Submitted:
08 May 2025
Posted:
08 May 2025
You are already at the latest version
Abstract
Soil, a vital component of sustainable agriculture, is influenced by topographical factors such as elevation, slope gradient, and slope position, all of which play a crucial role in determining nutrient distribution and soil characteristics. In light to the above constraints, distribution study based on the characterization of soil physicochemical properties and boron fractions were undertaken in three different blocks of varying altitude in Churachandpur district of Manipur. Soil samples were collected from three distinct blocks viz., Churachandpur, Singhat and Henglep which varies topographically through two-staged sampling methods and analysed for various soil properties. The investigation revealed strongly acidic to slightly acidic pH, low electrical conductivity value with low to high organic carbon content besides being lower cation exchange capacity. However, the boron variant showed transformation dynamics in terms of percentage as Residual boron (67.35%)> Organically bound boron (18.75%)> oxide bound boron (14.84%)> Readily soluble boron (0/94%)> specifically adsorbed boron (0.89%), respectively. The PCA-based analysis revealed that RES-B and OX-B are the most significant factors influencing soil boron fractions in Churachandpur district, Manipur, India. The characterization and transformation study of boron fractions, would simplify on developing effective strategies for soil resource management in hilly areas.
Keywords:
Soil
; properties
; topography
; boron
; correlation
; fractions and PCA
1. Introduction
Soil is a key component which serves as the initial resource for plant growth, and development. Being the most crucial component of sustainable agriculture (Lemenih et al., 2005), the suitability of soil for crop cultivation is determined by its physical, chemical, and biological qualities (Khan et al., 2013). However, the variability of the soil parameters was significantly influenced by soil parent materials, topography, climate, vegetation and human activities. Among them, topography is one of the most important soils forming factors which influenced landform stability directly. Studying of slope gradient or slope position of the cultivated area plays an important role in the distribution patterns and availability of the physico-chemical properties including macro and micronutrients. Furthermore, irregularity of slope proclivity also transmuted availability and distribution of soil boron fractions. Hence, slope position acts as an important factor influencing soil properties, vegetation, climatic condition, species distribution, ecosystem and soil erosion. So, the need of the hour is to focus more on the regeneration of natural resources through considering the notability of slope position on various soil properties and its underlying phenomena.
The variability of different elevation and slope position has significantly impacted the distribution of soil physico-chemical and morphological properties (Khormali et al., 2007) such as solum thickness, sand, silt and clay content, soil acidity, organic carbon, CEC, boron and its various fractions. Numerous research work has been accepted in determining the unevenness of soil properties. Nutrient availability has been impacted by variability of slope position on which Chen et al., 2019 have observed optimum range of available Fe, Mn, Cu and Zn in soils of the upper slope positions. In another study, Pierson and Mulla 1990 observed an unevenness of soil properties on different elevation which then summed up with higher organic carbon and aggregate stability on lower elevation or slope compared to the peak position. However, the pH, available P, exchangeable Ca and Mg were significantly increased near the foothill (Tsui et al., 2004). From the findings, it is not determined to pinpoint that altitudinal variation could suggestively amend soil properties, and indirect impacts on soil properties in hilly terrain. However, the north-eastern region of India has remained unexplored in terms of nutrients availability its distribution patterns in accordance with crop diversification. Despite the variability in the soil chemical and physiological traits, the variation in the availability and abundancy of the various other micronutrients particularly boron along with its fractions at different elevation and slope position mainly in the hilly region were yet to be established and put up in public domain which could be used as a reference in future research on these aspects of hilly region.
Among the 17 essential plant elements, boron has emerged as a vital micronutrient next to zinc in milieu of the stretch of deficiency in Indian agriculture (Sathya et al., 2009). It plays a pivotal role predominantly at reproductive stage in flowering, pollen germination, fertilization and enhancement in yield attributes (Randhawa and Bhail, 1976). Nearly, 33% of the Indian soils were deficient in boron (Singh, 2008) and on an average, 18.3% of total cultivated soils in India are deficient in Boron (Shukla et al., 2019). However, there was upsurge in the boron deficient area from 2% in the year 1980 (Katyal and Vlek, 1985) to 52% as reported by Singh, 2012. Five different boron fractions were described in soils viz. readily-soluble, specifically-adsorbed, oxide-bound, organically-bound, and residual fractions boron. The availability of boron fractions depends on soil properties viz., pH, organic matter, amount and nature of clay, soil moisture and lime content. Among the different boron fractions, readily boron (RS-B) is the fraction of B present in soil solution and adsorbed weakly by soil particles and is most readily available for plant uptake. However, the boron availability was generally low in acid soils of high rainfall areas (Kumari et al., 2017) and was localised in the north eastern hilly states including Manipur, Assam, Meghalaya due to leaching of B and adsorption by Al and Fe oxides minerals along with acid red and lateritic soils in addition to high pH calcareous soils (Behera et al., 2009).
Churachandpur district, which was previously known as Manipur South District, is the hilly district of Manipur that shares a 398 km border with Myanmar in its Northwestern part The district has 11 Sub-Divisions which shared a unique soil dynamics, climatic condition, topography, vegetation and landform features. However, despite the variation, fewer research trials were undertaken so far and the place remain hidden and unexplored in the present context. Moreover, the impact of slope positions on soil physico-chemical properties in different paddy cultivated of the hilly region remains unidentified, which limits our levels of understanding particularly in the field of agriculture and allied science. Keeping the above points in view, the investigation was conducted to study the effect of different slope position and elevation on distribution of soil physico-chemical properties and available patterns of boron and its fractions in Churachandpur district of Manipur. The key resolutions of the analysis were (1) to examine the changeability of soil properties at different altitudinal variants (2) to investigate their relationships between soil boron fractions and soil properties (3) To find the most contributing soil parameters in the distribution patterns. Furthermore, such information will enlighten the upcoming researcher in the related field and can facilitate soil restoration, ecological balance, futuristic crop planning and sustainable development of the hilly areas on global scale.
2. Materials and Methods
2.1. Study Area
The investigation was carried out in the three different blocks in the hilly region of Churachandpur district of Manipur (India) which varies in the slope position and elevation. Being the largest district in Manipur, Churachandpur district expands over 4570 Sq.km and covers 20.5 % of state’s total area. The district is located between 24°20″46′ N latitudes and 93°42″00′ E longitude in the south-western part of Manipur. The district borders with Myanmar on the east, Imphal valley on the north, Tamenglong on the west and Mizoram on the south. Most of the hill ranges had elevation extending from 750 to 1950 m above MSL (mean sea level) which is about 5.57% of the total geographical area. The hilly ranges share moderately hot and humid belt. The alluvial soil is deep in the flood plain of area which is dominant in fine silty with Typic Haplaquepts soils and fine Aquic, Dystrochrepts.
The mean annual precipitation varies from 1166 mm to 1848 mm, with a distinct wet season from May to October (more than 80% of precipitation occurs during the wet season). In this region, the soil in the upslope or hills are residual soils whereas soils in the valley are transported from the hill slopes with laterization as the most common phenomena. The natural vegetation of this region is characterized by mix of semi-evergreen rain forest, tropical wet evergreen forest and tropical moist deciduous forest with the semi-evergreen rain forest being the most dominant one.
2.2. Soil Sampling and Determination of Basic Soil Properties
The foremost topographical factor surveyed in this study was elevation, therefore three different sub division or block, which vary in their elevation or slope position, were chosen as the sampling sites, namely: Churachandpur (Lamka) block (914 m), Singhat block (963 m) and Henglep block (1100 m). So, a total of 30 plots (0-15 cm) were selected through 2-staged sampling from the different blocks ranging from different elevated area of the paddy cultivated field of churachandpur district, Manipur (Figure 1). Moreover, sampling was surveyed and recorded for each sampling plot. Moreover, the basic descriptive information about the geographical position system (GPS) reading were recorded for the sampling sites and was presented in the Table 1. All the samples were collected along with the GPS location of the selected area and stored in the polythene bags for further analysis. The soils were dried in shade, grounded and passed through 2 mm nylon sieve. The processed samples were stored in separate polyethylene bags and used for determination of soil properties and boron fractions through sequential extraction method as described by Raza et al., 2002.
2.3. Laboratory Analysis
The soil samples collected from different location of the Churachandpur district were air-dried and ground to pass through 2 mm sieve. The collected soil samples were analysed at the Soil Science’s laboratory, COA, CAU, Imphal following standard laboratory procedures.
The soil pH and Electrical Conductivity were determined potentiometrically using glass electrode in the ratio of 1:2.5 (Sarkar, 2005). The particle-size distributions were analysed using the Bouyoucos hydrometer method (Estefan et al., 2013). The soil organic carbon (SOC) was determined following the Walkley Black wet digestion method (Sarkar, 2005). Cation-exchange capacity (CEC) was determined by the ammonium acetate method at pH 7 (Sumner & Miller, 1996). The hot water-soluble B was estimated by UV-VIS Spectrophotometer (Berger and Troug, 1939).
2.3.1. Fractionation of Boron
The fractionation method of boron was adopted from Datta et al., 2002 and is depicted below:
A. Readily soluble boron
5 g of soil samples were weighed into 50 ml polyethylene centrifuge tubes to which 10 ml of 0.01 M calcium chloride was added and the tubes were shaken at 25° C for 16 h (Hou et al., 1994 and 1996); after centrifuging at 10,000 rpm for 30 minutes, the suspension was filtered through Whatman no. 42 filter paper. Boron was determined in clear extracts using Azomethine-H (Bingham, 1982).
B. Specifically adsorbed boron
The residue from above was extracted with 10 ml of 0.05 M potassium dihydrogen phosphate by shaking for 1 hour. The suspension was centrifuged and filtered as described previously. After centrifugation, B could be measured in the clear supernatant as described in the previous step because KH2PO4 was also not found to interfere with the estimation of B with Azomethine-H.
C. Oxide bound boron
The residue from the previous step was extracted with 20 ml of 0.2 M acidic ammonium oxalate, pH 3.25 (Hou et al., 1994, 1996) by shaking for 4 hours (Hou et al., 1994, 1996). Most of these extracts had a yellow to slight reddish colour. The yellow colour was mainly due to Fe and the reddish colour was due to slight dissolution of organic matter.
Elimination of colour by treating the extracts with NaOH and HClO4
To remove the colour, a 14 ml aliquot of the extract was taken into a 50 ml teflon beaker and the weight of the beaker plus aliquot was noted. The content was then warmed on a hot plate and 2 ml of 5 N NaOH solution was added to completely precipitate the dissolved Fe as Fe(OH)3. Jackson (1973) has also suggested a similar procedure to separate Fe and other metals in total elemental analysis of soil and rocks. The beaker with the aliquot was weighed again and the loss in weight was made up by adding distilled water. While doing so, the weight of the 2 ml 5 N NaOH was also considered. The suspension was filtered through Whatman no. 42 filter paper and thus Fe was separated. A 9 ml aliquot of the filtrate was taken into a 50 ml teflon beaker and 4 ml concentrated H2SO4 and 1 ml HClO4 (60%) were added and heated on hot plate at 135± 5°C to destroy the organic matter. Heating the samples at temperature > 140°C led to B losses (Hou et al., 1994, 1996). Care was also taken not to allow the samples to dry because B losses have been reported under these conditions. When the volume was reduced to about 6 ml, HClO4 was added in an increment of 0.5 ml until the solution became colourless and the volume reduced to 4 to 5 ml. The content was then transferred to a 15 ml graduated polyethylene tube and the final volume was made up to 6 ml. After centrifuging at 10,000 rpm for 15-minute, B in the clear extracts was determined by the carmine method (Bingham, 1982).
D. Organically bound boron
The residue from the above was extracted by adding 3 ml of 0.02 M HNO3 and 5 ml of 30% H2O2 at pH 2.0. The mixture was heated at 85°C in a water bath for 2 hours with the occasional agitation. A second 3 ml aliquot of 30% H2O2 (at pH 2.0) was then added, and the sample was heated again to 85°C for 3 hours with intermittent agitation. After cooling, 5 ml of 3.2 M ammonium acetate in 20% HNO3 was then added to the solution, which was then diluted to 20 ml with water, mechanically shaken for 30 minute and separated by centrifugation.
E. Residual boron
The residue from the above was transferred to a PTFE beaker to which 5 ml of aqua regia and 5 ml of HF was added. The beaker was placed on a hotplate at 140°C and evaporated to a volume of 1-2 ml.
The procedure was repeated with further 5 ml of each acid. A solution of 10 ml of AlCl3 was then added and the solution was warmed at 60°C in a water bath for approximately 5 minutes. The suspension was allowed to cool, transferred to a 50 ml polyethylene volumetric flask and made up to volume. The solution from the volumetric flask was filtered through a Whatman membrane filter paper and the filtrate was collected for B analysis.
2.4. Statistical Analysis
The soil sample collected through 2-staged sampling methods were used for analysis of various soil parameters. All the data recorded in the findings were tested for normality distribution and homogeneity of variances. Furthermore, the tested data were analysed for finding main statistical parameters viz., mean, standard deviation (SD), skewness, kurtosis, and coefficient of variance (CV) of soil properties of different blocks under SpSS software version 24. The variability in the soil properties across different elevation were compared using the one-way analysis of variance (one-way ANOVA) method. Furthermore, the Tukey-HSD significant test of the means was used with statistically significant differences (p< 0.05) being observed among different blocks. The relationship between different soil physico-chemical properties and boron fractions were evaluated using Pearson’s correlation tests and visualized diagrammatically as a correlogram using R 4.4.2 software. In addition, Principal component analysis (PCA) was applied to illustrate the most contributing factor and analyse the degree of the inclusive variation of each soil’s physico-chemical properties using R studio software.
3. Results
3.1. Effect of Altitudinal Deviation on Soil Separates
The statistical summary of the studied samples of three different blocks viz., churachandpur, Singhat and Henglep blocks were summarized and illustrated in Table 2.
The recorded data on distribution of soil separates of Churachandpur district viz., sand, silt and clay in the soil samples were represented in Table 2. The highest proportion of sand separtes were recorded under Henglep blocks which was followed by Churachandpur blocks. The silt and clay fractions of studied soils recorded highest value in Singhat block, respectively. The relative proportion of silt and clay separates followed the trend: Singhat> Churachandpur> Henglep block as shown in table 3. The overall study of the soil texture can predict the wide variability of the soil separates with the majority of soil texture fall under the category of clay, clay loam, silty clay and silty clay loam respectively. Out of the 30 studied sites, 60 per cent of the soil texture composed of clay texture.
3.2. Effect of Altitudinal Deviation on Soil Chemical Attributes
The soil pH (1:2.5, soil: water) values of the collected soil samples were acidic in nature to strongly acidic soil which exhibited no significant difference between the three blocks. Similarly, the electrical conductivity of the studied areas exhibited mean value of 0.12 dS/m as illustrated in Table 2. The value of organic carbon value of the experimental samples ranged from 1.01 to 1.18 % indicating high content of organic carbon in Churachandpur district (Table 2). The highest organic matter (1.18 %) was recorded in Churachandpur block which is of lower elevation followed by Singhat block (1.07%) which are non-significant as shown in Table 3. The CEC of the soil samples varied from 13.50 cmolc/kg in Henglep block to 14.20 cmolc/kg which is highest in churachandpur block exhibiting the higher CEC in lower elevated areas of churachanpur district. Considering the availability of boron (B) content in Churachandpur district, the table 3 exhibited significantly higher boron content of 1.10 mg/kg in lower slope of churachandpur block compared to Singhat (0.64 mg/kg) while the higher elevated areas of Henglep block recorded nearly deficit value of 0.47 mg/kg block. Conclusively, most of the soil parameters recorded lower value in higher elevated areas of Henglep block.
3.3. Effect of Altitudinal Deviation on Boron Fraction
Readily soluble boron (RAS-B), which includes water-soluble and non-specifically adsorbed boron, ranged from 0.81 to 0.83 mg/kg as shown in Table 2. The highest value of RAS-B was found in Singhat, while the lowest was in Buallian, both in Churachandpur. Specifically adsorbed boron (SA-B), which is associated with phyllosilicate clay surfaces, varied from 0.62 to 0.87 mg/kg with the highest specifically adsorbed fraction recording under churachandpur block with higher levels possibly influenced by clay and organic matter content. This fraction accounted for just 0.89% of the total boron content.
The oxide-bound boron (OX-B), associated with amorphous oxides and organic matter, ranged from 12.32 to 13.88 mg/kg as illustrated in Table 4. However, the oxide bound fraction doesn’t exhibited significant response on the different attitudinal variant block of the studied site as shown in Figure 2. The Organically bound fraction of boron (OR-B), largely complexed with organic matter, ranged between 15.48 to 18.24 mg/kg, contributing 18.75% to the total boron. The highest value of organically bound fraction of 18.24 mg/kg was recorded under Singhat area. The residual boron (RES-B) fraction, which is the most stable and least available form, was the dominant pool, ranging from 50.34 to 61.50 mg/kg, and contributed 65.35% to the total boron (Table 4). The inclusive study of the boron variants in three different studied sites of Churachandpur district showed non-significant response on almost all the fractions as evident in Figure 2. The overall, the dominance of boron fractions followed the order: Residual B > Organically bound B > Oxide bound B > Specifically adsorbed B > Readily soluble B.
3.2. Figures, Tables and Schemes
Figure 1.
Study area map of Churachandpur district of Manipur, India.
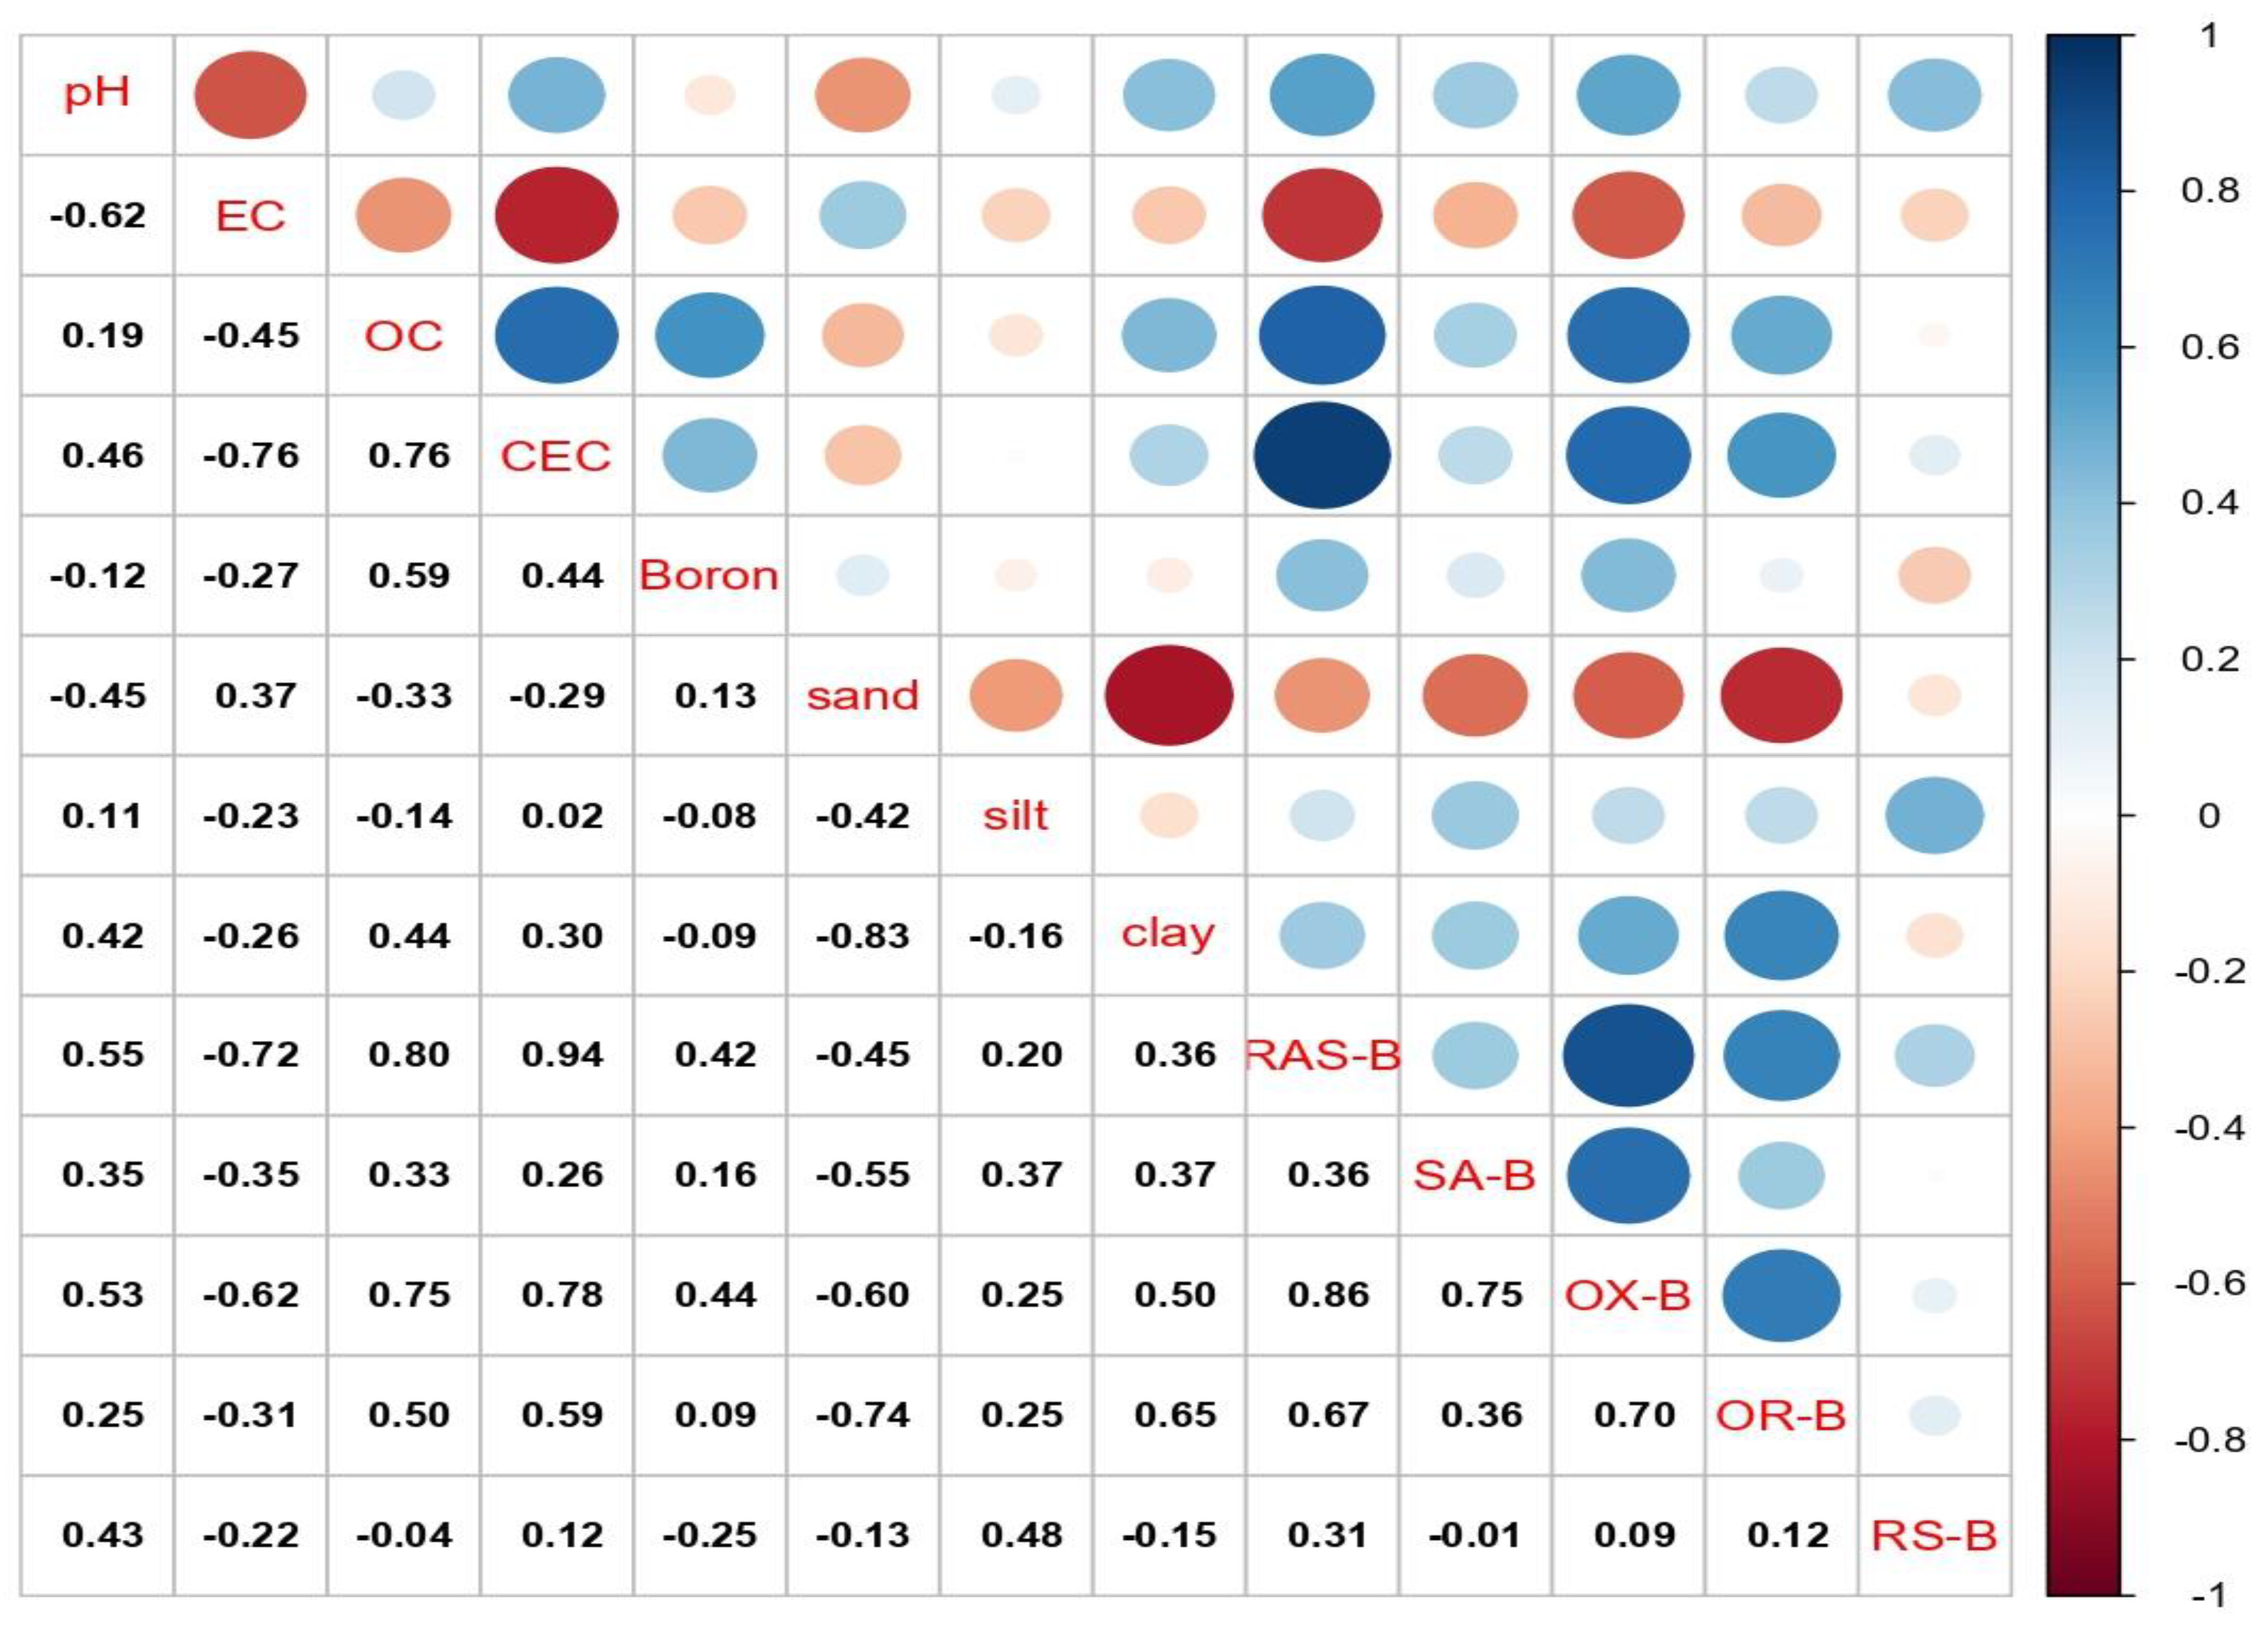
Figure 3.
Correlogram of Spearman correlation executed between boron fractions and soil properties of three different blocks viz. (a) Churachandpur, (b)Singhat and (c)Henglep block, respectively. Blue dots correspond to the positive correlations and red dots to the negative correlations. The size and color intensity of the dots are proportional to the correlation coefficient (r). Parameters: EC= Electrical conductivity; CEC = cation exchange capacity; OC= Organic carbon; RAS-B=Readily Soluble Boron; SA-B=Specifically adsorbed Boron; OX-B=Oxide Bound Boron; OR-B= Organically bound Boron; RS-B=Residual Boron.
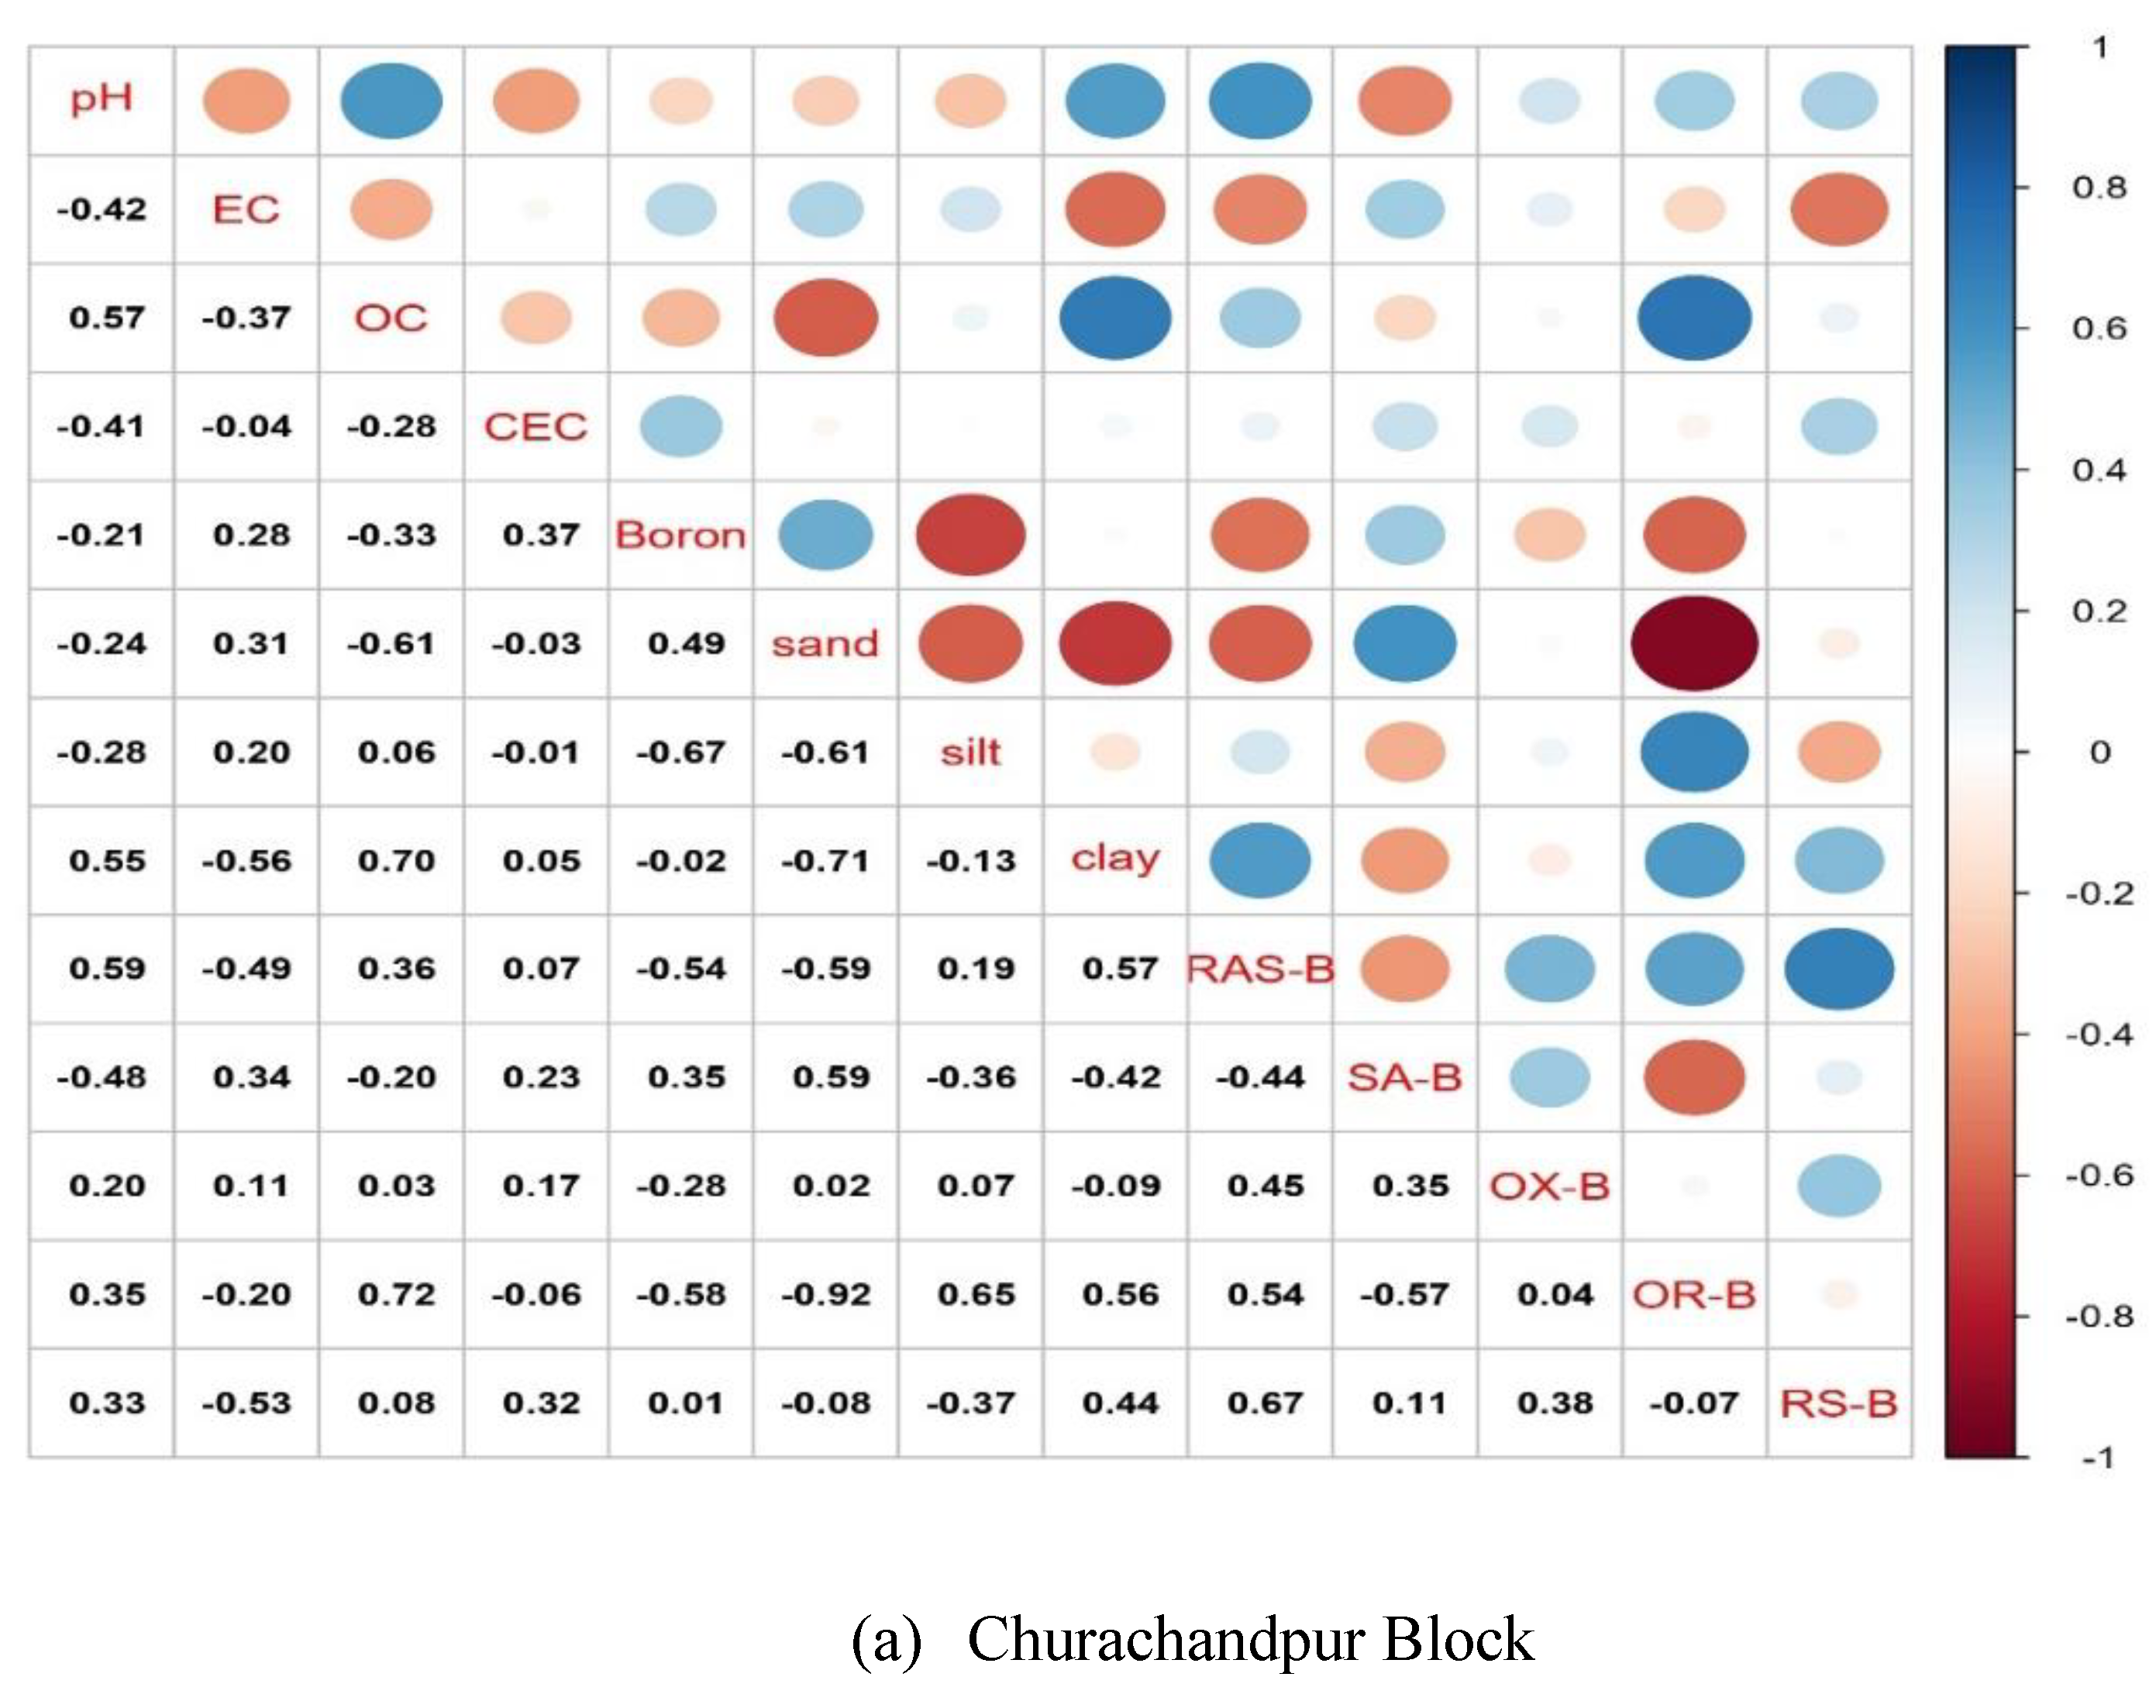
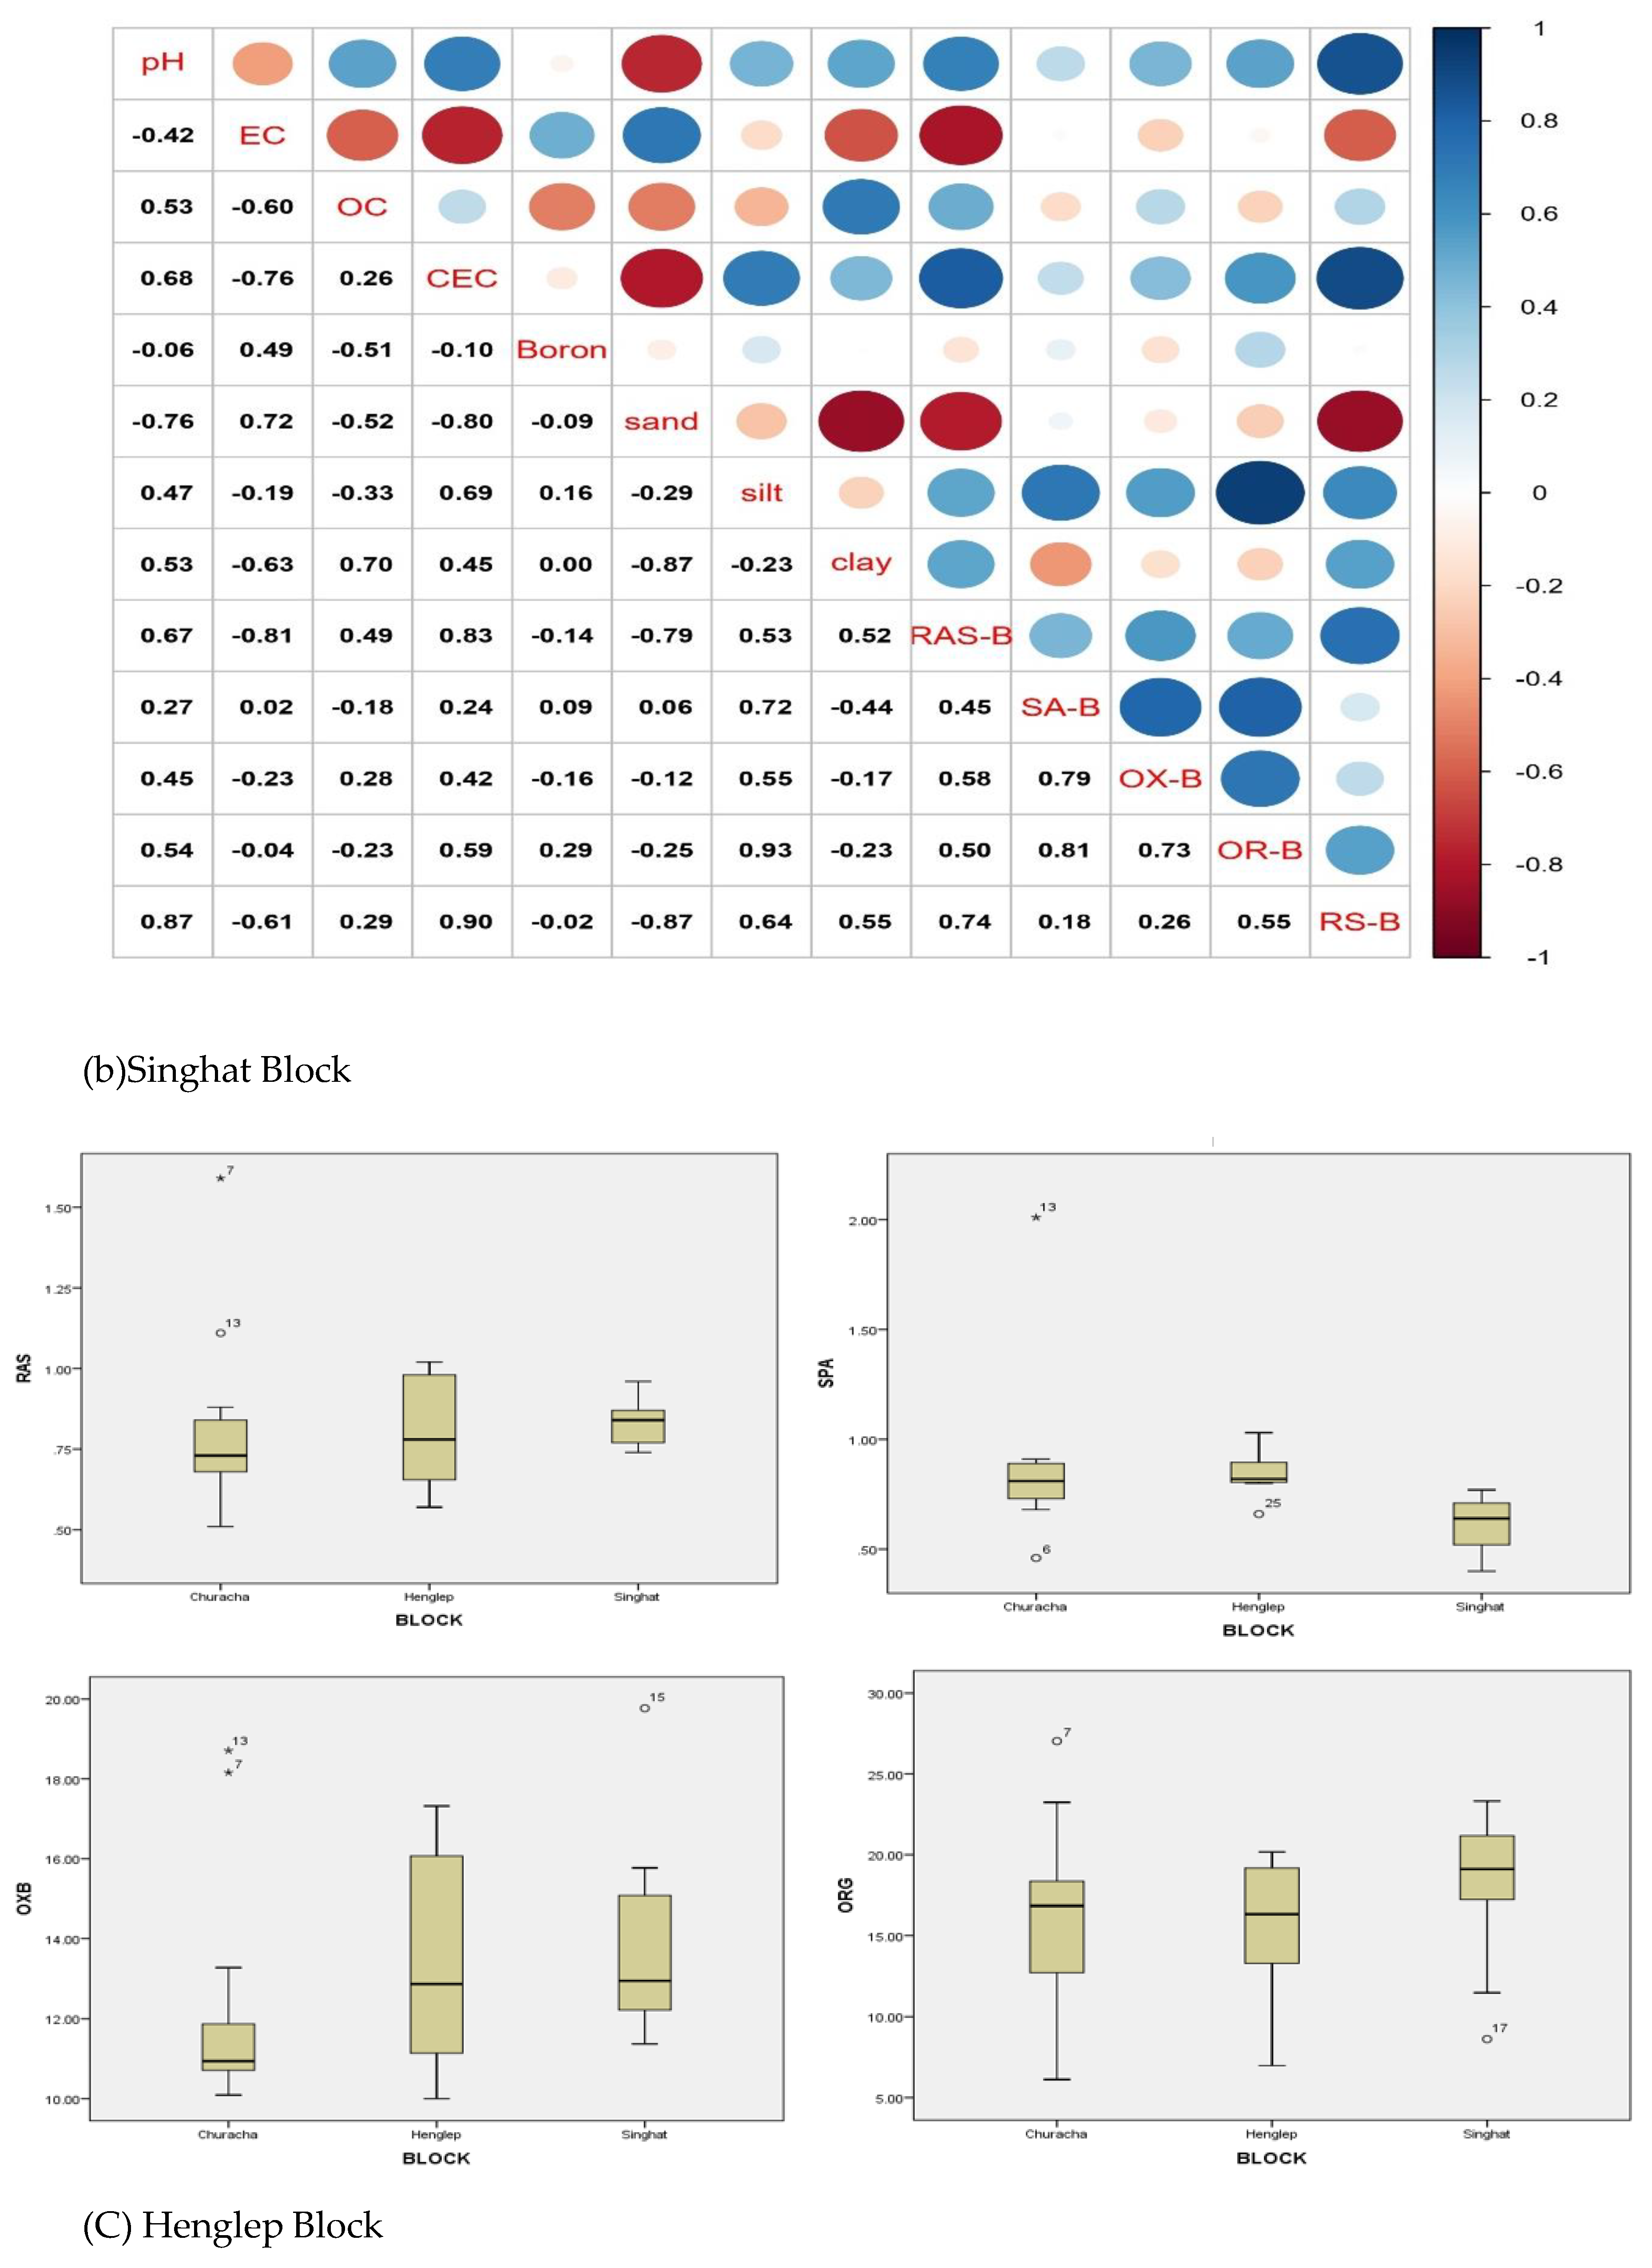
Figure 2.
Changes in the soil boron fractions at different blocks. (1) RAS: Readily soluble boron (2) SA-B: Specifically adsorbed boron (3) OX-B: Oxide bound boron (4) ORG: Organically bound boron (5) RS-Residual boron. Error bars show (Churachandpur, Singhat and Henglep block with n=13, n=10 and n=7, respectively). Since the there is no significant difference between the blocks, error bars are presented without letters.
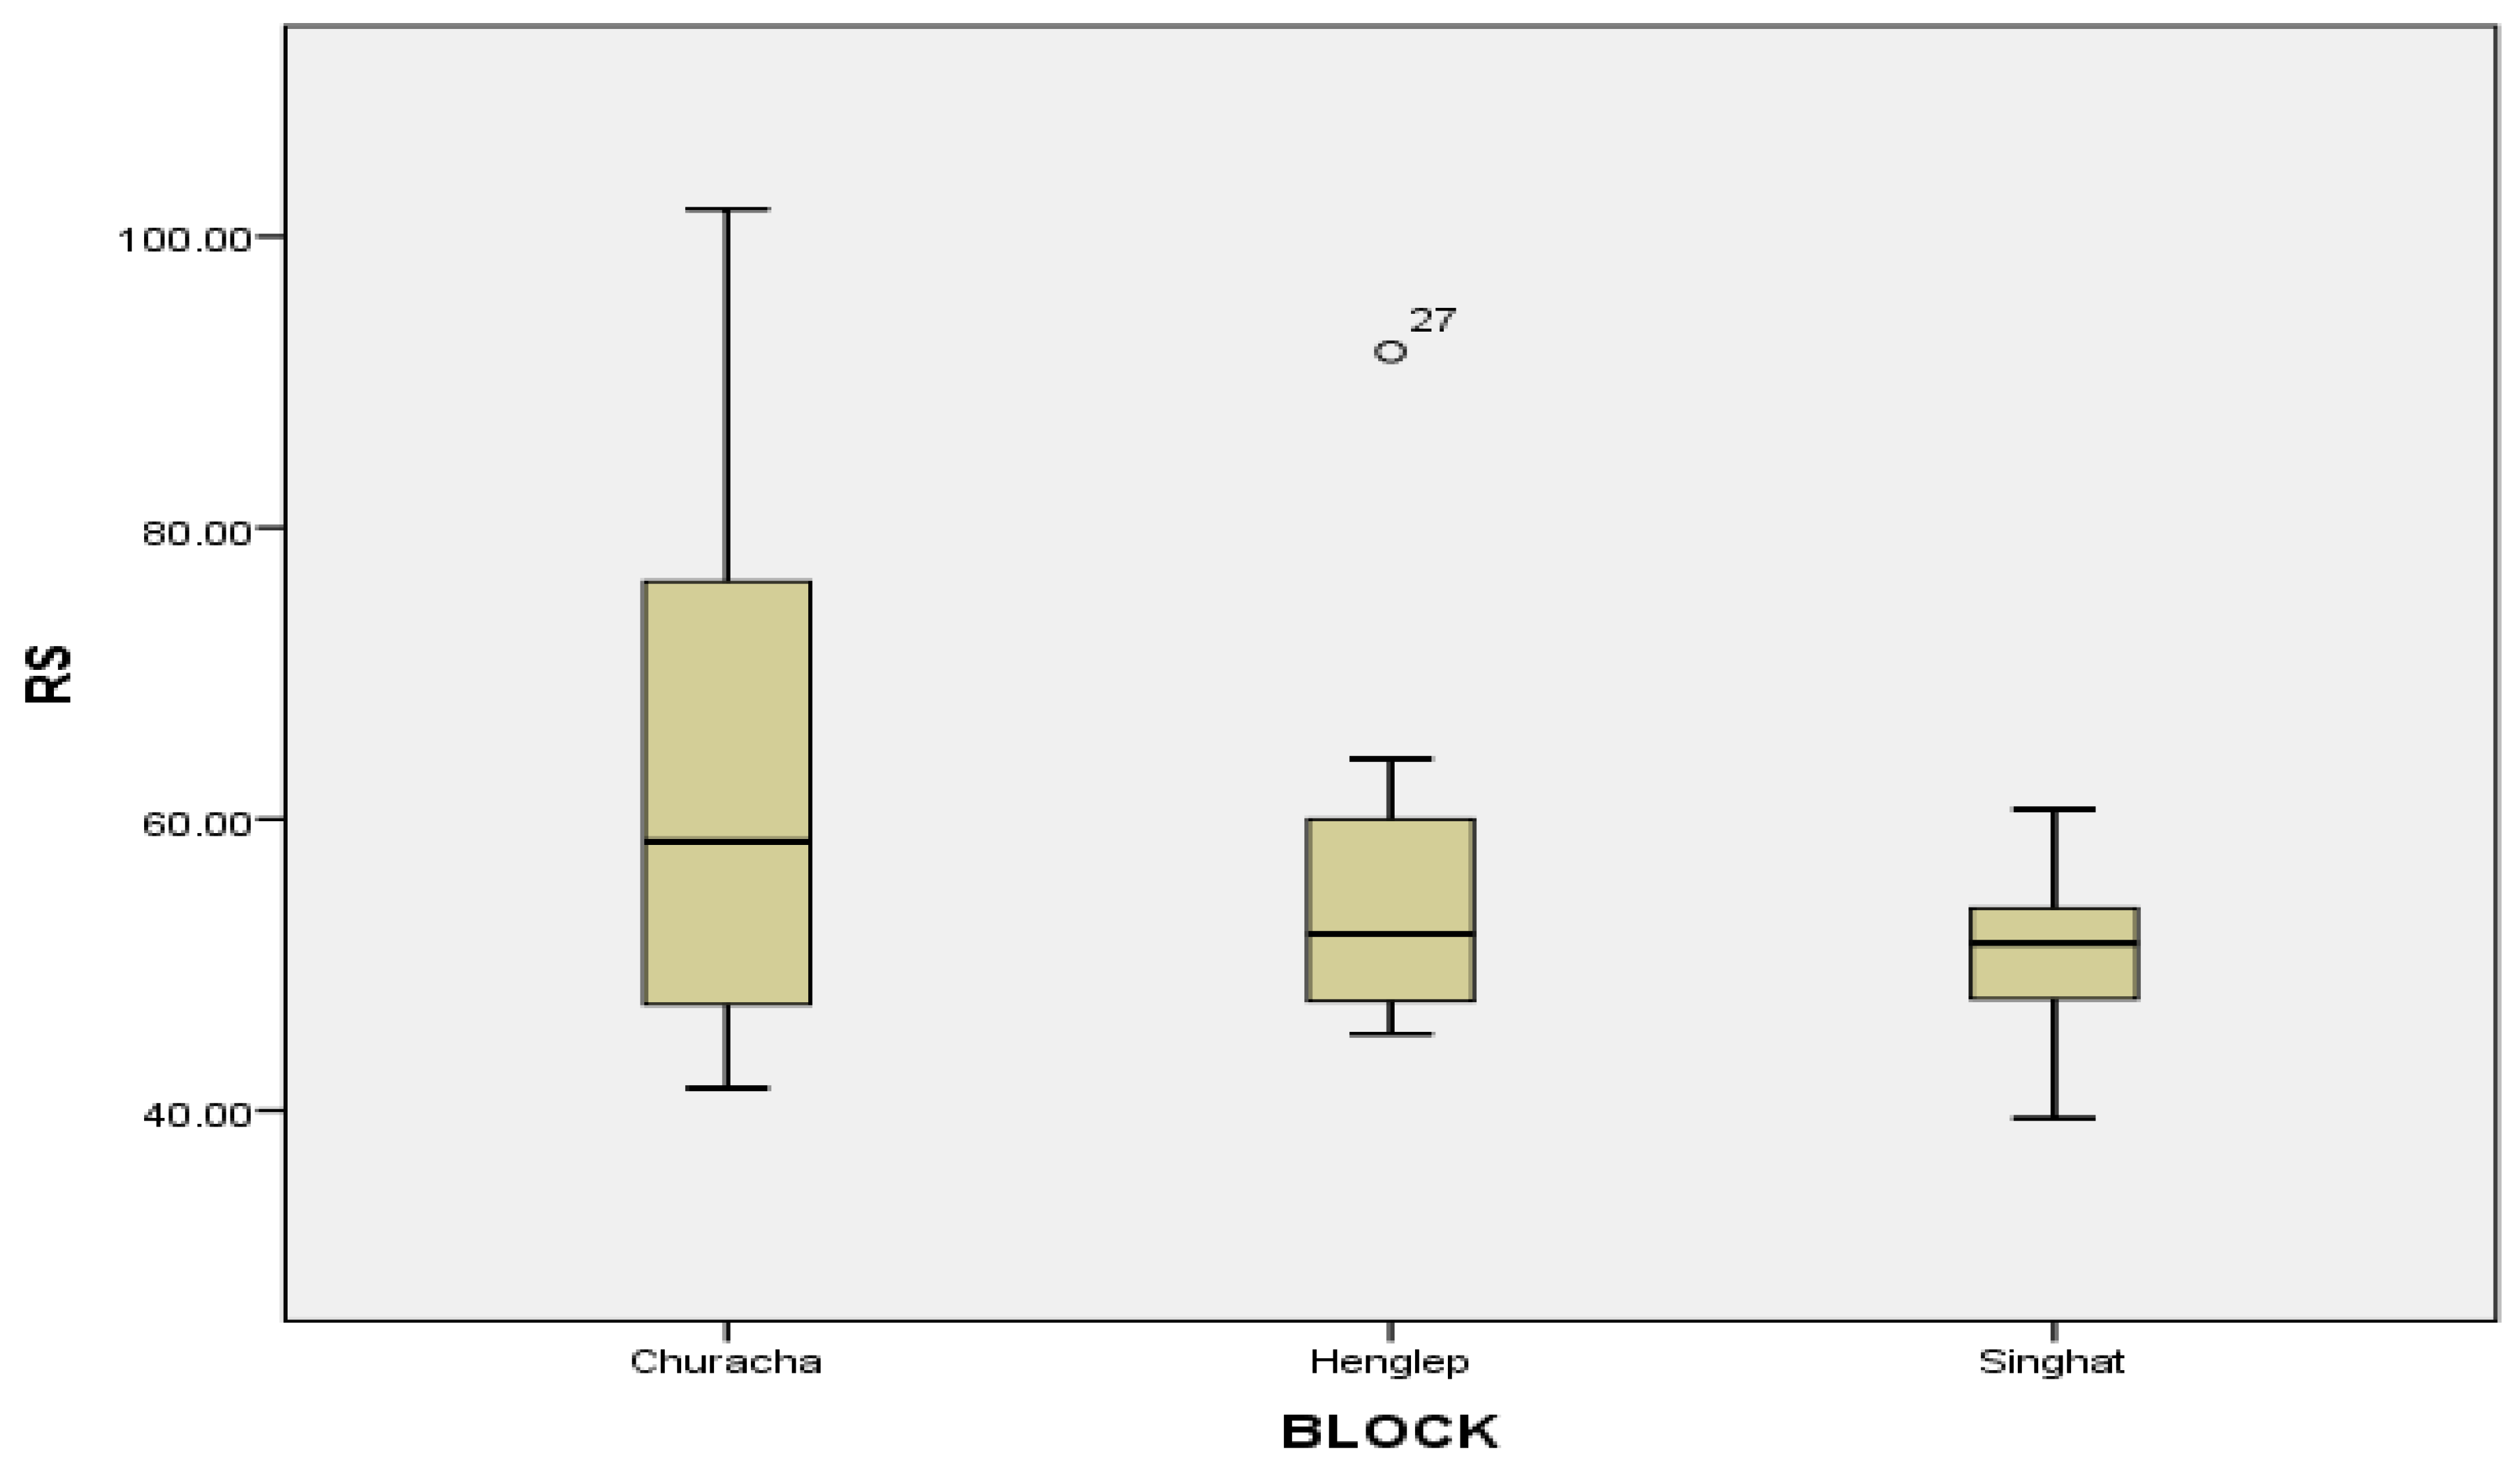
Figure 4.
Principal component analysis (PCA) for different soil physico-chemical properties in Churachandpur district, Manipur, India.
Figure 4.
Principal component analysis (PCA) for different soil physico-chemical properties in Churachandpur district, Manipur, India.
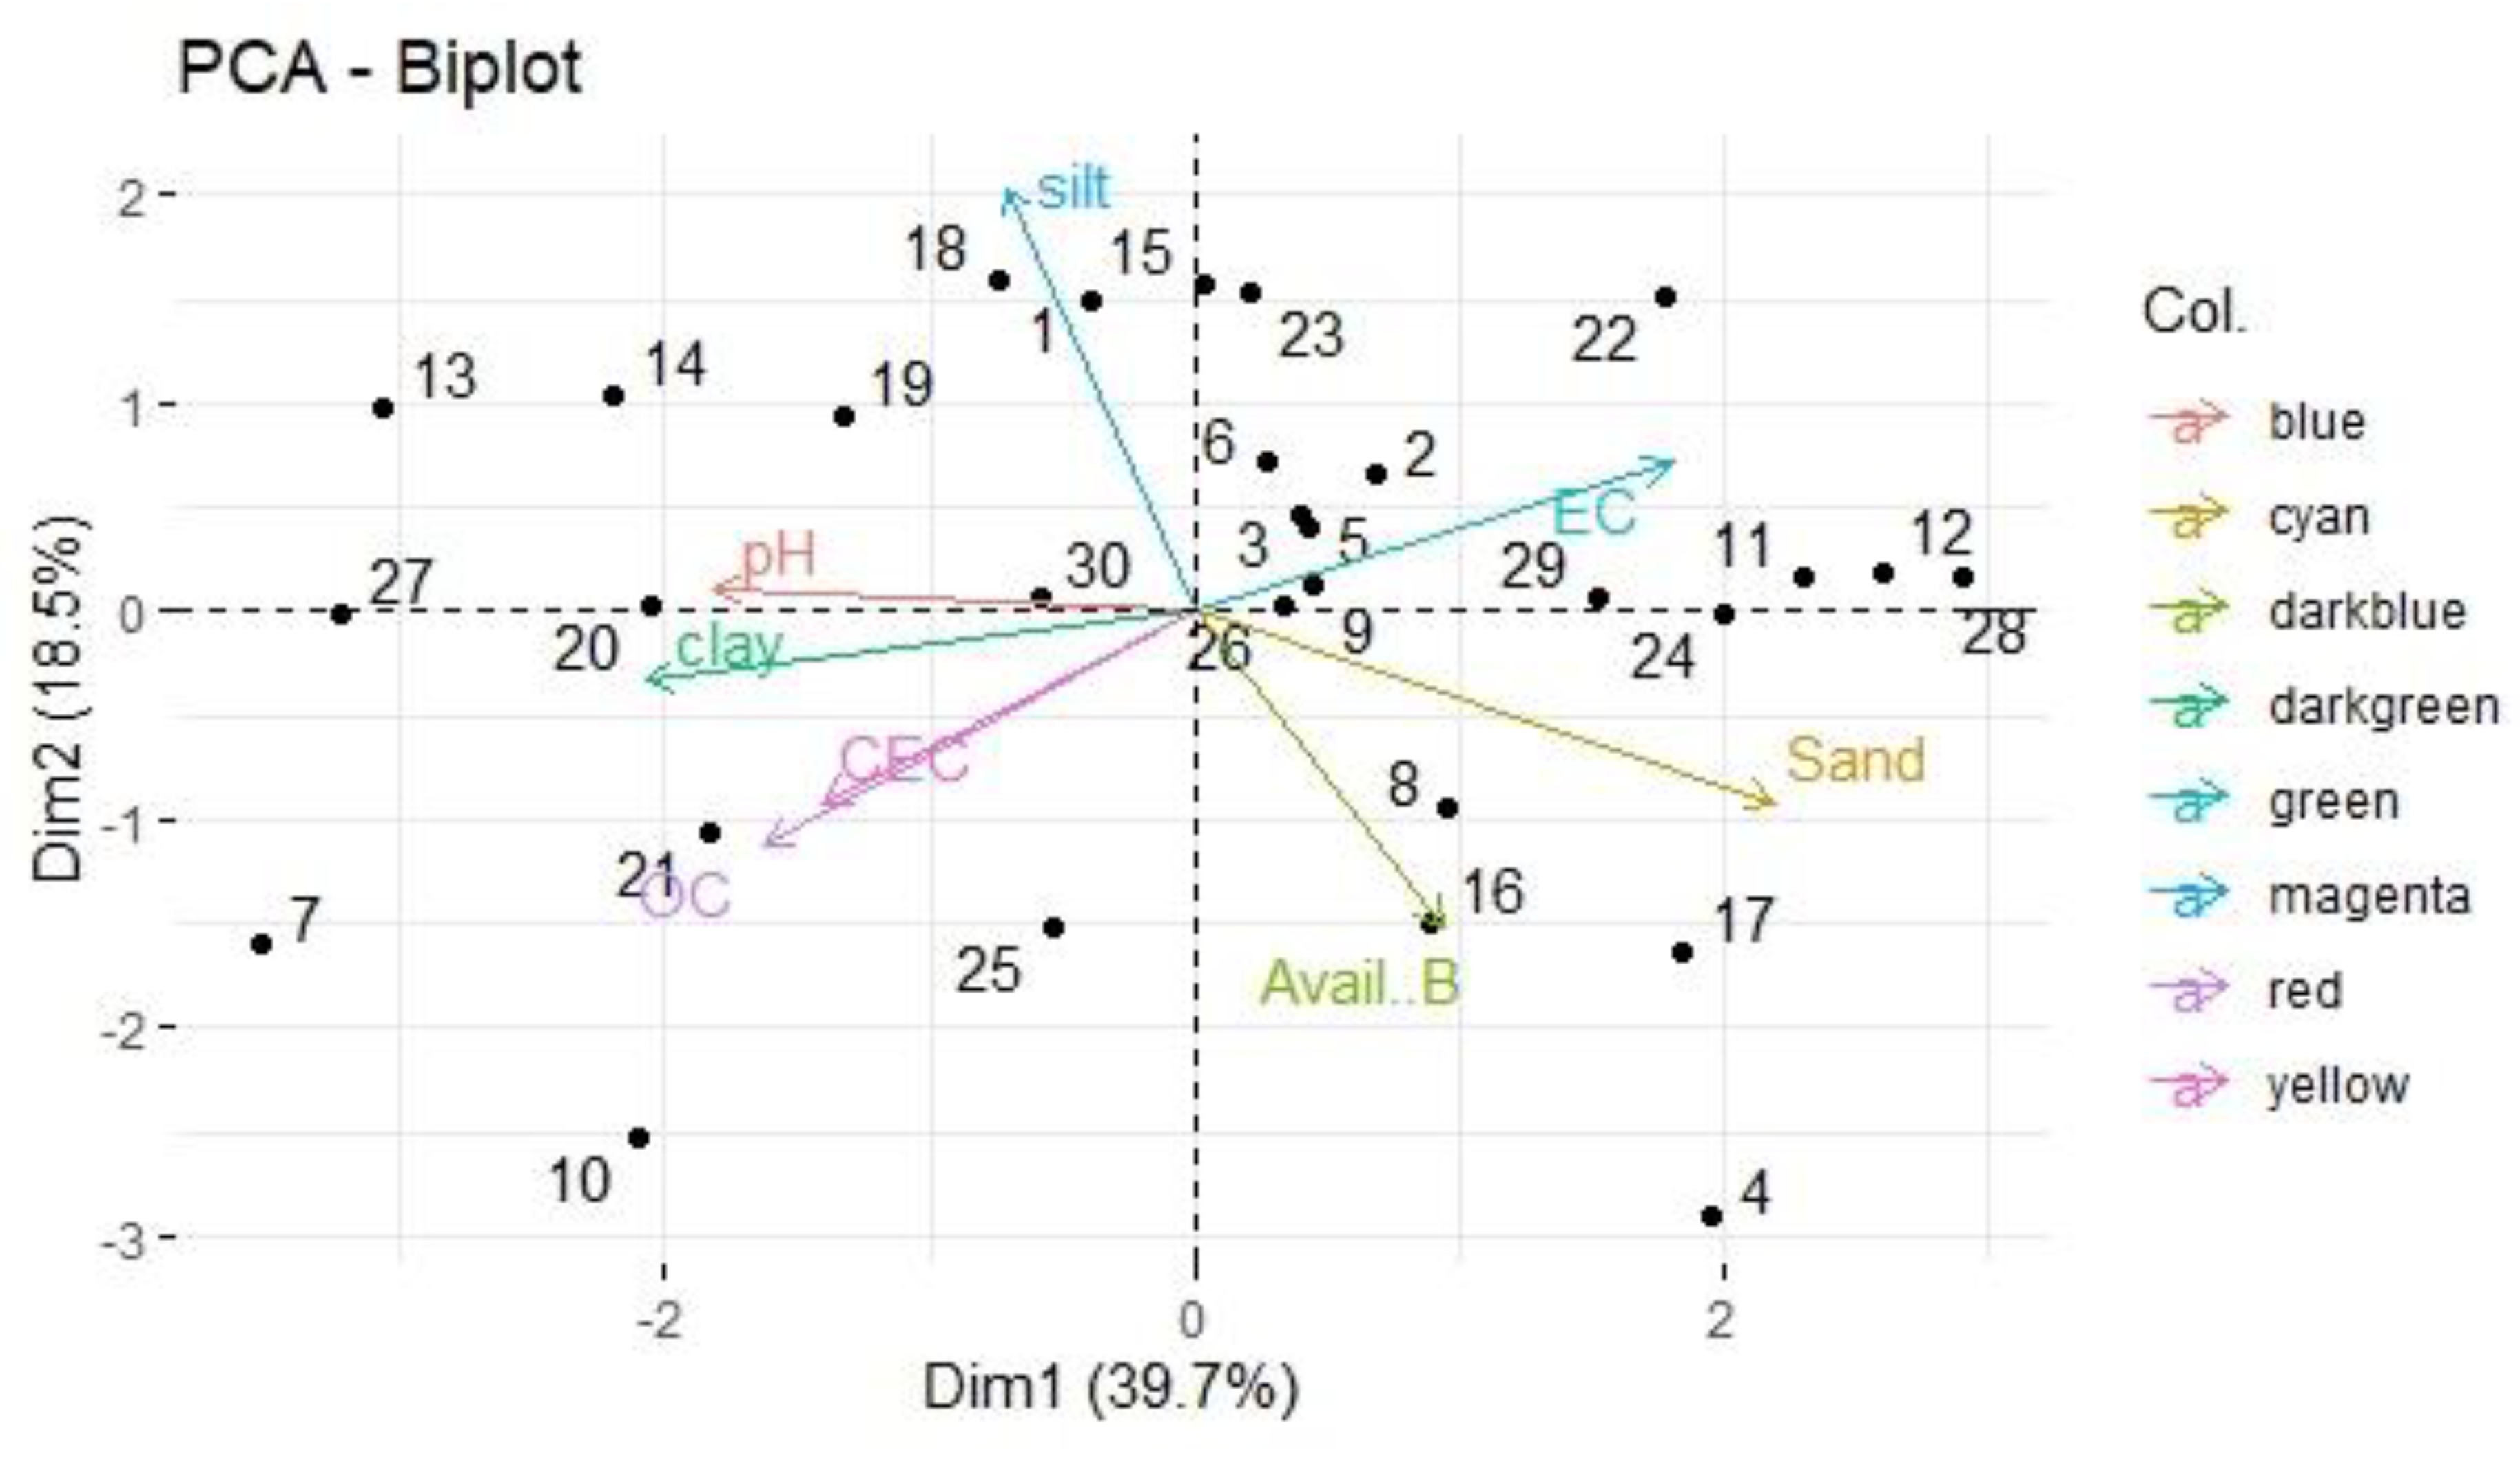
Figure 5.
Principal component analysis (PCA) for different soil boron fractions in Churachandpur district of Manipur, India.
Figure 5.
Principal component analysis (PCA) for different soil boron fractions in Churachandpur district of Manipur, India.
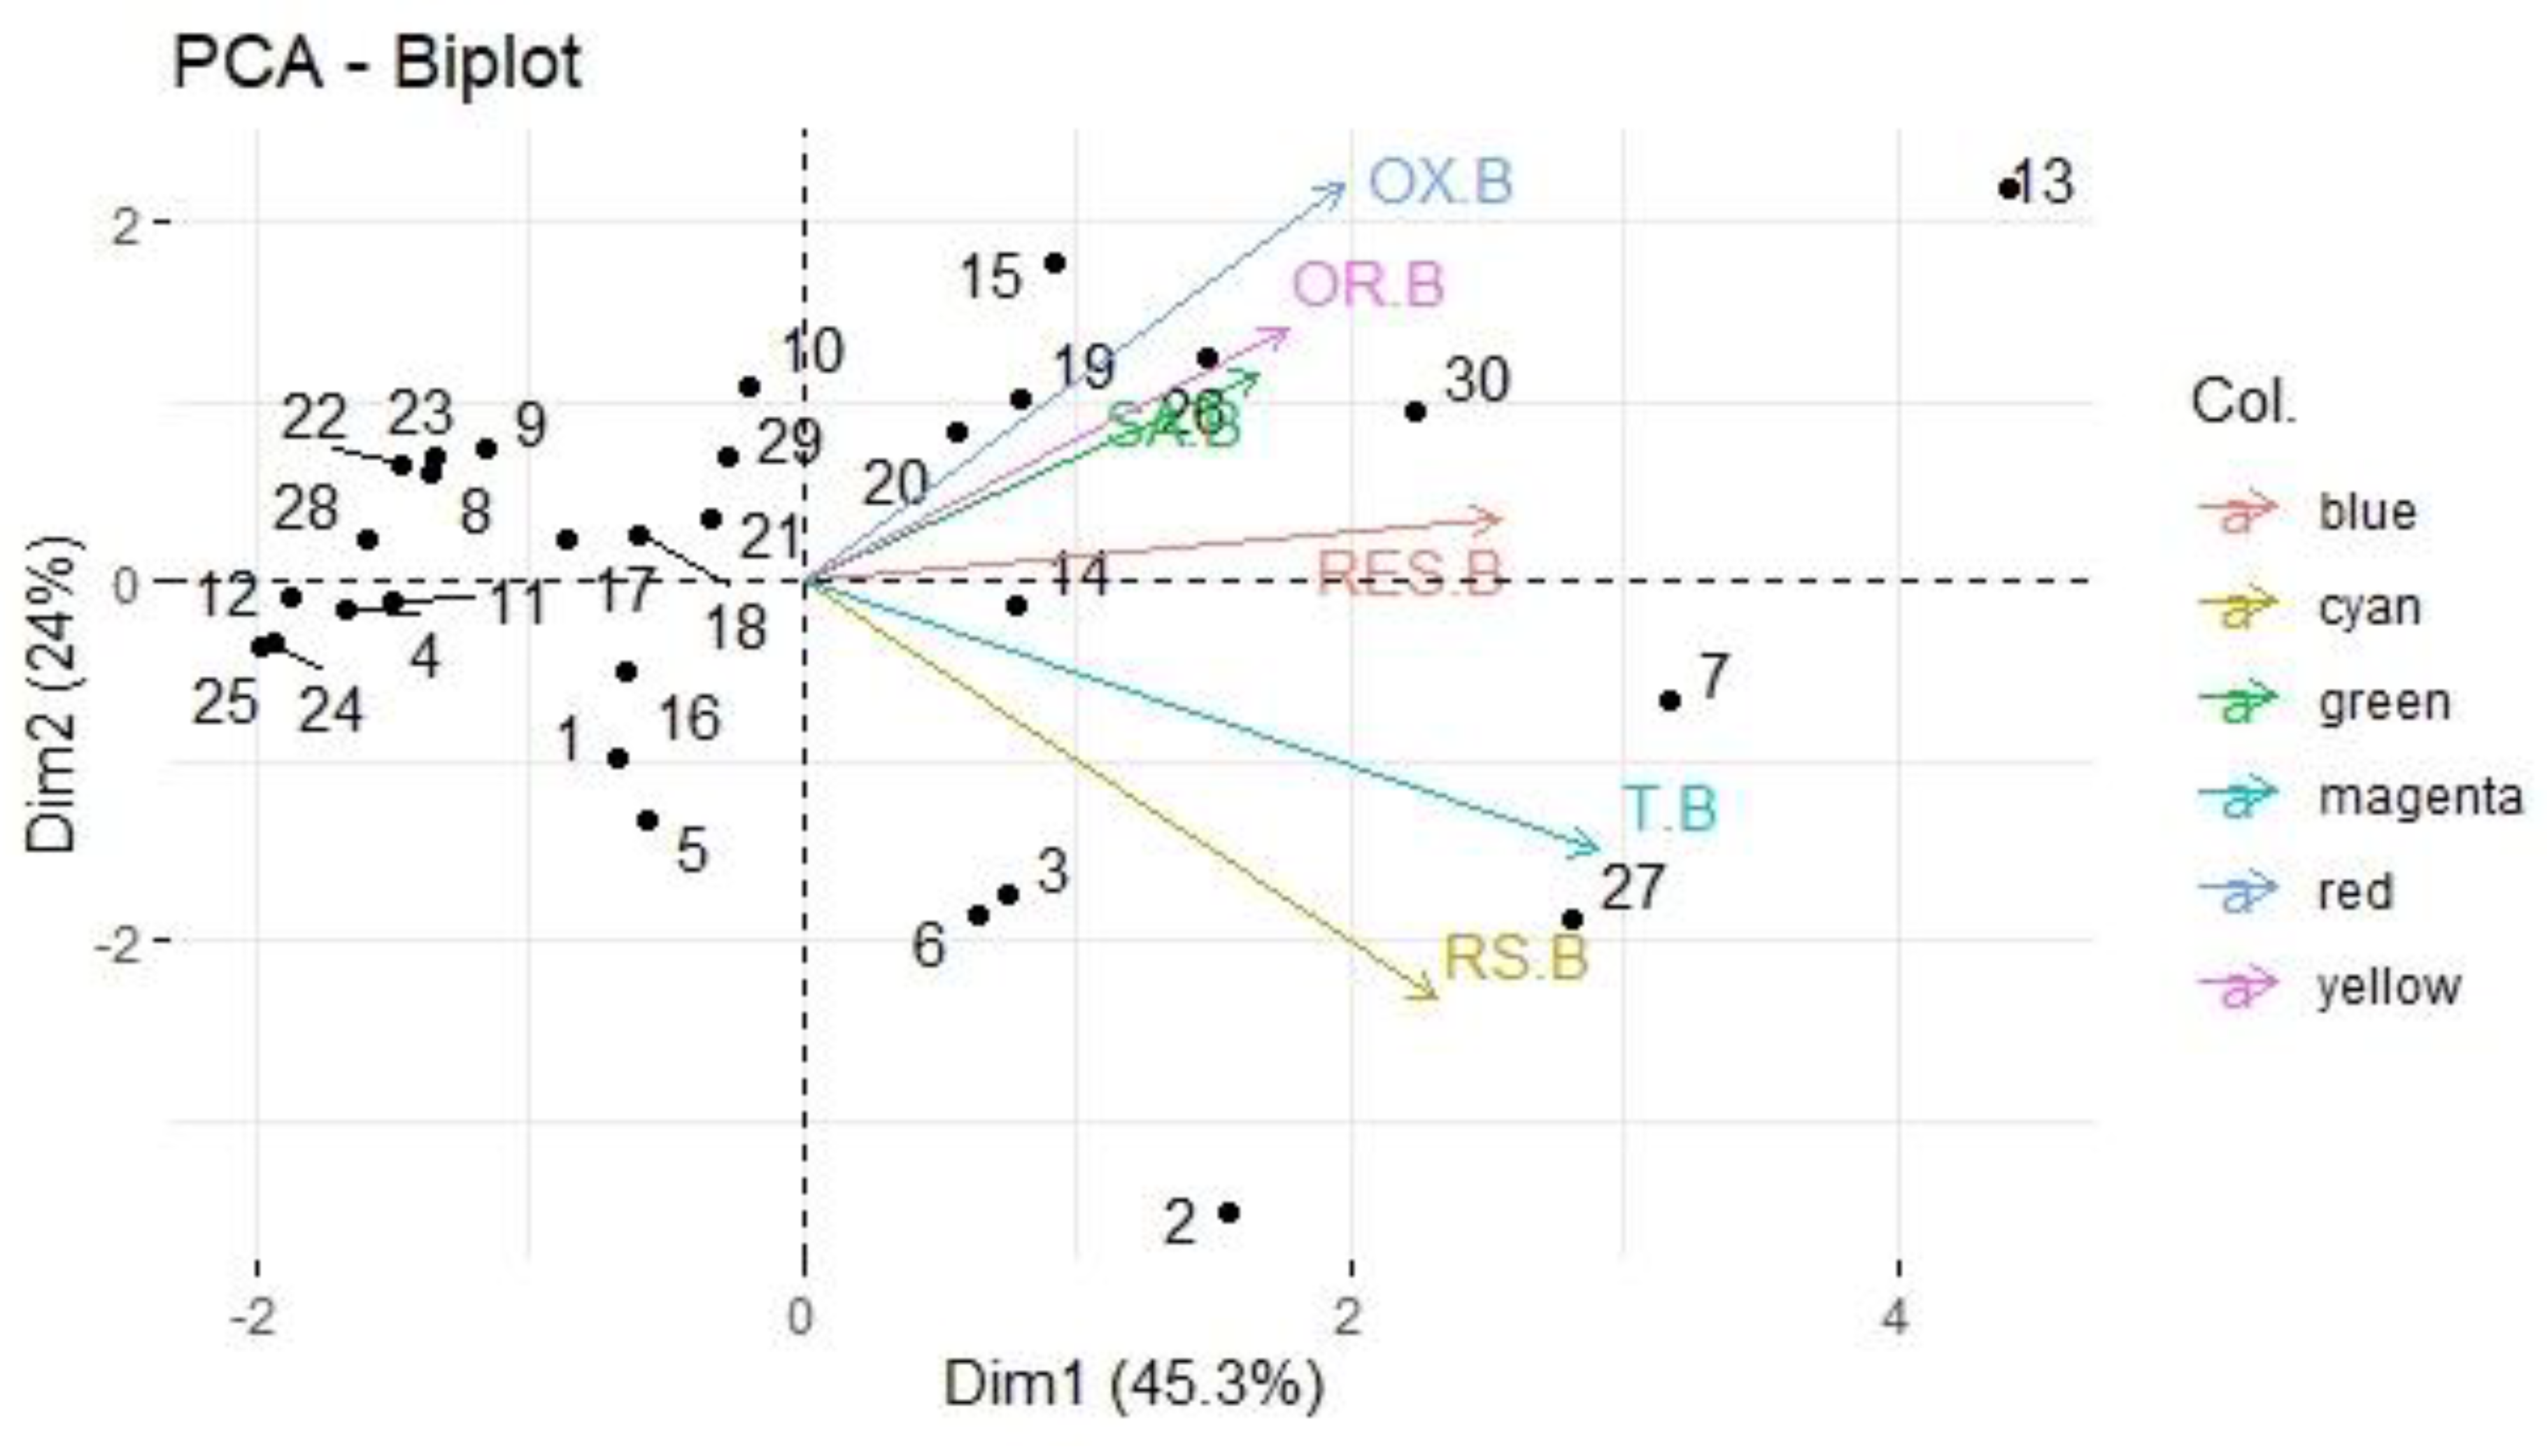

Table 2.
Statistical summary of soil physico-chemical properties at different altitudinal deviation.
Table 2.
Statistical summary of soil physico-chemical properties at different altitudinal deviation.
| Sl. No. | Block | Parameters | Mean | Median | Variance | Minimum | Maximum | Standard Deviation (SD | Skewness | Kurtosis | Coefficient of Variance (CV %) |
| 1 | Churachandpur | Sand % | 35.72 | 32.55 | 80.17 | 18.12 | 52.3 | 8.95 | 0.01 | 0.21 | 25.06 |
| Silt % | 22.62 | 22.5 | 26.24 | 5.12 | 11.26 | 32.08 | -0.33 | 1.40 | 141.82 | ||
| Clay % | 41.66 | 41.13 | 67.56 | 8.13 | 27.70 | 58.59 | 0.32 | 0.20 | 140.64 | ||
| pH | 5.48 | 5.60 | 0.40 | 0.63 | 4.64 | 6.43 | 0.05 | -1.63 | 117.34 | ||
| EC (dS/m) | 0.12 | 0.12 | 0.001 | 0.04 | 0.08 | 0.12 | 0.76 | 0.03 | 100.00 | ||
| OC (%) | 1.18 | 0.98 | 0.39 | 0.63 | 0.52 | 2.61 | 1.08 | 0.72 | 221.19 | ||
| CEC (cmolc/kg) | 14.21 | 13.89 | 3.47 | 1.86 | 11.28 | 18.88 | 1.09 | 2.68 | 132.86 | ||
| Avail. B (mg/kg) | 0.95 | 0.99 | 0.17 | 0.42 | 0.40 | 1.79 | 0.54 | -0.18 | 188.42 | ||
| RS-B (mg/kg) | 0.81 | 0.73 | 0.08 | 0.28 | 0.51 | 1.59 | 2.02 | 4.96 | 196.30 | ||
| SA-B(mg/kg) | 0.87 | 0.81 | 0.13 | 0.36 | 0.46 | 2.01 | 2.88 | 9.76 | 231.03 | ||
| OX-B(mg/kg) | 12.32 | 10.94 | 8.04 | 2.84 | 10.09 | 18.71 | 1.84 | 2.24 | 151.87 | ||
| OR-B (mg/kg) | 16.15 | 16.84 | 30.33 | 5.51 | 6.12 | 27.03 | 0.23 | 0.38 | 167.37 | ||
| RES-B (mg/kg) | 61.6 | 58.47 | 337.23 | 18.36 | 41.54 | 101.87 | 0.79 | 0.07 | 165.37 | ||
| 2 | Singhat | Sand % | 31.25 | 29.25 | 71.36 | 8.45 | 21.8 | 50.3 | 1.34 | 2.09 | 160.96 |
| Silt % | 23.5 | 26.04 | 36.43 | 6.04 | 12.10 | 29.57 | -0.93 | -0.37 | 125.83 | ||
| Clay % | 45.25 | 43.94 | 45.82 | 6.77 | 36.91 | 56.01 | 0.46 | -1.07 | 123.78 | ||
| pH | 5.71 | 5.81 | 0.39 | 0.62 | 4.77 | 6.66 | -0.22 | -0.67 | 116.64 | ||
| EC (dS/m) | 0.13 | 0.12 | 0.001 | 0.03 | 0.08 | 0.20 | 1.33 | 2.51 | 153.85 | ||
| OC (%) | 1.07 | 0.99 | 0.16 | 0.4 | 0.58 | 1.97 | 1.32 | 2.41 | 184.11 | ||
| CEC (cmolc/kg) | 13.75 | 14.17 | 3.14 | 1.77 | 10.2 | 15.92 | -0.96 | 0.36 | 115.78 | ||
| Avail. B (mg/kg) | 0.64 | 0.44 | 0.14 | 0.38 | 0.25 | 1.19 | 0.58 | -1.71 | 185.94 | ||
| RS-B (mg/kg) | 0.83 | 0.84 | 0.01 | 0.07 | 0.74 | 0.96 | 0.34 | -0.32 | 115.66 | ||
| SA-B(mg/kg) | 0.62 | 0.64 | 0.01 | 0.11 | 0.4 | 0.77 | -0.69 | -0.04 | 124.19 | ||
| OX-B(mg/kg) | 13.88 | 12.94 | 6.29 | 2.51 | 11.37 | 19.77 | 1.59 | 2.75 | 142.44 | ||
| OR-B (mg/kg) | 18.24 | 19.12 | 23.24 | 4.82 | 8.62 | 23.32 | -1.12 | 0.53 | 127.85 | ||
| RES-B (mg/kg) | 50.53 | 51.49 | 45.34 | 6.73 | 39.47 | 60.67 | -0.35 | -0.23 | 120.07 | ||
| 3 | Henglep | Sand % | 38.99 | 40.05 | 87.93 | 9.38 | 21.5 | 48.12 | -1.09 | 1.07 | 123.42 |
| Silt % | 20.46 | 20.19 | 23.27 | 4.82 | 11.25 | 25.06 | -1.67 | 1.73 | 122.48 | ||
| Clay % | 40.56 | 35.2 | 85.01 | 9.22 | 31.69 | 53.7 | 0.84 | -1.33 | 132.40 | ||
| pH | 5.15 | 4.86 | 0.64 | 0.80 | 4.35 | 6.39 | 0.76 | -1.11 | 124.08 | ||
| EC (dS/m) | 0.11 | 0.11 | 0.001 | 0.03 | 0.07 | 0.16 | 0.66 | 0.13 | 145.45 | ||
| OC (%) | 1.02 | 1.06 | 0.09 | 0.29 | 0.54 | 1.44 | -0.3 | 0.24 | 141.18 | ||
| CEC (cmolc/kg) | 14.50 | 13.79 | 3.95 | 1.99 | 12.63 | 18.11 | 1.17 | 0.56 | 124.90 | ||
| Avail. B (mg/kg) | 0.47 | 0.43 | 0.03 | 0.18 | 0.30 | 0.84 | 1.57 | 3.12 | 178.72 | ||
| RS-B (mg/kg) | 0.81 | 0.78 | 0.04 | 0.19 | 0.57 | 1.02 | 0.00 | -2.24 | 125.93 | ||
| SA-B(mg/kg) | 0.84 | 0.82 | 0.01 | 0.22 | 0.66 | 1.03 | 0.21 | 0.37 | 122.62 | ||
| OX-B(mg/kg) | 13.51 | 12.86 | 8.86 | 2.98 | 10.00 | 17.32 | 0.25 | -2.01 | 128.20 | ||
| OR-B (mg/kg) | 15.48 | 16.32 | 24.71 | 4.97 | 6.98 | 20.17 | -1.02 | -0.25 | 130.30 | ||
| RES-B (mg/kg) | 57.78 | 53.13 | 270.08 | 16.43 | 45.24 | 92.08 | 1.91 | 3.77 | 159.36 |
Table 3.
Variation on the distribution patterns of soil physico-chemical properties in Churachandpur district of Manipur.
Table 3.
Variation on the distribution patterns of soil physico-chemical properties in Churachandpur district of Manipur.
| Sl. No. | Block | Sand (%) | Silt (%) | Clay (%) | Texture | pH | EC (dS/m) |
OC (%) | CEC (cmolc/kg) |
Boron (mg/kg) |
| 1 | Churachandpur | 35.72±8.95 | 22.62±5.12 | 41.66±8.22 | Clay | 5.48±0.63 | 0.12±0.04 | 1.18±0.62 | 14.20±1.86 | 1.10±0.37a |
| 2 | Singhat | 31.25±8.45 | 23.50±6.04 | 45.25±6.77 | Clay | 5.71±0.62 | 0.13±0.03 | 1.07±0.40 | 13.75±1.77 | 0.64±0.38a |
| 3 | Henglep | 38.99±9.38 | 20.46±4.82 | 40.56±9.22 | Clay | 5.15±0.80 | 0.11±0.03 | 1.01±0.29 | 13.50±1.99 | 0.47±0.18b |
| F-value | 1.64 | 0.67 | 0.87 | 1.45 | 0.68 | 0.28 | 0.35 | 9.49 | ||
| P-value | 0.16ns | 0.45ns | 0.42ns | 0.18ns | 0.47ns | 0.76ns | 0.66ns | <0.001*** |
Table 4.
Variation on the distribution patterns of soil boron fraction in Churachandpur district of Manipur.
Table 4.
Variation on the distribution patterns of soil boron fraction in Churachandpur district of Manipur.
| Sl. No. | Blocks | Readily soluble boron (RS-B) |
Specifically adsorbed boron (SA-B) | Oxide bound boron (OX-B) |
Organically bound boron (OR-B) | Residual boron (RES-B) |
| (mg/kg) | ||||||
| 1 | Churachandpur | 0.81±0.28 | 0.87±0.36 | 12.32±2.84 | 16.15±5.51 | 61.50±18.36 |
| 2 | Singhat | 0.83±0.07 | 0.62±0.11 | 13.88±2.51 | 18.24±4.82 | 50.34±6.73 |
| 3 | Henglep |
0.81±0.19 | 0.84±0.12 | 13.51±2.98 | 15.48±4.97 | 57.78±16.43 |
| F-value | 0.03 | 3.07 | 0.99 | 0.71 | 1.55 | |
| P-value | 0.97ns | 0.09ns | 0.45ns | 0.49ns | 0.26ns | |
Table 5.
Results depicting the factor loading values, eigenvalue, variance (%), cumulative variance (%) of PCA-based analysis of soil physico-chemical parameters of Churachandpur district of Manipur.
Table 5.
Results depicting the factor loading values, eigenvalue, variance (%), cumulative variance (%) of PCA-based analysis of soil physico-chemical parameters of Churachandpur district of Manipur.
| Soil parameters | PC1 | PC2 | ||
| Factor loading 1 | Contribution 1 | Factor loading 2 | Contribution 2 | |
| pH | -0.39 | 15.31 | 0.03 | 0.09 |
| EC | 0.39 | 15.31 | 0.23 | 5.32 |
| OC | -0.35 | 12.33 | -0.36 | 13.04 |
| CEC | -0.30 | 9.06 | -0.29 | 8.46 |
| Sand | 0.47 | 22.23 | -0.29 | 8.46 |
| Silt | -0.15 | 2.26 | 0.64 | 41.22 |
| Clay | -0.44 | 19.48 | -0.10 | 1.01 |
| Avail. B | 0.20 | 4.03 | -0.48 | 23.19 |
| F1 | F2 | |||
| Eigen values | 1.78 | 1.22 | ||
| Variance (%) | 39.7% | 18.45% | ||
| Cumulative variance (%) | 39.7% | 58.19% | ||
Table 6.
Results depicting the factor loading values, eigenvalue, variance (%), cumulative variance (%) of PCA-based analysis of the different boron fraction in Churachandpur district of Manipur.
Table 6.
Results depicting the factor loading values, eigenvalue, variance (%), cumulative variance (%) of PCA-based analysis of the different boron fraction in Churachandpur district of Manipur.
| Soil parameters | PC1 | PC2 | ||
| Factor loading 1 | Contribution 1 | Factor loading 2 | Contribution 2 | |
| RS-B | 0.46 | 21.35 | 0.09 | 0.82 |
| SA-B | 0.30 | 9.08 | 0.29 | 8.49 |
| OX-B | 0.36 | 13.08 | 0.56 | 31.65 |
| OR-B | 0.32 | 10.33 | 0.35 | 12.36 |
| RES-B | 0.42 | 17.80 | -0.58 | 33.95 |
| T-B | 0.53 | 28.35 | -0.37 | 13.82 |
| F1 | F2 | |||
| Eigen values | 1.65 | 1.20 | ||
| Variance (%) | 45.32% | 24.05% | ||
| Cumulative variance (%) | 45.32% | 59.36% | ||
4. Discussion
4.1. Influence of Altitudinal Deviation on the Distribution of Physico-Chemical Properties
Considering the textural study of the sand, silt and clay fractions, the proportion of silt and clay fraction were lower and higher at lower topography as shown in Table 3. This might be due to translocation of clay fraction from higher to lower elevation leaving behind the silt content (Mengistu et al., 2016). Moreover, the silt content augmented with height due to deletion of fine soil particles from the steeper slopes and their eventual deposition in the lower slope areas (Endrias et al., 2024)
With regard to the topographic position, the highest pH and EC value were recorded at lower elevation of Singhat area which might be attribute to the accumulation of bivalent cation like calcium and magnesium at lower areas (Endrias et al., 2014). The lower Ph value was recorded in Churachandpur block which might be attribute to higher organic matter content (Brady and Weil, 2002) along with high rainfall that significantly decrease the pH of soil solution over a period of time thereby contributes to soil acidity (Pati and Mukhopadhyay, 2011). However, the overall mean Ph and EC doesn’t have statistically significant difference between the different slope position or elevation which might be due to the buffering mechanism of the soil that maintain an equilibrium level to the external agent to a great extent (Table 3). However, comparing the soil organic matter (SOM) content availability, the highest organic matter (2.61 %) was recorded in Khotuh, Churachandpur and the lowest under Haijang, Singhat village which might be due to assimilation of organic matter during cultivation as plant residue (Ghosh et al., 2005) and through runoff water from higher elevation (Amara et al., 2013).
As evident from the result, the highest CEC value was recorded in Churachadpur block which might be due to higher clay content (Ghosh et al., 2005). However, comparing the different topographical variation on the recorded value, we observed that the upper elevated position of Henglep block has lower concentration of exchangeable calcium, magnesium and percentage base saturation (Amare et al., 2013) resulting from action of leaching and degradation compared to the lower elevated areas which then result in the deposition of washed-out sediment in the lower elevated areas resulting in higher CEC value in Churachandpur block.
The available boron (B) content of the soils of Churachandpur district ranged from 0.47 to 1.10 mg/kg as illustrated in Table 3. Ruminating 0.5 mg/kg as the critical limit of B in soils about 53.33 per cent (16 out of 30) of the sample sites studied had B status in sufficient level and 46.66 per cent of the soils had B content in deficient level. Ray et al. (2018) reported deficiency of available B in 81 per cent of the soils in the study area
4.2. Influence of Altitudinal Deviation on Distribution of Boron Fraction
Boron occurs in soil in different fraction which then differ in their solubility and availability to plants. Boron fraction comprises of readily-soluble (RAS-B), specifically-adsorbed (SA-B), Oxide-bound (OX-B), organically-bound (OR-B) and with residual boron (RES-B). The characterization of various boron fractions in Churachandpur district of Manipur are offered in the Table 4.
1. Readily soluble boron (RAS-B)
Readily soluble boron encompasses both water soluble boron and no specifically adsorbed boron. It embraces dissolved boron in addition to those non-specifically adsorbed on clay and further charged surfaces. In the present analysis, the readily soluble boron recorded the highest (0.83 mg/kg) in Singhat block while the least (0.81 mg/kg) was recorded from Churachandpur and Henglep block. The results were in corroboration with the outcome conveyed by Diana and Beni, 2006 and Chaudhary and Shukla, 2004. In the soils of Konkan and Kerela, the RS-B data were very low ranging from 0.28 to 0.39 ppm, Kasture et al. (2019) relating to high rainfall and intense leaching.
2. Specifically adsorbed boron (SA-B)
Specifically-adsorbed boron (SA-B) encompasses of boron which is adsorbed on clay minerals. The specifically adsorbed boron varied from 0.62 to 0.87 mg/kg (Table 4). The lowest value (0.62 mg/kg) was recorded in the soils from Mauljin, Singhat village and the highest (0.87 mg/kg) in the soils of NH2 Sabual, Khotuh village, Churachandpur. The higher range of this fraction might be attributable to higher clay and organic matter content in soil. The overall relative proportion of this fraction worked out to be just 0.89 per cent of total B. This is in conformity with the findings of other researchers (Xu et al., 2001). Similar outcomes were also testified by Nath et al. (2018) in the soils of Kerela and Assam respectively.
3. Oxide bound (OX-B)
Oxide-bound (OX-B) fraction institutes those amorphous aluminium, iron oxides and hydroxides occluded onto boron along with organic matter. Appraisal of Table 4 exhibited that the oxide bound boron value ranged from 12.32 to 13.88 mg/kg. The highest (13.88 mg/kg) was observed in Tuivelzang 1, Singhat block and lowest (12.32 mg/kg) in Churachandpur block, respectively. The research outcomes are in row with the data (0.26 to 1.67 ppm) revealed by Kumari et al. (2017) in Himachal Pradesh. The result of the investigation showed that oxide bound boron contributed 14.84 per cent of total boron in Churachandpur district of Manipur.
4. Organically bound Boron (ORG-B)
Organically-bound fraction of boron ranged between 15.48 to 18.24 mg/kg (Table 4). The lowest (15.48 mg/kg) and the highest (18.24 mg/kg) were recorded in the soils of Henglep village and Tuivelzang 4, Singhat village, respectively. The slope variation and elevation play a crucial role in lesser composition of organic fraction in Henglep areas as they were of higher altitude which pertain to lesser favourable environment compared to lower altitudinal areas. The lower value of the oxide bound fraction of boron in Henglep block may be attributed to high rainfall and heavy leaching from upper slope to the low-lying areas leading to acidic parent materials. Organic matter is considered to retain more boron than mineral constituent (Dey et al., 2014) and low temperature restricts the mineralization of organic matter and release of adsorbed boron. Organic carbon content in soils has been considered as primary sink of available boron when unleased through mineralization (Gupta et al., 1983). Comparatively higher contribution of organically bound boron (18.75 per cent) of total boron in the present study might be due to higher content of organic carbon.
5. Residual boron (RES-B)
Residual B was the most dominant pool of B, contributing about 65.35 per cent towards the total B in the present study. In the present context, the highest residual boron fraction of 61.50 mg/kg was recorded under Churachandpur block which is of lower elevation compared to the remaining other two blocks of higher altitudeas shown in Table 4. Overall distribution study of different boron fractions in soils of Churachandpur district reveals their relative dominance in the order: RES-B>OR-B>OX-B> SA-B> RS-B (Table 4). Similar distribution pattern of boron fractions in soil was also reported by Kumari et al. (2017).
4.3. Co-Relation Between Boron Fractions with Soil Properties of Churachandpur District, Manipur
1. Soil pH
In the present investigation pH (1:2 H2O) were found to have positive correlations with all the boron fractions studied i.e. readily-soluble boron (RAS-B), specifically-adsorbed boron (SA-B), oxide-bound boron (OX-B), organically-bound boron (OR-B) and with residual boron (RES-B) as shown in Table 5 and Figure 3. In lower slope range of Churachandpur block, the correlation of pH of the soils was positive and significant with Readily soluble boron (r=0.55**) as shown in Figure 3(a). However, the remaining block viz. Singhat and Henglep does show positive correlation with the boron variants but was observed to be non-significant. It can be ascribed to the fact that increasing the pH increases the negative surface charges of clays and other variable charge surfaces. The findings were further supported by Datta et al. (2002) and Choudhury and Shukla, 2004.
2. Electrical Conductivity (EC)
The EC of the soils of lower elevated Churachandpur block correlated negatively with boron fractions of the soil viz., readily soluble boron (r=-0.72**), Oxide bound boron (r=-0.62**) significantly while the remaining other were correlated was found not statistically significant in Figure 2(a). Moreover, correlations between electrical conductivity (EC) and readily soluble boron (RS-B) of higher elevated Henglep block was found to be statistically significant with r values of -0.81* (Figure 3b) which also indicates that with increase in transformation of boron fraction in any form resulted in decrease of EC content of these soils. Rathiya et al. (2018) also reported that there is no any significant effect on EC by the application of boron.
3. Organic Carbon (OC)
The correlation found in soil of lower foothill slope of Churachandpur between forms of boron fractions and organic carbon (OC) of the soils was mostly positive which also indicates that with increase in organic carbon content in soil resulted in increase in transformation of different boron fractions (Figure 3a). This positive relationship may be elucidated as that organic carbon is source of boron due to which there is not much transformation from the residual to other pools, resulting larger residual pool of boron with optimum organic matter. Illustrating the correlation between organic carbon with readily soluble boron (RAS-B) and oxide bound boron statistically significant with r values of 0.80** and 0.75** respectively. Similar case was observed under Singhat block as shown in Figure 3b. This significant correlation of these fractions with organic carbon indicated that soil organic matter is an important parameter contributing towards availability of B in soils (Mathur and Sudan, 2011). The present remark is in arrangement with the findings of Dey et al., 2014.
4. Cation Exchange Capacity (CEC)
Comparing the lowest and the highest slope gradient site of the studied area, the lower foothill areas of Churachandpur correlate well between Cation exchange capacity (CEC) with RAS-B and OX-B significantly with tabulated r value of 0.94** and 0.78**, respectively. The outcomes depicted significant positive correlation of soil boron fractions with Cation Exchange Capacity (CEC) of the studied soils. In Henglep block of upper slope range, the Cation exchange capacity (CEC) was found to correlate significantly and positively with readily soluble boron (r= 0.83*) and Residual boron (r=0.90*) as shown in Figure 2c. The organic carbon and CEC favoured by high organic matter content has positive correlation with different boron fractions (Arora et al., 2014). However, the other forms of boron fractions viz., specifically adsorbed boron, oxide bound boron and organically bound boron were found to have direct correlation with CEC which was statistically non-significant (Figure 3). These results were in line with the findings of Kaundal et al. (2014) and Dey et al. (2015).
5. Boron
The correlation between available boron and boron variant in soil were observed to correlate well. However, there exhibited non-significant relation between them as shown in figure 3a,3b and 3c. In the Singhat block, soil fraction exhibited negative correlation with the available B content as shown in Figure 3b. This might be ascribed to immobilization of certain boron fractions, such as organically bound boron that are associated with sesquioxide’s (iron/aluminum oxides), pertaining it unavailable for plant uptakes. Besides, adsorption onto the oxides and hydroxide clay mineral further hasten the process of fixation render its unavailable as stated by Padbhushan & Kumar (2017).
6. Soil texture
The co-relation coefficient (r) between various boron fractions with mechanical separates (i.e. sand, silt and clay fractions) of Churachandpur district of Manipur was presented in the Figure 3. In these soils the correlation of coarse fraction with boron fractions were negative. However, it was statistically significant in case of readily soluble boron (r=-0.59*) and organically bound boron (r= - 0.92**) fractions of Singhat area (Figure 3b). In Henglep block, the sand separates correlate well with readily soluble (r=-0.79*) fraction negatively as illustrated in Figure 3c. Generally coarse textured soils possess less adsorption sites and also favour good leaching of plant available nutrients. The illustrated surveys about fine texture soils encompass more available boron than coarse textured soils (Raza et al., 2002). Coarse textured soils of humid regions may have B deficiency due to loss of B through leaching (Shuman, 1975).
The silt content correlated well different variant of boron but was found to be non-significant for all the fractions except for organically bound boron (r=0.93**). The present investigation showed that all the boron fractions were found to have positive correlations with clay content i.e. readily soluble boron, specifically adsorbed boron, oxide bound boron, organically bound boron and residual boron as shown in Figure 3a. However, the correlation of clay content of the soils was positive and significant with specifically adsorbed boron (r= 0.50*) and organically bound boron (r=0.65*) only as in Figure 3a. It is evidently showed that boron content amplified in soil with a surge in clay content. Fine-textured soils retain B for longer periods than do coarse-textured soils due to the higher adsorption affinity of the former (Nicholaichuk et al., 1988). The Spearman correlation test of the above analysis was illustrated with the help of correlogram as shown in Figure 3.
4.4. PCA-Based Interpretation of Significant Soil Physico-Chemical Properties in Churachandpur District of Manipur
The principal component analysis revealed sensitive patterns and variability in soil parameters through factor loadings as shown in Table 5 and Figure 4. The initial two principal components (PC1 and PC2) together with eigenvalues greater than 1 accounted for 58.19% of the entire variance. PC1 with an eigenvalue of 1.78 explained 39.7% of total variance where sand content demonstrated the highest positive loading value of 0.47 which accounted for 22.23% of this variability making it the key sand factor. The principal component number two (PC2) demonstrated the silt factor and possessed an eigenvalue of 1.22 which accounted for 18.45% of the total variance while silt content showed the strongest positive loading at 0.64, explaining about 41.22% of variability. Analysis identified sand and silt fractions as the primary influential factors. Certain soil physico-chemical properties in Churachandpur district, Manipur, India experience influence from these factors. The PCA biplot highlighted various relationships amongst soil properties: Dim 1 demonstrates strong connections with EC, sand content and available boron levels while Dim 2 shows relationships with pH, silt and clay fractions along with cation exchange capacity and organic carbon. Dim 1's strong negative loading for available boron shows that soils from Singhat and some Churachandpur blocks contain high boron levels while other areas exhibit boron deficiency.
4.5. PCA-Based Interpretation of Significant Boron Fractions or Variant in Churachandpur District of Manipur
Principal Component Analysis (PCA) identified the sensitivity and variability of soil boron fractions based on factor loadings (Table 6 and Figure 5). The first two principal components (PC1 and PC2) with eigenvalues >1 explained 59.36% of the total variance. PC1 (eigenvalue 1.65) accounted for 45.32% of the variance, with readily soluble boron (RS-B) showing the highest positive loading (0.46), contributing 21.35% to the variability, representing the RES-B fraction. PC2 (eigenvalue 1.20) explained 24.05% of the variance, with oxide-bound boron (OX-B) having the highest negative loading (-0.58), contributing 33.95% to the variability, representing the OX-B fraction. This analysis revealed that RES-B and OX-B are the most significant factors influencing soil boron fractions in Churachandpur district, Manipur, India. The PCA biplot highlighted relationships among boron fractions, with Dim 1 primarily associated with all soil boron fractions, including RES-B, adsorbed boron, OX-B, organically bound boron, and residual boron. The overall analysis revealed the interrelationship among the boron fractions and the collected soil samples. The principal component-based results illustrated the influence of readily soluble boron variant on the sample plots on varying levels of slope with greater impact on the lower elevated and valley areas of churachandpur block as compared to hilly terrain of Singhat and Henglep block. Moreover, comparing the other boron variants, the organically bound fraction of boron also contributes a greater perspective towards the sample sites depending on the varying levels of altitude. The lower elevated areas of churachandpur block recorded better contribution in the total pool of boron while compared to the remaining soil samples collected from higher elevated areas of Singhat and Henglep. The illustrated findings and the outcomes evoke a greater prospect of farming and cultivation of rice in the lower altitudinal and valley areas of churachandpur district as they were enriched with enough macro and micronutrients for plant physiological process compared to the hilly terrain with lower economic output.
5. Conclusions
In a nutshell, this study assesses the impact of variable topographical variant across the hilly terrain on different patterns and characteristics of soil physico-chemical properties along with the distribution of boron fractions in Churachandpur district, Manipur, India. The findings showed unevenness equally on soil properties and boron fractions. Soil pH ranged from strongly acidic to neutral. Several parameters, including soil pH, electrical conductivity (EC), cation exchange capacity (CEC), and available boron, showed variation across different locations and land use patterns. Organic carbon content varied from low to very high in the soil samples. The study also highlighted that the available soil properties have significant potential to improve soil quality and support diverse cropping systems. Among the different soil textural classes, variability was observed across sites, affecting the soil nutrient structure and its efficiency. Regarding boron fractionation, residual boron accounted for 76.5% of the total boron, followed by organically bound boron. The relative proportions of boron fractions in soils of Churachandpur district of Manipur were illustrated to be in the following sequence: Residual boron > organically bound boron > oxide-bound boron > specifically adsorbed boron > readily soluble boron. The PCA-based analysis revealed that RES-B and OX-B are the most significant factors influencing soil boron fractions in Churachandpur district, Manipur, India. Further research is needed to explore the characterization and transformation of boron fractions, which will help in developing effective, tailored strategies for soil resource management. Future studies should explore the intricate relationship among slope positions, slope gradient, soil properties, vegetation, land-use management and advance soil quality indicators to support ecosystem restoration and proper land management.
Author Contributions
All the authors contributed censoriously to the preparation and approval of the final manuscript.
Funding
“The research did not receive any specific funding”.
Data Availability Statement
The corresponding author is willing to provide the analysed data upon reasonable request.
Acknowledgments
The authors wish to acknowledge Department of Soil Science and Agricultural Chemistry, College of Agriculture, Central Agricultural University for implementing and effective completion of soil sampling processes. In addition, the authors would like to acknowledge those staffs who provide technical assistance on this venture for their valuable support during the data collection process.
Conflicts of Interest
“The authors declare no conflict of interest”.
Abbreviations
The following abbreviations are used in this manuscript:
| RAS-B | Readily soluble boron |
| SA-B | Specifically adsorbed boron |
| OX-B | Oxide bound boron |
| OR-B | Organically bound boron |
| RS-B | Residual boron |
References
- Amare, T.; Terefe, A.; Selassie, Y.G.; Yitaferu, B.; Wolfgramm, B.; Hurni, H. Soil Properties and Crop Yields along the Terraces and Toposequece of Anjeni Watershed, Central Highlands of Ethiopia. J. Agric. Sci. 2013, 5, 134. [Google Scholar] [CrossRef]
- Behera, S.K.; Singh, D.; Dwivedi, B.S. Changes in Fractions of Iron, Manganese, Copper, and Zinc in Soil under Continuous Cropping for More Than Three Decades. Commun. Soil Sci. Plant Anal. 2009, 40, 1380–1407. [Google Scholar] [CrossRef]
- Berger, K.C.; Truog, E. Boron Determination in Soils and Plants. Ind. Eng. Chem. Anal. Ed. 1939, 11, 540–545. [Google Scholar] [CrossRef]
- Bingham, F. T. Boron. In: Page, A. L. (Ed.). Methods of soil analysis Part-2 chemical and mineralogical properties. American Society of Agron., 1982, 431-448.
- Brady, N.C.; Weil, R.R. The Nature and Properties of Soil. 13th Edition, Prentice Hall, Upper Saddle River, New Jersey 2002.
- Chaudhary, D.R.; Shukla, L.M. Boron status of arid soil of western Rajasthan in relation to their characteristic. Journal of the Indian Society of Soil Science 2004, 52, 194–196. [Google Scholar]
- Chen, J.; Xiao, H.; Li, Z.; Liu, C.; Wang, D.; Wang, L.; Tang, C. Threshold effects of vegetation coverage on soil erosion control in small watersheds of the red soil hilly region in China. Ecol. Eng. 2019, 132, 109–114. [Google Scholar] [CrossRef]
- Datta, S.P.; Rattan, R.K.; Suribabu, K.; Datta, S.C. Fractionation and colorimetric determination of boron in soils. Z. Pflanzenernähr. Bodenk 2002, 165, 179–184. [Google Scholar] [CrossRef]
- Dey, A.; Dwivedi, B.S.; Meena, M.C.; Datta, S.P.; Kumar, A. Soil boron fractions and their contribution towards boron availability and uptake by wheat on a Typic Haplustept under long-term fertilization. Journal of Indian Society of Soil Science 2014, 62, 384–390. [Google Scholar]
- Diana, G.; Beni, C. Effect of organic and mineral fertilization on soil boron fractions. Agricoltura Mediterranea 2006, 136, 70–78. [Google Scholar]
- Endrias, M.; Assen, M.; Legass, A. Effect of land-use types and topographic positions on soil physico-chemical properties in urago and mendi micro-watersheds, Becho District, Central Highlands of Ethiopia. Cogent Food Agric. 2024, 10. [Google Scholar] [CrossRef]
- Estefan, G.; Sommer, R.; Ryan, J. Methods of Soil, Plant, and Water Analysis: A Manual for the West Asia and North Africa Region. Third Edition, International Center for Agricultural Research in the Dry Areas (ICARDA), Beirut, 2013, 84-105.
- Ghosh, S.; Sarkar, D.; Sahoo, A.K. Nature, distribution, amelioration response of soil acidity in a host site of hot dry sub-atomic belt of West Bengal. Journal of the Indian Society of Soil Science 2005, 53(1), 66–73. [Google Scholar]
- Gupta, U.C. Boron deficiency and toxicity symptoms for several crops as related to tissue boron levels. J. Plant Nutr. 1983, 6, 387–395. [Google Scholar] [CrossRef]
- Hou, X.; Han, H.; Tigabu, M.; Cai, L.; Meng, F.; Liu, A.; Ma, X. Changes in soil physico-chemical properties following vegetation restoration mediate bacterial community composition and diversity in Changting, China. Ecol. Eng. 2019, 138, 171–179. [Google Scholar] [CrossRef]
- Hou, J.; Evans, L.J.; Spiers, G.A. Boron fractionation in soils. Commun. Soil Sci. Plant Anal. 1994, 25, 1841–1853. [Google Scholar] [CrossRef]
- Hou, J.; Evans, L.J.; Spiers, G.A. Chemical fractionation of soil boron: I. Method development. Can. J. Soil Sci. 1996, 76, 485–491. [Google Scholar] [CrossRef]
- Jackson, M.L. Soil Chemical Analysis, Prentice Hall of India Pvt. Ltd. New Delhi 1973. [Google Scholar]
- Kasture, M.; Kalokhe, D.; Salvi, V. Effect of Submergence on Boron Fractions in Soils of Konkan Region of Maharashtra. J. Indian Soc. Soil Sci. 2019, 67, 204. [Google Scholar] [CrossRef]
- Katyal, J.; Vlek, P. 3. Micronutrient problems in tropical Asia. Nutr. Cycl. Agroecosystems 1985, 7, 69–94. [Google Scholar] [CrossRef]
- Kaundal, A.; Sharma, S.K.; Kumar, P.; Sankhyan, N.; Dutta, J. Distribution of Boron Forms in Relation to Soil Characteristics, Chemical Fertilizers, and Amendments in an Acid Alfisol of Northwestern Himalayas. Commun. Soil Sci. Plant Anal. 2014, 45, 1772–1783. [Google Scholar] [CrossRef]
- Khan, F.; Hayat, Z.; Ahmad, W.; Ramzan, M.; Shah, Z.; Sharif, M.; Mian, I.A.; Hanif, M. Effect of slope position on physico-chemical properties of eroded soil. Soil Environment 2013, 32, 22–28. [Google Scholar]
- Khormali, F.; Ayoubi, S.; Foomani, F.K.; Fatemi, A.; Hemmati, K. Tea yield and soil properties as affected by slope position and aspect in Lahijan area, Iran. Int. J. Plant Prod. 2007, 1, 99–111. [Google Scholar] [CrossRef]
- Kumari, K.; Nazir, G.; Singh, A.; Kumar, P. Studies on Boron Fractions with Different Physico-Chemical Properties of Cultivated Soils of Himachal Pradesh, India. Int. J. Curr. Microbiol. Appl. Sci. 2017, 6, 1547–1555. [Google Scholar] [CrossRef]
- Lemenih, M.; Karltun, E.; Olsson, M. Assessing soil chemical and physical property responses to deforestation and subsequent cultivation in smallholders farming system in Ethiopia. Agric. Ecosyst. Environ. 2005, 105, 373–386. [Google Scholar] [CrossRef]
- Mathur, R.; Sudan, P. Relationship and distribution of various forms of boron with different physico chemical properties of soil in Bikaner district. Journal of Chemical and Pharmaceutical Research 2011, 3(3), 290–294. [Google Scholar]
- Mengistu, D.; Bewket, W.; Lal, R. Conservation Effects on Soil Quality and Climate Change Adaptability of Ethiopian Watersheds. Land Degrad. Dev. 2015, 27, 1603–1621. [Google Scholar] [CrossRef]
- Nath, A.J.; Brahma, B.; Sileshi, G.W.; Das, A.K. Impact of land use changes on the storage of soil organic carbon in active and recalcitrant pools in a humid tropical region of India. Sci. Total. Environ. 2018, 624, 908–917. [Google Scholar] [CrossRef]
- Nicholaichuk, W.; Leyshon, A.J.; Jame, Y.W.; Campbell, C.A. BORON AND SALINITY SURVEY OF IRRIGATION PROJECTS AND THE BORON ADSORPTION CHARACTERISTICS OF SOME SASKATCHEWAN SOILS. Can. J. Soil Sci. 1988, 68, 77–90. [Google Scholar] [CrossRef]
- Padbhushan, R.; Kumar, D. Distribution of Boron in Different Fractions in Some Alkaline Calcareous Soils. Commun. Soil Sci. Plant Anal. 2015, 46, 939–953. [Google Scholar] [CrossRef]
- Pati, R.; Mukhopadhyay, D. Distribution of Cationic Micronutrients in Some Acid Soils of West Bengal. Journal of Indian Society of Soil Science 2011, 59(2), 125–133. [Google Scholar]
- Pierson, F.B.; Mulla, D.J. Aggregate stability in the Palouse region of Washington: E ect of landscape position. Soil Science Society of America 1990, 54, 1407–1412. [Google Scholar] [CrossRef]
- Randhawa, K.S.; Bhail, A.S. Effect of nitrogen, phosphorus and potassium on cauliflower. Indian Journal of Horticulture 1976, 33, 83–91. [Google Scholar]
- Rathiya, G.R.; Kumar, U.; Mahobia, R.K.; Painkra, S. Response of Balanced Fertilization on Soil Nutrient Status, Growth and Yield of Blackgram. International Journal of Agriculture Sciences 2018, 10, 0975–3710. [Google Scholar]
- Ray, P.; Gogoi, S.N.; Bandyopadhyay, S.; Padua, S.; Jena, R.K.; Roy, P.D.; Ramachandran, S.; Sharma, G.K.; Sah, K.D.; Trivedy, K.; Singh, S.K.; Ray, S.K. Fertility status of mulberry (Morus indica L.) growing soils of Upper Brahmaputra Valley Region of North Eastern India. Range Management of Agroforestry 2018, 39, 147–155. [Google Scholar]
- Raza, M.; Mermut, A.R.; Schoenau, J.J.; Malhi, S.S. Boron fractionation in some Saskatchewan soils. Can. J. Soil Sci. 2002, 82, 173–179. [Google Scholar] [CrossRef]
- Sarkar, D. Physical and chemical methods in soil analysis. New Age International Publishers, India, 2005.
- Sathya, S.; Pitchai, G.J.; Indirani, R. Boron nutrition of crops in relation to yield and quality–A review. Agricultural Reviews 2009, 30(2), 139–44. [Google Scholar]
- Shukla, A.K.; Behera, S.K.; Satyanarayana, T.; Majumdar, K. Importance of micronutrients in Indian agriculture. In better crops - South Asia 2019, 1, 6–10. [Google Scholar]
- Shuman, L.M. The Effect of Soil Properties on Zinc Adsorption by Soils. Soil Sci. Soc. Am. J. 1975, 39, 454–458. [Google Scholar] [CrossRef]
- Singh, M.V. Micronutrient deficiencies in crops and soils in India. In micronutrient deficiencies in global crop production, ed. B. J. Alloway, 93–125. The Netherlands: Springer, 2008.
- Sumner, M.E.; Miller, W.P. Cation exchange capacity and exchange coefficients. In Methods of Soil Analysis. Part 3. Chemical Methods; Bingham, J.M., Ed.; ASA-SSSA: Madison, WI, USA, 1996. [Google Scholar]
- Tsui, C.-C.; Chen, Z.-S.; Hsieh, C.-F. Relationships between soil properties and slope position in a lowland rain forest of southern Taiwan. Geoderma 2004, 123, 131–142. [Google Scholar] [CrossRef]
- Xu, J.; Wang, K.; Bell, R.; Yang, Y.; Huang, L. Soil Boron Fractions and Their Relationship to Soil Properties. Soil Sci. Soc. Am. J. 2001, 65, 133–138. [Google Scholar] [CrossRef]
Disclaimer/Publisher’s Note: The statements, opinions and data contained in all publications are solely those of the individual author(s) and contributor(s) and not of MDPI and/or the editor(s). MDPI and/or the editor(s) disclaim responsibility for any injury to people or property resulting from any ideas, methods, instructions or products referred to in the content. |
© 2025 by the authors. Licensee MDPI, Basel, Switzerland. This article is an open access article distributed under the terms and conditions of the Creative Commons Attribution (CC BY) license (http://creativecommons.org/licenses/by/4.0/).
Copyright: This open access article is published under a Creative Commons CC BY 4.0 license, which permit the free download, distribution, and reuse, provided that the author and preprint are cited in any reuse.


