Submitted:
31 July 2023
Posted:
02 August 2023
You are already at the latest version
Abstract
In Ethiopia, land degradation in the form of gully development and soil nutrient depletion is a very serious issue. The goal of this study is to determine how different types of land management practices and slope positions affect particular soil physico-chemical characteristics in the Agamssa watershed. Using systematic sampling techniques, soil samples were taken using a sampling quadrat (15 * 15 m) that was placed 50 m apart from one another. A total of 54 quadrats were planted at three slope positions: upper (>15%), middle (10–15%), and foot (3–10%) slope respectively. 18 composite soil samples were then. A two-way ANOVA was used to analyze the data, and the Least Significant Difference (LSD) test was used to separate the means at p ≤ 0.05. According to the study's findings, the value of most soil physical and chemical characteristics was higher in closed area than on open grazing land, as well as at foot slope position compared to middle and upper slope positions. The higher mean value (7.3 ppm) was recorded at the foot slope, while the lower mean value (4.9 ppm) was found at the upper slope position. The exchangeable cations such as Mg+2, K+, and Na+ were significantly (p≤ 0.01) affected by the main effect of land-use types. The higher mean values of Mg+2 (9.70 mq/100g), K+ (0.38 mq/100 g), and Na+ (0.035 mq/100 g) were found at area closure, whereas the lower mean values of Mg+2 (7.33 mq/100g), K+ (0.30 mq/100 g), and Na+ (0.027 mq/100g) were recorded at open grazing land. It was able to conclude this study that area closure enhances the physical and chemical qualities of soil and recovers woody plant species. Therefore, converting open grazing land into a closure area is advised.
Keywords:
Area closure
; Open grazing land
; Soil properties
; Slope position
1. Introduction
The livelihood of the global population is largely dependent on the soil, which also provides food, clean water, and air as well as being a key repository for biodiversity [1]. However, the global environment, agricultural production, and economic progress are seriously hampered by land degradation, which takes the form of soil erosion and diminishing soil physical and chemical qualities [2]. Due to this fact, the average annual rate of soil loss in Ethiopia is approximated to be 42 tons per hectare per year and it’s above 300 tons per hectare per year on extremely exposed areas such as low vegetation cover areas and steep slopes [3]. This exceeds the mean annual tolerable soil loss level of 11 tons per hectare per year, which is a generally accepted strategy for erosion control mechanisms as appropriate; however, it may be lower or higher depending on soil depth, texture, and permeability [4].
In Ethiopia, the majority of the physical soil conservation measures and community forest plantations were destroyed, and only 25% of the land rehabilitation targets in terms of reforestation efforts and soil conservation schemes have been achieved [5]. In various regions of Ethiopia, particularly in Tigray, area closure has emerged as a promising strategy to address these serious resource degradation issues [6], Wollo, and Showa [7] reported that area closures are a process of restoration and rehabilitation of degraded lands by natural means, but the background and meaning of area closures differ from country to country. Accordingly, [8] Stated area closure in the Ethiopian situation is referred to as degraded land that has been excluded from human and livestock interference for restoration. Principally, human and animal interference controlled the area under closure to inspire natural regeneration. However, in practice controlled grazing of cattle is allowed in several area closures, especially five years later from its establishment, cutting grass and collection of fuel wood from dead trees and bee-keeping are allowed [9].
Therefore, several area closure projects have already been launched in the various regional states of Ethiopia by both governmental organizations and non-governmental organizations, and those in the northern parts of the Tigray region and central highlands of the country studies conducted on area closures [10]. So far, two major types of area closures were practiced in Ethiopia. The most common type involves closing off an area from livestock and people so that natural regeneration of the vegetation can occur. The second choices contain the closing of degraded land while at the same time implementing extra measures like establishing soil and water harvesting structures to enhance the woody plant species regeneration capacity [11].
2. Materials and Methods
2.1. Location, Climate, and Topography of the Study Area
The study was conducted in Agamssa micro watershed, which is located in Habru District, North Wollo. It is found 490 km to the Northeast of Addis Ababa (the Capital of Ethiopia) and about 30 km South of Woldia (the capital town of North Wollo). It is geographically located between 11° 35´ 30´´ N - 11° 40´ 30´´ N Latitude and 39° 35´ 0´´ E - 39° 40´ 0´´ E Longitude (Figure 1). The altitude of the watershed ranges between 1573 and 1870m above sea level. The map of the study area is drawn using ArcGIS. This watershed is part of the Mersa sub river basin and the total area of the watershed is about 779 ha and is characterized by flat and hilly topography.
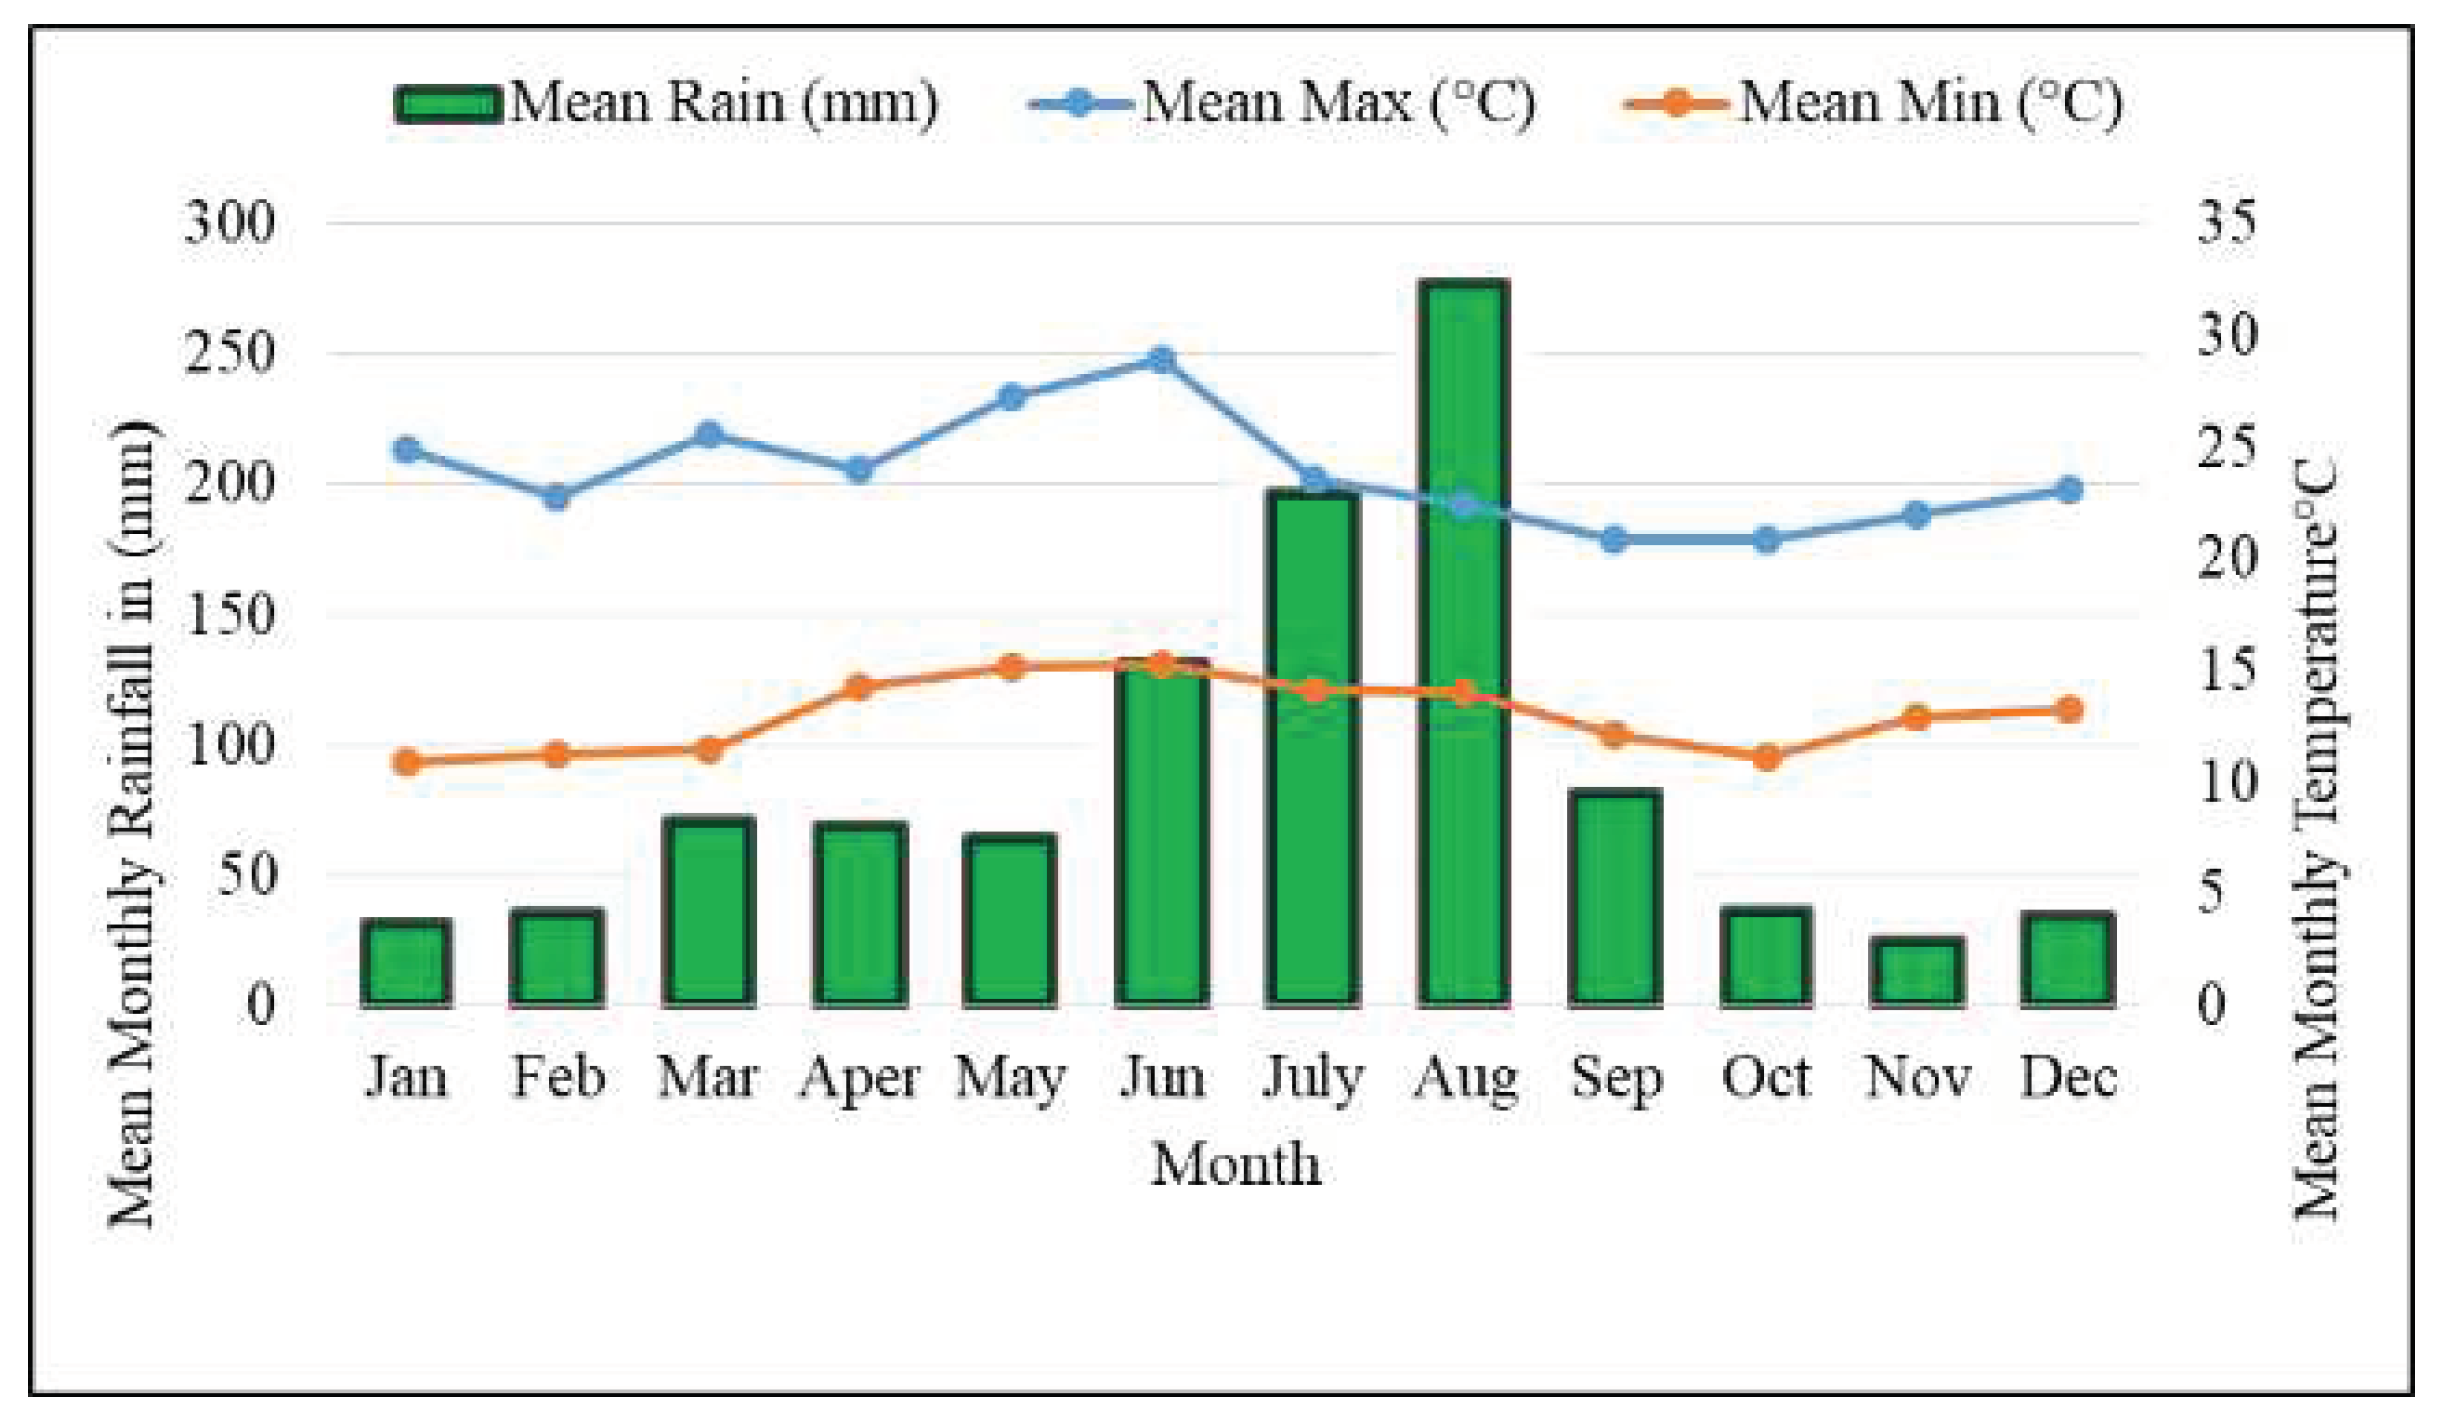
According to the nearby Sirinka Agricultural Research Center Meteorological Station long-term climate data (1990 - 2020) showed that the mean monthly maximum and mean minimum air temperature of the study area were 23.84 and 12.99 °C, respectively (Figure 2). The mean monthly rainfall distribution of the study area indicates July and August are the wettest month and high rainy seasons (Figure 2). It indicates the nature of rainfall distribution in the study area; the short (Belg) rain starts in February and ends in May while the main rainy season starts in June and ends in September. However, the distribution is erratic. According to the classification of agroecological zones, the climate is ‘Woyna Dega’ and the average research area's yearly rainfall is between 750 – 1000 mm. The dominant crops grown in the watershed include teff (Eragrostis tef) and maize (Zea mays) and sorghum (Sorghum bicolor). The soil types in the landscape are predominated by Cambisol, Leptosol, and Vertisol.
2.2. Experimental design and soil sampling techniques
A reconnaissance survey was carried out before the actual sampling, to identify the representative watershed having both open grazing land and area closure sites. Under the watershed area, open grazing land and area closure sites were homogeneous before area closure establishment, and the size of open grazing land was 11.3 ha while the area closure was 8.6 ha. Clinometers were used to identify the slope class of the sampling sites. Soil sampling plots were established in 15 m by 15 m of closed area and open grazing land and replicated three times across the slope positions. The sample plots were laid down using systematic sampling techniques in which one quadrat was 50 m apart from the other. The soil samples were collected from a total of 54 quadrates, 27 from each land use, and three slope positions, namely, upper (> 15%), middle (10-15%), and foot (3-10%) slope positions. All quadrats were laid in a zigzag manner for the considered land use to collect soil samples, a total of 54 soil samples were collected from 54 quadrats, and soil samples from every three quadrats laid on similar land use and slope class were mixed thoroughly to produce a single composite sample that represents a single replication which finally gave rise to 18 composite soil sample (2 land-use types 3 slope positions 3 replications) were collected by using auger from a depth of 0-20 cm. Undisturbed soil samples were taken from the respective land-use types and slope classes using a core sampler for the detection of soil bulk density.
Soil Sample Preparation and laboratory analysis
Soil clods in every composite sample were thoroughly mixed and ground, following which the soil was divided into two four equal parts from which two diagonals were taken and the alternative two parts were removed. The samples were mixed thoroughly in a plastic bucket to form a composite sample. Except for soil bulk density, the collected soil samples were air-dried at room temperature, homogenized, and passed through a 2 mm sieve before laboratory analysis. For the determination of soil organic carbon and total nitrogen, the samples were passed through a 0.5 mm sieve. Likewise, undisturbed samples were taken with a core sample of height (10 cm) and diameter (7.2 cm) for soil bulk density determination.
Selected soil physical and chemical properties that were determined in the laboratory including soil texture, bulk density, pH, organic carbon, total nitrogen, available phosphorus, CEC, and exchangeable bases (Ca, Mg, K, and Na). The soil samples were analyzed at Sirnka Agricultural Research Center Soil laboratory following the standard and recommended analytical procedures. Soil texture was analyzed by the Bouyoucous Hydrometer method [12]. The bulk density of the soil was estimated from undisturbed soil samples collected by using a core sampler (which is weighted with field moisture) after drying preweighted soil core samples in an oven for 24 hours at 105°C [13].
The soil pH was determined by a 1:2.5 soil-to-water ratio suspension method with a microprocessor-based pH meter (Jackson, 1973). Soil organic carbon was determined by Walkley and Black method [14]. Total nitrogen was determined using the Kjeldahl digestion, distillation, and titration method [15]. Available phosphorus was determined by the Olsen method [16]. The ammonium acetate method was employed to determine the Cation Exchange Capacity [17] and Exchangeable bases (Ca, Mg, K, and Na) were determined after extracting the soil samples by ammonium acetate (NH4CH3CO2) solution at pH 7 [18]. Exchangeable Ca and Mg in the extracts were analyzed using atomic absorption spectrophotometer, whereas K and Na were measured by flame photometer [19].
2.3. Statistical Data Analysis
The collected soil data were organized and summarized according to land use type and slope position. The data obtained from the laboratory were subjected to the analysis of variance (ANOVA) in statistical analysis software (SAS). Statistically significant different treatment means were separated using the least significant difference (LSD) technique at P ≤ 0.05 significance level.
3. Results and Discussion
3.1. Effect of land management practices on selected soil physical properties
3.1.1. Soil Texture. The results revealed that clay and sand fractions of the soil were significantly (P < 0.001) affected by the main effects of land management types, whereas, the silt soil separates were significantly different for land use (P ≤ 0.05). The results also showed that the highest sand mean value (49.0%) contents were recorded at open grazing land. The possible reason might be the continuous grazing and trampling effect of livestock, which is exposed to selective removal of the clay and silt fraction due to erosion. This result agrees with [20] who reported that sand content was reduced at the exclosure areas. However, the clay and silt fraction was increased under the exclosure area significantly. The highest clay content mean value (31.8%) in the area closure means that there could be relatively low soil erosion at the site, due to dense vegetation and accumulation of vegetation litter, this finding is in line with [21] Stated that in general, management practises don't quickly change the soil's textural class on a field scale. However, managerial techniques indirectly contribute to this.
The results of ANOVA revealed highly significant differences (P ≤ 0.001) in sand, silt, and clay content (P ≤ 0.001) as a result of the main effect of slope position (Table 1). The mean value of sand fraction was (55.6%) in the upper slope position than the middle slope and the foot slope position, which had 47.9% and 37.1%, respectively. The result disclosed that silt and clay soil separates tend to increase in percent composition as one went from the upper slope position to the foot slope, whereas the sand soil separates showed a reverse trend (Table 1). This showed the removal of clay and silt content from the upper and middle slope position to the foot slope position. On the other hand, such a process produced a high volume of sand fraction in the upper slope position compared to the middle and foot slope position. This finding agreed with [22] who reported that clay and sand contents were significantly different at different slope gradients.
3.1.2. Soil bulk Density (BD). The mean effect of land management types significantly (P < 0.05) affected soil bulk density (Table 1). The highest bulk density (1.31g/cm3) was recorded from open grazing land while the lowest mean value (1.22 g/cm3) was recorded from area closure. The highest bulk density found on the open grazing land area closure, probably due to soil compaction encountered as a result of the trampling effect from domestic animals during grazing, and the low vegetation coverage exposure of the soil surface to direct raindrop impacts cause the soil compaction the result agrees with [23].
Bulk density was found significantly (P <0.01) affecting the slope position (Table 1). The highest mean value of bulk density was observed under the upper slope position (1.40 g/cm3), followed by the middle slope position (1.25 g/cm3), and the foot slope position (1.15g/cm3), respectively (Table 1). The variation of soil bulk density among the slope positions might be attributed to the selective removal of fine soil particles and organic matter from the upper slope and deposited at the lower slope, which ultimately reduced soil bulk density and improved porosity. The result is also supported by [24] who found soil bulk density was significantly affected by slope position.

Table 1.
Mean effects of land management practices and slope positions (mean SE) of topsoil (0-20 cm) depth.
Table 1.
Mean effects of land management practices and slope positions (mean SE) of topsoil (0-20 cm) depth.
| Variables | ||||
|---|---|---|---|---|
| Land management practices | Sand (%) | Silt (%) | Clay (%) | BD (g/cm3) |
| Area closure | 44. 8b | 23.4a | 31.8a | 1.22b |
| Open grazing land | 49a | 21.9b | 29.1b | 1.31a |
| LSD (0.05) | 1.49 | 1.15 | 1.2 | 0.089 |
| CV (%) | 3.09 | 4.93 | 3.8 | 6.88 |
| SEM(±) | 0.5920 | 0.4561 | 0.4738 | 0.0290 |
| Slope positions | ||||
| Upper (>15%) | 55.6a | 19.2c | 25. 2c | 1.40a |
| Middle (10-15%) | 47.9b | 21. 6b | 30.5b | 1.25b |
| Foot (3-10%) | 37.1c | 27.3a | 35.6a | 1.15b |
| LSD (0.05) | 1.49 | 1.15 | 1.2 | 0.11 |
| CV (%) | 3.09 | 4.93 | 3.8 | 6.88 |
| SEM (±) | 0.5920 | 0.4561 | 0.4738 | 0.0355 |
3.2. Effect of Land Management Practices on Selected Soil Chemical Properties
3.2.1. Soil pH, Organic Carbon, and Total Nitrogen
The analysis of variance showed that the soil pH was not significantly (P > 0.05) affected by land management practices (Table 2). The reason behind this could be endorsed by the similarity in weathering of parent materials and climate conditions. This finding was supported by, [25] who reported that no significant variation was found between area closure and open grazing land. However, the result was inconsistent with the finding of [20] who reported that significant variation in soil pH between area enclosure and free grazing land.)
There was no significant variation in soil Av. P among the slope positions (Table 2). The recorded results indicated that the mean value of Av. P increased down the slope from the upper slope (>15%) to the middle (10-15%) and lower (3-10%) slopes in both land management and the increase in soil pH at the foot slope position could be attributed to the accumulation of bases that were presumed to have been eroded from the upper and middle slope positions as is evident from the work of [26] who reported highest basic cations concentration at bottom slope position of 30 eroded sites. ANOVA showed that the lowest pH mean value (6.38) was recorded on the soil of the middle slope position, whereas the highest pH (6.5) was obtained on the foot slope position area (Table 2). However, this difference was statistically non-significant. The result is in line with [27] the soil pH was not significantly affected by the slope position.
As represented in (Table 2), soil organic Carbon and total nitrogen were significantly (P < 0.001) affected by land management practices in the study area. The highest mean value of organic carbon (2.13%) was obtained from area closure and the lowest mean value (1.64%) was observed from adjacent open grazing land. The variations could be due to organic matter accumulation through litter fall from the grass, trees, and shrubs in a closed area and higher biomass production capacity in the soil may cause a higher mean value of organic carbon observed under area closure. This result agreed with [28] who reported high OC at area closure than that of free grazing lands. On the other hand, [29] reported a reduction of OC as a result of lower biomass return in the OGL due to very little grass cover resulting from intensive grazing. The highest soil total nitrogen (0.29%) was observed under area closure, while the lower was observed under the adjacent open grazing land (0.09%) (Table 2). This could be due to the better availability of nitrogen-fixing trees such as Acacia abyssinica and Sesbania sesban, which serves as source of nitrogen through mineralization. This study is in line with [30]. Moreover, [31] confirmed that total nitrogen was significantly increased when the area has been closed for 20 years.
The recorded OC in the foot slope (3-10%) was (2.03%) compared to the upper slope position (1.78%), although it was at par with the middle slope position (1.85%). This result coincided with [32]who found a significant variation in SOC along different slope positions. This might be due to the washing away of organic materials from the upper slope positions and their subsequent settlement at the bottom slope part of the land. The analysis of variance revealed that TN content was significantly (P≤ 0.001) affected by slope position (Table 2). The higher TN content was recorded under the foot slope position (0.23%), which was, of course statistically at par when compared to the middle slope position. Significantly lowest value of TN was obtained in the upper slope position (0.13%) (Table 2). The possible reason for the higher mean value of TN under the foot slope position could be due to the increased accumulation of OM and reduced risk of soil erosion due to runoff, whereas the stated processes of soil erosion and accumulation of organic matter are reversed in the upslope area [33]. The present result was in line with [34] who revealed that TN increased as one traveled from a moderately steep to the sloping gradient.
Table 2.
Mean effects of land management practices on selected soil chemical properties.
| Variables | |||||||||
| Land management practices | pH (H2O) |
OC (%) | TN (%) | Av.P (ppm) |
CEC (meq/100g) | Ca+2 meq/100g) | Ma+2 meq/100g) | K+ meq/100g) | Na+ meq/100g) |
| Area closure | 6.43a | 2.13a | 0.29a | 6.3a | 48.8a | 26.0a | 9.7a | 0.38a | 0.035a |
| Open grazing land | 6.22b | 1.64b | 0.09b | 6.0b | 33.5b | 19.1b | 7.3b | 0.30b | 0.027b |
| LSD (0.05) | Ns | 0.16 | 0.04 | Ns | 1.44 | 3.12 | 1.43 | 0.039 | 0.004 |
| CV (%) | 4.30 | 8.28 | 19.96 | 13.03 | 3.40 | 13.48 | 16.39 | 11.38 | 12.33 |
| SEM (±) | 0.091 | 0.052 | 0.013 | 0.267 | 0.47 | 1.014 | 0.47 | 0.013 | 0.0013 |
| Slope positions | |||||||||
| Upper (>15%) | 6.10b | 1.78c | 0.13c | 5.0c | 36.3c | 20.1b | 7.48b | 0.31b | 0.028b |
| Middle (10-15%) | 6.38ab | 1.85ab | 0.2a | 6.1b | 41.7b | 20.2b | 8.46ab | 0.33ab | 0.031ab |
| Foot (3-10%) | 6.5a | 2.03ab | 0.23a | 7.3a | 45.5a | 27.4a | 9.60a | 0.37a | 0.034a |
| LSD (0.05) | Ns | 0.19 | 0.047 | 1.0046 | 1.76 | 3.83 | Ns | Ns | Ns |
| CV (%) | 4.30 | 8.28 | 19.96 | 13.03 | 3.40 | 13.48 | 16.39 | 11.38 | 12.33 |
| SEM (±) | 0.111 | 0.064 | 0.02 | 0.33 | 0.571 | 1.242 | 0.5696 | 0.016 | 0.00157 |
Note: pH =hydrogen ion concentration; OC = organic carbon; TN = total nitrogen; Av. P = available phosphors; CEC = cation exchange capacity; LSD = least significant difference and CV = coefficient of variation.
3.2.2. Available Phosphorous, Cation Exchange Capacity
The analysis of variance showed that the resulting of Av. P was not significantly (P > 0.05) affected by land management practice (Table 2). The results obtained from this study agree with that of [35] who reported a statistically insignificant difference between area closure and open grazing land. However, the result was inconsistent with the finding of [36] who reported available phosphorus to be varied statistically between area closure and open grazing land.
Av-P was significantly different (P ≤ 0.01) due to the main effect of slope position (Table 2). The current study clearly showed that the available phosphorus significantly increases as one goes from the upslope down to the foot slope position. Therefore, significantly higher Av-P was found under the foot slope position (7.3 ppm), whereas the lowest was recorded in the upper slope position (5.0 ppm) (Table 2). The current result coincides with the finding of [24] who conducted a study at the Gumara watershed, Lake Tana basin, Ethiopia, which reported the presence of significant differences in Av-P among the different slope gradient classes with the highest concentration of Av-P on gentler slopes. This might be due to the higher enrichment of soil organic matter and removal of soil by water from the upper and middle slope positions and deposition in the foot slope position [25].
The analysis of variance revealed that the cation exchange capacity was very highly significant (P ≤ 0.001) and affected due to land management practice (Table 2). The highest mean CEC value was found under area closure (48.8 meq/100g) while the lowest value (33.5 meq/100g) was found in adjacent open grazing land (Table 1). The highest CEC recorded under area closure could be related to the availability of high soil organic carbon and clay content. This finding agrees with [37] who reported that cation exchange capacity (CEC) was significantly higher in closed areas than what was obtained in the open grazing land. Most studies revealed that there is a direct relationship between organic matter, clay content, and CEC.
The variation of CEC was significantly different (P ≤ 0.001) affected in relationship to slope position. The results showed that the higher mean value (45.5 meq/100g) was recorded under the foot slope position, whereas the lowest mean values (41.7 meq/100g) and (36.3 meq/100g) were recorded under the middle and upper slope position, respectively (Table 2). The highest cation exchange capacity in the foot slope position is related to the availability of high concentrations of soil organic carbon and clay content. Therefore, this result was supported by [33] who reported that the value of CEC was significantly different among the slope positions. A similar result was reported by [38] who found a CEC value that had a significant difference among the slope position, where higher CEC was recorded in the gentle slope position.
3.2.3. Exchangeable Base (Ca+2, Mg+2, K+, and Na+)
The ANOVA result (Table 2) showed that exchangeable Ca+2 was significantly different at (P ≤ 0.001) due to the mean effect of land management practice (Table 2). The higher mean value of exchangeable calcium (Ca+2) was recorded under area closure (26.0 meq/100g) while the lower mean value was recorded under adjacent open grazing land (19.1meq/100g) (Table 2). This might be due to the higher accumulation of plant biomass on the closed land surface that increases the exchangeable calcium and organic carbon. The result was consistent with the finding of [39] which confirms that there was a significant variation of exchangeable calcium content in the enclosure site.
Exchangeable magnesium content was significantly affected at (P≤ 0.01) by land management practice (Table 2). The mean value of exchangeable magnesium (Mg+2) at the area closure (9.70 meq/100g) was significantly higher than what was observed in the adjacent open grazing land (7.33 meq/100g) (Table 1). The result was comparable to the finding of [40] who reported exchangeable magnesium content was significantly different in area closure compared to adjacent free grazing land. The analysis of variance for exchangeable potassium content revealed a significant difference at (P ≤ 0.01) due to the mean effect of land management practice (Table 2). The highest mean value of Ex. K+ was recorded at area closure (0.38 meq/100g) while the lowest mean value of Ex. K+ was found on adjacent open grazing land (0.30 meq/100g) (Table 1). The reason for the exchangeable potassium (Ex. K+) in the area closure to be higher was related to its pH value and better accumulation of organic matter and higher clay content of the soil. This result agrees with the work of [41] who reported that exchangeable potassium content decreases under heavy grazing land, compared with the closed land site in the tropical pasture.
The results obtained from the laboratory indicated that the mean value of Ex. K+ was not significantly affected (p > 0.05) by slope position. The mean value of Ex.K+ was recorded with both land management practices of similar slope position of upper (0.31meq/100g), middle (0.33meq/100g), and lower (0.37meq/100g) respectively (Table 2). The result correspondence with the finding of [21] who reported that there was no significant variation among slope gradients on exchangeable K+. A similar trend was reported by [34] who suggested that exchangeable K+ did not have significant variation among the slope gradients. The mean value of Ex. K+ relatively increases from the upper to foot slope position in the area closure, this could be due to the larger biomass of grass cover present on the lower parts so that less leaching of potassium and better soil conditions of soil for microorganisms to decompose organic nutrients to available nutrients plant growth.
The content of exchangeable Na+ was significantly affected (P ≤ 0.01) by the main effect of land management practice (Table 2). The higher mean value of Ex. Na+ was found at area closure (0.035 meq/100g), whereas the lower mean value (0.027 meq/100g) was recorded on adjacent open grazing land. This finding implies that Na+ was significantly influenced by the availability of basic cations. The previous finding has also considered that this factor exchangeable Na+ increased at the exclosure site compared to adjacent degraded land by [42]. The statistical analysis showed that exchangeable sodium (Ex. Na+) was not significantly affected at p > 0.05 by the mean effect of slope position (Table 2). This finding agrees with the finding [34] who reported that slope position differences had no significant effect on exchangeable Na+
4. Conclusion and Recommendation
In order to compare area closure and open grazing land in the Agamssa watershed, Hbaru District, North Wollo, Ethiopia, the study compared the impacts of land management, practise, and slope position on specific soil physico-chemical parameters. The results of this study showed that the land management of area closure had brought significant improvement of selected soil physicochemical properties such as soil texture, clay, sand, silt, bulk density, organic carbon, total nitrogen, cation exchange capacity, and exchangeable basic cations (Ca+2, Mg+2, K+, Na+) than in the adjacent open grazing land. The majority of the physical and chemical characteristics of the soil yielded results that revealed statistically significant variations in slope positions. Except for bulk density and sand content, the mean values were always highest at the foot slope position. This could occur as a result of the fertile topsoil from the upper portion of the ground washing down and settling at the foot of the land.
It is feasible to draw the conclusion that the establishment of area closures in degraded lands is a viable alternative for improving soil quality and conserving biodiversity based on the improved soil conditions of area closure land. Therefore, from a technical standpoint, open grazing areas in hilly lands ought to be converted to area closure before soil physical properties and soil nutrient contents are further depleted. Additionally, the management activities carried out in area closure should be strengthened in the future to increase soil fertility improvement. In conclusion, implementing area closure in the degraded area with plantation and soil and water conservation in the appropriate slope position improved the selected soil physico-chemical properties in the study area.
Author Contributions
All authors significantly contributed to the development of this manuscript. The Manscript was wrote, edited, and improved by A.A., T.M and E.F. Allover, authors have read and agreed to the published version of the manuscript.
Data Availability
Data are obtained upon request to the corresponding author.
Conflicts of Interest
The authors declare that they have no conflict of interest.
References
- Keesstra, S., Pereira, P., Novara, A., Brevik, E. C., Azorin- Molina, C., Parras-Alcántara, L., Jordán, A. and Cerdà, A. , "Effects of soil management techniques on soil water erosion in apricot orchards," Sci. Total Environ, pp. 55(1): 357-366, 2016. [CrossRef]
- FAO, "Methodological framework for land degradation assessment in dry-lands.," 2004.
- Demeke, A.B., "Factors influencing the adoption of soil conservation practices in," Northwestern Ethiopia, Discussion Papers Germany, 2003.
- Morgan, R. P. C., Soil Erosion and Conservation 3rd edition, Soil Resources: Blackwell publishing, Oxford, 2005.
- Azene Bekele, A participatory agro-forestry approach for soil and water conservation in Ethiopia., PhD Dissertation, Wageningen Agricultural University,: the Netherlands. 229p., 1997.
- Mitiku, H. and Kindeya, G., "Local initiatives for planning sustainable natural resources management in Tigray, northern Ethiopia," Ethiopian Journal of Natural Resources, pp. 3: 303-326, 2001.
- Tefera Mengstu, The role of enclosures in the recovery of woody vegetation in degraded dry land hillsides of central and northern Ethiopia, Sweden: M.Sc Thesis, SLU with WGCF in Ethiopia, 2001.
- Betru. N., Jawad. A. and Ingrid, N., "Exploring ecological and socio-economic issues for the for the improvement of area enclosure management," a case study from Ethiopia DCG Report, Addis Ababa, 2005.
- Emiru, B., Demel, T. and Barklund, P., "Actual and potential contribution of exclosures to enhance biodiversity of woody species in the dry lands of Eastern Tigray," Journal of the Dry lands, pp. 1(2): 134-147., 2006.
- Gert. N., Stephen. M., Mureithi. Deborah. N., Muricho and Madelene. O., "Enclosures as a land management tool for food security in African drylands," Journal of Land Use Science, pp. 1, 110–121, 2019. [CrossRef]
- Wondie.M., "Natural regeneration practice in degraded high lands of Ethiopia through area enclosure," International Journal of Environmental Protection Policy, pp. 3: 120-123, 2015. [CrossRef]
- Gee, G.W. and Bauder, J.W., Particle size analysis In: Klute, A. (Ed.), Methods of soil analysis, part 1: physical and mineralogical methods, America: merican Society of Agronomy Monograph, 1982.
- Black, C.A., Evans, D.D. and Dinauer, R.C. , Methods of soil analysis. Madison, WI, USA: American Society of Agronomy, 1965.
- Walkley, A. and Black, I. A., “An examination of the Degtjareff method for determining soil organic matter, and a proposed modification of the chromic acid titration method, Soil Science, vol. 37, no. 1, pp. 29–38, 1934., 1934.
- Bremner, J.M. and Mulvaney, C.S. , “Total nitrogen,” in Methods of Soil Analysis, A. L. Page, R. H. Miller, and D. R. Keeny, Eds., American Society of Agronomy and Soil Science Society of America, Madison, WI, USA, 1982.
- Olsen, S.R. and Sommers, L.E. , Phosphorus. In: Page, A.L., et al. (Eds.), Methods of Soil Analysis, Part 2: Chemical and Microbiological Properties, American Society of Agronomy Monograph, 9: 403–430., 1982.
- H. Chapman, Cation exchange capacity. In: Methods of Soil Analysis. Part 2 Chemical and Microbiological Properties, Norman, A.G., (Ed.). American Society of Agronomy, - Soil Science Society of America, WI, USA. pp. 891–901., 1965.
- G. Blake, Methods of soil analysis (Ed). American. Soil sciences. Agron Madison, Wisconsin, USA, (9): 374-39 9, 1965.
- D. Rowell, Soil science: methods and applications. Longman group UK Limited, 1994.
- Solomon and Tamrat, "Effects of area exclosure on soil properties and farmers’ awareness in Wera Sub-Watershed at Analemo Woreda, Southern Ethiopia," International Journal of Agricultural and Environmental Sciences, pp. 1-7, 2019.
- Endale. B, Feto. E, Alemayehu. M,, "Effects of Area Closure on Selected Soil Physico-Chemical Properties in Hidabu Abote District, North Shewa Zone, Oromia," Journal of Energy, Environmental & Chemical Engineering, p. 4:9, 2020. [CrossRef]
- Melaku Alene, Hailu Kendie, Tesfaye Feyisa, "Impact of Soil and Water Conservation Measures and Slope Position on Selected Soil Attributes at a Watershed Scale," Applied and Environmental Soil Science, p. 11, 2022. [CrossRef]
- Wolde. M, Edzo. V, Mitiku. H, Kindeya. G, Bart. M and Jan. N, "Effectiveness of exclosures to control soil erosion and local community perception on soil erosion in Tigray, Ethiopia," African Journal of Agricultural Research, p. 7:13, 2009.
- Mesfin, A. and Mohammed, A., "Effects of land cover changes and slope gradient on soil quality in the Gumara watershed, Lake Tana basin of North-West Ethiopia.," Modeling Earth Systems and Environment, pp. 6(1): 85-97, 2019. [CrossRef]
- Fantaw, Y., Getachew, A. and Abdu, A., "Soil property variations in relation to exclosure and open grazing land use types in the Central Rift Valley area of Ethiopia.," Environmental Systems Research, p. 4(1). 17., 2015. [CrossRef]
- Farmanullah Khan, Zahir Shah, Waqar Ahmad and Muhammad Ramzan, "Effect of slope position on physico-chemical properties of eroded soil," Soil Environ, pp. 32(1): 22-28, 2013.
- Fikrey, T., Kibebew, K., Aster, G. and Kiros, M. , "Changes in selected soil properties across a chronosequence of exclosures in the central dry lowlands of Ethiopioa.," EurasianJournals of soil sciences, pp. (2) 173-185., 2020. [CrossRef]
- Minal, T. and Anil, V., "Mycorrhizae at polluted site of western rajasthan.," International Journal of Plant, Animal and Environmental Sciences, p. 2(4): 325–487., 2012.
- Mekuria W, Veldkamp E, Mitiku H, Nyssem J, Muys B, Kindeya G., "Effectiveness of exclosures to restore degraded soils as a result of overgrazing in Tigray, Ethiopia," Journal of Arid Environments, pp. 69: 270-284, 2007. [CrossRef]
- Descheemaeker, K., Nyssen, J., Poesen, J., Raes, D., Haile, M., Muys, B. and Deckers, S.,, "Runoff on slopes with restoring vegetation: a case study from the Tigray highlands, Ethiopia.," Journal of hydrology, pp. 331(1-2), 2006. [CrossRef]
- Mengistu, T., Teketay, Demel, Hulten, H., and Yemishaw, Y. , "The role of enclosures in the recovery of woody vegetation in degraded dry land hillsides of Central and Northern Ethiopia.," Journal of Arid Environment,, pp. 60: 259- 281, 2005. [CrossRef]
- Mulat Guadie,Eyayu Molla, Mulatie Mekonnen and Artemi Cerda, "effect of soil bund and stone-faced soil bund on soil physicochmical properties and crop yield under rain-fed conditions of Northwest Ethiopia," MDPI land , p. 15, 2020. [CrossRef]
- Awdenegest, M. and Nicholas, H.M., "Soil fertility in relation to slope position and agricultural land use: A case study of Umbulo catchment in southern Ethiopia.," Environmental management, pp. 42(5): 753-763., 2008. [CrossRef]
- Mulugeta, "Effect of Slope Gradient on Selected Soil Physicochemical Properties of Dawja Watershed in Enebse Sar Midir District, Amhara National Regional State.," American Journal of Scientific and Industrial Research, pp. 6(4): 74-81, 2015. [CrossRef]
- T. Endale, "Dynamics of soil physico-chemical properties in area closure at Hirna Watershed of West Hararghe Zone of oromia Region, Ethiopia.," International Journal of Soil Science,, pp. 11:1-8., 2016. [CrossRef]
- Temesgen, A., Debela, H. and Endalkachew, K., "Area exclosure as a strategy to restore soil fertility status in degraded land in Southern Ethiopia.," International Journal of Biological and Chemical Research, pp. 31(1): 482-494., 2014.
- Mekuria W, Veldkamp E, Mitiku H, Nyssem J, Muys B, Kindeya G. , "Effectiveness of exclosures to restore degraded soils as a result of overgrazing in Tigray, Ethiopia.," Journal of Arid Environments,, pp. 69: 270-284, 2007. [CrossRef]
- Husen, D., Esimo, F. and Getechew, F., " Effects of soil bund on soil physical and chemical properties in Arsi Negelle woreda, Central Ethiopia.," African Journal of Environmental Science and Technology, pp. 11(10): 509-516, 2017. [CrossRef]
- Bot, A. and Benites, J., "The importance of soil organic matter: key to drought-resistant soil and sustainable food production.," European Journal of soil sciences,, pp. (80): 5-48., 2005.
- Fikrey, T., Kibebew, K., Aster, G. and Kiros, M. , "Changes in selected soil properties across a chronosequence of exclosures in the central dry lowlands of Ethiopioa.," Eurasian Journals of soil sciences,, pp. (2) 173-185, 2020.
- Emiru, B., Demel, T. and Barklund, P., "Actual and potential contribution of exclosures to enhance biodiversity of woody species in the dry lands of Eastern Tigray.," Journal of the Dry lands,, vol. 1, no. 2, pp. 134-147, 2006.
- Temesgen, A., Debela, H. and Endalkachew, K., "Area exclosure as a strategy to restore soil fertility status in degraded land in Southern Ethiopia.," International Journal of Biological and Chemical Research, vol. 31, no. 1, pp. 482-494., 2014.
- H. Cuenca, Irrigation system designs an engineering approach, Prentice-Hall Inc: Englewood Cliffs, 1989.
Figure 1.
Map of the study area.
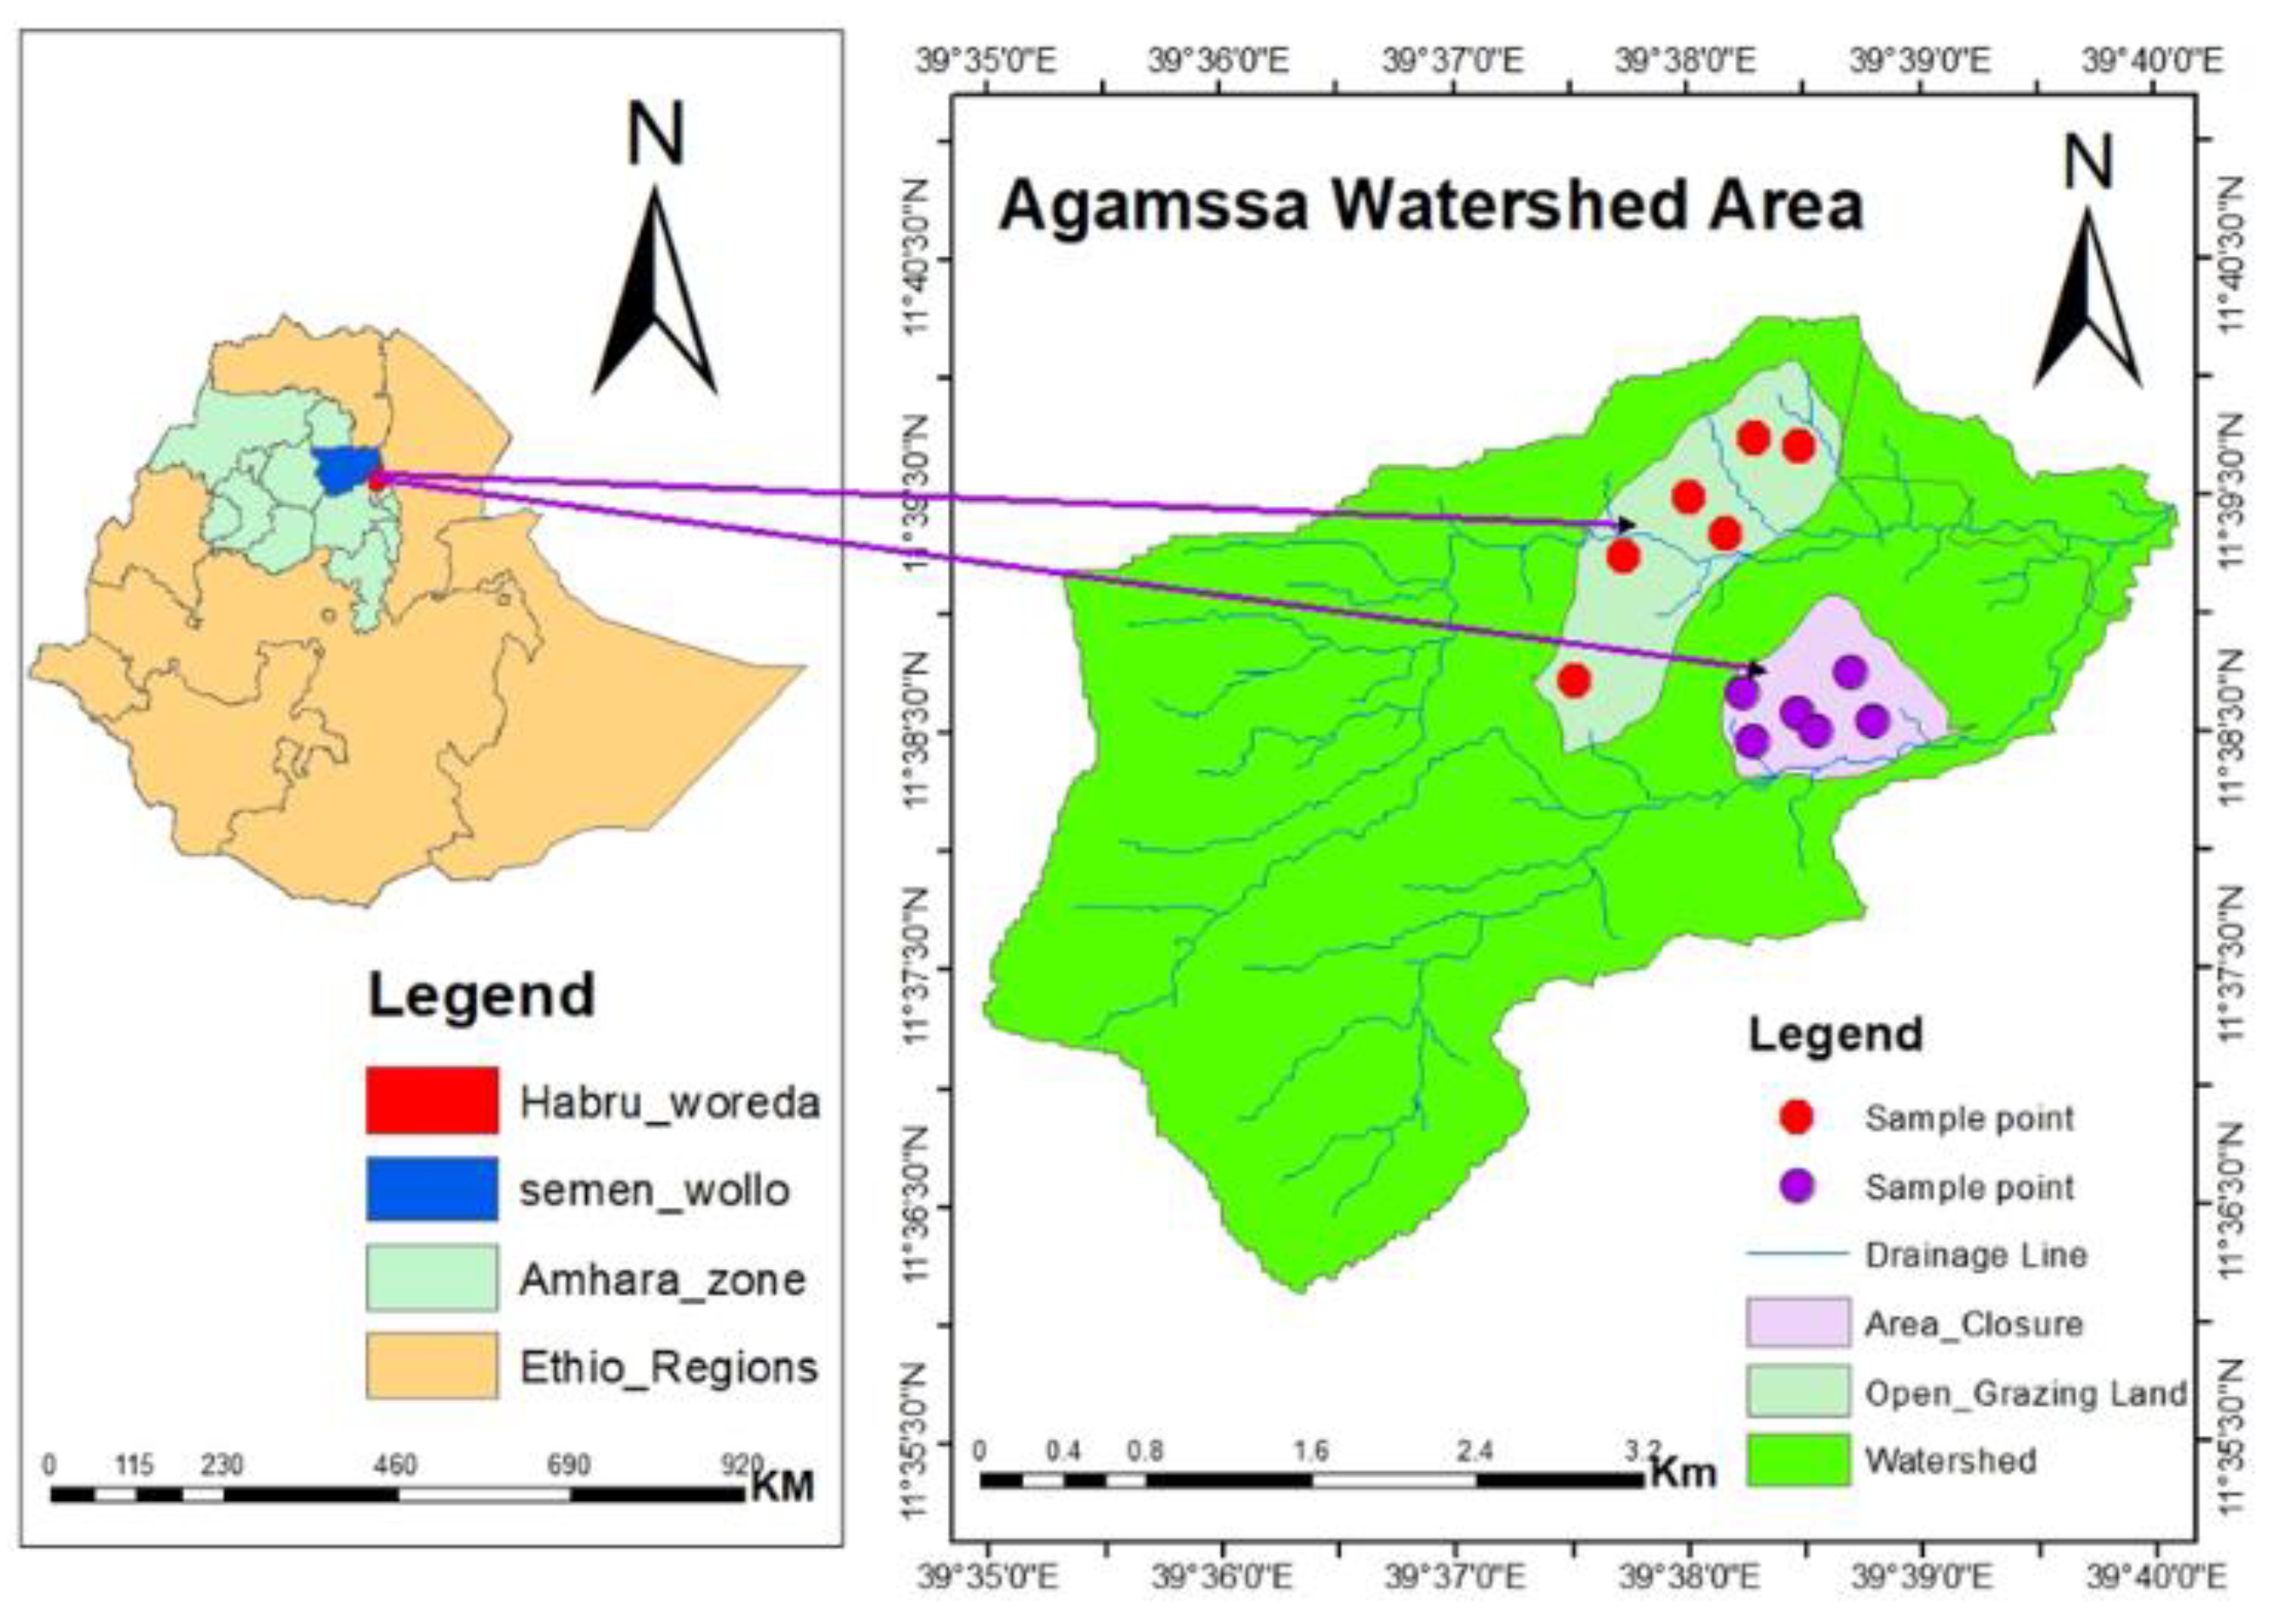
Figure 2.
Maximum and minimum temperatures and mean monthly rainfall of the study area (1990 – 2020) .
Figure 2.
Maximum and minimum temperatures and mean monthly rainfall of the study area (1990 – 2020) .
Disclaimer/Publisher’s Note: The statements, opinions and data contained in all publications are solely those of the individual author(s) and contributor(s) and not of MDPI and/or the editor(s). MDPI and/or the editor(s) disclaim responsibility for any injury to people or property resulting from any ideas, methods, instructions or products referred to in the content. |
© 2023 by the authors. Licensee MDPI, Basel, Switzerland. This article is an open access article distributed under the terms and conditions of the Creative Commons Attribution (CC BY) license (http://creativecommons.org/licenses/by/4.0/).
Copyright: This open access article is published under a Creative Commons CC BY 4.0 license, which permit the free download, distribution, and reuse, provided that the author and preprint are cited in any reuse.


