Submitted:
06 May 2025
Posted:
08 May 2025
You are already at the latest version
Abstract
Classical molecular dynamics simulation of cation diffusion in isolated crystals (UxPuyTh1xy)O2 bounded by a free surface was performed. It was shown that in the bulk of the same model crystallite the diffusion coefficients of cations of all types were practically identical. At the same time, the cation diffusion coefficients changed with the melting temperature of nanocrystals, which increased with increasing thorium content. At a given temperature, the diffusion coefficients were the higher, the lower were the melting points of the (UxPuyTh1xy)O2 crystallites. The temperature dependences of the diffusion coefficients in crystallites of different compositions converged when using coordinates normalized to the melting points.
Keywords:
uranium dioxide
; plutonium dioxide
; thorium dioxide
; molecular dynamics
; diffusion
; lattice disordering
1. Introduction
The most widely used fuel for nuclear reactors at present is uranium dioxide UO2 enriched in the fissile isotope U-235. Unfortunately, the available reserves of uranium are limited, which forces us to consider alternative fuels. The use of mixed MOX fuel (U,Pu)O2 containing the fissile isotope Pu-239 is considered promising [1,2]. In the future, it is possible to use both uranium and plutonium in combination with thorium, since thorium-232 is the raw isotope for the production of uranium-233 [3]. In the future, uranium, plutonium and thorium dioxides are of interest as fuel for high-temperature gas-cooled reactors, fast reactors with lead, sodium and helium coolants, and even space power reactors [3,4,5,6].
The main reason for the possible degradation of fuel characteristics under the influence of neutron irradiation are radiation-stimulated phenomena, including the destruction of the crystal lattice by ballistic collision cascades, the accumulation of radiogenic gases and other nuclear decay products, changes in the stoichiometry, structure and grain size of the fuel crystals [7,8,9,10,11,12,13,14,15]. Oxygen diffusion in oxide fuel is a relatively fast process. However, oxygen migration is not sufficient for mass transfer. The rates of processes associated with transport of mass (grain growth, sintering, creep, plastic deformation, recrystallization) are determined by the much slower diffusion of uranium, plutonium and thorium cations [13,14].
In mixed uranium-plutonium and uranium-plutonium-thorium fuel, in the presence of temperature gradients or radiation damage, the difference in the diffusion coefficients of uranium, plutonium and thorium cations may act as a mechanism for the spatial separation of these elements, creating undesirable heterogeneity of composition. Thus, a comparison of the diffusion coefficients of different types of cations in the mixed oxides (U,Pu,Th)O2 is of interest.
Obtaining experimental data to characterize the disordering of irradiated nuclear fuel is difficult due to the complexity of the defect structure and extreme conditions of the reactor core. Thus, there are a large number of works devoted to computational modeling of defect formation in UO2, PuO2 and ThO2 [10,12,16,17,18,19,20,21,22,23,24,25,26,27]. The studied features include thermo physical, mechanical and electrical properties [15,16,17], the electron subsystem [19,20,21,22], disordering mechanisms, collision cascades and thermal spikes [28,29,30,31,32,33], phase transitions [3,34,35], crack propagation [18], non-stoichiometry effects [36]. The research methods were first-principles calculations, as well as static and dynamic modeling using both empirical and a priori interaction potentials [10,22,23,24,37,38,39].
Until recently, molecular dynamics (MD) modeling of the diffusion of intrinsic ions in (U,Pu,Th)O2 crystals was limited to the anion sublattice or highly disordered systems due to the low mobility of cations. Cation migration was studied near the surface, cavities, grain boundaries, or in the presence of artificially created defects [40,41,42]. In [43], MD modeling of uranium diffusion in a defect-free bulk of UO2 nanocrystals with a free surface serving as a source of cation vacancies was performed. A recent study [44] applied a similar approach to studying the diffusion of thorium cations in the bulk of ThO2 nanocrystals. In the present work, the technique of [44] is used to model cation diffusion in mixed oxides (Ux,Puy,Th1-x-y)O2.
2. Modeling Methodology
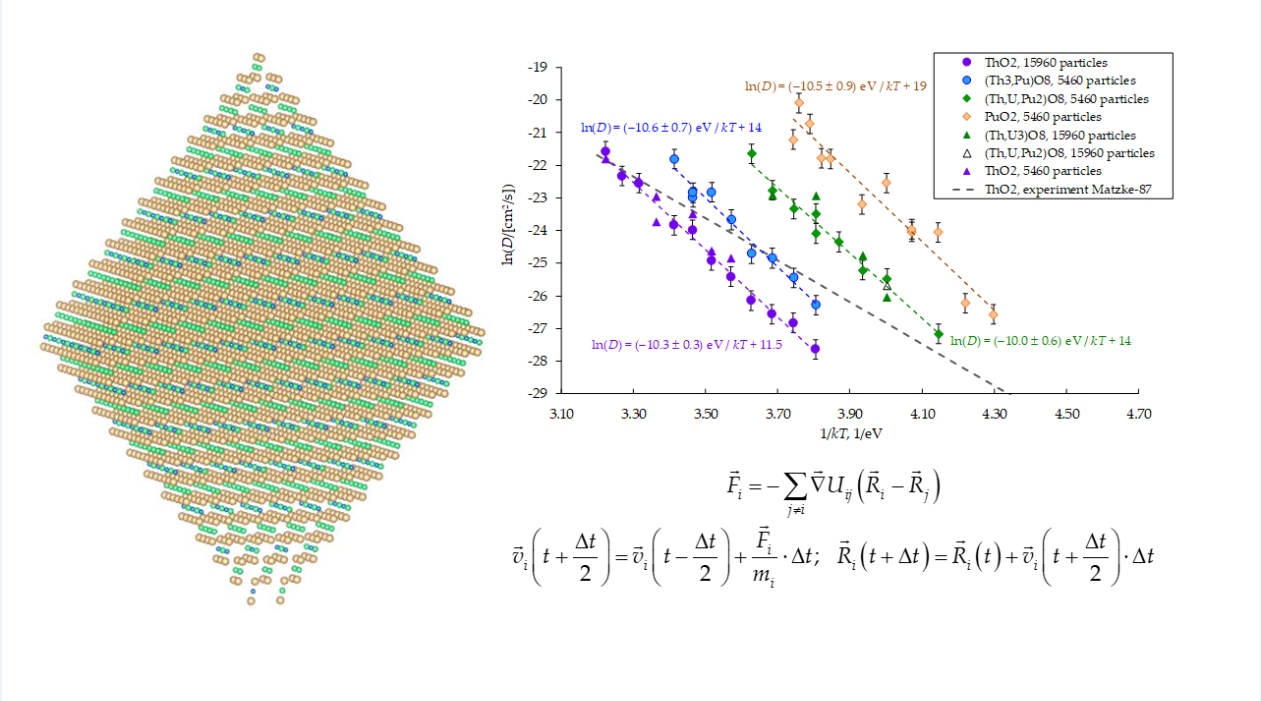
In the present work, the model systems for studying the diffusion of intrinsic cations of thorium, plutonium, and uranium were isolated nanocrystals of ThO2, PuO2 and crystallites of mixed compositions (U0.25Pu0.5Th0.25)O2, (Pu0.25Th0.75)O2 (Figure 1). The nanocrystals contained from 5460 to 43848 particles. At the beginning of the computational experiments, the model crystallites had the shape of regular octahedrons, the faces of which were formed by crystallographic planes of the (111) type (Figure 1a). During the simulation, the crystallites evolved into a more optimal shape of octahedrons with truncated vertices (Figure 1b).
The interaction of particles was described by a set of pair potentials MOX-07 [10], which was supplemented by a compatible thorium-oxygen potential proposed later in [46]. The use of pair interaction potentials somewhat reduces the accuracy of the modeling compared to the multiparticle potentials Cooper-2014 (CRG, [47]), increasing the simulation performance, which was critical for the present work. In [30], it was shown that the MOX-07 and CRG potentials give close energies of intrinsic disordering of UO2 and PuO2 crystals. In addition, the MOX-07 and [46] potentials made it possible to quantitatively reproduce the superionic transition temperatures in UO2 [12] and ThO2 [44] crystals.
Potentials MOX-07 account for the Coulomb interaction of effective charges of the particles, the valence repulsion of overlapping electron shells, and the dispersion attraction in the form Equation (1). The parameters of these potentials are given in [10].
Uij(Rij) = KE⋅qiqj / Rij + Aij⋅exp(−Bij) − Cij/Rij6.
The presence of a free surface ensured the natural influx of cation vacancies into the crystal bulk, which provided equilibrium concentration of the thermal Schottky defects as implementation of the vacancy mechanism of cation diffusion.
As the temperature decreased, the rate of generation of the thermal vacancies became too low for direct molecular dynamics simulation, so the temperatures in the present work were limited to the superionic state of the crystals that is close to melting.
The objective of this work was to calculate the diffusion coefficient of cations within the volume of the model nanocrystals. Near the surface, the diffusion coefficients are increased compared to the bulk. To exclude the surface effect, the diffusion of cations in this work was studied inside a central spherical region, the boundary of which was located at a distance of 1.75⋅a (a denotes the lattice constant) from the nearest surface (Figure 2).
During the computational experiments, the mean squares of the displacements were calculated, which were averaged over 20 computational experiments at each temperature. The linear sections of the dependences <a2(t)> on time t were used to calculate the diffusion coefficient D using the formula
<a2(t)> = 6Dt.
The diffusion of cations was studied in the course of computational experiments lasting up to 450 ns with a step of integration of the equations of motion of ∆t = 3∙10–15 s. The equations of motion were integrated using the “leapfrog” method in a form mathematically equivalent to the Verlet integration [48].
Accumulation of computational error could lead to the emergence of translational motion of the crystallite, as well as to rotation around the mass center. Such motion would create an artificial increase in the mean square of the particle displacement, which would overestimate the diffusion coefficients calculated from Equation (2). In order to exclude non-diffusion movement of cations, the mass center of the model systems was fixed at the origin of coordinates. At each step of the MD simulation, the solid-state rotation of the crystal was compensated. Despite this, at simulation times of hundreds of nanoseconds, a significant rotation of the cation sublattice accumulated. This rotation was excluded when processing the simulation results using a special original procedure. An example of the dependences <a2(t)> obtained before and after the rotation compensation is shown in Figure 3.
During a computational experiment, the temperatures were kept constant using the Berendsen thermostat [49]. This thermostat was chosen for its computational efficiency and because it had the lowest temperature fluctuation amplitude in our calculations. However, it is not ergodic.
The Berendsen thermostat adjusts the temperature T so that deviations ΔT from the required value T0 decrease with time t according to the exponential law ΔT ~ exp(-t/τ), where τ is the thermostat parameter. With increasing parameter τ, the particle energy distribution approaches ergodicity. In [50], it was demonstrated that for τ > 200⋅∆t, where ∆t is the integration time step in molecular dynamics simulations, the Berendsen thermostat achieves a quality comparable to that of the Nosé-Hoover thermostat [51,52]. In the present work, τ = 3000⋅∆t = 9 ps.
To verify the use of the Berendsen thermostat, we obtained cation diffusion coefficients in the (Pu0.25Th0.75)O2 crystal of 5460 particles while stabilizing temperature using the stochastic velocity rescaling method (SVR, [50]), which ensures ergodic thermostating. The temperature regulation intensity of the stochastic velocity rescaling method follows the same exponential law, ΔT ~ exp(-t/τ), as in the case of the Berendsen thermostat. We maintained the value of τ at 3000⋅∆t = 9 ps for the stochastic velocity rescaling.
Figure 4 presents the averaged mean square displacements of thorium cations and oxygen ions over 20 computational experiments at a temperature of T = 3350 K. The difference in the slopes of the two lines falls within the margin of error observed in this work.
We note that the diffusion coefficients of different cation types within the same crystallite showed nearly identical values in our simulations. Figure 5 presents the temperature dependence of the combined diffusion coefficient for thorium and plutonium cations in (Pu0.25Th0.75)O2 crystals, calculated using both Berendsen and stochastic velocity rescaling thermostats.
As evident from the plots in Figure 5, the linear fits approximating these dependencies in ln(D) = f(1/kT) coordinates are virtually identical. Therefore, we conclude that the use of the Berendsen thermostat for subsequent calculations in this work is well justified.
The cation diffusion coefficients in this work depended on the melting temperature of the model crystallites, which was determined by their composition. Moreover, to properly compare diffusion coefficients, it was necessary to consider the melting temperatures (T∞) of infinite-size systems. The T∞ values were estimated by extrapolating the Tmelt(N−1/3) dependence to N−1/3 = 0, where N represents the number of particles in the nanocrystal.
The Tmelt(N−1/3) values were determined as the temperatures at which melting of the model crystallites initiated within 3 ns after the start of computational experiments in 90% of cases. As demonstrated for UO2 in our previous work [53], this approach enables accurate determination of melting temperatures in macroscopic crystals. The Tmelt(N−1/3) relationships in this work showed nonlinear behavior, similar to Ref. [53], though they became linear at large system sizes (Figure 6).
The Tmelt(N−1/3) dependencies in our study exhibited nonlinear behavior, consistent with the results reported in [53]. However, in the large-size limit (R→∞), the relationships converged to the linear asymptotic form
where T∞ represents the bulk melting temperature and R is the characteristic crystal size, scaling as N1/3. The size parameters R0 and N0 correspond to a nanocrystal that would melt at zero temperature. We note that analytical models describing nanocrystal melting (see, e.g., Ref. [54]) yield dependencies of the form given by Equation (3) in the large-size limit.
Tmelt(R) = T∞⋅(1−R0/R) = T∞⋅(1−(N0/N)1/3),
In order to estimate the T∞ values, we extrapolated the Tmelt(N−1/3) dependences to the N−1/3 → 0 limit. This was achieved by applying Equation (3) to the three highest Tmelt data points corresponding to the largest crystal sizes in our study (systems comprising 15960, 27600, and 43848 particles), as illustrated in Figure 6.
The temperature ranges investigated in this work for each crystallite composition extended from T ≈ 0.8⋅T∞ up to the melting points of the model crystallites. These ranges corresponded to the superionic state of these systems. Lower temperatures were inaccessible for direct simulation due to low cation mobility.
3. Results and Discussion
3.1. Cation Diffusion Coefficients
In all the computational experiments, the diffusion coefficients of cations of all types (uranium, plutonium, thorium) practically coincided when these ions were part of the same crystallite. This result corresponds to the experimental data described in [14]. According to these data, the temperature dependences of the diffusion coefficients of uranium, plutonium and thorium ions in the ThO2 matrix coincided. In the context of our work, this coincidence can be explained by the fact that the diffusion movement of cations consisted of their collective movement along the chain towards the vacancies entering the crystal volume from the surface. On the other hand, the diffusion coefficients of cations depended on the composition of (UxPuyTh1−x−y)O2. This change correlated with the melting temperature, which increased with the thorium content. At a given temperature, the model nanocrystals with a lower melting point were characterized by higher cation diffusion coefficients (Figure 7).
The correlation between melting temperature and cation diffusion coefficients in structural analogs of (U,Pu,Th)O₂ crystals is well established. As demonstrated in [14], plotting these coefficients against reduced temperature (T/T∞, with T∞ being the macroscopic melting point) reveals nearly identical curves for UO₂ and CaF₂ crystals.
In the present work, the existence of the discussed relationship was verified for mixed oxides (UxPuyTh1−x−y)O2. It is evident from Figure 7 that the size of the model crystallites did not exert a clear effect on the diffusion coefficients of cations. Therefore, to obtain the reduced temperatures T/T∞, we used the T∞ values calculated by extrapolating the dependence Tmelt on model crystallite size N to an infinite size, as described in the Modeling Methodology section.
The obtained values T∞ of the melting point of the (UxPuyTh1−x−y)O2 crystallites are given in Table 1. For comparison, the experimental melting points of pure thorium and plutonium dioxides are also shown. It is evident that the model melting temperatures in the present work are overestimated in comparison with the experiment. However, the tendency for the melting temperature to increase upon transition from pure ThO2 to pure PuO2 is reproduced correctly.
The T∞ values from Table 1 are used to build the dependences of the diffusion coefficients on temperature in the ln(D(T∞/T)) coordinates that are shown in Figure 8. It is evident that this choice of coordinates brings all the ln(D) values to one region near a line, which is located close to the linear extrapolations of low-temperature experimental data known for uranium and thorium dioxides [14]. The experimental Arrhenius plots ln(D) vs (T∞/T) for UO2 and ThO2 demonstrate near-identical behavior. It can be concluded that the differences in the diffusion coefficients of cations in (UxPuyTh1−x−y)O2 crystals are indeed associated with melting temperatures.
The melting of nanocrystals in the present study began with the formation of a surface melt, which subsequently propagated into the bulk. In the previous work [53] it was shown that at temperatures close to melting, a molten layer was formed on the surface of model UO2 crystals, the proportion of molecules in which increased as melting approached. A surface disordered in this way can serve as a source of vacancies diffusing into the bulk of the crystal. Accordingly, the relationship between the bulk diffusion coefficients and melting temperatures obtained in the present work can be a consequence of the existence of the surface melt.
To investigate the potential relationship between cation diffusion coefficients and crystal characteristics influencing the melting process, we calculated the enthalpy of fusion L and the average surface energy γ for (UxPuyTh1−x−y)O2 crystallites consisting of 43848 particles. The obtained values are listed in Table 2. For each composition, these values correspond to temperatures reduced by approximately 100 K relative to T∞.
Within the framework of our modeling, there was a decrease in the heat of fusion L upon the transition from PuO2 to ThO2, and the surface energy γ decreased in sequence ThO2 → (Th0.75Pu0.25)O2 → (Th0.25U0.25Pu0.5)O2, as shown in Table 2. The calculated heat of fusion of PuO2 was close to the experimental values known for plutonium dioxide (66.5 ± 5.4 kJ/mol [57]) and uranium dioxide (70 ± 4 kJ/mol [58]). The correlation between these trends and the changing cation diffusivity will be the subject of future investigations.
3.2. Activation Energies of Cation Diffusion
The mechanism of cation diffusion in this work was their movement towards cation vacancies that migrated from the surface through the bulk of the model crystallites. The obtained effective activation energies for cation diffusion in crystals of different compositions (Figure 7) coincided within the error margin determined by the root-mean-square displacement fluctuations observed in the simulations. The values of these energies (ED) were in the range from (10.0 ± 0.6) eV to (10.6 ± 0.7) eV. These values are significantly overestimated compared to low-temperature experimental recommendations for thorium and uranium dioxides (6.5 and 5.6 eV, respectively [14]).
The energies obtained can be interpreted using the well-known thermodynamic theory of Lydiard and Matzke [14,59]. Below, we designate cation vacancies as V4−, and anion vacancies as V2+. In the ideal solution limit, the concentration of neutral vacancy complexes V4−⋅2V2+ relative to cation sublattice sites follows the relation
where E(V4−⋅2V2+) represents the formation energy of the complex, and [V4−⋅2V2+]0 denotes a temperature-independent pre-exponential factor. Molecular dynamics simulations should yield an effective formation energy matching E(V4−⋅2V2+).
[V4−⋅2V2+] = [V4−⋅2V2+]0⋅exp{−E(V4−⋅2V2+)/kT},
The normalized concentrations of single cation and anion vacancies are related as
[V4−] = const⋅[V2+]−2⋅exp{−ESh/kT}.
Here, ESh denotes the formation energy of a classical Schottky defect, which is a non-interacting pair of cation vacancy and two anion vacancies. In the superionic state, the anion vacancy concentration becomes temperature-independent as the anion sublattice attains maximal configurational entropy, reaching the limit of possible disorder. Consequently, the effective formation energy of isolated vacancies equals ESh. On the other hand, at temperatures below the superionic transition
where EAF is the energy of anti-Frenkel disordering of the anion sublattice. Thus, at low temperatures, which correspond to the experimental data, the effective energy of formation of single cation vacancies is reduced compared to ESh to the value
[V2+]2 = [V2+]02⋅exp{−EAF/kT},
E(V4−) = ESh − EAF.
Furthermore, we consider the possible formation of an electrically neutral combination of defects V4−⋅V2+ + V2+, consisting of a charged vacancy cluster V4−⋅V2+ paired with a distant compensating anion vacancy (V2+). In the superionic phase, the formation energy of this complex, E(V4−⋅V2+ + V2+), equals the sum of E(V4−⋅2V2+) and the work needed to separate one anion vacancy to infinity. In the normal crystalline state, the effective energy of formation of the complex V4−⋅V2+ + V2+ decreases to the value
Eeff(V4−⋅V2+ + V2+) = E(V4−⋅V2+ + V2+) − EAF/2.
The coefficient of vacancy diffusion of cations is proportional to the concentration of cation vacancies [V4−] or clusters [V4−⋅2V2+], [V4−⋅V2+] involved in the migration process. Thus, the effective activation energy of diffusion is the sum of the formation energy of the indicated defects and the height of the potential barrier EM separating the equilibrium positions of the cation.
Table 3 presents the values of the intrinsic disorder energies of UO2, PuO2, and ThO2 crystals calculated by static methods. Results from prior studies employing the MOX-07 potentials [10] (identical to those used herein) are labeled as “MOX-07”. The values calculated using the Cooper-2014 potentials proposed by M.W.D. Cooper, M.J.D. Rushton, and R.W. Grimes [47] are designated with the abbreviation CRG. The energies calculated with the MOX-07 and CRG potentials are close to each other, being overestimated relative to the experimental values characterizing the cation sublattice.
The overestimation of the cation sublattice disordering energies is characteristic of the known classical interaction potentials for UO2. The energies of Schottky trio formation calculated using such potentials are in the range from 7.7 to 14.7 eV [43], while the experimental data are in the range from 6 to 7 eV [14]. This systematic difference indicates changes in the electronic state of cations that are not taken into account by classical potentials. For comparison, Table 3 also shows the values of disordering energies obtained by first-principles calculations within the framework of the density functional theory (DFT) with the local density approximation (LDA) or the generalized gradient approximation (GGA) [59,60,61,62,63,64,65,66,67,68,69,70,71,72,73,74,75,76,77,78,81]. Experimental values are marked with the abbreviation “exp“.
It is known that the Hubbard-U correction can be used to correctly calculate the band gap in crystals with valence f-electrons (UO2, PuO2). In [60,66], the use of DFT+U led to an increase in the calculated disordering energies of UO2 compared to the LDA and GGA approximations without the Hubbard correction. The authors of [66] used the occupation matrix control to avoid obtaining metastable states. On the other hand, in [59] the use of a similar matrix-controlled technique in LDA+U and GGA+U calculations yielded relatively low values of the energies of anti-Frenkel disordering (3.3 eV) and the formation of a classical Schottky defect (6.0 eV).
The analysis of the literature data did not allow us to reveal a systematic difference in the disordering energies of (U,Pu,Th)O2 crystals corresponding to different DFT approximations. However, there is a group of results in which the formation energies of identical defects in UO2, PuO2 and ThO2 are close to each other. We believe that the similarity of the disordering energies of all three oxides is in agreement with the empirical data, since these oxides behave similarly in diffusion experiments [14].
As previously discussed, the temperature-dependent diffusion coefficients of oxygen and cations in UO₂, PuO₂, and ThO₂ crystals exhibit converging behavior when plotted in ln(D) versus T∞/T coordinates. Exact coincidence of these curves would imply the following relationship between effective activation energies:
ED/kT∞(ThO2) = ED/kT∞(UO2) = ED/kT∞(PuO2).
Using the experimentally established melting temperatures of 3120 K for UO₂ [75] and 3665 K for ThO₂ [55], along with the recommended uranium migration energy of 5.6 eV from [14], Equation (9) predicts a thorium migration energy in ThO₂ of 6.6 eV:
ED(ThO2) = T∞(ThO2)/T∞(UO2)⋅ED(UO2) = 6.6 eV.
This prediction is in quantitative agreement with the experimental value of 6.5 eV from the review [14].
Relation (9) may provide reasonable approximation for the intrinsic disorder energies. If valid, the values of EAF and ESh should increase along the series PuO₂ → UO₂ → ThO₂, exhibiting a 20 % change from PuO₂ to ThO₂. Our static calculations satisfy this predicted trend.
Regarding the V4−⋅2V2+ cluster, we limited ourselves to considering the linear configuration <111>, which is a V2+−V4−−V2+ chain oriented along the [111] direction; the formation energies of other variations of this cluster are close to E(V4−⋅2V2+)111 [30,64,72].
The cation migration energies EM calculated both in the present and in other works are overestimated compared to the experimental recommendations (Table 3). There are calculations indicating a significant decrease in the migration energy of cation vacancies in the case of their movement as part of vacancy clusters. For example, in the work [65] the migration energy of a cation vacancy in uranium dioxide as part of the V4−⋅2V2+ cluster decreased compared to the migration energy of a single vacancy from 3.09 eV to 2.19 eV. On the other hand, the migration energy of thorium cations in ThO2 (4.47 eV) considered by the authors of [65] in a similar manner, did not change.
In the present work, the lattice statics method was used to calculate the migration energies of a cation through a vacancy complex (V4−⋅2V2+)111 in thorium and plutonium dioxides. The obtained values of EM(V4−⋅2V2+) for ThO₂ and PuO₂ were 4.4 eV and 5.5 eV, respectively. These energies closely match the migration energies of single cation vacancies (4.5 eV for PuO₂ and 5.45 eV for ThO₂), which were also computed in the present work using the lattice statics approach.
According to Equations (5-8) and the calculation data for MOX-07 potentials from Table 3, the results of dynamic modeling obtained in this work can only correspond to the diffusion of cations via the bound cluster V4−⋅2V2+ with effective activation energies
ED,Static(ThO2) = E(V4−⋅2V2+)111 + EM(V4−⋅2V2+) = 6.9 + 5.5 = 12.4 eV,
ED,Static(PuO2) = E(V4−⋅2V2+)111 + EM(V4−⋅2V2+) = 5.0 + 4.4 = 9.4 eV.
The static calculation of the diffusion activation energy obtained for PuO₂ agrees well with molecular dynamics results. However, for thorium dioxide, the static prediction ED,Static(ThO2) = 12.4 eV significantly overestimates the dynamic activation energy ED = 10.3 ± 0.3 eV (Figure 7). The discrepancy may originate from the collective cation motion involving temporary displacements of certain cations into interstitial sites. This complex cation diffusion mechanism in ThO₂ was previously identified in [44].
As temperature decreases, the superionic state of (U,Pu,Th)O₂ crystals transitions to a conventional crystalline phase containing either charged impurity-vacancy complexes V4−⋅V2+ or neutral clusters V4−⋅2V2+, as well as single cation vacancies. Notably, the effective diffusion activation energies derived from Table 3 data show no reduction in these cases, maintaining values comparable to those in the superionic regime. Assuming approximately equal migration energies for cations through both charged and neutral vacancy clusters, we obtain
ED,Static(V4−⋅V2+ in ThO2) = E(V4−⋅V2+ + V2+) + EM(V4−⋅2V2+) − − EAF/2 = 9.7 + 5.5 − 4.5/2= 12.9 eV;
ED,Static(V4−⋅V2+ in PuO2) = E(V4−⋅V2+ + V2+) + EM(V4−⋅2V2+) − − EAF/2 = 7.0 + 4.4 − 4.5/2 = 9.45 eV;
ED,Static(single V4− in ThO2) = ESh − EAF + EM = 12.7 + 5.45 − 4.5 = 13.7 eV;
ED,Static(single V4− in PuO2) = ESh − EAF + EM = 9.5 + 4.4 − 3.9 = 10.0 eV.
The static calculations presented above demonstrate that the superionic-to-normal crystalline phase transition is unlikely to reconcile the effective diffusion activation energies obtained from molecular dynamics simulations with low-temperature experimental data [14]. To improve agreement, it would be necessary to reduce both the calculated Schottky disorder energies and the cation vacancy migration energies.
4. Conclusions
According to the modeling performed in the present work, the diffusion coefficients of cations of all types in the bulk of the same (UxPuyTh1-x-y)O2 crystal should be very close. This result is consistent with the experimental data from [14] and can be explained by the vacancy migration mechanism, in which a group of different cations moves along a chain towards one vacancy (or vacancy cluster). At the same time, the diffusion coefficients in the present work changed with the melting temperature of the nanocrystals, which rose with increasing thorium content.
The cation diffusion coefficients exhibited an inverse correlation with the melting points of (UxPuyTh1-x-y)O2 crystallites at constant temperature. When plotted as ln(D) versus T∞/T (where T∞ represents the bulk melting temperature), the temperature dependencies for different compositions converged toward a common curve, demonstrating the universal scaling of diffusion behavior with melting point.
The values of the cation diffusion coefficients computed for superionic (UₓPuᵧTh₁₋ₓ₋ᵧ)O₂ nanocrystals agree with extrapolated low-temperature diffusion data from macroscopic UO₂ and ThO₂ crystals [14]. However, the model effective diffusion activation energies remain systematically overestimated relative to experimental values. Our analysis reveals no mechanism for reducing these activation energies during the transition from the superionic to normal crystalline phase. Improved agreement would require refining both the calculated Schottky defect formation energies and cation vacancy migration barriers.
Author Contributions
Conceptualization, D.D.S., K.A.N. and S.K.G.; methodology, D.D.S., K.A.N., F.U.A., G.D.K., A.U.A. and S.K.G.; software, K.A.N.; validation, D.D.S. and K.A.N.; formal analysis, D.D.S., K.A.N. and S.S.P.; investigation, D.D.S., K.A.N. and S.S.P.; resources, F.U.A. and G.D.K.; data curation, D.D.S.; writing—original draft preparation, D.D.S. and K.A.N.; writing—review and editing, D.D.S. and S.S.P.; visualization, D.D.S. and S.S.P.; supervision, F.U.A., G.D.K. and A.U.A.; project administration, F.U.A. and G.D.K.; funding acquisition, D.D.S., F.U.A. and G.D.K. All authors have read and agreed to the published version of the manuscript.
Funding
This research was funded by the Science Committee of the Ministry of Education and Science of the Republic of Kazakhstan (Grant No. AP19174919).
Data Availability Statement
The original contributions presented in the study are included in the article; further inquiries can be directed to the corresponding authors.
Conflicts of Interest
The authors declare no conflicts of interest.
References
- Carbajo, J.J.; Yoder, G.L.; Popov, S.G.; Ivanov, V.K. A Review of the Thermophysical Properties of MOX and UO₂ Fuels. J. Nucl. Mater. 2001, 299, 181–198. [Google Scholar] [CrossRef]
- Parrish, R.; Aitkaliyeva, A. A Review of Microstructural Features in Fast Reactor Mixed Oxide Fuels. J. Nucl. Mater. 2018, 510, 644–660. [Google Scholar] [CrossRef]
- Ghosh, P.S.; Kuganathan, N.; Galvin, C.O.T.; Arya, A.; Dey, G.K.; Dutta, B.K.; Grimes, R.W. Melting Behavior of (Th,U)O₂ and (Th,Pu)O₂ Mixed Oxides. J. Nucl. Mater. 2016, 479, 112–122. [Google Scholar] [CrossRef]
- Meyer, M.K.; Fielding, R.; Gan, J. Fuel development for gas-cooled fast reactors. J. Nucl. Mater. 2007, 371, 281–287. [Google Scholar] [CrossRef]
- Crawford, D.C.; Porter, D.L.; Hayes, S.L. Fuels for Sodium-Cooled Fast Reactors: US Perspective. J. Nucl. Mater. 2007, 371, 202–231. [Google Scholar] [CrossRef]
- Matthews, R.B.; Chidester, K.M.; Hoth, C.W.; Mason, R.E.; Petty, R.L. Fabrication and Testing of Uranium Nitride Fuel for Space Power Reactors. J. Nucl. Mater. 1988, 151, 345–351. [Google Scholar] [CrossRef]
- Matzke, Hj. Science of Advanced LMFBR Fuels; North-Holland: Amsterdam, The Netherlands, 1986. [Google Scholar]
- Godinho, J.R.A.; Piazolo, S.; Stennett, M.C.; Hyatt, N.C. Sintering of CaF₂ Pellets as Nuclear Fuel Analog for Surface Stability Experiments. J. Nucl. Mater. 2011, 419, 46–51. [Google Scholar] [CrossRef]
- Idriss, H. Surface Reactions of Uranium Oxide Powder, Thin Films and Single Crystals. Surf. Sci. Rep. 2010, 65, 67–109. [Google Scholar] [CrossRef]
- Potashnikov, S.I.; Boyarchenkov, A.S.; Nekrasov, K.A.; Kupryazhkin, A.Ya. High-Precision Molecular Dynamics Simulation of UO₂–PuO₂: Pair Potentials Comparison in UO₂. J. Nucl. Mater. 2011, 419, 217–225. [Google Scholar] [CrossRef]
- Murch, G.E.; Catlow, C.R.A. Oxygen Diffusion in UO₂, ThO₂ and PuO₂: A Review. J. Chem. Soc. Faraday Trans. 1987, 83, 1157–1169. [Google Scholar] [CrossRef]
- Potashnikov, S.I.; Boyarchenkov, A.S.; Nekrasov, K.A.; Kupryazhkin, A.Ya. High-Precision Molecular Dynamics Simulation of UO₂–PuO₂: Anion Self-Diffusion in UO₂. J. Nucl. Mater. 2013, 433, 215–224. [Google Scholar] [CrossRef]
- Matzke, Hj. Lattice Disorder and Metal Self-Diffusion in Non-Stoichiometric UO₂ and (U, Pu)O₂. J. Phys. Colloq. 1973, 34, 317–325. [Google Scholar] [CrossRef]
- Matzke, Hj. Atomic Transport Properties in UO₂ and Mixed Oxides (U, Pu)O₂. J. Chem. Soc. Faraday Trans. 2 1987, 83, 1121–1142. [Google Scholar] [CrossRef]
- Ronchi, C.; Sheindlin, M.; Staicu, D.; Kinoshita, M. Effect of Burn-Up on the Thermal Conductivity of Uranium Dioxide up to 100,000 MWdt⁻¹. J. Nucl. Mater. 2004, 327, 58–76. [Google Scholar] [CrossRef]
- Govers, K.; Lemehov, S.E.; Hou, M.; Verwerft, M. Comparison of Interatomic Potentials for UO₂. Part I: Static Calculations. J. Nucl. Mater. 2007, 366, 161–177. [Google Scholar] [CrossRef]
- Govers, K.; Lemehov, S.E.; Hou, M.; Verwerft, M. Comparison of Interatomic Potentials for UO₂: Part II: Molecular Dynamics Simulations. J. Nucl. Mater. 2008, 376, 66–77. [Google Scholar] [CrossRef]
- Balboa, H.; Van Brutzel, L.; Chartier, A.; Le Bouar, Y. Assessment of Empirical Potential for MOX Nuclear Fuels and Thermomechanical Properties. J. Nucl. Mater. 2017, 495, 67–79. [Google Scholar] [CrossRef]
- Shi, H.; Chu, M.; Zhang, P. Optical Properties of UO₂ and PuO₂. J. Nucl. Mater. 2010, 400, 151–156. [Google Scholar] [CrossRef]
- Peng-Fei, S.; Zhen-Hong, D.; Xiao-Ling, Z.; Yin-Chang, Z. Electronic Structure and Optical Properties in Uranium Dioxide: The First Principle Calculations. Chin. Phys. Lett. 2015, 32, 077101. [Google Scholar] [CrossRef]
- Boudjemline, A.; Louail, L.; Islam, M.M.; Diawara, B. Dependence of Pressure on Elastic, Electronic and Optical Properties of CeO₂ and ThO₂: A First Principles Study. Comput. Mater. Sci. 2011, 50, 2280–2286. [Google Scholar] [CrossRef]
- Li, Y. A Universal COMB Potential for the Whole Composition Range of the Uranium-Oxygen System. J. Nucl. Mater. 2019, 513, 102–111. [Google Scholar] [CrossRef]
- Phillpot, S.R.; Antony, A.C.; Shi, L.; Fullarton, M.L.; Liang, T.; Sinnott, S.B.; Zhang, Y.; Biner, S.B. Charge Optimized Many Body (COMB) Potentials for Simulation of Nuclear Fuel and Clad. Comput. Mater. Sci. 2018, 148, 231–241. [Google Scholar] [CrossRef]
- Li, Y.; Liang, T.; Sinnott, S.B.; Phillpot, S.R. A Charge-Optimized Many-Body Potential for the U–UO₂–O₂ System. J. Phys. Condens. Matter 2013, 25, 505401. [Google Scholar] [CrossRef] [PubMed]
- Ryzhkov, M.V.; Kupryazhkin, A.Ya. First-Principles Study of Electronic Structure and Insulating Properties of Uranium and Plutonium Dioxides. J. Nucl. Mater. 2009, 384, 226–232. [Google Scholar] [CrossRef]
- Ryzhkov, M.V.; Kovalenko, M.A.; Kupryazhkin, A.Ya.; Gupta, S.K. Transformation of Electron Density Distribution Induced by the Cation Point Defects in Uranium Dioxide. J. Radioanal. Nucl. Chem. 2020, 325, 253–262. [Google Scholar] [CrossRef]
- Boyarchenkov, A.S.; Nekrasov, K.A.; Kupryazhkin, A.Ya.; Gupta, S.K. A Novel Empirical Potential for High-Temperature Molecular Dynamics Simulation of ThO₂ and MOX Nuclear Fuel Crystals. AIP Conf. Proc. 2020, 2313, 030064. [Google Scholar] [CrossRef]
- Brutzel, L.V.; Rarivomanantsoa, M.; Ghaleb, D. Displacement Cascade Initiated with the Realistic Energy of the Recoil Nucleus in UO₂ Matrix by Molecular Dynamics Simulation. J. Nucl. Mater. 2006, 354, 28–35. [Google Scholar] [CrossRef]
- Martin, G.; Garcia, P.; Brutzel, L.V.; Dorado, B.; Maillard, S. Effect of the Cascade Energy on Defect Production in Uranium Dioxide. Nucl. Instrum. Methods Phys. Res. B 2011, 269, 1727–1731. [Google Scholar] [CrossRef]
- Balboa, H.; Van Brutzel, L.; Chartier, A.; Le Bouar, Y. Damage Characterization of (U,Pu)O₂ Under Irradiation by Molecular Dynamics Simulations. J. Nucl. Mater. 2018, 512, 440–451. [Google Scholar] [CrossRef]
- Devanathan, R. Molecular Dynamics Simulation of Fission Fragment Damage in Nuclear Fuel and Surrogate Material. MRS Adv. 2017, 2, 1225–1236. [Google Scholar] [CrossRef]
- Yablinsky, C.A.; Devanathan, R.; Pakarinen, J.; Gan, J.; Severin, D.; Trautmann, C.; Allen, T.R. Characterization of Swift Heavy Ion Irradiation Damage in Ceria. J. Mater. Res. 2015, 30, 1473–1484. [Google Scholar] [CrossRef]
- Kovalenko, M.A.; Kupryazhkin, A.Ya. Mechanisms of Exchange and Anion Frenkel Diffusion in Uranium Dioxide: Molecular Dynamics Study. J. Nucl. Mater. 2019, 522, 255–264. [Google Scholar] [CrossRef]
- Boyarchenkov, A.S.; Potashnikov, S.I.; Nekrasov, K.A.; Kupryazhkin, A.Ya. Molecular Dynamics Simulation of UO₂ Nanocrystals Melting Under Isolated and Periodic Boundary Conditions. J. Nucl. Mater. 2012, 427, 311–322. [Google Scholar] [CrossRef]
- Singh, S.; Sonvane, Y.; Nekrasov, K.A.; Boyarchenkov, A.S.; Kupryazhkin, A.Ya.; Gajjar, P.N.; Gupta, S.K. Ab-Initio Investigation of Crystal Structure and Pressure Induced Phase Transition in ThO₂ and PuO₂. Mater. Today Commun. 2021, 28, 102579. [Google Scholar] [CrossRef]
- Kim, K.C.; Olander, D.R. Oxygen Diffusion in UO₂₋ₓ. J. Nucl. Mater. 1981, 102, 192–199. [Google Scholar] [CrossRef]
- Basak, C.; Sengupta, A.; Kamath, H. Classical Molecular Dynamics Simulation of UO₂ to Predict Thermophysical Properties. J. Alloys Compd. 2003, 360, 210–216. [Google Scholar] [CrossRef]
- Morelon, N.-D.; Ghaleb, D.; Delaye, J.-M.; Brutzel, L.V. A New Empirical Potential for Simulating the Formation of Defects and Their Mobility in Uranium Dioxide. Philos. Mag. 2003, 83, 1533–1555. [Google Scholar] [CrossRef]
- Yakub, E.; Ronchi, C.; Staicu, D. Computer Simulation of Defects Formation and Equilibrium in Non-Stoichiometric Uranium Dioxide. J. Nucl. Mater. 2009, 389, 119–129. [Google Scholar] [CrossRef]
- Vincent-Aublant, E.; Delaye, J.-M.; Van Brutzel, L. Self-Diffusion Near Symmetrical Tilt Grain Boundaries in UO₂ Matrix: A Molecular Dynamics Simulation Study. J. Nucl. Mater. 2009, 392, 114–122. [Google Scholar] [CrossRef]
- Arima, T.; Yoshida, K.; Idemitsu, K.; Inagaki, Y.; Sato, I. Molecular Dynamics Analysis of Diffusion of Uranium and Oxygen Ions in Uranium Dioxide. IOP Conf. Ser. Mater. Sci. Eng. 2010, 9, 012003. [Google Scholar] [CrossRef]
- Desai, T.G.; Millett, P.; Tonks, M.; Wolf, D. Atomistic Simulations of Void Migration Under Thermal Gradient in UO₂. Acta Mater. 2010, 58, 330–339. [Google Scholar] [CrossRef]
- Boyarchenkov, A.S.; Potashnikov, S.I.; Nekrasov, K.A.; Kupryazhkin, A.Ya. Investigation of Cation Self-Diffusion Mechanisms in UO₂±ₓ Using Molecular Dynamics. J. Nucl. Mater. 2013, 442, 148–161. [Google Scholar] [CrossRef]
- Pitskhelaury, S.; Seitov, D.; Nekrasov, K.; Boyarchenkov, A.; Kupryazhkin, A.; Gupta, S.K. Influence of the Superionic Transition on the Diffusion of Cations in ThO₂ Nanocrystals: A Molecular Dynamics Simulation. Mater. Today Proc. 2023, in press. [CrossRef]
- Momma, K.; Izumi, F. VESTA 3 for three-dimensional visualization of crystal, volumetric and morphology data. J. Appl. Crystallogr. 2011, 44, 1272–1276. [Google Scholar] [CrossRef]
- Seitov, D.D.; Pitskhelaury, S.S.; Nekrasov, K.A.; Boyarchenkov, A.S.; Kupryazhkin, A.Ya. A Mechanism of Cation Diffusion in ThO₂ Nanocrystal Bulk: A Molecular Dynamic Simulation. AIP Conf. Proc. 2022, 2466, 030040. [Google Scholar] [CrossRef]
- Cooper, M.W.D.; Rushton, M.J.D.; Grimes, R.W. A Many-Body Potential Approach to Modelling the Thermomechanical Properties of Actinide Oxides. J. Phys. Condens. Matter 2014, 26, 105401. [Google Scholar] [CrossRef]
- Verlet, L. Computer "Experiments" on Classical Fluids. I. Thermodynamical Properties of Lennard-Jones Molecules. Phys. Rev. 1967, 159, 98–103. [Google Scholar] [CrossRef]
- Berendsen, H.J.C.; Postma, J.P.M.; van Gunsteren, W.F.; DiNola, A.; Haak, J.R. Molecular Dynamics with Coupling to an External Bath. J. Chem. Phys. 1984, 81, 3684–3690. [Google Scholar] [CrossRef]
- Bussi, G.; Donadio, D.; Parrinello, M. Canonical Sampling Through Velocity Rescaling. J. Chem. Phys. 2007, 126, 014101. [Google Scholar] [CrossRef]
- Nosé, S. A Unified Formulation of the Constant Temperature Molecular Dynamics Methods. J. Chem. Phys. 1984, 81, 511–519. [Google Scholar] [CrossRef]
- Hoover, W.G. Canonical Dynamics: Equilibrium Phase-Space Distributions. Phys. Rev. A 1985, 31, 1695–1697. [Google Scholar] [CrossRef] [PubMed]
- Nekrasov, K.A.; Boyarchenkov, A.S.; Kupryazhkin, A.Ya.; Gupta, S.K. The melting mechanisms of UO2 nanocrystals: A molecular dynamics simulation. AIP Conf. Proc. 2019, 2142, 020001. [Google Scholar] [CrossRef]
- Vanfleet, R.R.; Mochel, J.M. Thermodynamics of Melting and Freezing in Small Particles. Surf. Sci. 1995, 341, 40–50. [Google Scholar] [CrossRef]
- Pavlov, T.R.; Wangle, T.; Wenman, M.R.; Tyrpekl, V.; Vlahovic, L.; Robba, D.; Van Uffelen, P.; Konings, R.J.M.; Grimes, R.W. High Temperature Measurements and Condensed Matter Analysis of the Thermo-Physical Properties of ThO₂. Sci. Rep. 2018, 8, 5038. [Google Scholar] [CrossRef] [PubMed]
- De Bruycker, F.; Boboridis, K.; Manara, D.; Pöml, P.; Rini, M.; Konings, R.J.M. Reassessing the Melting Temperature of PuO₂. Mater. Today 2010, 13, 52–55. [Google Scholar] [CrossRef]
- Epstein, L.F. Ideal Solution Behavior and Heats of Fusion from the UO₂-PuO₂ Phase Diagram. J. Nucl. Mater. 1967, 22, 340–348. [Google Scholar] [CrossRef]
- Fink, J.K.; Sofu, T.; Ley, H. International Nuclear Safety Center Database on Thermophysical Properties of Reactor Materials. Int. J. Thermophys. 1999, 20, 279–287. [Google Scholar] [CrossRef]
- Dorado, B.; Andersson, D.A.; Stanek, C.R.; Bertolus, M.; Uberuaga, B.P.; Martin, G.; Freyss, M.; Garcia, P. First-Principles Calculations of Uranium Diffusion in Uranium Dioxide. Phys. Rev. B 2012, 86, 035110. [Google Scholar] [CrossRef]
- Gupta, F.; Brillant, G.; Pasturel, A. Correlation Effects and Energetics of Point Defects in Uranium Dioxide: A First Principle Investigation. Philos. Mag. 2007, 87, 2561–2569. [Google Scholar] [CrossRef]
- Crocombette, J.P.; Jollet, F.; Nga, L.T.; Petit, T. Plane-Wave Pseudopotential Study of Point Defects in Uranium Dioxide. Phys. Rev. B 2001, 64, 104107. [Google Scholar] [CrossRef]
- Freyss, M.; Petit, T.; Crocombette, J.P. Point Defects in Uranium Dioxide: Ab Initio Pseudopotential Approach in the Generalized Gradient Approximation. J. Nucl. Mater. 2005, 347, 44–51. [Google Scholar] [CrossRef]
- Freyss, M.; Vergnet, N.; Petit, T. Ab Initio Modeling of the Behavior of Helium and Xenon in Actinide Dioxide Nuclear Fuels. J. Nucl. Mater. 2006, 352, 144–150. [Google Scholar] [CrossRef]
- Moxon, S.; Skelton, J.; Joshua, S.T.; Flitcroft, J.; Togo, A.; Cooke, D.J.; Da Silva, E.L.; Harker, R.M.; Storr, M.T.; Parker, S.C. Structural Dynamics of Schottky and Frenkel Defects in ThO₂: A Density-Functional Theory Study. J. Mater. Chem. A 2022, 10, 1861–1875. [Google Scholar] [CrossRef]
- Yun, Y.; Oppeneer, P.M.; Kim, H.; Park, K. Defect Energetics and Xe Diffusion in UO₂ and ThO₂. Acta Mater. 2009, 57, 1655–1659. [Google Scholar] [CrossRef]
- Dorado, B.; Jomard, G.; Freyss, M.; Bertolus, M. Stability of Oxygen Point Defects in UO₂ by First-Principles DFT+U Calculations: Occupation Matrix Control and Jahn-Teller Distortion. Phys. Rev. B 2010, 82, 035114. [Google Scholar] [CrossRef]
- Iwasawa, M.; Chen, Y.; Kaneta, Y.; Ohnuma, T.; Geng, H.Y.; Kinoshita, M. First-Principles Calculation of Point Defects in Uranium Dioxide. Mater. Trans. 2006, 47, 2651–2657. [Google Scholar] [CrossRef]
- Nerikar, P.; Watanabe, T.; Tulenko, J.S.; Phillpot, S.R.; Sinnott, S.B. Energetics of Intrinsic Point Defects in Uranium Dioxide from Electronic-Structure Calculations. J. Nucl. Mater. 2009, 384, 61–69. [Google Scholar] [CrossRef]
- Dorado, B.; Freyss, M.; Martin, G. GGA+U Study of the Incorporation of Iodine in Uranium Dioxide. Eur. Phys. J. B 2009, 69, 203–209. [Google Scholar] [CrossRef]
- Wang, L.F.; Sun, B.; Liu, H.F.; Lin, D.Y.; Song, H.F. Thermodynamics and Kinetics of Intrinsic Point Defects in Plutonium Dioxides. J. Nucl. Mater. 2019, 526, 151762. [Google Scholar] [CrossRef]
- Nakamura, H.; Machida, M. A First-Principles Study on Point Defects in Plutonium Dioxide. Prog. Nucl. Sci. Technol. 2018, 5, 132–135. [Google Scholar] [CrossRef]
- Singh, S.; Sonvane, Y.; Nekrasov, K.A.; Kupryazhkin, A.Ya.; Gajjar, P.N.; Gupta, S.K. A First Principles Investigation of Defect Energetics and Diffusion in Actinide Dioxides. J. Nucl. Mater. 2024, 591, 154901. [Google Scholar] [CrossRef]
- Lu, Y.; Yang, Y.; Zhang, P. Charge States of Point Defects in Plutonium Oxide: A First-Principles Study. J. Alloys Compd. 2015, 649, 544–552. [Google Scholar] [CrossRef]
- Tian, X.; Gao, T.; Lu, C.; Shang, J.; Xiao, H. First Principle Study of the Behavior of Helium in Plutonium Dioxide. Eur. Phys. J. B 2013, 86, 179. [Google Scholar] [CrossRef]
- Adamson, M.G.; Aitken, E.A.; Caputi, R.W. Experimental and thermodynamic evaluation of the melting behavior of irradiated oxide fuels. J. Nucl. Mater. 1985, 130, 245–252. [Google Scholar] [CrossRef]
- Yun, Y.; Eriksson, O.; Oppeneer, P.M. First-Principles Study of Helium Behavior in Nuclear Fuel Materials. Preprints 2011. Available online: https://www.researchgate.net/publication/287350512_Firstprinciples_study_of_helium_behavior_in_nuclear_fuel_materials (accessed on 04 May 2025).
- Lu, Y.; Yang, Y.; Zhang, P. Thermodynamic Properties and Structural Stability of Thorium Dioxide. J. Phys. Condens. Matter 2012, 24, 225801. [Google Scholar] [CrossRef] [PubMed]
- Murphy, S.T.; Cooper, M.W.D.; Grimes, R.W. Point Defects and Non-Stoichiometry in Thoria. Solid State Ionics 2014, 267, 80–87. [Google Scholar] [CrossRef]
- Konings, R.J.M.; Beneš, O. The Heat Capacity of NpO₂ at High Temperatures: The Effect of Oxygen Frenkel Pair Formation. J. Phys. Chem. Solids 2013, 74, 653–655. [Google Scholar] [CrossRef]
- Hutchings, M.T. High-Temperature Studies of UO₂ and ThO₂ Using Neutron Scattering Techniques. J. Chem. Soc. Faraday Trans. 2 1987, 83, 1083–1103. [Google Scholar] [CrossRef]
- Matthews, J.R. Technological Problems and the Future of Research on the Basic Properties of Actinide Oxides. J. Chem. Soc. Faraday Trans. 2 1987, 83, 1273–1285. [Google Scholar] [CrossRef]
Figure 1.
A model nanocrystal (Pu0.25Th0.75)O2 of 5460 particles: (a) At the beginning of a computational experiment; (b) 80 nanoseconds after the start of the simulation. Oxygen ions are shown in orange, thorium in green, and plutonium in blue. Images were prepared with VESTA application (Ver. 3.4.4) [45].
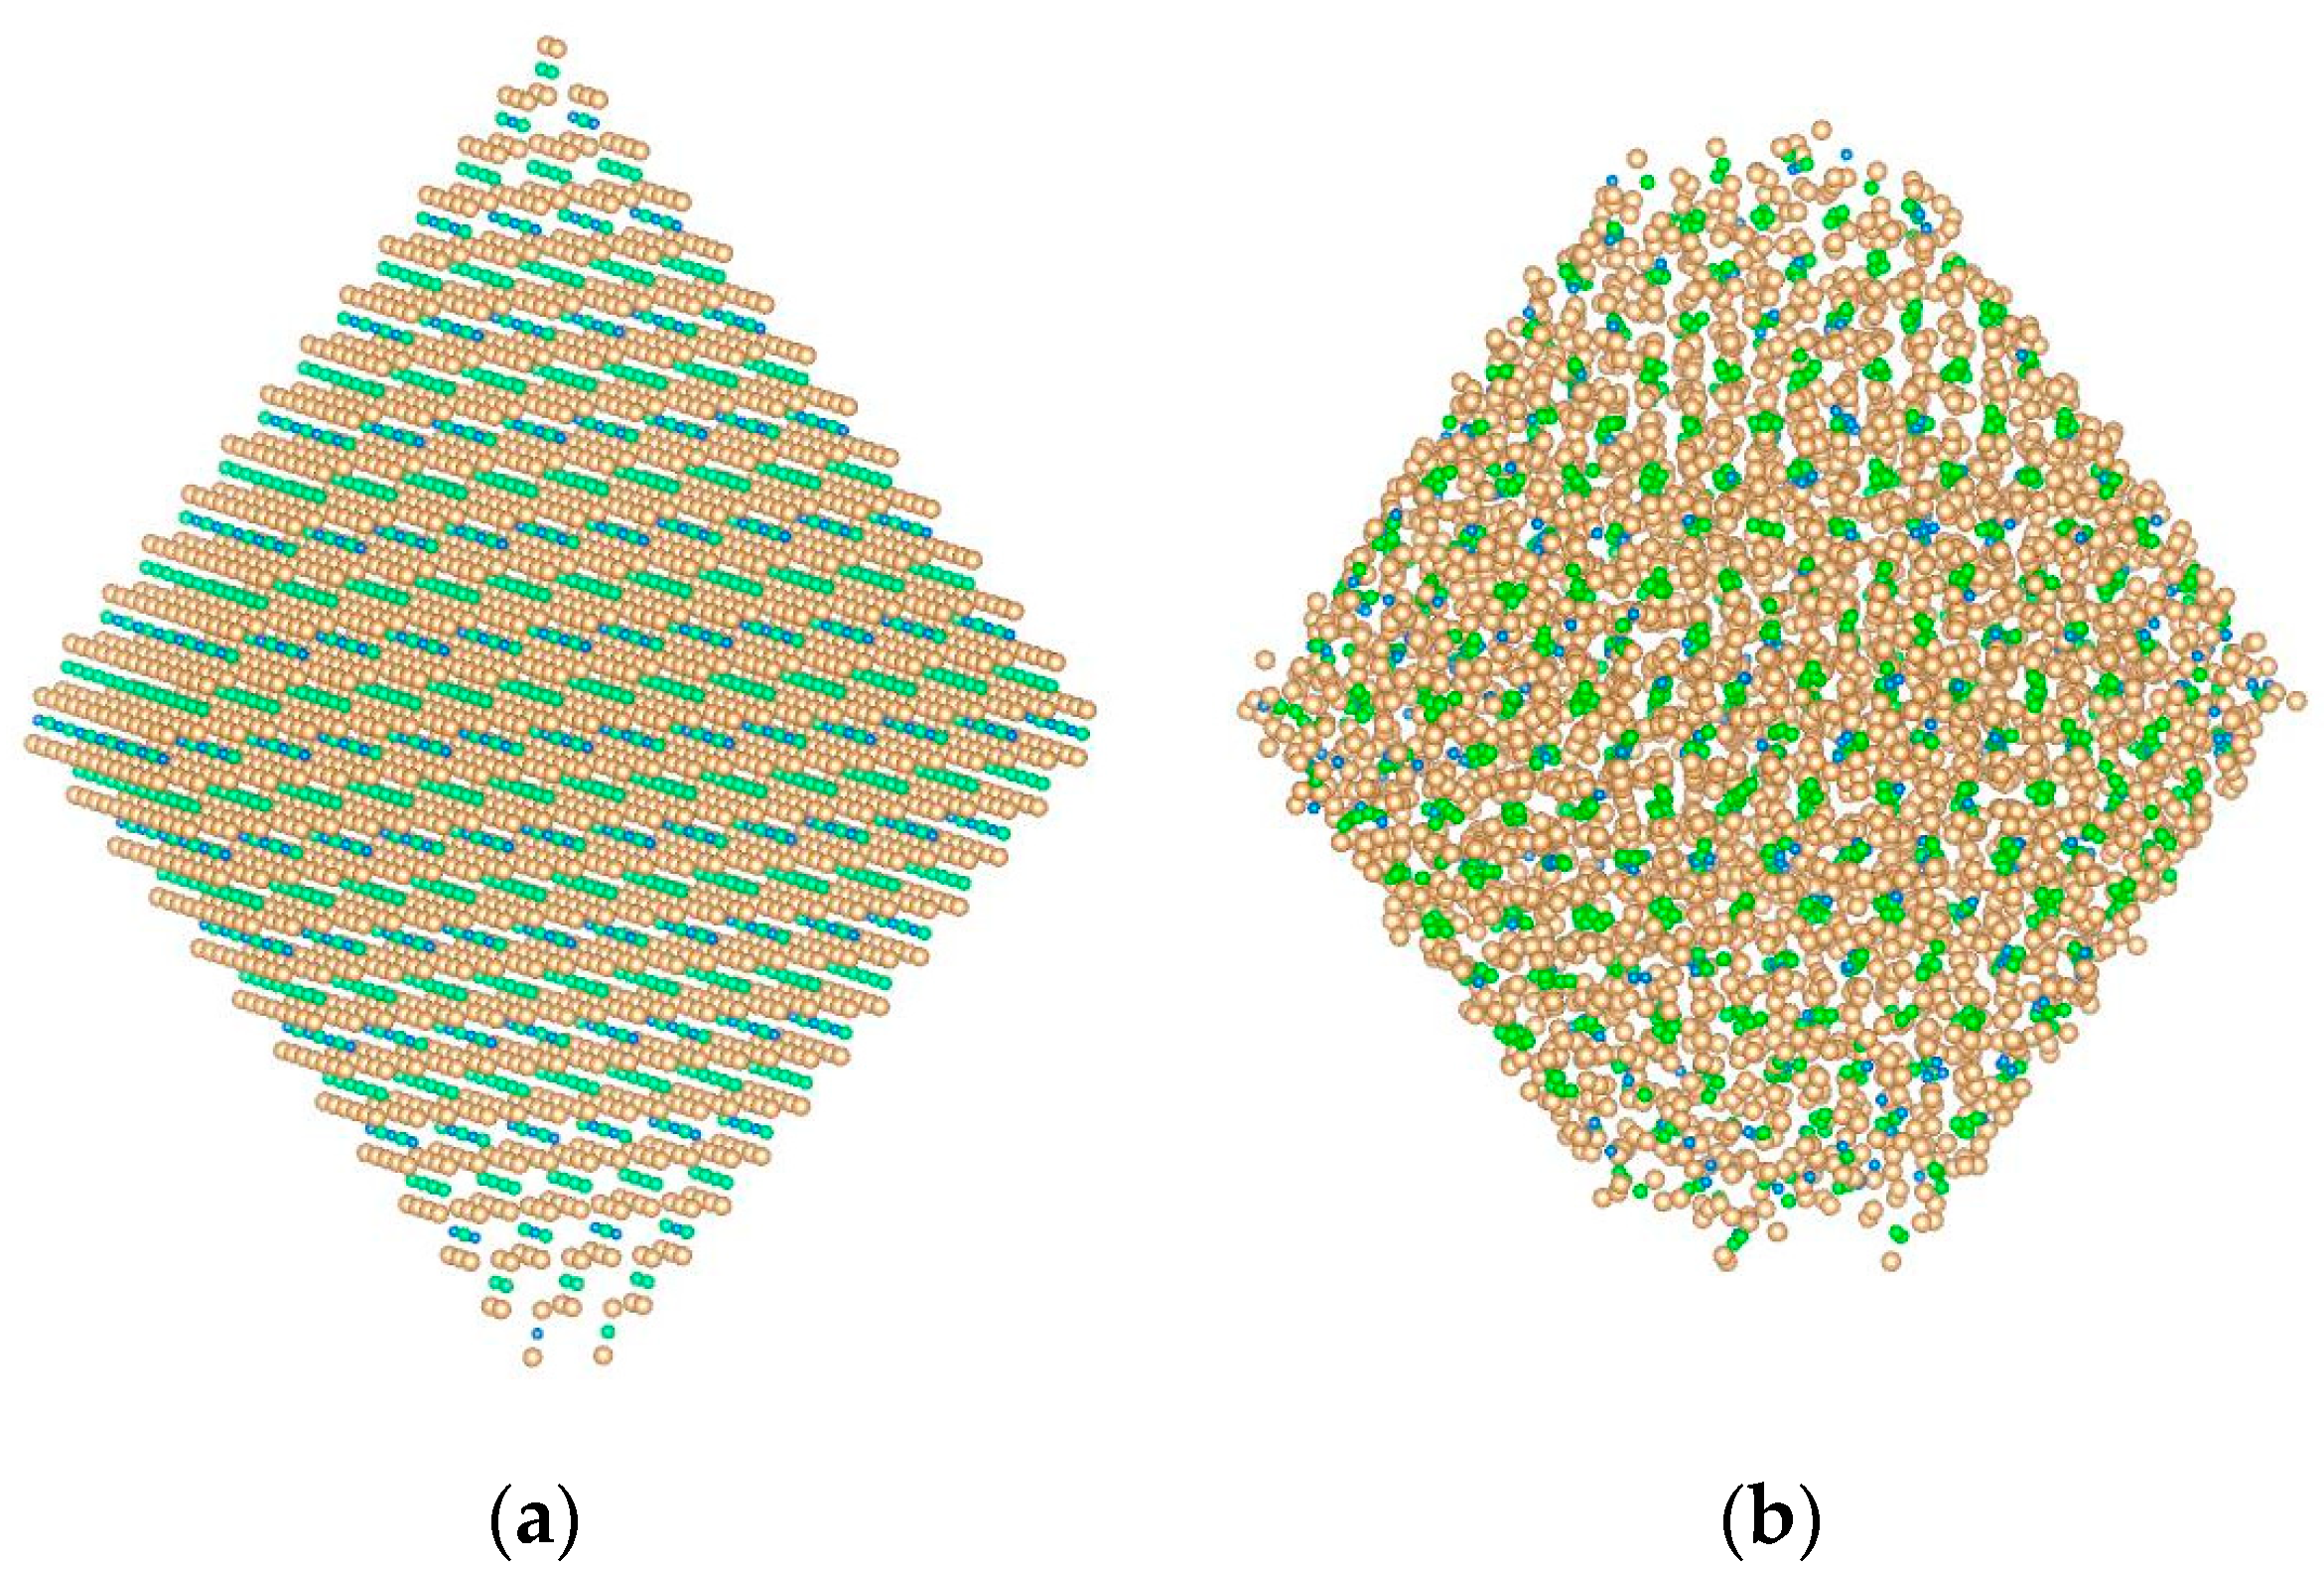
Figure 2.
The central region of a model nanocrystal. The cross-section of an octahedral crystallite with the crystallographic plane (110) is shown. The diffusion coefficients of cations were calculated inside the central sphere.
Figure 2.
The central region of a model nanocrystal. The cross-section of an octahedral crystallite with the crystallographic plane (110) is shown. The diffusion coefficients of cations were calculated inside the central sphere.
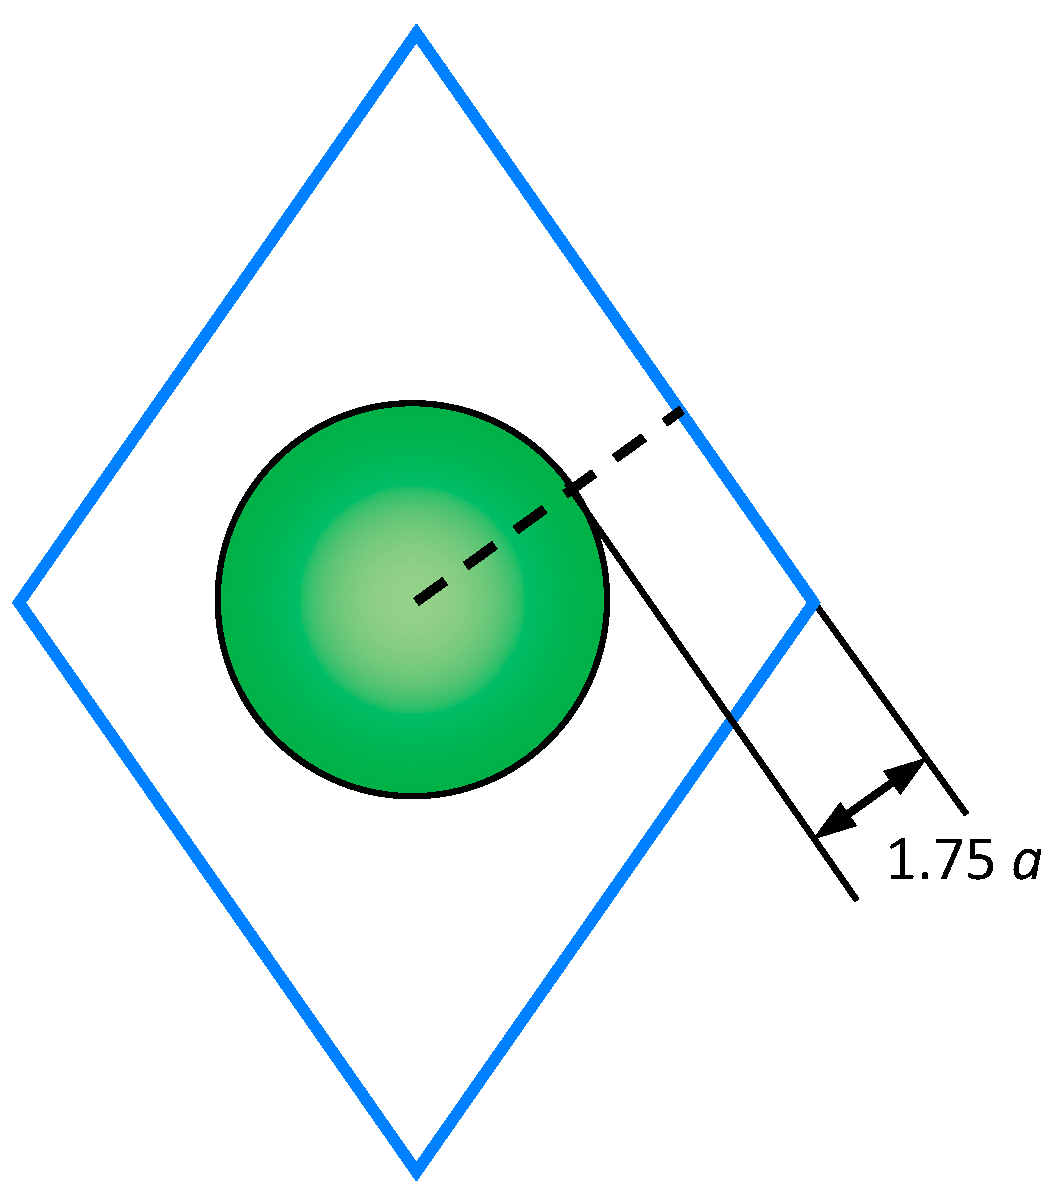
Figure 3.
Effect of rotation compensation on calculation of the mean square displacement (MSD): (a) A comparison of cation MSD with and without the rotation correction at the post-processing stage; (b) The same MSD with rotation correction on a larger scale. The system was (Th0.75Pu0.25)O2 crystal of 5460 particles at 3300 K.
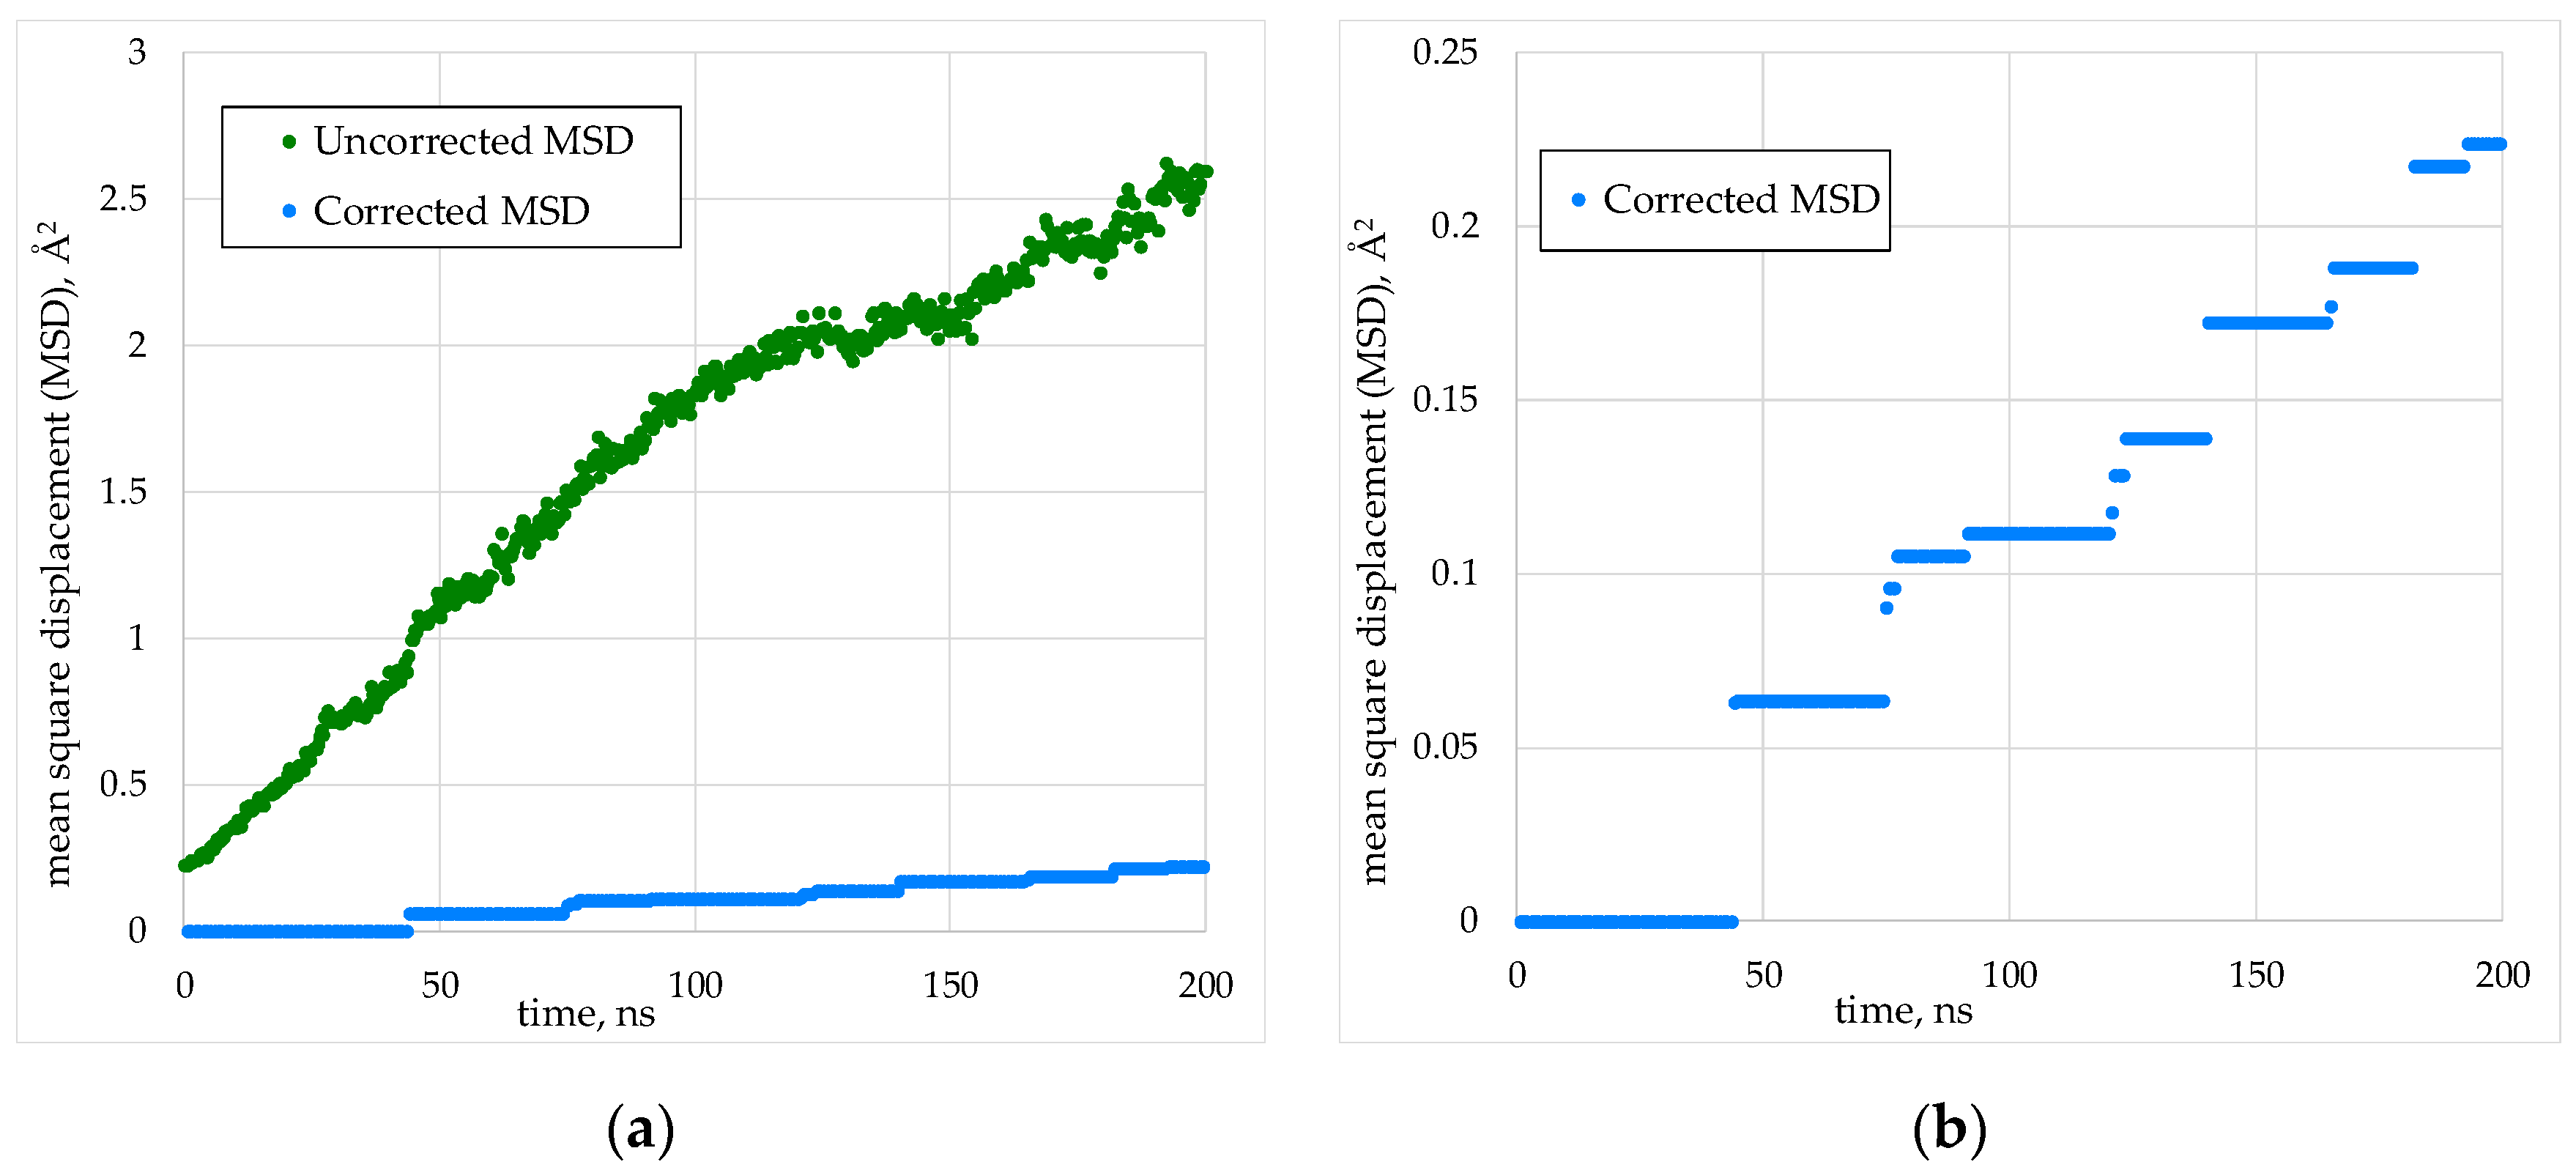
Figure 4.
Mean squares of cation displacement in the (Pu0.25Th0.75)O2 crystal of 5460 particles calculated using the stochastic velocity rescaling and Berendsen thermostats. The parameters of the two thermostats τ had the same values τ = 9 ps.
Figure 4.
Mean squares of cation displacement in the (Pu0.25Th0.75)O2 crystal of 5460 particles calculated using the stochastic velocity rescaling and Berendsen thermostats. The parameters of the two thermostats τ had the same values τ = 9 ps.
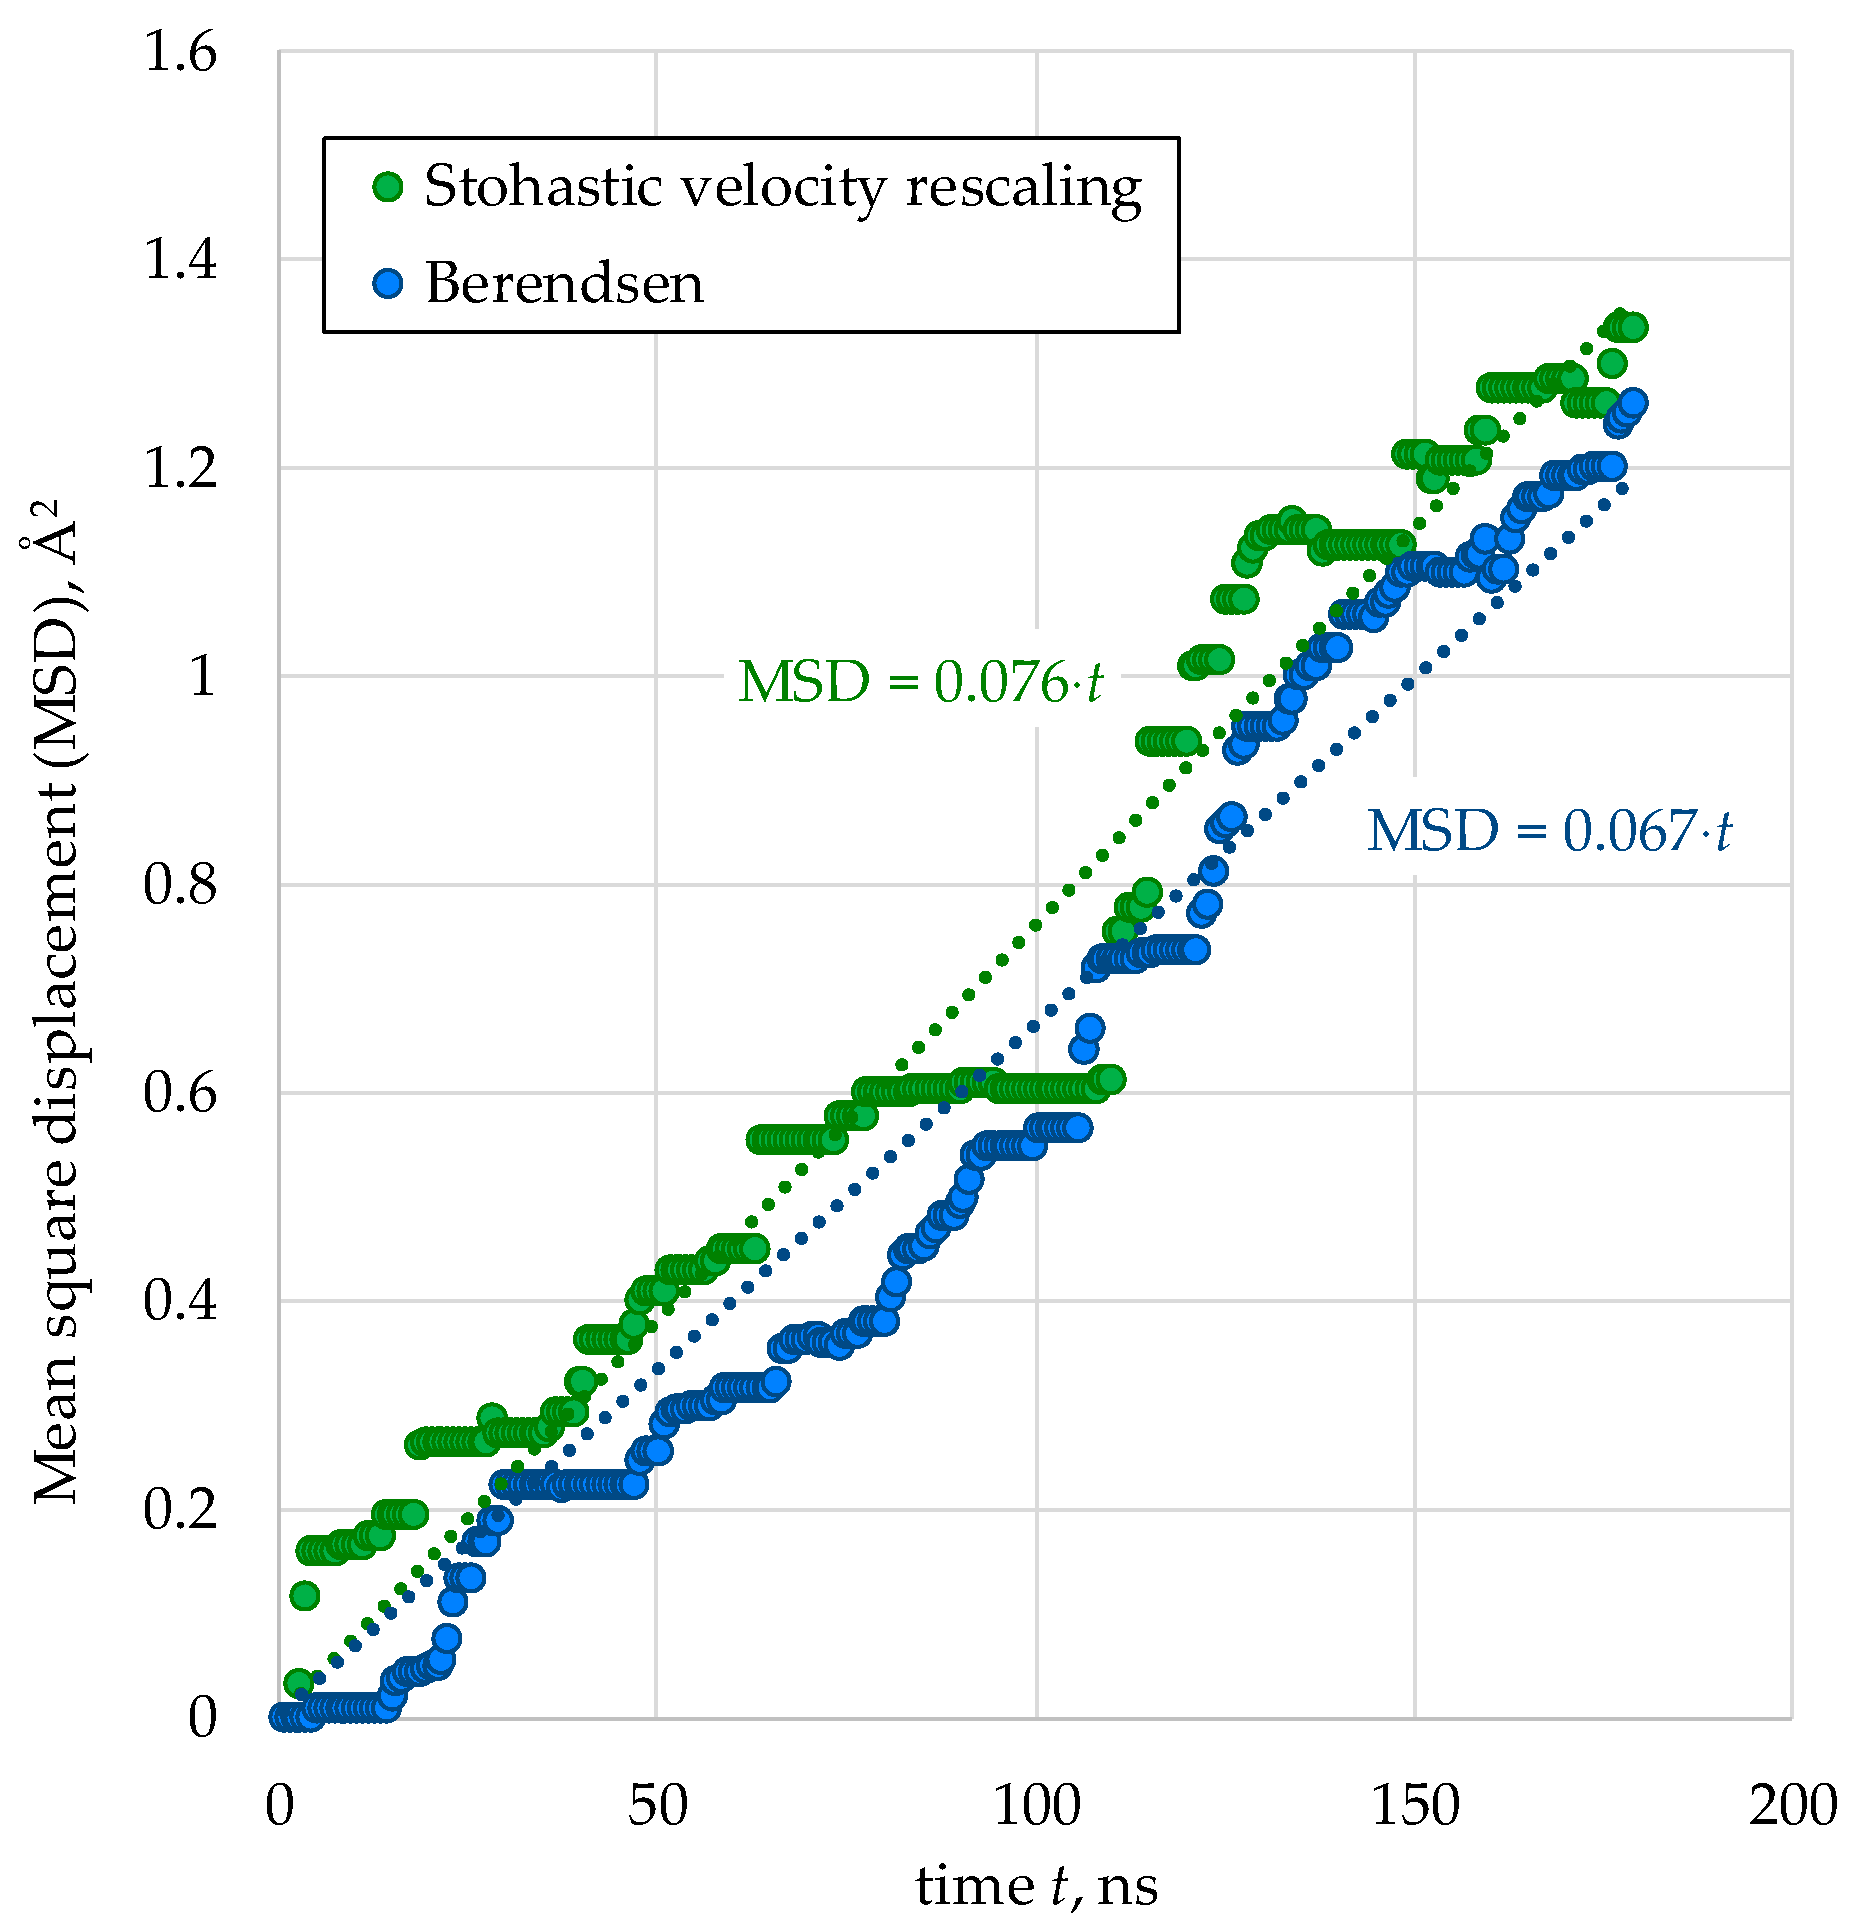
Figure 5.
Temperature dependence of the cation diffusion coefficient in (Pu0.25Th0.75)O2 (5460 particles) calculated using stochastic velocity rescaling and Berendsen thermostats.
Figure 5.
Temperature dependence of the cation diffusion coefficient in (Pu0.25Th0.75)O2 (5460 particles) calculated using stochastic velocity rescaling and Berendsen thermostats.
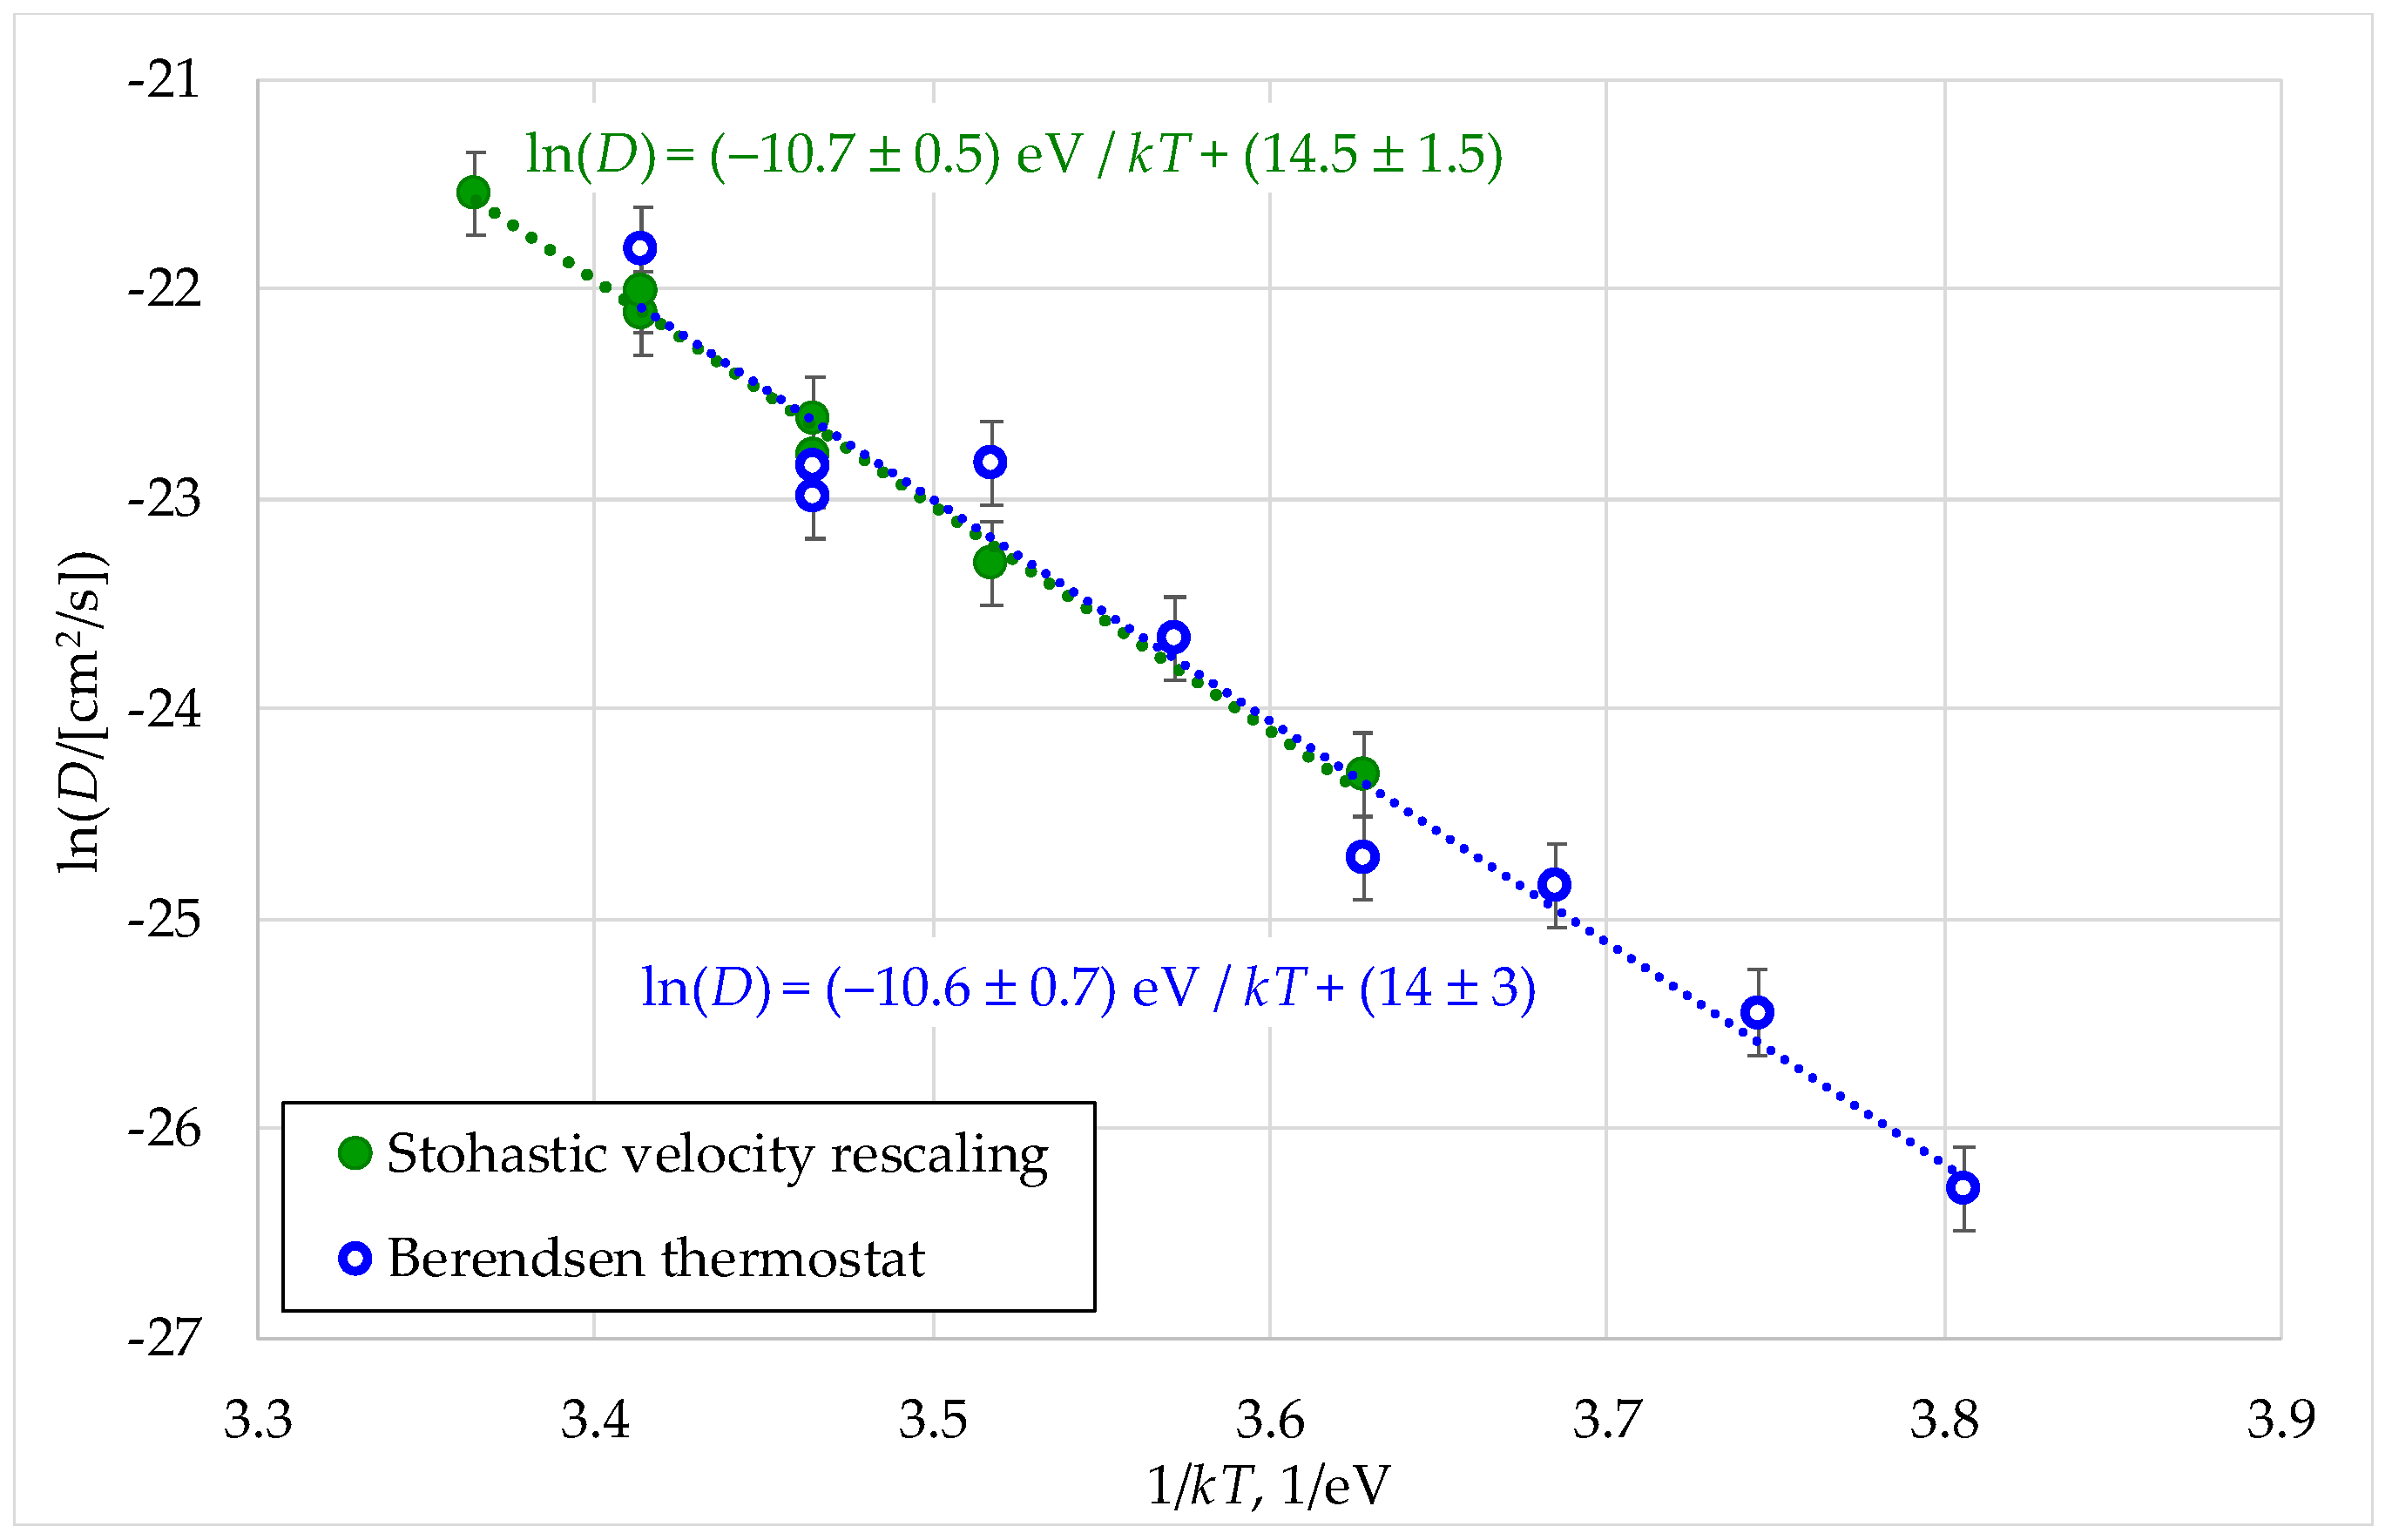
Figure 6.
Dependence of the melting temperature of model ThO2 crystals on the inverse linear size.
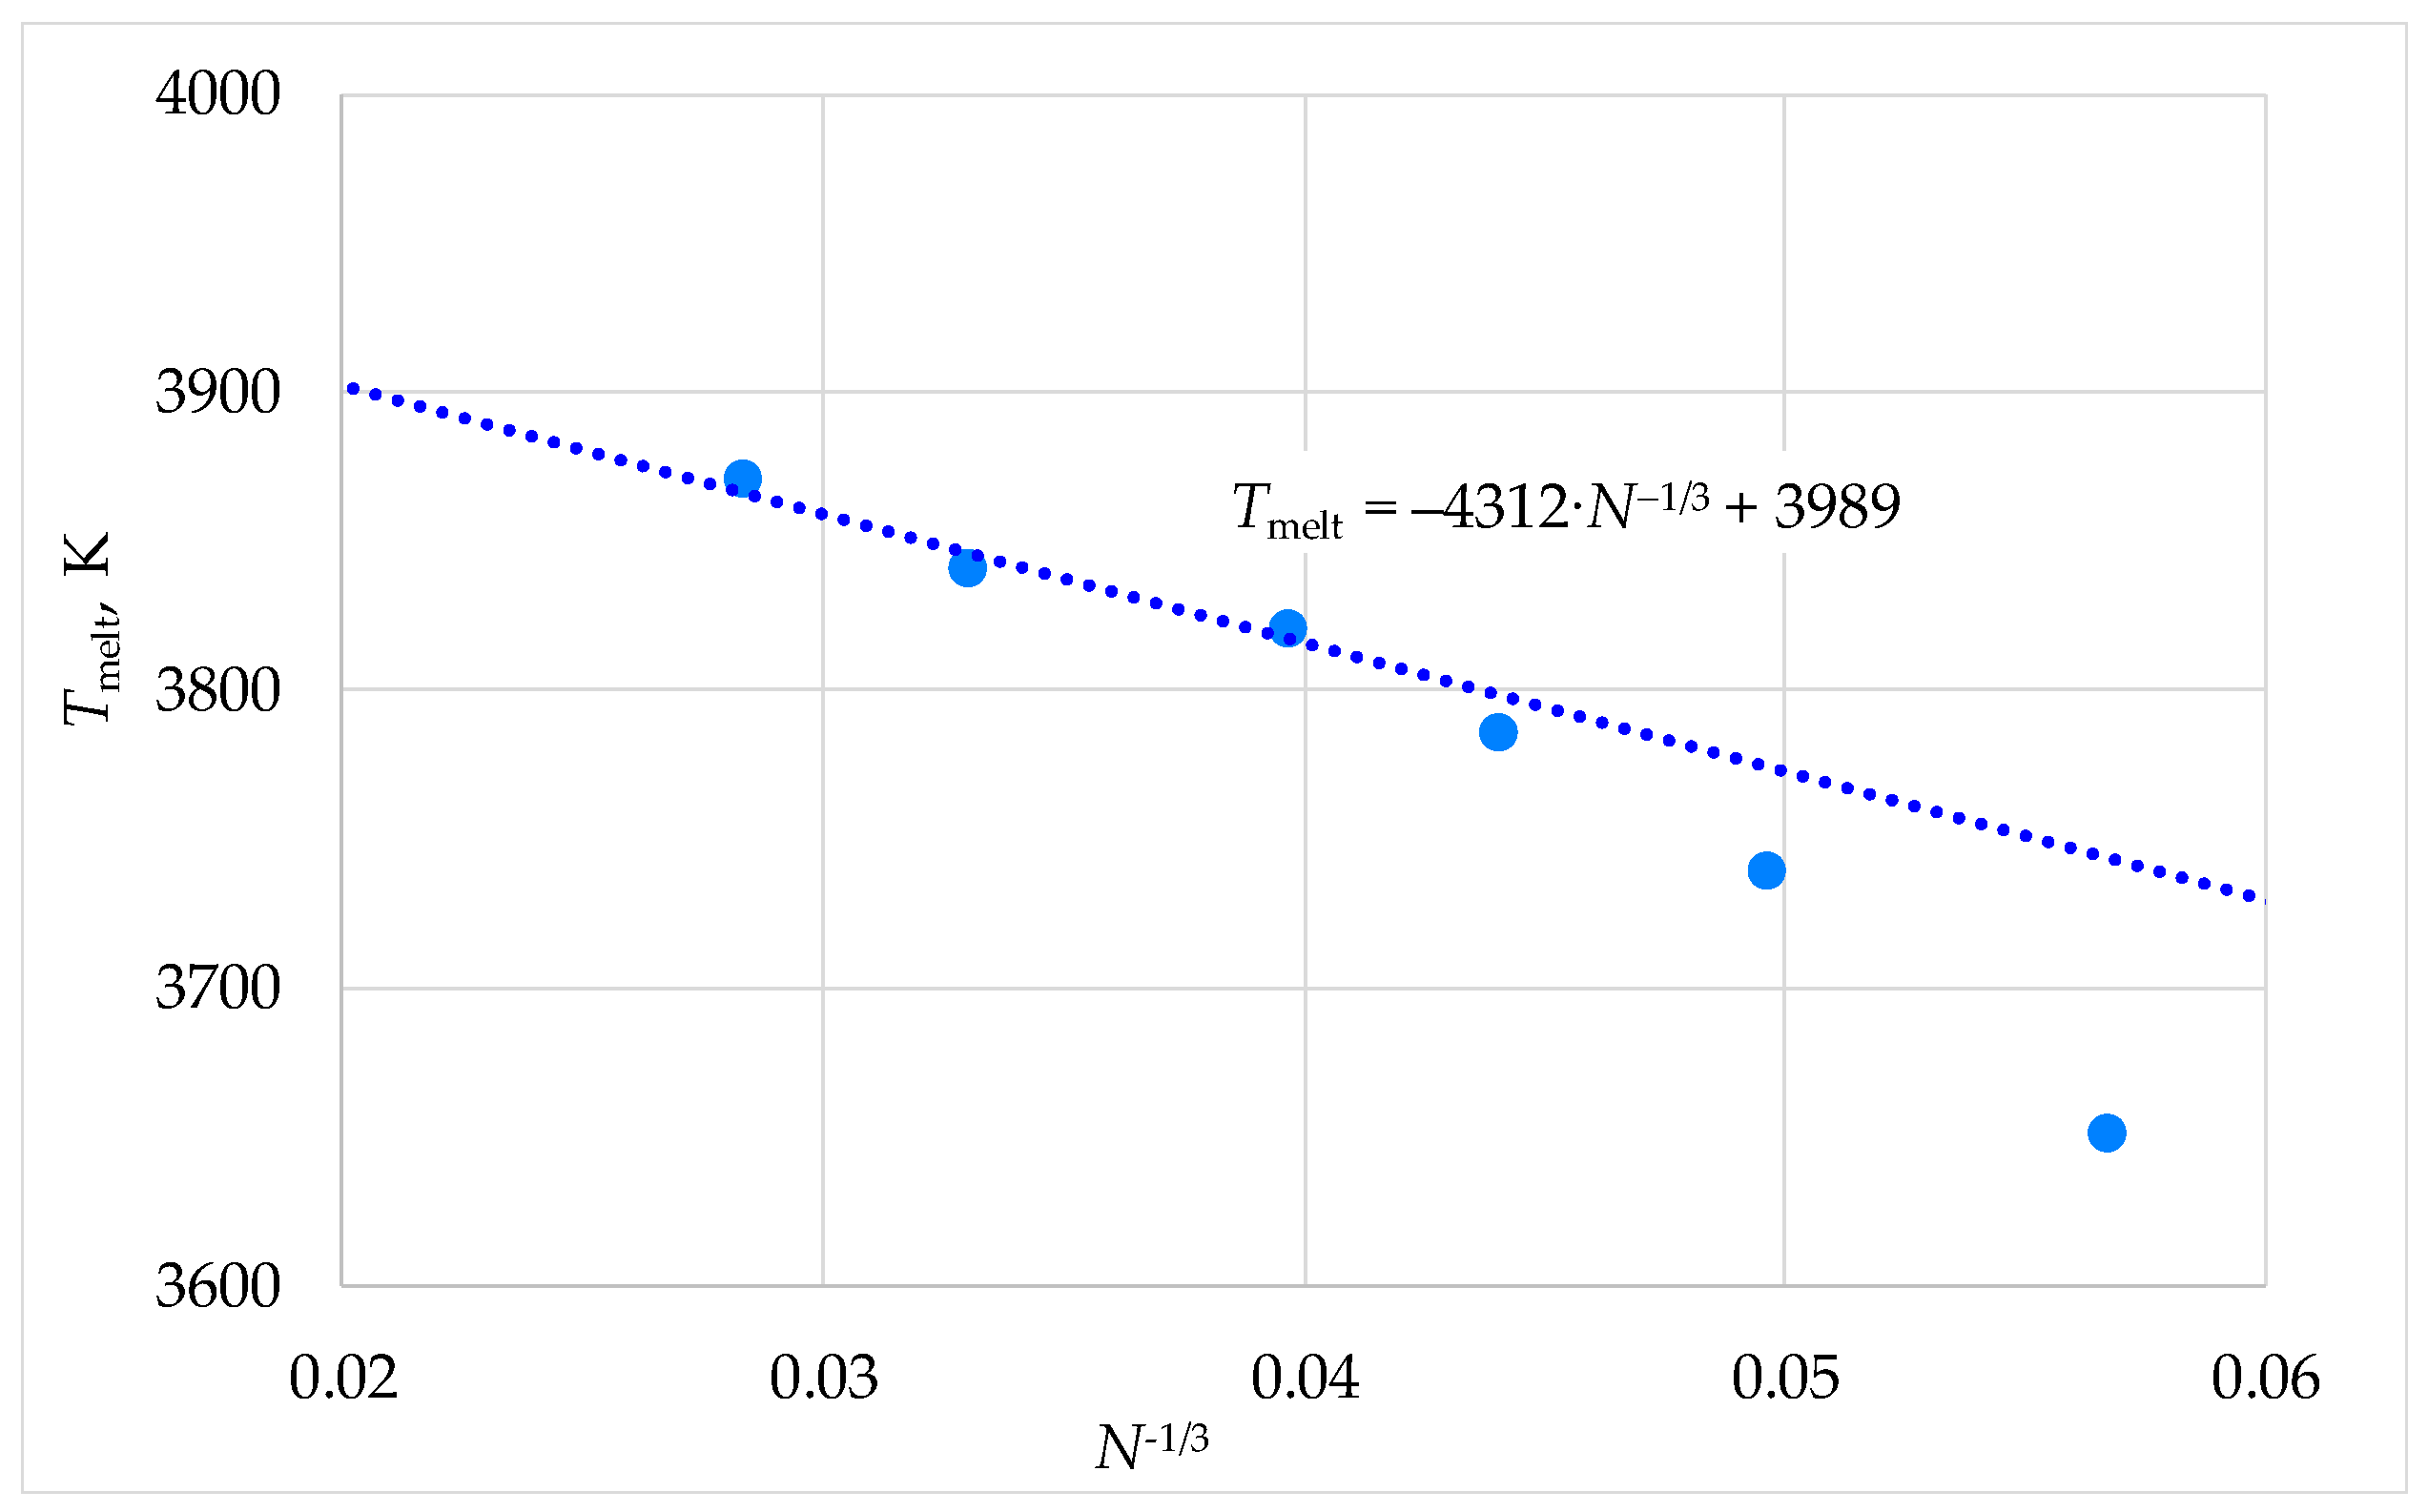
Figure 7.
Dependence of the diffusion coefficients of cations on the inverse tempera ture. Chemical formulas (Th3,Pu)O8, (Th,U,Pu2)O8, (Th,U3)O8 are used in the Legend as analogs of the formulas (Th0.75,Pu0.25)O2, (Th0.25,U0.25,Pu0.5)O2, (Th0.25,U0.75)O2.
Figure 7.
Dependence of the diffusion coefficients of cations on the inverse tempera ture. Chemical formulas (Th3,Pu)O8, (Th,U,Pu2)O8, (Th,U3)O8 are used in the Legend as analogs of the formulas (Th0.75,Pu0.25)O2, (Th0.25,U0.25,Pu0.5)O2, (Th0.25,U0.75)O2.
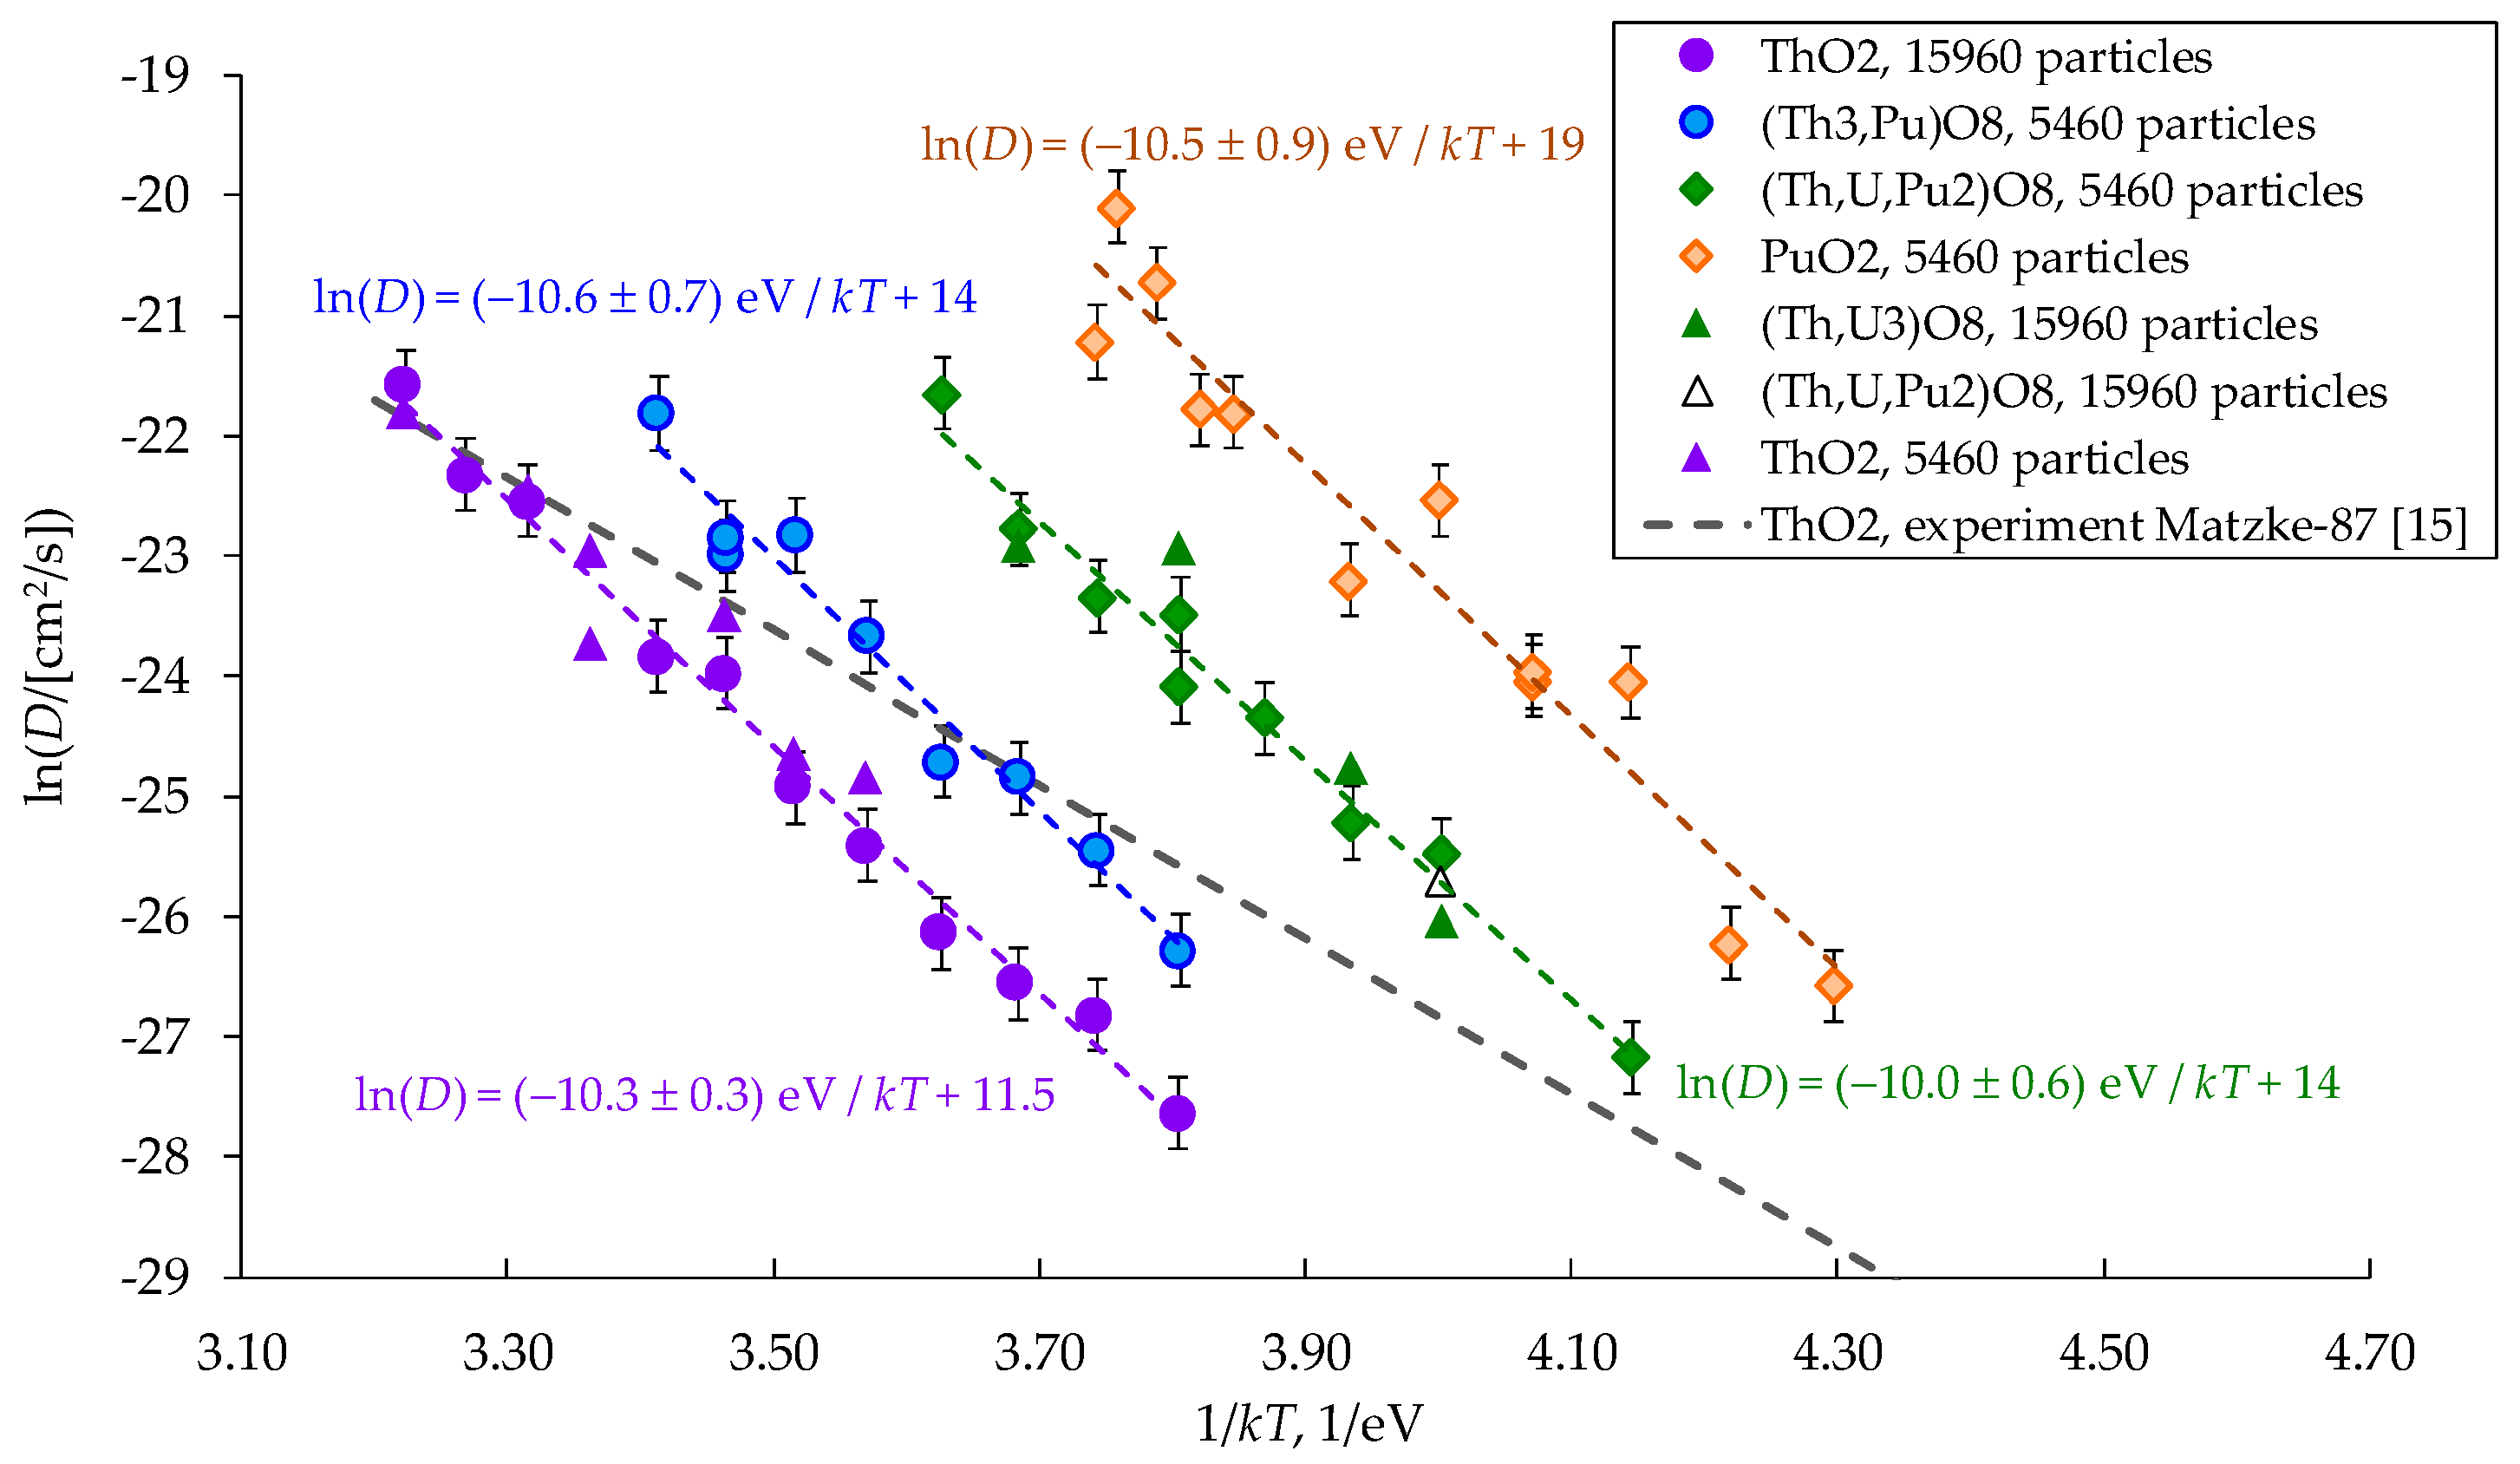
Figure 8.
Dependences of the diffusion coefficient of cations on the inverse reduced temperature T∞/T. The formulas (Th3,Pu)O8, (U,Th,Pu2)O8 are used in the Legend as analogs of the (Th0.75,Pu0.25)O2, (Th0.25,U0.25,Pu0.5)O2.
Figure 8.
Dependences of the diffusion coefficient of cations on the inverse reduced temperature T∞/T. The formulas (Th3,Pu)O8, (U,Th,Pu2)O8 are used in the Legend as analogs of the (Th0.75,Pu0.25)O2, (Th0.25,U0.25,Pu0.5)O2.
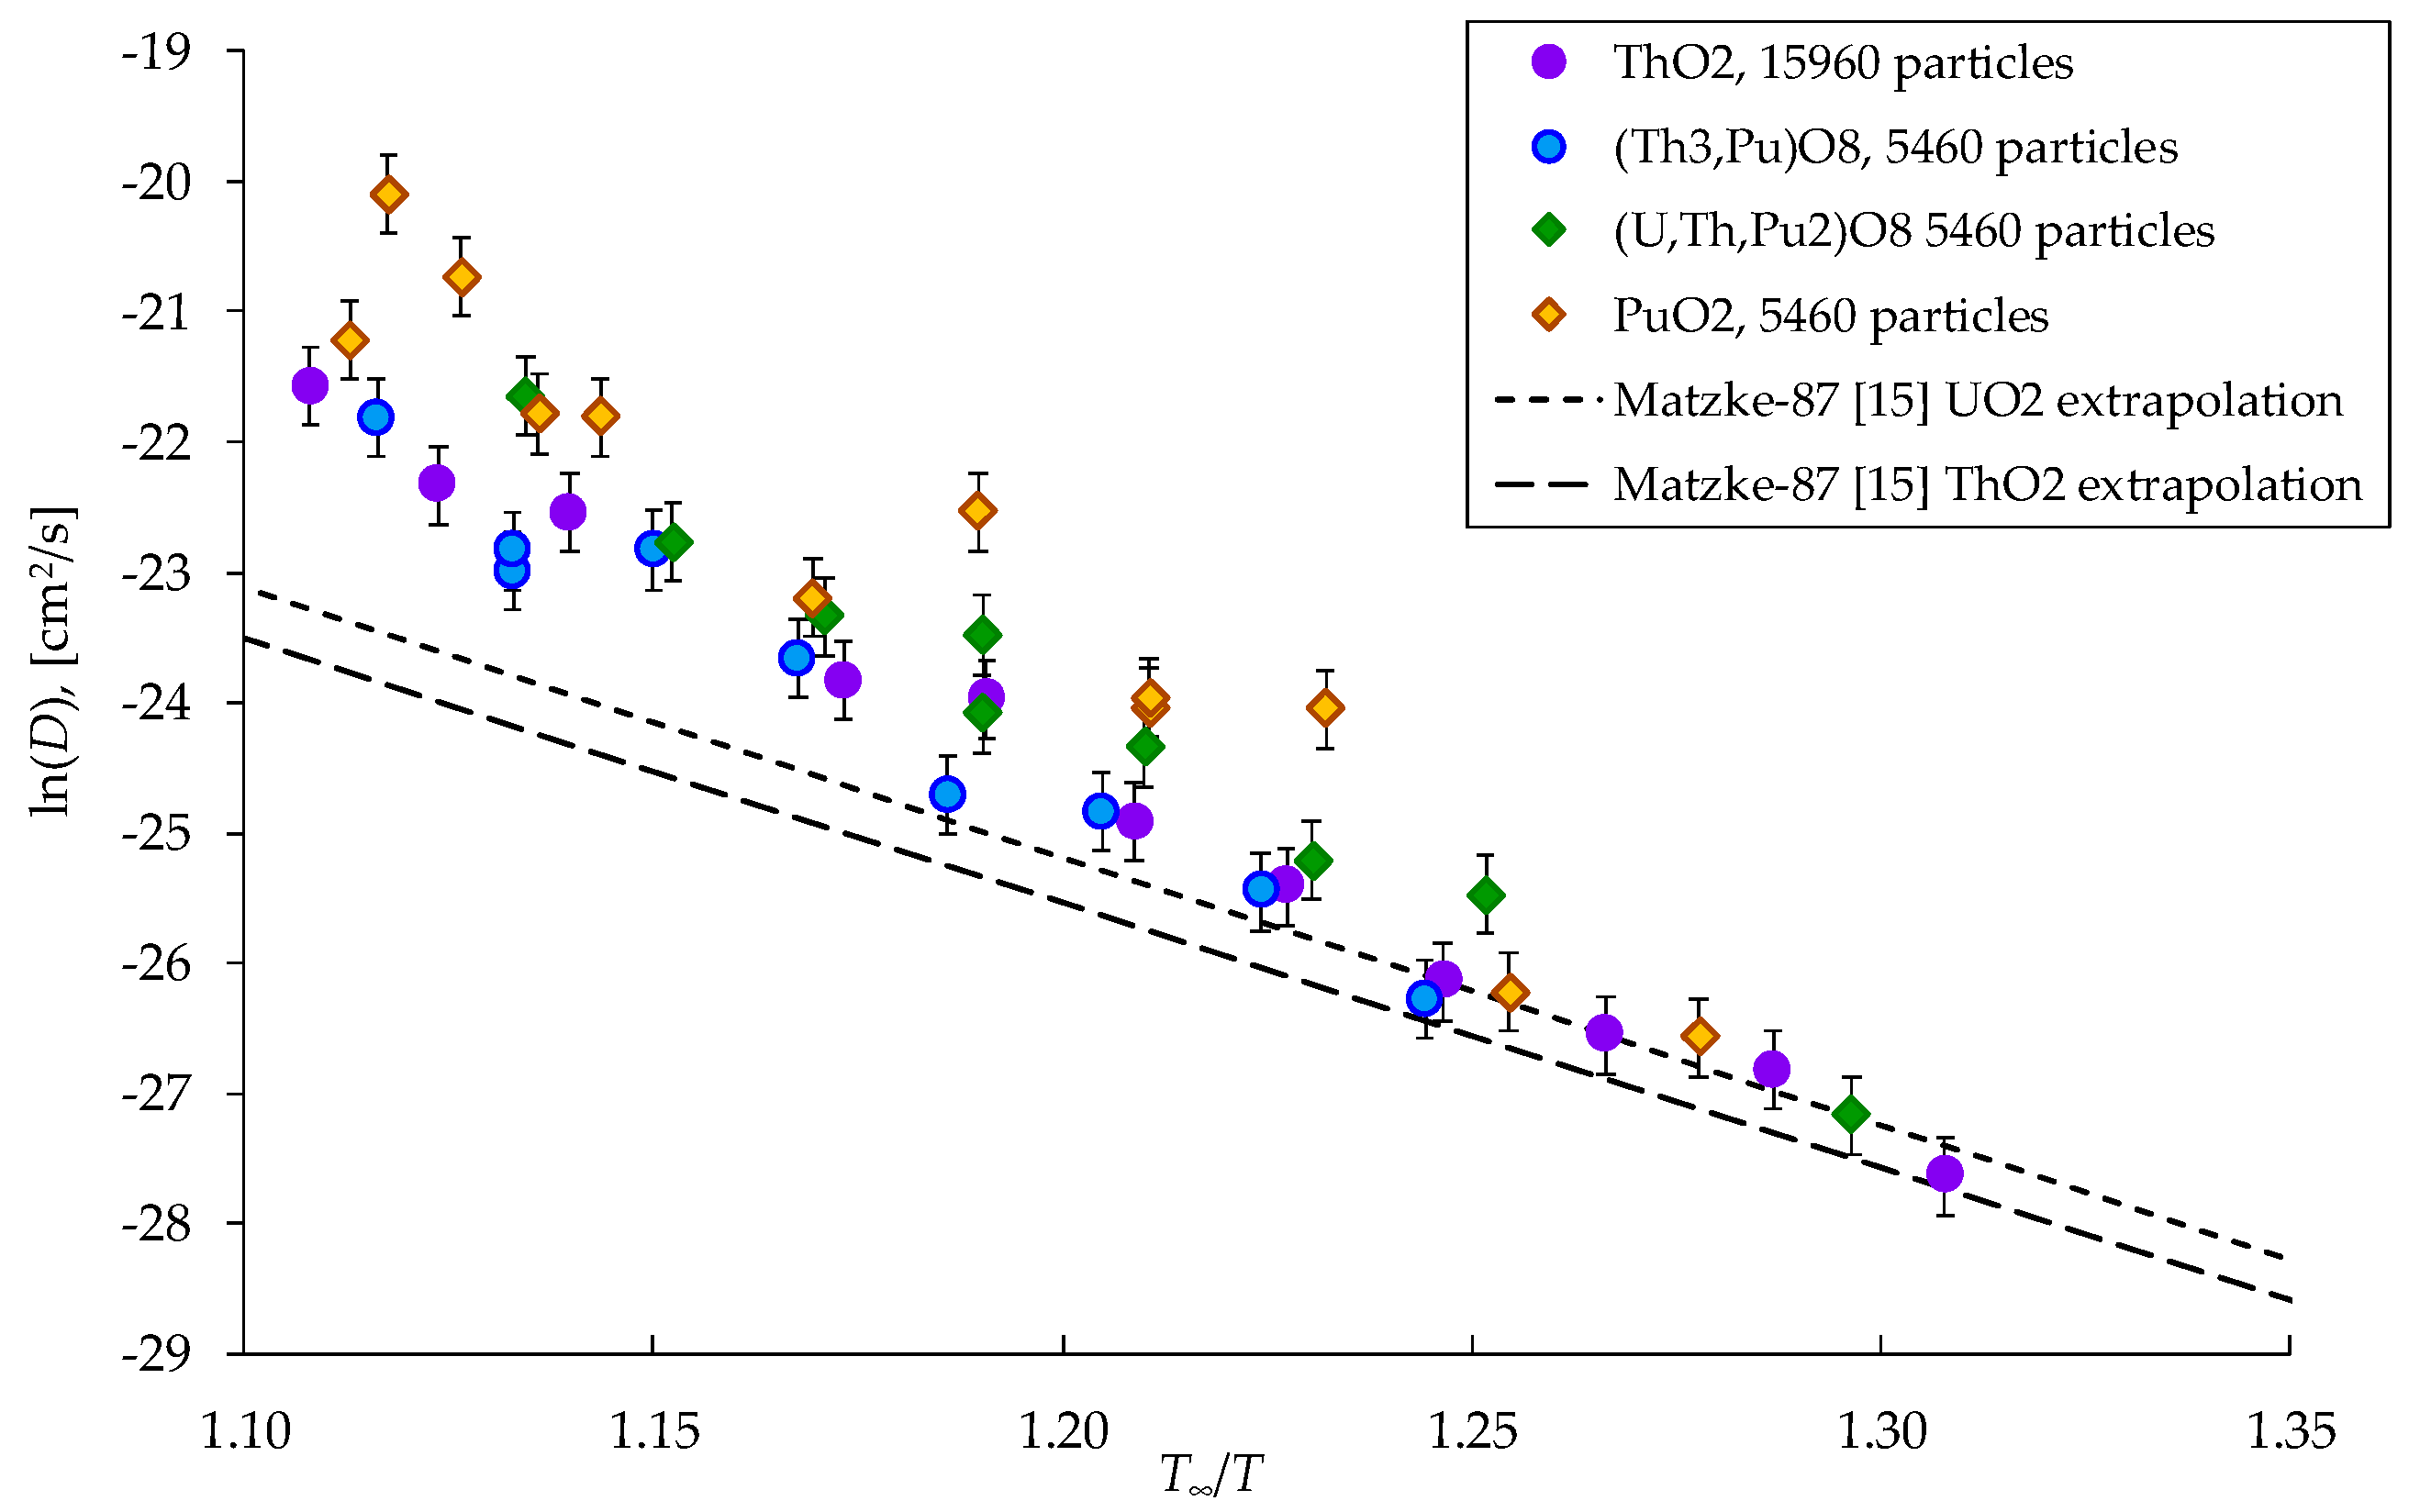

Table 1.
Estimation of melting points of macroscopic model crystals (UxPuyTh1−x−y)O2.
| Compound | T∞, K, present work | T∞, K, experiment |
| ThO2 | 3990 | 3665 ± 70 K [55] |
| (Th0.75Pu0.25)O2 | 3795 | – |
| (Th0.25U0.25Pu0.5)O2 | 3630 | – |
| PuO2 | 3450 | 3017 ± 28 K [56] |
Table 2.
Heat of fusion and surface energy of the model crystals (UxPuyTh1−x−y)O2.
| Compound | L, kJ/mol | γ, J/m2 |
| ThO2 | 37.1 | 4.40 |
| (Th0.75Pu0.25)O2 | 45.3 | 4.33 |
| (Th0.25U0.25Pu0.5)O2 | 65.1 | 3.94 |
| PuO2 | 68.2 | 4.20 |
Table 3.
The energies of intrinsic disordering and migration in UO2, PuO2 and ThO2.
| Mechanism of disor dering | Formation energy, eV | ||
| ThO2 | UO2 | PuO2 | |
| Unbound intersti tial anion and anion vacancy (EAF) | 4.5, MOX-07 [44] 6.8, GGA [77] 5.0, GGA [78] 9.8, GGA [65] 9.5, GGA [72] 2.3-4.7, exp [12] 4.42, exp [79] |
4.1, MOX-07 [30] 5.9, CRG [30] 4.0, GGA+U [60] 3.6, GGA [60] 4.5, GGA [65] 3.95, GGA+U [68] 5.8, GGA+U [66] 3.3, GGA+U [59] 3.6, GGA [63] 3.5±0.5, exp [14] 4.6, exp [80] |
3.9, this work 3.9, MOX-07 [30] 5.5, CRG [30] 5.5, CRG [70] 3.48, LDA+U [73] 5.3, GGA [63] 4.4, GGA, [76] 4.6, GGA+U, [71] 4.2, GGA [72] 9.8, GGA+U [74] 2.7-2.9, exp [12] |
| Classic Schottky trio V4− + 2V2+ (ESh) | 12.7, MOX-07 [44] 8.2, GGA [77] 8.05, GGA [78] 20.6, GGA, [65] |
8.9, this work 9.7, MOX-07 [30] 10.9, CRG [30] 7.2, GGA+U [60] 5.2, GGA [60] 7.2, GGA [65] 7.6, GGA+U [68] 6.0, GGA+U [59] 5.6, GGA [63] 6-7, exp [14] |
9.5, MOX-07 [30] 10.0, CRG [30] 10.4, CRG [70] 7.5, LDA+U [73] 9.1, GGA [63] 7.1, GGA [76] 6.09, GGA+U [71] 14.9, GGA+U [74] |
| Bound Schottky trio (V4−⋅2V2+)111 | 6.9, MOX-07 [44] 5.4, GGA [64] 4.5, GGA [78] 4.6, GGA [72] |
4.8, this work 4.8, MOX-07 [30] 5.0, CRG [30] 3.6, GGA [72] |
5.0, MOX-07 [30] 4.8, CRG [30] 4.8, CRG [70] 3.6, GGA [72] |
| Partially bound Schottky trio V4−⋅V2++V2+ | 9.7, MOX-07 [44] | 6.7, this work | 7.0, this work |
| Migration of a single cation vacancy V4− (height of potential barrier EM) | 5.45, this work 4.5, GGA [65] 5.7, GGA [72] |
3.1, GGA [65] 4.2, GGA+U [81] 3.6, GGA+U [59] 5.4, GGA [72] 2.4, exp [14] |
4.5, this work 3.4, CRG [70] 5.8, GGA [72] |
Disclaimer/Publisher’s Note: The statements, opinions and data contained in all publications are solely those of the individual author(s) and contributor(s) and not of MDPI and/or the editor(s). MDPI and/or the editor(s) disclaim responsibility for any injury to people or property resulting from any ideas, methods, instructions or products referred to in the content. |
© 2025 by the authors. Licensee MDPI, Basel, Switzerland. This article is an open access article distributed under the terms and conditions of the Creative Commons Attribution (CC BY) license (http://creativecommons.org/licenses/by/4.0/).
Copyright: This open access article is published under a Creative Commons CC BY 4.0 license, which permit the free download, distribution, and reuse, provided that the author and preprint are cited in any reuse.


