
Submitted:
06 May 2025
Posted:
07 May 2025
You are already at the latest version
Abstract
We experimentally studied the effect of a surfactant on the bubble formation on a superhydrophobic surface (SHS). The bubble was created by injecting gas through an orifice on the SHS at a constant flow rate in the quasi-static regime. The surfactant, 1-pentanol, was mixed with water at a concentration C ranging from 0 to 0.08 mol/L, corresponding to a surface tension ? ranging from 72 to 43 mN/m. We found that as C increased, bubble detachment volume (Vd) and maximum bubble base radius (Rdmax) decreased. For low surfactant concentration, the static contact angle ?0 remained nearly constant, and Vd and Rdmax decreased due to lower surface tensions, following the scaling laws: Rdmax~?1/2 and Vd~?3/2. The bubble shapes at different concentrations were self-similar. The bubble height, bubble base radius, radius at bubble apex, and neck radius, all scaled with the capillary length. For high surfactant concentration, however, ?0 was greatly reduced, and Vd and Rdmax decreased due to the combined effects of reduced ?0 and smaller ?. Last, we found that surfactant had a negligible impact on the forces acting on the bubble, except for reducing their magnitudes, and had little effect on the dynamics of bubble pinch-off, except for reducing the time and length scales. Overall, our results provide a better understanding of bubble formation on complex surfaces in complex liquids.
Keywords:
Bubble formation
; superhydrophobic surface
; surfactant
; surface tension
; contact angle
1. Introduction
Recently, the bio-inspired superhydrophobic surfaces (SHS) have been proven to be a new approach to control the bubble formation [1,2,3,4]. The SHS exhibits a large static contact angle of θ0>150° due to a combination of surface roughness and hydrophobic chemistry [5]. Due to the large θ0, the SHS facilitates the formation of larger bubbles than hydrophilic and hydrophobic surfaces. The SHS has found a wide range of applications, from reducing drag in turbulent flows [6,7,8], enhancing boiling heat transfer [1,2], and preventing engineered surfaces from biofouling [9] and icing [10]. Most of these applications take advantage of the presence of the gas layer on SHS. Understanding bubble formation on SHS could potentially provide new solutions to sustain the gas layer on the surface and thus benefit the broader applications of SHS. Furthermore, controlling bubble formation in liquid solutions is crucial for many other industrial and biomedical applications, including pool boiling heat transfer [11], surface cleaning [12], chemical processing [13], mineral particle recovery [14], and drug delivery [15].
Bubble formation due to gas injection through a nozzle or orifice has been extensively investigated [16,17]. The detached bubble volume (Vd) is affected by many parameters, including the liquid properties [18,19,20,21,22], surface tension [23], gravity [24], surface wettability [25,26,27], orifice configuration [28,29,30], and gas flow rate [31,32]. Depending on the gas flow rate Q, the bubble formation can be separated into two regimes [33]: quasi-static regime for small Q, and dynamic regime for large Q. In the quasi-static regime, the main forces acting on the bubble are due to surface tension and hydrostatic pressure, and Vd is independent of gas flow rate [33]. In the dynamic regime, the forces due to momentums of liquid and gas cannot be ignored, and Vd increases with gas flow rate [34]. Depending on surface wettability, bubble formation follows two modes [35]: pinning mode for well-wetting surfaces (i.e., hydrophilic) and de-pinning mode for poorly wetting surfaces (i.e., hydrophobic). In the pinning mode, the bubble base remains pinned at the rim of the orifice; whereas in the de-pinning mode, the bubble base expands beyond the orifice rim, leading to a larger Vd [36,37]. Furthermore, for hydrophobic surfaces, with increasing the static contact angle θ0, the bubble base radius increases, resulting in a larger Vd [35].
Bubble formation on SHS has received growing interest recently. A few researchers [38,39,40,41] investigated the effect of the size of SHS region on bubble formation at quasi-static regime. They found that with increasing the size of SHS, the bubble formation transitioned from the pinning mode where bubble base pins at the rim of SHS, to the de-pinning mode where the bubble base moves along the SHS. Breveleri et al. [42] studied the bubble formation on an SHS fabricated on a porous material and found an increased bubble size as increasing the pressure difference across the porous surface. Recently, O’Coin and Ling [43] examined the effect of gas flow rate on the bubble formation on SHS at the quasi-static regime, and found an increase of Vd with increasing the gas flow rate.
However, the effect of surfactants on bubble formation on the SHS has not been studied, despite the fact that surfactants are widely present in natural environments and are used in many engineering systems. Surfactants typically adsorb at the gas-liquid interface due to their amphiphilic properties and are well-known for reducing the surface tension. The effect of surfactants on bubble formation on nozzle and orifice has been extensively studied [44,45,46,47,48,49,50,51,52]. It is generally agreed that at low gas flow rate, a small amount of surfactant greatly reduces the detached bubble size due to the reduction of surface tension [49,51]. However, at high gas flow rate, due to the reduced time scale of bubble formation, the surfactants do not have sufficient time to reach the equilibrium concentration at the bubble surface. As a result, at high gas flow rate, the detached bubble size in surfactant solution is close to that in pure water [49]. In addition to reducing surface tension, surfactants have been shown to reduce the static contact angle of SHS [53,54]. Therefore, surfactants may significantly alter the bubble formation on SHS due to the changes in surface tension and static contact angle.
The goal of this experimental study is to investigate, for the first time, the effect of surfactants on bubble formation on SHS. We will use 1-pentanol as the surfactant model and focus on the bubble formation at a low gas flow rate. The time scale of bubble formation is much longer than the time for surfactant to reach the equilibrium concentration, rendering the effect of dynamic surface tension negligible. We will apply high-speed imaging to capture the bubble shape, measure the bubble geometrical parameters by processing the recorded images, and calculate the forces acting on the bubble. We will show that for low surfactant concentrations, the static contact angle θ0 remains nearly constant, the bubble shapes at different concentrations are self-similar, and the bubble size scales with the capillary length. However, for high surfactant concentration, θ0 is greatly reduced, the bubble size decreases due to a combination effect of smaller θ0 and smaller σ. We will also discuss the effect of 1-pentanol on the dynamics of bubble pinch-off and the forces acting on the bubble.
2. Materials and Methods
The experimental setup for measuring bubble formation in the surfactant solution is shown in Figure 1(a). This setup was also employed in our previous studies [41,43]. A transparent acrylic tank with an inner dimension of 100 mm by 100 mm was filled with the surfactant solution (density ρL=997 kg/m3) to the height of 70 mm. A superhydrophobic surface (SHS) with a dimension of 50 mm by 50 mm was installed at the bottom of the tank. The SHS was fabricated by sandblasting an aluminum surface with an abrasive medium of grit size 60 (particle mesh size 35 to 100), followed by spray-coating the textured surface with hydrophobic nanoparticles (SOFT99 Corp, Glaco Mirror Coat Zero). The aluminum surface was cleaned in an ultrasonic bath before and after the sandblasting. Figures 1(b-c) show the surface texture of the SHS obtained by scanning electron microscopy. Clearly, the SHS exhibited a combination of micro- and nano-scale surface roughness. When submerged in water, the SHS maintained a Cassie-Baxter state and trapped a thin layer of air. The experiments were performed at room temperature of T=25 °C.
The surfactant solution was prepared by mixing 1-pentanol (Sigma-Aldrich, #398268, >99%, CAS #71-41-0) with deionized (DI) water. We selected 1-pentanol as the surfactant model due to its well-characterized kineics of dynamic adsorption [55,56]. The concentration of 1-pentanol in the solution, denoted as C, ranged from 0 to 0.08 mol/L, where C=0 corresponded to pure water. Due to the low concentration used, the addition of surfactant to water caused no significant changes in physical properties, except for the surface tension. The equilibrium surface tension between the air and the 1-pentanol solution, denoted as σ, was measured using pendant droplet method [57]. Figure 2(a) shows the measured σ as a function of C. The results showed good agreement with the Szyszkowski model [58], expressed as:
where σ0 denotes the surface tension of pure water, is the ideal gas constant, T is the temperature, ω is the limiting partial molar area of the solute at the surface, and k is the solute adsorption coefficient. For 1-pentanol [58], ω=1.48×10⁵ m2/mol and k=66 L/mol. Furthermore, we estimated the time scale τe for reaching the equilibrium interfacial surfactant concentration based on the following model [59]:
where ka is the adsorption kinematic coefficient, kd is the desorption kinematic coefficient, and Γ∞ is the maximum interfacial surfactant concentration. For 1-pentanol solution with different concentrations, ka, kd and Γ∞ are constants [55,56]: ka=3.00×10⁻³ cm/s, kd=1.10×10² s–1, and Γ∞=5.90×10⁻¹⁰ mol/cm2. According to this model, for the current range concentration, τe<0.006 s, which is more than two orders of magnitude smaller than the time scale of bubbling period (~1 s). Therefore, we can safely assume that the surfactant concentration at the bubble surface reached equilibrium during the bubble formation.
σ = σ0 – T/ω ln(1+kC),
τe ~ (kaC/Γ∞ + kd)–1,
Figure 2(b) shows the static contact angle θ0 of the SHS as a function of C. The static contact angle was measured by sessile-drop-fitting method with a small droplet (~5 μL) seating on the surface [60]. With increasing C from 0 to 0.05 mol/L, there was only a slight decrease in the static contact angle from 159±2° to 155±2°. However, with further increasing the concentration to C=0.08 mol/L, θ0 decreased significantly to 131±2°, in consistent to the observation by Mohammadi et al. [53]. Previous studies [35] have also shown that for a bubble formation on a hydrophobic surface (θ0>90°), the detached bubble volume increased with increasing θ0. Therefore, as will be shown later, for low concentration C<0.05 mol/L where the change of θ0 is small, the detached bubble volume was mainly affected due to the change of surface tension. However, at high concentration C=0.08 mol/L, since θ0 was greatly reduced, the detached bubble volume decreased because of a combined effect of reduced surface tension and reduced θ0.
The bubble was created on the SHS by injecting air (density ρG=1.2 kg/m3) through a 0.5 mm diameter orifice located at the center of the SHS at a constant gas flow rate. A syringe pump (Model #NE-1010 SyringeONE, by New Era Pump System Inc.) was used to supply gas. To ensure the constant flow rate, the air passed through a long needle (152 mm in length, inner diameter 0.61 mm) before reaching the orifice. The bubble formation was recorded by a high-speed camera (PCO.dimax S4, pixel size 11 µm, 2016×2016 pixels) at a frame rate of 1000 frames per second. The spatial resolution of the imaging system was 34 µm/pixel. A collimated light (Thorlabs, model #QTH10, power 50 mW) was used for illumination. The data was recorded after a series of bubbles had formed and detached from the surface. The light was switched on briefly and did not change the temperature of the solution. The size of the bubble was much smaller than the tank. We expect that the side walls of the tank had a negligible impact on the bubbe formation. The bubble formation was in the single-bubbling regime, and previously formed bubbles had minimal influence on the observed one.
Table 1 summarizes the main experimental parameters, including 1-pentanol concentration (C), surface tension (σ), and static contact angle (θ0). The key experimental results, including the maximum bubble base radius (Rbmax) and bubble detached volume (Vd), are also provided in the table. Rbmax can be analogized to the nozzle radius for a bubble detached from a nozzle. We calculated the critical gas flow rate for the transition from the quasi-static regime to the dynamic regime as [33]: Qcr=π(16/3g2)1/6(σRbmax/ρL)5/6, where g=9.78 m2/s is the gravitational acceleration. In the current study, the gas flow rate was Q<30 mL/min, corresponding to Q/Qcr<0.07. The Weber number We=ρLQ2/πσRbmax3 (ratio of gas momentum to surface tension) did not exceed 2×10⁻³. At this small flow rate, the bubble formation was in the quais-static regime, and Q had little influence on the detached bubble volume [43]. The capillary length scale, defined as lσ=(σ/ρLg)0.5, is also provided in Table 1.
3. Results and Discussion
Figure 3 shows the time evolution of bubble shapes for five different 1-pentanol concentrations: C=0, 0.01, 0.02, 0.05, and 0.08 mol/L. With increasing C, the bubble size, along with the detached volume, gradually decreased. For all cases, the bubble formation processed through two stages: an initial expansion stage and a final necking stage. During the expansion stage (0<t<0.99T0), the bubble grew in both horizontal and vertical directions due to the gas injection. The bubble was in the quasi-static condition due to the balance between surface tension and hydrostatic pressure. However, during the necking stage (0.99T0<t<T0), the bubble reached its maximum equilibrium volume and can no longer maintain the quasi-static condition. Instead, the bubble shape changed dramatically under the impact of surface tension and buoyancy. The necking process can be characterized by the formation of a neck near the bubble base and the rapid reduction of the neck radius. The necking stage occupied a very small portion of the whole bubbling period. In all cases, due to the constant gas flow rate, the bubble volume increased linearly with time.
Figure 4(a) shows the maximum bubble base radius (Rbmax) as a function of C. Clearly, with increasing C, Rbmax reduced due to the reduced surface tension. A similar trend was observed for a hydrophobic surface made of Teflon by Mirsandi et al. [26]. Figure 4(b) shows the bubble detached volume (Vd) as a function of C. For comparison, the Tate volume [61]: VT=2πRbmaxσ/(ρL−ρG)g, derived based on the balance between surface tension force and buoyancy force, was also plotted. Note, the effect of contact angle in the expression of Tate Volume was ignored. Clearly, the trend that Vd decreased with increasing C was captured by VT. The agreement suggests that reduction of Vd results from two factors: the decrease in σ and the decrease in Rbmax.
Figure 4(c) and (d) show Rbmax/lσ and Vd/lσ3 as a function of C, respectively. Interestingly, for low concentration C<0.05 mol/L, Rbmax/lσ and Vd/lσ3 were nearly constant, suggesting that the capillary length was a proper length scale for normalization. Therefore, we derive the scaling laws for Rbmax and Vd in terms of surface tension as:
Rbmax ~ lσ ~ σ1/2
Vd ~ lσ3 ~ σ3/2
To confirm the proposed scaling relations, Figure 5(a) and (b) present Rbmax and Vd as a function of σ, respectively. Clearly, for C<0.05 mol/L, the two scaling laws had good agreement with the measurements. However, for the highest concentration C=0.08 mol/L, both Rbmax and Vd were much smaller than the prediction based on the scaling laws. This is attributed to the fact that, at the highest concentration, the static contact angle was significantly reduced, leading to a further decrease in Rbmax and Vd.
Figure 6 shows the evolutions of the bubble geometrical parameters including bubble height H, bubble base radius Rb, and radius at the bubble apex Ra, as a function of bubble volume V for four different 1-pentanol concentrations: C=0, 0.02, 0.05, and 0.08 mol/L. In Figure 6(a) to (c), results are shown in the dimensional form. In Figure 6(d) to (f), results are shown in the dimensionless form, where lσ was chosen as the characterized length scale for normalization. Since the volume was linearly proportional to time, the curves had the same trends when plotted as a function of time. To measure these geometrical parameters, we employed an image processing method described in our previous work [41]. The procedure mainly involved a binarization of the image based on an intensity threshold to segment the region belong to the bubble. V was calculated by accumulating the cross-section area at each height level from the bottom to the top of the bubble. Ra was determined by fitting the bubble apex with a circle of radius Ra.
As shown in Figure 6, the curves had similar trends regardless the value of C. During the bubble growing period, with increasing volume, H increased linearly with V, Ra gradually decreased, and Rb experienced an initial increase due to bubble expansion along the horizontal surface and then became nearly constant. During the necking period, with keep increasing volume, all geometrical parameters changed dramatically, including a sudden increase in H and Ra, and a sudden decrease in Rb due to the retraction of the contact line along the surface. With increasing C, all the geometrical parameters decreased due to the reduction in surface tension and static contact angle. Interestingly, as shown in Figure 6(d) to (f), when showing the results in the dimensionless form, for low 1-pentanol concentrations C<0.05 mol/L, the curves collapsed. This result implies that, for low concentrations C<0.05 mol/L, bubble shapes are self-similar. The capillary length was an appropriate scale for normalization, and the surfactant did not affect the kinematics of the bubble formation, expect for reducing the length scale. For the highest concentration C=0.08 mol/L, the normalized curves did not overlap with others. This deviation is likely due to the significantly lower static contact angle compared to the other cases.
Figure 7 shows the evolution of contact angle (θb) at the bubble base as a function of bubble volume for four different 1-pentanol concentrations. θb was measured by applying a second-order polynomial fitting to the bubble shape near the contact point with the solid surface. Clearly, for C<0.05 mol/L, as the bubble volume increased and as the bubble base expanded along the horizontal surface, θb was nearly a constant, in consistent to the observation by Rubio-Rubio et al. [38]. Furthermore, with increasing C, the trend of θb was consistent to the trend of θ0. For low 1-pentanol concentrations C<0.05 mol/L, the effect of C on θb was small. For the highest 1-pentanol concentrations C=0.08 mol/L, θb was much smaller than other cases.
Figure 8(a) shows the evolution of bubble shape just before the detachment (or pinch-off) for C=0. The time to bubble pinch-off was defined as τ, with =0 as the time of pinch-off. A neck formed near the base of the bubble at τ~20 ms. With approaching to the pinch-off, the neck radius decreased at an accelerated rate. We measured the minimum neck radius and defined it as Rn. Figure 8(b) shows the time evolutions of Rn for four different values of C. For all cases, as expected, Rn decreased to 0 as τ approached to 0. Moreover, with increasing C, in agree with smaller bubble size, Rn decreased. However, as shown in Figure 8(c), after normalizing Rn by Rbmax and τ by the capillary-inertia time scale τn=(ρLRbmax 3/σ)0.5, all the profiles collapsed nicely and roughly agree with the trends observed for pinch-off of bubble from a nozzle [62]. All profiles exhibited a power-law relation: Rn ~ τn0.57, where the exponent 0.57 is consistent with values reported in the literature [62,63,64,65] for the pinch-off of a bubble from a nozzle. This result suggests that the necking process was primarily driven by liquid inertia [63], and the surface tension had a negligible impact on the dynamics of necking, expect for reducing the length and time scales.
Finally, following our previous work [41], we performed a force balance analysis for the bubble. In the current study, since the gas flow rate was low and the bubble formation was in quasi-static regime, the dynamic forces due to the momentums and viscosities of gas and liquid were negligible. we mainly calculated three static forces acting on the bubble including: (1) the pressure force FP=(2σ/Ra+ρGgH)πRb2 mainly caused by the surface tension at the bubble apex; (2) the surface tension force FS=−2πRbσsinθb applied at the rim of bubble base; and (3) the buoyancy force FB=(ρL−ρG)gV−ρLgHπRb2 due to the imbalance of hydrostatic pressure applied on the bubble surface. Note, FP is in the upward direction since the pressure in the bubble is higher than that in the liquid due to surface tension, and FB is in the downward direction since the hydrostatic pressure applied on the bubble is in the downward direction.
Figure 9(a) and (b) show the three forces (FP, FS, and FB) as well as their summation FP+FB+FS as a function of bubble volume for two 1-pentanol concentrations: C=0 and 0.08 mol/L, respectively. The forces were normalized by the buoyancy force (ρL−ρG)gVd, which was corresponded to the detached bubble volume. Clearly, regardless of the value of C, the growth of bubble was governed by similar forces: one lifting force FP, and two retaining forces FS and FB. The three forces were roughly in balance (FP+FB+FS was close to 0). As bubble volume increases, the magnitudes of FP and FB increased linearly with volume, while FS quickly reached to a nearly constant value. This result confirms that the dynamics forces due to the momentums of the injected gas and the surrounding liquid were negligible. Furthermore, this result suggests that surface tension and static contact angle had little impact on the dynamics of bubble formation, except for reducing the magnitude of the forces.
4. Conclusions
In summary, we experimentally investigated the effect of 1-pentanol on bubble formation on superhydrophobic surfaces (SHS) in the quasi-static regime. To quantify the bubble formation, we measured various geometrical parameters, including bubble height, bubble base radius, radius at bubble apex, contact angle, neck radius, and detached volume. We also calculated the forces acting on the bubble based on these geometry parameters. Our key findings are summarized below:
- As surfactant concentration increased, all bubble geometrical parameters, including the bubble detached size, decreased.
- For low surfactant concentrations, θ0 remained nearly constant, bubble shapes at different concentrations are self-similar, and Rdmax and Vd decreased following the scaling laws: Rdmax~σ1/2 and Vd~σ3/2, respectively.
- For high surfactant concentrations, θ0 greatly reduced, Rdmax and Vd decreased due to the combined effects of reduced surface tension and lower static contact angle.
- Surfactant had little impact on the dynamics of bubble pinch-off, except for reducing the time and length scales. The minimum neck radius followed a power-law relation, Rn~τ0.57, similar to that observed for the bubble pinch-off from a nozzle.
- Surfactant had negligible impact on the forces acting on bubble, except for reducing their magnitudes. The growth of bubble was governed by a balance between surface tension and hydrostatic pressure.
Overall, our results provide deeper insight into bubble formation on complex surfaces in complex solutions. However, our study is limited to one type of surfactant (nonionic 1-pentanol), one type of SHS, and quasi-static regime. Future studies should investigate the effects of surfactant types (anionic, cationic, and nonionic), texture geometries of the SHS, and gas flow rate on the bubble formation.
Conflict of Interest statement
The authors declare that they have no known competing financial interests or personal relationships that could have appeared to influence the work reported in this paper.
Acknowledgments
We thank the support of National Science Foundation under Grant No. 2041479 and 2339606, and University of Massachusetts OTCV Technology Development Fund, and University of Massachusetts Dartmouth Internal Seed Fund.
References
- Searle, M.; Emerson, P.; Crockett, J.; Maynes, D. Influence of microstructure geometry on pool boiling at superhydrophobic surfaces. Int. J. Heat Mass Transf. 2018, 127, 772–783. [Google Scholar] [CrossRef]
- Betz AR, Jenkins J, Kim C-J “CJ”, Attinger D. 2013 Boiling heat transfer on superhydrophilic, superhydrophobic, and superbiphilic surfaces. Int J Heat Mass Transf 57, 733–741. [CrossRef]
- Lim, C.S.; Di Sia, G.; Hung, Y.M. Extraordinary enhancement of nucleate pool boiling on intrinsically biphilic graphene nanostructured surfaces. Appl. Therm. Eng. 2022, 218. [Google Scholar] [CrossRef]
- Huynh, S.H.; Zahidi, A.A.A.; Muradoglu, M.; Cheong, B.H.-P.; Ng, T.W. Plastron-Mediated Growth of Captive Bubbles on Superhydrophobic Surfaces. Langmuir 2015, 31, 6695–6703. [Google Scholar] [CrossRef] [PubMed]
- Mohammadshahi, S.; Breveleri, J.; Ling, H. Fabrication and characterization of super-hydrophobic surfaces based on sandpapers and nano-particle coatings. Colloids Surfaces A: Physicochem. Eng. Asp. 2023, 666. [Google Scholar] [CrossRef]
- Mohammadshahi, S.; O'Coin, D.; Ling, H. Impact of sandpaper grit size on drag reduction and plastron stability of super-hydrophobic surface in turbulent flows. Phys. Fluids 2024, 36. [Google Scholar] [CrossRef]
- Cheng, X.; Wang, X.; Jiang, N. Experimental investigation on the modified coherent structures in the turbulent boundary layer by superhydrophobic surface. Phys. Fluids 2025, 37. [Google Scholar] [CrossRef]
- Ling, H.; Srinivasan, S.; Golovin, K.; McKinley, G.H.; Tuteja, A.; Katz, J. High-resolution velocity measurement in the inner part of turbulent boundary layers over super-hydrophobic surfaces. J. Fluid Mech. 2016, 801, 670–703. [Google Scholar] [CrossRef]
- Elius; Richard, S. ; Boyle, K.; Chang, W.-S.; Moisander, P.H.; Ling, H. Impact of gas bubbles on bacterial adhesion on super-hydrophobic aluminum surfaces. Results Surfaces Interfaces 2024, 15. [Google Scholar] [CrossRef]
- Zhang C, Pei K, Zhao J, Zhou Y, Zhang S, Han X, Guo Z. 2025 Hierarchical dandelion-like superhydrophobic surfaces with excellent stability and photothermal performance for efficient anti-/deicing. Chemical Engineering Journal 510, 161582. [CrossRef]
- Guan, S.Y.; Zhang, Z.H.; Wu, R.; Gu, X.K.; Zhao, C.Y. Pool boiling inside micro-nano composite pores: Thermofluids behaviors and heat transfer enhancement. Appl. Phys. Lett. 2024, 124. [Google Scholar] [CrossRef]
- Corbett, C.; Wang, Q.; Smith, W.; Liu, W.; Walmsley, A.D. Cleaning effects due to shape oscillation of bubbles over a rigid boundary. Phys. Fluids 2023, 35. [Google Scholar] [CrossRef]
- Cheng H Bin, Lu YW. 2014 Applications of textured surfaces on bubble trapping and degassing for microfluidic devices. Microfluid Nanofluidics 17, 855–862. [CrossRef]
- Zeng, L.; Lu, J.; Tryggvason, G. A numerical study of the capture of hydrophobic particles by a buoyant bubble. Phys. Fluids 2025, 37. [Google Scholar] [CrossRef]
- Roovers, S.; Segers, T.; Lajoinie, G.; Deprez, J.; Versluis, M.; De Smedt, S.C.; Lentacker, I. The Role of Ultrasound-Driven Microbubble Dynamics in Drug Delivery: From Microbubble Fundamentals to Clinical Translation. Langmuir 2019, 35, 10173–10191. [Google Scholar] [CrossRef] [PubMed]
- Kulkarni, A.A.; Joshi, J.B. Bubble Formation and Bubble Rise Velocity in Gas−Liquid Systems: A Review. Ind. Eng. Chem. Res. 2005, 44, 5873–5931. [Google Scholar] [CrossRef]
- Li, S.; Xiao, H.; Wang, Z.; Zhang, H.; Chen, A.; Huang, Q.; Yang, C. Theoretical model for predicting bubble formation from submerged orifices. Chem. Eng. J. 2024, 496. [Google Scholar] [CrossRef]
- Terasaka, K.; Tsuge, H. Bubble formation at a single orifice in non-Newtonian liquids. Chem. Eng. Sci. 1991, 46, 85–93. [Google Scholar] [CrossRef]
- Vafaei, S.; Wen, D. Spreading of triple line and dynamics of bubble growth inside nanoparticle dispersions on top of a substrate plate. J. Colloid Interface Sci. 2011, 362, 285–291. [Google Scholar] [CrossRef]
- Vafaei, S.; Wen, D. Effect of Gold Nanoparticles on the Dynamics of Gas Bubbles. Langmuir 2010, 26, 6902–6907. [Google Scholar] [CrossRef]
- Ji, B.; Yang, Z.; Feng, J. Oil-coated bubble formation from submerged coaxial orifices. Phys. Rev. Fluids 2021, 6, 033602. [Google Scholar] [CrossRef]
- Zhou, Y.; Ji, B.; Zhao, C.; Bo, H. Bubble formation from a submerged orifice in a thin liquid layer: Detachment and bursting. Phys. Fluids 2021, 33, 013305. [Google Scholar] [CrossRef]
- Jia, M.; Pang, M. Influence of wettability and surface tension on bubble formation from a needle. Asia-Pacific J. Chem. Eng. 2024. [CrossRef]
- Zhang, Q.; Mo, D.; Moon, S.; Janowitz, J.; Ringle, D.; Mays, D.; Diddle, A.; Rexroat, J.; Lee, E.; Luo, T. Bubble nucleation and growth on microstructured surfaces under microgravity. npj Microgravity 2024, 10, 1–10. [Google Scholar] [CrossRef]
- Heidarian, A.; Sun, B.; Soria, J. Effects of nozzle size and surface hydrophobicity on microbubble generation. Phys. Fluids 2025, 37. [Google Scholar] [CrossRef]
- Mirsandi, H.; Smit, W.J.; Kong, G.; Baltussen, M.W.; Peters, E.A.J.F.; Kuipers, J.A.M. Influence of wetting conditions on bubble formation from a submerged orifice. Exp. Fluids 2020, 61, 83. [Google Scholar] [CrossRef]
- Corchero, G.; Medina, A.; Higuera, F. Effect of wetting conditions and flow rate on bubble formation at orifices submerged in water. Colloids Surfaces A: Physicochem. Eng. Asp. 2006, 290, 41–49. [Google Scholar] [CrossRef]
- Xie, J.; Zhu, X.; Liao, Q.; Wang, H.; Ding, Y.-D. Dynamics of bubble formation and detachment from an immersed micro-orifice on a plate. Int. J. Heat Mass Transf. 2012, 55, 3205–3213. [Google Scholar] [CrossRef]
- Mohseni, E.; Kalayathine, J.J.; Reinecke, S.F.; Hampel, U. Dynamics of bubble formation at micro-orifices under constant gas flow conditions. Int. J. Multiph. Flow 2020, 132. [Google Scholar] [CrossRef]
- Hanafizadeh, P.; Sattari, A.; Hosseini-Doost, S.E.; Nouri, A.G.; Ashjaee, M. Effect of orifice shape on bubble formation mechanism. Meccanica 2018, 53, 2461–2483. [Google Scholar] [CrossRef]
- Qu, C.; Yu, Y.; Zhang, J. Experimental study of bubbling regimes on submerged micro-orifices. Int. J. Heat Mass Transf. 2017, 111, 17–28. [Google Scholar] [CrossRef]
- Zhang, J.; Yu, Y.; Qu, C.; Zhang, Y. Experimental study and numerical simulation of periodic bubble formation at submerged micron-sized nozzles with constant gas flow rate. Chem. Eng. Sci. 2017, 168, 1–10. [Google Scholar] [CrossRef]
- Oguz, H.N.; Prosperetti, A. Dynamics of bubble growth and detachment from a needle. J. Fluid Mech. 1993, 257, 111–145. [Google Scholar] [CrossRef]
- Ma, J.; Li, J.; Zhou, P.; Song, Y.; Chai, L.; Zhou, C.Q. A viewpoint on the dynamics of bubble formation from a submerged nozzle. Eur. J. Mech. - B/Fluids 2019, 78, 276–283. [Google Scholar] [CrossRef]
- Gerlach, D.; Biswas, G.; Durst, F.; Kolobaric, V. Quasi-static bubble formation on submerged orifices. Int. J. Heat Mass Transf. 2005, 48, 425–438. [Google Scholar] [CrossRef]
- Hecht, K.J.; Velagala, S.; Easo, D.A.; Saleem, M.A.; Krause, U. Influence of Wettability on Bubble Formation from Submerged Orifices. Ind. Eng. Chem. Res. 2019, 59, 4071–4078. [Google Scholar] [CrossRef]
- Gnyloskurenko, S.; Byakova, A.; Nakamura, T.; Raychenko, O. Influence of wettability on bubble formation in liquid. J. Mater. Sci. 2005, 40, 2437–2441. [Google Scholar] [CrossRef]
- Rubio-Rubio, M.; Bolaños-Jiménez, R.; Martínez-Bazán, C.; Muñoz-Hervás, J.; Sevilla, A. Superhydrophobic substrates allow the generation of giant quasi-static bubbles. J. Fluid Mech. 2021, 912. [Google Scholar] [CrossRef]
- Pereira, J.; Cautela, R.; Moita, A.; Moreira, A. Effect of the Size of the Superhydrophobic Regions of Biphilic Surfaces on the Bubble Dynamics. Symmetry 2023, 15, 949. [Google Scholar] [CrossRef]
- Qiao, S.; Cai, C.; Chen, W.; Pan, C.; Liu, Y. Control of the shape of bubble growth on underwater substrates with different sizes of superhydrophobic circles. Phys. Fluids 2022, 34, 067110. [Google Scholar] [CrossRef]
- O'Coin, D.; Ling, H. Dynamics of bubble formation on superhydrophobic surface under a constant gas flow rate at quasi-static regime. Phys. Fluids 2024, 36. [Google Scholar] [CrossRef]
- Breveleri, J.; Mohammadshahi, S.; Dunigan, T.; Ling, H. Plastron restoration for underwater superhydrophobic surface by porous material and gas injection. Colloids Surfaces A: Physicochem. Eng. Asp. 2023, 676. [Google Scholar] [CrossRef]
- O'Coin, D.; Ling, H. Effect of gas flow rate on bubble formation on superhydrophobic surface. Droplet 2025, 4. [Google Scholar] [CrossRef]
- Xu, Q.; Nakajima, M.; Ichikawa, S.; Nakamura, N.; Roy, P.; Okadome, H.; Shiina, T. Effects of surfactant and electrolyte concentrations on bubble formation and stabilization. J. Colloid Interface Sci. 2009, 332, 208–214. [Google Scholar] [CrossRef]
- Loubière, K.; Hébrard, G. Influence of liquid surface tension (surfactants) on bubble formation at rigid and flexible orifices. Chem. Eng. Process. - Process. Intensif. 2004, 43, 1361–1369. [Google Scholar] [CrossRef]
- Kukizaki, M.; Baba, Y. Effect of surfactant type on microbubble formation behavior using Shirasu porous glass (SPG) membranes. Colloids Surfaces A: Physicochem. Eng. Asp. 2008, 326, 129–137. [Google Scholar] [CrossRef]
- Zhang, X.; Uddin, H.; Yang, H.; Toikka, G.; Ducker, W.; Maeda, N. Effects of Surfactants on the Formation and the Stability of Interfacial Nanobubbles. Langmuir 2012, 28, 10471–10477. [Google Scholar] [CrossRef] [PubMed]
- Hsu, S.-H.; Lee, W.-H.; Yang, Y.-M.; Chang, C.-H.; Maa, J.-R. Bubble Formation at an Orifice in Surfactant Solutions under Constant-Flow Conditions. Ind. Eng. Chem. Res. 2000, 39, 1473–1479. [Google Scholar] [CrossRef]
- Babu, R.; Das, M.K. Effects of surface-active agents on bubble growth and detachment from submerged orifice. Chem. Eng. Sci. 2018, 179, 172–184. [Google Scholar] [CrossRef]
- Yang, Y.-M.; Yeh, S.-J.; Hsiung, C.-K.; Chien, C.-L.; Chang, C.-H.; Maa, J.-R. Bubble Formation in Catanionic Surfactant Solutions under Constant-Flow Conditions. J. Chem. Eng. Jpn. 2001, 34, 563–567. [Google Scholar] [CrossRef]
- Kurimoto, R.; Yasuda, T.; Minagawa, H. Effects of surfactant on quasi-static bubble growth from an orifice. Chem. Eng. Process. - Process. Intensif. 2016, 104, 154–159. [Google Scholar] [CrossRef]
- King, L.; Sadhal, S.S. Effect of surfactants on the growth and departure of bubbles from solid surfaces. Heat Mass Transf. 2014, 50, 373–382. [Google Scholar] [CrossRef]
- Mohammadi, R.; Wassink, J.; Amirfazli, A. Effect of Surfactants on Wetting of Super-Hydrophobic Surfaces. Langmuir 2004, 20, 9657–9662. [Google Scholar] [CrossRef]
- Chang, F.-M.; Sheng, Y.-J.; Chen, H.; Tsao, H.-K. From superhydrophobic to superhydrophilic surfaces tuned by surfactant solutions. Appl. Phys. Lett. 2007, 91, 094108. [Google Scholar] [CrossRef]
- B. F V. 1982 Dynamic Surface Tension and kinetics of Adsorption in Solutions of Normal Alcohls. Kolloid. Z. 44, 598–603.
- Takagi, S.; Uda, T.; Watanabe, Y.; Matsumoto, Y. Behavior of a Rising Bubble in Water with Surfactant Dissolution : 1st Report, Steady Behavior. Transactions of the Japan Society of Mechanical Engineers Series B 2003, 69, 2192–2199. [Google Scholar] [CrossRef]
- Daerr, A.; Mogne, A. Pendent_Drop: An ImageJ Plugin to Measure the Surface Tension from an Image of a Pendent Drop. J. Open Res. Softw. 2016, 4. [Google Scholar] [CrossRef]
- Hey, M.; Kippax, P. Surface tensions of mixed aqueous solutions of tert-butanol and n-pentanol. Colloids Surfaces A: Physicochem. Eng. Asp. 2005, 262, 198–203. [Google Scholar] [CrossRef]
- Tagawa, Y.; Takagi, S.; Matsumoto, Y. Surfactant effect on path instability of a rising bubble. J. Fluid Mech. 2013, 738, 124–142. [Google Scholar] [CrossRef]
- Hung, Y.-L.; Chang, Y.-Y.; Wang, M.-J.; Lin, S.-Y. A simple method for measuring the superhydrophobic contact angle with high accuracy. Rev. Sci. Instruments 2010, 81, 065105. [Google Scholar] [CrossRef]
- Tate, T. 1864 On the magnitude of a drop of liquid formed under different circumstances. The London, Edinburgh, and Dublin Philosophical Magazine and Journal of Science 1864, 27, 176–180. [Google Scholar] [CrossRef]
- Thoroddsen, S.T.; Etoh, T.G.; Takehara, K. Experiments on bubble pinch-off. Phys. Fluids 2007, 19, 042101. [Google Scholar] [CrossRef]
- Burton, J.C.; Waldrep, R.; Taborek, P. Scaling and Instabilities in Bubble Pinch-Off. Phys. Rev. Lett. 2005, 94, 184502. [Google Scholar] [CrossRef]
- Keim, N.C.; Møller, P.; Zhang, W.W.; Nagel, S.R. Breakup of Air Bubbles in Water: Memory and Breakdown of Cylindrical Symmetry. Phys. Rev. Lett. 2006, 97, 144503. [Google Scholar] [CrossRef]
- Quan, S.; Hua, J. Numerical studies of bubble necking in viscous liquids. Phys. Rev. E 2008, 77, 066303. [Google Scholar] [CrossRef]
Figure 1.
(a) Schematic drawing of the experimental setup for measuring bubble formation on superhydrophobic surface; (b-c) SEM images of the superhydrophobic surface.
Figure 1.
(a) Schematic drawing of the experimental setup for measuring bubble formation on superhydrophobic surface; (b-c) SEM images of the superhydrophobic surface.
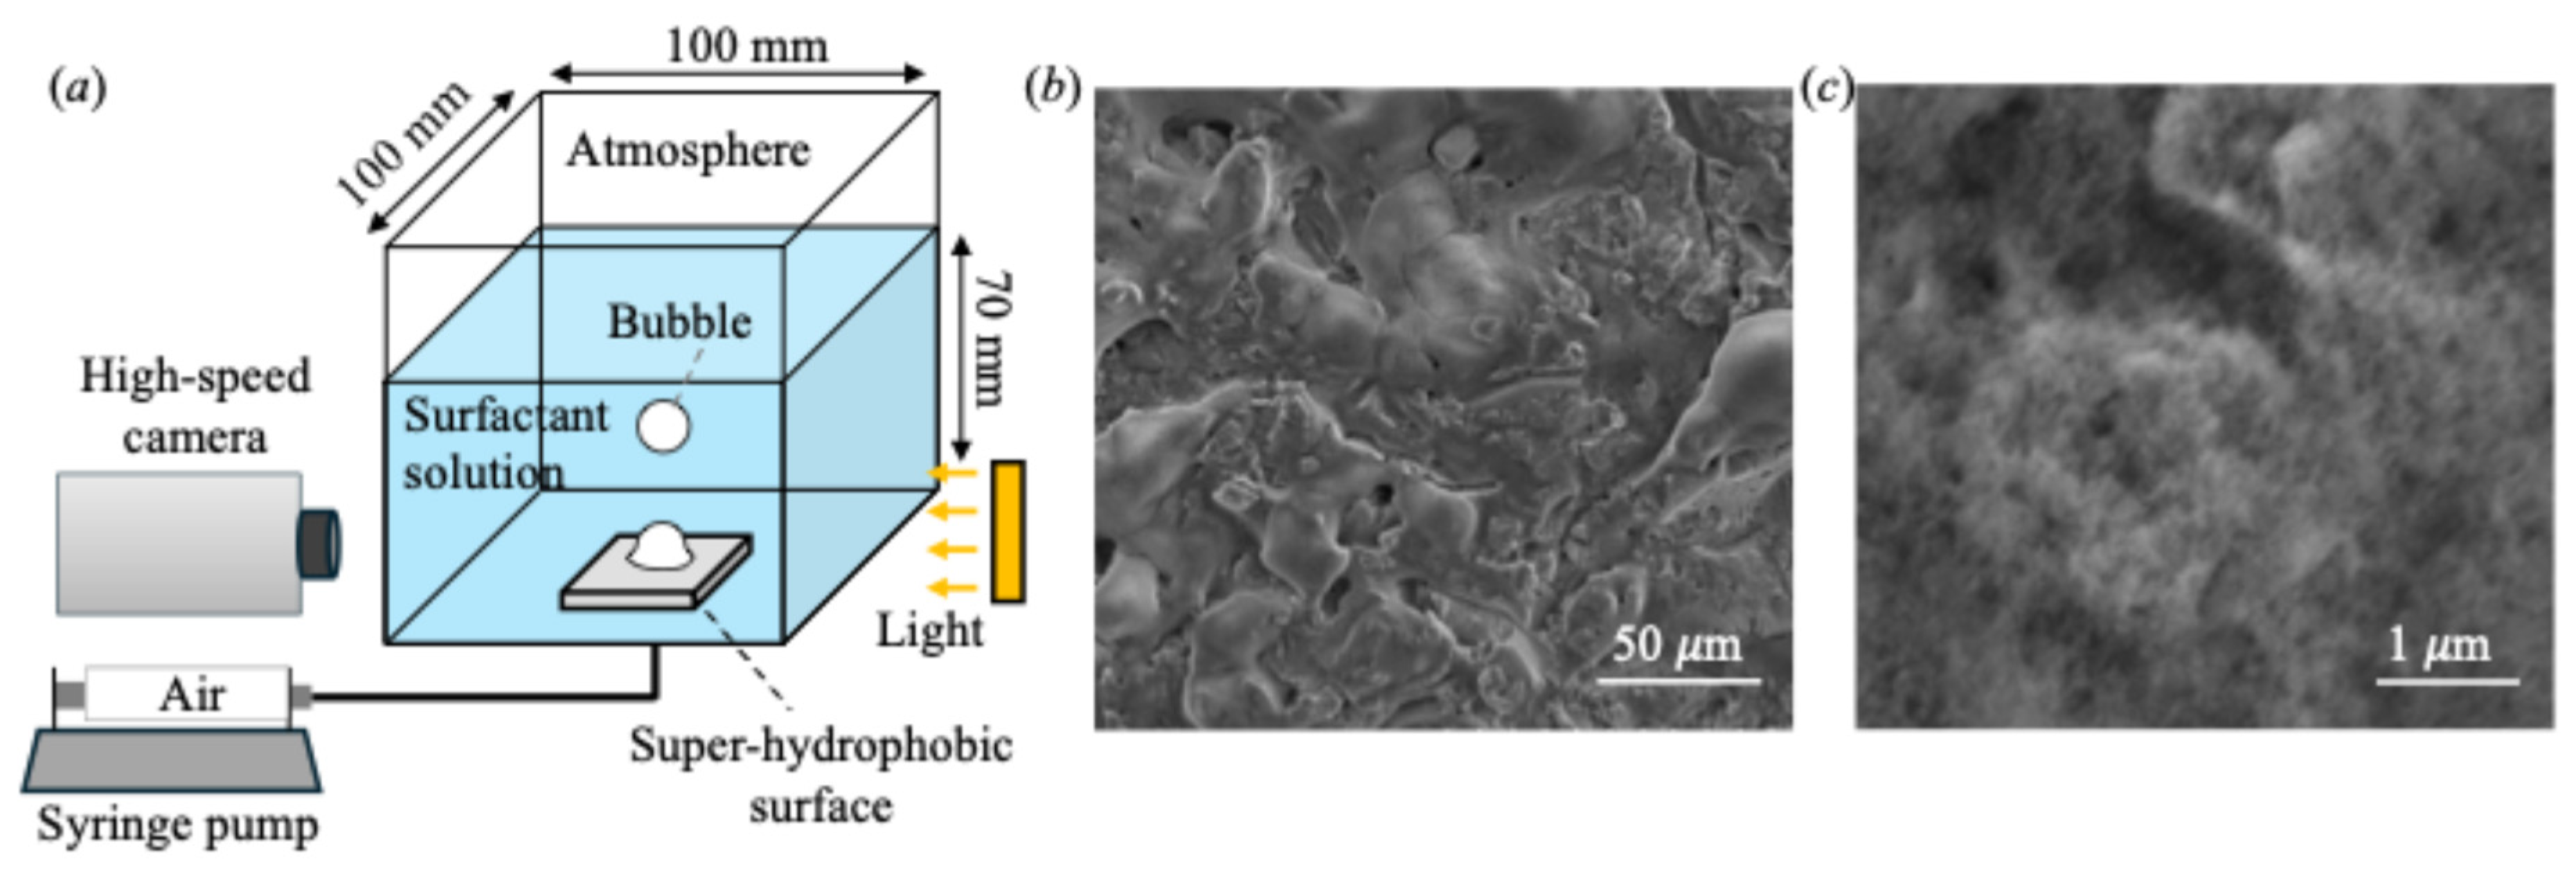
Figure 2.
(a) Surface tension as a function of the 1-pentanol concentration; and (b) Static contact angle of the superhydrophobic surface as a function of the 1-pentanol concentration. The inserted image in (b) is a water droplet seating on the SHS.
Figure 2.
(a) Surface tension as a function of the 1-pentanol concentration; and (b) Static contact angle of the superhydrophobic surface as a function of the 1-pentanol concentration. The inserted image in (b) is a water droplet seating on the SHS.
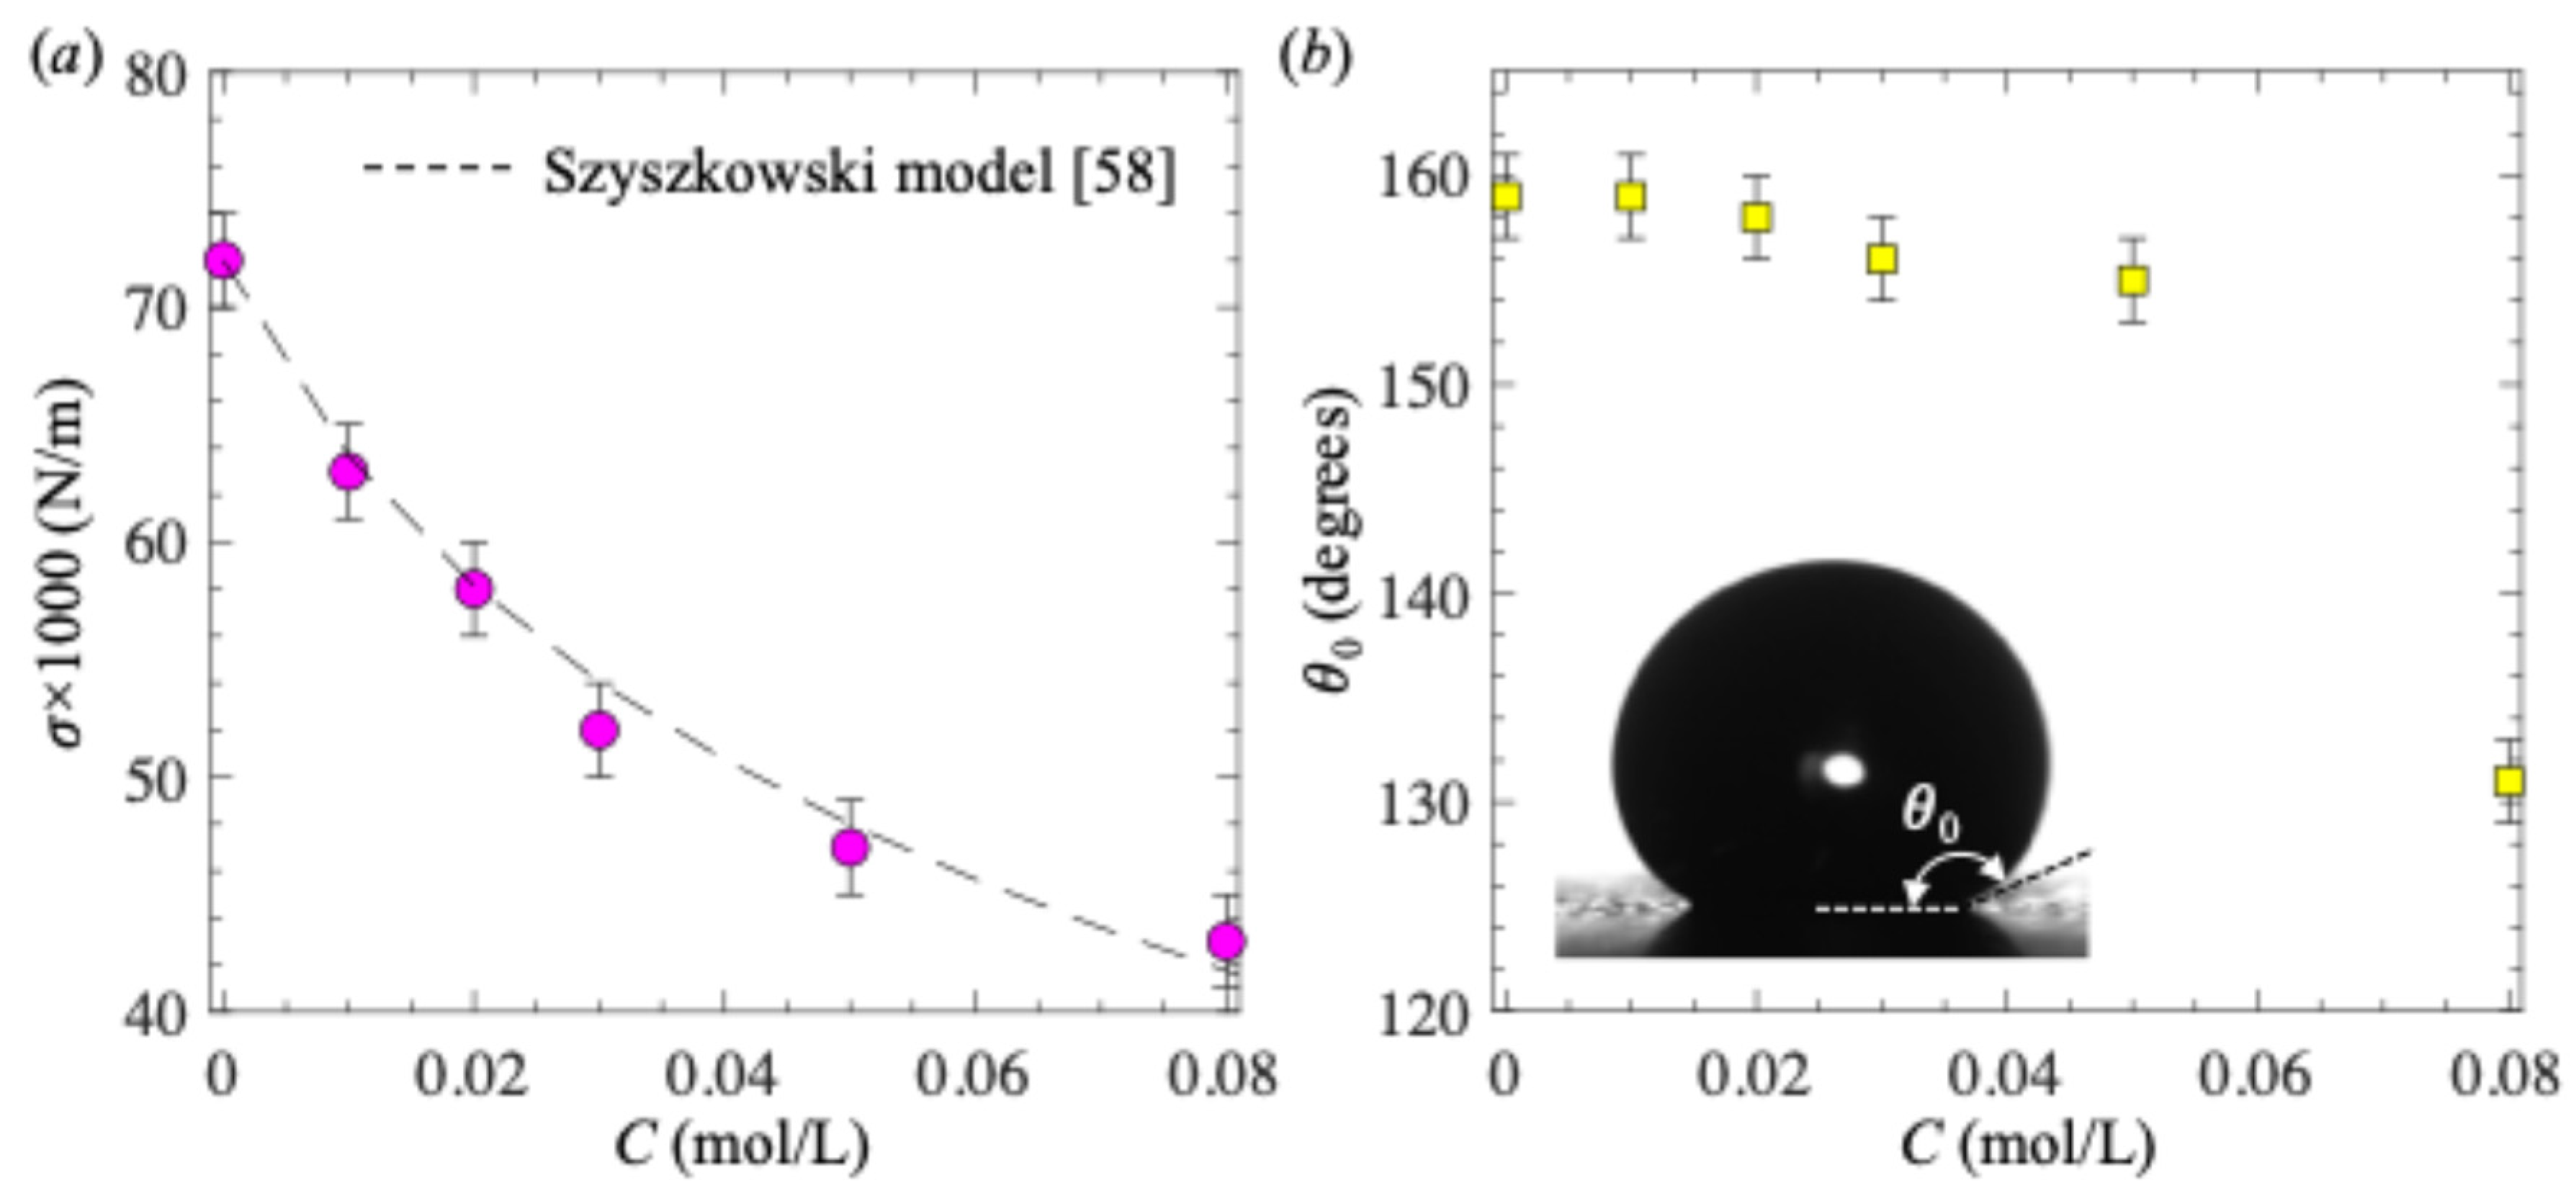
Figure 3.
Time-evolution of bubble shapes for five different 1-pentanol concentrations ranging from 0 to 0.08 mol/L. Time t=0 is defined as the time of detachment of previous bubble, and T0 is the bubbling period.
Figure 3.
Time-evolution of bubble shapes for five different 1-pentanol concentrations ranging from 0 to 0.08 mol/L. Time t=0 is defined as the time of detachment of previous bubble, and T0 is the bubbling period.
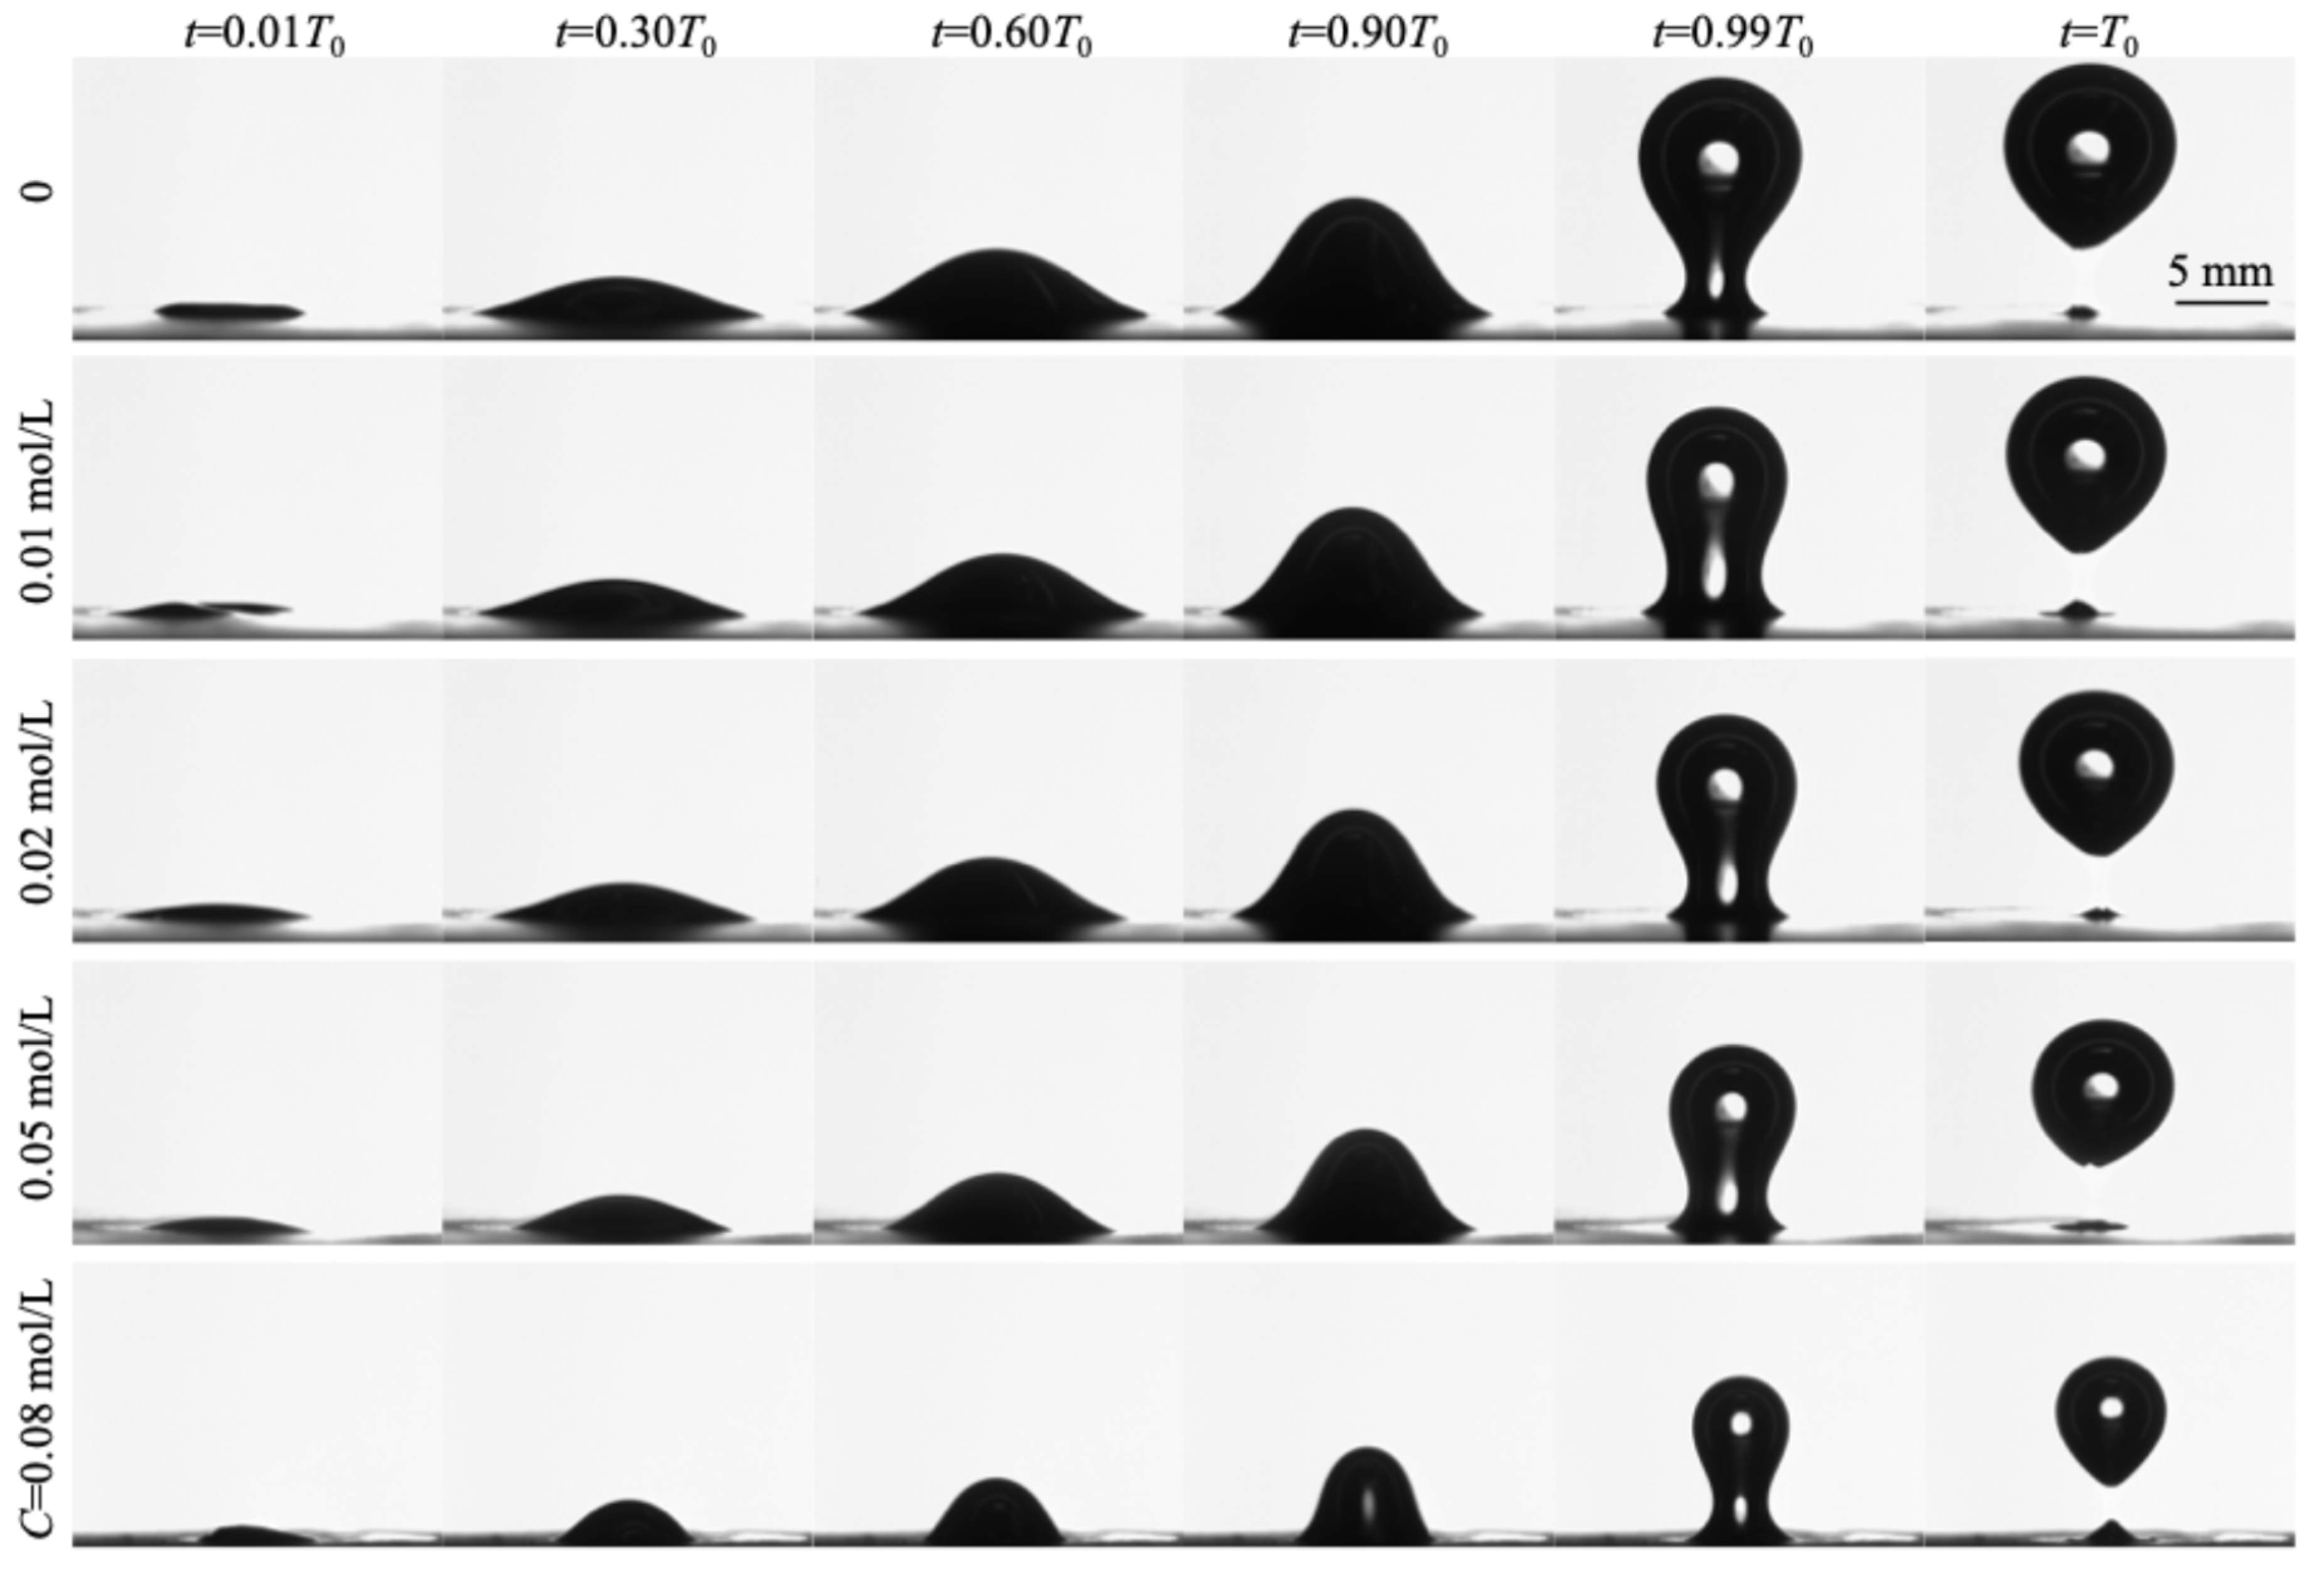
Figure 4.
(a) and (c) Maximum bubble base radius as a function of 1-pentanol concentration, and (b) and (d) detached bubble volume as a function of 1-pentanol concentration. In (c) and (d), Rbmax and Vd are normalized by lσ and lσ3, respectively, where lσ=(σ/ρLg)0.5 is the capillary length. .
Figure 4.
(a) and (c) Maximum bubble base radius as a function of 1-pentanol concentration, and (b) and (d) detached bubble volume as a function of 1-pentanol concentration. In (c) and (d), Rbmax and Vd are normalized by lσ and lσ3, respectively, where lσ=(σ/ρLg)0.5 is the capillary length. .
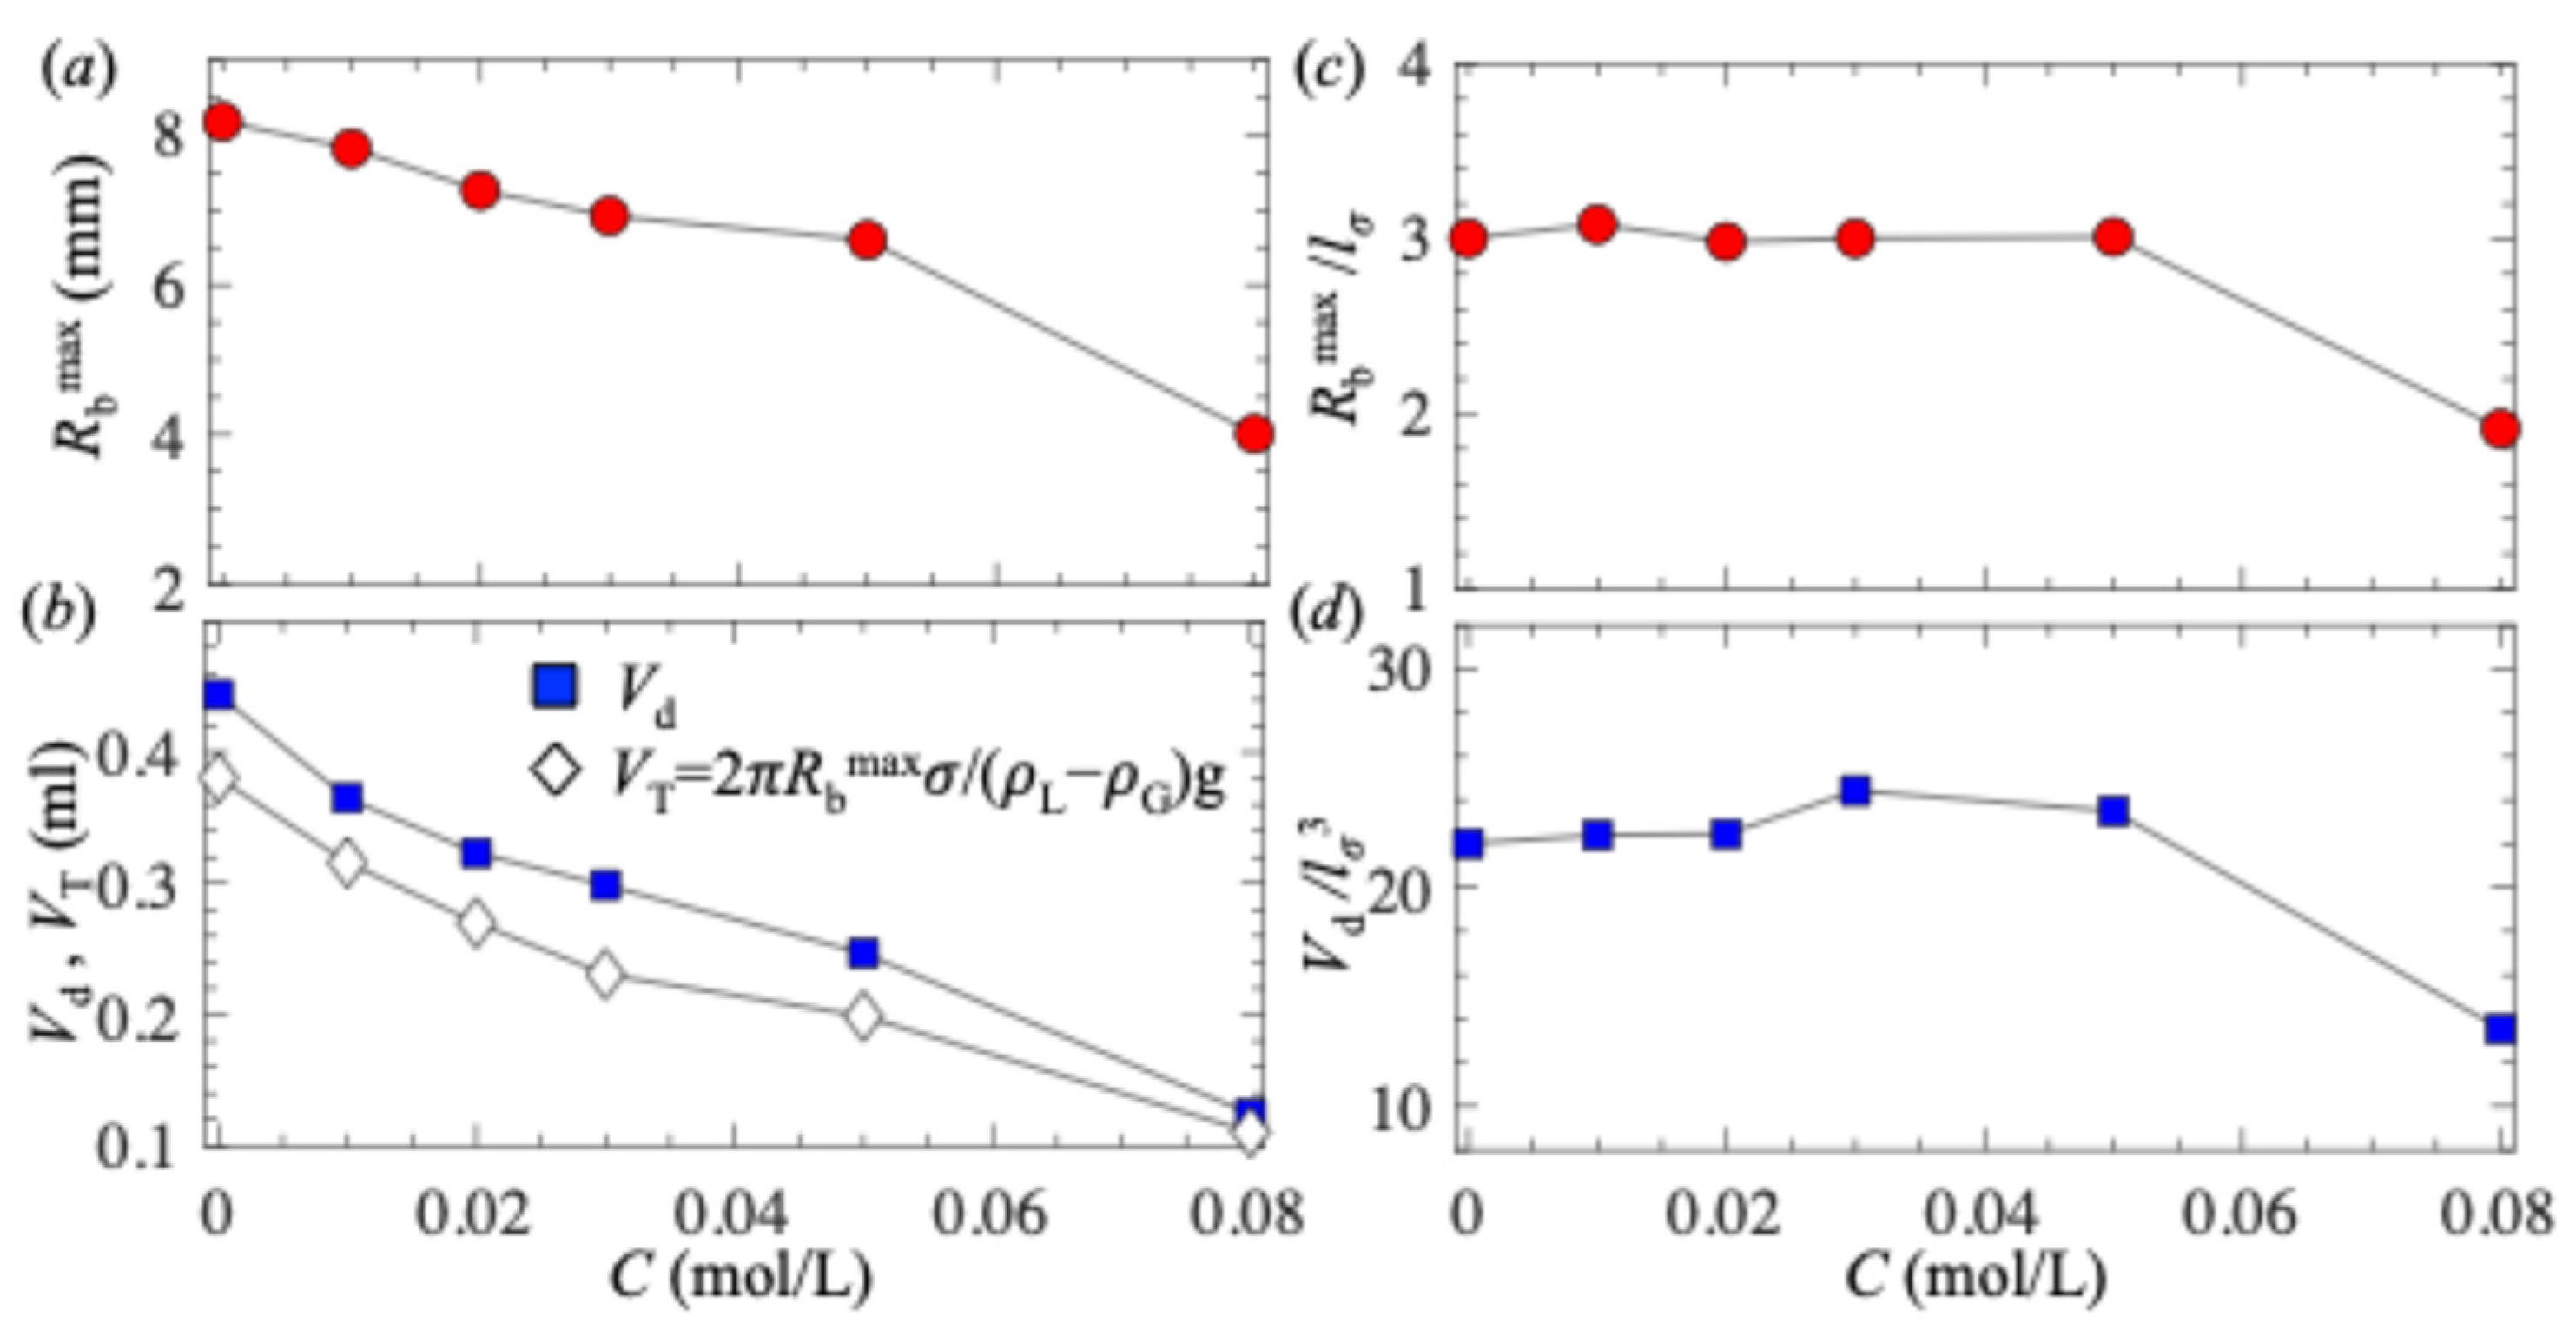
Figure 5.
(a) Bubble maximum base radius and (b) bubble detached volume as a function of surface tension. Both axes are shown in log scale. Dashed lines are fittings to the experimental data at the large surface tension range.
Figure 5.
(a) Bubble maximum base radius and (b) bubble detached volume as a function of surface tension. Both axes are shown in log scale. Dashed lines are fittings to the experimental data at the large surface tension range.
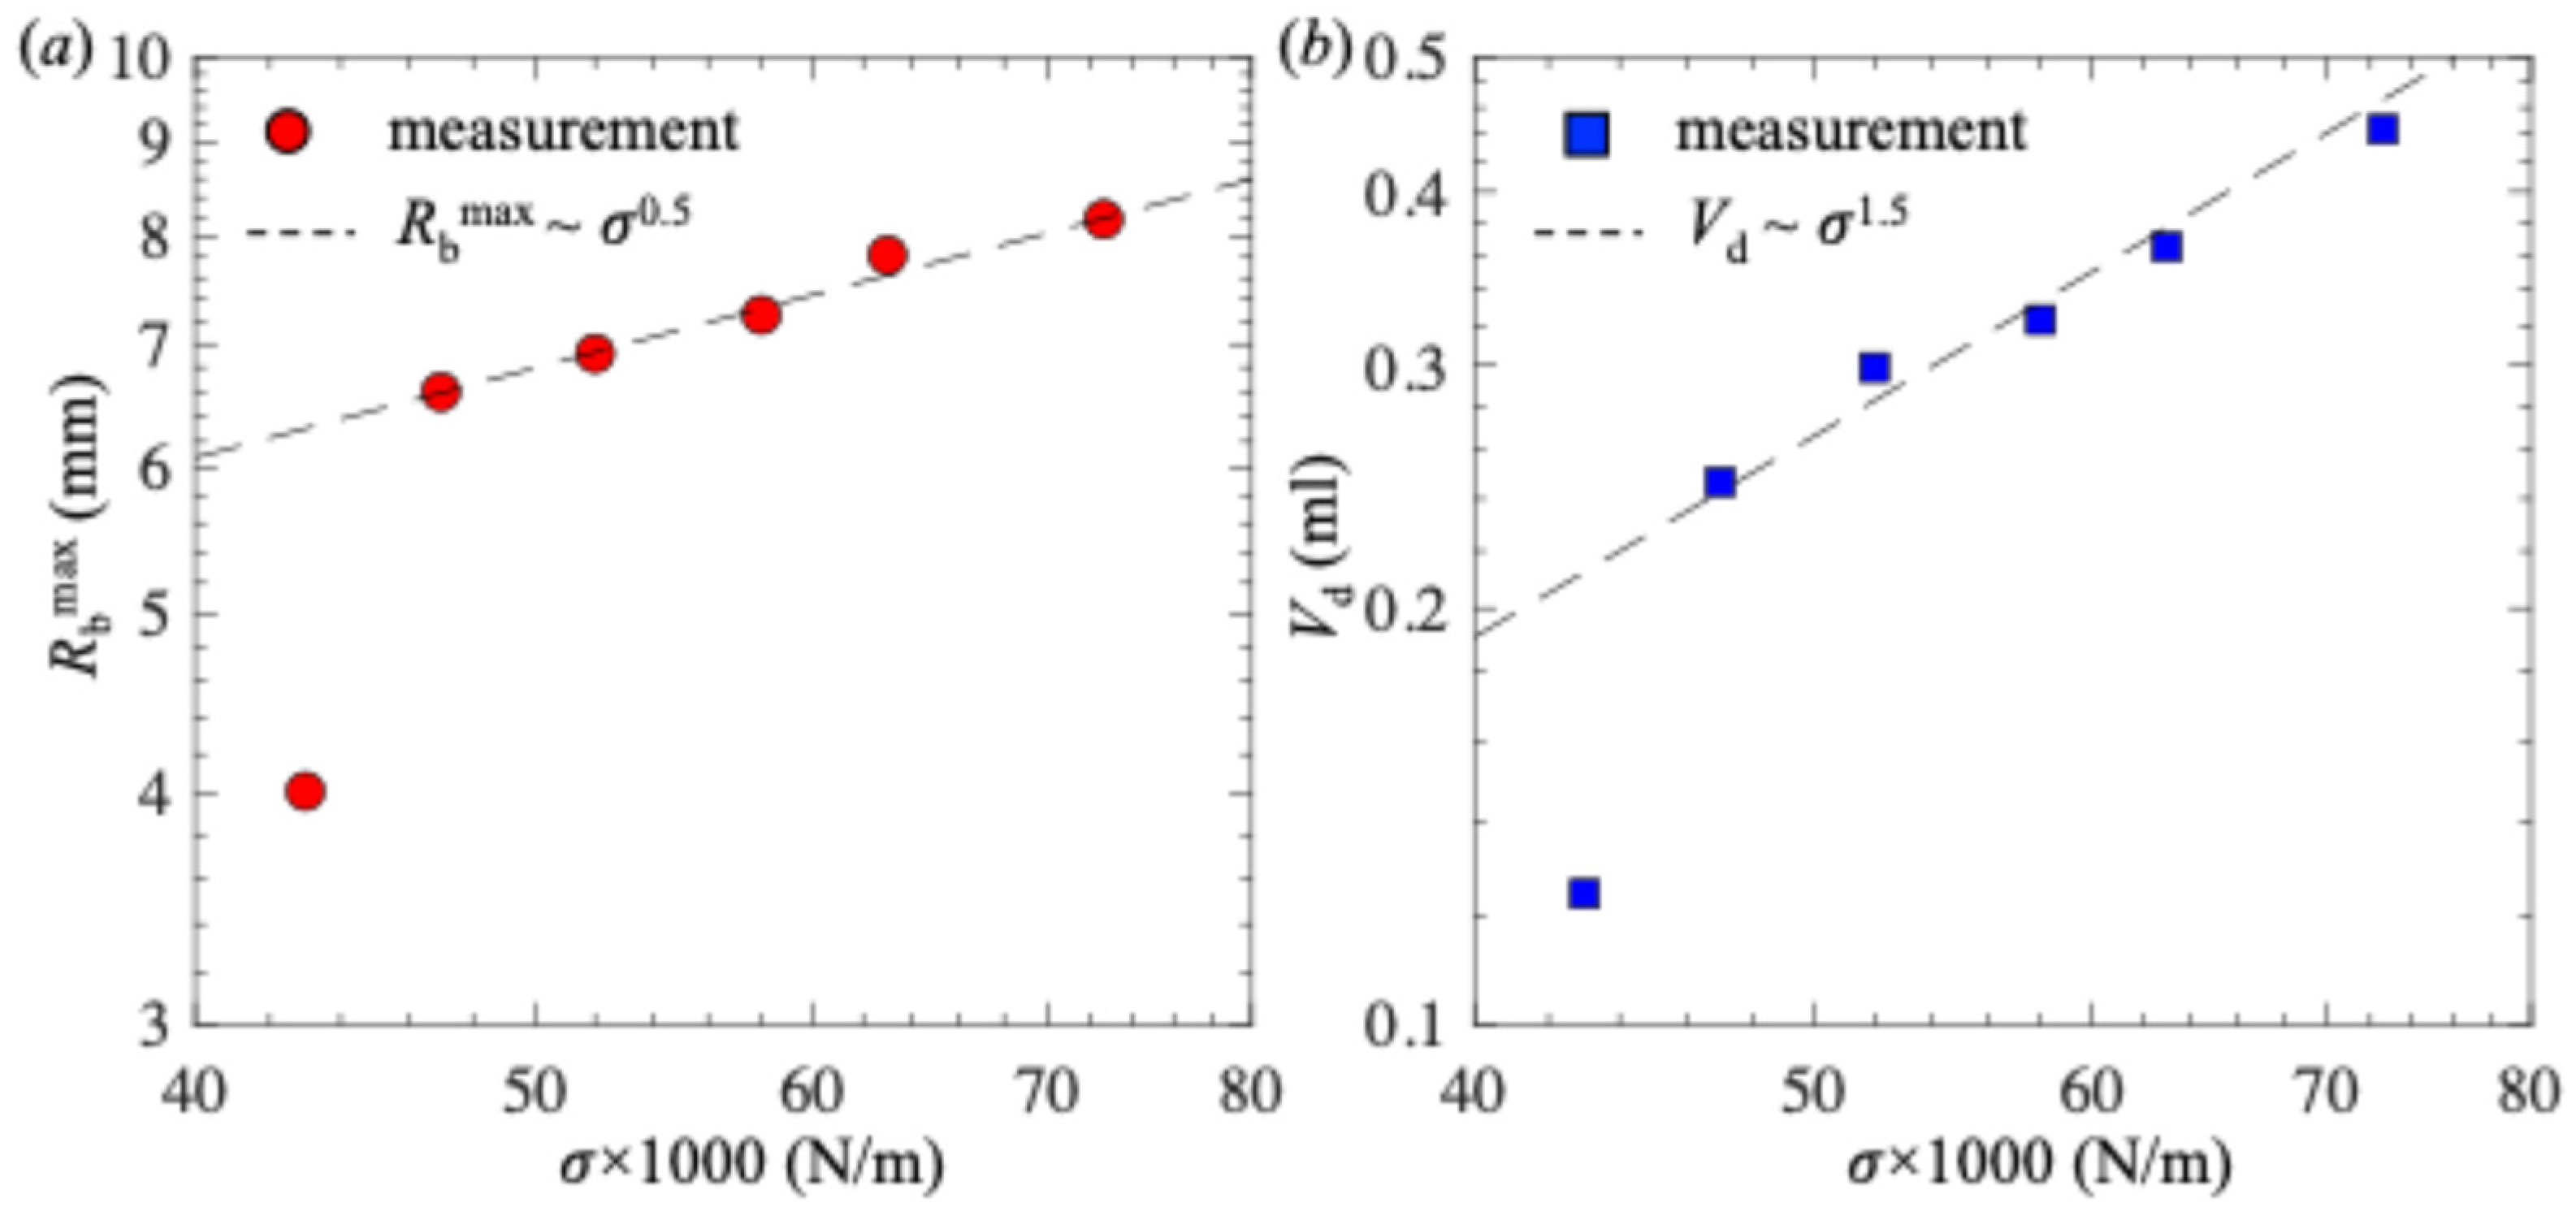
Figure 6.
(a) and (d) Bubble height, (b) and (e) bubble base radius, and (c) and (f) bubble radius at the apex as a function of bubble volume. In (d) to (f), the length and volume are normalized by lσ and lσ3, respectively.
Figure 6.
(a) and (d) Bubble height, (b) and (e) bubble base radius, and (c) and (f) bubble radius at the apex as a function of bubble volume. In (d) to (f), the length and volume are normalized by lσ and lσ3, respectively.

Figure 7.
Evolution of contact angle at bubble base as a function of bubble volume.
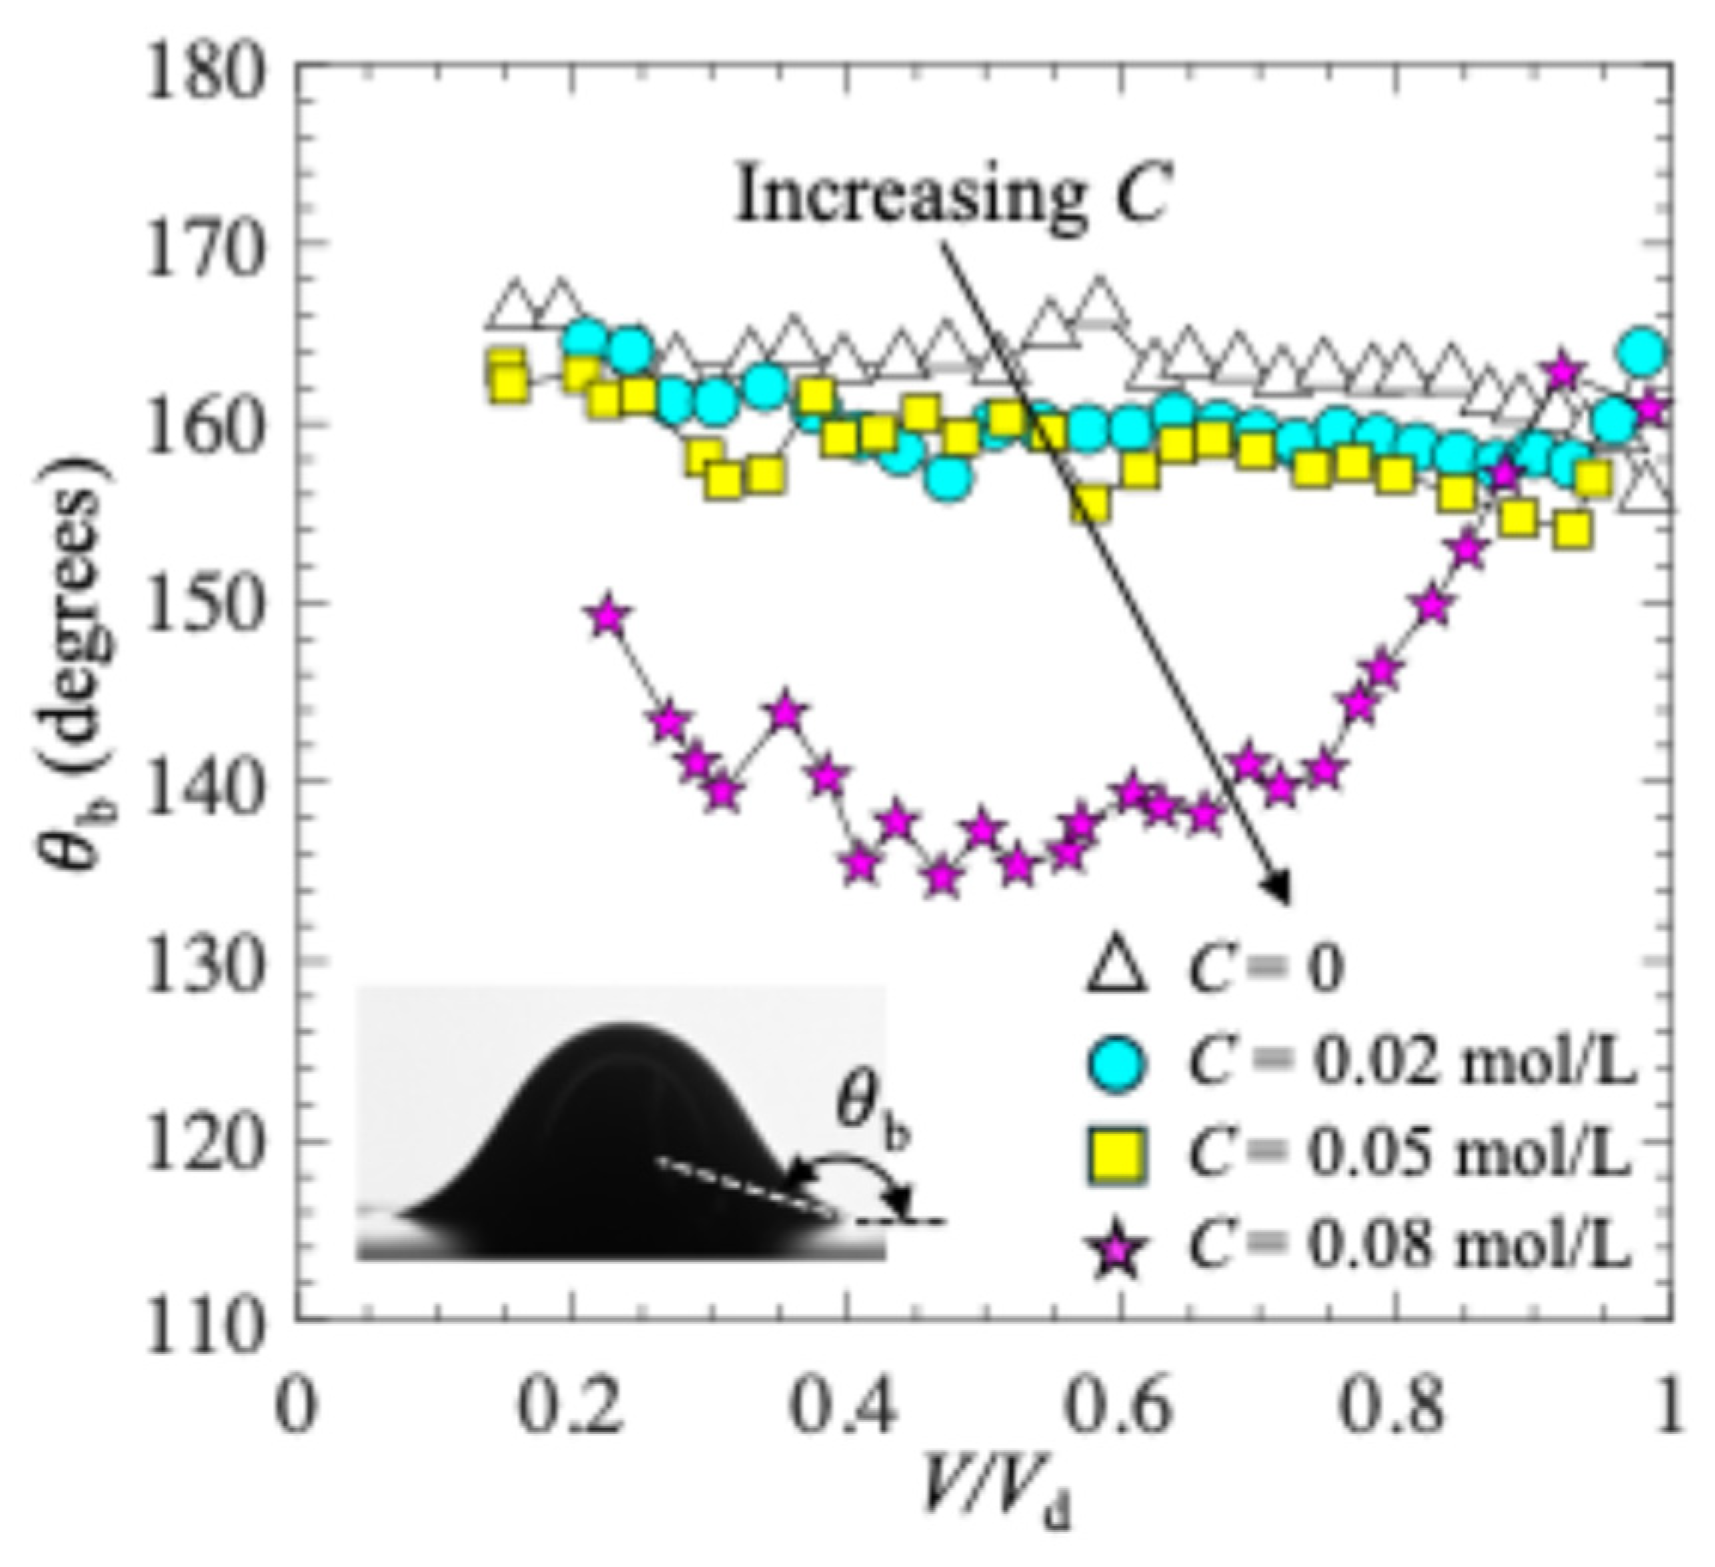
Figure 8.
(a) Evolution of bubble shape during the necking period for C=0; and (b-c) Variations of minimum neck radius as a function of time to pinch-off. In (c), the length and time are normalized by Rbmax and capillary-inertia time scale, respectively.
Figure 8.
(a) Evolution of bubble shape during the necking period for C=0; and (b-c) Variations of minimum neck radius as a function of time to pinch-off. In (c), the length and time are normalized by Rbmax and capillary-inertia time scale, respectively.
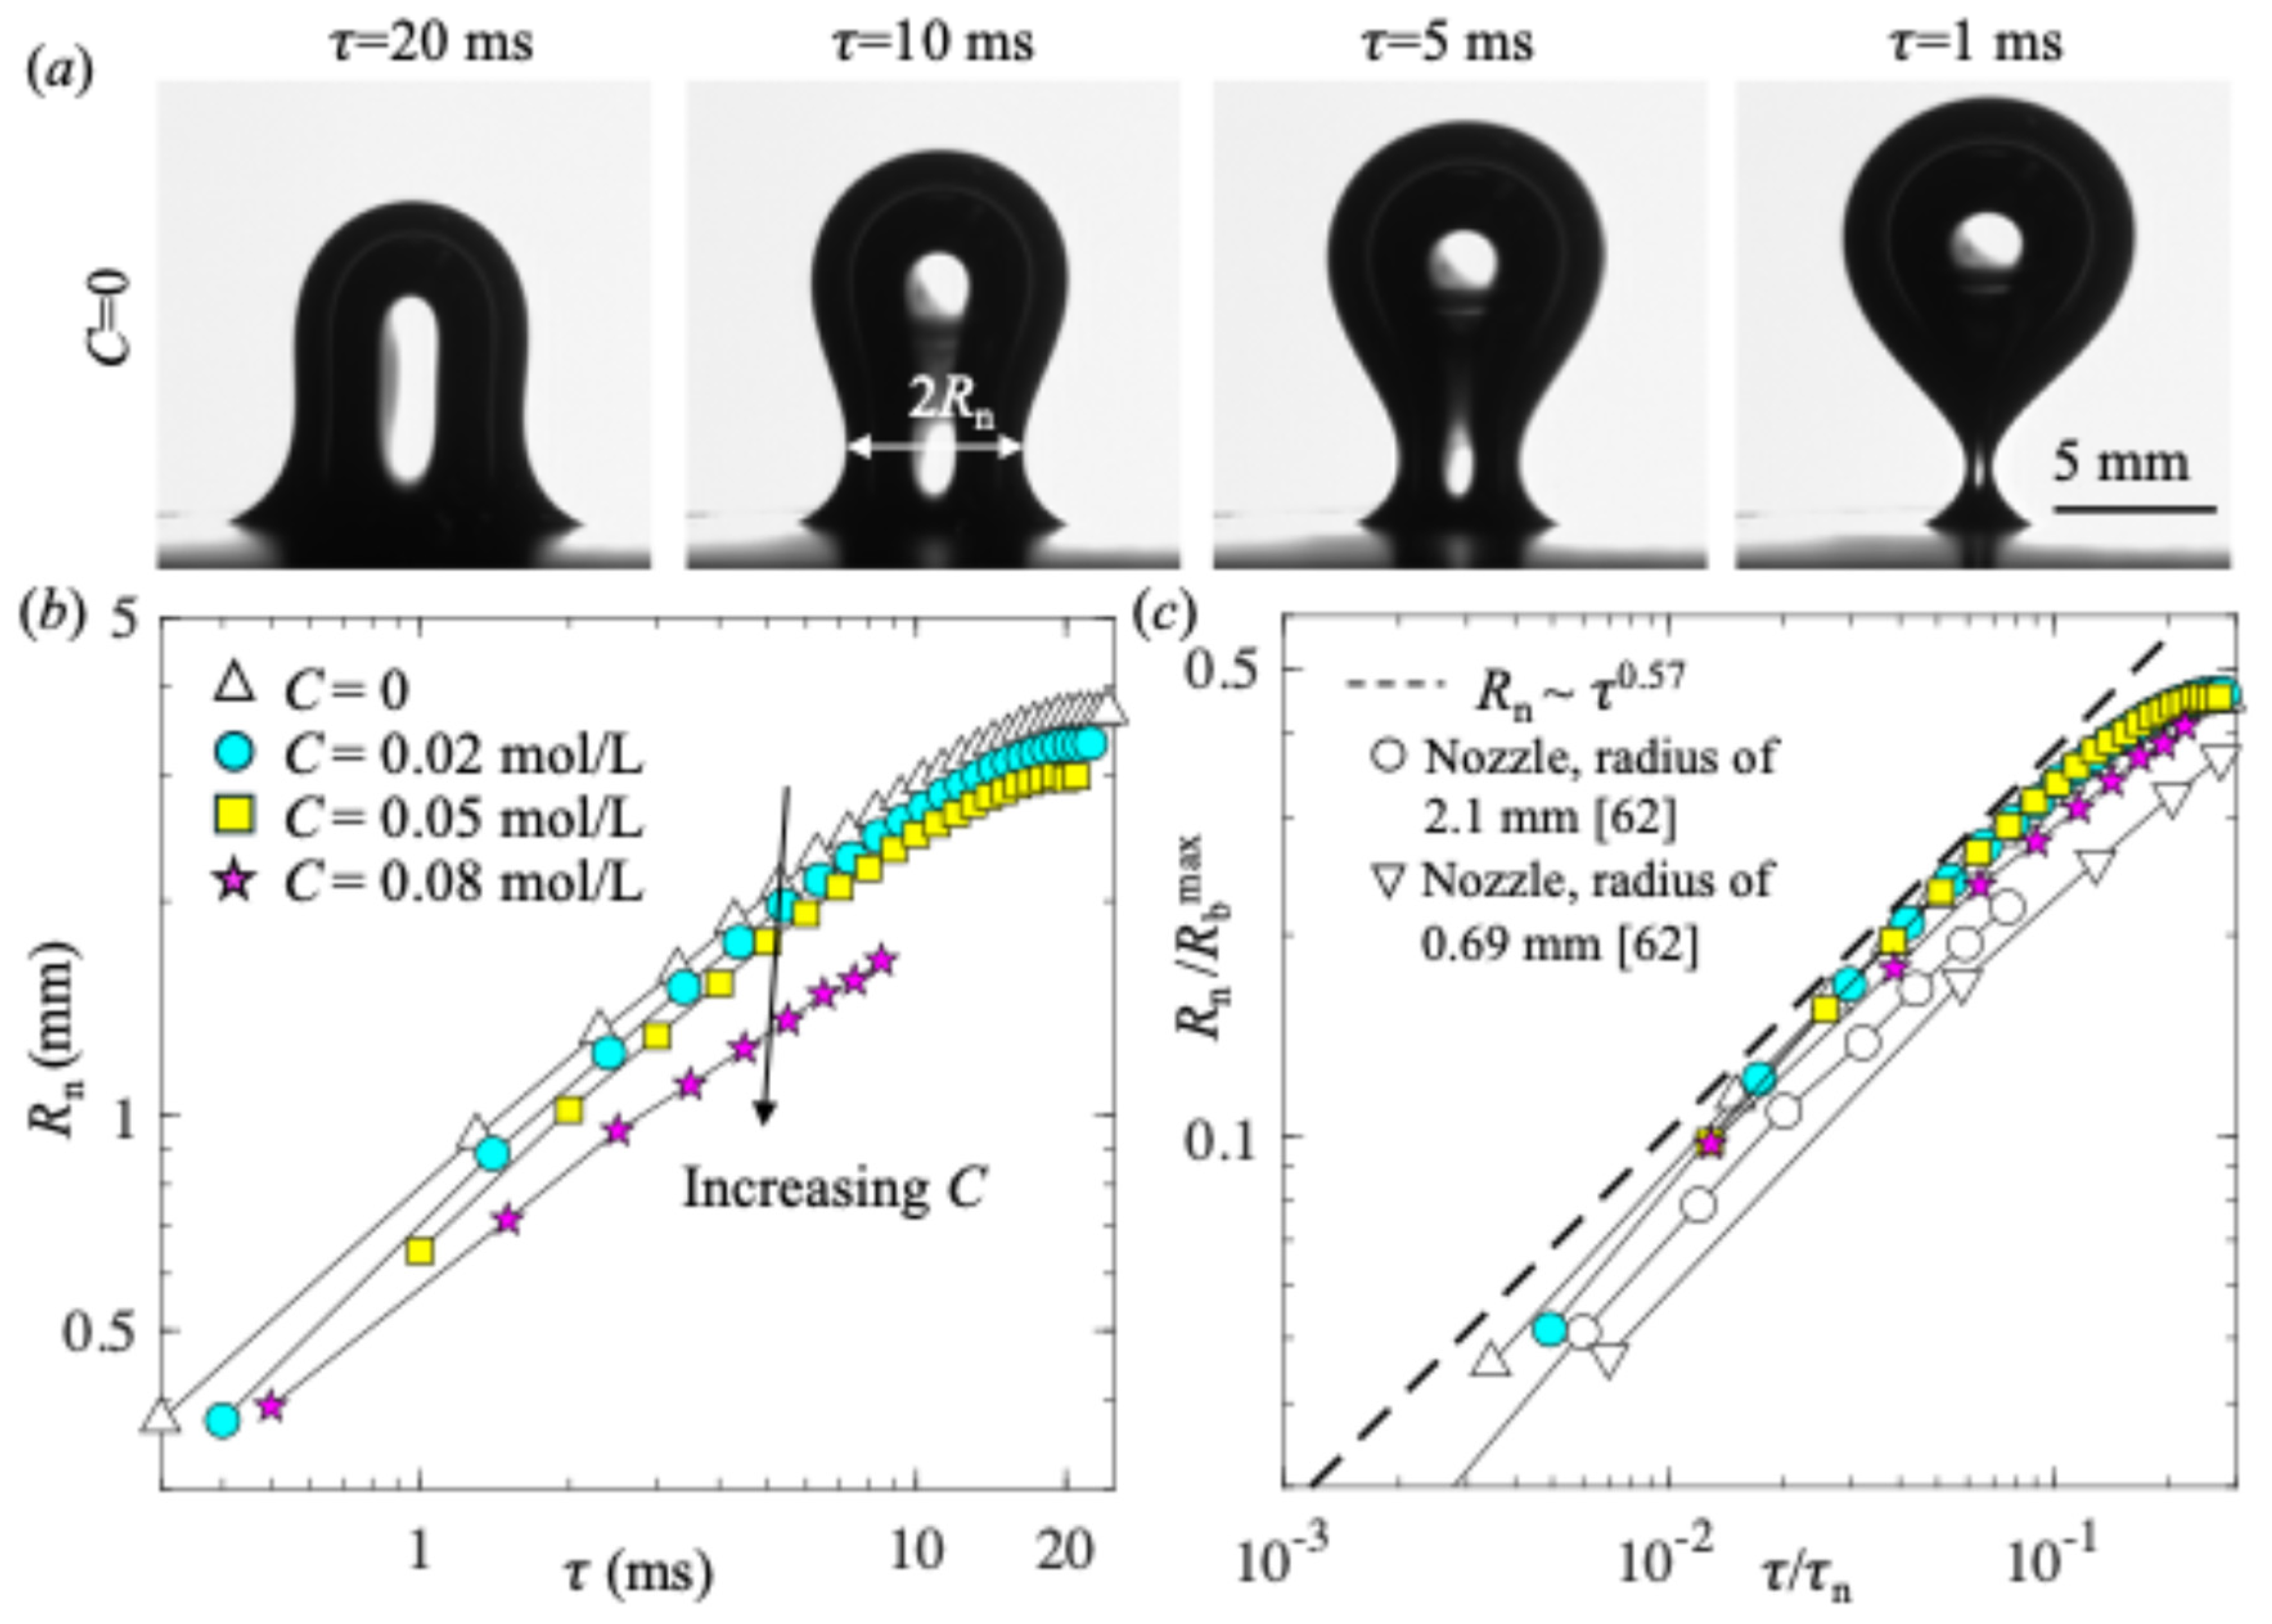
Figure 9.
Variations of forces, including pressure force FP, buoyancy force FB, surface tension force FS, and their summation FP+FB+FS, for (a) C=0 and (b) C=0.05 mol/L, as a function of bubble volume. The forces are normalized by (ρL−ρG)gVd and the volume is normalized by lσ3.
Figure 9.
Variations of forces, including pressure force FP, buoyancy force FB, surface tension force FS, and their summation FP+FB+FS, for (a) C=0 and (b) C=0.05 mol/L, as a function of bubble volume. The forces are normalized by (ρL−ρG)gVd and the volume is normalized by lσ3.
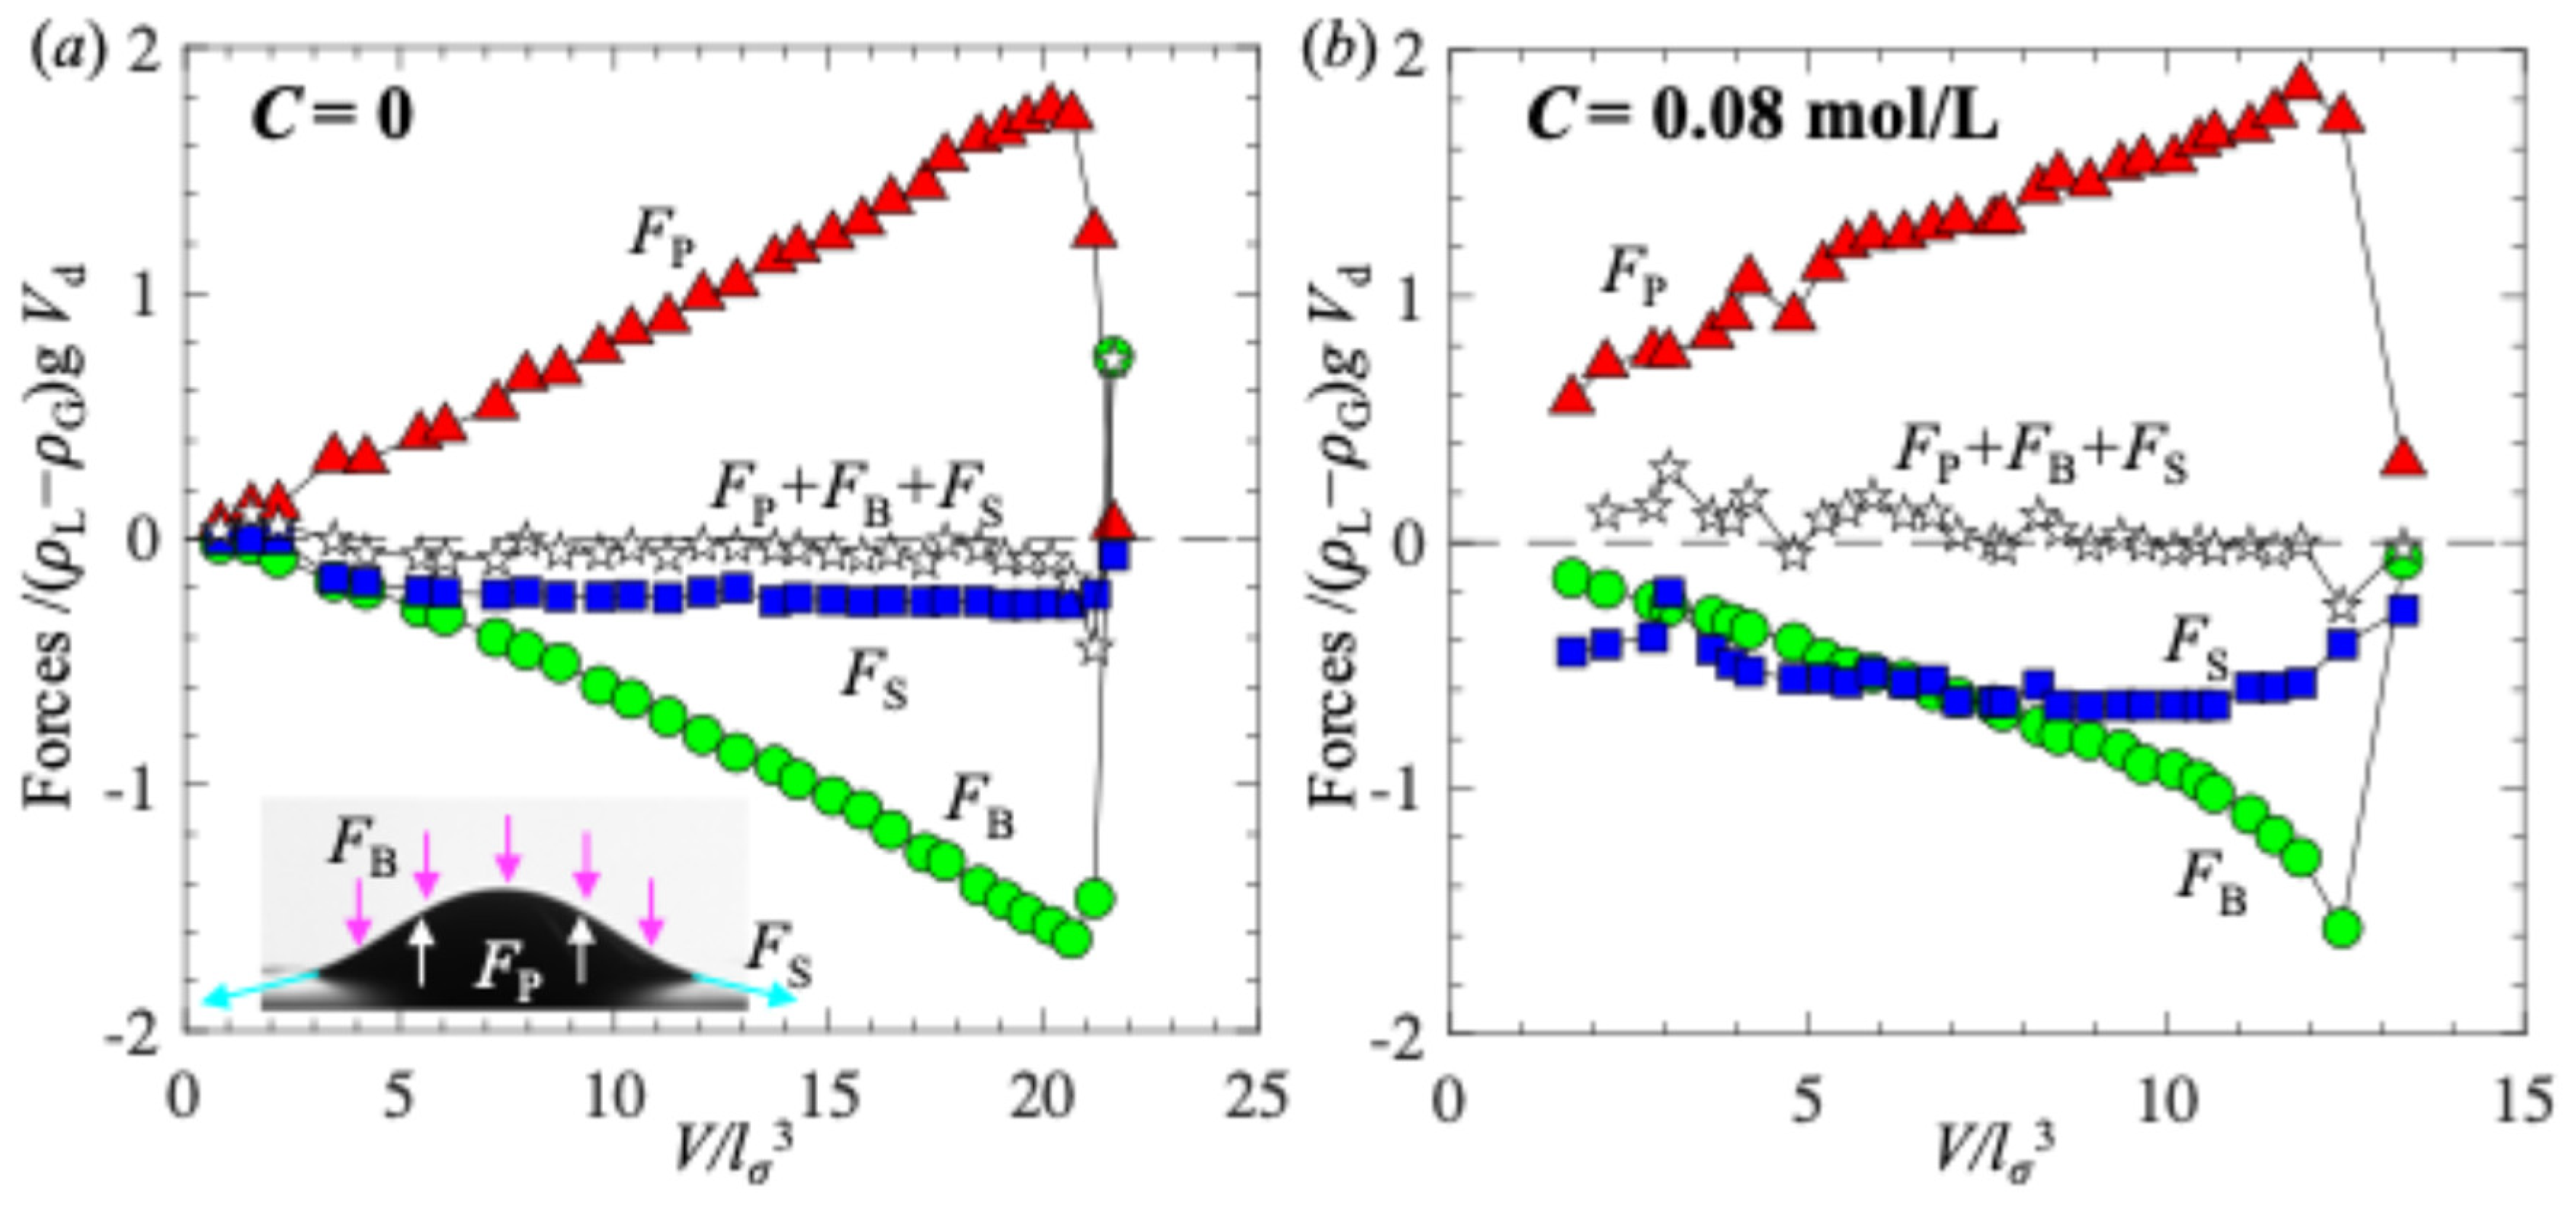

Table 1.
Main experimental parameters and experimental results in the current study.
| C (mol/L) | σ (mN/m) | θ0 (°) | Rbmax (mm) | Vd (mL) | lσ (mm) |
| 0 | 72 | 159 | 8.2 | 0.44 | 2.7 |
| 0.01 | 63 | 159 | 7.8 | 0.37 | 2.5 |
| 0.02 | 58 | 158 | 7.3 | 0.32 | 2.4 |
| 0.03 | 52 | 156 | 6.9 | 0.30 | 2.3 |
| 0.05 | 47 | 155 | 6.6 | 0.25 | 2.2 |
| 0.08 | 43 | 131 | 4.0 | 0.12 | 2.1 |
Disclaimer/Publisher’s Note: The statements, opinions and data contained in all publications are solely those of the individual author(s) and contributor(s) and not of MDPI and/or the editor(s). MDPI and/or the editor(s) disclaim responsibility for any injury to people or property resulting from any ideas, methods, instructions or products referred to in the content. |
© 2025 by the authors. Licensee MDPI, Basel, Switzerland. This article is an open access article distributed under the terms and conditions of the Creative Commons Attribution (CC BY) license (http://creativecommons.org/licenses/by/4.0/).
Copyright: This open access article is published under a Creative Commons CC BY 4.0 license, which permit the free download, distribution, and reuse, provided that the author and preprint are cited in any reuse.


