
Submitted:
28 November 2023
Posted:
28 November 2023
You are already at the latest version
Abstract
The phenomenon of droplet impact on moving surfaces is widely observed in fields such as transportation, rotating machinery, and inkjet printing. Droplets exhibit non-axisymmetric behavior due to the motion of solid surfaces which significantly determines core parameters such as contact time, maximum spreading radius, and bounding velocity, thereby affecting the efficiency of related applications. In this study, we focus on kinetics and morphology of the non-axisymmetric bouncing behaviors for droplets impacting on a moving superhydrophobic surface (SHPS) within the normal (Wen) and tangential (Wet) Weber numbers. Considering the influences of moving surface on the contact area and contact time, the previous scaling formula for the horizontal velocity of droplets has been improved. Based on the velocity superposition hypothesis, we establish a theoretical model for the ratio of the maximum spreading radius at both ends depending on Wen and Wet. This research provides both experimental and theoretical evidence for understanding and controlling the non-axisymmetric behavior of droplets impacting on moving surfaces.
Keywords:
superhydrophobic substrate
; droplet impact
; spreading dynamics
; contact time
I. Introduction
During the process of liquid droplet impact, various phenomena such as stacking, rebounding, and splashing can occur under the influence of the droplet properties and surface characteristics [1-3]. The rebound process refers to the lateral spreading of the droplet, with the conversion of kinetic energy to surface energy, gradually reaching the maximum spreading length Dmax, after which the droplet recoils towards the center until it reaches a certain degree of contraction. Subsequently, the droplet rebounds from the surface [4-6]. The phenomenon of droplet impact has been extensively studied both numerically and experimentally [7,8], the rebound behavior of liquid droplets is influenced by various factors such as droplet properties [9,10], droplet radius and velocity [11,12], surface properties [13,14], and incident angle [15,16].
In previous studies on droplet impact, the predominant focus on stationary surfaces, and the maximum spreading length of the impacting droplet was dependent on the normal Weber number Wen, especially in cases involving low viscosity and limited wetting ability [17]. The contact time was found to be contingent upon the radius and independent of the impact velocity [18]. In this context, contact time is defined as the duration from the first contact of the droplet with the surface to the complete detachment. Research into contact time has garnered practical applications in the field of self-cleaning surfaces [19]. Here, the design of macro-textures and microstructures can effectively reduce the contact time [20,21].
However, in practical applications, droplet impact phenomena mostly occur on moving surfaces, such as raindrops impacting aircraft wings and wind turbine blades [22], and the directional transport of droplets in inkjet printing [23]. A few studies have found that on the SHPSs, as the speed of the moving surface increases, elevated surface velocities amplify the extension of impacting droplets, consequently leading to a reduction in contact time [24,25]. Similar findings have also been observed on moving surfaces with macroscopic structures and wetting patterns [26].
These conclusions mostly analyze droplets from a kinematic perspective, focusing on droplet spreading and contact time. There are still some conclusions related to momentum, some studies suggest the main cause of momentum transfer is the aerodynamic Leidenfrost effect [27]. This phenomenon refers to the thin air film formed between the droplet and the moving surface, which is the primary factor generating viscous forces on the droplet. By analyzing the forces acting on the thin air film between droplet and surface, scaling relationships can be derived to summarize the contact time, spreading ratio, and horizontal distance. These dynamic conclusions have been well validated [28]. However, in this experiments, the presence of an air film between the liquid droplet and the surface was not distinctly observe. Droplets will inevitably come into contact with the surface, and the reason for this difference may be due to insufficient surface velocity to generate a noticeable air layer. We tend to the view of the transfer of horizontal momentum is caused by the viscous boundary layer developing in the liquid [29]. Throughout the impact process, energy dissipation due to viscous losses is observed. The fundamental physical principle of non-axisymmetric bouncing dynamics is the transfer of horizontal momentum during the impact process, gradually shifting from the bottom to the top of the droplet. Based on this, formulas related to the horizontal velocity of droplets have been proposed [30], while the feasibility of this velocity formula has been well validated, there are still some sections for improvement. For example, in the derivation of this formula, the spreading region of the droplet is considered to be circular, which is accurate when impacting a stationary surface but imprecise on a moving surface, where the spreading region is elongated [28,31]. Furthermore, the contact time of the droplet is also assumed to be the same as the contact time on a stationary surface τs, whereas on a moving surface the contact time τm is shorter than τs [24,25].
And there is still a lack of satisfactory solutions regarding how the spreading range of droplets is influenced by surface motion. In this study, the fundamental dynamic behaviors of droplet impact on moving surfaces are focused on being revealed, a more accurate correction has been made to the scaling formula for the droplet horizontal velocity. As well as analyzing the asymmetric evolution of the spreading radius at both ends of the droplet over time caused by surface motion.
II. Methodology
We conducted experimental studies on SHPSs with horizontal movement speeds of Vt = 0-2.2m/s (corresponding to Wet = 0-116.08) using water droplets with impact velocities of Vn = 0.48-1.70m/s (corresponding to Wen = 5.69-71.26), where Wet = ρVt2D0/γ and Wen = ρVn2D0/γ are defined as the normal and tangential Weber number, respectively. water density ρ ≈ 1000 kg/m3, surface tension coefficient γ ≈ 0.073 N/m, and D0 = 1.8 ± 0.1 mm was the initial diameter of the water droplets. Figure 1(a) shows the schematic diagram of the experimental apparatus, where the copper plate was polished, ultrasonically cleaned, and coated with an organic reagent three times. After drying at room temperature for 30 minutes, a solution mainly composed of nano-silica particles and silicone resin was sprayed, and the static contact angle of water droplets on the surface was about 160°(Figure 1(a)). The surface was fixed to a rotating motor to obtain the horizontal speed, and the water droplets were pushed by the injection pump (LSP01-3A) and dropped onto the SHPS under the action of gravity after separating from the needle tip. The impact velocity of the droplets was adjusted by varying the distance between the needle tip and the surface. The position of the high-speed camera (GX-8E, NAC), the point of droplet impact, and the center point of the circular hydrophobic surface are all located on the same straight line, as shown in Figure 1(b) (top view). For this experiment, the centrifugal force of the droplet on the disk can be neglected [32], therefore, the motion of the surface during droplet impact can be considered as rectilinear. The environmental temperature was about 25℃, and the humidity was around 30%.
III. Results and discussion
Figure 2 shows the spreading and receding stages of water droplets on a SHPS at Wen = 29.80, with Wet = 0 and Wet = 44.06 (Multimedia view). After the droplet hits the surface, a liquid film forms as it gradually spreads out towards the maximum spreading radius Dmax. The droplet then recedes from both ends towards the center, with its height gradually increasing due to the conversion of surface energy into kinetic energy. Once sufficient kinetic energy has accumulated, the droplet will start to bounce off the surface.
When the surface is stationary, the receding rates of the droplet from both ends are the same (Figure 2(a), t = 3.83 ms), resulting in a symmetric bouncing phenomenon. When the surface is in motion, the receding rate on the upstream side is faster than on the downstream side. (Where downstream refers to the side in the direction of surface movement and the upstream side refers to the opposite direction, as shown in Figure 7(a), we will discuss the upstream and downstream in the subsequent sections.) This is due to the influence of surface velocity, causing more kinetic energy to accumulate on the upstream side resulting in a higher height than the downstream side, leading to an "L"-shaped droplet (Figure 2(b), t = 5.01 ~ 5.83 ms). As the surface velocity increases, the spreading length of the droplet is stretched longer under the influence of the surface forces, making the "L"-shape more pronounced. Subsequently, the droplet begins to bounce off the surface, compared to the stationary surface, the contact time is reduced from 8.17 ms to 7.17 ms when the surface is in motion. When the surface is stationary, both ends of the droplet simultaneously leave the surface, while in motion, the downstream side of the droplet will detach from the surface before the upstream side (Figure 2(b), t = 4.17 ms). This reduces the portion of the droplet in contact with the surface, leading to a reduction in the contact time [33].
In addition, we conducted statistical analysis of experiments involving different Wet and Wen for contact time, Figure 3(a) shows the normalized contact time τ/τ0 as a function of Wet under different Wen conditions, whereis the inertial-capillary time [34]. As seen, the contact time gradually decreases as Wet increases. The difference between the contact times at Wet = 0 and Wet= 116 is about 30%. However, the influence of different Wen groups on the contact time is relatively weak, these findings are consistent with previous conclusions on moving SHPSs [24,28].
- A.
- Momentum transfer of droplet on the moving surface.
The bouncing and spreading of droplets are essentially the exchange of kinetic energy and surface energy. When a droplet hits a stationary surface, it bounces vertically along the impact direction, while during surface motion, the rebound direction of the droplet tilts towards the direction of surface motion. Research has shown that there are two theories explaining the cause of this phenomenon. The first theory based on the aerodynamic Leidenfrost effect suggests it is due to the thin layer of air formed between the droplet and the surface [28], while the second theory proposes it is the result of liquid-surface contact forming a viscous boundary layer [30]. We are inclined towards the latter theory. Furthermore, this study is based on the no-slip boundary condition and derives the scaling relationship for the horizontal speed of droplet.
Accordingly, we calculated the center of mass from the shape of droplet in the side view, taking the moment of contact t = 0 ms as the starting point and the moment of rebound as the end point [Figure 4(a)], by measuring the displacement of the center of mass and the contact time, the averaged horizontal velocity Va of droplet can be obtained.
Initially, Va = 0, but due to the shear effect of the surface, the momentum increases during the impact process. Considering the total viscous force and combine Newton’s second law in the horizontal direction mdVa/dt = F(t), the average velocity in the horizontal direction can be obtained [30]:
where μ is the viscosity of the liquid, δ0 is the thickness of the boundary layer, t is the contact time of the droplet on the moving surface and D2(t) represents the contact area of the droplet. In previous studies, D2(t) is considered to be the square of the maximum spreading length on a stationary surface Dmax-s. However, the droplet is not circular on a moving surface. It will be stretched along the direction of surface movement, and the maximum spreading of the droplet in that direction is defined as Dmax-m, as shown in Figure 4(c). While the maximum spreading length in the perpendicular to horizontal direction is evidently smaller than Dmax-m, and this spreading length is approximately equal to the spreading length Dmax-s on a stationary surface have been demonstrated [35]. Based on this, we can deduce:
With the maximal spreading ratio of the drop βmax = Dmax/D0, the dimensionless integral mean value of boundary layer thickness δ = δ0/D0, the dimensionless contact time τ=Vnt/D0, we can derive that:
On the moving surface, the maximum spreading ratio βmax-m~Wen1/4Ca1/6 [28], where the capillary number Ca=μVt/γ. (Despite this equation being based on the aerodynamic Leidenfrost effect, our experimental results have shown good agreement with it, the comparative results in Supplementary Material Figure S1.) While on the stationary surface, the maximum spreading ratio βmax-s~Wen1/4(1-cosθ)-1/2 [36].
Another aspect that distinguishes our work from previous research is that they considered the contact time τ in Eq. (3) as the contact time on a stationary surface τs, while we consider τ as the contact time on a moving surface τm. In Figure 3(a), we can clearly observe a significant difference in contact time between τs and τm. Based on volume conservation, the relationship between these two is given by [37]:
The validation of Eq. (3) can be observed in Supplementary Material Figure S2. The contact time on the stationary surface τs~Wen1/2(1-cosθ)-1/2. By combining Eq. (3) and Eq. (4) with the above scaling relationships, we can deduce:
Where the dimensionless Reynolds number is defined as Re=ρVnD0/μ, Eq. (5) is derived using the contact time τm and maximum spreading ratio βmax-m on a moving surface. If we were to derive it using the contact time τs and maximum spreading ratio βmax-s on a stationary surface [30], we can derive:
When comparing Eq. (5) and (6), the difference is the additional influence of the capillary number Ca in Eq. (5). This inclusion of Ca enhances the influence of surface motion on the droplet velocity and making it a more accurate representation. The boundary layer thickness and contact angle can be regarded as constant values. Therefore, the Eq. (5) can be expressed as:
In Figure 5, we can observe a good consistency between the experimental data and Eq. (6).
As previously mentioned, the conversion of momentum during droplet impact involves the consumption of energy. This implies that the averaged horizontal velocity of the droplet Va should be lower than the surface velocity Vt. We found that the velocity of the droplet is only about 1% of the surface movement velocity. As a result, we defined the averaged restitution coefficient εt = Va/Vt. Previous research has demonstrated a negative correlation between Wen and εt because higher Wen impacts can cause more significant droplet deformation, leading to more energy dissipation during rebound and a decrease in εt [38-42]. However, our study on the moving surface revealed an opposing result, we found that εt increases with the increase of Wen, as shown in Figure 6(a), and there is no significant change with the increase of Wet, as shown in Figure 6(b), the black line in the box represents the median line, and the point in the middle is the mean value. The upper and lower boundaries of the box represent the upper interquartile and lower interquartile, respectively, while the whiskers represent the extreme values. Firstly, previous studies focused on instantaneous velocity, while this study specifically examines the average velocity throughout the entire impact process. Secondly, a significant factor is that as the droplet impacts a moving surface, with an increase in the Weber number, the spreading length increases. This results in the viscous boundary layer length between the droplet and the surface also increasing, leading to an increase in the force exerted on the droplet in the horizontal direction. Ultimately, this is manifested as an increase in the coefficient of restitution.
- B.
- Morphology of droplet on moving surface
We conducted an analysis of changes in droplet behavior from a momentum perspective. In addition, the most significant difference between the stationary and moving surfaces is not only the contact time, but also the asymmetric spreading and receding of the droplet on the upstream and downstream sides.
Figure 7.
(a) Schematic diagram distinguishing the upstream and downstream spreading of the droplet. The red dot represents the initial center of impact of the droplet, while the green dot indicates the position after moving with velocity Va. The green dot serves as the reference for defining the boundary between the upstream and downstream regions, where Ds=0. (b) Side view of the droplet at different time instances. (c) Schematic representation of the velocity superposition of Vs and Vt.
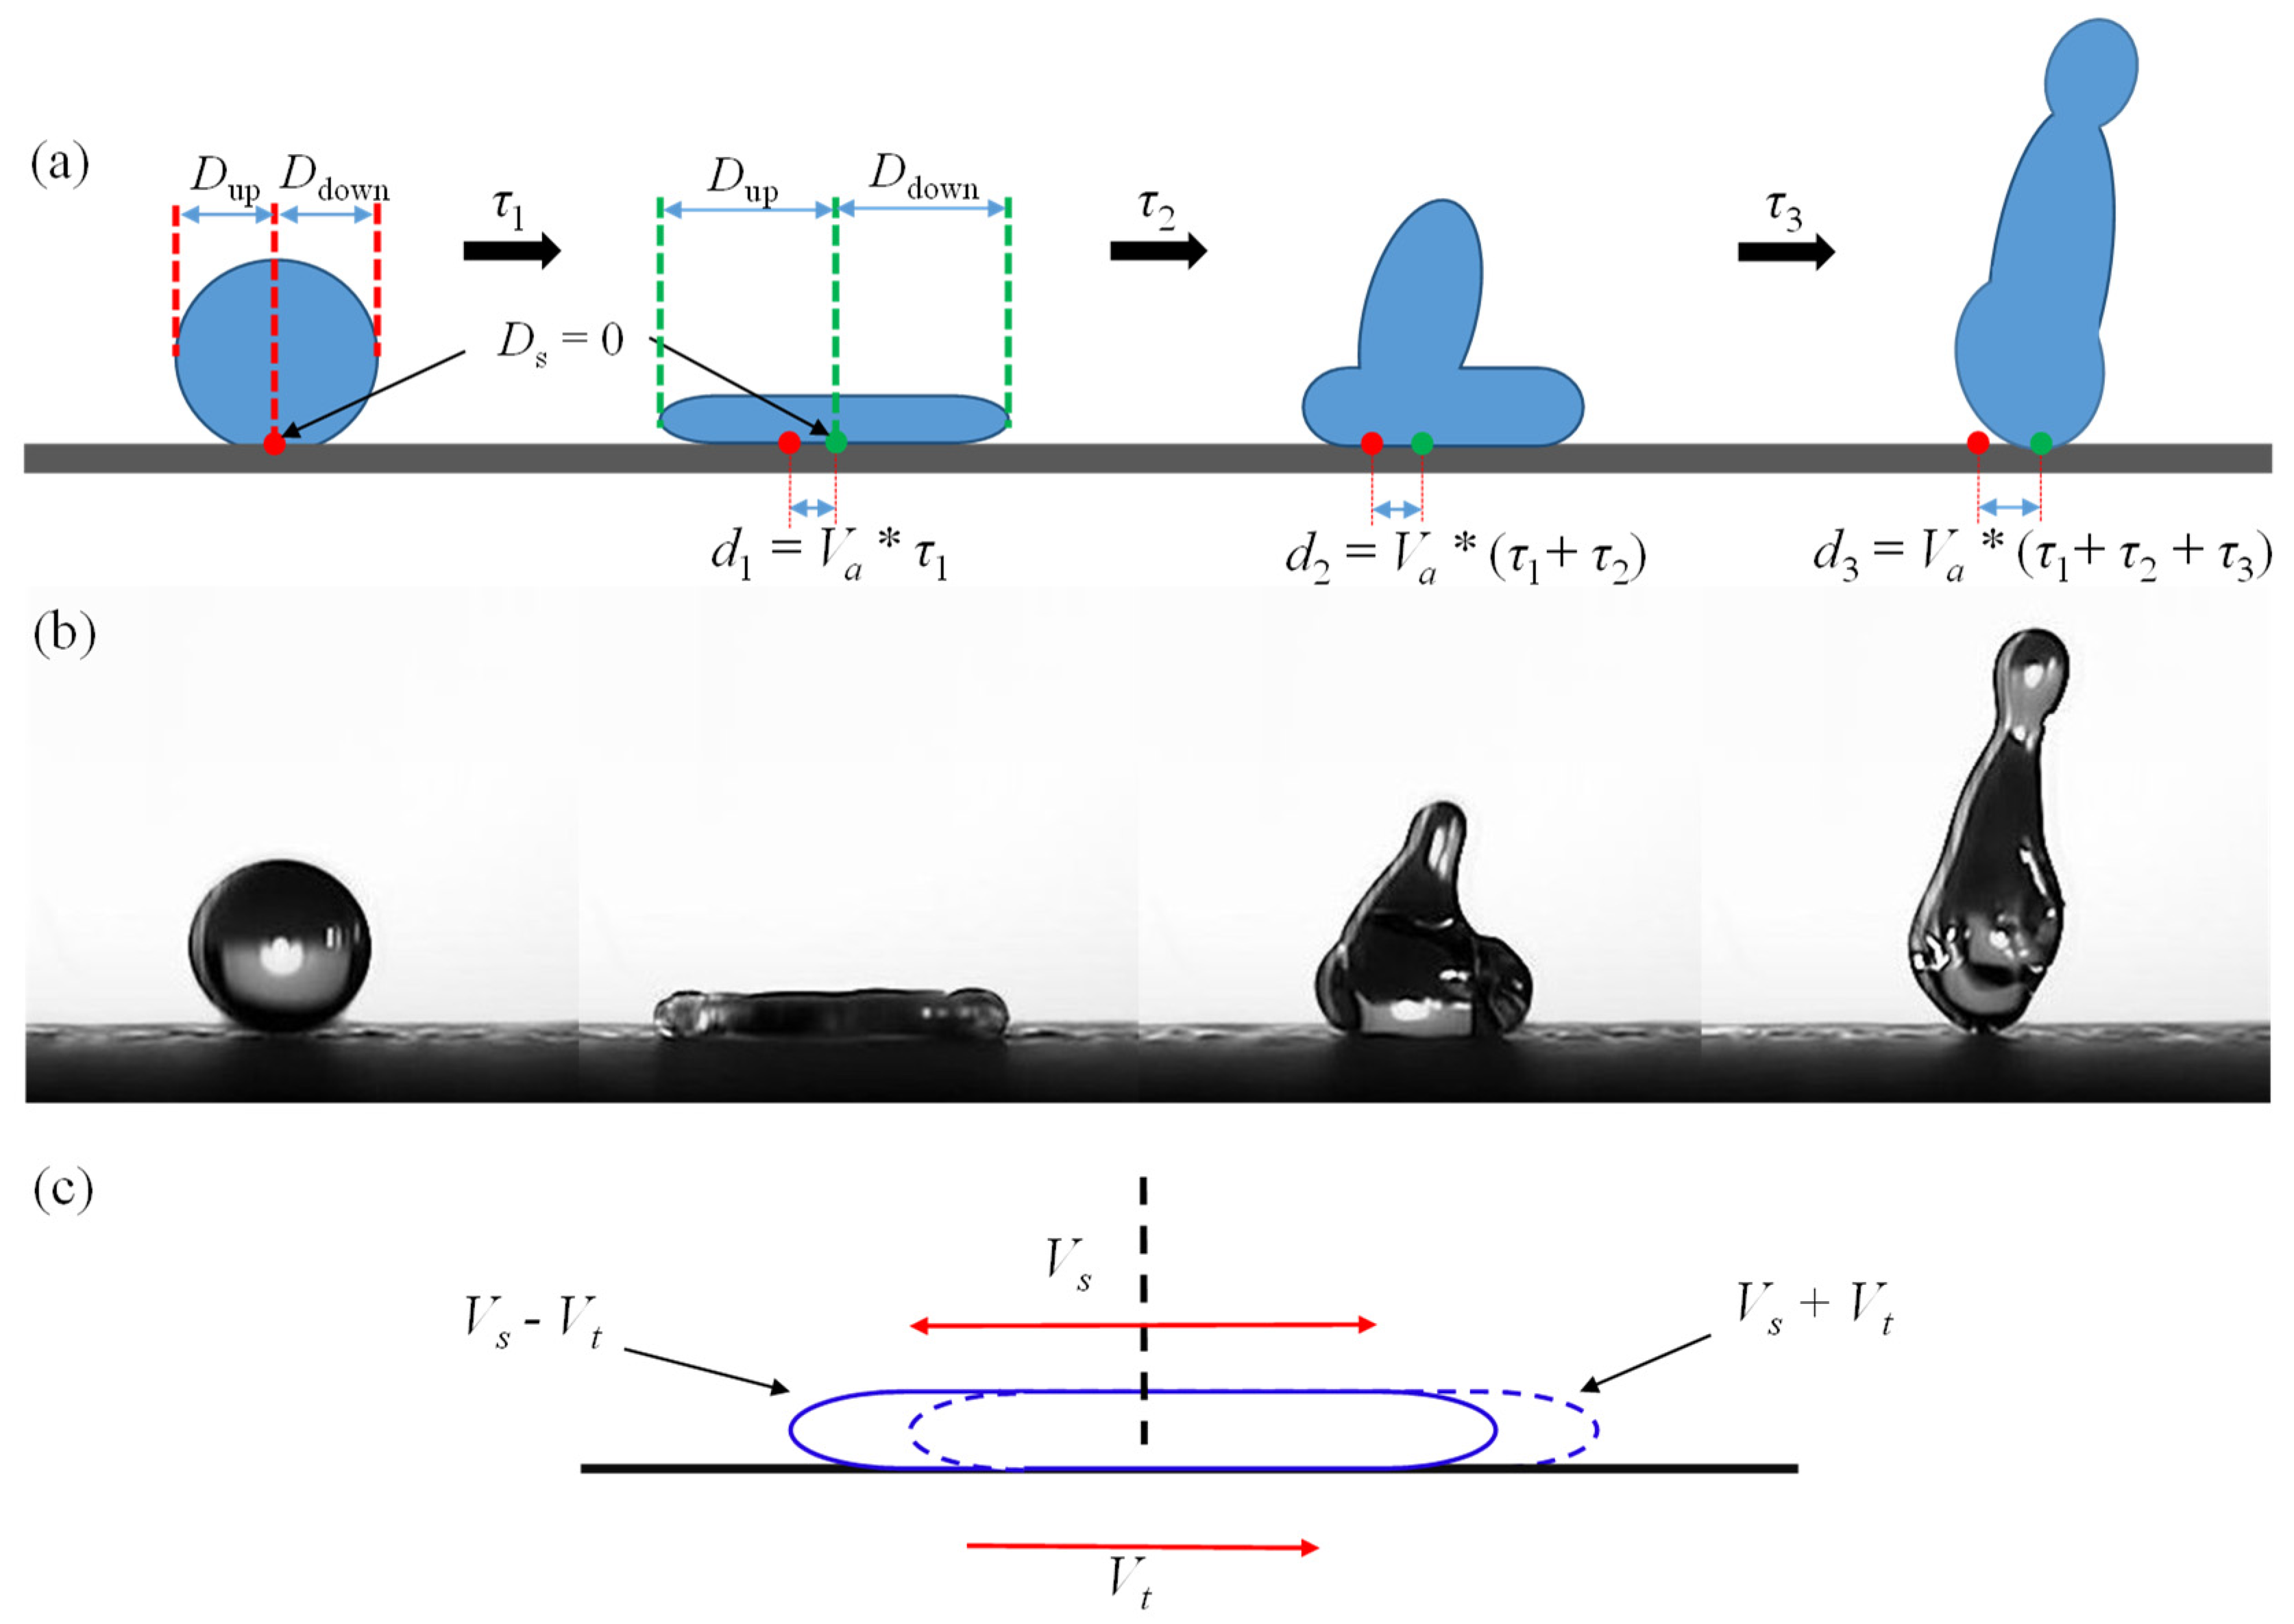
Therefore, we divided the droplet into two portions Dup and Ddown based on the impact center point. Initially, the positions of the center points Ds=0 is represented by the red dot [Figure 7(a)]. And it varies at different moments, it moves with the horizontal velocity Va of the droplet, as indicated by the green point in Figure 7(a). The distance from the point along the moving direction to the edge of the droplet is referred to as Dup, and the distance from the point along the opposite direction of motion to the edge of the droplet is referred to as Ddown. When Wet =0, the spreading length of the droplet on the upstream and downstream sides is symmetrically distributed along Ds=0. However, as Wet increases, the spreading length of the droplet on the upstream side gradually increases, and its spreading time becomes longer, as shown in Figure 8(a) and 8(b), the negative values in Figure 8(a) represent that the droplet is located to the right of the boundary point. In addition, the time of initiating receding on the upstream side is later than that on the downstream side. For different Wet values, the spreading time of the downstream side is around 2 ms, and it has almost no effect on the length of spreading. However, the length during the receding phase gradually reduces with the increase of surface speed. In Figure 8(c) and 8(d), with a fixed Wet = 44.06 and different Wen, the spreading length on both the upstream and downstream sides increases with Wen, with the increment being more significant on the downstream side.
Although the increment of spreading length on the upstream side during the receding phase is relatively small compared to that in the spreading phase, it still increases overall. Thus, we postulate that when the droplet reaches its maximum spreading length, the length of the upstream and downstream portions should be a function of the impact velocity Vn and surface velocity Vt. Assuming that the averaged spreading velocity is Vs and the surface velocity is Vt, the averaged velocity of the upstream can be treated as Vup = Vs - Vt, similarly, the averaged velocity of the downstream is Vdown = Vs + Vt, as shown in Figure 7(c). Taking into account that droplet will also move a certain distance caused by the moving substrate, the maximal spread length ratio of the upstream to downstream can be expressed as:
If the droplet's upstream and downstream are distinguished based on the calculated moving distance of the green dot, then the term Vaτs representing the sliding distance of the droplet in Eq. (7) can be eliminated, the formula can be simplified as:
Obviously, Vt ~ αWet1/2, and for Vs, it is a function of the maximum spreading length and spreading time, Vs ~Dmax/τspread. As can be observed in Figure 3(b), the spreading time τspread is independent of surface velocity and impact velocity, which is consistent with previous research findings [3,28]. Therefore, we can treat τspread as a constant, while Dmax ~D0Wen1/4, based on these, we can derive the expression for Vs ~ βWen1/4, Substituting these values into Eq. (8) we have:
Where coefficients α and β are related constants, Eq. (10) can be written as Eq. (11):
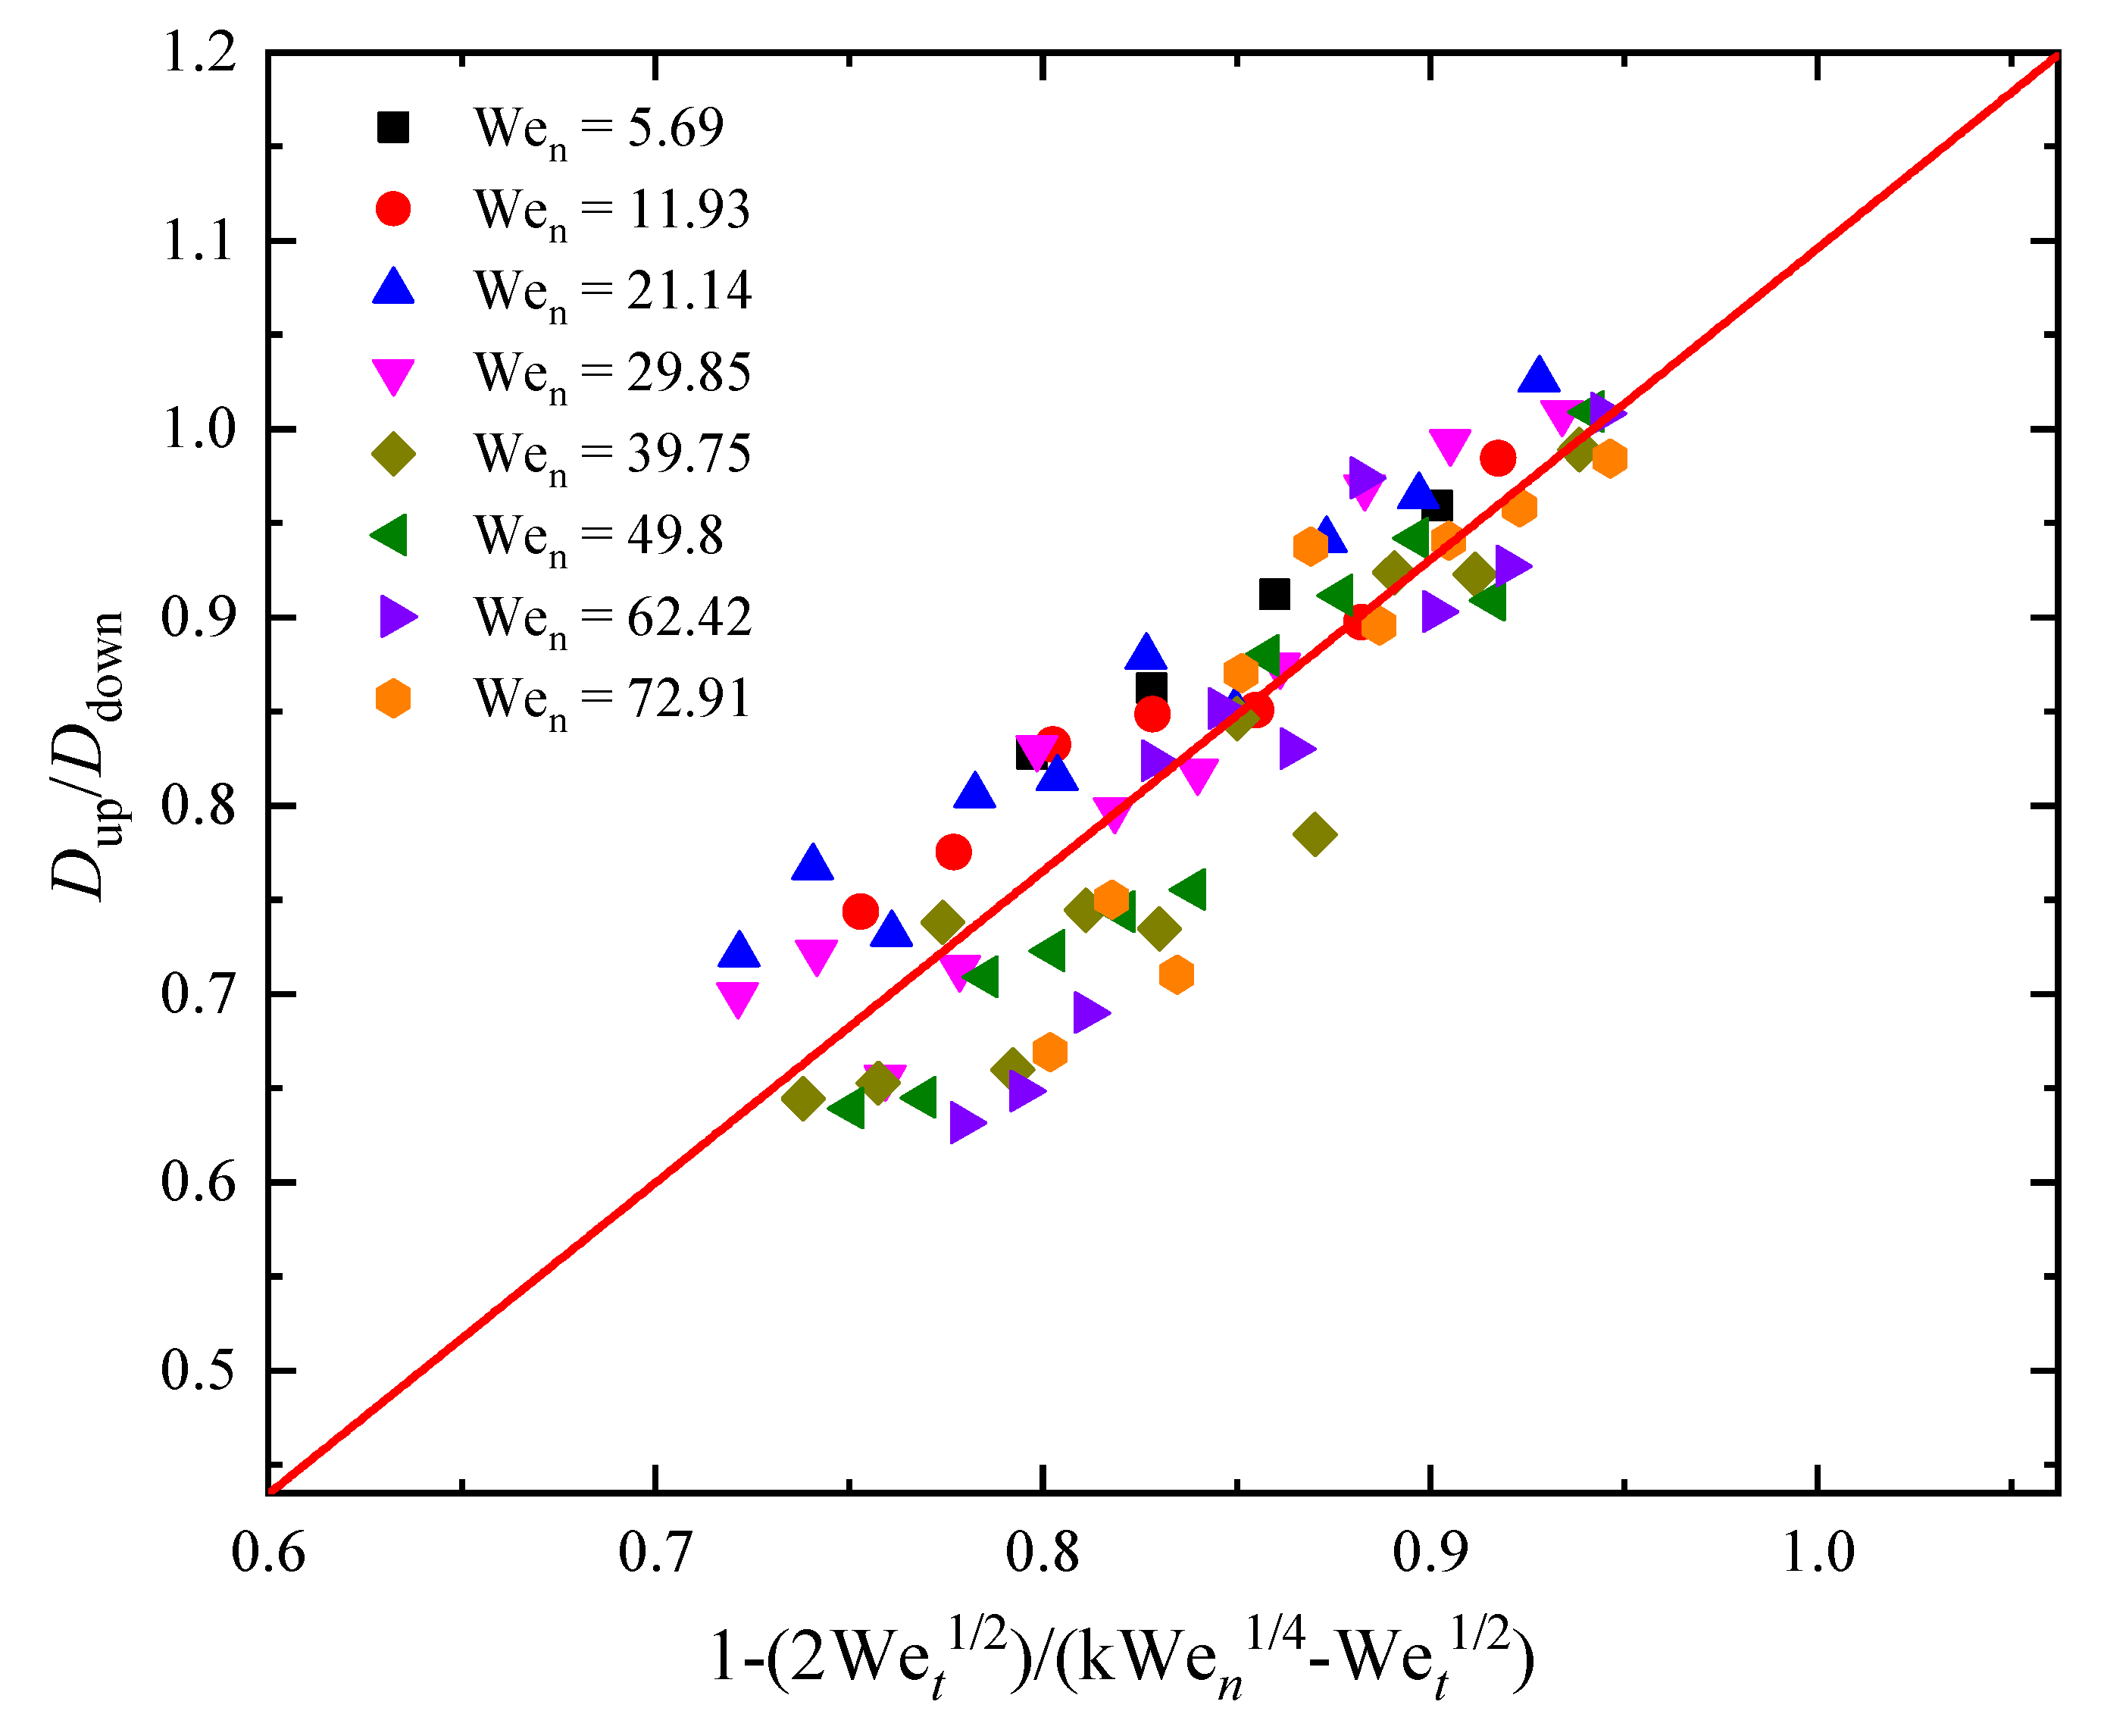
Where coefficients k=α/β. In Figure 9, we can observe a good consistency between the experimental data and Eq. (11). This scaling relationship has practical applications such as using water to cool rotating machinery, understanding the spreading range of droplet holds significance for such applications [43].
IV. CONCLUSIONS
In this study, experiments have shown that the contact time between water droplets and surfaces is inversely proportional to surface velocity. Our main conclusions are as follows. 1. We have refined the scaling relationship for the horizontal velocity Va of the droplet. Previous conclusions were derived by approximating the droplet's spreading on a moving surface as a circular shape, and in doing so, the droplet's contact time τm was considered equal to τs. However, in actually, the droplet elongates in the direction of surface motion, considering it as a circular is inaccurate. And the droplet's contact time on a moving surface τm is less than τs. These corrections make the scaling relationship more accurate. 2. Furthermore, an investigation into the variation relationship between the droplet's tangential restitution coefficient εt and Weber numbers Wen and Wet was conducted. Additionally, we were surprised to discover that the velocity of the droplets was only about 1% of the SHPSs speed, we will focus on exploring ways to improve the exchange rate of droplet momentum in future work. 3. Based on the asymmetry of droplet spreading, a coupling scale relationship between the maximum spreading length ratio of water droplets upstream and downstream was revealed by superimposing the spreading velocity and the surface velocity, which finding can be applied to temperature reduction in moving machinery. These has provided us with new insights into the energy transfer mechanisms of small droplets.
Supplementary Materials
The following supporting information can be downloaded at the website of this paper posted on Preprints.org. Figure S1: The validation of the maximum spreading ratio βmax-m on a moving surface. Figure S2: The validation of the contact time τm on a moving surface.
Acknowledgments
This work was supported by the National Natural Science Foundation of China (Grant No. 12002212, 11872283) and Shanghai Sailing Program (Grant No. 20YF1432800). The grant is gratefully acknowledged.
Data Availability
The data that support the findings of this study are available within the article and its supplementary material.
References
- X. Cheng, T.-P. X. Cheng, T.-P. Sun, and L. Gordillo, Annual Review of Fluid Mechanics 54, 57 (2022).
- J. De Ruiter, R. J. De Ruiter, R. Lagraauw, D. Van Den Ende, and F. Mugele, Nature physics 11, 48 (2015).
- Josserand and S., T. Thoroddsen, Annual review of fluid mechanics 48, 365 (2016).
- R. Enright, N. R. Enright, N. Miljkovic, J. Sprittles, K. Nolan, R. Mitchell, and E. N. Wang, ACS nano 8, 10352 (2014).
- F. Liu, G. F. Liu, G. Ghigliotti, J. J. Feng, and C.-H. Chen, Journal of Fluid mechanics 752, 39 (2014).
- X. Liu, P. X. Liu, P. Cheng, and X. Quan, International Journal of Heat and Mass Transfer 73, 195 (2014).
- X. Han, J. X. Han, J. Li, X. Tang, W. Li, H. Zhao, L. Yang, and L. Wang, Small 18, 2200277 (2022).
- X. Yu, Y. X. Yu, Y. Zhang, R. Hu, and X. Luo, Nano Energy 81, 105647 (2021).
- R. Esmaeili, N. R. Esmaeili, N. Mir, and R. Mohammadi, Langmuir 37, 841 (2021).
- H. Liu, C. H. Liu, C. Si, C. Cai, C. Zhao, and H. Yin, Chemical Engineering Science 229, 116106 (2021).
- V. Fink, X. V. Fink, X. Cai, A. Stroh, R. Bernard, J. Kriegseis, B. Frohnapfel, H. Marschall, and M. Wörner, International Journal of Heat and Fluid Flow 70, 271 (2018).
- K. Okumura, F. K. Okumura, F. Chevy, D. Richard, D. Quéré, and C. Clanet, Europhysics Letters 62, 237 (2003).
- Y. Guo, Y. Y. Guo, Y. Lian, and M. Sussman, Physics of Fluids 28, 073303 (2016).
- S. Stevens, A. S. Stevens, A. Latka, and S. R. Nagel, Physical Review E 89, 063006 (2014).
- T.-S. Zen, F.-C. T.-S. Zen, F.-C. Chou, and J.-L. Ma, International communications in heat and mass transfer 37, 1025 (2010).
- W. Yu, D. W. Yu, D. Zhu, W. Wang, Z. Yu, S. Chen, and J. Zhao, Applied Physics Letters 121, 061602 (2022).
- Clanet, C. Béguin, D. Richard, and D. Quéré, Journal of Fluid Mechanics 517, 199 (2004).
- M. J. Kreder, J. M. J. Kreder, J. Alvarenga, P. Kim, and J. Aizenberg, Nature Reviews Materials 1, 1 (2016).
- S. Ren, S. S. Ren, S. Wang, Z. Dong, J. Chen, and L. Li, Colloids and Surfaces A: Physicochemical and Engineering Aspects 626, 127056 (2021).
- J. C. Bird, R. J. C. Bird, R. Dhiman, H.-M. Kwon, and K. K. Varanasi, Nature 503, 385 (2013).
- Y. Liu, G. Y. Liu, G. Whyman, E. Bormashenko, C. Hao, and Z. Wang, Applied Physics Letters 107, 051604 (2015).
- J. Hou, J. J. Hou, J. Gong, X. Wu, and Q. Huang, International Journal of Heat and Mass Transfer 183, 122044 (2022).
- N. Reis, C. N. Reis, C. Ainsley, and B. Derby, Journal of Applied Physics 97, 094903 (2005).
- X. Zhang, Z. X. Zhang, Z. Zhu, C. Zhang, and C. Yang, Applied Physics Letters 117, 151602 (2020).
- R. Tao et al., Research 6, 0023 (2023).
- Chu, S. Li, Z. Hu, and X. Wu, Applied Physics Letters 122 (2023).
- Gauthier, J. C. Bird, C. Clanet, and D. Quéré, Physical Review Fluids 1, 084002 (2016).
- H. Zhan, C. H. Zhan, C. Lu, C. Liu, Z. Wang, C. Lv, and Y. Liu, Physical Review Letters 126, 234503 (2021).
- P. García-Geijo, G. P. García-Geijo, G. Riboux, and J. M. Gordillo, Journal of Fluid Mechanics 897, A12 (2020).
- M. Wang et al., Iscience 26 (2023).
- Y. Shu, F. Y. Shu, F. Chu, Z. Hu, J. Gao, X. Wu, Z. Dong, and Y. Feng, ACS Applied Materials & Interfaces 14, 57340 (2022).
- M. Moqaddam, S. S. M. Moqaddam, S. S. Chikatamarla, and I. V. Karlin, Journal of Fluid Mechanics 824, 866 (2017).
- S. Moghtadernejad, M. S. Moghtadernejad, M. Jadidi, J. Hanson, and Z. Johnson, Physics of Fluids 34, 062104 (2022).
- Richard, C. Clanet, and D. Quéré, Nature 417, 811 (2002).
- H. Almohammadi and A. Amirfazli, Langmuir 33, 5957 (2017).
- S.-R. Gao, B.-J. S.-R. Gao, B.-J. Wei, J.-X. Jin, J.-S. Ye, Y.-F. Wang, S.-F. Zheng, Y.-R. Yang, and X.-D. Wang, Physics of Fluids 34 (2022).
- X. Zhang, Z. X. Zhang, Z. Zhu, C. Zhang, and C. Yang, Applied Physics Letters 117 (2020).
- Aria and, M. Gharib, Langmuir 30, 6780 (2014).
- V. Bertola, International journal of heat and mass transfer 52, 1786 (2009).
- A.-L. Biance, F. A.-L. Biance, F. Chevy, C. Clanet, G. Lagubeau, and D. Quéré, Journal of Fluid Mechanics 554, 47 (2006).
- L. Chen, Z. L. Chen, Z. Xiao, P. C. Chan, Y.-K. Lee, and Z. Li, Applied surface science 257, 8857 (2011).
- L. Qian, B. L. Qian, B. Huo, Z. Chen, E. Li, and H. Ding, International Journal of Multiphase Flow 165, 104454 (2023).
- L. Yarin, Annu. Rev. Fluid Mech. 38, 159 (2006).
Figure 1.
(a) Schematic of the experimental setup. (b) View from above showing the position of the camera, droplet impact point, and center of the circular SHPS.
Figure 1.
(a) Schematic of the experimental setup. (b) View from above showing the position of the camera, droplet impact point, and center of the circular SHPS.
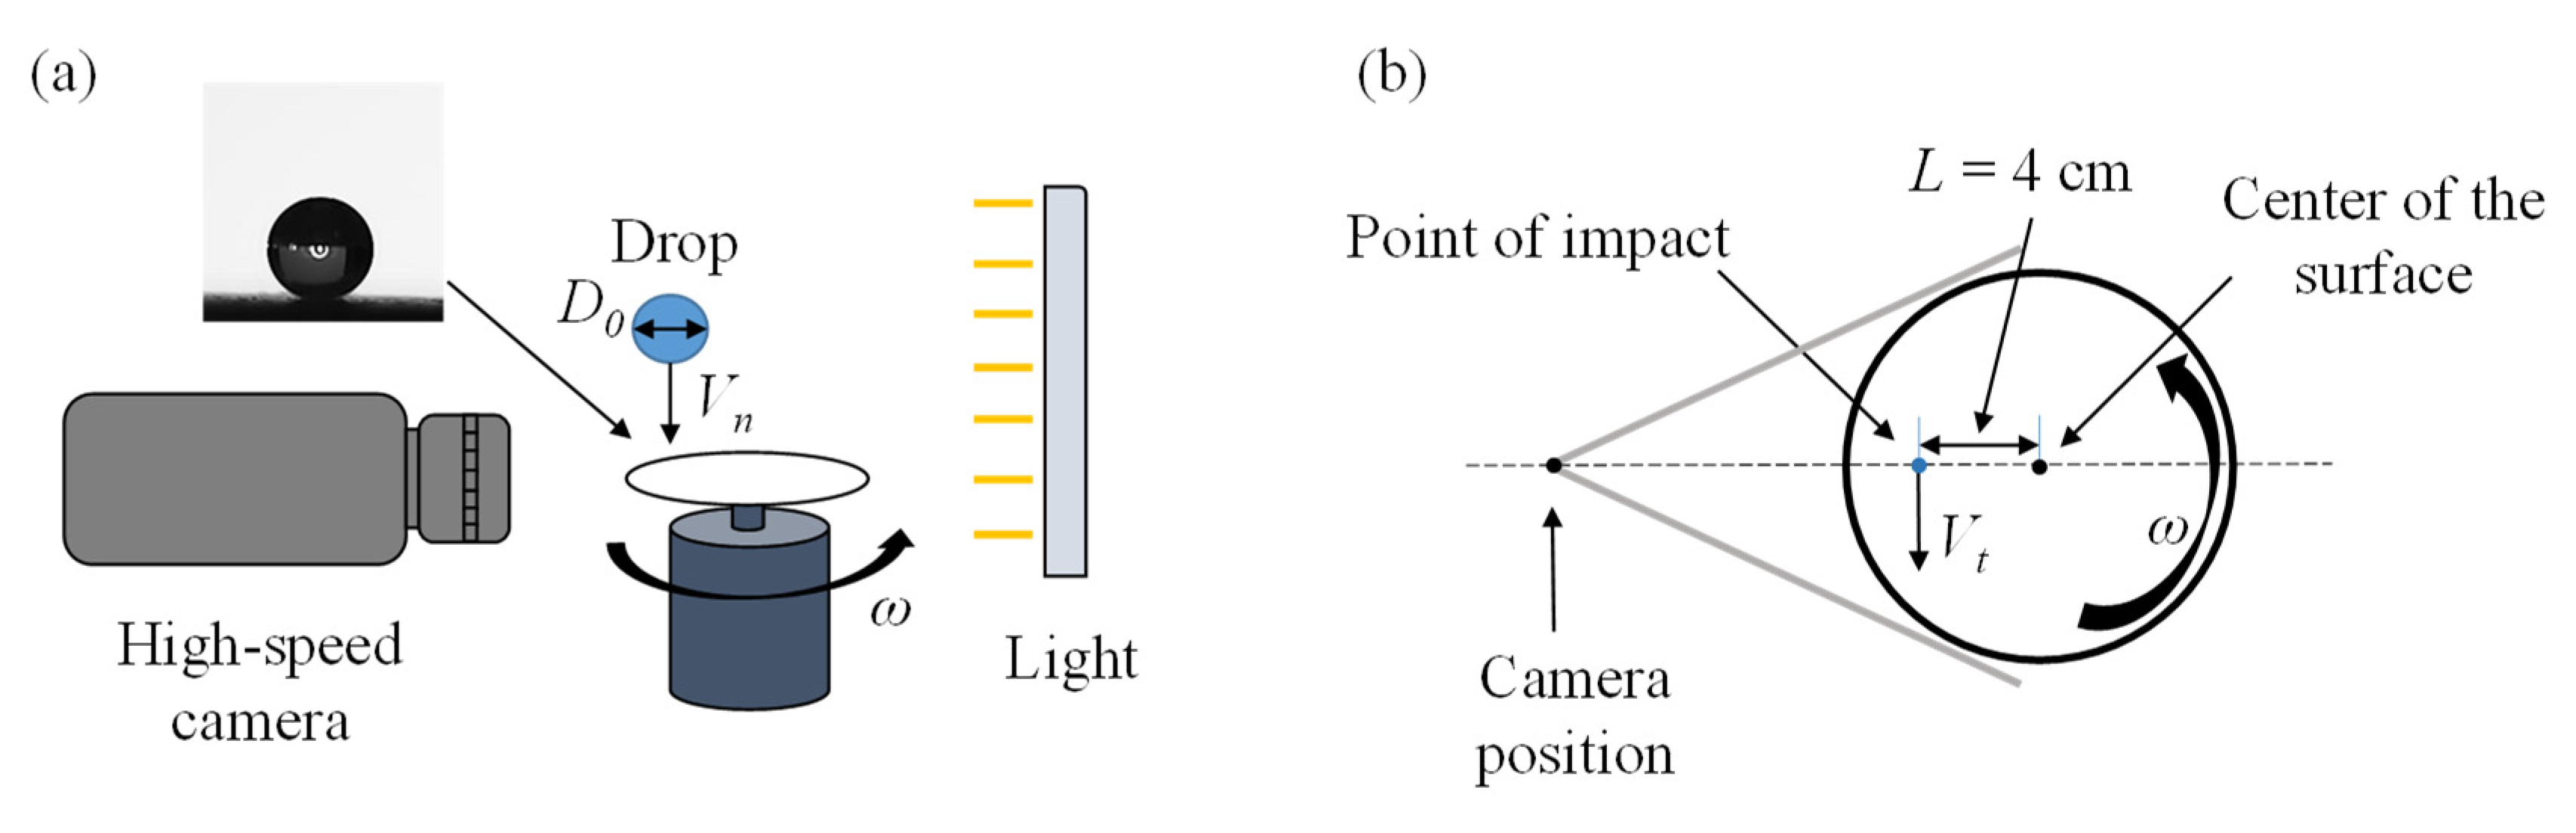
Figure 2.
(a) Snapshot of droplet impact on the SHPS for Wen = 29.80 and Wet = 0. (b) Snapshot of droplet impact on the SHPS for Wen = 29.80 and Wet = 44.06. (Multimedia view).
Figure 2.
(a) Snapshot of droplet impact on the SHPS for Wen = 29.80 and Wet = 0. (b) Snapshot of droplet impact on the SHPS for Wen = 29.80 and Wet = 44.06. (Multimedia view).
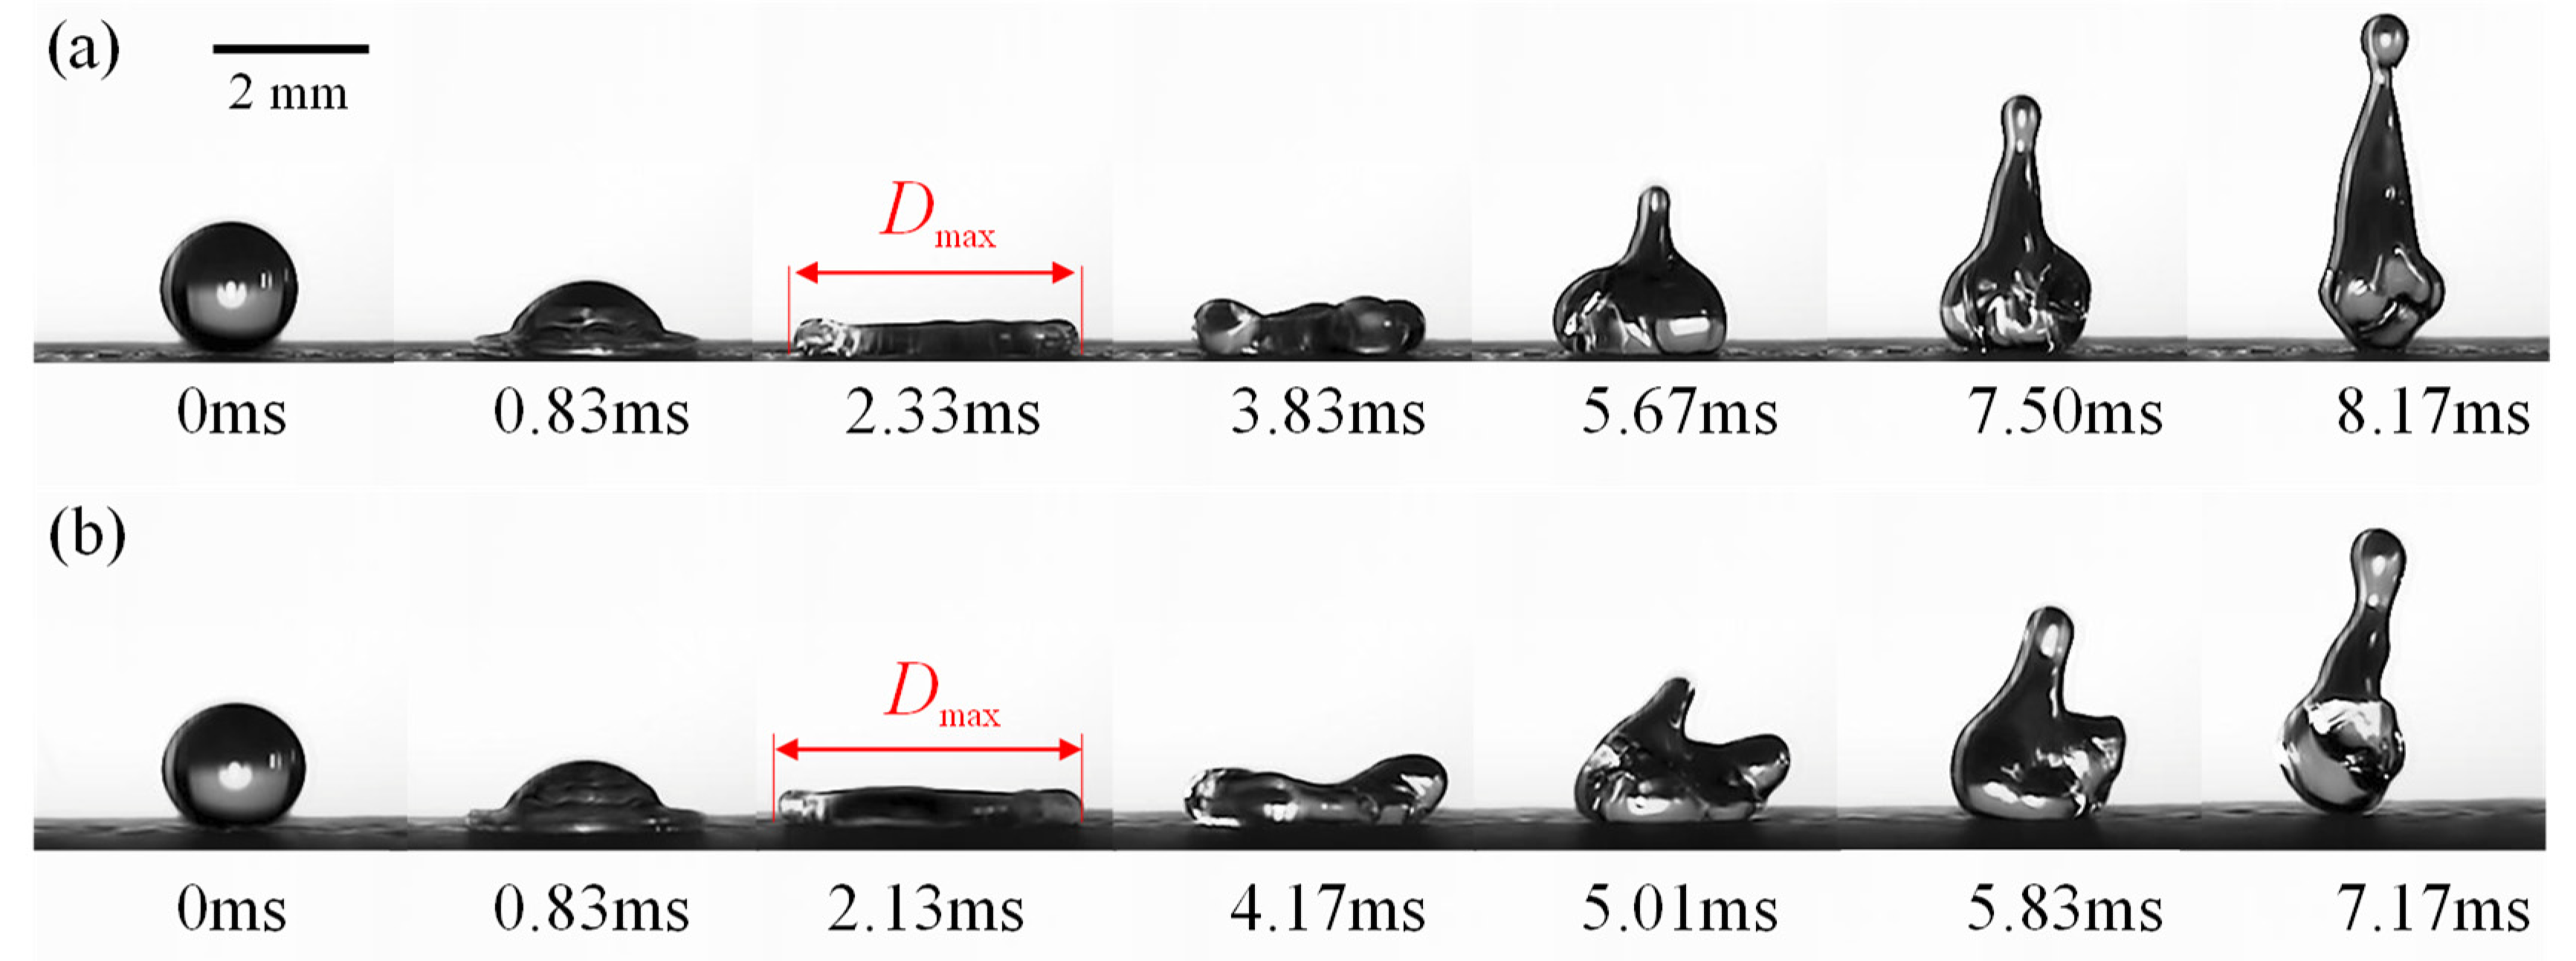
Figure 3.
(a) Normalized contact time τ/τ0 under different Wen groups varies as the change of Wet, where τ0 is the inertial-capillary time. (b) Spreading time τspread and retraction time τretract varies as the change of Wet.
Figure 3.
(a) Normalized contact time τ/τ0 under different Wen groups varies as the change of Wet, where τ0 is the inertial-capillary time. (b) Spreading time τspread and retraction time τretract varies as the change of Wet.
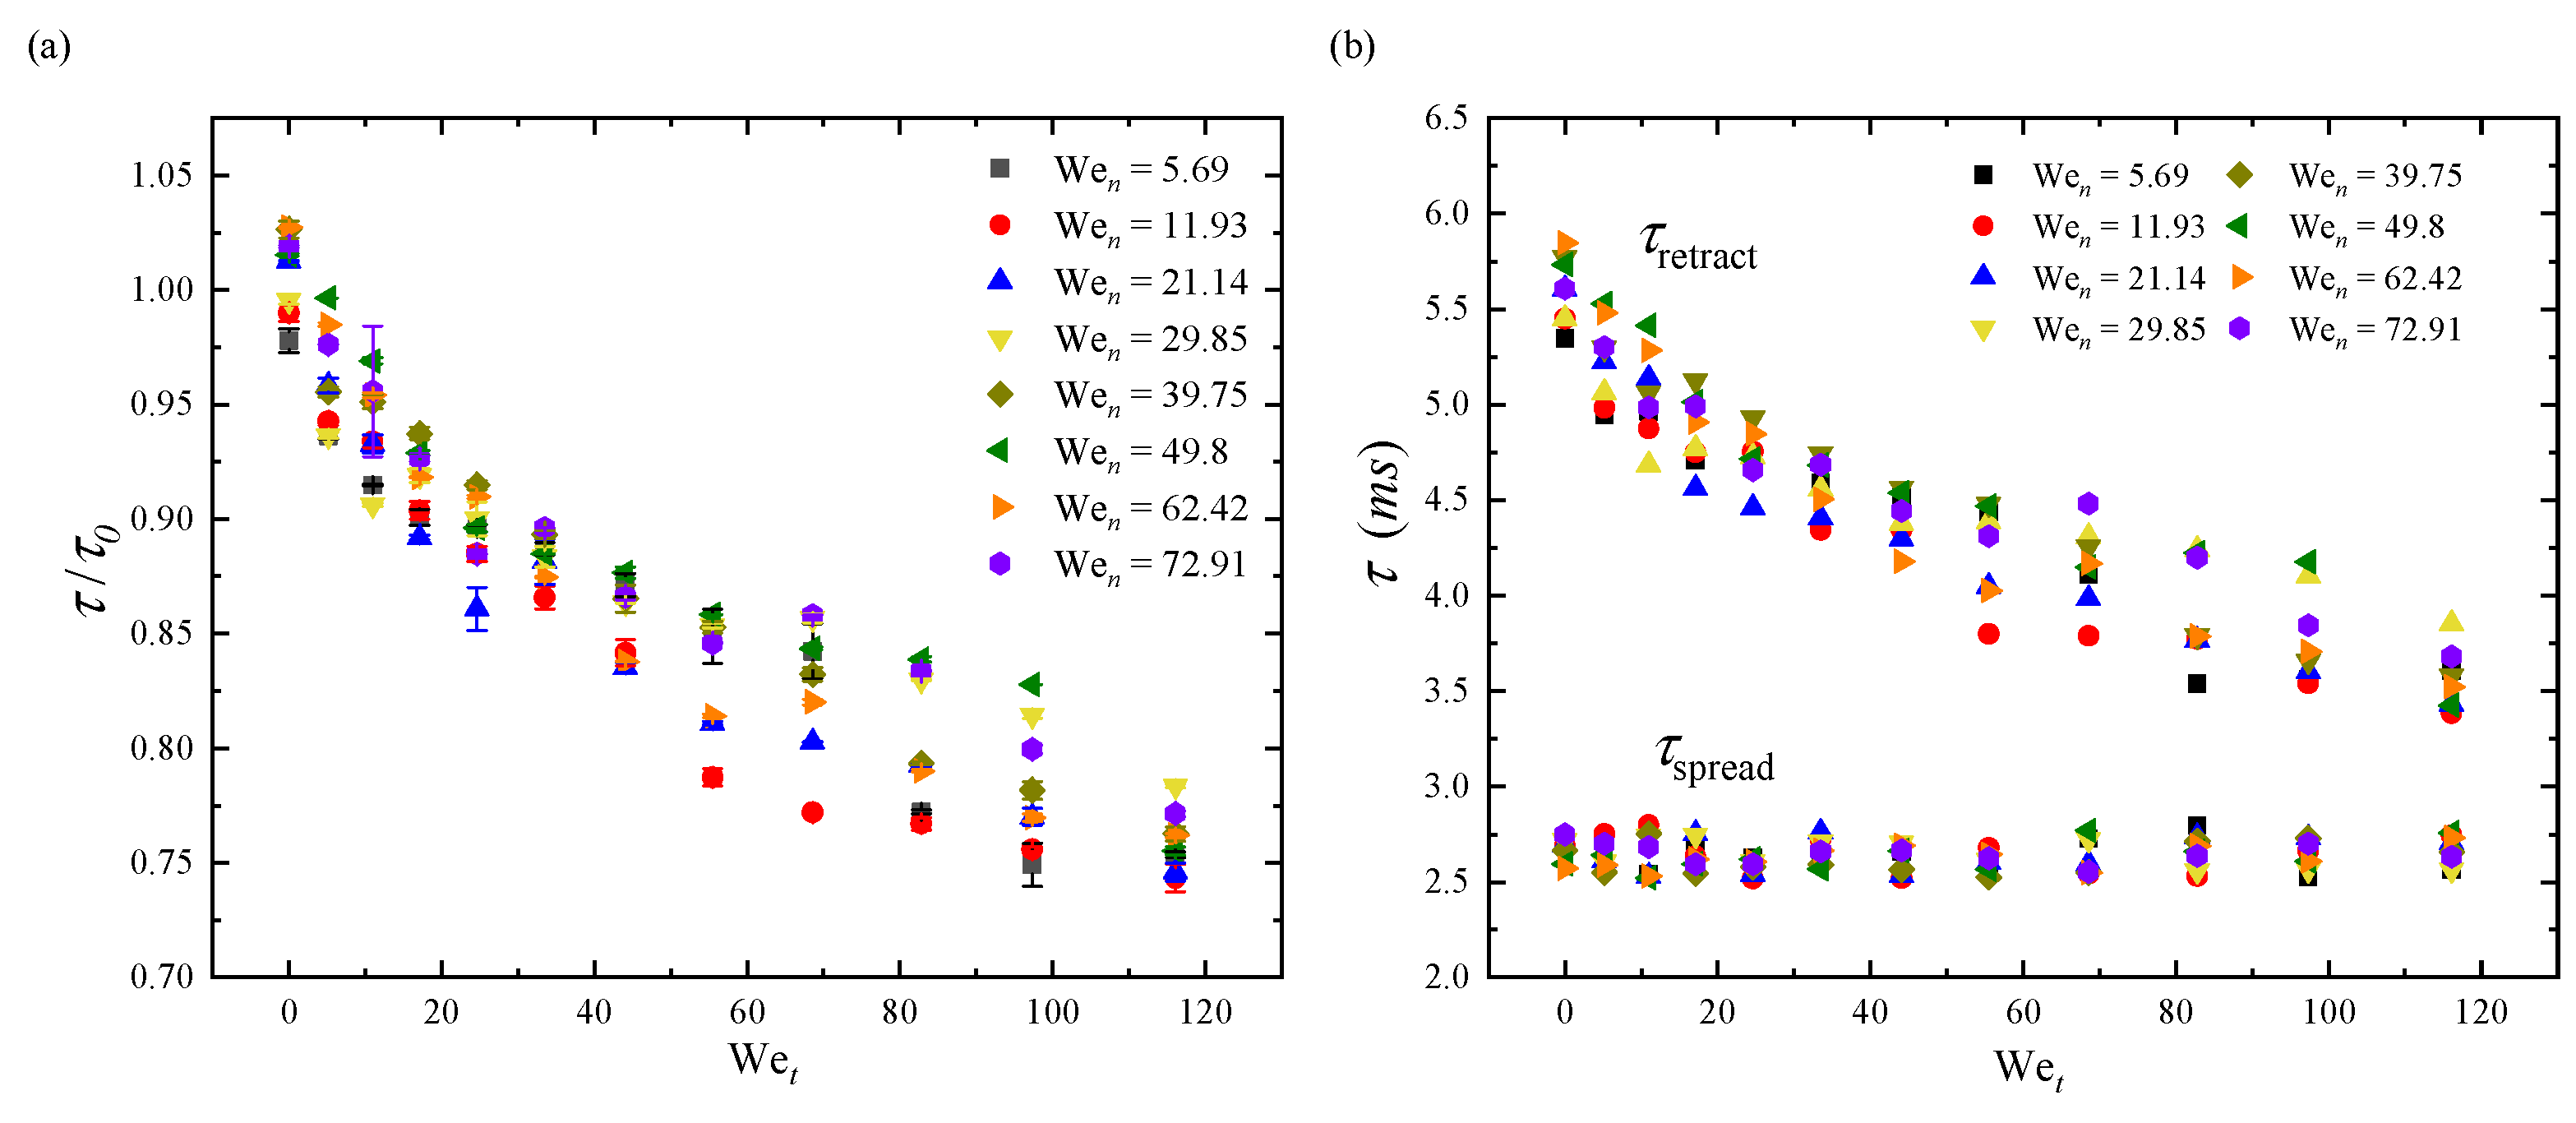
Figure 4.
(a) The blue dot represents the centroid of the droplet, from which the droplet velocity Va is calculated based on the distance moved in the horizontal direction. (b) Side view of the droplet at different time instances. (c) Top view of the droplet at different time instances, where Dmax-s and Dmax-m denote the maximum spreading lengths of the droplet on stationary and moving surfaces, respectively.
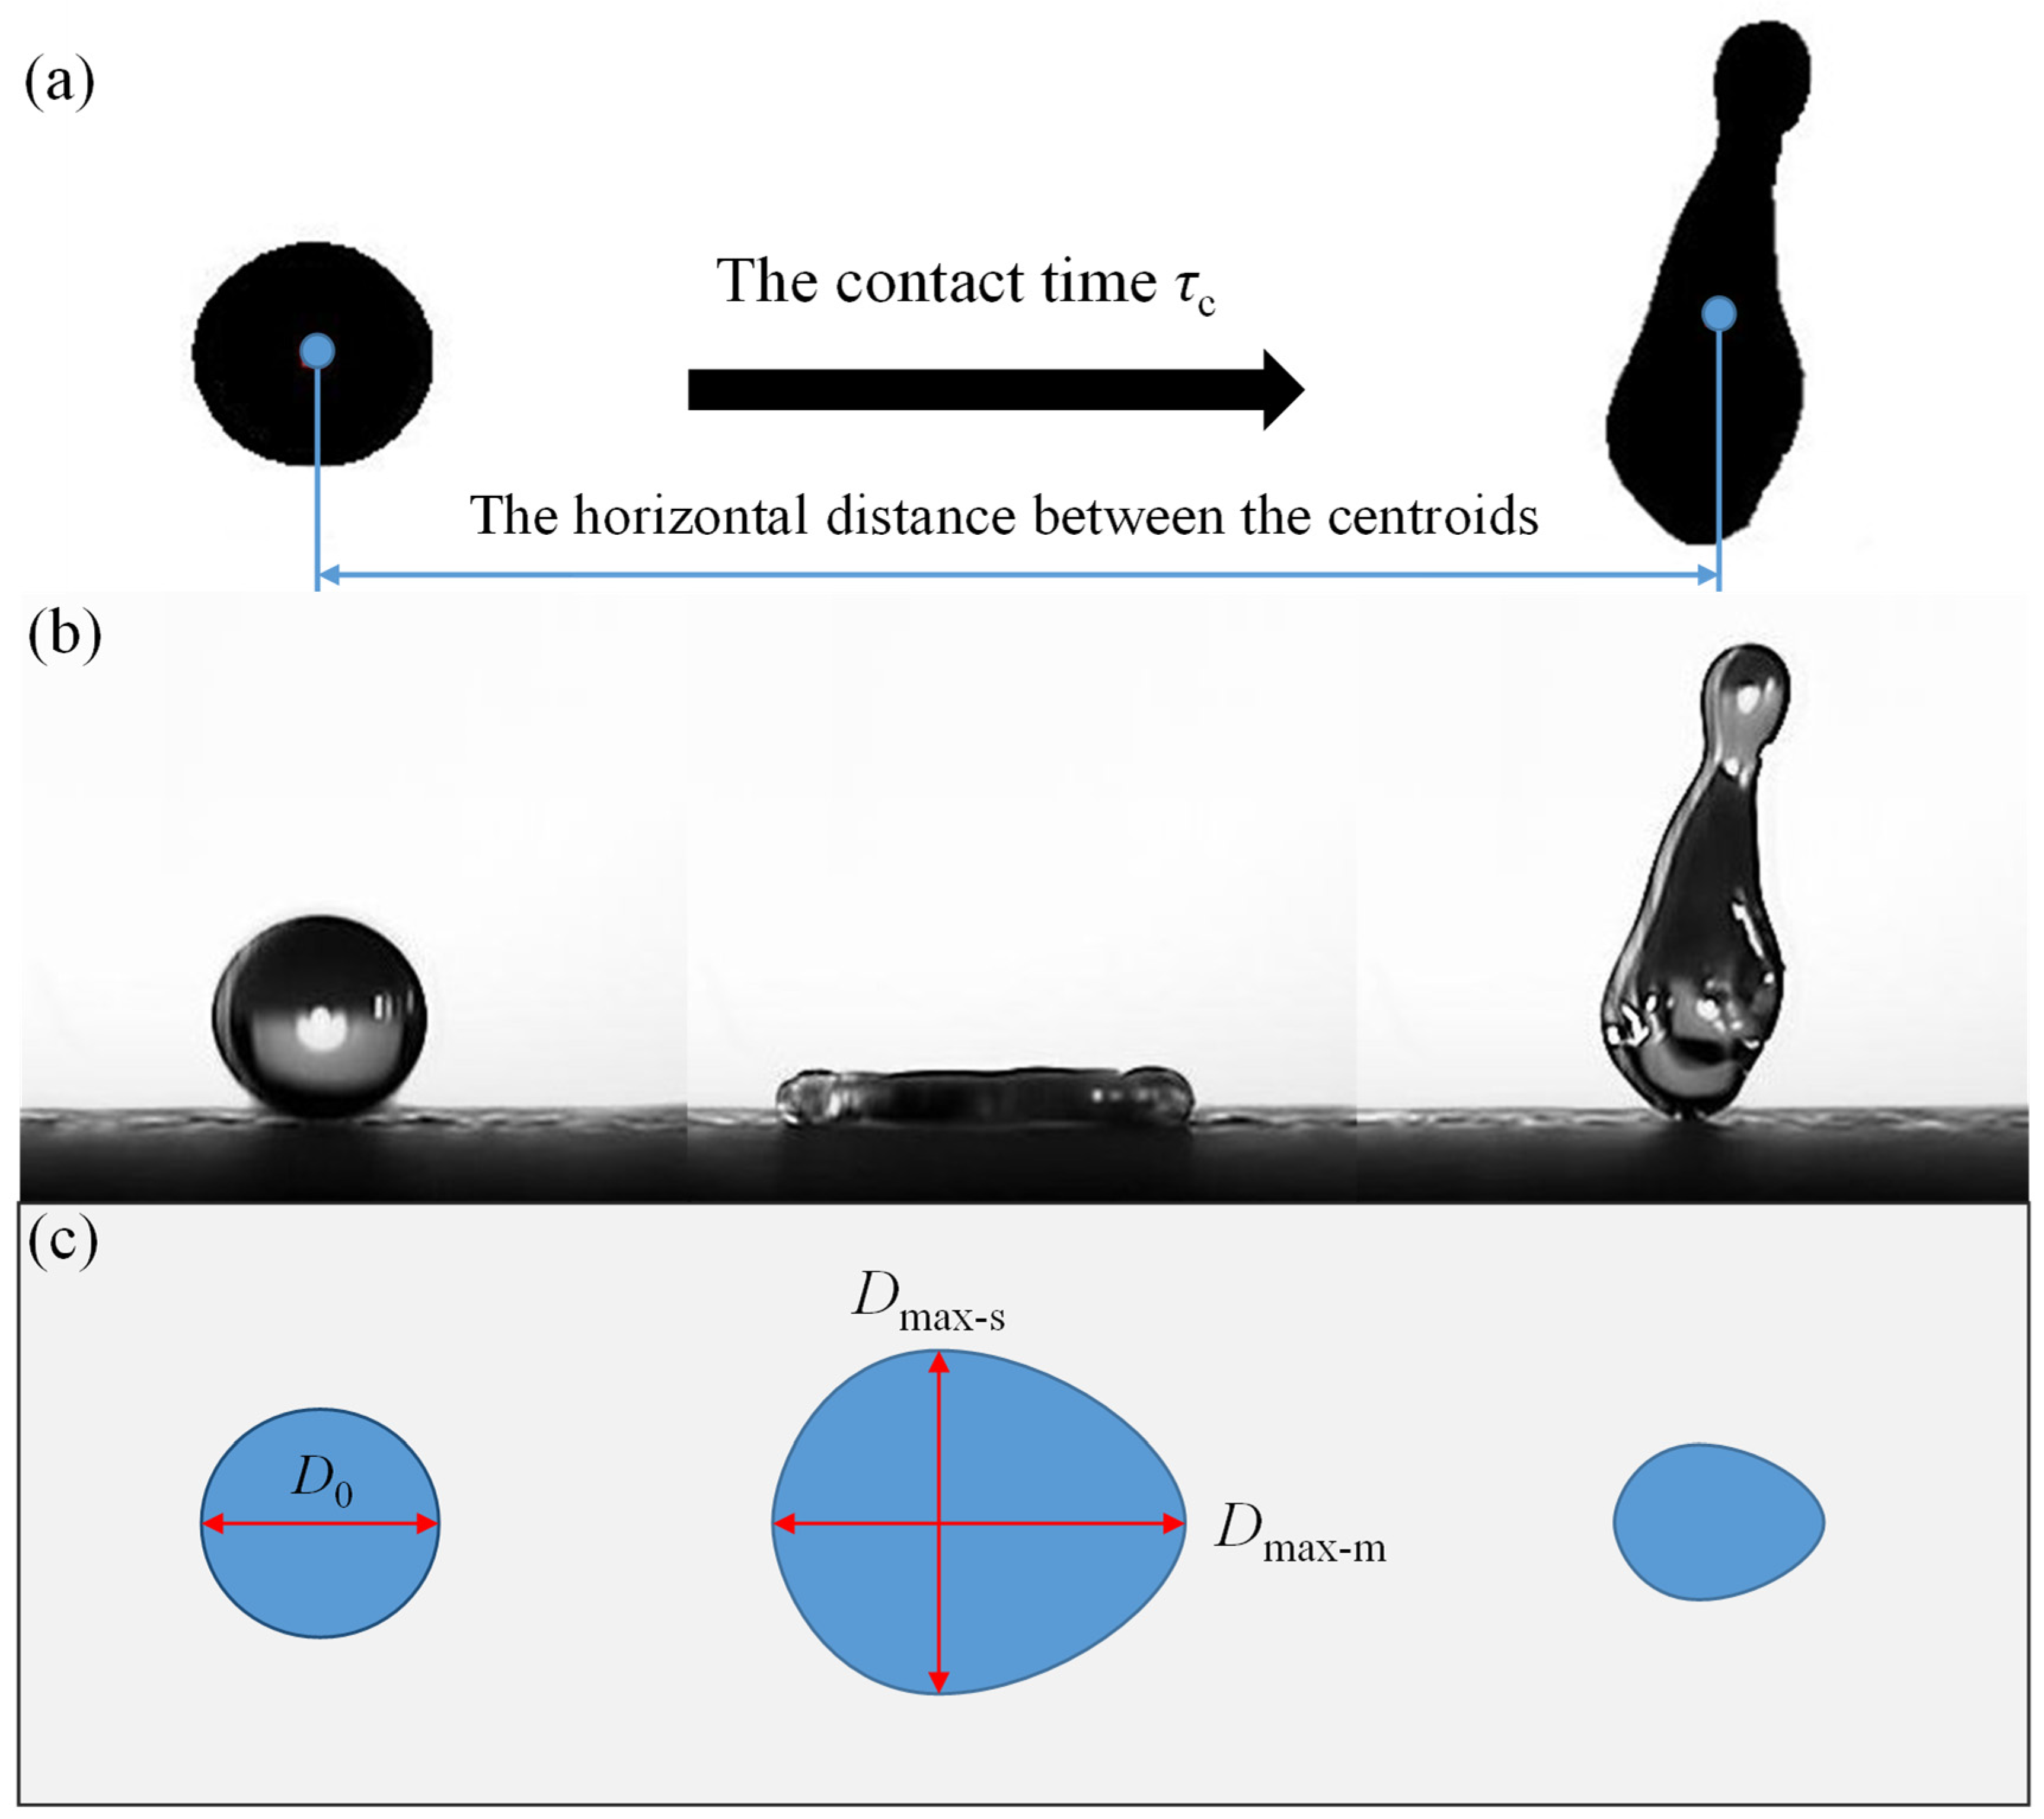
Figure 5.
Variation of the Va as a function of Re, Wen, Ca and Vt, with the solid line representing the best fit of Eq. (6).
Figure 5.
Variation of the Va as a function of Re, Wen, Ca and Vt, with the solid line representing the best fit of Eq. (6).
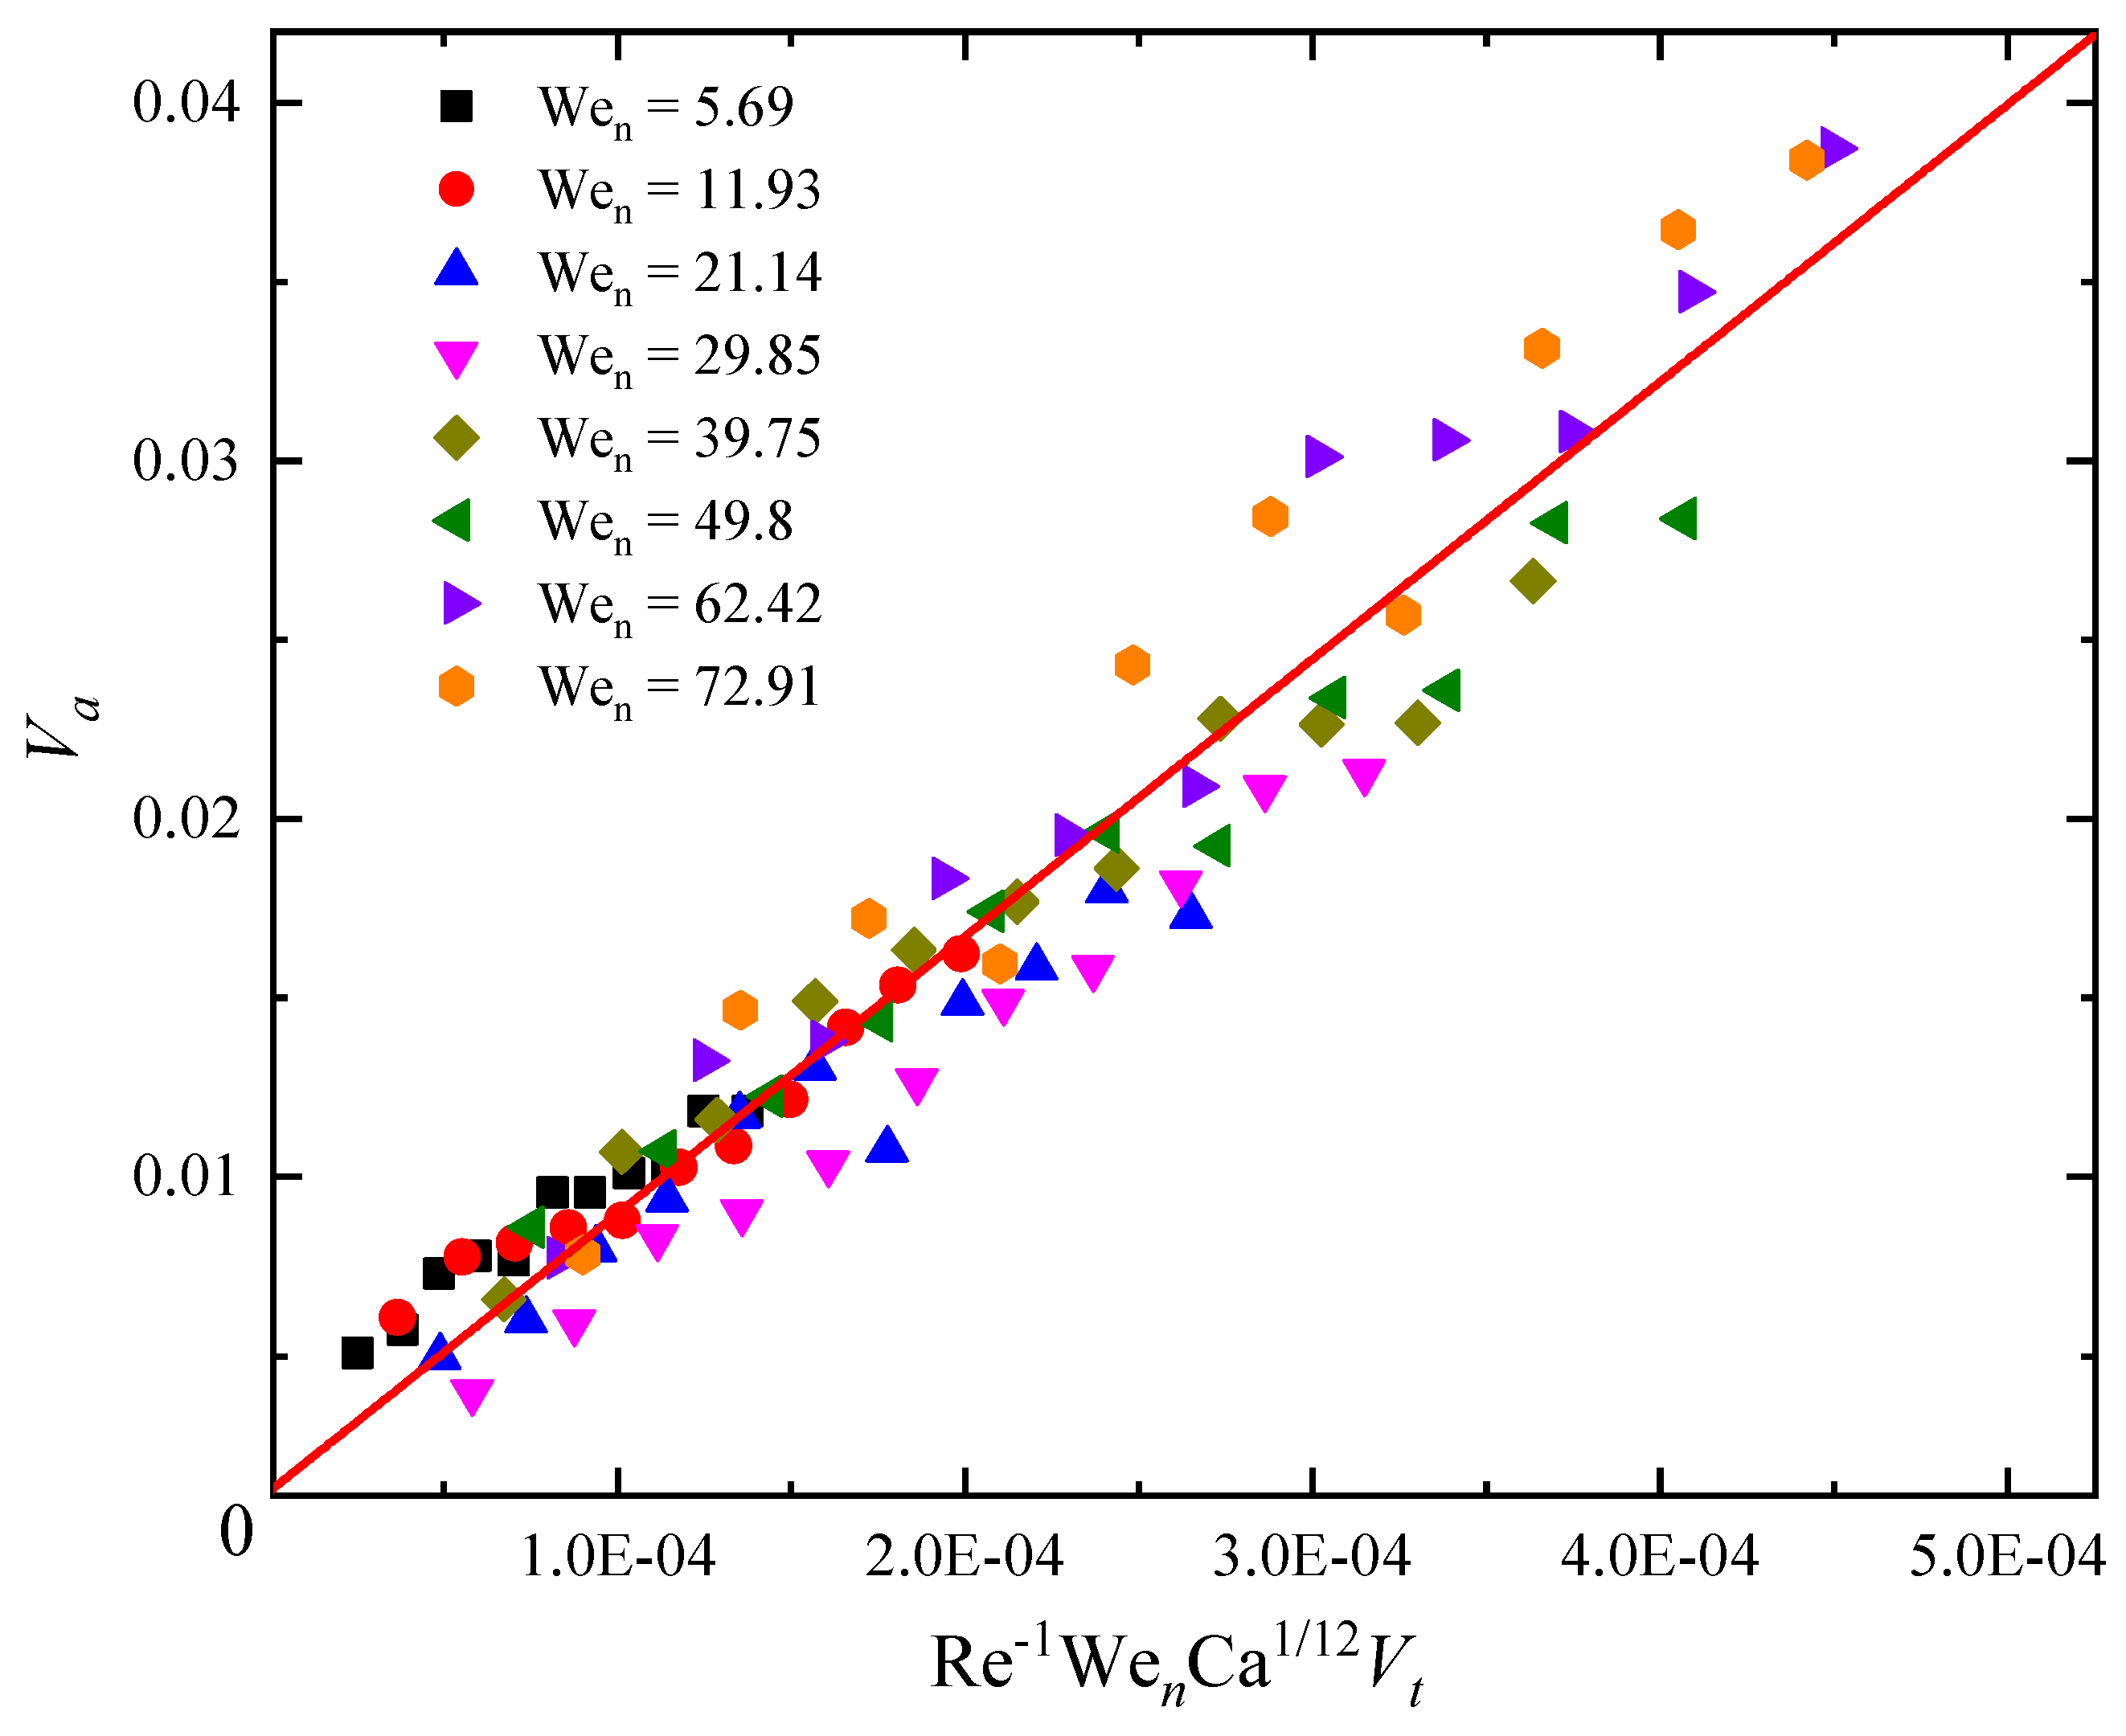
Figure 6.
(a) The boxplot of tangential recovery coefficient εt with respect to Wen which range corresponding to each Wet is 5.2-116.1. (b) The boxplot of tangential recovery coefficient εt with respect to Wet which range corresponding to each Wen is 5.7-60.9.
Figure 6.
(a) The boxplot of tangential recovery coefficient εt with respect to Wen which range corresponding to each Wet is 5.2-116.1. (b) The boxplot of tangential recovery coefficient εt with respect to Wet which range corresponding to each Wen is 5.7-60.9.
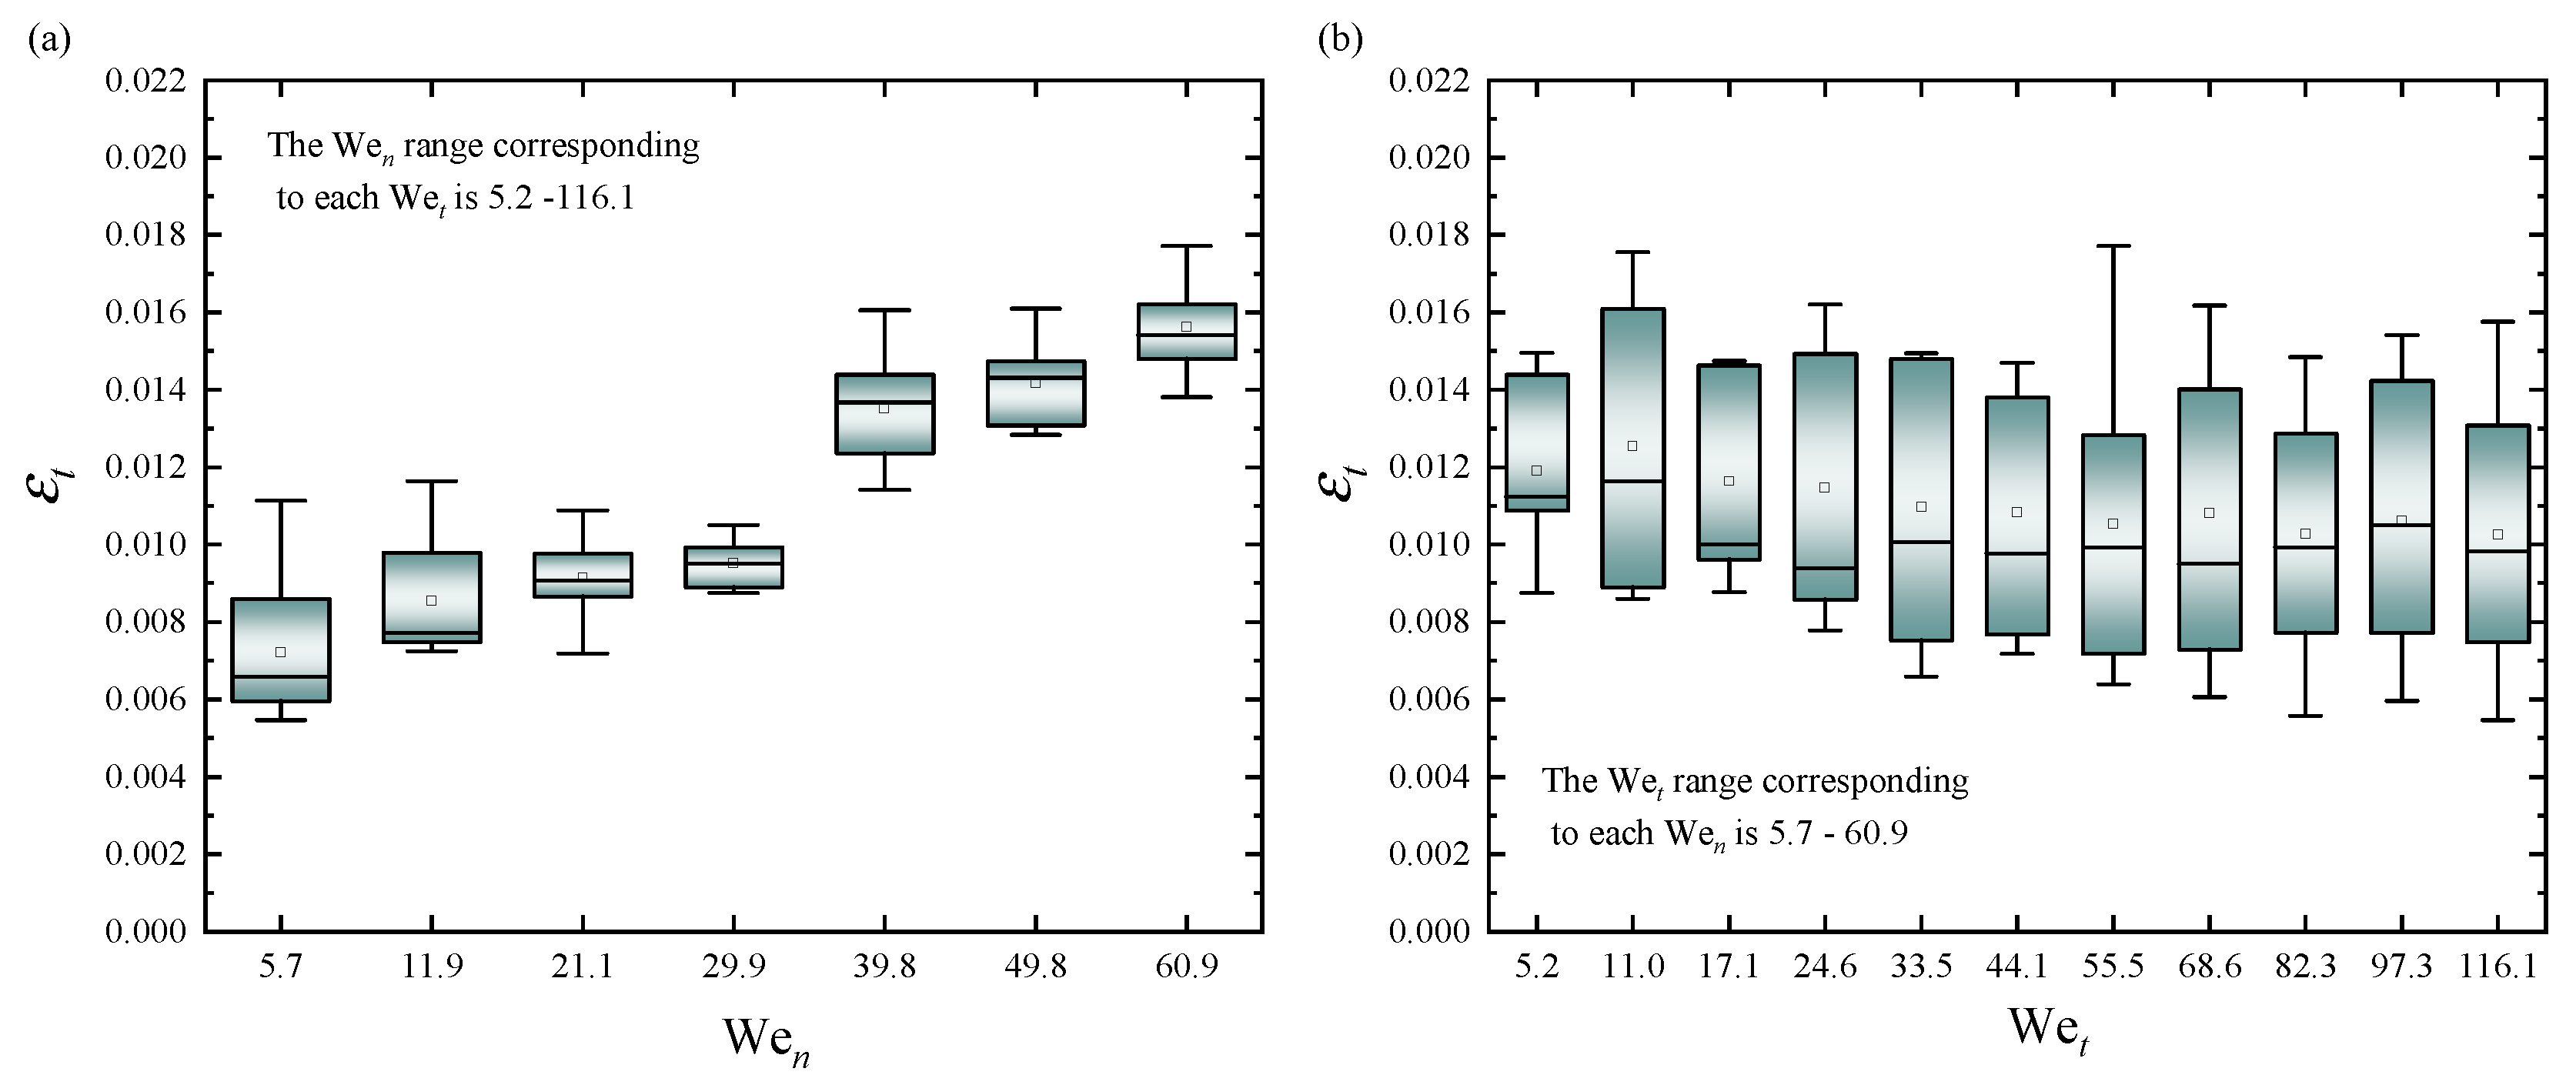
Figure 8.
(a) Variation of upstream and downstream spread lengths of the droplet with time for different values of Wet at Wen = 49.8, with the center of the droplet at Ds = 0 at the beginning of impact used to distinguish between the upstream and downstream regions. (b) Actual deformation of the droplet corresponding to (a). (c) Variation of upstream and downstream spread lengths of the droplet with time for different values of Wen at Wet = 44.06. (d) Actual deformation of the droplet corresponding to (c).
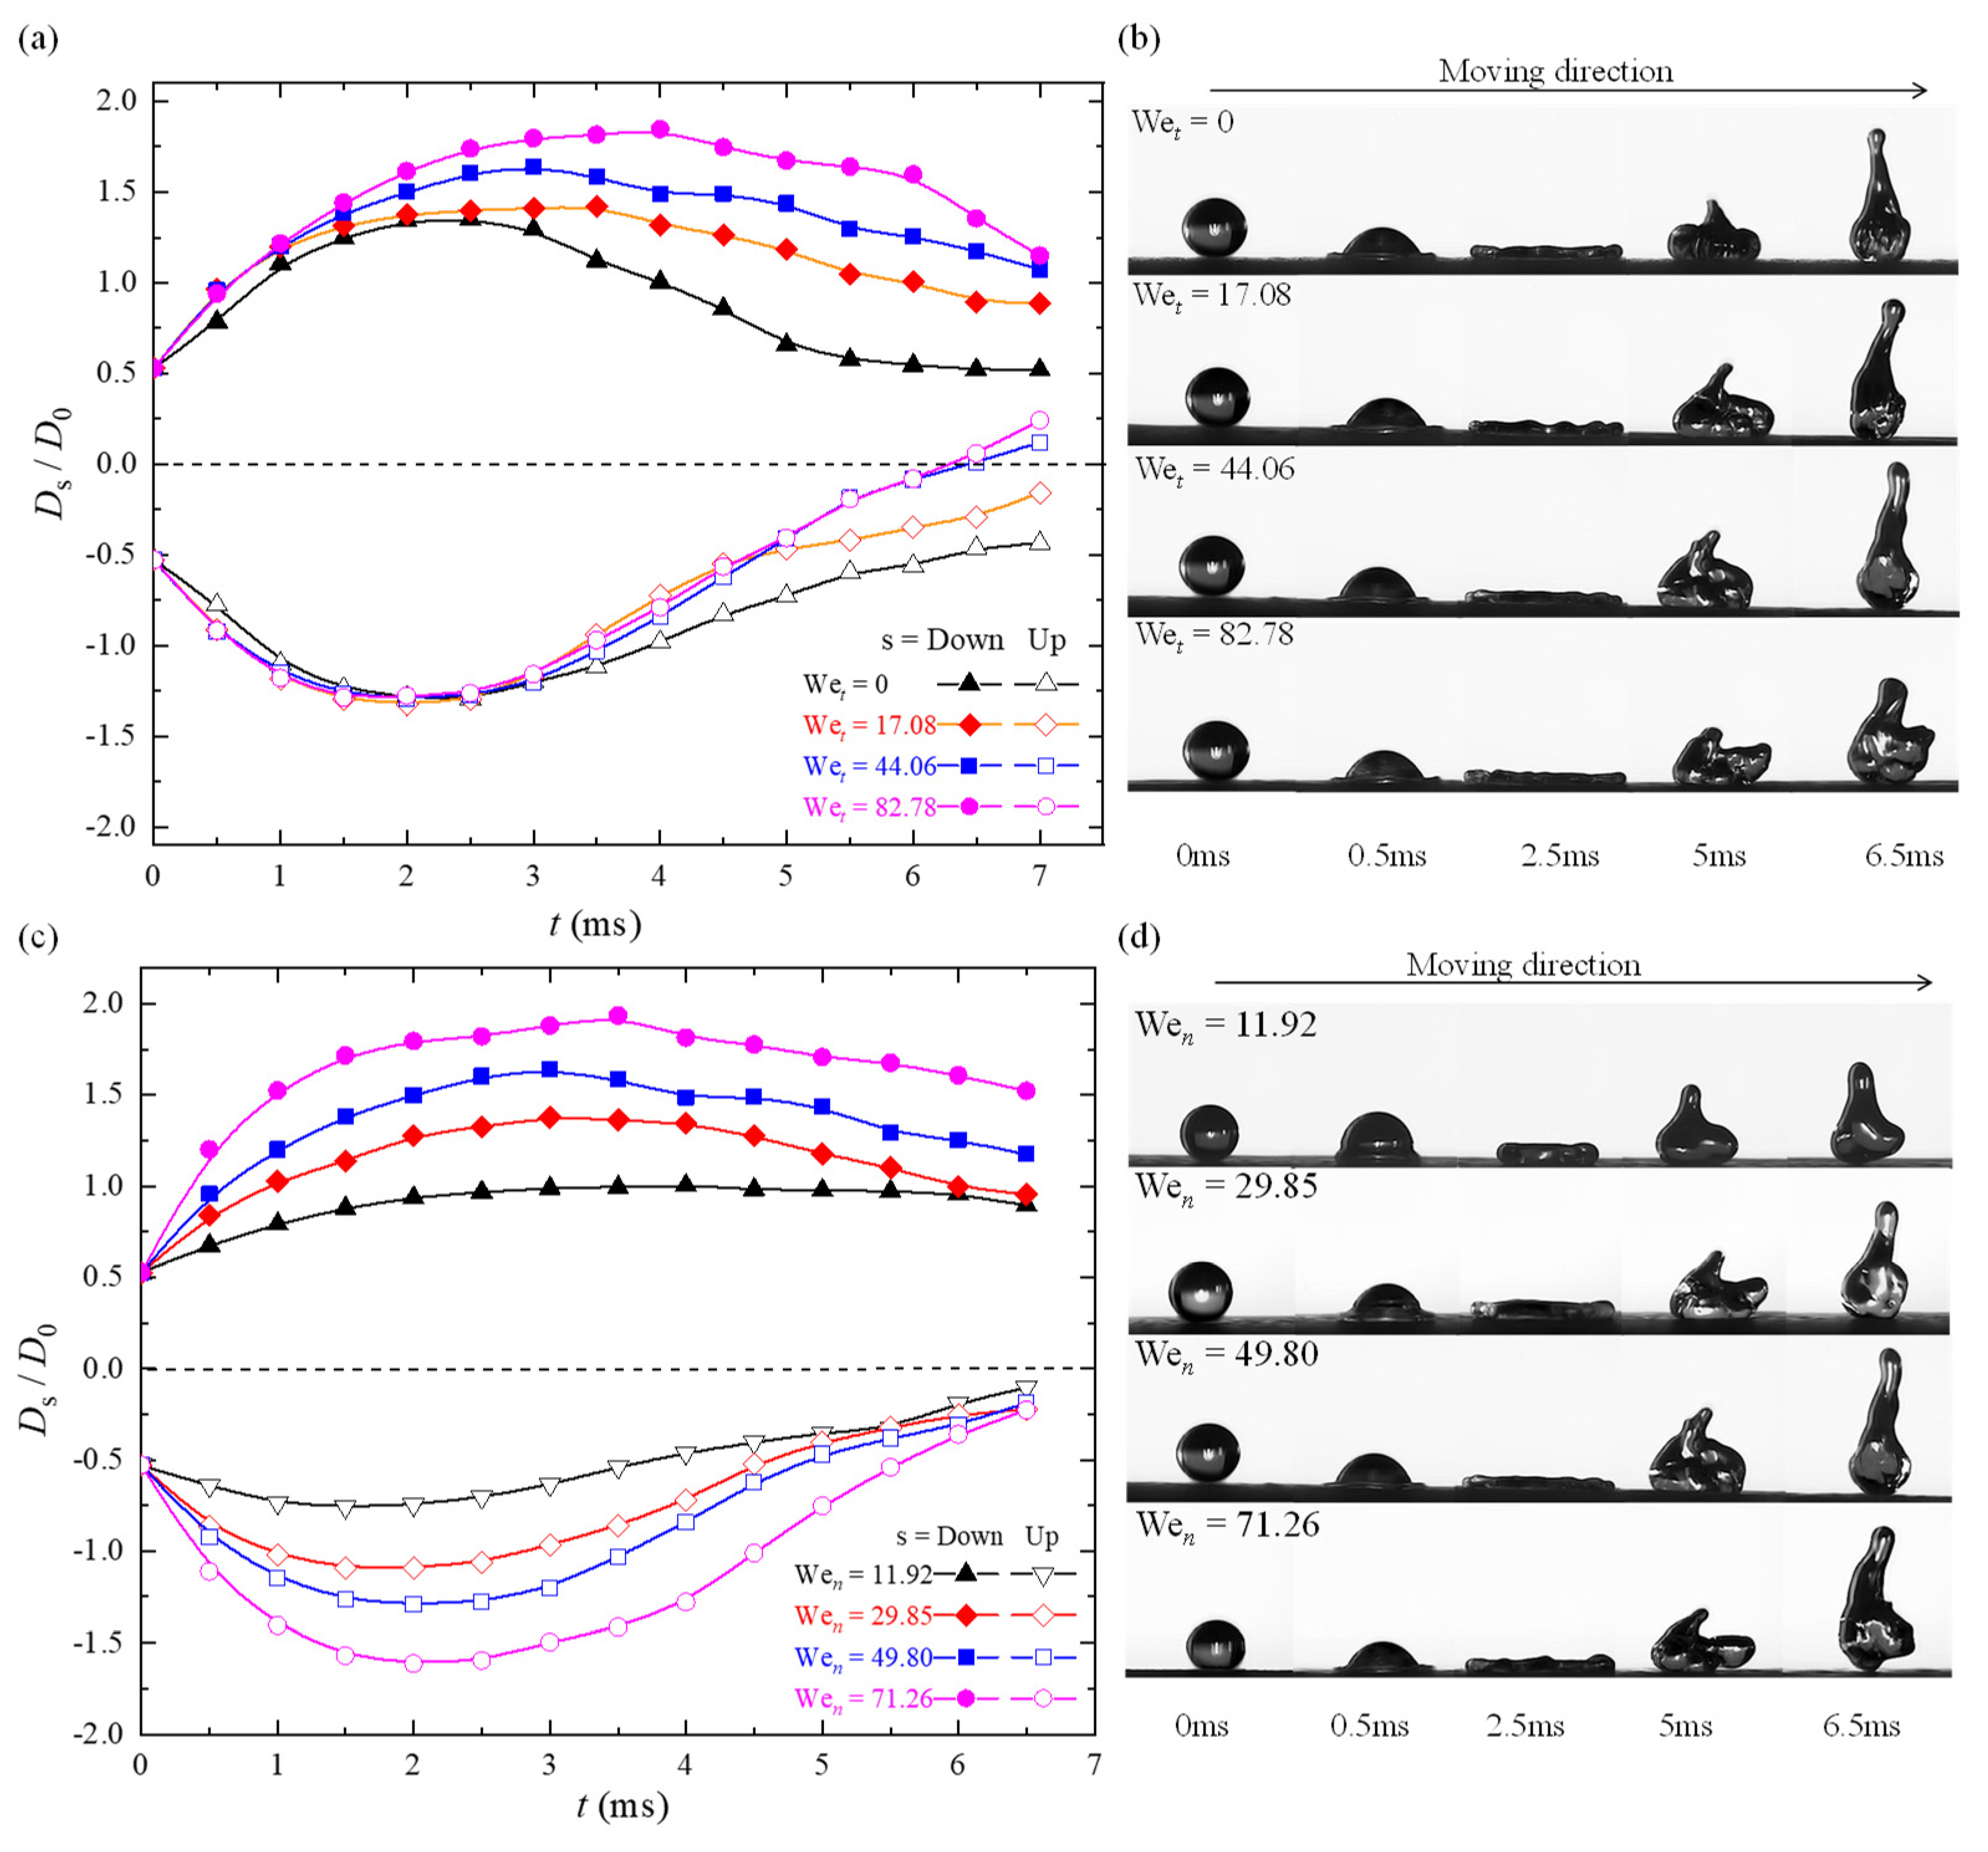
Figure 9.
Wet and Wen as functions of the normalized ratio of upstream and downstream spread lengths, the solid line representing the best fit of Eq. (11).
Figure 9.
Wet and Wen as functions of the normalized ratio of upstream and downstream spread lengths, the solid line representing the best fit of Eq. (11).
Disclaimer/Publisher’s Note: The statements, opinions and data contained in all publications are solely those of the individual author(s) and contributor(s) and not of MDPI and/or the editor(s). MDPI and/or the editor(s) disclaim responsibility for any injury to people or property resulting from any ideas, methods, instructions or products referred to in the content. |
© 2023 by the authors. Licensee MDPI, Basel, Switzerland. This article is an open access article distributed under the terms and conditions of the Creative Commons Attribution (CC BY) license (http://creativecommons.org/licenses/by/4.0/).
Copyright: This open access article is published under a Creative Commons CC BY 4.0 license, which permit the free download, distribution, and reuse, provided that the author and preprint are cited in any reuse.


