Submitted:
01 May 2025
Posted:
08 May 2025
You are already at the latest version
Abstract
To address the issues of time-consuming, laborious, and inaccurate traditional detection methods of rice appearance quality, a complete set of rice appearance quality inspection schemes is proposed in this study based on the YOLOv8 object detection model. A method of detecting the whole kernel rate by using the rice image area was proposed that is based on the YOLOv8 detection model. This method is more efficient and faster than the traditional method of measuring the whole kernel rate by the weight of rice. The detection of yellow grains quality based on the color threshold and chalkiness degree of rice based on the gray threshold was realized. Finally, comparative tests were conducted to verify the effectiveness and feasibility of the detection method. Random rice samples were tested by manual testing methods following national standards. The results show that the whole kernel rate is 59.80%, the roughness rate is 78.10%, the mold rate is 4.32%, the chalkiness degree is 11.00%, and the grade is second-class indica rice. The same rice sample was tested using the method of this study. The results show that the whole kernel rate of 59.10%, the roughness rate of 77.30%, the mold rate of 4.20%, the chalkiness degree of 12.00%, and the grade is second-class indica rice. The results are basically consistent with the manual detection method of the national standard. The rice appearance quality detection method proposed in this study provides a reference for achieving efficient, non-destructive, accurate detection and preferential grading of rice quality.
Keywords:
rice
; machine vision
; appearance quality detection
; YOLOv8
; whole kernel rate
; yellow grains
; chalkiness degree
1. Introduction
Rice is one of the important food crops in our country. It plays a vital role in ensuring food security and promoting economic development. The appearance and quality of rice directly affect its price and use[1,2,3,4,5]. The traditional inspection of rice appearance quality mainly relies on manual experience. This method has low detection efficiency, high labor intensity, and relatively large detection errors. The application and promotion of rice quality inspection based on machine vision have significant importance and application prospects [6,7,8,9].
In recent years, many scholars have applied machine vision and image processing technologies to the experimental research of examining the appearance of crop fruits or seeds, and have achieved certain research results. Fabiyi et al. used RGB to classify rice seed varieties, evaluating a large dataset of 8,640 rice seeds sampled from 90 different species, effectively eliminating impure species [10]. Zhang et al. proposed the YOLO-CRD method for rice disease detection, achieving an accuracy of 90.4% for bakanae disease, bacterial brown spot, leaf rice fever, and dry tip nematode disease [11]. Li et al. used ESE-Net to enhance feature extraction and employed the Focal-EOIU loss function, designing a corn kernel detection and recognition model with MobileNetV3 as the feature extraction backbone network [12]. Guo et al. proposed a Sichuan pepper detection network based on the YOLOv5 object detection model. Through ablation experiments, it was found that the improved YOLOv5 model achieved an average detection accuracy increase of 4.6% and 6.9% in natural environments compared to the original model [13]. Xin et al. proposed a recognition algorithm based on the YOLOv5s model, integrating the Ghost module and BiFPN. This model achieved a recognition accuracy of 99.7% for broken red mountain buckwheat seeds [14]. Li et al. enhanced YOLOv8s and simplified the model structure by integrating the lightweight GhostNet. It has improved the speed of corn leaf detection. After the improvement, the mAP increased by 0.3% compared to before [15]. Wang et al. incorporated the ECA attention mechanism into YOLOv8 to improve the model performance. It uses the Focal-EIOU loss function to address the imbalance between easily classifiable and hard-to-classify samples. The accuracy rate for strawberry recognition can reach 97.81% after it is introduced [16]. Yin et al. used an improved YOLOv8 pest detection algorithm, which introduces the MPDIoU optimization model and uses Ghost to reduce the number of model parameters. The algorithm achieved a 97.3% mAP [17]. Amin et al. used YOLOv5 to train with optimal learning hyperparameters. This hyperparameter more accurately localizes the pest region in plant images with 0.93 F1 scores. The proposed network classification accuracy reached 99% [18]. In summary, extensive research has been conducted both domestically and internationally on the application of machine vision and image processing in the inspection of the appearance quality of crop seeds and grains. However, there are issues with slow detection speed and low detection accuracy. Moreover, there is relatively little inspection of the appearance quality of rice [19,20,21].
To address the above issues, this study proposes a rice appearance quality detection method based on the YOLOv8 object detection model. This method can further improve the speed and accuracy of rice appearance quality inspection and reduce rice loss. It provides solutions for the appearance quality inspection of rice.
2. Rice Image Data Collection
2.1. Image Acquisition Platform
This paper builds a rice image acquisition platform centered around the MV-GE1600C MindVision industrial camera. The camera lens uses MV-LD-8-3M-A. The camera’s effective pixels are 16 million. And it is equipped with a CMOS sensor. The camera’s maximum resolution is 4608×3465. The camera’s maximum resolution is 4608×3465, and the minimum exposure can reach 0.07 ms. Its image processing acceleration function can reduce the host CPU usage. The rear of the camera has a GigE and power interface, and the camera and a computer can be connected through GigE to capture images. The platform host environment uses the Win10 system. The image acquisition platform is shown in Figure 1.
2.2. Image Acquisition Platform
This paper uses early indica rice with different appearance qualities as the research subject. This article selects different grades of rice, including whole kernel, chalkiness kernel, and yellow grains, to provide feature information for the YOLOv8 object detection model. Figure 2 is a sample image of rice. This study performs grayscale transformation on rice sample images, uses the median filtering algorithm to remove noise and eliminate external interference, separates rice and background using a fixed threshold method, and finally uses the watershed algorithm to separate the rice grains that are stuck together.
2.2.1. Grayscale Transformation of Rice Images
In order to improve processing speed and reduce complexity, this study converts colour images into single-channel grayscale images [22]. The rice image can still display texture characteristics and discernible color variations even after grayscale processing. Three methods were chosen for the experiment and compared: the weighted average method, the maximum value method, and the average value method. From the grayscaled processed image in Figure 3, it is evident that the image processed using the weighted average method is clearer and more distinct. Thus, the weighted average method has been selected for transforming images to grayscale.
2.2.2. Rice Image Denoising
Noise from the sample and the environment during image acquisition decreases the accuracy and efficiency of image processing. Therefore, filtering should be used to eliminate noise during the image processing [23]. This study selected four methods for experimentation: median filtering, maximum filtering, mean filtering, and Gaussian filtering. As shown in Figure 4, the experiment used images of brown rice as samples. Adding impulse noise to the image after grayscale transformation can more clearly and distinctly show the advantages and disadvantages of the four algorithms. Experimental results indicate that the median filtering method effectively removes noise while preserving complete image details, as shown in Figure 4(b).
2.2.3. Rice Image Segmentation
Background segmentation can enhance the clarity of images. This study selects three methods: the fixed threshold method, adaptive threshold method, and maximum class variance method, and conducts a comparative analysis. Figure 5 shows the results of the three threshold segmentation methods. The fixed threshold segmentation method achieves the best separation of rice from the background, as shown in Figure 5(b). The fixed threshold segmentation method can divide the image into pixel parts below the threshold and pixel parts above the threshold according to a pre-set fixed threshold.
Rice grains may stick together when rice images are captured. Rice grains sticking together will not be separated during background segmentation. They will reduce detection accuracy and increase image processing difficulty, so the sticking rice grains need to be segmented. This study compared the background subtraction method and the watershed segmentation algorithm, as shown in Figure 6. From Figure 6, it can be seen that the watershed segmentation algorithm performs the best.
2.2.4. Morphological Processing of Rice Images
After preprocessing, the rice images still contain small particle noise. Small particle noise needs to be further eliminated using morphological opening in image processing.Secondary clearing can make the contours of the image more regular and improve the accuracy of rice appearance quality inspection. The computation results are shown in Error! Reference source not found..
3. Methods for Inspecting the Appearance Quality of Rice
3.1. Rice Detection Based on Image Processing
3.1.1. Detection Method Based on Area Threshold for Whole Kernel Rate
This study proposes a method for detecting the whole kernel rate using area thresholding to replace traditional quality inspection methods. This method calculates the area by counting the number of rice pixels in the target area of the image. It differentiates broken rice grains from whole rice grains by area. Firstly, whole rice grains and broken rice grains are selected manually. By calculating, the average area of a complete grain of rice is S1. Calculate the threshold S2 using formula (1).
S2 = 3/4 * S1,
Taking 100 single-grain rice images and preprocessing the sample images for detection using the area threshold method. Obtain the area of a unit of rice by the number of pixels in the target area. The result is obtained by comparing the unit area with the area threshold. The area of the rice grain greater than S2 is considered a whole grain, while less than S2 is considered a broken grain. Figure 8 displays the results of the rice quality assessment. The chart shows a significant difference in the area between broken rice and whole rice. This study evaluated 100 images of whole and broken rice grains, with 91 images judged correctly, resulting in an accuracy rate of 91.00%.
3.1.2. Method for Detecting the Rate of Yellow Grains in Rice Based on Color Threshold
The presence of yellow grains in the sample will affect the overall quality of the rice. The area of yellow grains is not much different from that of normal grains, but their color is noticeably different. The endosperm of yellow grain rice is yellow. When testing yellow grains, distinguished by colour difference in testing.
Color images are divided into various color spaces such as RGB, HSV, CMYK and so on. In the process of color threshold detection, we preprocess 100 images of single grains of rice and extract pixel data from these images. By analyzing the tonal values of each pixel, we can calculate the average tonal values of a single grain. The results were compared with the national standard. The yellow index of indica rice is 49.10±2.59. If the yellow index is within the specified range, rice is classified as yellow grain; otherwise, it is classified as other rice. Figure 9 is the effect diagram of yellow grain rice discrimination. From the picture, it can be seen that yellow grains of rice and normal grains of rice have significant differences in color. This study identified 100 sample images of yellow rice grains, with 87 correctly identified, resulting in an accuracy rate of 87.00%.
3.1.3. Grayscale Threshold-Based Detection Method for Rice Chalkiness
There may be chalky grains in the rice. Because the grayscale value of the chalky area is significantly different from the grayscale value of normal rice grains, the chalky area in the rice image can be identified by converting the image to a grayscale image [24,25].
The manually marked method divides the chalky area and the normal grain area before detection. Calculate the average grayscale values of the chalky area and the normal grain area using formula (2), and a reasonable threshold for the chalky area is set.
where E is the average grayscale value of the whitewashed area, X1 is the grayscale value of the whitewashed area, and Y1 is the number of pixels in the whitewashed area.
This study selects a batch of normal rice grain and chalky rice grain samples and uses the eight-neighborhood labeling method to count the pixel values of the chalky areas and the total pixel values of the rice grains. Calculate the chalkiness of each rice grain using the area ratio, and set the chalkiness threshold based on the distribution of chalkiness. If the whiteness is greater than the chalkiness threshold, it is classified as white rice. Figure 10 is the recognition effect diagram of chalky rice. Compared with the recognition image of normal rice grains, the gray-scale image of chalky rice has a deeper hue. This study selected 100 images of chalky rice grains for classification, with 84 images correctly classified, resulting in an accuracy rate of 84.00%.
3.2. Training the YOLOv8 Object Detection Model
In order to train the YOLOv8 model, this paper selects 500 rice photos. Determine the ratio of milled rice, yellow rice, whole grain rice, and broken rice. Before model training, the categories and locations of rice in the images need to be labeled using the Labelimg software and then set according to the VOC format to generate the corresponding XML files. Rice photos are divided into training and validation groups in an 8:2 ratio. After initializing the model parameters, the training group is input into the algorithm model to start training. The training parameters were set as follows: initial learning rate of 0.01, 300 training epochs, batch size of 16, input image size of 640×640 pixels, a weight decay coefficient of 0.0005, and a gradient momentum of 0.937. After training the best model multiple times and optimizing it by comparing the results with the actual differences, the validation group is then tested using the best model to compare the detection results.
3.2.1. Comparison of YOLOv8 Model with Other Different Models
To derive the optimal detection model, YOLOv8 was compared with its previous versions’ detection models. This experiment set up accuracy, recall, and mAP values under different IOUs. Table 1 shows the metrics for the four YOLO models. Table 1 shows that the YOLOv8 model has the highest accuracy, recall, and mF1 value, so YOLOv8 was chosen as the detection model.
To further determine the effectiveness and feasibility of the YOLOv8 detection model, this study conducts a comparative analysis of the performance of four detection models. The recognition effect is shown in Figure 11. Figure 11 shows that YOLOv8 has high accuracy in recognition and clear images, so YOLOv8 is chosen as the detection model.
4. Based on YOLOv8 Rice Appearance Quality Inspection Test
To obtain the best detection model for YOLOv8, rice was input into the YOLOv8 model and trained multiple times. Figure 12 shows the variation curves of various performance evaluation metrics for the rice image dataset during the training and prediction processes. Figure 12 includes loss functions such as box_loss, box_loss, and cls_loss. In addition, mAP50 and mAP50-95 have been set as performance evaluation metrics. Figure 12 shows that the various loss functions reach stability after 100 iterations, and the curve changes little at 200 iterations, indicating that the training model has stabilized.
Table 2 shows the specific changes in accuracy, recall, and mAP values under different iteration counts. As shown in Figure 12 and Table 2, the recall rate, accuracy, mAP50, and mAP50-95 gradually increased at the beginning of the training, reaching a stable state around 100 iterations. When the number of iterations reaches 200, the curves of each metric converge and change little. When the number of iterations reaches 200, the curves of various metrics converge and change little, indicating that the model has stabilized. After stabilizing, the model did not undergo significant changes or fitting, indicating that the training model has reached its optimal state.
After obtaining the best model, input the test set data into the model to obtain the accuracy. Figure 13 shows the P-R curve for the training and testing process of the YOLOv8 model, and Table 3 presents the accuracy of the training and testing. The comparison shows that the metrics between the training set and the test set are quite close, and there is no overfitting phenomenon.
The YOLOv8 detection model is trained using the rice dataset from the training set to obtain the best model, and the best model parameters are derived using the test set. The accuracy of various indicators is similar upon comparison, indicating that the trained model is universally applicable.
To test the detection model, this study conducted comparative experiments. We randomly selected 143 grains of indica rice as samples and conducted manual inspections of this batch of rice according to the procedures specified in the national standard GB/T 1354-2018. First, we use the dehusker and the rice mill to successively remove the husk and the bran, and then weigh them. First, we use the dehusker and the rice mill to successively remove the husk and the bran and weigh them. Then, we select and weigh the moldy grains, chalky grains, and incomplete grains from the sample. The manual inspection results show the whole grain rate of 59.80%, the milling rate of 78.10%, the mold rate of 4.32%, and the chalkiness degree of 11.00%. The sample rice grade is second-grade indica rice. Figure 14 is a bar chart of sample phenotypes. Figure 14 shows the phenotypic characteristics and quantities of the samples, providing a basis for quality inspectors to evaluate rice quality.
We placed this batch of equal amounts of indica rice into the rice image acquisition platform described in this paper for photography, storing the area information of the hulled rice for YOLOv8 model detection. Then the roller husker removes the husk and conducts a retest, selects brown rice for examination, and obtains the corresponding test information. Finally, the rice milling machine removes the bran to obtain polished rice. Choose polished rice detection, with the model being YOLOv8. The test results are shown in Figure 15. From Figure 15, it can be seen that the number of rice grains detected is 143, of which 12 are yellow grains. The milling rate is 77.30%, the whole grain rate is 59.10%, the moldy rate is 4.20%, the chalkiness is 12.00%, and the grade is second-class indica rice. The test results are consistent with manual detection methods, enabling non-destructive and accurate detection of rice.
5. Conclusions
- To address the issue of low efficiency and high error rates in traditional manual appearance inspection of rice, a rice detection method based on the YOLOv8 object detection model has been proposed. By comparison, the weighted average gray value transformation method, median filtering denoising method, and fixed threshold segmentation method were selected for image preprocessing and use threshold segmentation and watershed algorithms to solve the problem of grain adhesion in rice images. The whole grain was detected based on the YOLOv8 detection model. This study proposes a method for area detection to detect whole rice based on the YOLOv8 detection model. Moreover, this study examines rice detection from three aspects: area threshold, color threshold, and grayscale threshold. Finally, comparative experiments confirmed the effectiveness and feasibility of the method, enabling precise and non-destructive testing of rice;
- This study proposes a rice quality detection method based on image processing and deep learning. By extracting rice features and detecting based on the YOLOv8 detection model, using area threshold, color threshold, and grayscale threshold methods, the accuracy rate for whole grain rice is 91%, for yellow grain rice is 87%, and for chalky rice is 84%. The YOLOv8 detection model has better detection performance;
- This study conducted 100 sets of comparative experiments, with manual inspection results showing a whole grain rate of 59.80%, a milling rate of 78.10%, a mold rate of 4.32%, a chalkiness degree of 11.00%, and a grade of second-class indica rice. The detection results based on the YOLOv8 model show a whole grain rate of 59.10%, a milling rate of 77.30%, a mold rate of 4.20%, a chalkiness degree of 12.00%, and a grade of second-class indica rice. The results are basically consistent with manual detection, and the detection is fast and accurate.
The text continues here.
Author Contributions
Conceptualization, X.M. and X.Z.; methodology, R.T.; software, R.T.; validation, R.T.; formal analysis, R.T. and X.Z.; investigation, X.F.; resources, X.Z.; data curation, X.M.; writing—original draft preparation, X.M.; writing—review and editing, X.M.; visualization, J.L.; supervision, X.F. and J.L.; project administration, X.Z.; funding acquisition, X.F and J.L. All authors have read and agreed to the published version of the manuscript.”
Funding
This research was supported by the earmarked fund for CARS (CARS-23); Hebei province innovation research group project (C2024204246); Baoding city science and technology plan (2372P016).
Data Availability Statement
The datasets used and/or analyzed in the current study are available from the corresponding author upon reasonable request.
Acknowledgments
The authors would like to thank Hebei Agricultural University for providing scientific research sites and experimental materials.
Conflicts of Interest
The authors declare no conflicts of interest.
References
- Zhou, J.; Zeng, S.; Chen, Y.; Kang, Z.; Li, H.; Sheng, Z. A Method of Polished Rice Image Segmentation Based on YO-LACTS for Quality Detection. Agriculture 2023, 13. [CrossRef]
- Teng, M.; Duan, X.; Feng, R.; Zhang, D.; Guo, W.; Sun, H.; Liu, X. Effects of Harvest Time on Grinding Quality, Appearance Quality and Physical and Chemical Quality of Japonica Rice. Foods 2024, 13. [CrossRef]
- Fan, P.; Xu, J.; Wei, H.; Liu, G.; Zhang, Z.; Tian, J.; Zhang, H. Recent Research Advances in the Development of Chalkiness and Transparency in Rice. Agriculture 2022, 12. [CrossRef]
- Zhao, C.; Liu, G.; Chen, Y.; Jiang, Y.; Shi, Y.; Zhao, L.; Liao, P.; Wang, W.; Xu, K.; Dai, Q.; et al. Excessive Nitrogen Application Leads to Lower Rice Yield and Grain Quality by Inhibiting the Grain Filling of Inferior Grains. Agriculture 2022, 12. [CrossRef]
- Ogawa, Y. Chapter 17 - Quality Evaluation of Rice. In Computer Vision Technology for Food Quality Evaluation (Second Edition), Sun, D.-W., Ed.; Academic Press: San Diego, 2016; pp. 413-437.
- Ni, P.; Hu, S.; Zhang, Y.; Zhang, W.; Xu, X.; Liu, Y.; Ma, J.; Liu, Y.; Niu, H.; Lan, H. Design and Optimization of Key Parameters for a Machine Vision-Based Walnut Shell–Kernel Separation Device. Agriculture 2024, 14. [CrossRef]
- Feng, Y.; Zhao, X.; Tian, R.; Liang, C.; Liu, J.; Fan, X. Research on an Intelligent Seed-Sorting Method and Sorter Based on Machine Vision and Lightweight YOLOv5n. Agronomy 2024, 14. [CrossRef]
- Jiang, L.; Chen, W.; Shi, H.; Zhang, H.; Wang, L. Cotton-YOLO-Seg: An Enhanced YOLOV8 Model for Impurity Rate Detection in Machine-Picked Seed Cotton. Agriculture 2024, 14. [CrossRef]
- Li, X.; Xu, S.; Zhang, W.; Wang, J.; Li, Y.; Peng, B.; Sun, R. Research on the Detection Method of the Threshing Rate of Corn Ears Based on Machine Vision. Agriculture 2024, 14. [CrossRef]
- Fabiyi, S.D.; Vu, H.; Tachtatzis, C.; Murray, P.; Harle, D.; Dao, T.K.; Andonovic, I.; Ren, J.; Marshall, S. Varietal Classification of Rice Seeds Using RGB and Hyperspectral Images. IEEE Access 2020, 8, 22493-22505. [CrossRef]
- Zhang, R.; Liu, T.; Liu, W.; Yuan, C.; Seng, X.; Guo, T.; Wang, X. YOLO-CRD: A Lightweight Model for the Detection of Rice Diseases in Natural Environments. Phyton 2024, 93, 1275-1296. [CrossRef]
- Yang, L.; Liu, C.; Wang, C.; Wang, D. Maize Kernel Quality Detection Based on Improved Lightweight YOLOv7. Agriculture 2024, 14. [CrossRef]
- Guo, J.; Xiao, X.; Miao, J.; Tian, B.; Zhao, J.; Lan, Y. Design and Experiment of a Visual Detection System for Zanthoxylum-Harvesting Robot Based on Improved YOLOv5 Model. Agriculture 2023, 13. [CrossRef]
- Li, X.; Niu, W.; Yan, Y.; Ma, S.; Huang, J.; Wang, Y.; Chang, R.; Song, H. Detection of Broken Hongshan Buckwheat Seeds Based on Improved YOLOv5s Model. Agronomy 2023, 14. [CrossRef]
- Li, R.; Li, Y.; Qin, W.; Abbas, A.; Li, S.; Ji, R.; Wu, Y.; He, Y.; Yang, J. Lightweight Network for Corn Leaf Disease Identification Based on Improved YOLO v8s. Agriculture 2024, 14. [CrossRef]
- Wang, C.; Wang, H.; Han, Q.; Zhang, Z.; Kong, D.; Zou, X. Strawberry Detection and Ripeness Classification Using YOLOv8+ Model and Image Processing Method. Agriculture 2024, 14. [CrossRef]
- Yin, J.; Huang, P.; Xiao, D.; Zhang, B. A Lightweight Rice Pest Detection Algorithm Using Improved Attention Mechanism and YOLOv8. Agriculture 2024, 14. [CrossRef]
- Amin, J.; Anjum, M.A.; Zahra, R.; Sharif, M.I.; Kadry, S.; Sevcik, L. Pest Localization Using YOLOv5 and Classification Based on Quantum Convolutional Network. Agriculture 2023, 13. [CrossRef]
- Xiaofei, F.; Linbai, W.; Jingyan, L.; Yuhong, Z.; Jun, Z.; Xuesong, S. Corn seed appearance quality estimation based on improved YOLO v4. Transactions of the Chinese Society for Agricultural Machinery 2022, 53, 226-233.
- Xiangyou, W.; Yanxing, L.; Zhenyu, Y.; M, Z.; RM, W.; LX, C. Detection method of clods and stones from impurified potatoes based on improved YOLO v4 algorithm. Transactions of the Chinese Society for Agricultural Machinery 2021, 52, 241-247.
- Fang, L.; Yukun, L.; Sen, L.; Wenzhong, G.; Fan, X.; Bai, Z. Fast recognition method for tomatoes under complex environments based on improved YOLO. Transactions of the Chinese society for agricultural machinery 2020, 51, 229-237.
- de Magalhães, L.P.; Rossi, F. Use of Indices in RGB and Random Forest Regression to Measure the Leaf Area Index in Maize. Agronomy 2024, 14. [CrossRef]
- S. S, R.; Nair, R.R.; Kumar, E.R. An Efficient Low Complexity Denoising Filter Architecture for the Removal of Salt and Pepper Noise. In Proceedings of the 2022 3rd International Conference on Smart Electronics and Communication (ICOSEC), 20-22 Oct. 2022, 2022; pp. 476-481.
- Yun, L.; Yiming, W.; Ming, S.; xiaochao, Z. Chalky White Rice Image Detection Method Based on Fractal Dimension. Transactions of the Chinese Society for Agricultural Machinery 2005, 36, 92-95.
- Yanhong, W.; Muhua, L.; Jun, Y.; Huadong, Z. Rice Outer-quality Inspection Based on Computer Vision. Transactions of the Chinese Society for Agricultural Machinery 2007, 38, 107-111. [CrossRef]
Figure 1.
Schematic diagram of image acquisition hardware equipment: (a) Modeling drawings, (b) physical drawings 1.Bar light source; 2.Industrial camera; 3.Backlight plate; 4.Drawer stage; 5.Collection funnel; 6.Nylon roller; 7.Black acrylic sheet; 8.Scale holder; 9.Light source controller.
Figure 1.
Schematic diagram of image acquisition hardware equipment: (a) Modeling drawings, (b) physical drawings 1.Bar light source; 2.Industrial camera; 3.Backlight plate; 4.Drawer stage; 5.Collection funnel; 6.Nylon roller; 7.Black acrylic sheet; 8.Scale holder; 9.Light source controller.
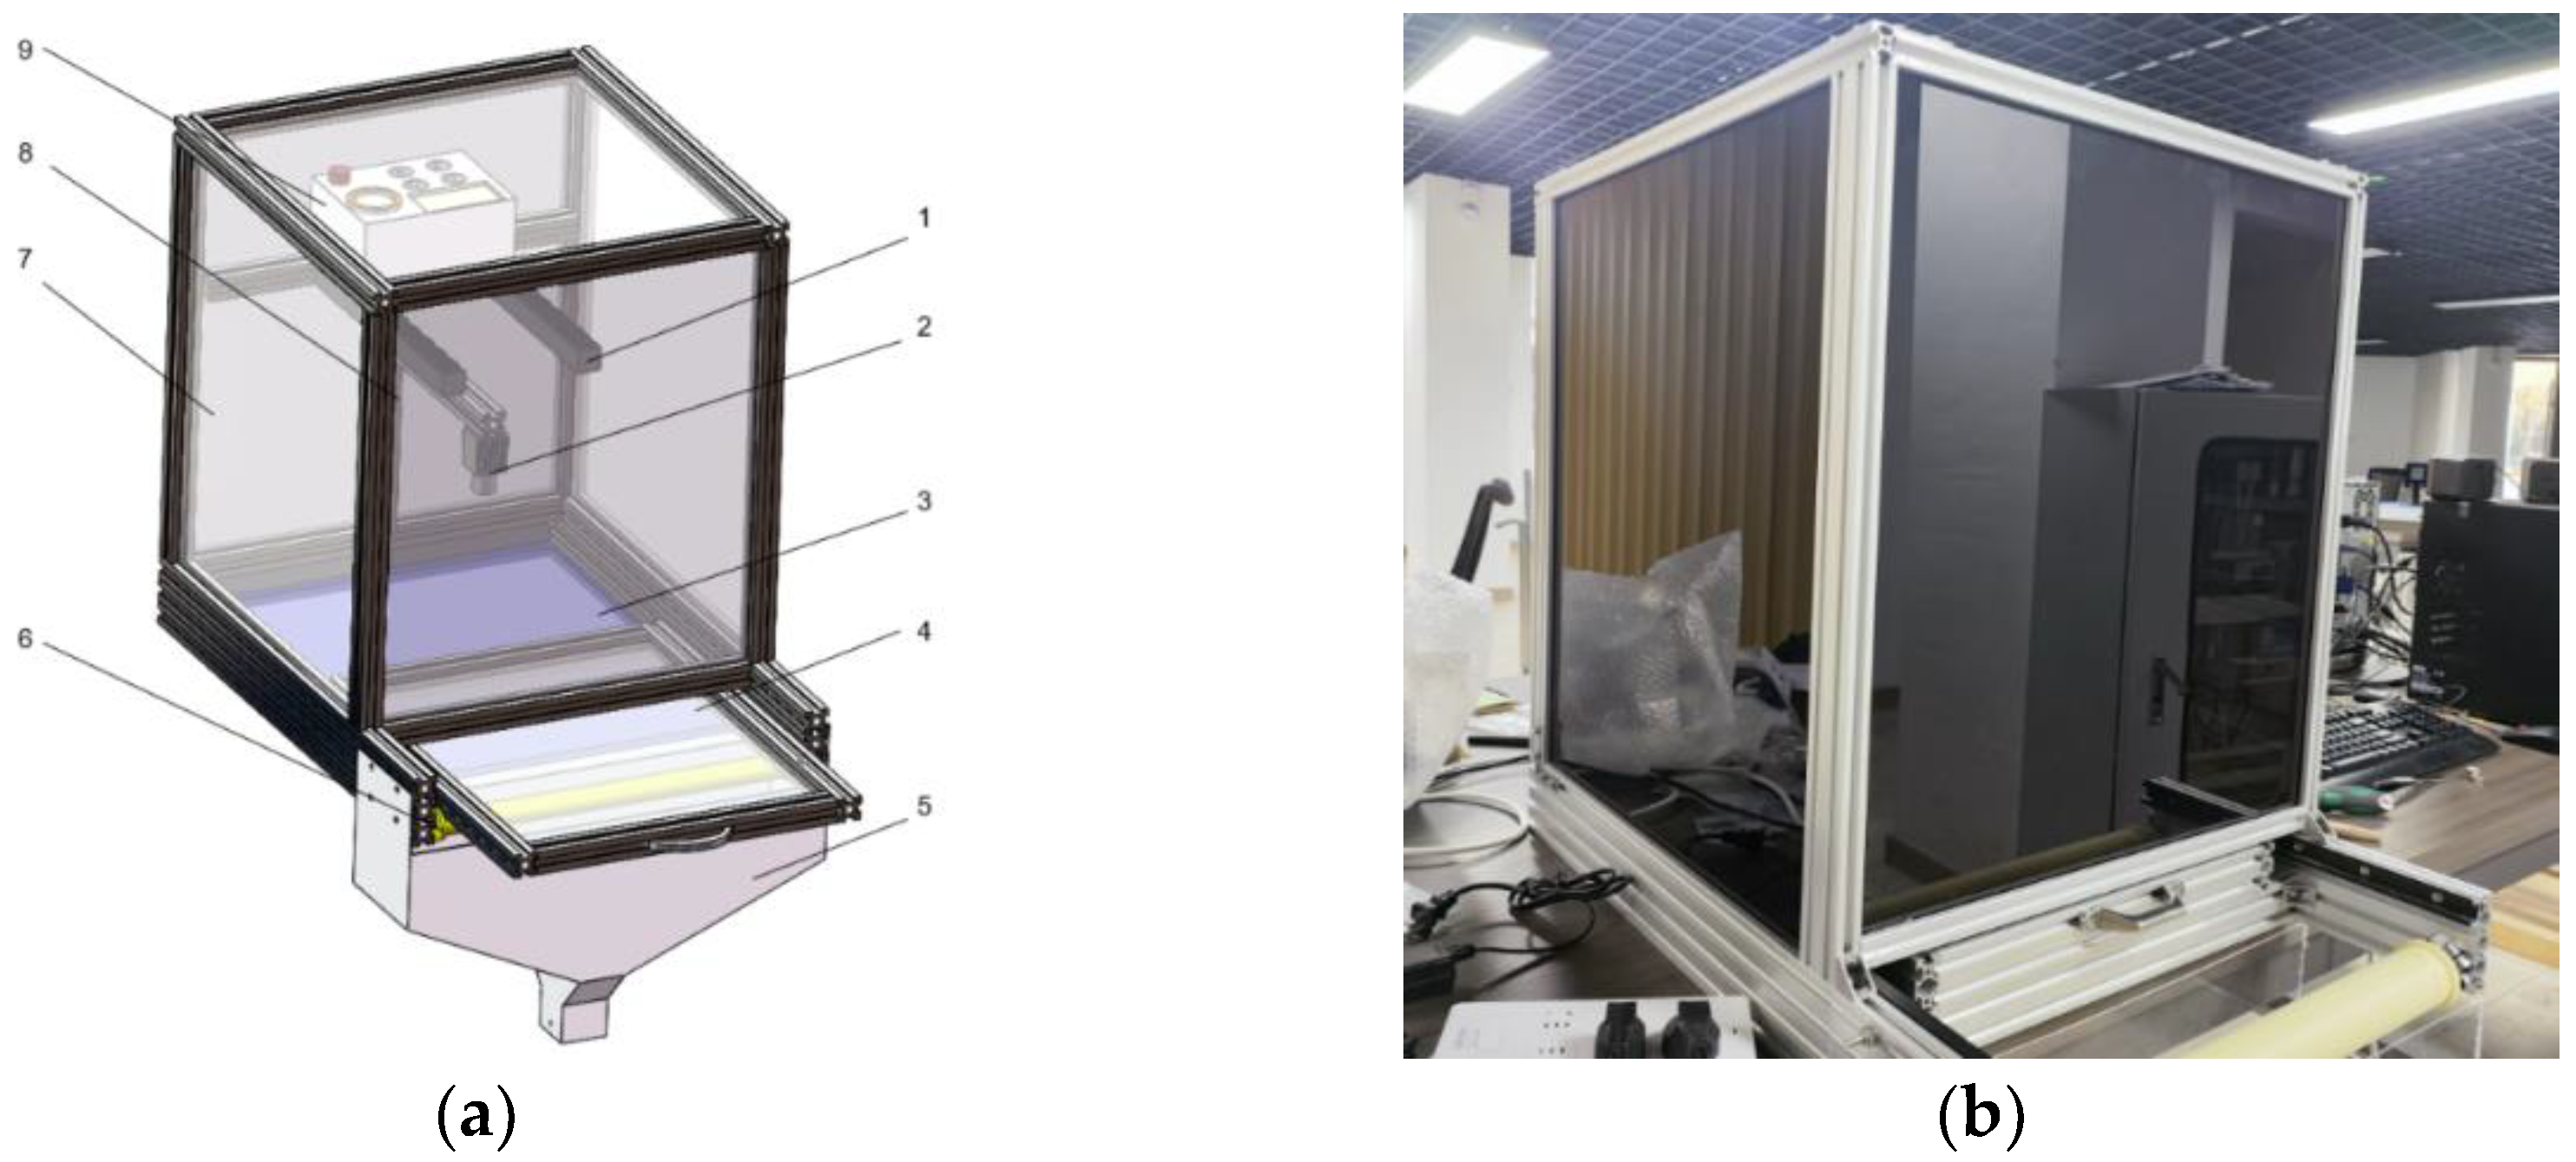
Figure 2.
Rice image samples: (a) rice image sample; (b) brown rice image sample; (c) milled rice image sample.
Figure 2.
Rice image samples: (a) rice image sample; (b) brown rice image sample; (c) milled rice image sample.
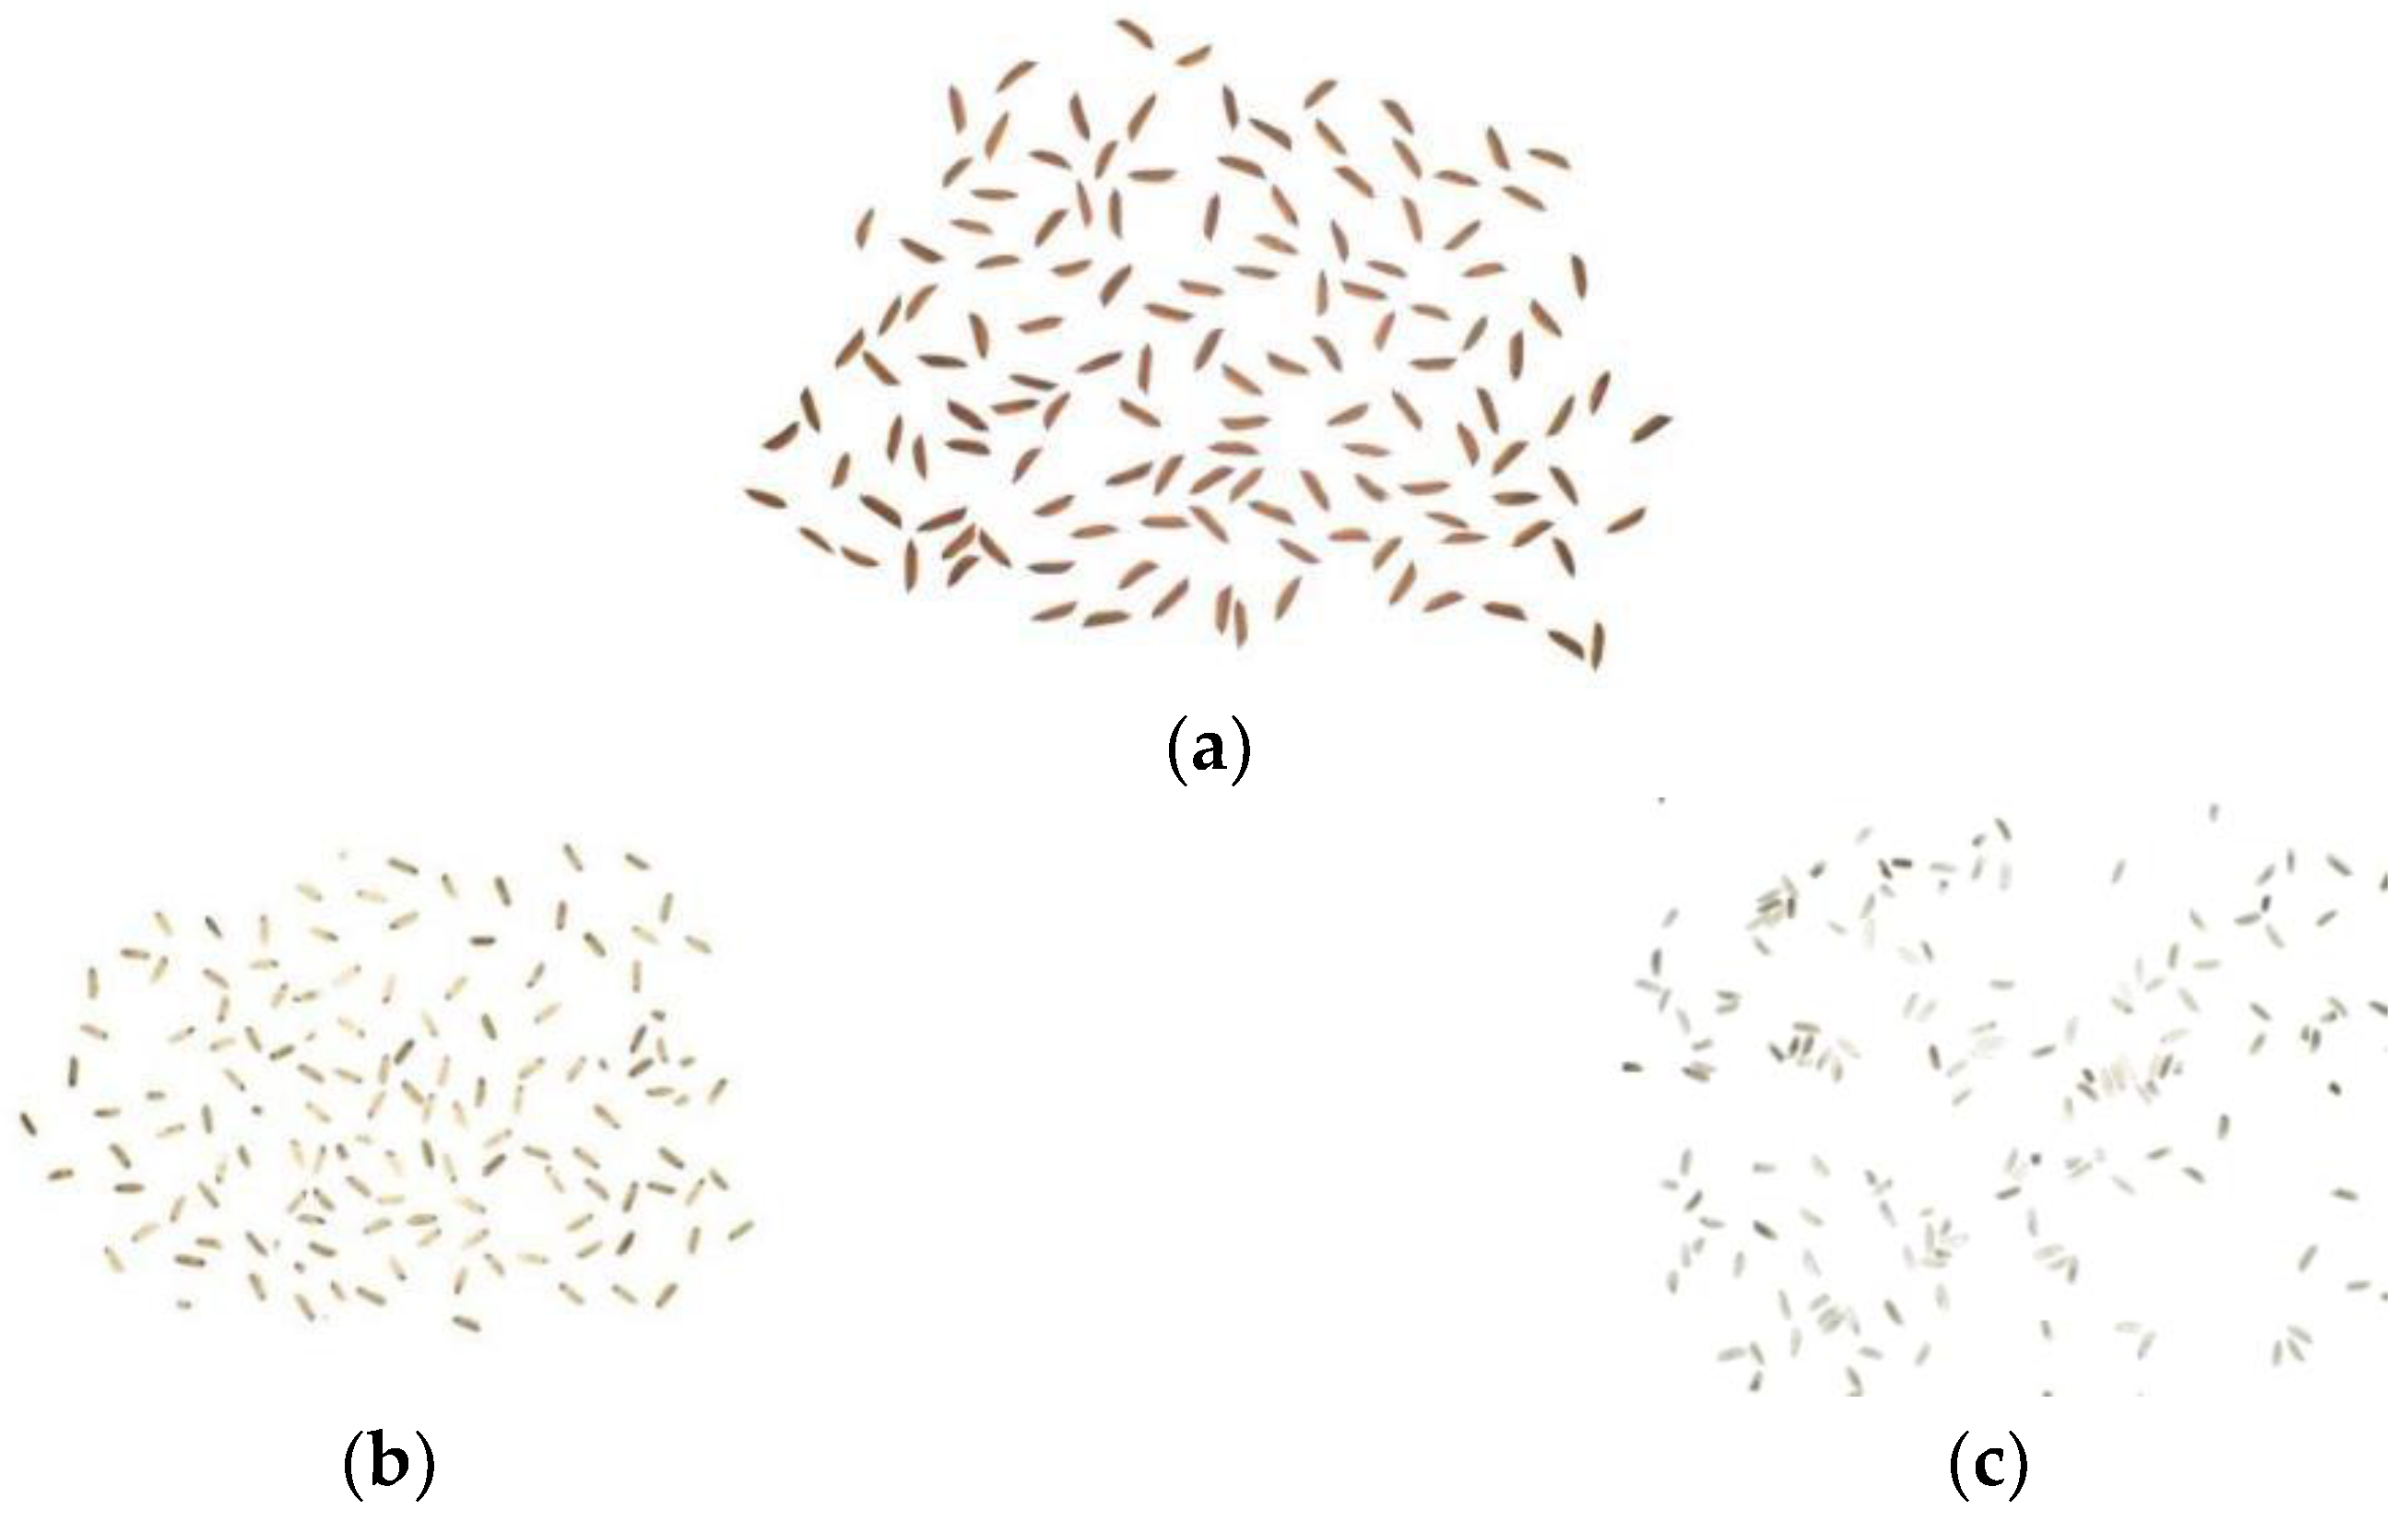
Figure 3.
Grayscale processing: (a) original image; (b) weighted average method; (c) maximum method; (d) average method.
Figure 3.
Grayscale processing: (a) original image; (b) weighted average method; (c) maximum method; (d) average method.
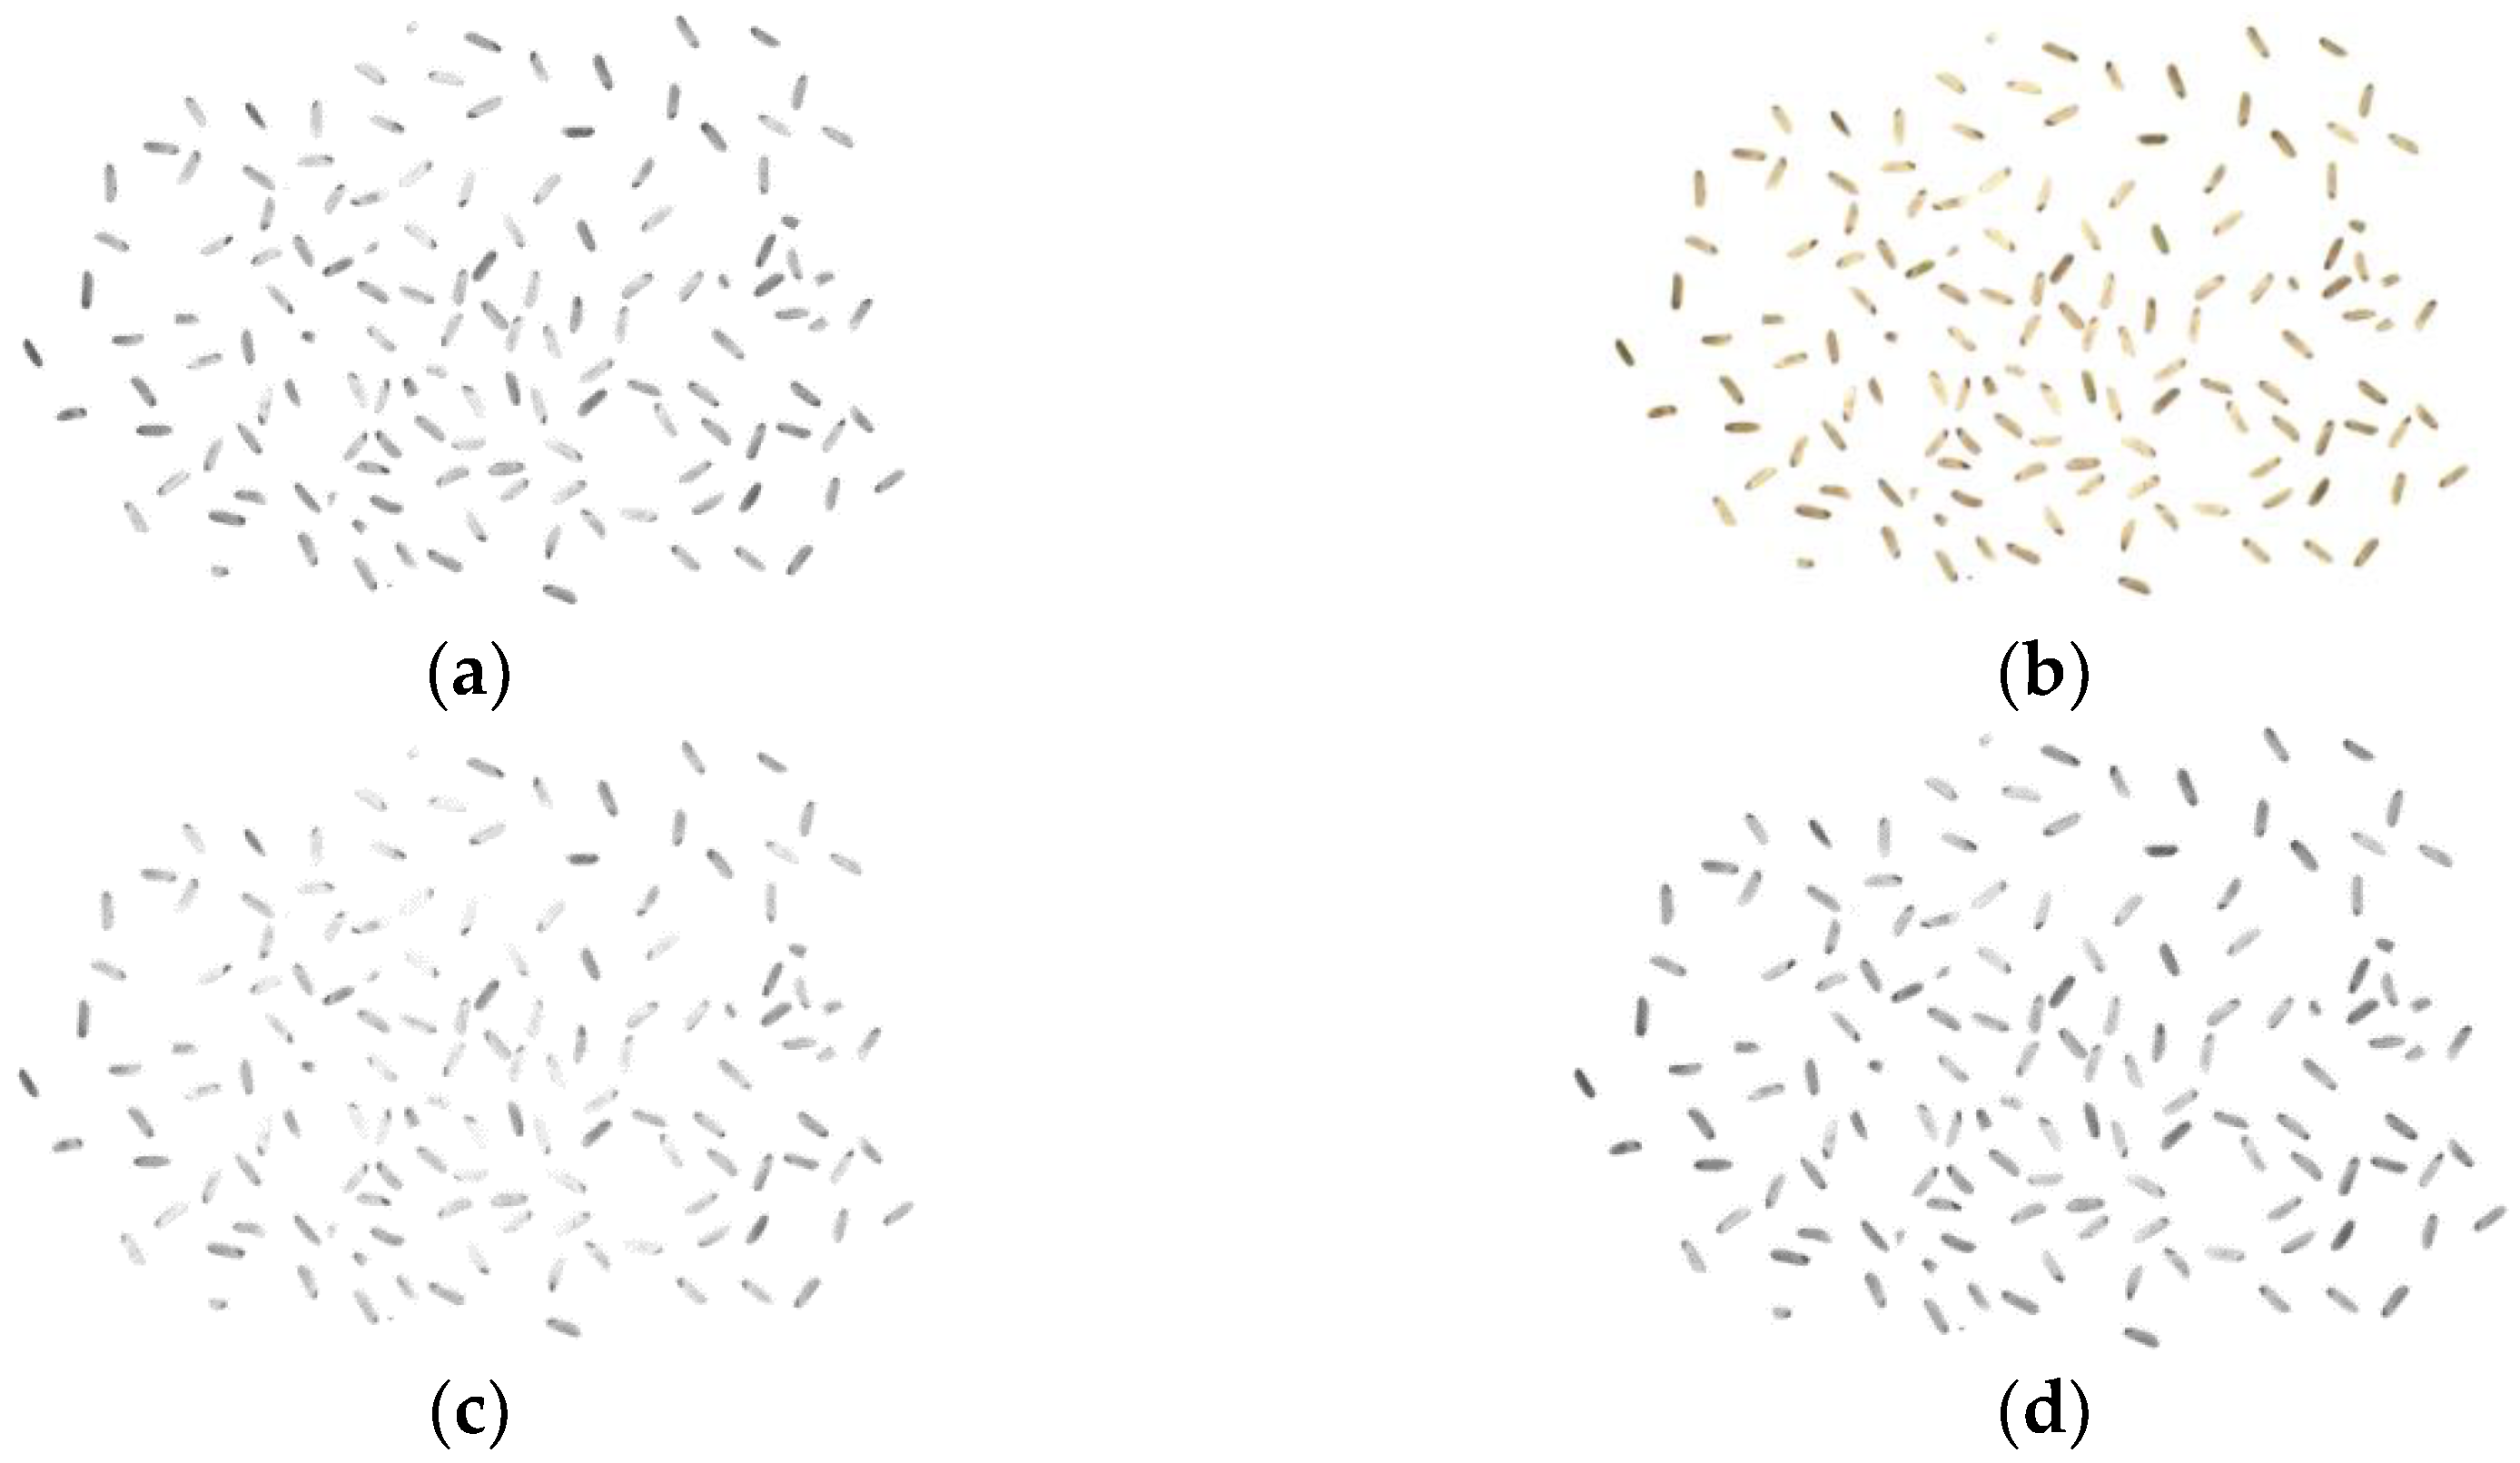
Figure 4.
Denoising process: (a) raw noise image; (b) median filtering; (c) maximum filtering; (d) mean filtering; (e) gaussian filtering.
Figure 4.
Denoising process: (a) raw noise image; (b) median filtering; (c) maximum filtering; (d) mean filtering; (e) gaussian filtering.
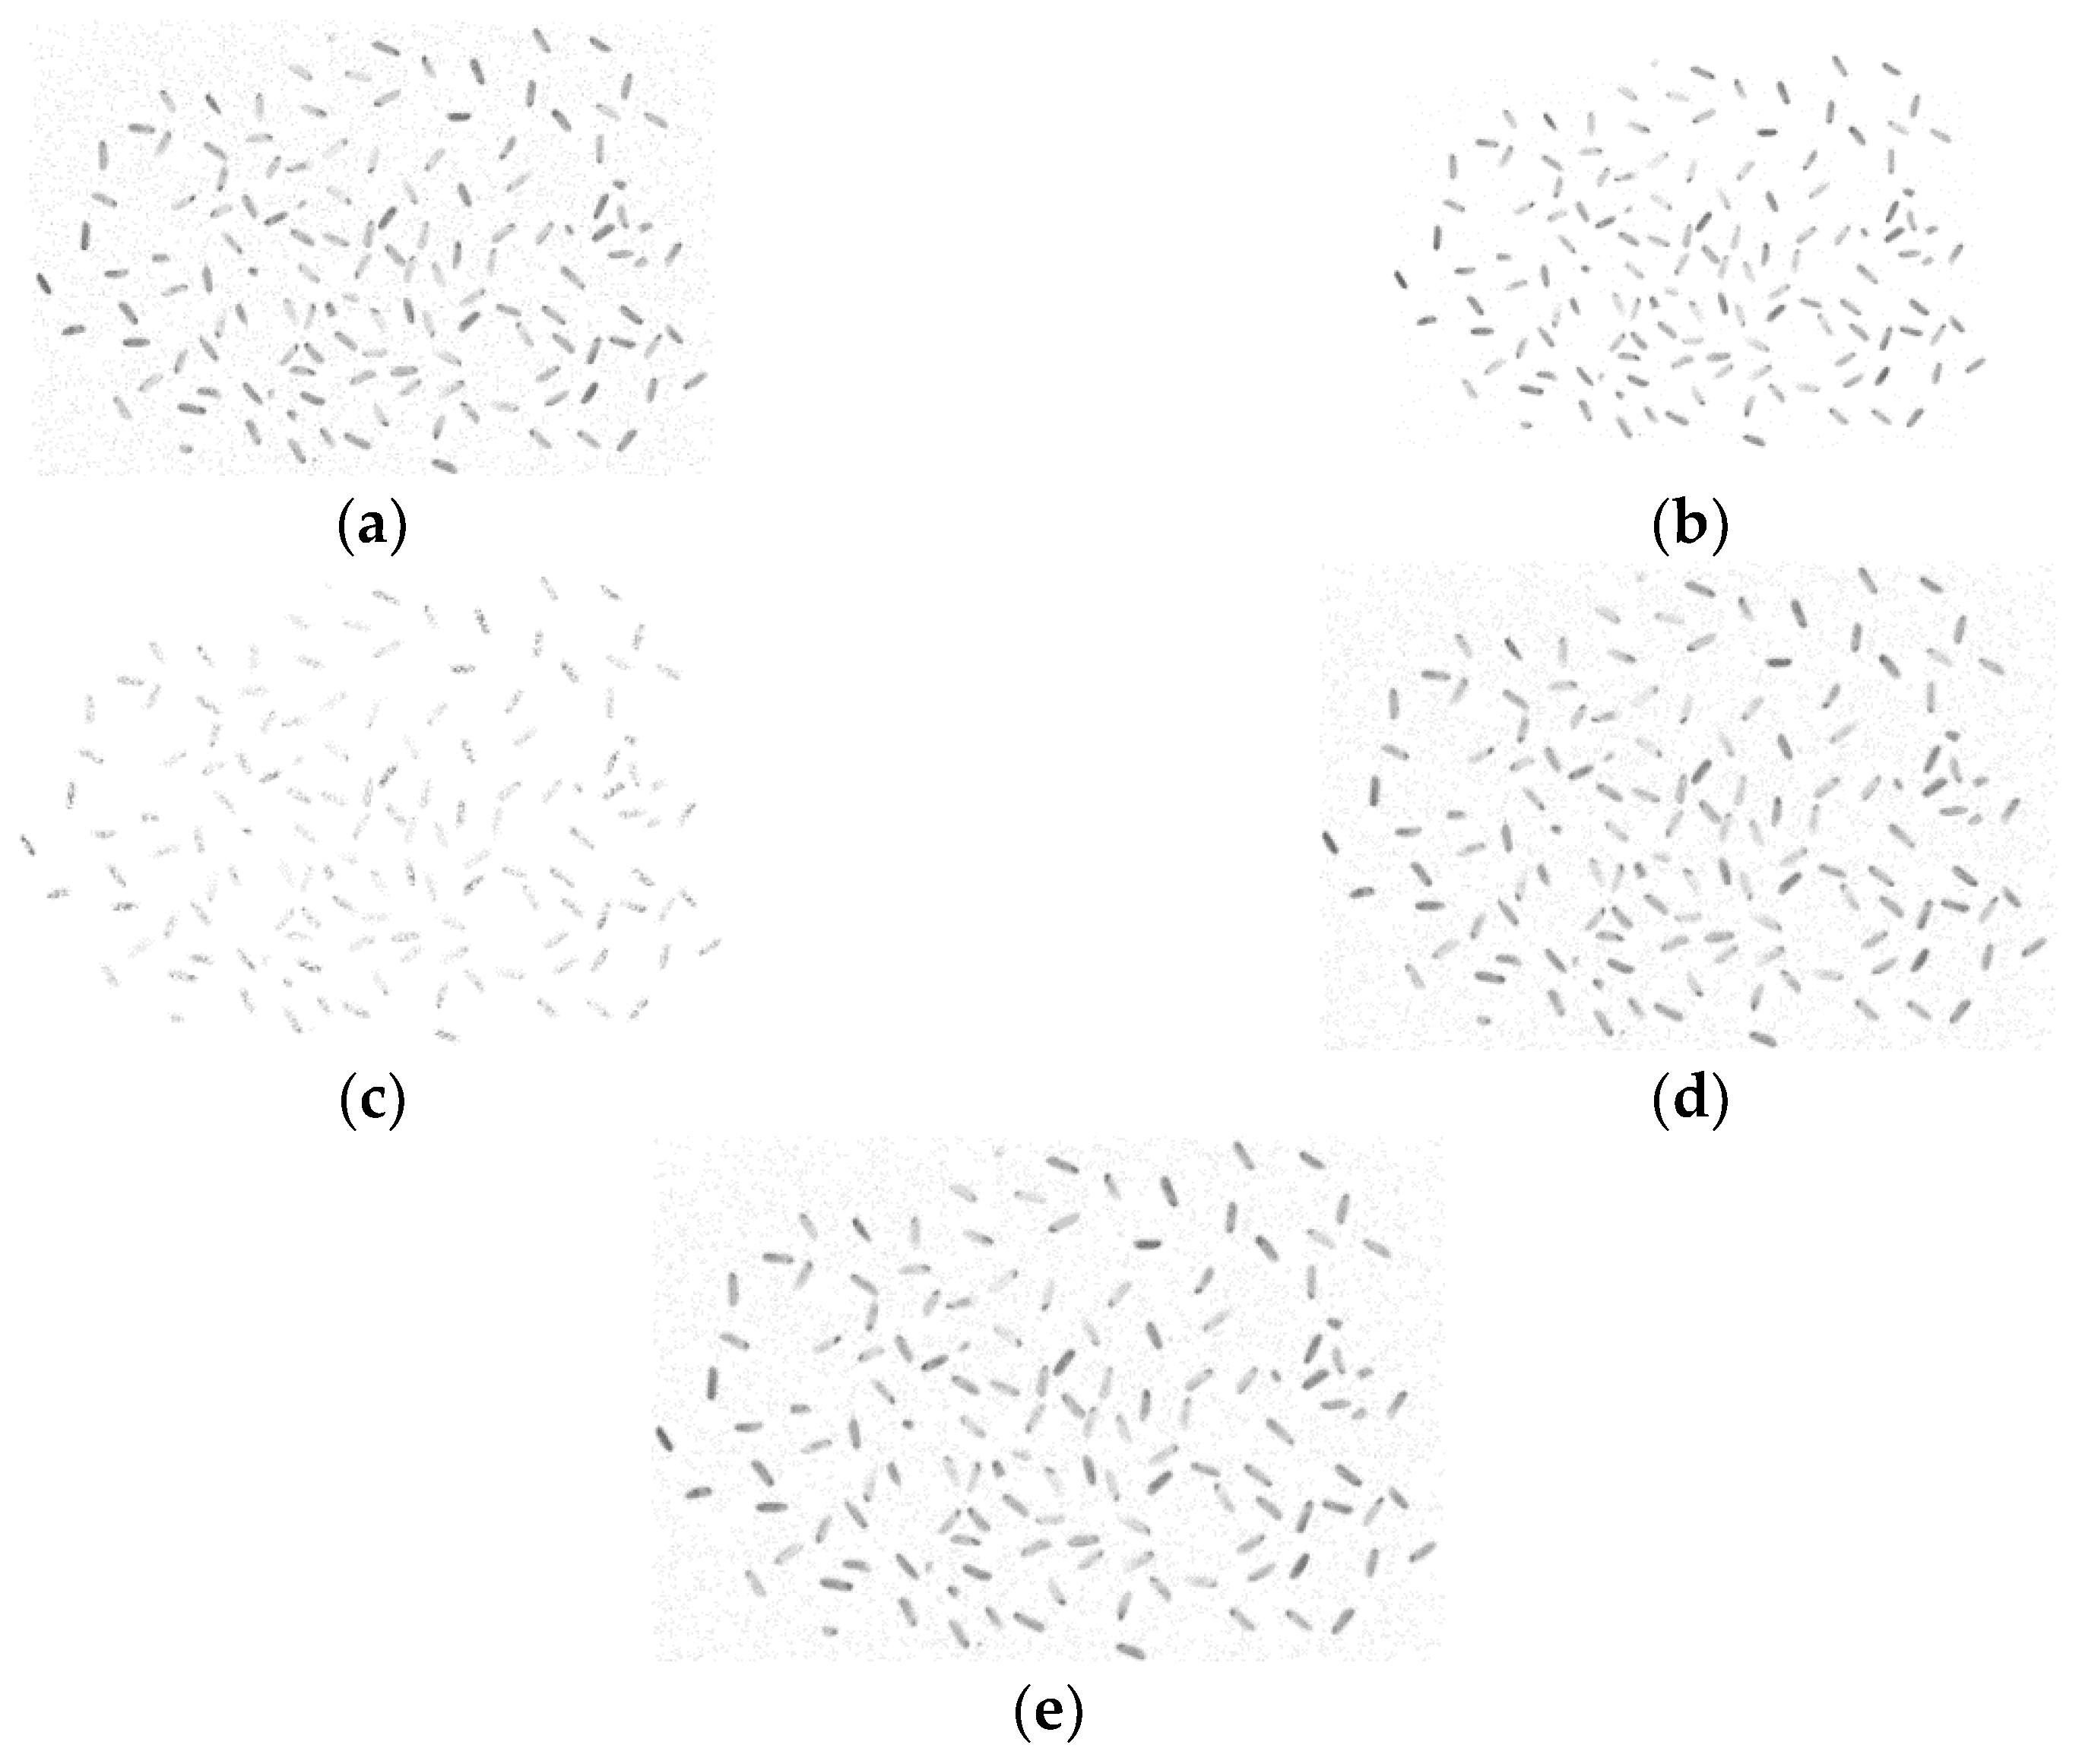
Figure 5.
Image segmentation: (a) original figure; (b) fixed threshold segmentation method; (c) adaptive threshold segmentation method; (d) maximum class variance method.
Figure 5.
Image segmentation: (a) original figure; (b) fixed threshold segmentation method; (c) adaptive threshold segmentation method; (d) maximum class variance method.
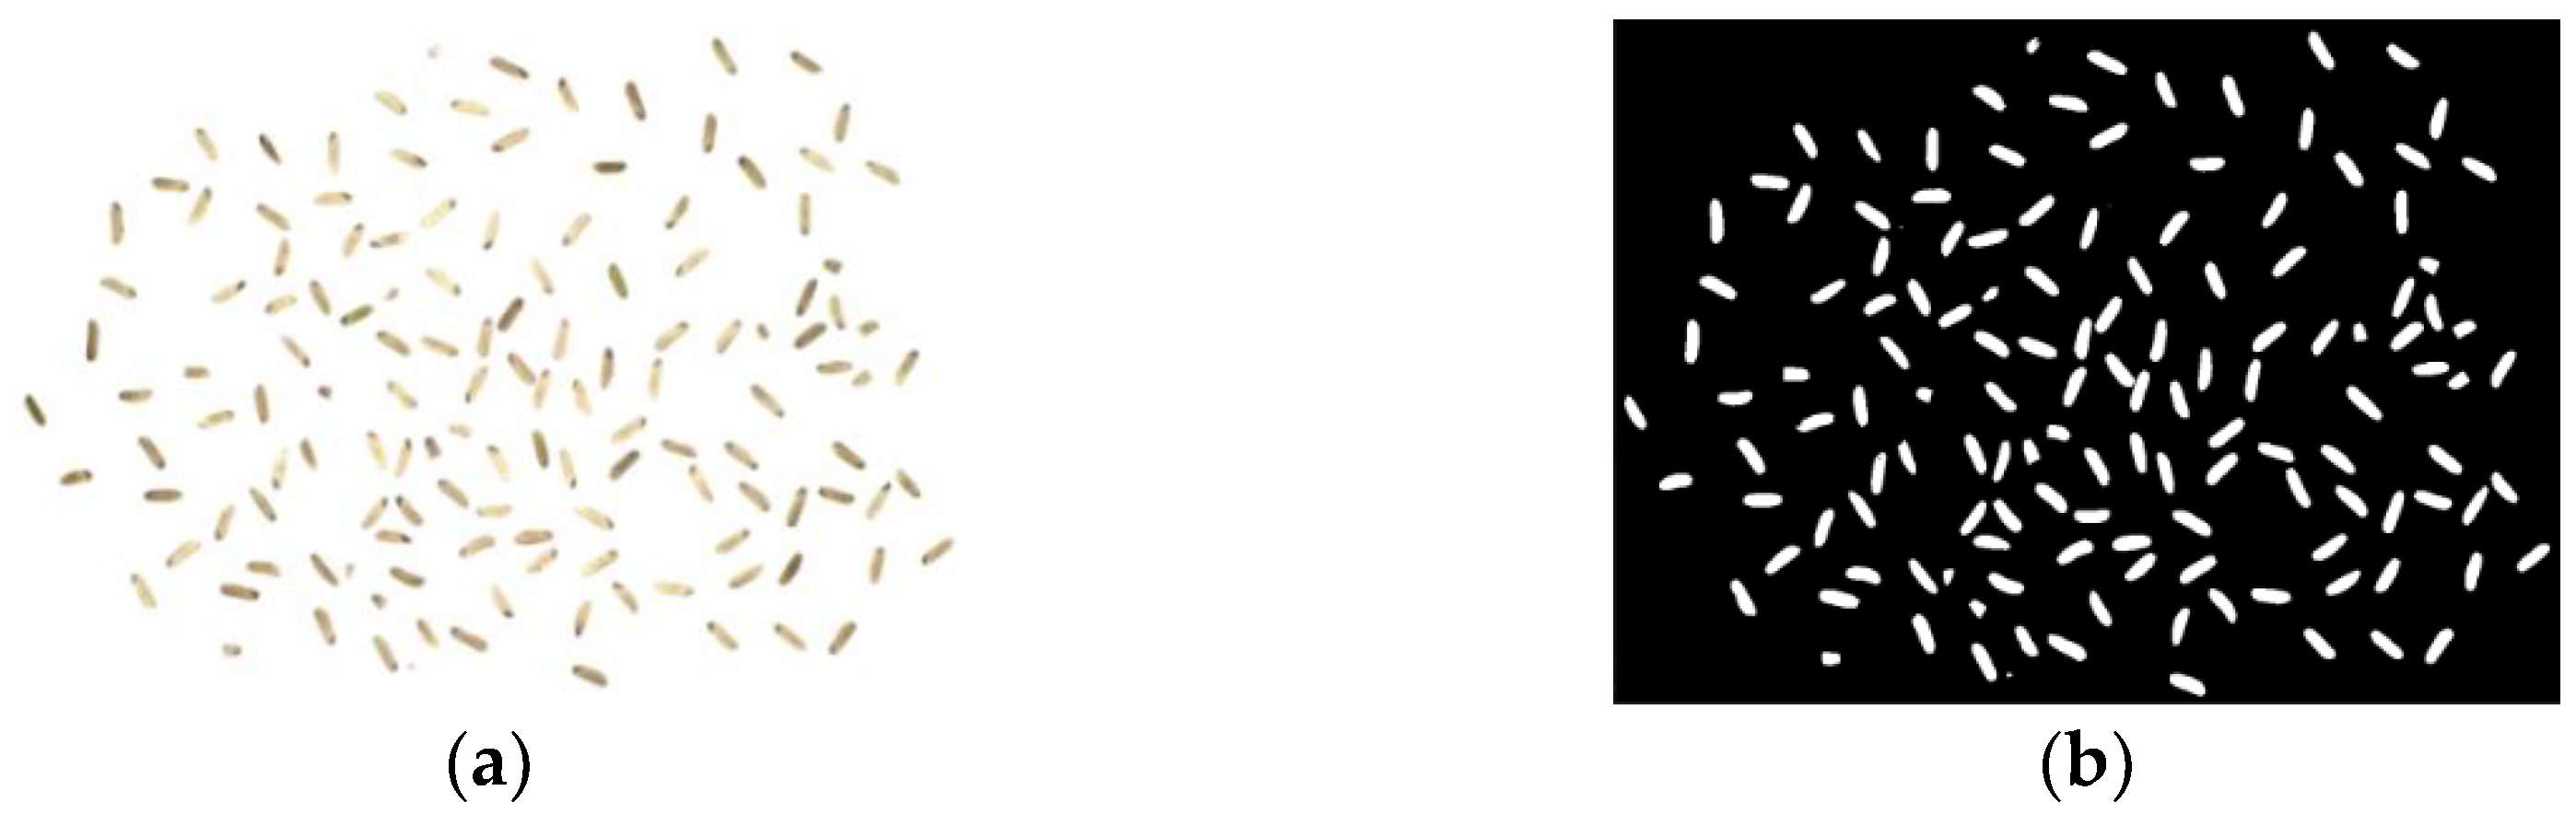
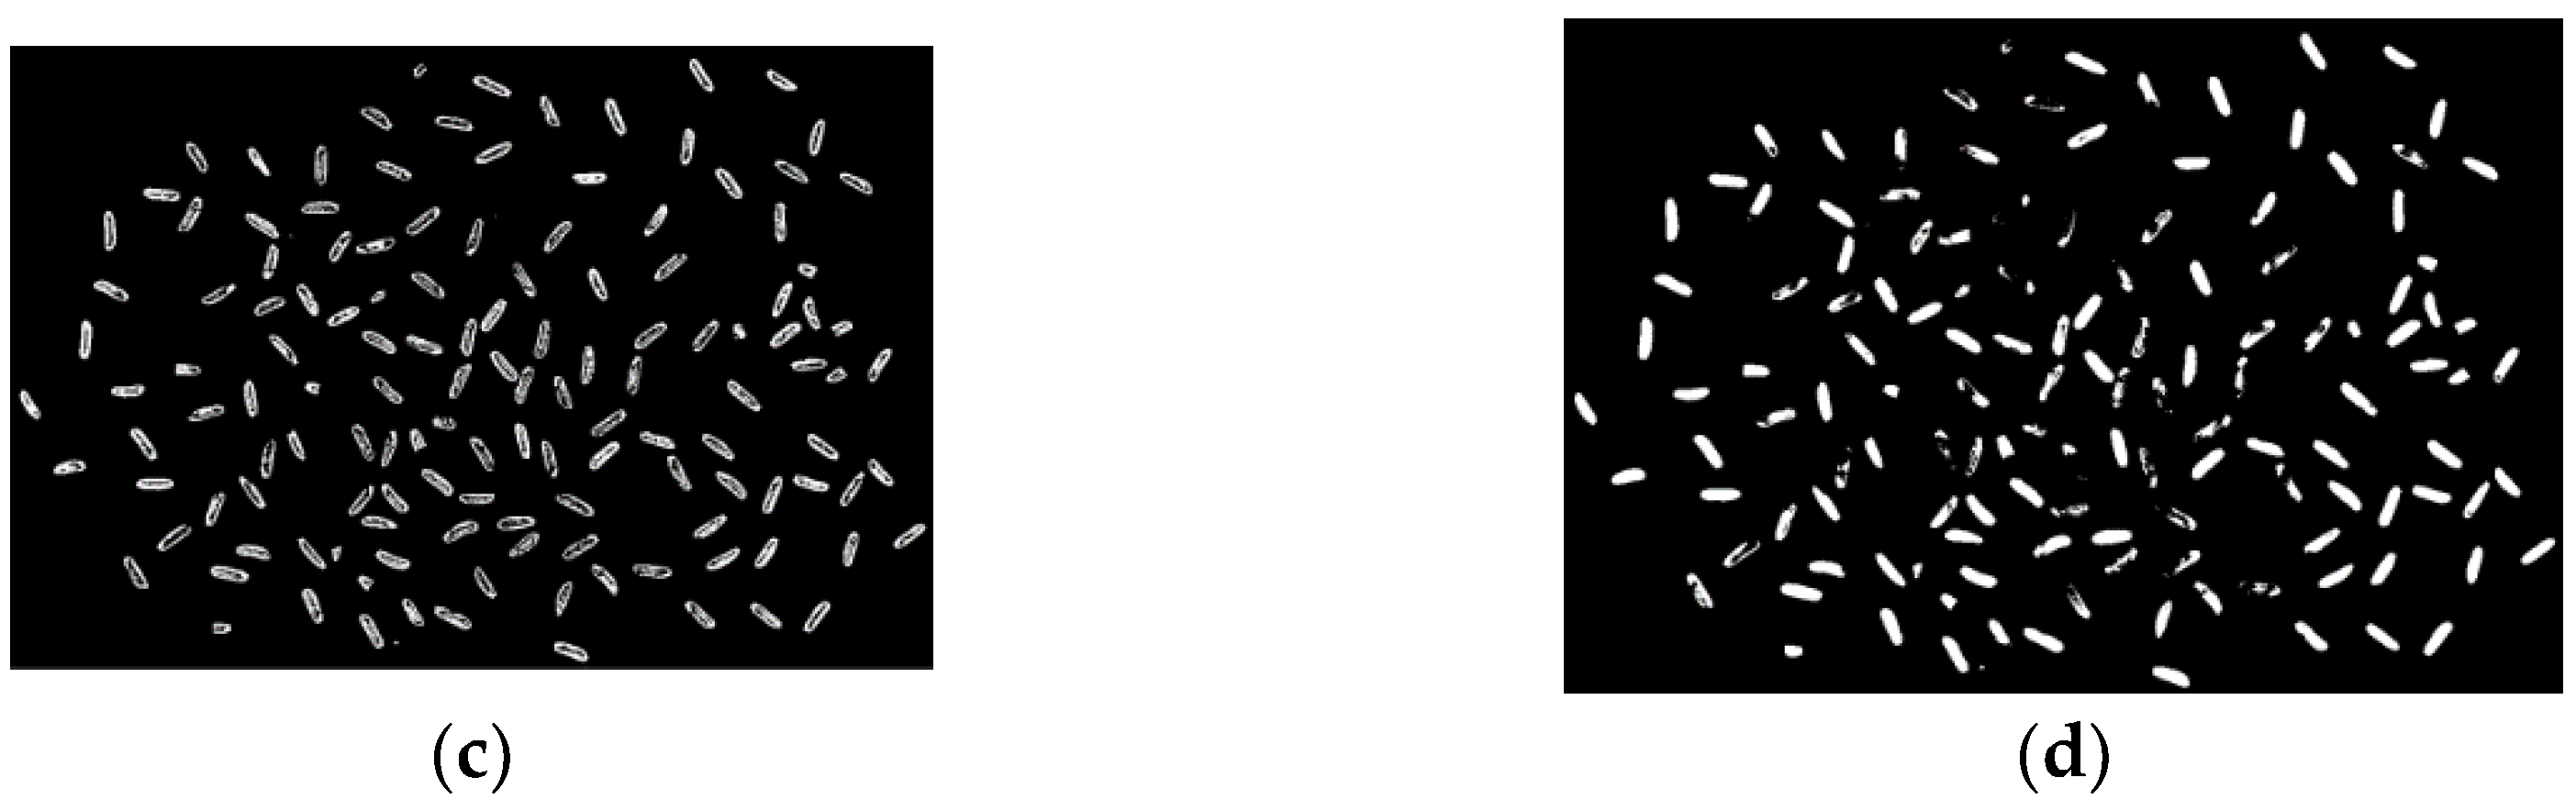
Figure 6.
Watershed algorithm to segment adhesions: (a) Original figure; (b) background segmentation method; (c)watershed algorithm segmentation method.
Figure 6.
Watershed algorithm to segment adhesions: (a) Original figure; (b) background segmentation method; (c)watershed algorithm segmentation method.

Figure 7.
Opening operation effect diagram: (a) original diagram; (b) rendering diagram of the opening operation.
Figure 7.
Opening operation effect diagram: (a) original diagram; (b) rendering diagram of the opening operation.
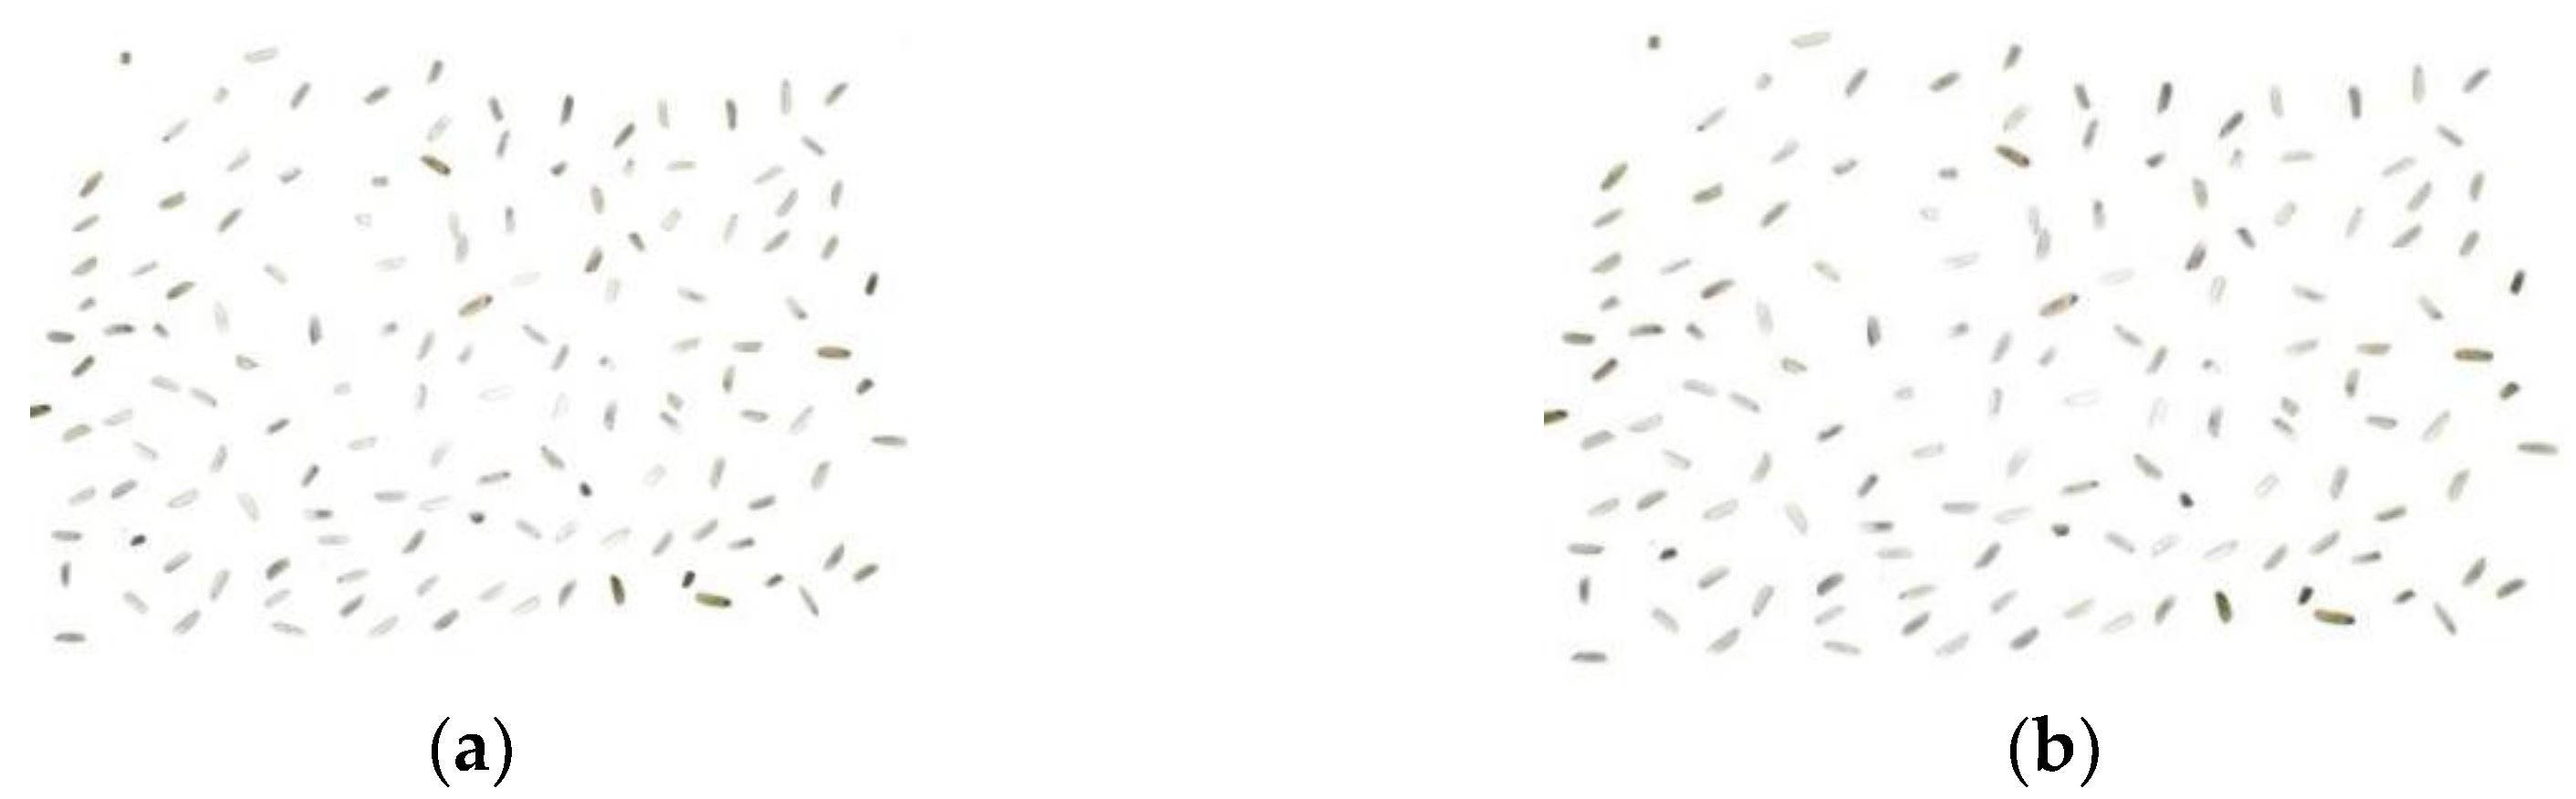
Figure 8.
The effect of rice grain quality discrimination based on area thresholding.
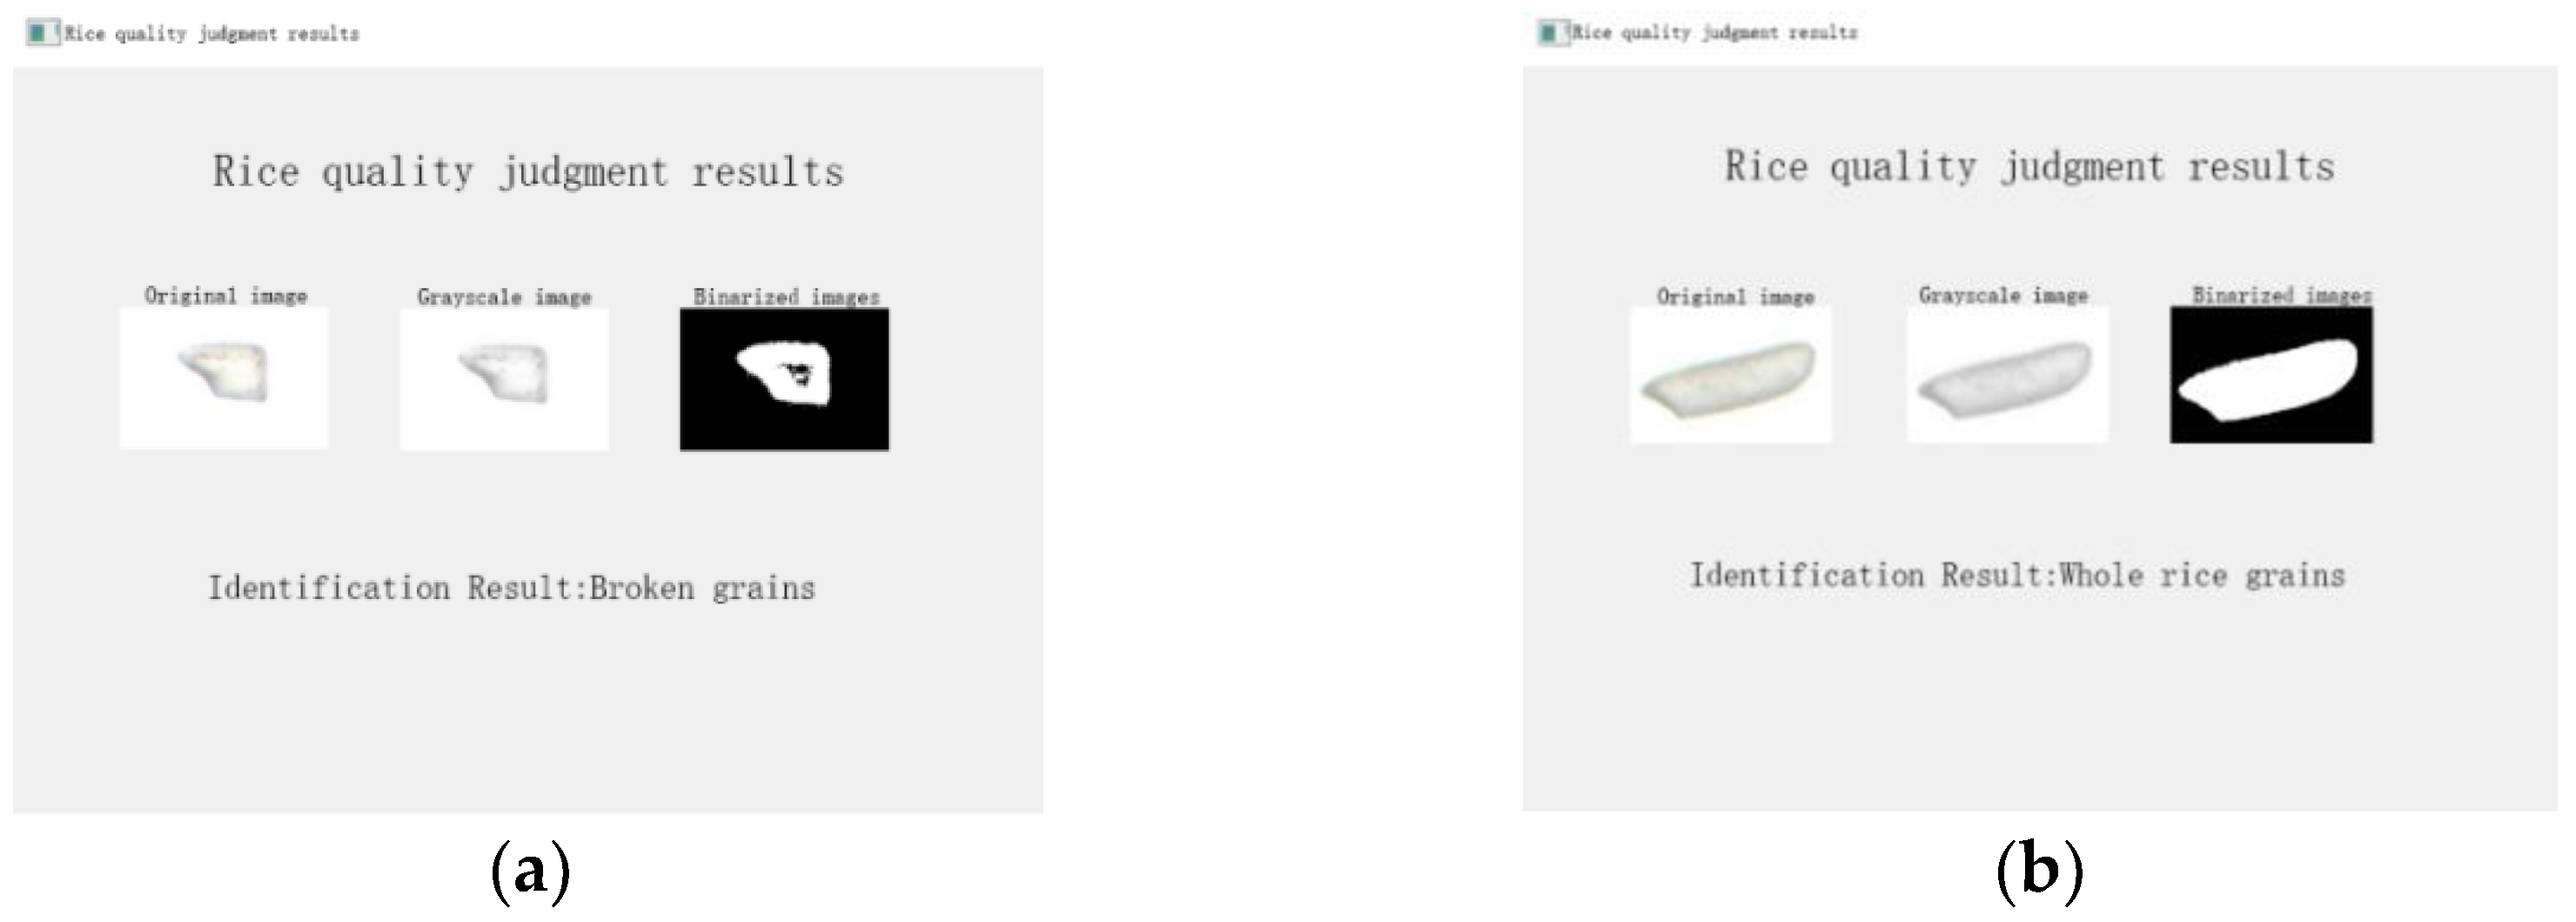
Figure 9.
Effect of rice quality discrimination based on hue thresholding.
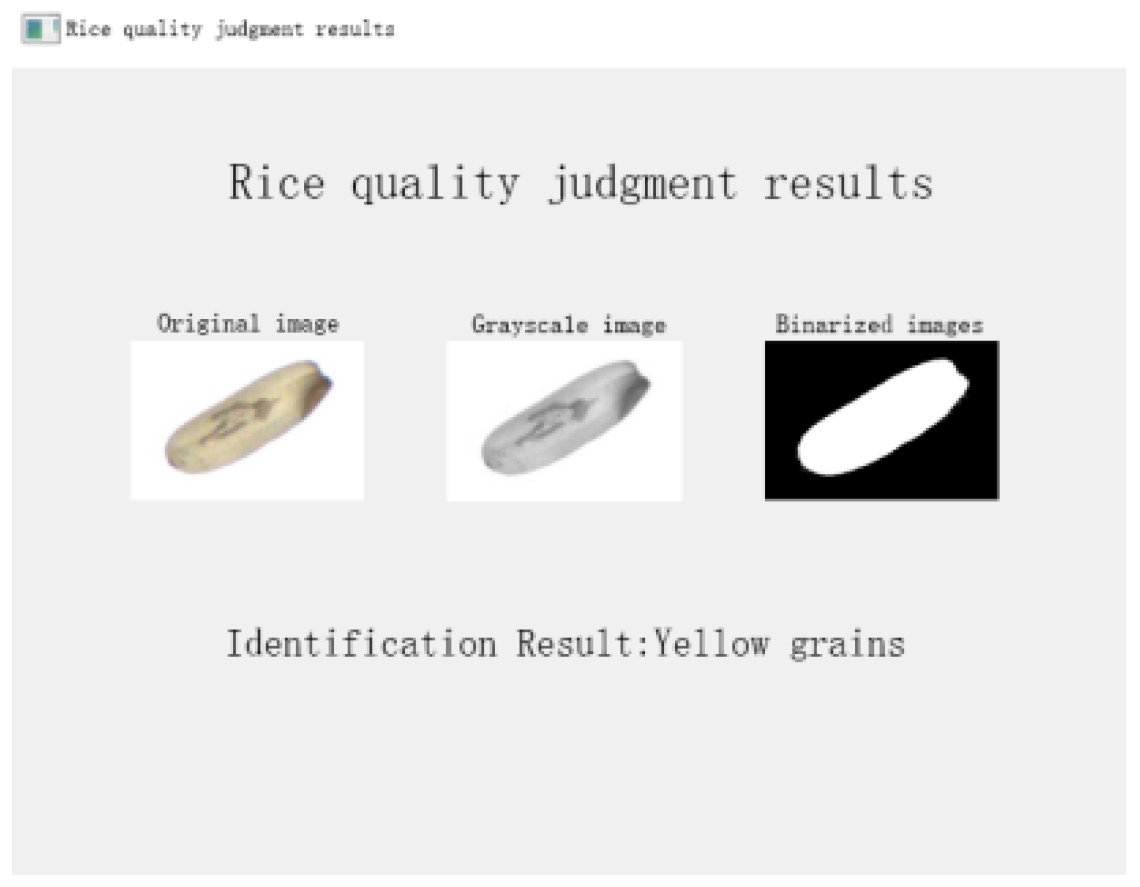
Figure 10.
Effect of rice quality discrimination based on hue thresholding.
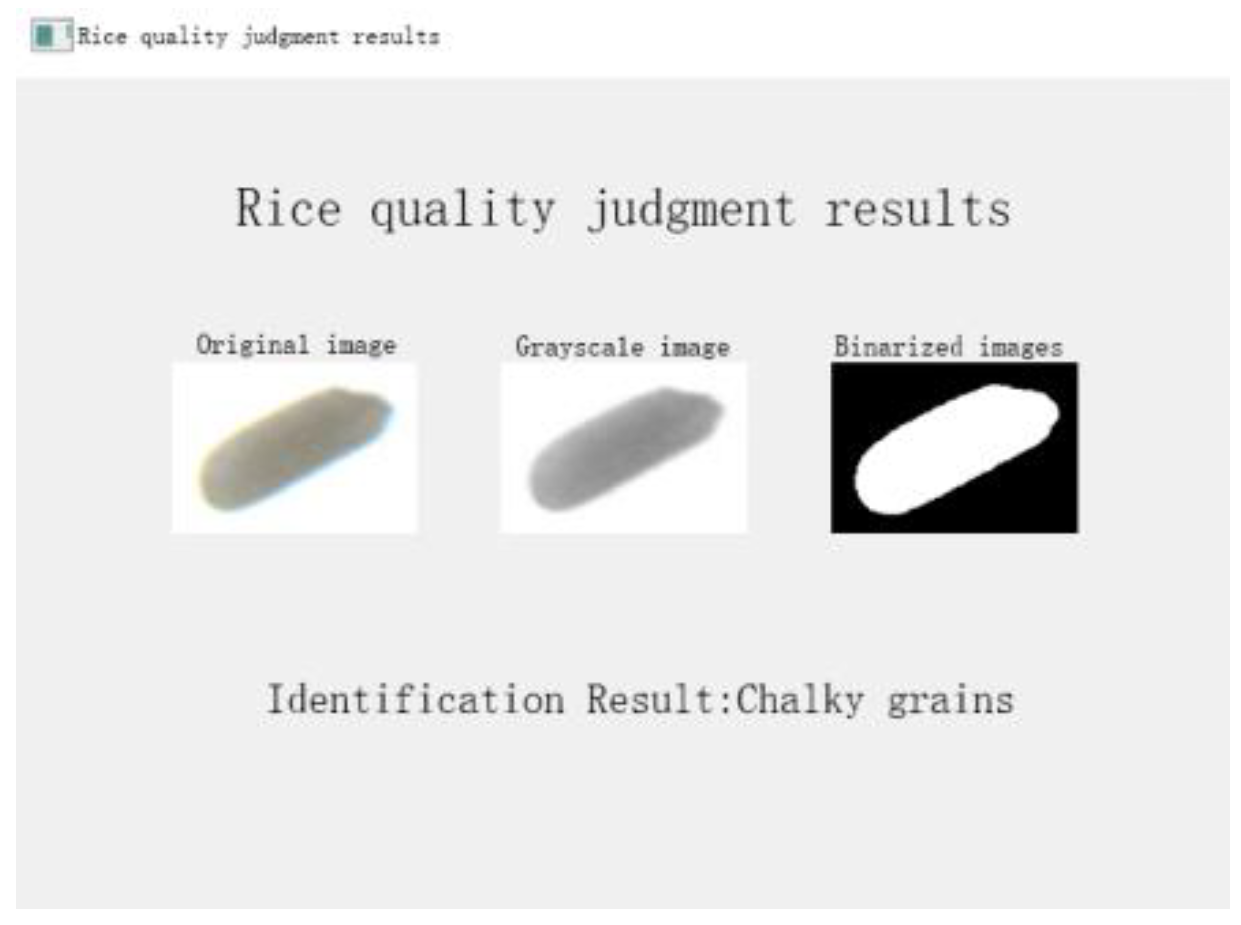
Figure 11.
Comparison of the effect of the YOLO model on rice quality recognition:(a) YOLOv3 model; (b) YOLOv5 model; (c) YOLOv7 model; (d) YOLOv8 model.
Figure 11.
Comparison of the effect of the YOLO model on rice quality recognition:(a) YOLOv3 model; (b) YOLOv5 model; (c) YOLOv7 model; (d) YOLOv8 model.
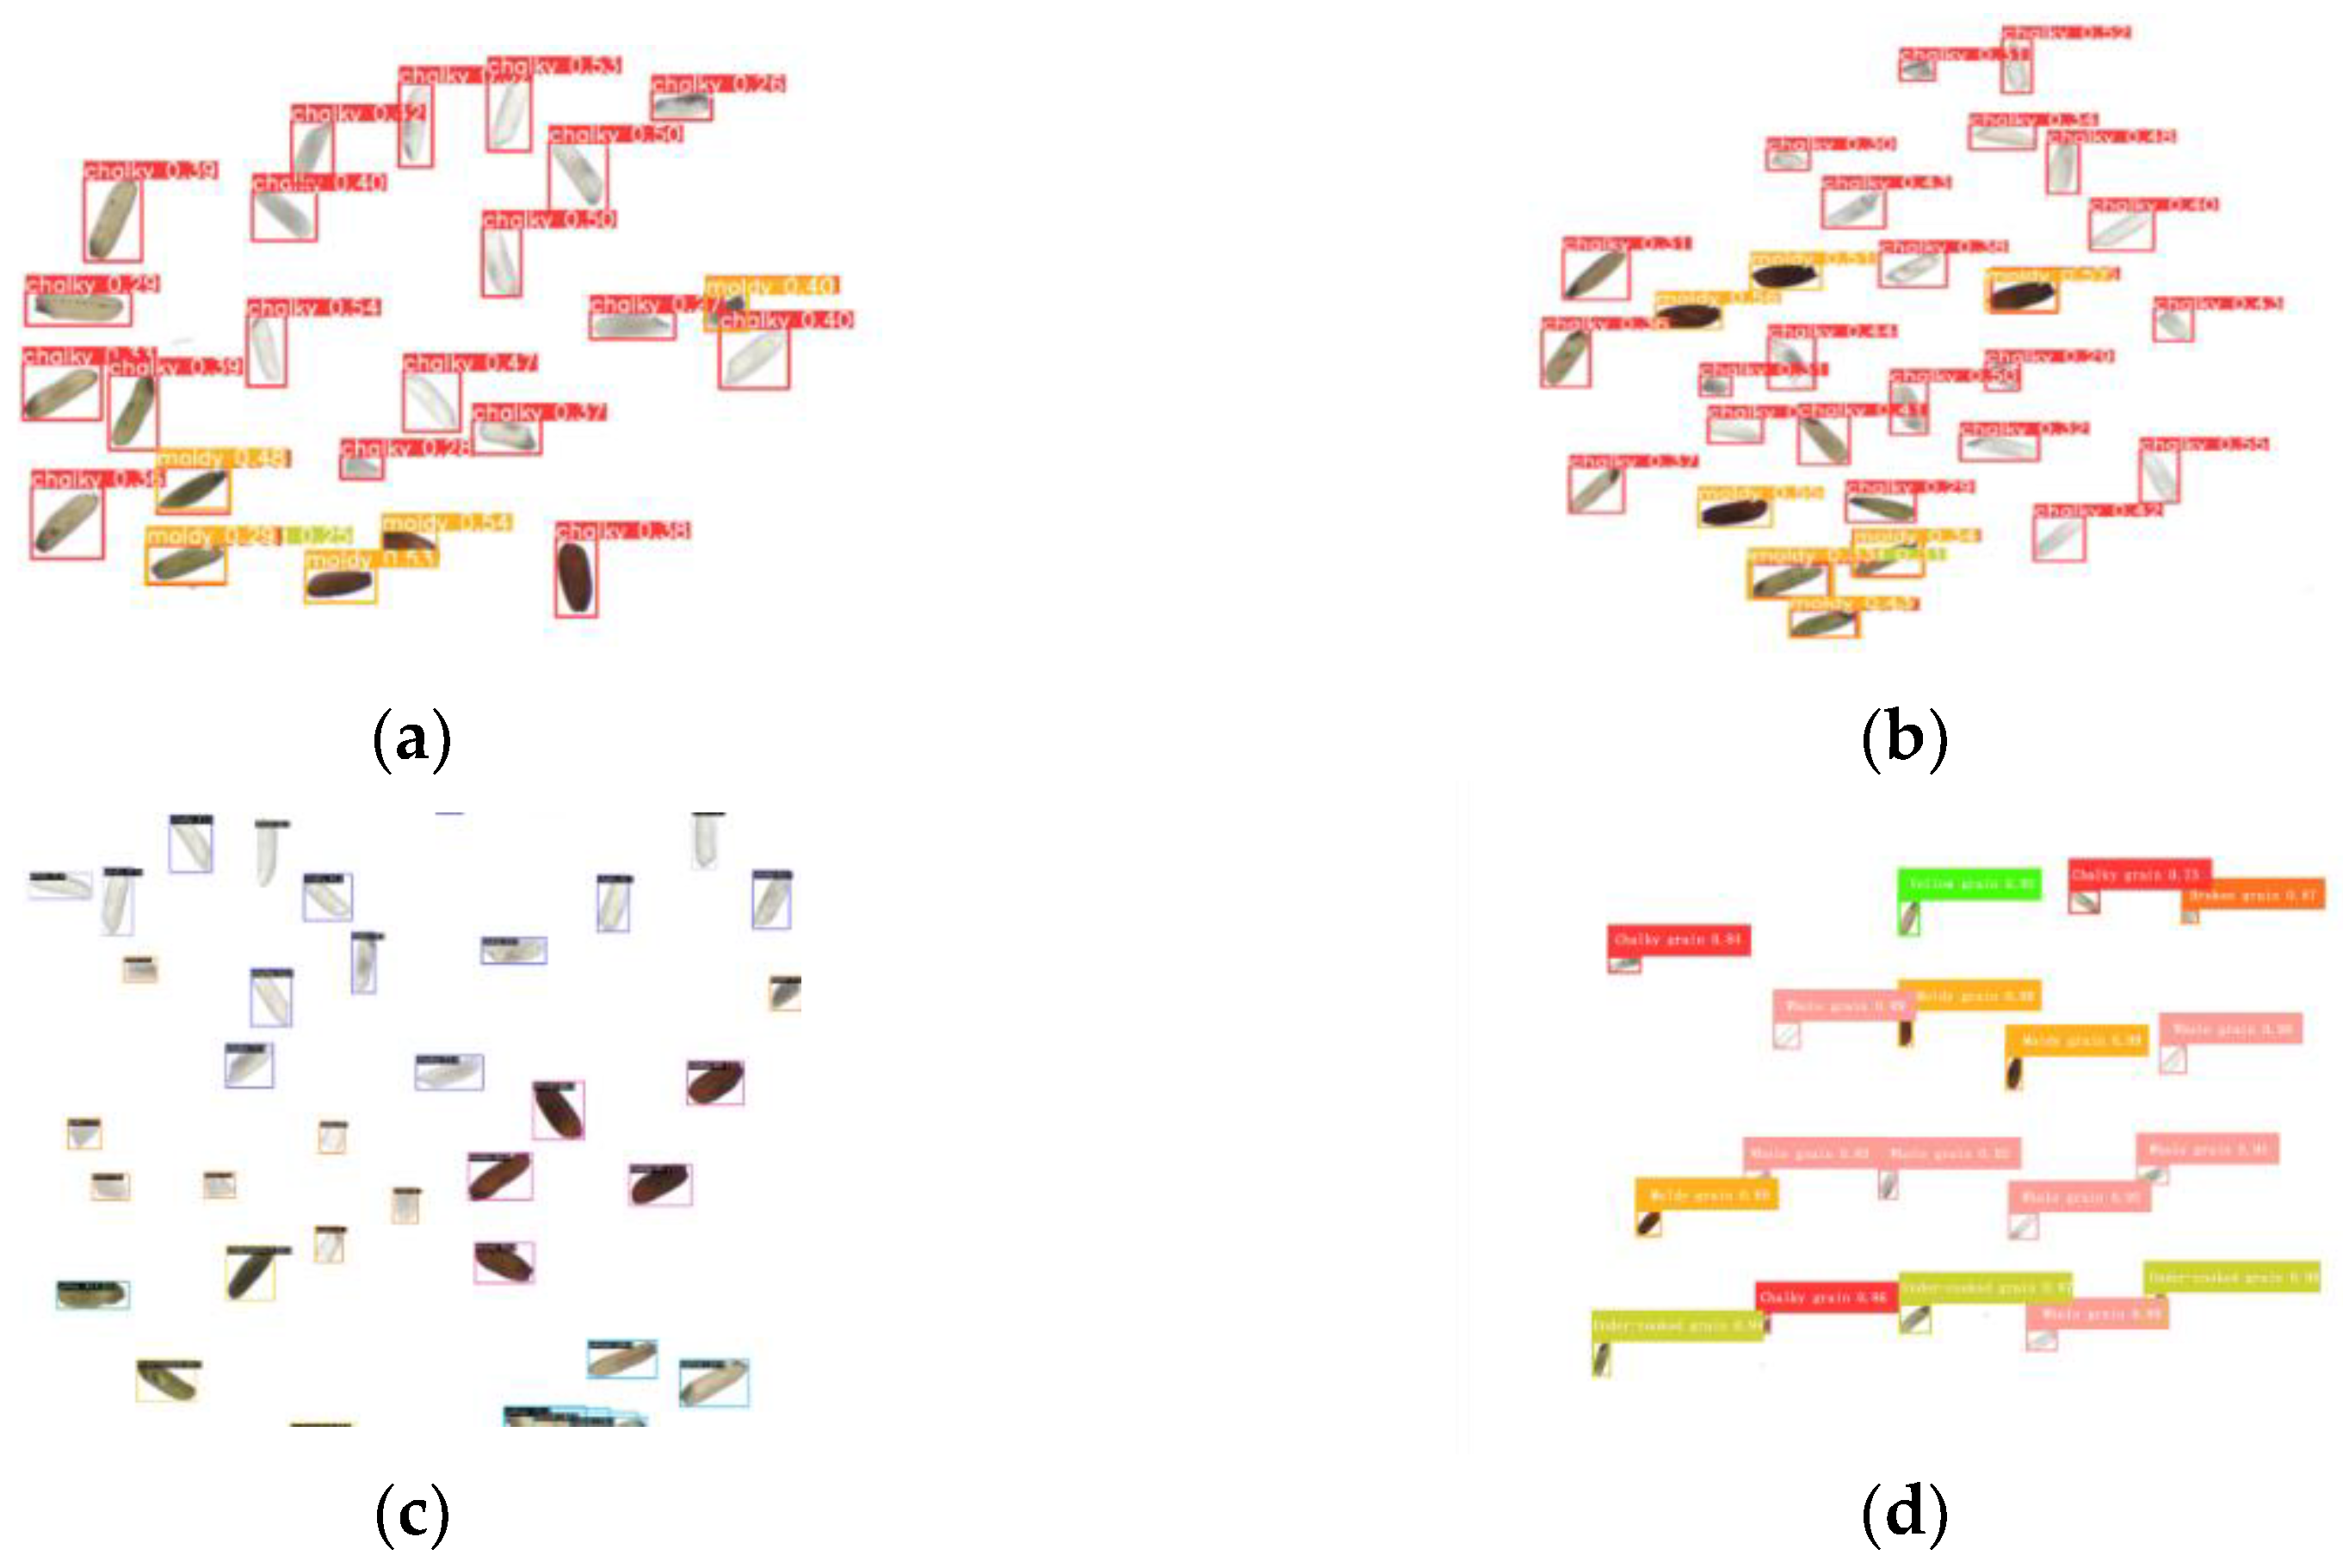
Figure 12.
Effect of rice quality discrimination based on hue thresholding.
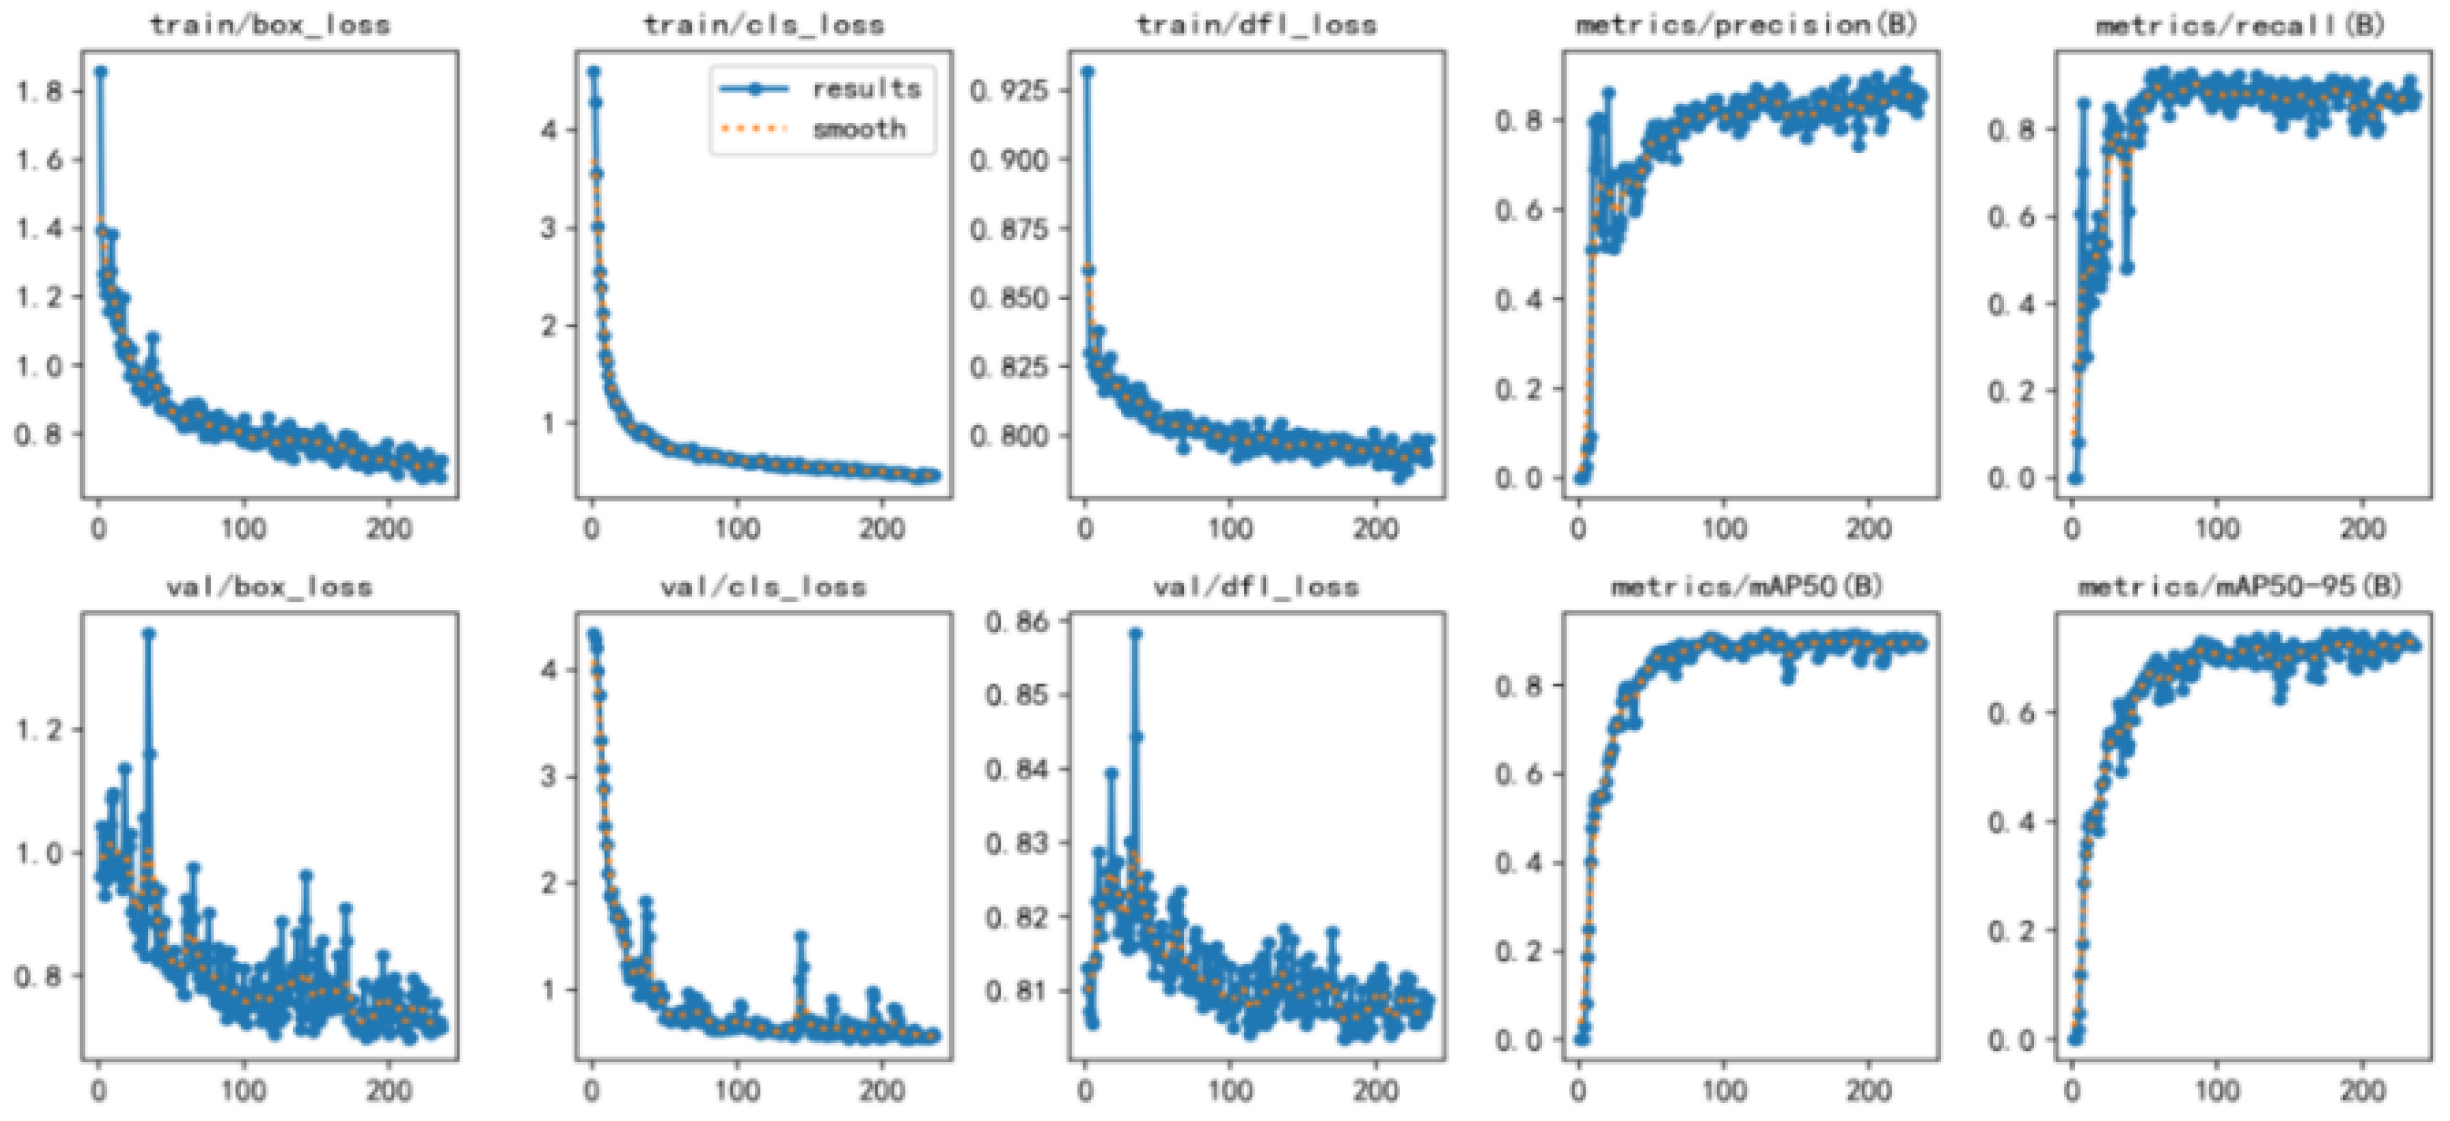
Figure 13.
P-R diagram of rice quality testing training set and inspection test set.
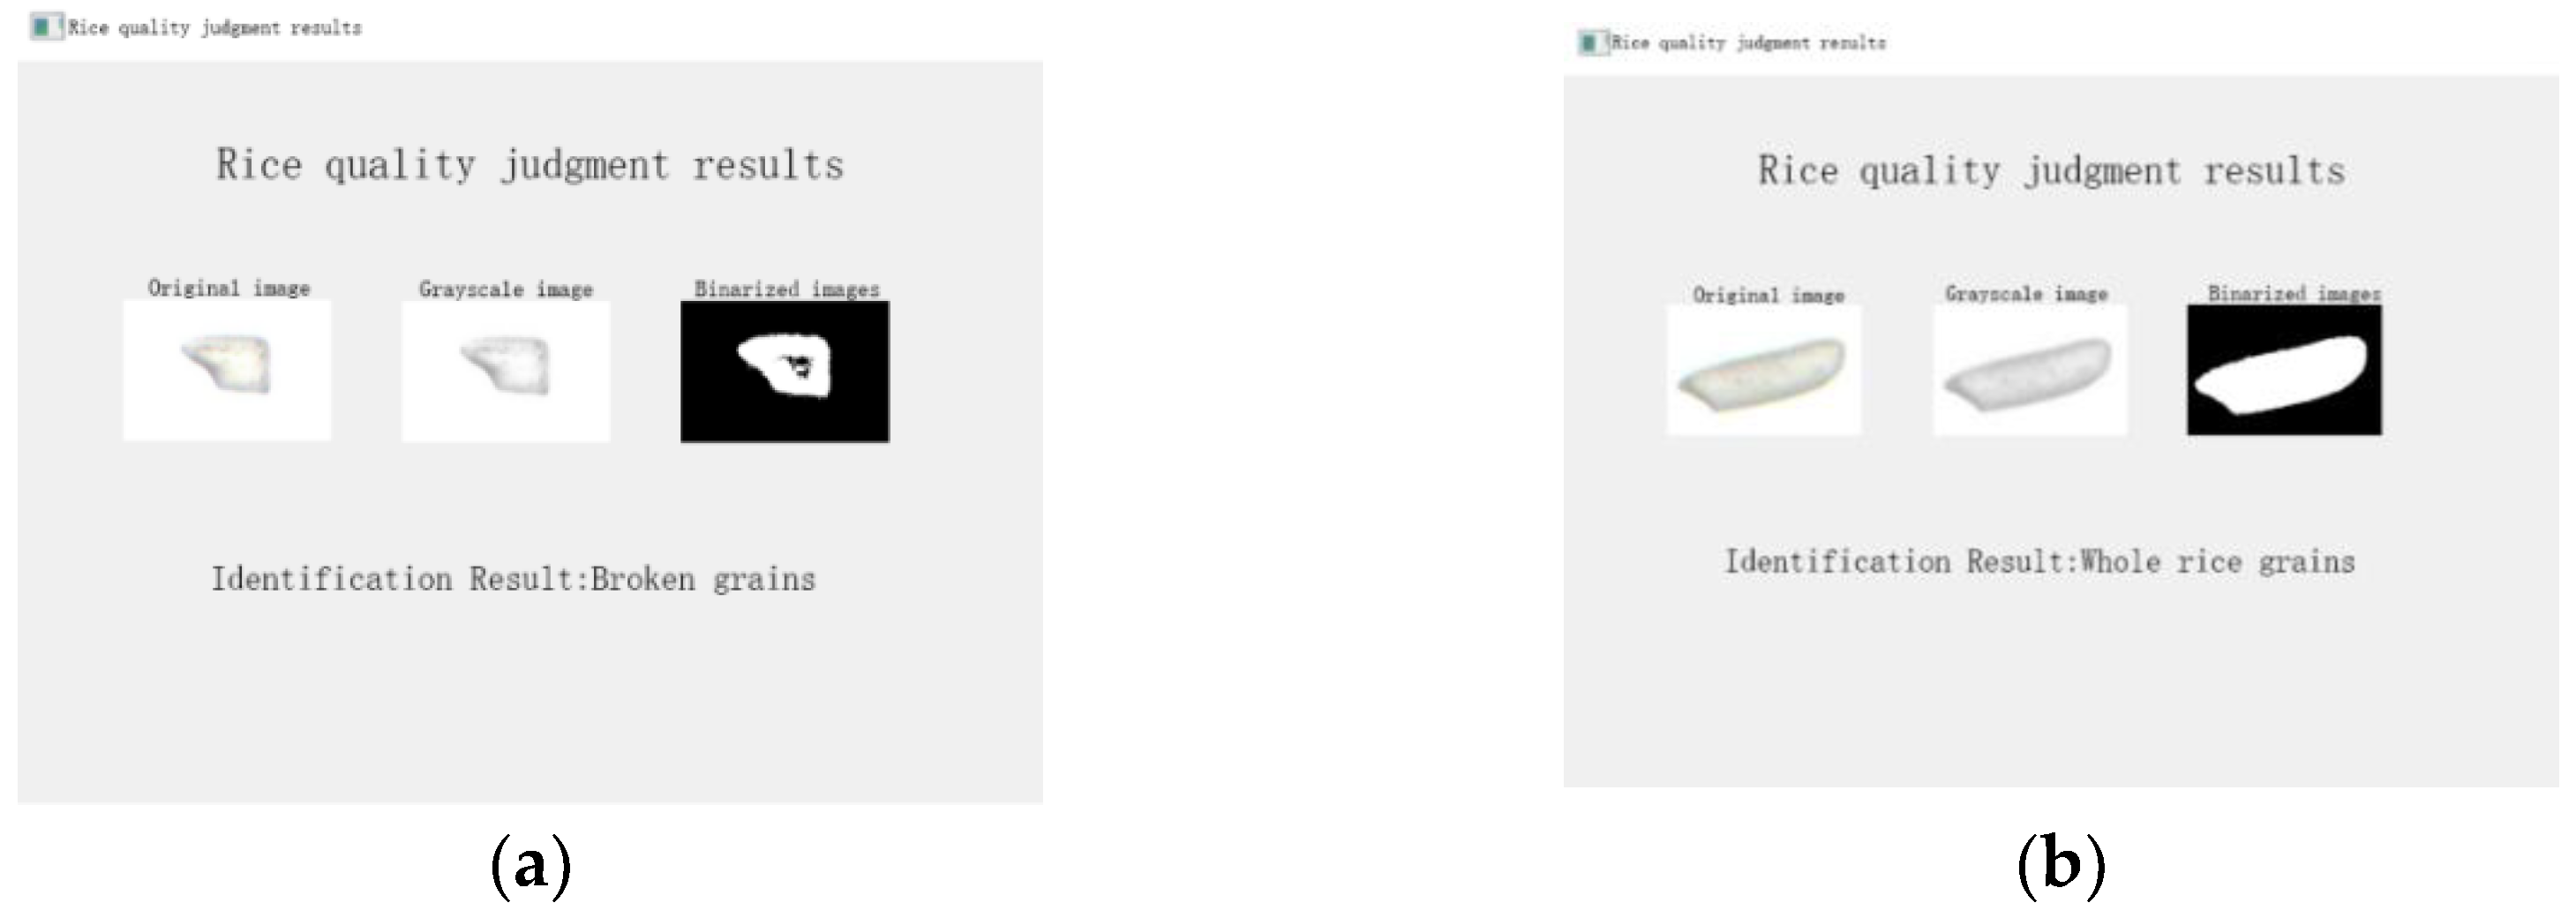
Figure 14.
Columnar distribution of phenotypic parameters of fine meters.
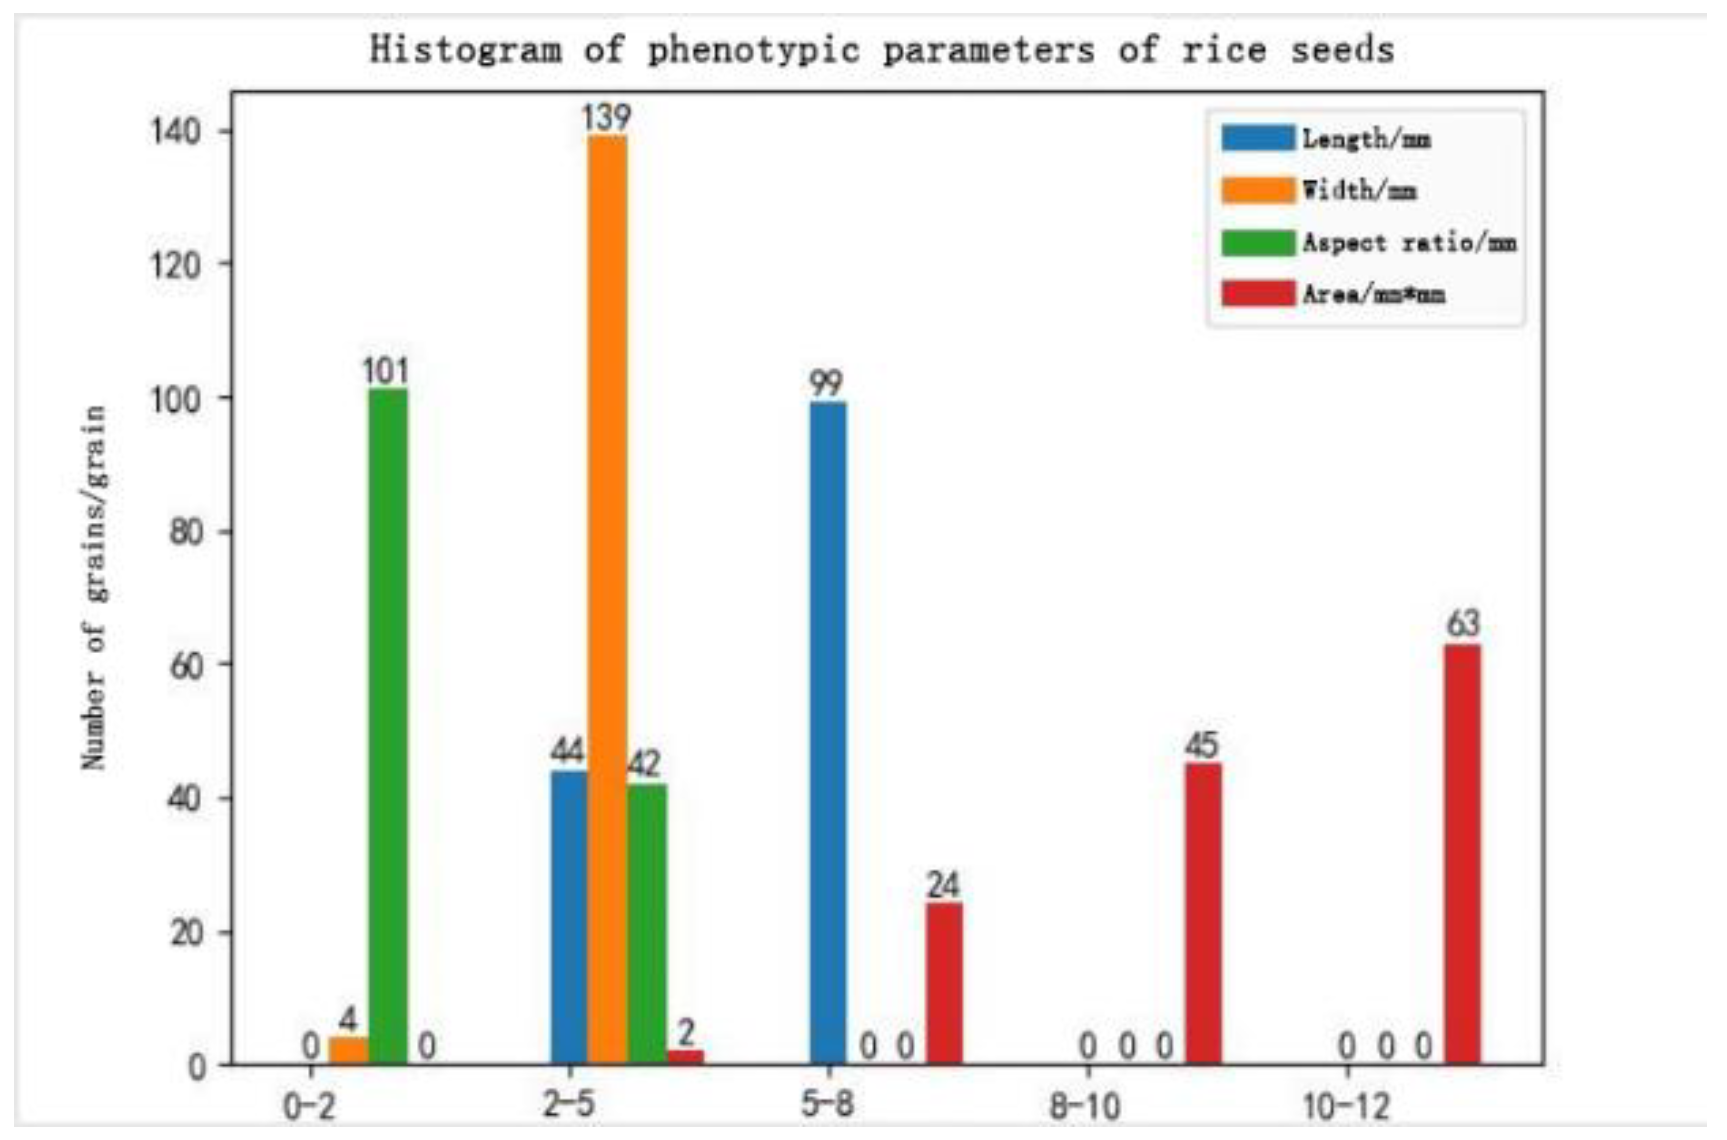
Figure 15.
The results of system detection.
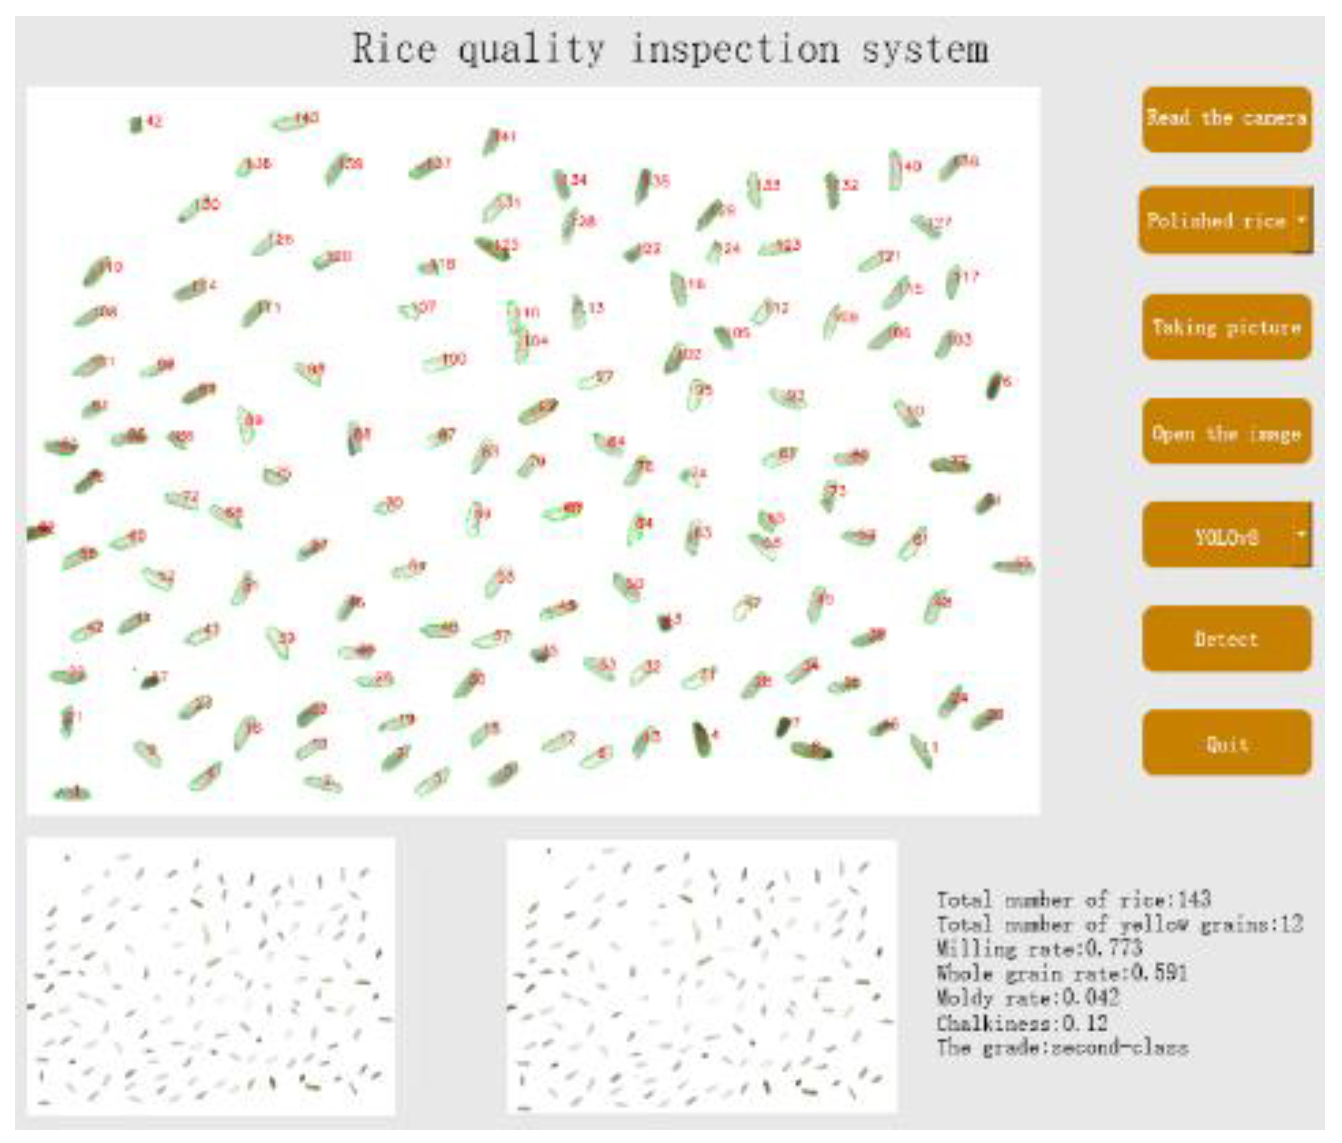

Table 1.
Comparative results of model indicators.
| Network model | mPrecision/% | mRecall/% | mF1/% |
|---|---|---|---|
| YOLOv3 | 0.553 | 0.552 | 0.552 |
| YOLOv5 | 0.652 | 0.652 | 0.652 |
| YOLOv7 | 0.778 | 0.780 | 0.780 |
| YOLOv8 | 0.912 | 0.915 | 0.912 |
Table 2.
Table of the number of iterations and changes in performance metrics.
| The number of iterations | 5 | 30 | 80 | 130 | 180 | 230 | 280 |
|---|---|---|---|---|---|---|---|
| Accuracy | 0.02548 | 0.57686 | 0.79765 | 0.84065 | 0.84259 | 0.86379 | 0.87091 |
| Recall | 0.25706 | 0.82675 | 0.89876 | 0.8878 | 0.8857 | 0.89374 | 0.8897 |
| mAP@0.5 | 0.08084 | 0.70734 | 0.88633 | 0.91777 | 0.9128 | 0.90258 | 0. 89766 |
Table 3.
Accuracy of training set and Accuracy of Inspection set.
| project | Chalky grains | Whole grains | Broken grains | Moldy grains | Under-cooked grains | Yellow grains | mAP@0.5 |
|---|---|---|---|---|---|---|---|
| Training set | 0.758 | 0.943 | 0.835 | 0.972 | 0.989 | 0.978 | 0.912 |
| Test set | 0.798 | 0.945 | 0.875 | 0.971 | 0.982 | 0.988 | 0.927 |
Disclaimer/Publisher’s Note: The statements, opinions and data contained in all publications are solely those of the individual author(s) and contributor(s) and not of MDPI and/or the editor(s). MDPI and/or the editor(s) disclaim responsibility for any injury to people or property resulting from any ideas, methods, instructions or products referred to in the content. |
© 2025 by the authors. Licensee MDPI, Basel, Switzerland. This article is an open access article distributed under the terms and conditions of the Creative Commons Attribution (CC BY) license (http://creativecommons.org/licenses/by/4.0/).
Copyright: This open access article is published under a Creative Commons CC BY 4.0 license, which permit the free download, distribution, and reuse, provided that the author and preprint are cited in any reuse.


