Submitted:
21 May 2025
Posted:
22 May 2025
You are already at the latest version
Abstract
Blueberry ripeness detection faces several persistent challenges, including large model parameter sizes, high visual similarity between fruits and background, and occlusion of target objects. To address these issues, this paper proposes a lightweight detection framework named YOLO-Blueberry. Firstly, we replace the Spatial Pyramid Pooling-Fast (SPPF) layer in YOLOv8n with a novel Grouped Large Kernel Reparameterization (GLKRep) module. This replacement significantly reduces computational complexity while enhancing contextual semantic perception, thereby improving the model’s ability to detect targets in visually complex orchard environments. Secondly, to accommodate substantial variations in fruit size and inconsistent image acquisition distances, we design a Unify module in the model’s neck network. This module aggregates multi-scale feature maps from the backbone and employs a dynamic receptive field selection mechanism to adaptively optimize multi-scale feature fusion, enhancing robustness to scale variation. Thirdly, during the training phase, we introduce VariFocal Loss in place of the original classification loss used in YOLOv8. By incorporating an IoU-aware classification score mechanism, this loss function improves the model’s discrimination between positive and negative samples, thereby reducing both false positives and false negatives. Experimental results demonstrate that YOLO-Blueberry achieves a mean Average Precision (mAP@0.5–0.95) of 97.5%, a precision of 97.8%, and a recall of 95.5%, with only 2.6 million parameters and 7.2 GFLOPs in computational cost. These results outperform several mainstream lightweight object detection models and validate the model’s suitability for deployment in real-world orchard scenarios. This study not only provides a key technical foundation for intelligent blueberry harvesting systems but also offers a viable reference approach for the automated detection of other small berry fruits in natural environments.
Keywords:
YOLO
; Deep Learning
; Blueberry Maturity Detection
; Fruit Maturity Detection
; Lightweight Target Detection Model
; Multi-scale Feature Extraction
1. Introduction
Blueberries, as a type of berry fruit with rich nutritional value and significant economic benefits, have garnered broad consumer interest and immense development potential in the global fruit market [1]. The berries are abundant in functional nutrients such as anthocyanins, vitamin C, and dietary fiber, offering health benefits including antioxidant effects, anti-aging properties, and immune enhancement [2], which make them highly popular among consumers [3]. Against the backdrop of growing health-conscious consumption, blueberry cultivation areas have been expanding, making them an essential direction for optimizing fruit industry structures and upgrading agricultural products worldwide [4].
However, blueberries face challenges such as a short ripening cycle and susceptibility to post-harvest decay under room temperature conditions, leading to significant waste after production [5]. Moreover, the small, densely clustered, and irregularly distributed berries make traditional harvesting heavily reliant on manual labor, resulting in high labor intensity, low efficiency, and elevated rates of missed or incorrect picking. These issues hinder large-scale cultivation and standardized harvesting, posing critical bottlenecks to the mechanization and intelligent development of the blueberry industry.
Therefore, addressing the above challenges and achieving precise identification and efficient harvesting of blueberry ripeness is of great significance. In recent years, with the continuous integration of artificial intelligence and agricultural informatization technologies, fruit ripeness detection methods based on image recognition have gradually become a research hotspot [6]. Among them, Convolutional Neural Networks (CNNs) have been widely applied in agriculture, achieving remarkable results in areas such as crop yield prediction, pest and disease prevention, and crop ripeness detection [7]. Lin [8] et al. developed an integrated tomato yield prediction model by combining TOMGRO and Vanthoor models while employing the EFast Fourier Amplitude Sensitivity Test (EFAST) and Bayesian optimization, achieving better adaptability in greenhouse environments.In crop pest identification, Jia [9] et al. proposed MobileNet-CA-YOLO, integrating MobileNetV3 with a Coordinate Attention (CA) mechanism, reaching an mAP@0.5 of 93.7% for rice pest and disease detection. For fruit maturity detection, Wang [10] et al.enhanced YOLOv9 with HGBlock and SPD-ADown modules, achieving 98% detection accuracy for ripe tomatoes. Chai [11] et al. innovatively combined YOLOv7 with augmented reality (AR) for strawberry ripening detection, obtaining an mAP of 0.89. Furthermore, Zhu [12]et al. introduced YOLO-LM, integrating Criss-Cross Attention (CCA) and Adaptive Spatial Feature Fusion (ASFF) for Camellia oleifera fruit maturity detection in complex orchard environments, achieving 93.18% mAP@0.5.
The above research results indicate that deep learning models can effectively identify the ripeness of fruits in the field and have achieved certain success in recognizing larger fruits such as tomatoes and apples. However, these models often underperform when handling small targets like blueberries, particularly in terms of distinguishing subtle features, especially on resource-constrained devices like edge computing systems, where meeting both detection accuracy and real-time requirements is challenging. The key to intelligent harvesting systems lies in the high-precision identification of fruit ripeness, which imposes higher demands on the robustness and real-time performance of algorithms. Although some researchers have conducted studies on blueberry ripeness detection.Yang [13] et al. proposed a detection model that integrates enhanced detail features and content-aware features to address the clustered growth characteristics of blueberries. In the feature extraction phase, the EDFM module was used to strengthen the extraction of color and texture features, while the RFB module was introduced to expand the receptive field, achieving an mAP of 80.7% on a five-class ripeness dataset at a scale of tens of thousands. To improve deployment performance on embedded devices, Xiao [14] et al. made lightweight improvements to the YOLOv5 structure, adopting the ShuffleNet module to optimize the computational network. This reduced model parameters by 40% while maintaining a 91.5% mAP@0.5, and incorporated the CBAM module during single-iteration computations to enhance small-target feature expression, ultimately achieving a detection speed of 67.1 fps. Feng [15] et al. tackled the common issue of occlusion and overlap in complex field environments by designing the MDPIoU loss function and a spatial cross-convolution module based on the YOLOv9 framework, improving accuracy by 1.5 percentage points in dense fruit scenarios. Quiroz [16]et al. introduced CNN technology for fruit-stage plant identification in Chilean blueberry orchards, developing a three-class system that achieved an average accuracy of 86% in real farm environments.
However, due to the small size of blueberries, subtle color variations, uneven ripeness distribution, and common environmental challenges such as occlusion, overlap, and complex lighting conditions, this task remains highly challenging.
Therefore, developing a blueberry ripeness detection model that is lightweight, highly accurate, and robust is not only a significant research topic in the field of intelligent agricultural perception but also a critical component in achieving automation and intelligent upgrading of the blueberry harvesting industry. Against this backdrop, this paper proposes a lightweight blueberry ripeness detection model, YOLO-Blueberry, based on the YOLOv8n network architecture. This model effectively reduces the number of parameters and computational resource demands while maintaining high detection accuracy, making it more suitable for resource-constrained real-world application scenarios. By incorporating reparameterized convolutional modules and an adaptive receptive field mechanism, YOLO-Blueberry demonstrates strong robustness and generalization capabilities in typical scenarios involving complex lighting conditions and fruit occlusion or overlap. This study provides an efficient and feasible technical pathway for automated blueberry recognition and intelligent harvesting, contributing to the advancement of smart and precise fruit cultivation management. It also offers theoretical reference and methodological insights for ripeness detection of other berry fruits.
The main contributions of this paper are summarized as follows:
- (1)
- Constructed and publicly released a blueberry image dataset containing complex noise scenarios, including real-world samples with backlighting, occlusion, and overlapping fruits.
- (2)
- Designed the GLKRep (Grouped Large Kernel Reparameterization) module, which integrates structural reparameterization with grouped large-kernel convolutions to enhance contextual awareness while reducing computational costs.
- (3)
- Proposed the Unify dual-layer detection module with an adaptive receptive field mechanism to achieve precise fusion and recognition of multi-scale targets.
- (4)
- Introduced the VariFocal Loss function to improve the model’s ability to distinguish occluded and densely distributed targets, thereby enhancing overall detection accuracy.
2. Materials
2.1. Data Sample Acquisition
This paper takes the maturity of blueberries as the research object, and the data is from a blueberry planting base in Dinghai District, Zhejiang Province. Blueberry photos were taken in a natural state using an iPhone 14 at different maturity levels. The collection dates were from 9:00 am to 5:00 pm. According to the actual situation of blueberry picking robots in blueberry orchards and the advice of experts, the maturity of blueberries was divided into three categories: immature,semi-mature and fully mature. Considering the diversity of the data set and the model’s generalization ability (as shown in Figure 1), the collected images covered a variety of conditions, including forward lighting, backlighting, distant views, close-up views, leaf occlusion, and fruit overlap. After screening and statistical analysis, a total of 2056 JPG format blueberry images were collected, with a resolution of 3024 x 4032 pixels.
2.2. Dataset Analysis and Data Augmentation
To enhance the generalization ability and stability of the model, as well as to simulate various scenarios and noise, the experiment employed data augmentation techniques to demonstrate the diversity and comprehensiveness of the dataset across different scenarios. As illustrated in Figure 2, vertical and horizontal flipping were employed to simulate shooting scenes from different angles and positions; Gaussian blur was utilized to eliminate noise and details from the images. The mosaic technique concatenates multiple images to simulate complex backgrounds in real environments and to identify occlusions between targets. In this experiment, the LabelImg software was employed to manually annotate the samples in the dataset. The maximum rectangular box was utilized to select the area of the blueberry fruit, generating a TXT file containing the annotation information upon completion. This file stores the filename of the fruit image, the coordinate information of the four corners of the annotation area, and the corresponding annotation category.
A total of 15290 blueberry fruits were annotated in the dataset, and the images were resized to 640 × 640 pixels. To ensure the appropriate allocation of data and effective model training, the annotated dataset was randomly divided into training, validation, and testing sets in a ratio of 7:1.5:1.5.
3. Methods
3.1. Overview Structure
YOLOv8 provides multiple size variants, including n (nano), s (small), m (medium), l (large), and x (extra large), catering to different application requirements [17,18]. Among these, YOLOv8n is one of the most lightweight and fastest versions, making it suitable for resource-constrained environments such as embedded devices [19,20].
Figure 3.
Structure of YOLO-Blueberry.
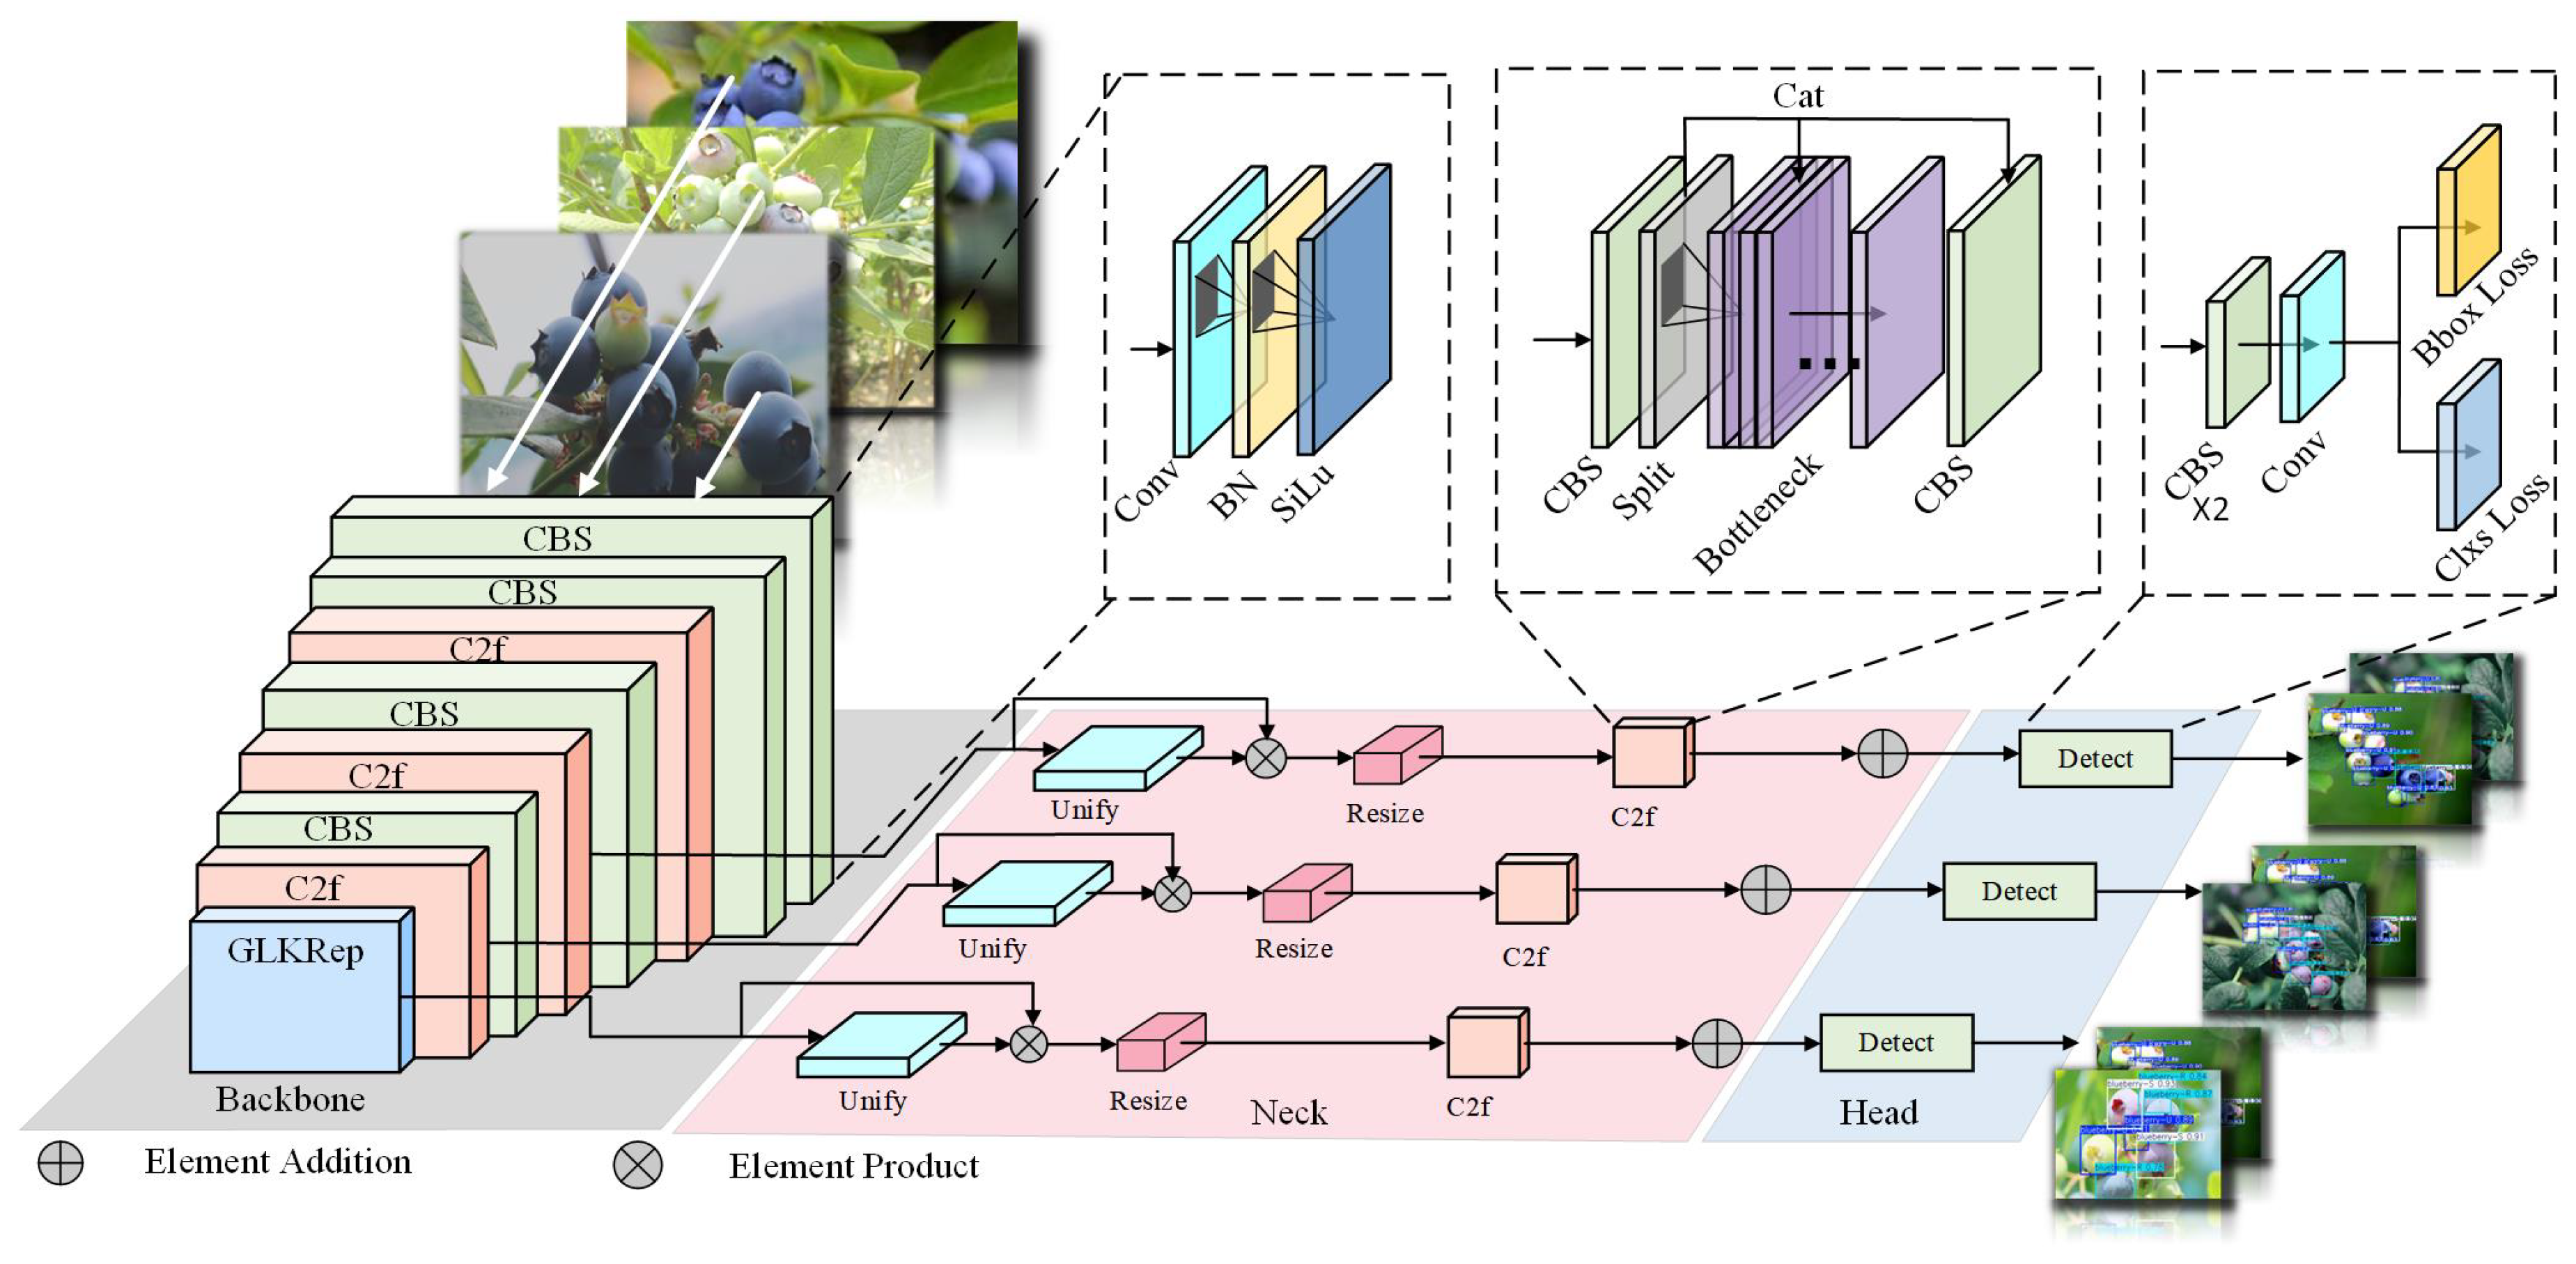
3.2. GLKRep Modules
To address the issue of excessive channel numbers at the end of the original backbone network leading to overly large model parameters and high computational resource consumption [21], this paper proposes a Channel-Shuffled Separable Group Convolution Large Kernel Re-parameterization Module, as illustrated in Figure 4.
The module achieves a balance between computational efficiency and semantic perception capabilities through the following steps: First, conventional convolution is employed to complete channel dimensionality mapping. Next, feature downsampling is implemented using depthwise separable convolution (DW 3×3) with a stride of 2. The downsampled features are then channel-split, with a portion of the features fed into the ShuffleDwRep module.
Figure 4.
Structure of GLKRep Modules.
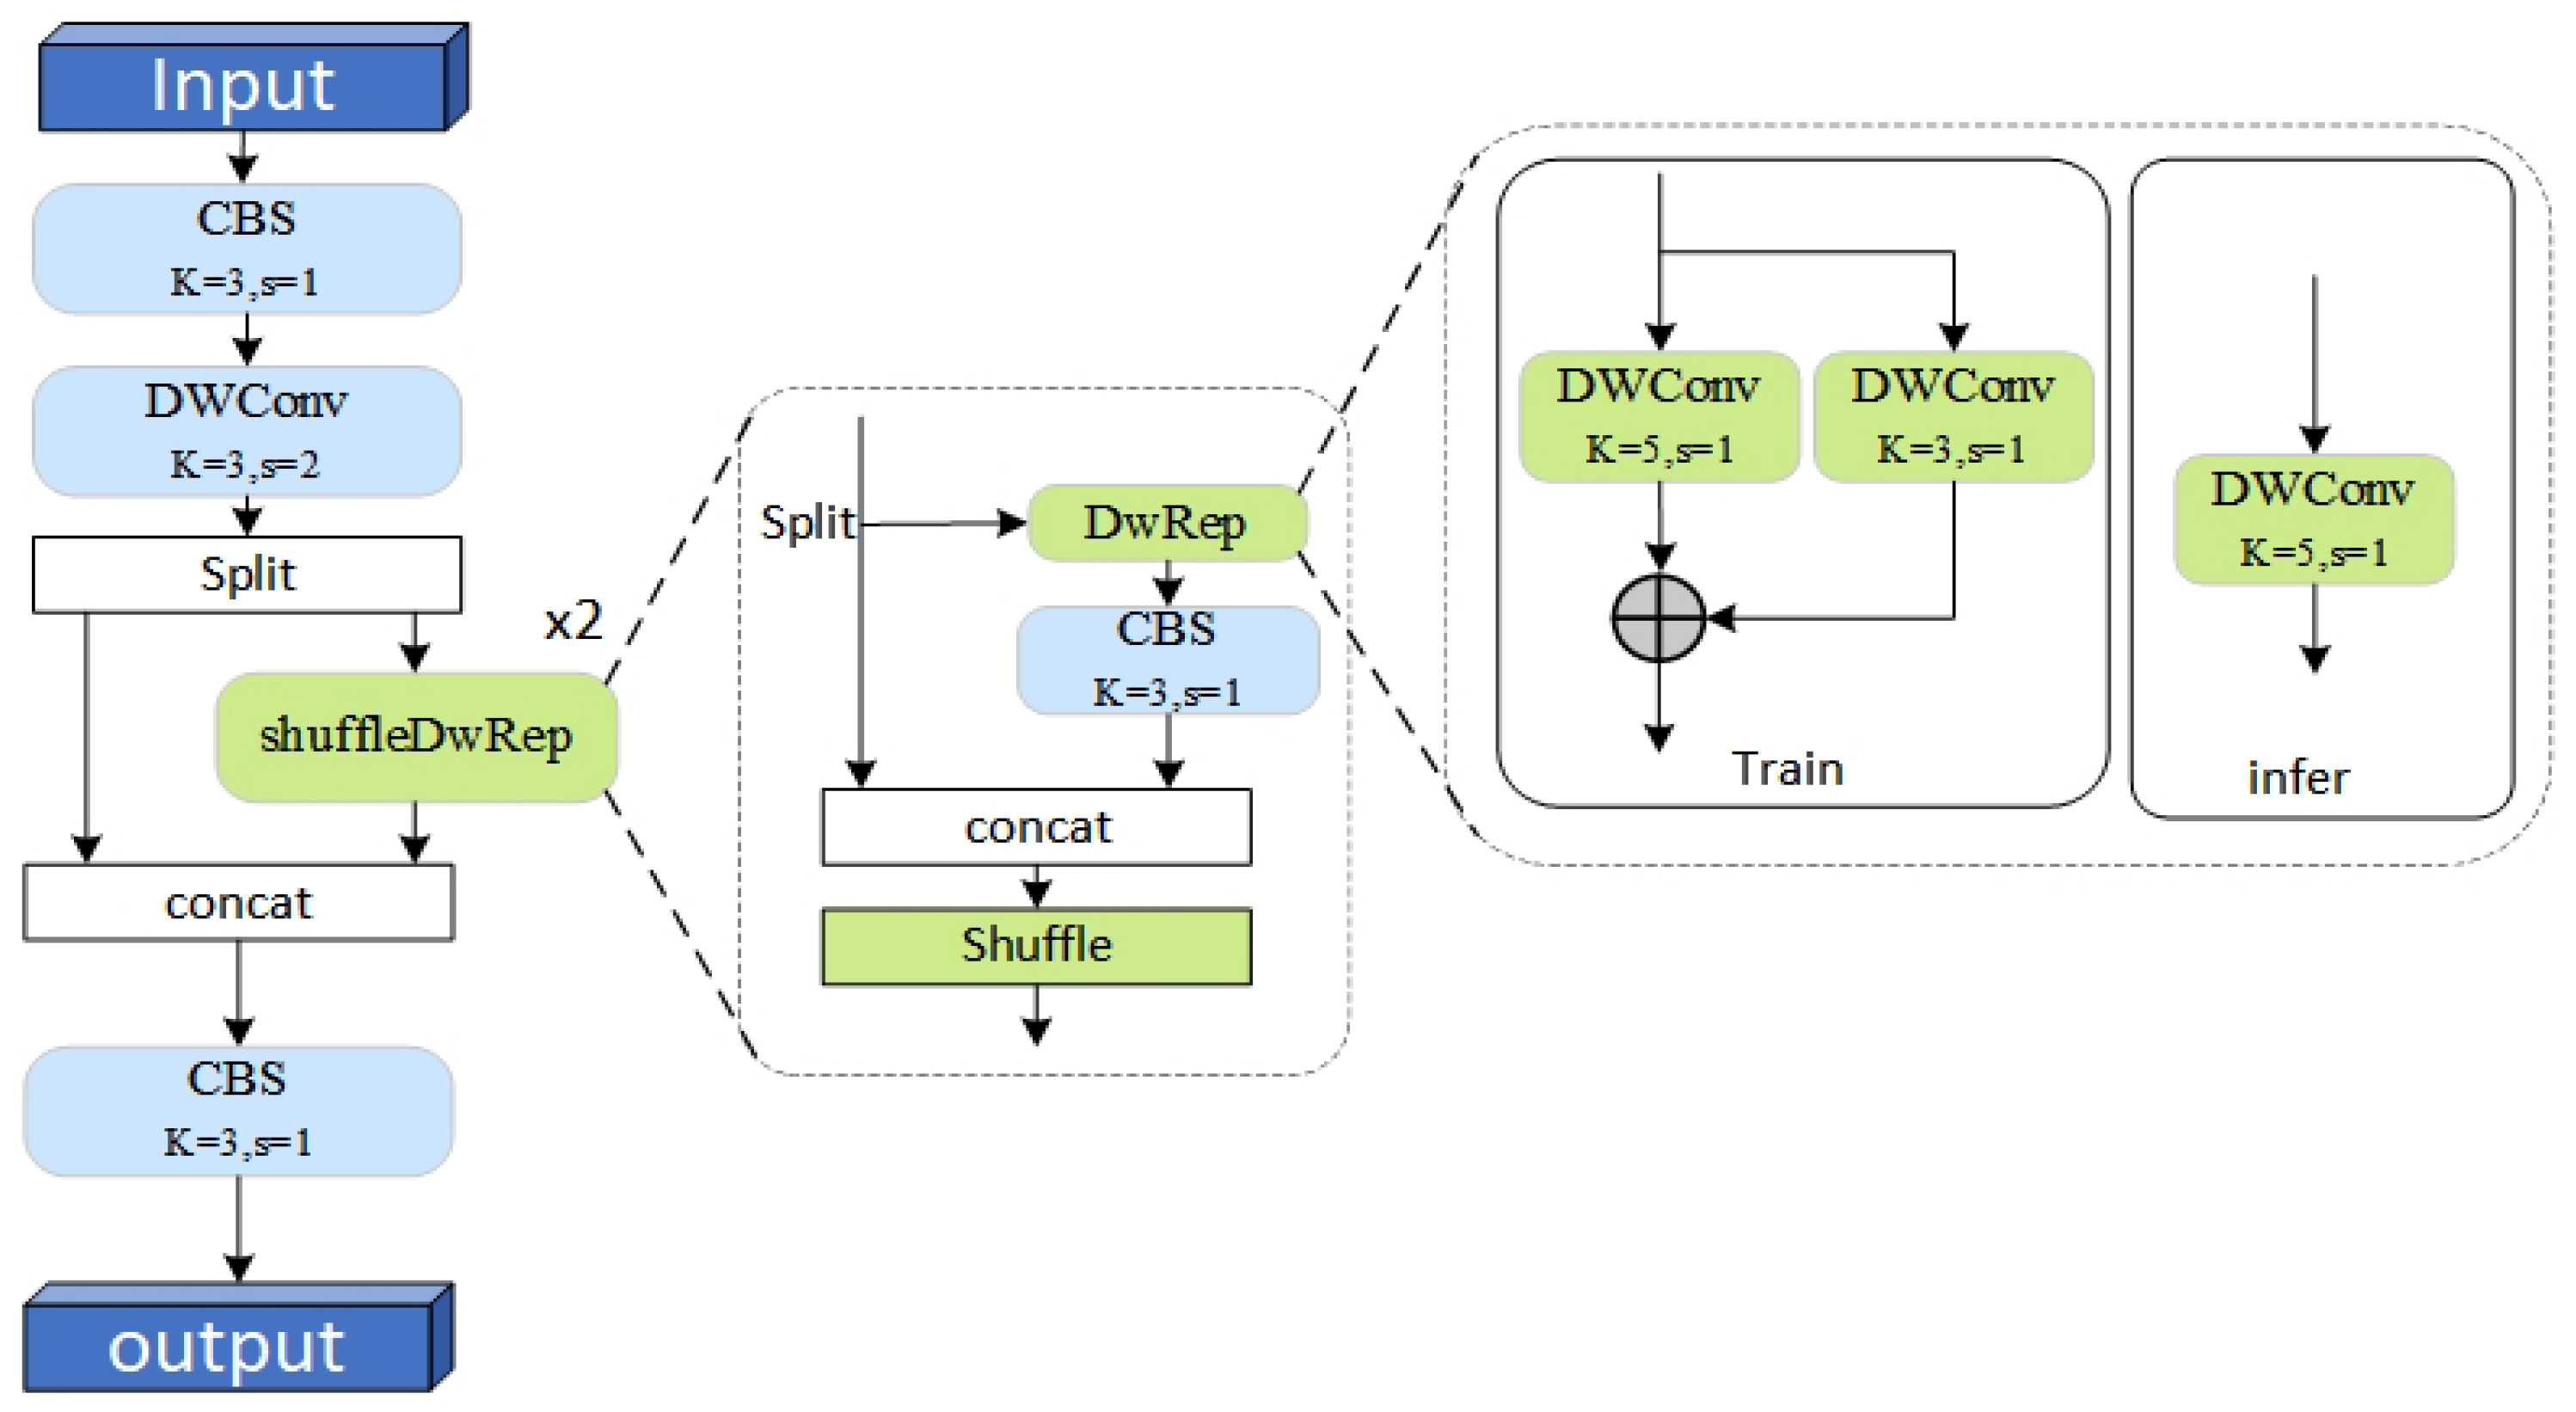
This module processes the input features through secondary splitting, dividing them into two paths: one path undergoes depthwise separable re-parameterization (DWRep) followed by 1×1 convolution for channel information fusion, while the other path retains and concatenates the input features, which then undergo channel shuffling (Shuffle) to enable cross-branch interaction. Finally, the module integrates its output features with the initially split features through concatenation, followed by 1×1 convolution for cross-channel information aggregation.By significantly reducing computational complexity while enabling multi-scale feature interaction, the module enhances global context modeling capabilities.
3.3. Unify Modules
To address the computational inefficiency and limited generalization performance caused by redundant connections in the PANet (Path Aggregation Network) structure of traditional neck networks, this study proposes a dual-layer detection module based on a receptive field adaptive mechanism [22]. As illustrated in Figure 5, the module significantly enhances the efficiency and effectiveness of network feature representation through multi-dimensional feature fusion and adaptive screening mechanisms.
The module first performs spatial scale normalization on input features from different layers, Average pooling and bilinear Upsampling to achieve spatial alignment, followed by channel dimension unification using 1×1 convolution kernels. After multi-scale feature concatenation (Concat), the module introduces the selective kernel mechanism from LSKNet (LSK). This mechanism dynamically achieves adaptive fusion of multi-scale receptive fields by stacking parallel 3×3 standard convolutions (extracting local detail features) and 5×5 dilated convolutions (d=2, capturing global contextual information).
Finally, the module adopts a feature pyramid re-parameterization strategy, forming a cascaded dual detection head structure through scale transformation (Resize). This further reduces computational overhead significantly, achieving a synergistic optimization of accuracy and efficiency.
3.4. VariFocal-Loss Function
In blueberry datasets, occlusions by leaves and fruit overlaps are two prevalent challenges. Leaf occlusion prevents the model from capturing complete fruit features, while overlapping fruits make it difficult to distinguish individual fruit boundaries—particularly in multi-object detection, where the model must accurately segment clustered fruits while correctly predicting their positions and ripeness categories.
To improve detection accuracy for mulberry fruits, we introduced the VariFocal Loss function during model training [23], as illustrated in Figure 6.
VariFocal Loss enhances detection accuracy by introducing the IoU-Aware Classification Score (IACS). Traditional methods typically learn category labels directly, whereas VariFocal Loss learns a classification score associated with the Intersection over Union (IoU). This approach enables the model to achieve a better balance between confidence and localization accuracy for the target. The loss function is mathematically defined in Equations (1).
where p represents the predicted score, q is the IoU-aware classification score, and and are hyperparameters of the loss function.
When (the target exists), VariFocal Loss applies weights based on the IoU score q to the predictions of positive samples. This approach ensures that the model focuses not only on classifying the target but also on predicting the accuracy of the IoU.
When (the target does not exist), VariFocal Loss adjusts the penalty applied to negative samples by introducing weight parameters, which reduces the impact of false positives.
VariFocal Loss significantly improves detection performance by incorporating the IoU-Aware Classification Score, enabling the model to address challenges such as leaf occlusion and fruit overlap in multi-target blueberry detection.
4. Experiments
4.1. Experimental Setup
The experimental models were trained, validated, and tested on a Windows 10 (64-bit) operating system. The computer used had 32GB of RAM, an NVIDIA GeForce RTX 2060 GPU, and an Intel(R) Core(TM) i7-10870H CPU @ 2.20GHz. The PyTorch version was 1.10.0, the programming language was Python 3.8.5, and CUDA 11.3 was used for GPU acceleration.
All experiments in this study were conducted under identical conditions. The training images were resized to 640×640 pixels, with a batch size of 16. The initial learning rate was set to 0.01, and the optimizer used for training was SGD, with a momentum value of 0.937. The training process was carried out for a total of 120 epochs.
4.2. Evaluation Indicators
This study primarily evaluates model performance using Precision (P), Recall (R), Mean Average Precision (mAP), Floating Point Operations (FLOPs), Frames Per Second (FPS), and the number of parameters (Parameters, M),which are defined as follows:
where,True Positive (TP) represents the number of actual positive samples correctly predicted as positive, while False Positive (FP) refers to the number of actual negative samples incorrectly predicted as positive.
in the formula,False Negative (FN) indicates the number of actual positive samples predicted as negative.
where,Average Precision (AP) measures the average precision for a specific class of targets at various recall points and corresponds to the area under the Precision-Recall (PR) curve. When the Intersection over Union (IoU) threshold is set to 0.5, AP is specifically denoted as AP50.
where,Real-time performance is assessed using Frames Per Second (FPS), where a higher FPS value indicates better real-time detection capability. These metrics collectively evaluate the accuracy and efficiency of the model in detecting blueberry maturity.
4.3. Performance Comparison of YOLO-Blueberry and YOLOv8n
To evaluate the performance of the proposed YOLO-Blueberry model, several representative test images were randomly selected for visual comparison.
As shown in Figure 7, The four sets of comparative images illustrate the following limitations of YOLOv8n when dealing with small, dense, and occluded blueberry targets:First, YOLOv8n exhibits a noticeable tendency for missed detections. In the first row, YOLOv8n identifies only a subset of the fruits, with the number of bounding boxes significantly lower than the actual number of blueberries—particularly for those located near the edges or partially occluded by leaves. In contrast, YOLO-Blueberry accurately localizes most of the fruits in the scene. Second, YOLOv8n suffers from low localization precision and blurred bounding box boundaries. In the second row, multiple predicted boxes from YOLOv8n overlap substantially, which hinders target differentiation and negatively impacts subsequent tasks such as fruit counting and recognition. YOLO-Blueberry, however, produces tighter and more precise bounding boxes that closely fit the fruit contours, demonstrating improved localization performance. Finally, YOLOv8n tends to produce redundant detections in densely packed scenarios. As shown in the fourth row, YOLOv8n outputs several overlapping boxes within the same region, leading to detection clustering. YOLO-Blueberry effectively mitigates this issue by incorporating a more efficient feature extraction mechanism, which enhances its ability to detect densely distributed small targets.
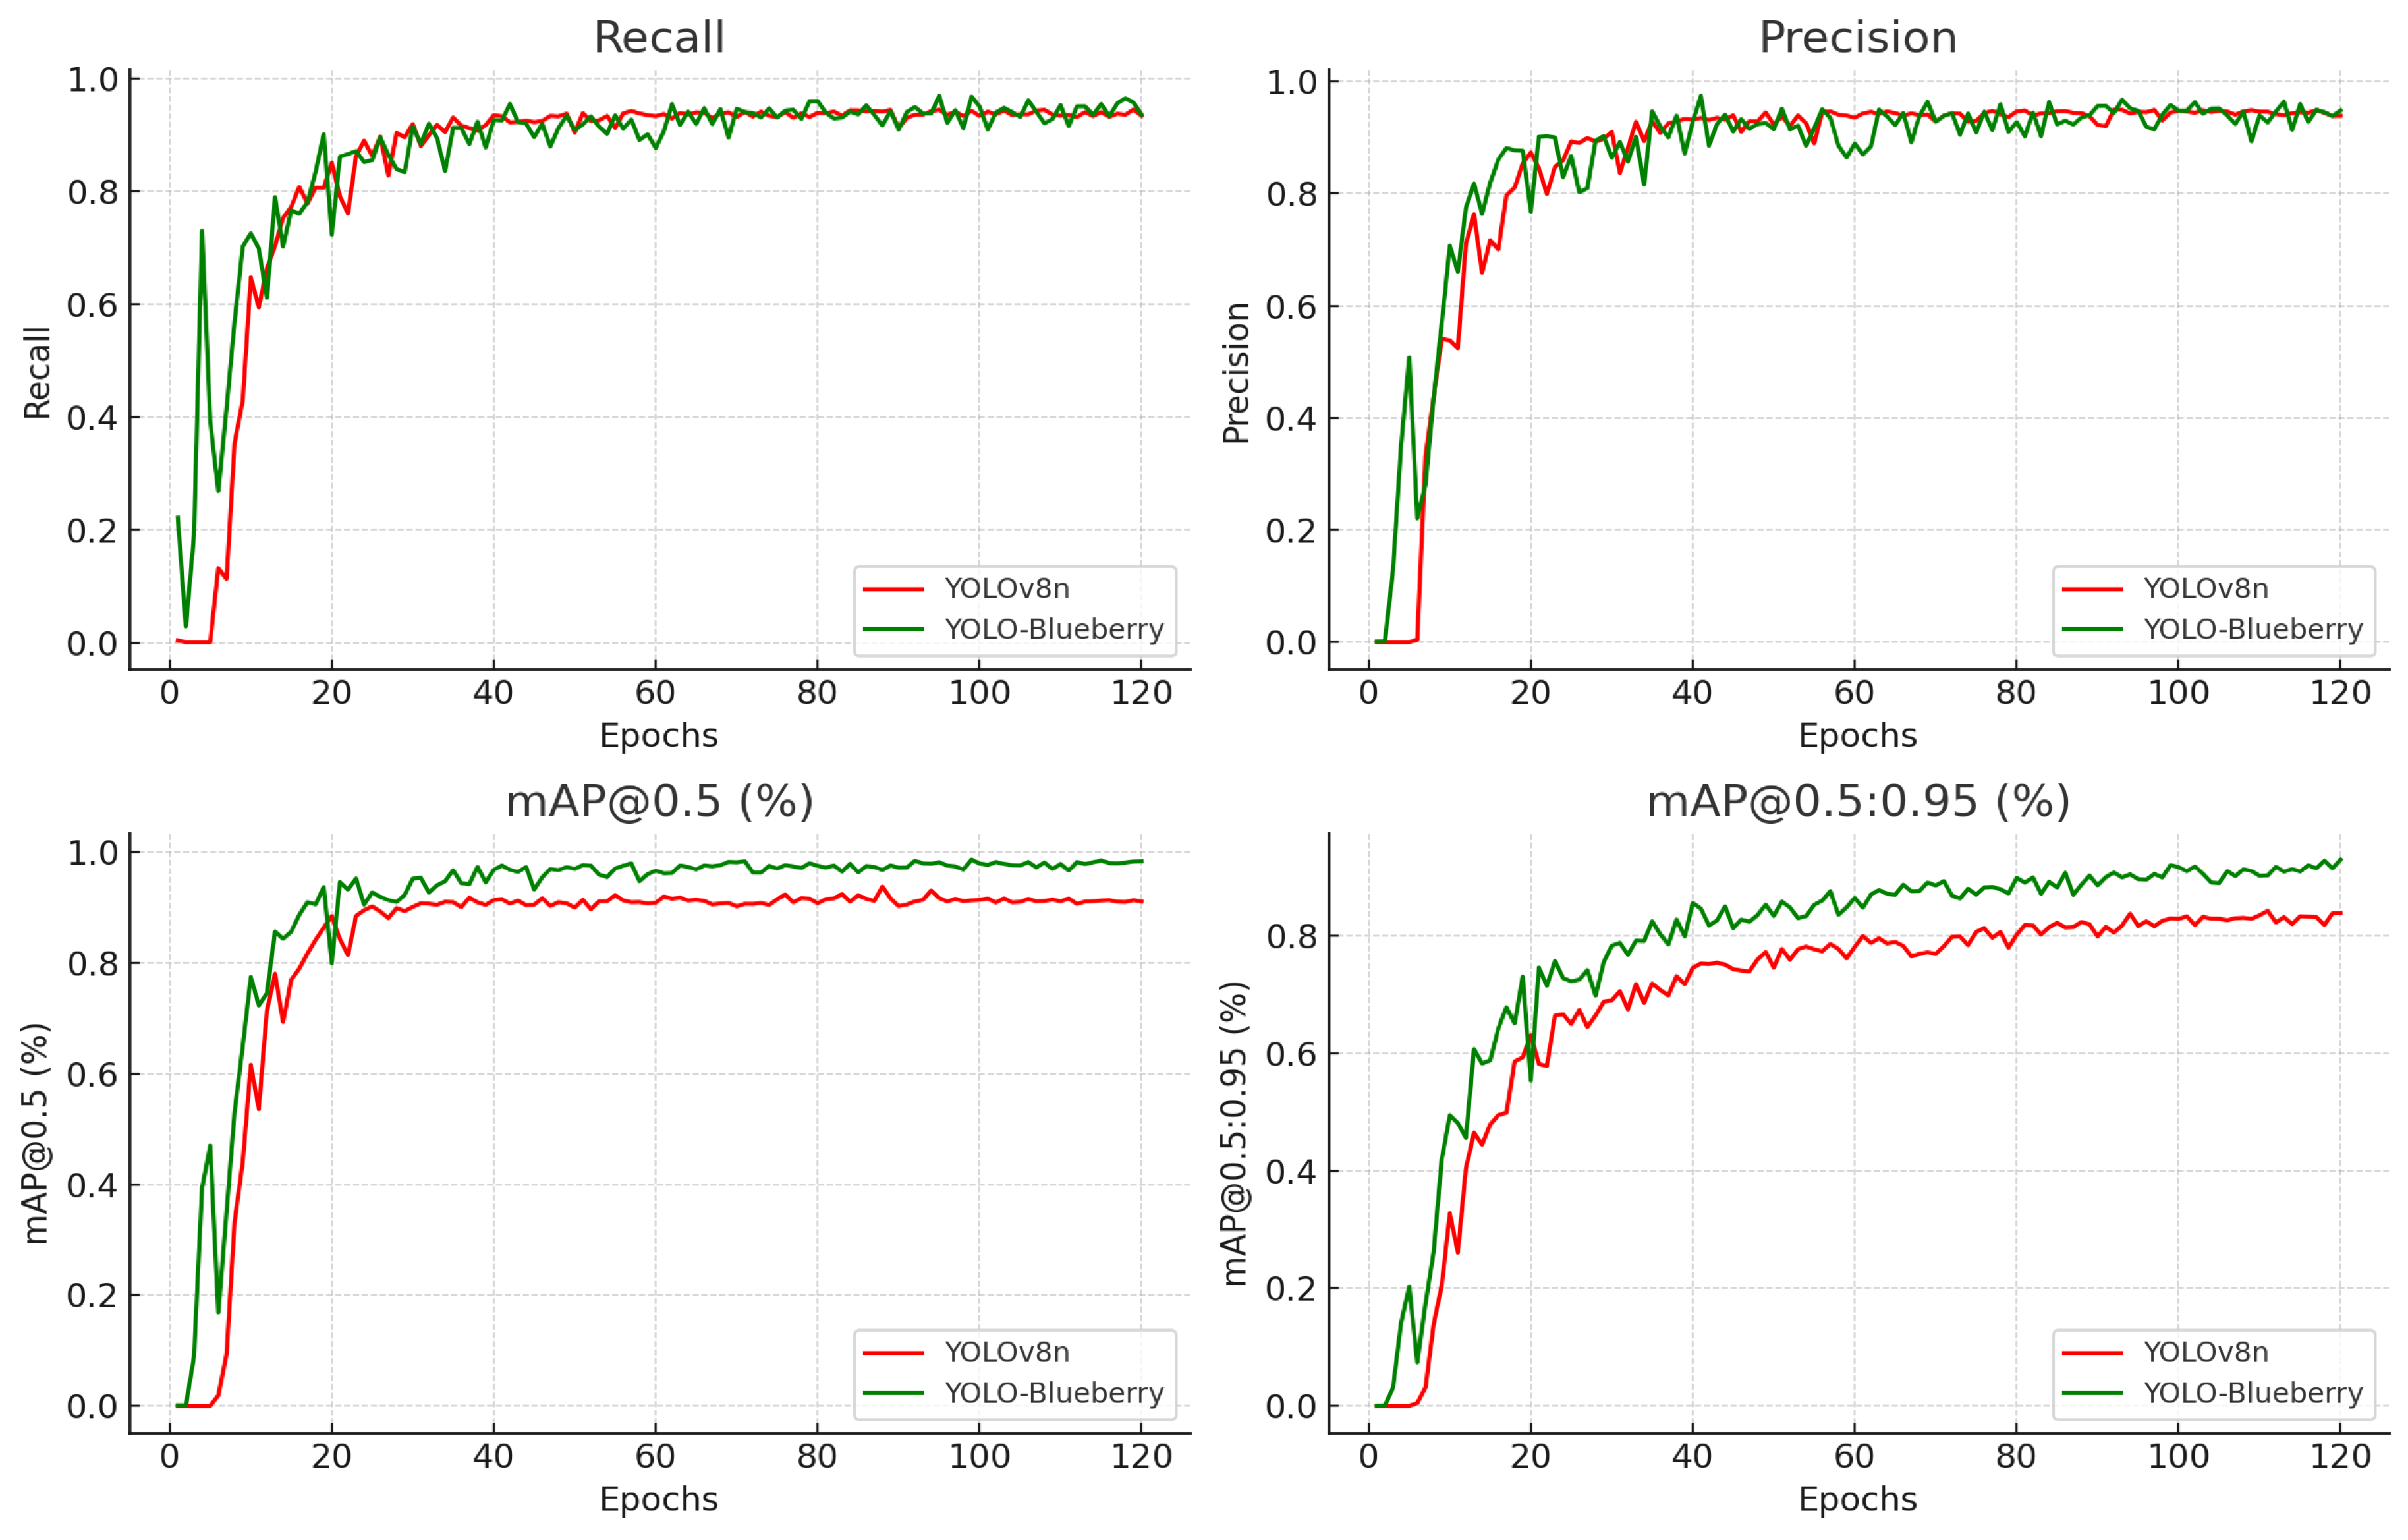
Figure 8 presents the performance curves of YOLOv8n and the improved YOLO-Blueberry model during the training process.
An analysis of four key metrics reveals that YOLO-Blueberry demonstrates superior learning capability and convergence speed from the early stages of training. In terms of recall, YOLO-Blueberry shows rapid improvement within the first 20 epochs and maintains a stable value above 0.96% throughout the remainder of the training. This indicates stronger object detection capability and a lower risk of missed detections. For precision, YOLO-Blueberry achieves a relatively stable curve with minimal fluctuations, reflecting robust training stability and better generalization. In contrast, YOLOv8n exhibits less stability in the early stages and maintains a comparatively lower precision overall. Regarding the mAP@0.5 metric, YOLO-Blueberry sustains a high level of accuracy above 0.95 in the later stages of training, significantly outperforming YOLOv8n, which plateaus around 0.90. More notably, under the more stringent and comprehensive mAP@0.5:0.95 metric, YOLO-Blueberry surpasses YOLOv8n by nearly 8 percentage points, underscoring its clear advantage in localization accuracy and model generalization. Overall, YOLO-Blueberry consistently outperforms YOLOv8n across all key performance metrics—recall, precision, mAP@0.5, and mAP@0.5:0.95.
Furthermore, its performance advantage becomes increasingly evident as training progresses, validating the effectiveness and superiority of the proposed model in blueberry detection tasks.
Figure 8.
Comparison of the training curves of YOLOv8n and YOLO-Blueberry.
4.4. Comparison Experiments
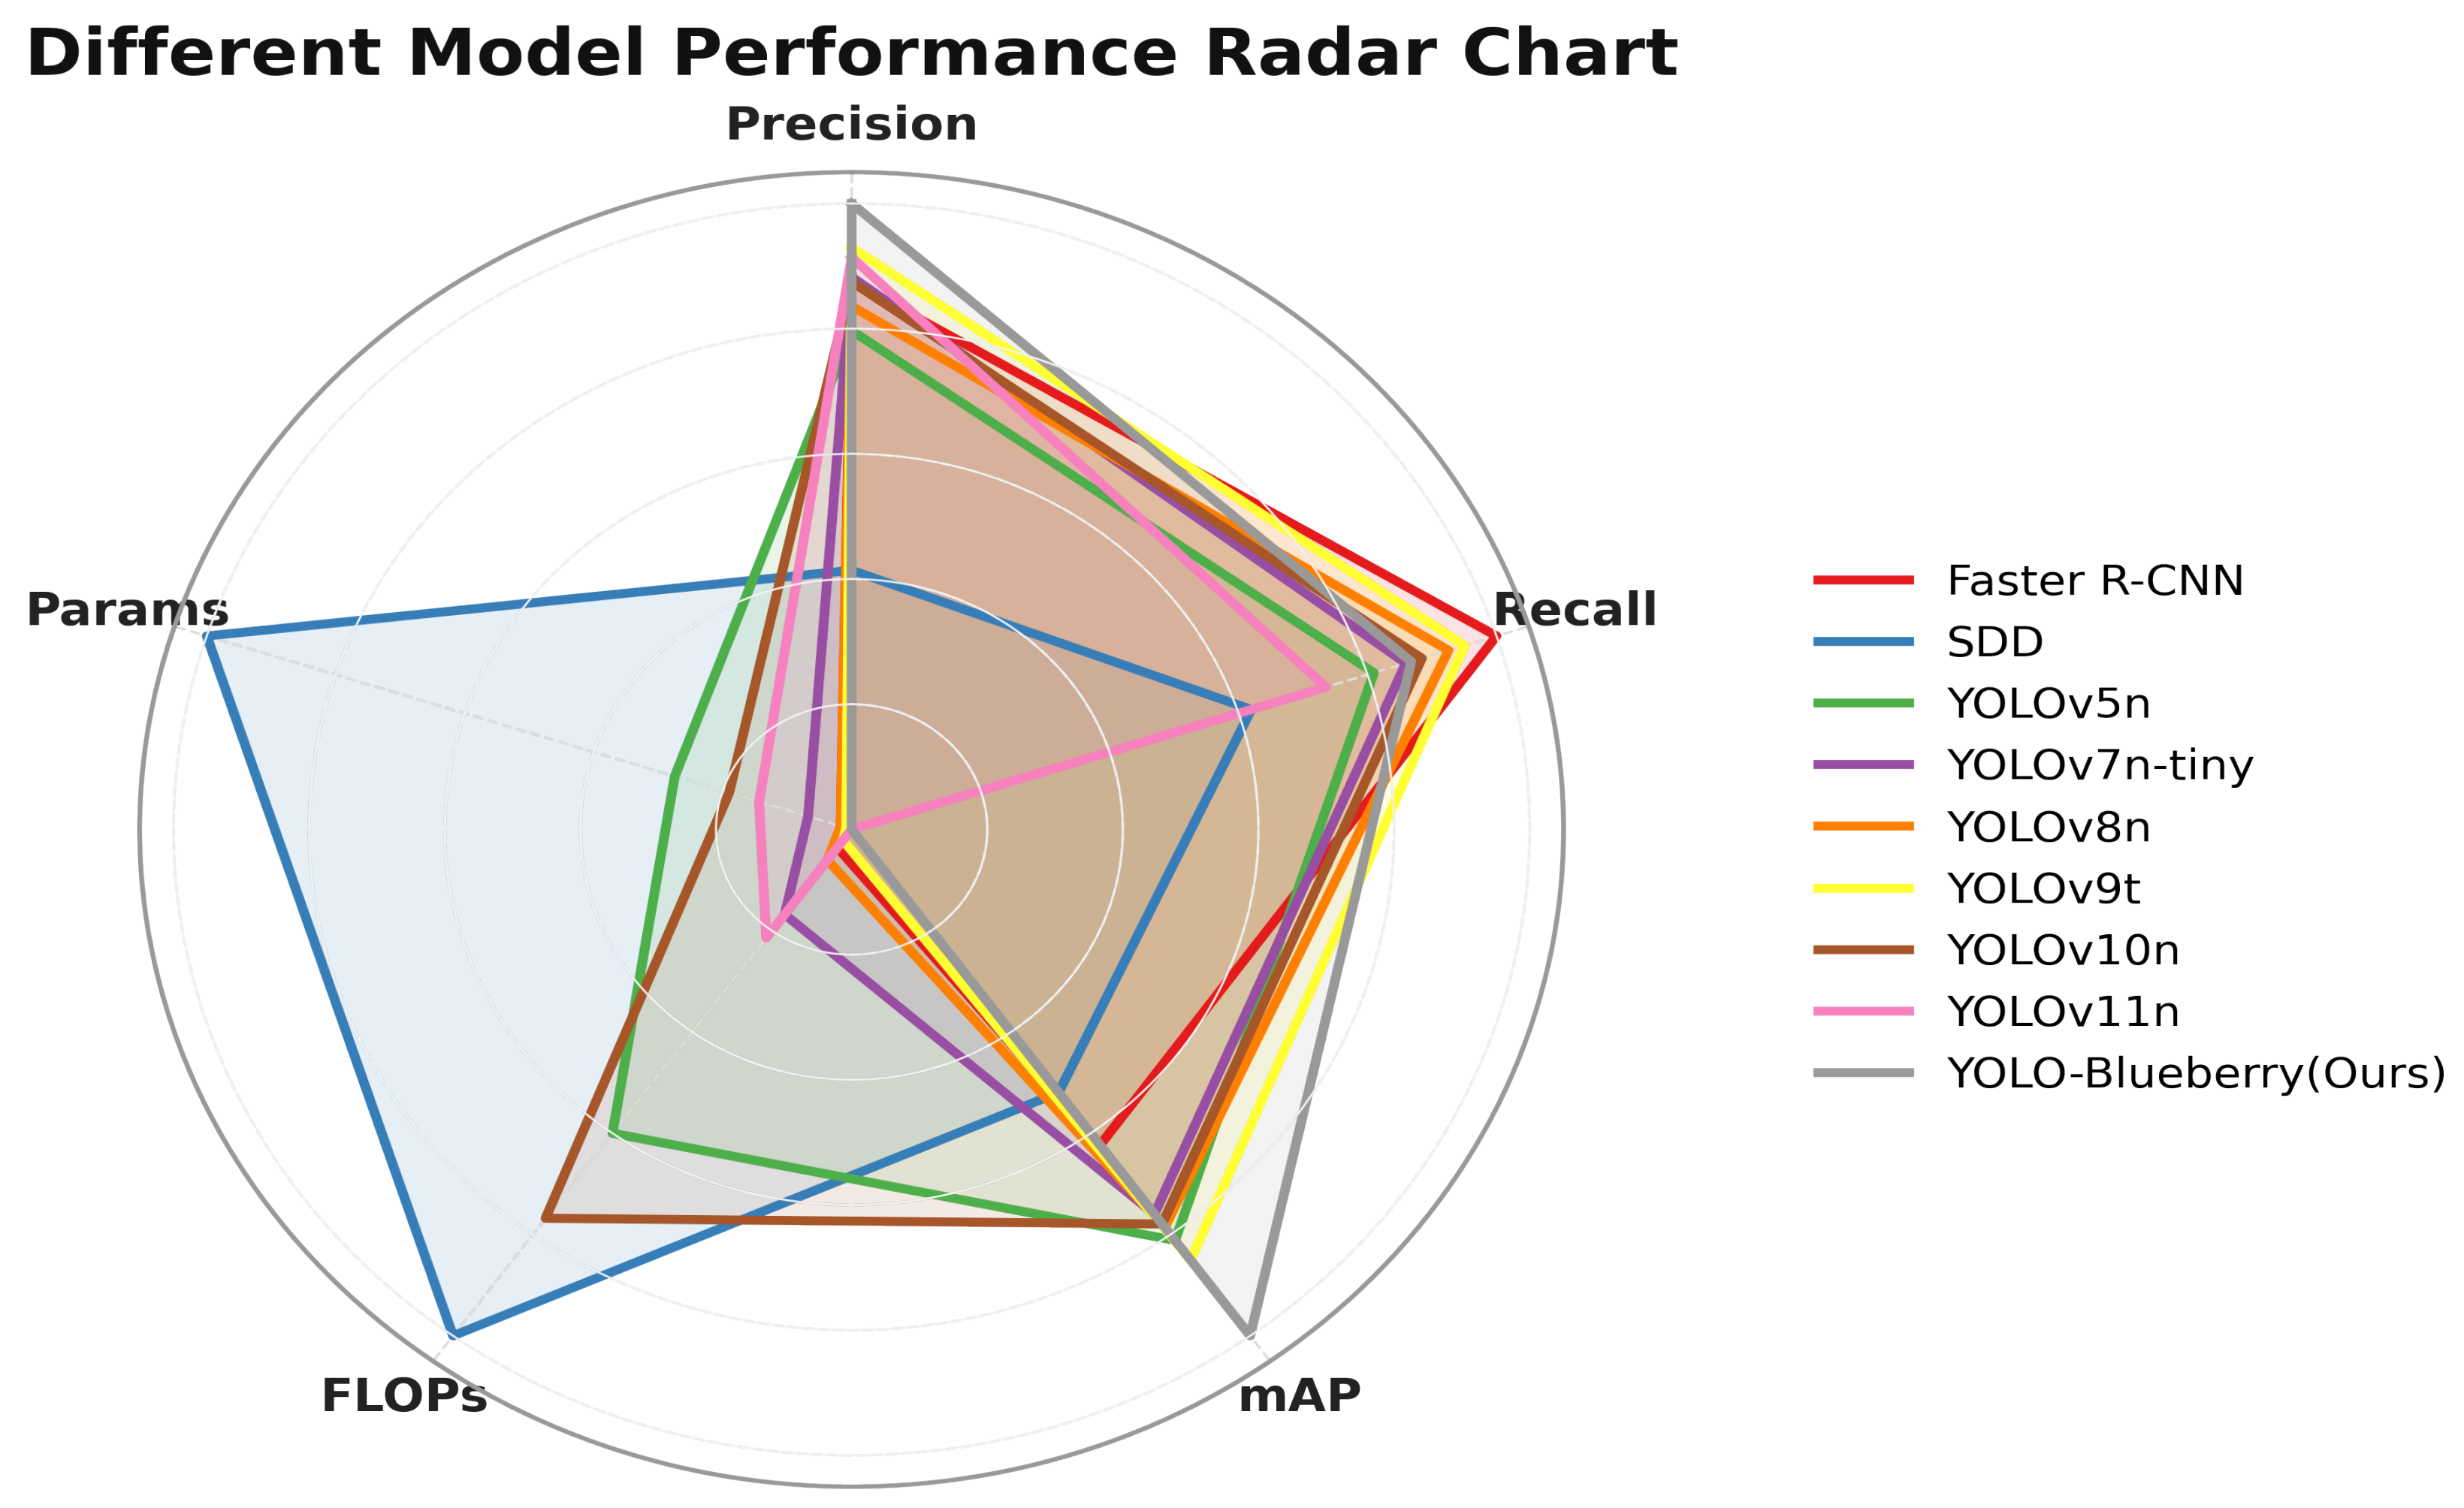
To evaluate the detection performance of the proposed YOLO-Blueberry algorithm, a comprehensive comparison was conducted against several mainstream object detection models, including Faster R-CNN [24], SSD [25], YOLOv5n [26], YOLOv7n-tiny [27], YOLOv8n [28], YOLOv9t [29], YOLOv10n [30], YOLOv11n [31], and YOLO-Blueberry [32]. All models were trained under identical environments and hyperparameter settings to ensure a fair evaluation. The performance comparison results are presented in Table 1.
As shown in Table 1, YOLO-Blueberry achieves the most outstanding performance, with a precision of 97.8%, a recall of 95.5%, and a mAP of 97.5%. Furthermore, it maintains a lightweight structure with only 2.6M parameters and a computational cost of 7.2 GFLOPs, making it highly suitable for deployment in resource-constrained environments. These results are largely attributed to the integration of the improved GLKRep module at the end of the backbone, which enhances contextual awareness while significantly reducing the number of parameters. Additionally, the Unify module is capable of aggregating multi-level feature maps and adaptively optimizing multi-scale feature fusion through a dynamic receptive field selection mechanism, thereby improving the model’s ability to detect blueberry targets of varying sizes. In comparison, Faster R-CNN achieves a mAP of 91.7%, precision of 96.2%, and recall of 97.1%. Although its recall is slightly higher, it comes at the cost of increased model complexity 3.0M parameters and computational load 8.2 GFLOPs, as typical of two-stage detection frameworks. SSD attains the highest recall among single-stage models but suffers from excessive complexity, resulting in low inference efficiency and poor suitability for lightweight applications. YOLOv10n and YOLOv11n generate overly large weight files, limiting their compatibility with embedded platforms. Although YOLOv5n, YOLOv7n-tiny, YOLOv8n, and YOLOv9t each offer different trade-offs in accuracy and efficiency, none achieves the optimal balance demonstrated by YOLO-Blueberry.
The proposed model proves especially effective in dense, small-object scenarios such as real-time blueberry ripeness detection in complex orchard environments.

Table 1.
Comparison of models performance.
| Models | Precision P/% | Recall R/% | mAP@0.5-0.95/% | FLOPs/GB | Parameters/M |
|---|---|---|---|---|---|
| Faster R-CNN | 96.2 | 97.1 | 91.7 | 8.2 | 3.0 |
| SDD | 90.3 | 92.5 | 90.1 | 35.2 | 26.3 |
| YOLOv5n | 95.2 | 94.8 | 94.6 | 24.0 | 9.1 |
| YOLOv7n-tiny | 96.3 | 95.4 | 93.8 | 11.9 | 4.2 |
| YOLOv8n | 95.7 | 96.2 | 94.2 | 8.9 | 3.0 |
| YOLOv9t | 96.9 | 96.5 | 95.2 | 7.8 | 2.8 |
| YOLOv10n | 96.2 | 95.7 | 94.9 | 28.7 | 11.1 |
| YOLOv11 | 96.7 | 93.9 | 82.1 | 13.2 | 6.0 |
| YOLO-Blueberry(Ours) | 97.8 | 95.5 | 97.5 | 7.2 | 2.6 |
To provide an intuitive comparison of model performance, representative test images were selected as shown in Figure 9.
In the first row of images, the blueberry fruits are densely packed with noticeable differences in ripeness, where light green and light purple fruits are interspersed among dark, mature fruits, creating some identification interference. In this scenario, Faster R-CNN can generally detect most dark fruits but fails to effectively identify lighter-colored or partially occluded fruits, with some bounding boxes erroneously offset to leaf areas, resulting in significant errors. YOLOv5n detects more targets, but the confidence scores are unevenly distributed, with severe overlapping of some bounding boxes and instances of false detections and redundant boxes. YOLOv7-tiny shows improvement in detecting edge fruits but still misses some lighter-colored fruits. YOLOv10 and YOLOv11 produce more compact bounding box distributions and clearer boundary delineations among overlapping fruits, with YOLOv11 achieving relatively accurate localization of some partially mature fruits. YOLO-Blueberry performs the best in this scenario, not only identifying all mature fruits but also accurately detecting two light green, unripe fruits, demonstrating that the model has learned the appearance features of fruits at different growth stages during training.
In the second row of images, the blueberry fruits are more sparsely distributed, but the background features significant leaf occlusion, posing a challenge to the models’ anti-interference capabilities. Faster R-CNN only detects some foreground fruits, failing to penetrate leaf occlusion to identify targets in the background. YOLOv5n and YOLOv7-tiny show an increase in the number of detections but still miss several mature fruits. YOLOv10 and YOLOv11 effectively avoid misjudgments caused by leaf veins or reflections through accurate extraction of fruit edge contours, achieving significantly better detection performance than the previous models. YOLO-Blueberry once again demonstrates precise recognition of small-scale and leaf-occluded fruits, even accurately boxing a fruit with only a partially exposed peel, showcasing significantly enhanced robustness and target perception capabilities.
The third row of images depicts blueberry fruits in a greenhouse environment with complex background structures and some degree of uneven lighting. Faster R-CNN’s detection performance further declines, failing to mark most edge targets except for clearly visible foreground fruits. YOLOv5n and YOLOv7-tiny show slightly improved adaptability to the environment, but misdetections persist in areas with light spots or highly reflective leaves. YOLOv10 produces bounding boxes that better align with fruit contours, reducing the false detection rate, while YOLOv11 maintains boundary independence among multiple overlapping fruits. YOLO-Blueberry again exhibits strong recognition capabilities in occluded and unevenly lit areas, particularly in the heavily occluded lower-left region of the image, where it successfully detects targets completely missed by other models, maintaining high confidence scores.
In the fourth row of images, the blueberries exhibit significant ripeness variations, ranging from light green, pink, purple, to dark blue fruits. Faster R-CNN and YOLOv5n almost entirely fail to identify non-dark fruits, resulting in low bounding box density and insufficient accuracy. YOLOv7-tiny responds to purple fruits to some extent but suffers from fragmented recognition and redundant boxes. YOLOv10 and YOLOv11 stably detect fruits of medium to high ripeness with balanced confidence score distributions. YOLO-Blueberry comprehensively covers fruits of all color stages, achieving the highest detection count with almost no false positives, indicating that its training dataset likely includes blueberry samples under different spectra, endowing the model with superior spectral robustness and ripeness perception capabilities.
Figure 9.
Detection effect of different models
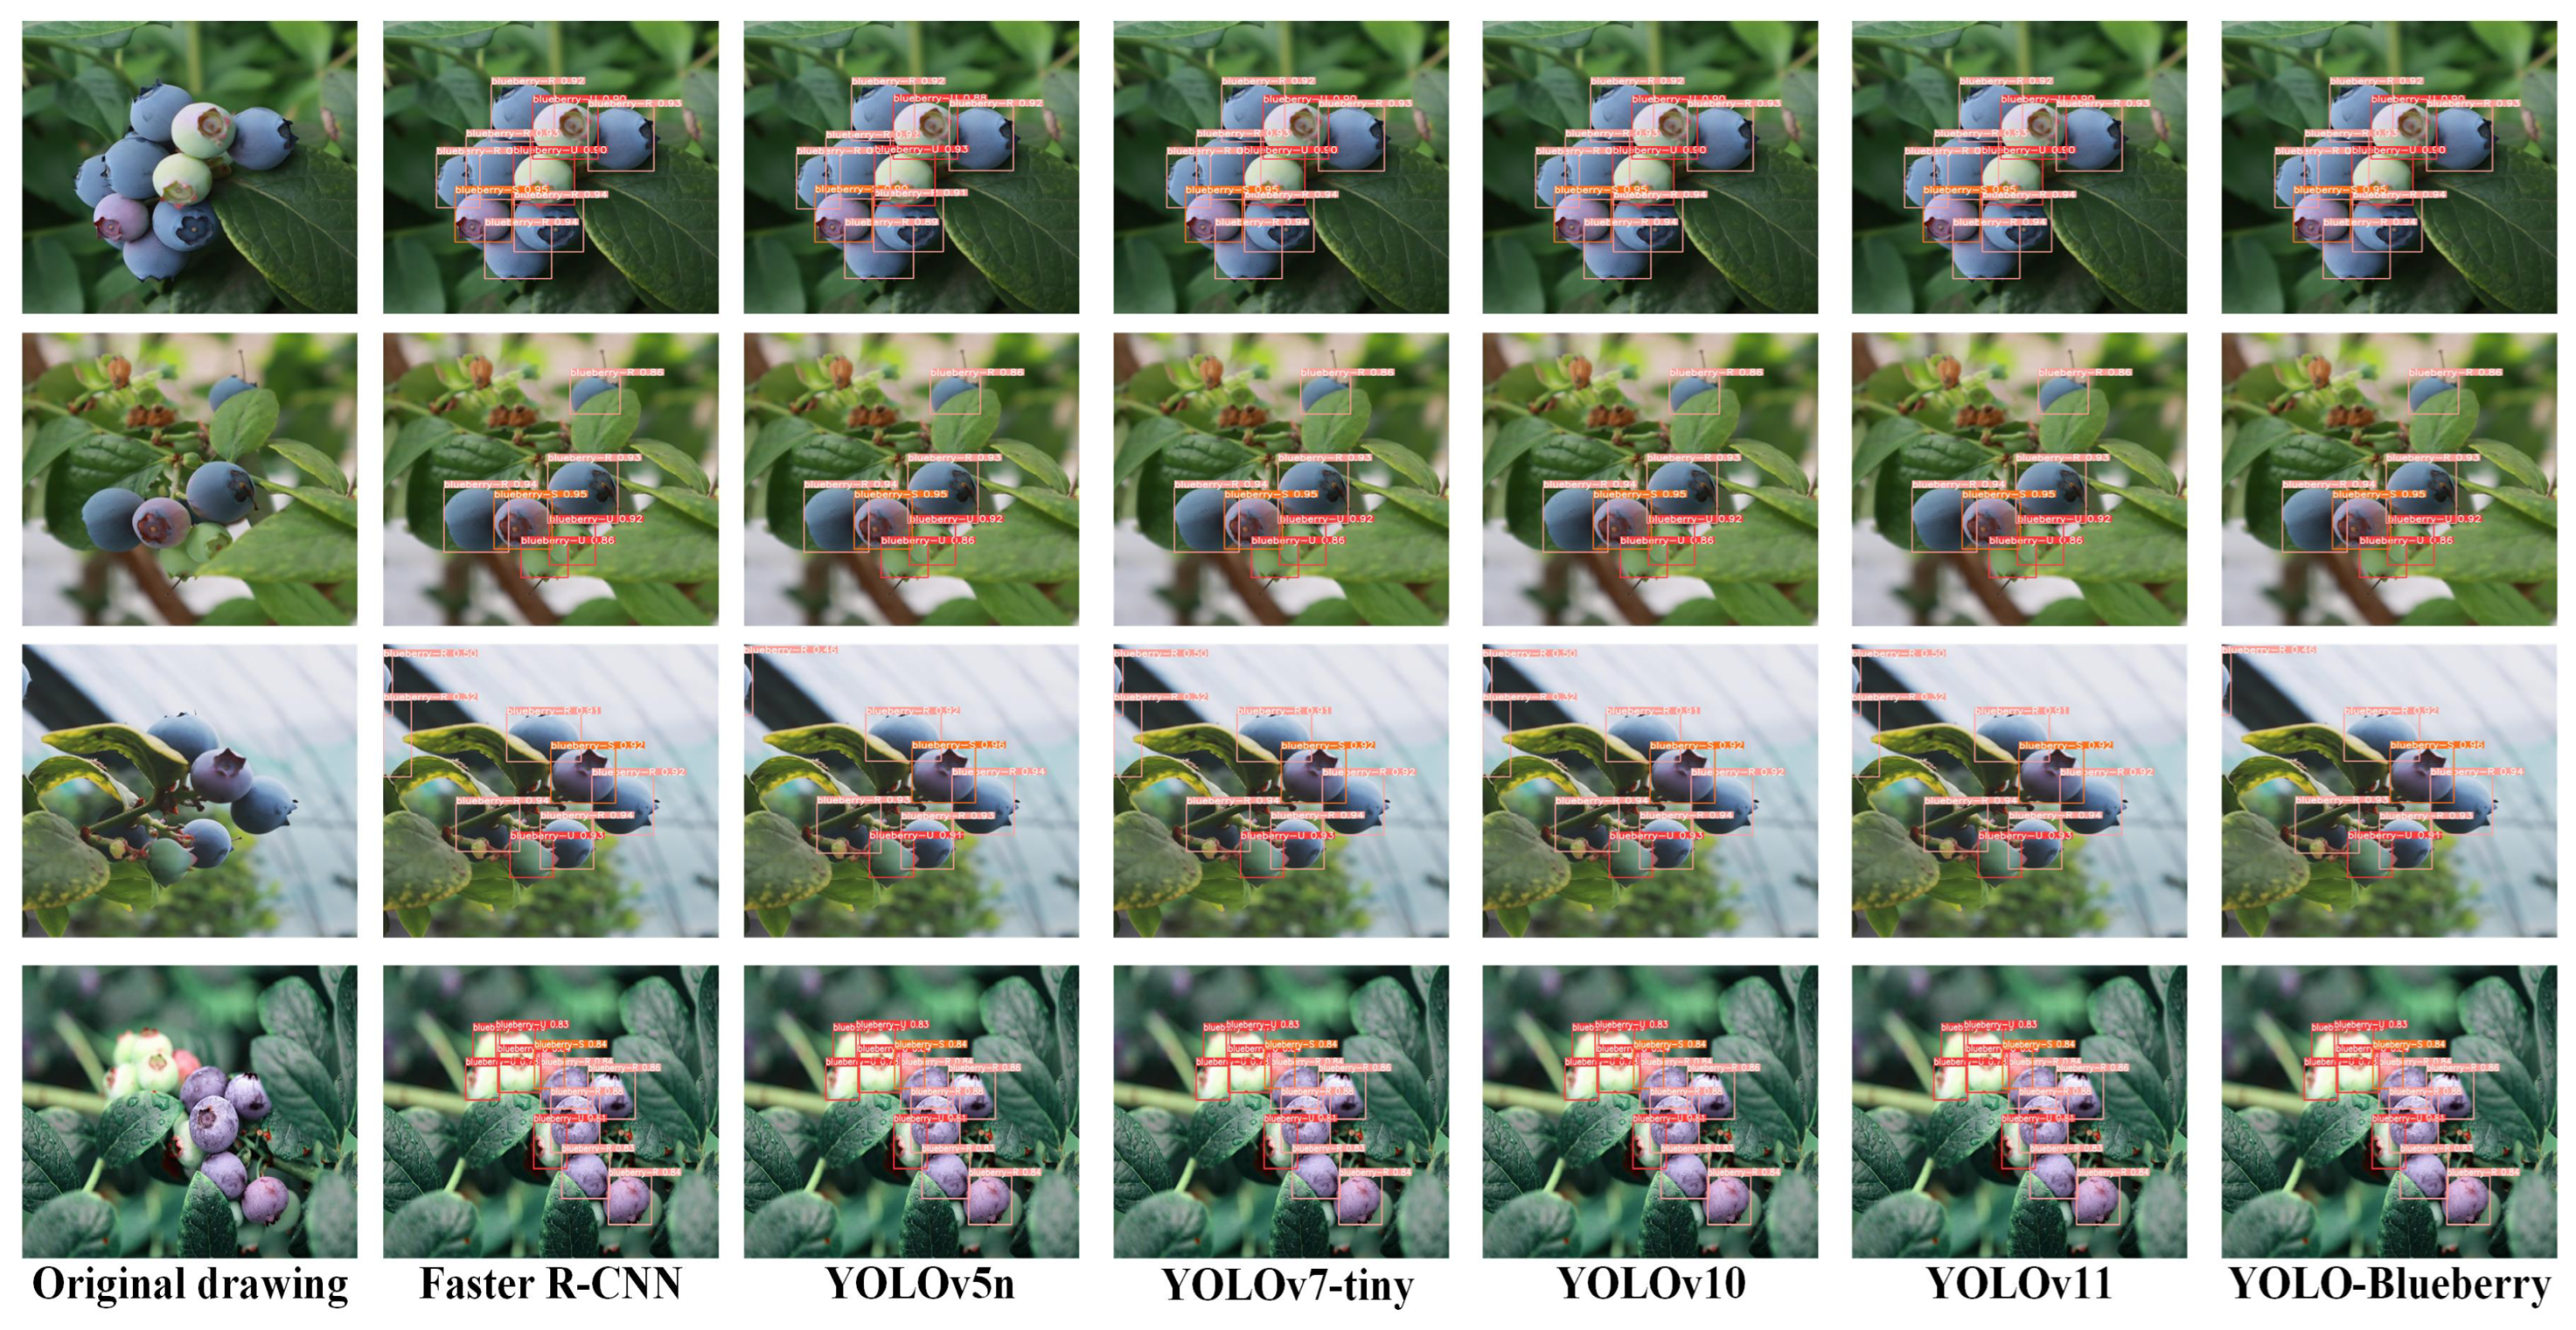
Figure 10 presents a radar chart comparing the performance metrics of YOLO-Blueberry with those of other benchmark models. The figure provides a clear visual illustration of YOLO-Blueberry’s strengths, particularly in terms of its lightweight design. It achieves the highest scores in both parameter count (Params) and computational complexity (FLOPs), indicating its excellent suitability for deployment on resource-constrained devices.
Considering multiple aspects—including the number of detected objects, confidence score distribution, boundary localization accuracy, occlusion handling, and maturity stage diversity—YOLO-Blueberry consistently outperforms competing models. These results highlight its strong potential for real-world applications, especially in scenarios requiring high efficiency and robustness in complex agricultural environments.
Figure 10.
Different Model Performance Radar Chart
4.5. VariFocal Loss Parameter Analysis
In the experiments, mean average precision (mAP) was used as the evaluation metric to assess the impact of different parameter settings on model performance. The weight parameters and of the VariFocal Loss function were optimized and fine-tuned during the experiments. The experimental results demonstrated that when was set to 0.75 and the parameter to 2.0, the mean average precision reached its highest value, 98.7%. This indicates that, under this parameter combination, the model performs optimally in detecting high-quality positive samples and occluded objects, significantly improving detection accuracy.
Table 2.
Results of comparative and .
| 0.5 | 1.0 | 2.0 | 2.5 | 5.0 | 7.5 | 10.0 | |
|---|---|---|---|---|---|---|---|
| 0.1 | 95.7 | 96.3 | 97.6 | 96.5 | 97.3 | 96.6 | 94.7 |
| 0.2 | 96.7 | 96.9 | 98.0 | 97.0 | 97.5 | 96.4 | 93.9 |
| 0.5 | 97.1 | 97.4 | 98.4 | 97.7 | 97.7 | 97.0 | 95.2 |
| 0.7 | 97.3 | 98.5 | 98.7 | 98.1 | 98.0 | 97.3 | 96.5 |
| 1.0 | 97.8 | 96.3 | 98.5 | 98.0 | 98.2 | 97.5 | 96.8 |
4.6. Ablation Experiments
To evaluate the effectiveness of each proposed improvement, we conducted four ablation experiments under identical datasets and training settings. The experiments were carried out in a stepwise manner: first, the original SPPF layer in the backbone network was replaced with the custom-designed GLKRep module; second, the PANet structure in the neck network was substituted with the Unify module; and finally, the original classification loss was replaced with the VariFocal Loss function. The detailed results are presented in Table 3.
The baseline model, without any modifications, achieved an mAP@0.5–0.95 of 91.7%, with 8.2 GFLOPs and 3.0M parameters. After introducing the GLKRep module, the mAP increased to 94.1%, while both FLOPs and parameter count decreased by approximately 0.2 units, indicating that the module enhances local feature extraction and receptive field representation without sacrificing computational efficiency.
Building upon this, replacing the PANet in the neck with the Unify module led to a further increase in mAP to 96.8%, and a reduction in model size to 2.7M parameters. This improvement is attributed to the Unify module’s ability to receive multi-level feature maps and adaptively optimize multi-scale feature fusion through a dynamic receptive field selection mechanism. These results further validate the module’s effectiveness in enhancing detection performance for blueberry targets of varying sizes.
Finally, after integrating both structural improvements, we replaced the original loss function with the VariFocal Loss. This led to a final mAP of 97.5%, with 7.2 GFLOPs and 2.6M parameters. The VariFocal Loss improves the model’s discriminative power by weighting positive and negative samples based on IoU-aware scores, thereby enhancing detection accuracy under occlusion and reducing false negatives and false positives. The results demonstrate a well-balanced improvement in both detection accuracy and model efficiency.
Table 3.
Results of Ablation Experiments.
| Baseline | +GLKRep | +Unify | +VariFocal | mAP@0.5-0.95/% | FLOPs/GB | Parameters/M |
|---|---|---|---|---|---|---|
| ✔ | × | × | × | 91.7 | 8.2 | 3.0 |
| ✔ | ✔ | × | × | 94.1 | 7.9 | 2.8 |
| ✔ | ✔ | ✔ | × | 96.8 | 7.5 | 2.7 |
| ✔ | ✔ | ✔ | ✔ | 97.5 | 7.2 | 2.6 |
Figure 11 presents feature map visualizations to compare the performance of the GLKRep and Unify modules during the feature extraction process. Subfigure (a) shows the original input image containing multiple blueberry fruits in a complex background.In subfigure (b), the feature maps extracted after incorporating the GLKRep module exhibit strong responses to object edges and local textures, effectively highlighting the structural information of blueberry fruits. This enhancement contributes to more precise localization by emphasizing fine-grained details.Subfigure (c) shows the feature maps after introducing the Unify module. The results demonstrate improved semantic consistency and spatial continuity, with feature activations more concentrated in the blueberry regions and significantly reduced background interference. This indicates superior global feature fusion capability. Overall, the GLKRep module enhances the extraction of fine details, while the Unify module strengthens multi-scale semantic fusion. The combination of both modules substantially improves the model’s robustness and accuracy in complex detection scenarios.
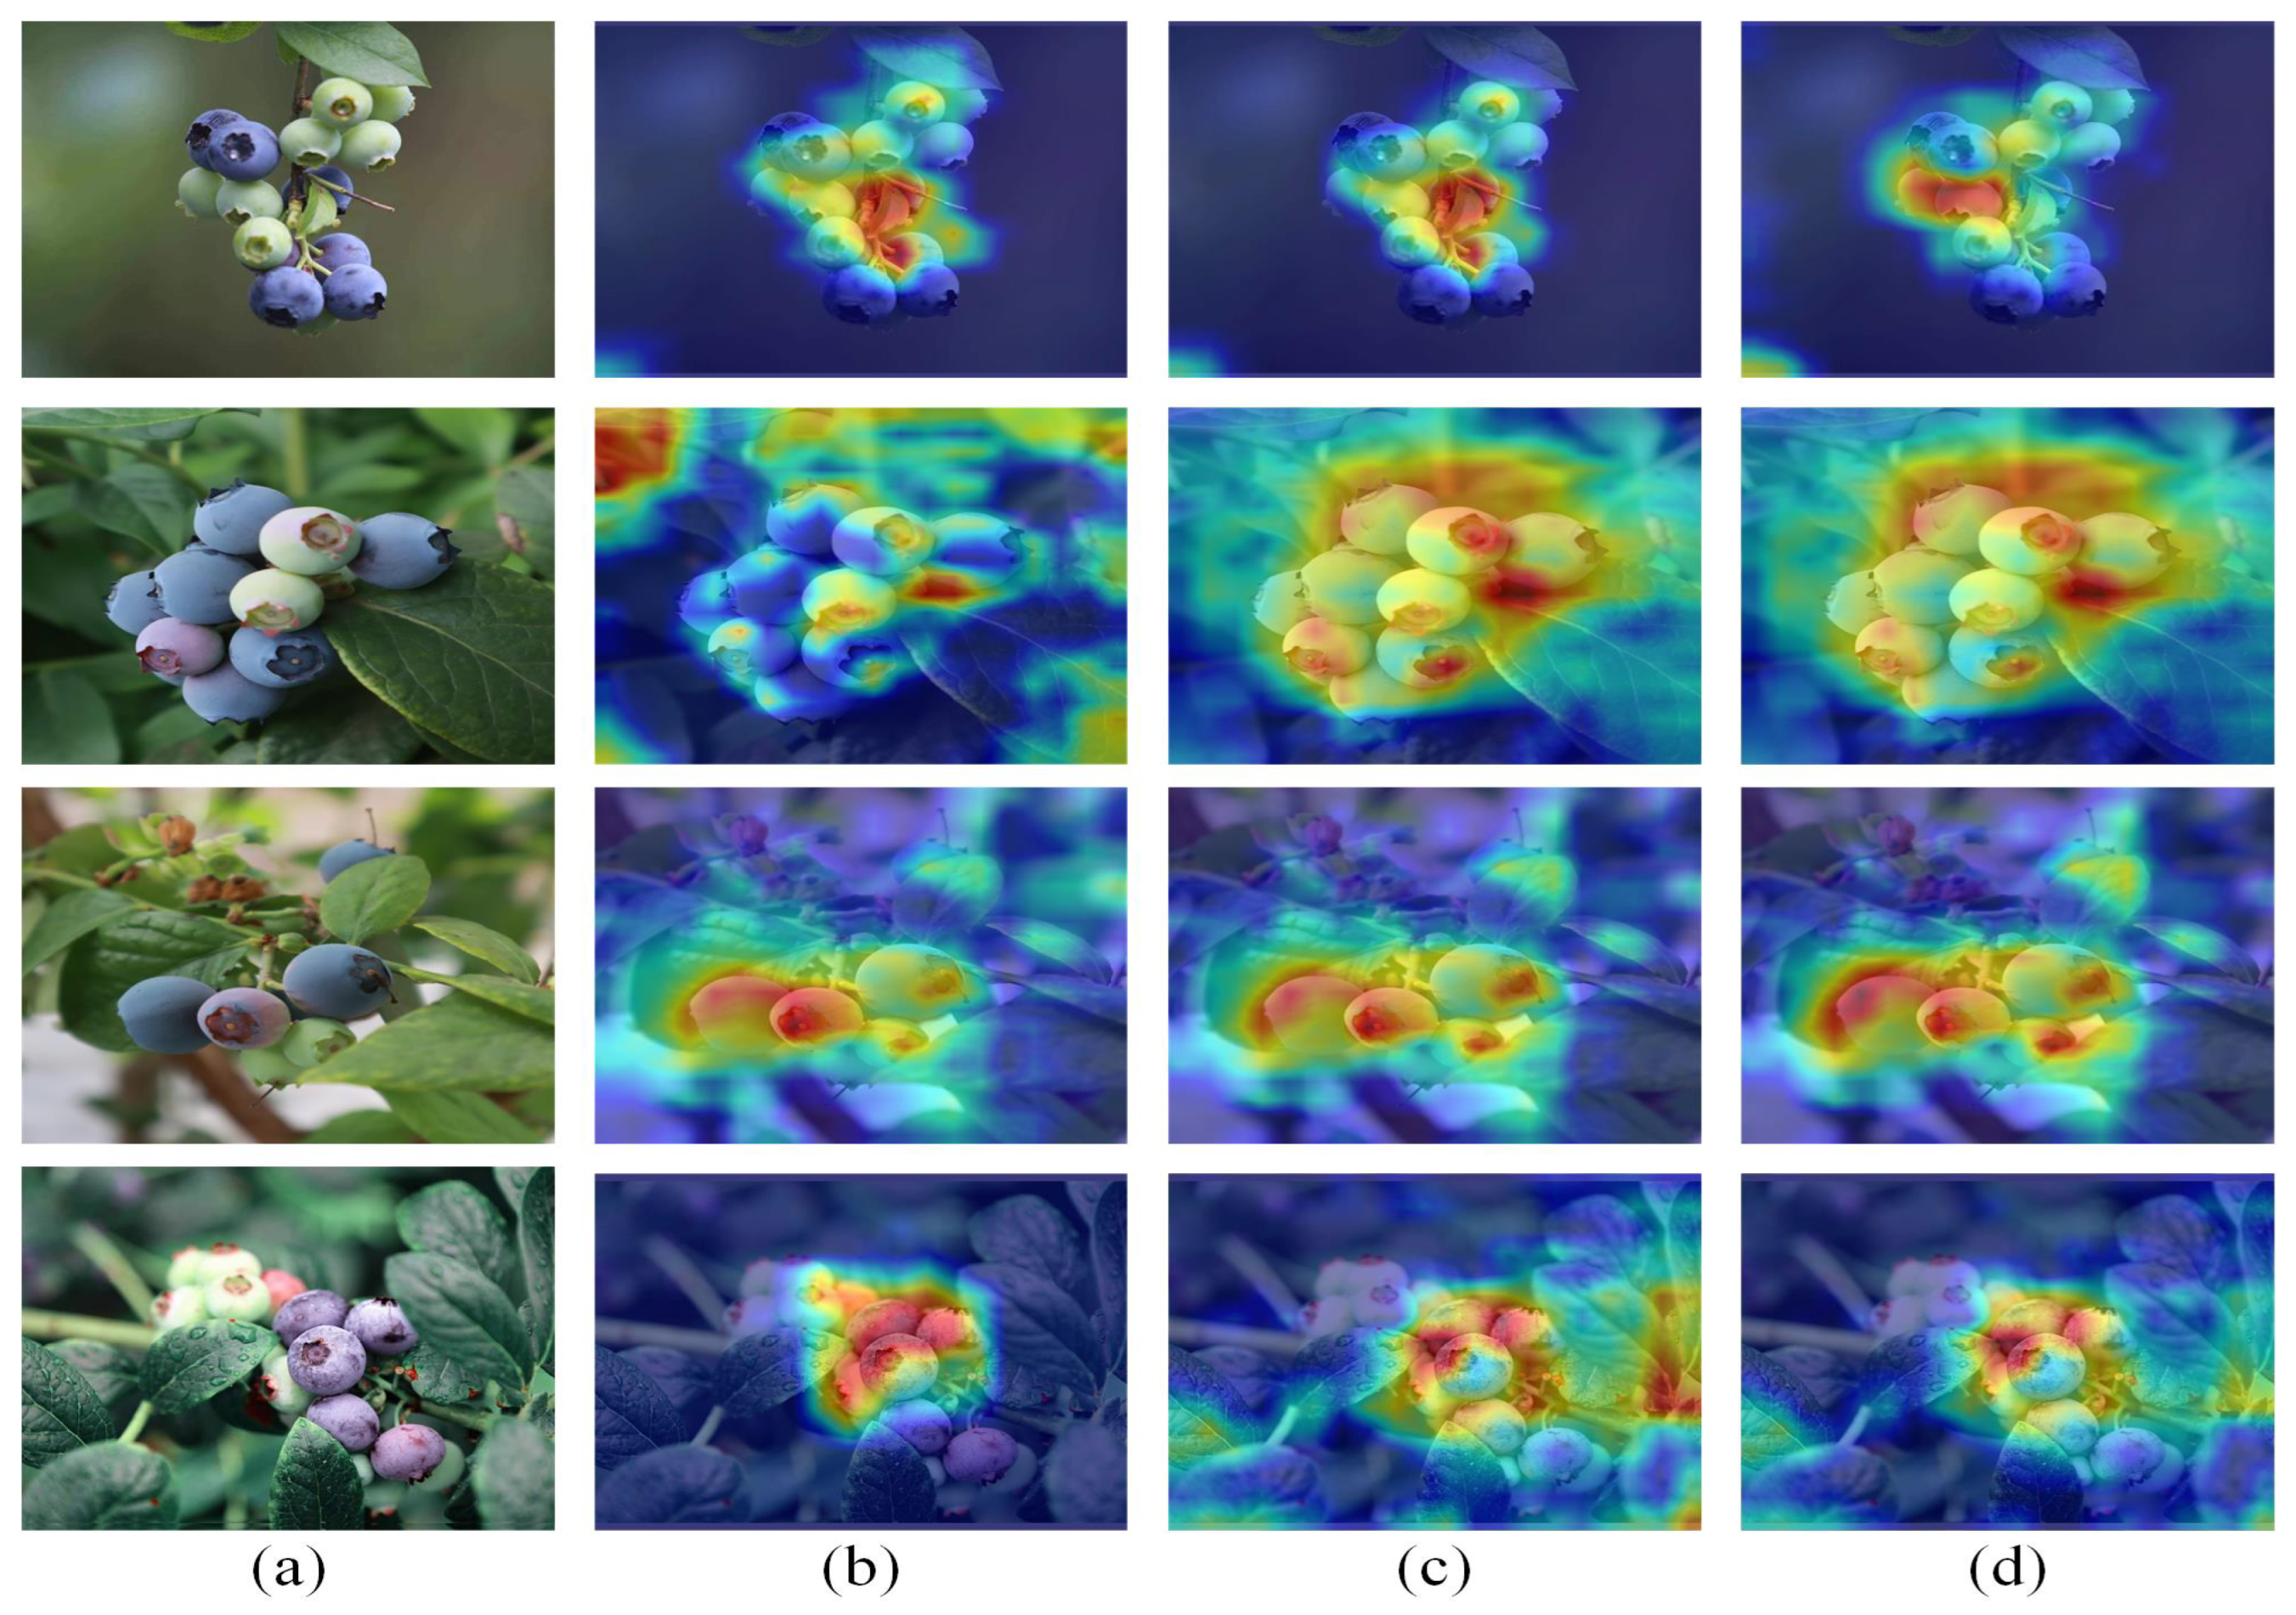
To intuitively illustrate the effectiveness of the proposed model improvements, we employ Gradient-weighted Class Activation Mapping (Grad-CAM) to visualize the attention regions of the detection targets [33]. In the visualizations, brighter areas indicate regions to which the model pays greater attention. The results are shown in Figure 12.
As depicted in (b) YOLOv8n, the attention map of the YOLOv8n model appears dispersed and is susceptible to background interference. In contrast, after integrating the GLKRep module, the attention becomes more concentrated, leading to noticeably improved target localization. Furthermore, with the addition of the Unify module, the model exhibits significantly enhanced focus and robustness across all scenes, accurately highlighting the blueberry regions while effectively suppressing irrelevant background responses.
These visual results confirm that the proposed architectural modifications contribute to improved feature representation and localization precision, particularly in complex field environments.
Figure 12.
Visualzation of heatmap. (a) Original image (b) YOLOv8n (c) YOLOv8n+GLKRep (d) YOLOv8n+GLKRep+Unify.
Figure 12.
Visualzation of heatmap. (a) Original image (b) YOLOv8n (c) YOLOv8n+GLKRep (d) YOLOv8n+GLKRep+Unify.
4.7. Generalization Assessment
To evaluate the generalization capability of the YOLO-Blueberry model [34], this study conducted tests on a publicly available blueberry dataset from the literature. As shown in Figure 13, the left column presents the original images, while the right column displays the detection results produced by YOLO-Blueberry. The experimental results demonstrate that the model can accurately detect blueberry fruits and distinguish their maturity levels under complex background conditions. Even in scenarios involving dense fruit clusters, partial occlusion, or significant lighting variations, the model consistently produces precise bounding boxes and class labels, exhibiting strong robustness and high detection accuracy. These findings further confirm that YOLO-Blueberry maintains reliable consistency and recognition performance across various shooting angles and application scenarios.
Table 4 compares the performance of YOLO-BLBE and YOLO-Blueberry across multiple evaluation metrics. As shown in the table, YOLO-Blueberry demonstrates higher efficiency in terms of model size and detection speed, while also outperforming YOLO-BLBE in key detection indicators such as precision, recall, and mAP. Although its F1 score is slightly lower than that of YOLO-BLBE, the overall performance of YOLO-Blueberry is more balanced. These results indicate that YOLO-Blueberry not only performs well on the specific training dataset but also exhibits strong detection capability and generalization on the public test set.
5. Discussion
To achieve accurate identification of blueberries at different maturity stages and address the limitations of existing detection models in multi-scale feature extraction and adaptability to complex environments, this study develops a lightweight YOLO-Blueberry model based on the YOLOv8n architecture. The proposed model incorporates a GLKRep module to enhance semantic perception capability and introduces a Unify dual-layer detection module to adapt to multi-scale feature fusion requirements. The advantages of the proposed model are demonstrated in three key aspects:
- (1)
- Lightweight Design and Deep Integration of Structural Reparameterization: This paper innovatively introduces the GLKRep module, which combines grouped channel convolution with large-kernel structural reparameterization. This approach significantly reduces computational complexity while maintaining semantic perception capabilities, effectively enhancing the depth and semantic awareness of feature extraction. It ensures efficient deployment and real-time response on edge devices.
- (2)
- Adaptive Dual-Layer Receptive Field Multi-Scale Fusion Structure: To address the significant scale variations and complex spatial distribution of blueberries in natural environments, a Unify dual-layer detection module was designed. This module dynamically receives and fuses feature maps from different layers of the backbone network, utilizing a multi-scale convolutional structure to achieve precise blueberry fruit recognition under conditions of scale variation, target overlap, and perspective changes, significantly enhancing the model’s robustness in identifying blueberry ripeness in complex scenarios.
- (3)
- Introduction of IoU-Aware Classification Loss to Optimize Detection Consistency: During the model training phase, the VariFocal Loss function is introduced, leveraging IoU-Aware Classification Scores (IACS) to effectively coordinate the optimization of target classification and bounding box regression tasks. This results in higher stability and accuracy in multi-target detection scenarios with dense fruit clusters and severe occlusion.
Despite the significant breakthroughs achieved by the YOLO-Blueberry model in the blueberry ripeness detection task, certain limitations remain. First, the model currently focuses on ripeness classification and does not address the detection of fruit pests or diseases. Second, the model relies on high-quality image inputs, and its adaptability to extreme weather conditions or blurry images needs further improvement. Future research will focus on enhancing the YOLO-Blueberry model, further exploring its detection and recognition capabilities for blueberry targets in complex agricultural scenarios. This includes achieving precise identification and classification of blueberry pests and diseases, intelligent estimation of large-scale blueberry yields, and analysis of blueberry growth trends, ultimately contributing to the promotion and development of intelligent agricultural monitoring technologies.
6. Conclusions
This study proposes a lightweight blueberry ripeness detection model, YOLO-Blueberry, capable of efficiently and accurately identifying the maturity stages of blueberry fruits across various growth phases. To address the challenges of feature extraction in complex environments and limited multi-scale recognition accuracy, the model integrates a GLKRep module to enhance multi-scale feature representation, employs a Unify module to optimize semantic fusion across network layers, and introduces the VariFocal Loss function to improve detection precision under conditions of occlusion and overlap.
While maintaining a lightweight architecture, YOLO-Blueberry significantly improves robustness and generalization. Experimental results demonstrate that the model outperforms existing mainstream methods in key evaluation metrics including mAP@0.5–0.95, precision, and recall, while also achieving lower FLOPs and parameter counts. These advantages indicate strong deployment efficiency, making the model particularly well-suited for real-world, resource-constrained scenarios.
YOLO-Blueberry provides a high-performance, low-computation solution for automatic fruit recognition and offers valuable technical support and practical reference for deploying mobile detection systems in agricultural applications.
Author Contributions
Conceptualization,Y.B.J, C.Z.B ; methodology,Z.X.Y.; resources, P.P.; data curation, Y.B.J.; writing—original draft preparation, Y.B.J..; project administration,P.P; Y.B.J., C.Z.B, Z.X.Y and P.P. are the co-first authors. All authors have read and agreed to the published version of the manuscript.
Funding
This research was funded by Zhejiang Ocean University, grant number JX6311040123.
Data Availability Statement
The original contributions presented in this study are included in the article. Further inquiries can be directed to the corresponding author.
Conflicts of Interest
The authors declare that they have no known competing financial interests or personal relationships that could have appeared to influence the work reported in this paper.
References
- Duan, Y.; Tarafdar, A.; Chaurasia, D.; Singh, A.; Bhargava, P.C.; Yang, J.; Li, Z.; Ni, X.; Tian, Y.; Li, H.; et al. Blueberry fruit valorization and valuable constituents: A review. International Journal of Food Microbiology 2022, 381, 109890. [CrossRef]
- Wu, Y.; Han, T.; Yang, H.; Lyu, L.; Li, W.; Wu, W. Known and potential health benefits and mechanisms of blueberry anthocyanins: A review. Food Bioscience 2023, 55, 103050. [CrossRef]
- Wu, Y.; Xu, L.; Liu, X.; Hasan, K.F.; Li, H.; Zhou, S.; Zhang, Q.; Zhou, Y. Effect of thermosonication treatment on blueberry juice quality: Total phenolics, flavonoids, anthocyanin, and antioxidant activity. Lwt 2021, 150, 112021. [CrossRef]
- Sivapragasam, N.; Neelakandan, N.; Rupasinghe, H.V. Potential health benefits of fermented blueberry: A review of current scientific evidence. Trends in Food Science & Technology 2023, 132, 103–120. [CrossRef]
- Aguilera, C.A.; Figueroa-Flores, C.; Aguilera, C.; Navarrete, C. Comprehensive analysis of model errors in blueberry detection and maturity classification: identifying limitations and proposing future improvements in agricultural monitoring. Agriculture 2023, 14, 18.
- Elbasi, E.; Mostafa, N.; AlArnaout, Z.; Zreikat, A.I.; Cina, E.; Varghese, G.; Shdefat, A.; Topcu, A.E.; Abdelbaki, W.; Mathew, S.; et al. Artificial intelligence technology in the agricultural sector: A systematic literature review. IEEE access 2022, 11, 171–202. [CrossRef]
- Javaid, M.; Haleem, A.; Khan, I.H.; Suman, R. Understanding the potential applications of Artificial Intelligence in Agriculture Sector. Advanced Agrochem 2023, 2, 15–30. [CrossRef]
- Lin, D.; Wei, R.; Xu, L. An Integrated Yield Prediction Model for Greenhouse Tomato. Agronomy 2019, 9. [CrossRef]
- Jia, L.; Wang, T.; Chen, Y.; Zang, Y.; Li, X.; Shi, H.; Gao, L. MobileNet-CA-YOLO: An Improved YOLOv7 Based on the MobileNetV3 and Attention Mechanism for Rice Pests and Diseases Detection. Agriculture 2023, 13. [CrossRef]
- Wang, Y.; Rong, Q.; Hu, C. Ripe Tomato Detection Algorithm Based on Improved YOLOv9. Plants 2024, 13. [CrossRef]
- Chai, J.J.K.; Xu, J.L.; O’Sullivan, C. Real-Time Detection of Strawberry Ripeness Using Augmented Reality and Deep Learning. Sensors 2023, 23. [CrossRef]
- Zhu, X.; Chen, F.; Zheng, Y.; Chen, C.; Peng, X. Detection of Camellia oleifera fruit maturity in orchards based on modified lightweight YOLO. Computers and Electronics in Agriculture 2024, 226, 109471. [CrossRef]
- Yang, W.; Ma, X.; An, H. Blueberry ripeness detection model based on enhanced detail feature and content-aware reassembly. Agronomy 2023, 13, 1613. [CrossRef]
- Xiao, F.; Wang, H.; Xu, Y.; Shi, Z. A lightweight detection method for blueberry fruit maturity based on an improved YOLOv5 algorithm. Agriculture 2023, 14, 36. [CrossRef]
- Feng, W.; Liu, M.; Sun, Y.; Wang, S.; Wang, J. The Use of a Blueberry Ripeness Detection Model in Dense Occlusion Scenarios Based on the Improved YOLOv9. Agronomy 2024, 14, 1860. [CrossRef]
- Quiroz, I.A.; Alférez, G.H. Image recognition of Legacy blueberries in a Chilean smart farm through deep learning. Computers and Electronics in Agriculture 2020, 168, 105044. [CrossRef]
- Sohan, M.; Sai Ram, T.; Rami Reddy, C.V. A review on yolov8 and its advancements. In Proceedings of the International Conference on Data Intelligence and Cognitive Informatics. Springer, 2024, pp. 529–545.
- Badgujar, C.M.; Poulose, A.; Gan, H. Agricultural object detection with you look only once (yolo) algorithm: A bibliometric and systematic literature review. arXiv preprint arXiv:2401.10379 2024. [CrossRef]
- Alif, M.A.R.; Hussain, M. YOLOv1 to YOLOv10: A comprehensive review of YOLO variants and their application in the agricultural domain. arXiv preprint arXiv:2406.10139 2024.
- Kanna S, K.; Ramalingam, K.; PC, P.; et al. YOLO deep learning algorithm for object detection in agriculture: a review. Journal of Agricultural Engineering (1974-7071) 2024, 55.
- Doherty, J.; Gardiner, B.; Kerr, E.; Siddique, N. BiFPN-yolo: One-stage object detection integrating Bi-directional feature pyramid networks. Pattern Recognition 2025, 160, 111209. [CrossRef]
- Yan, B.; Li, J.; Yang, Z.; Zhang, X.; Hao, X. AIE-YOLO: Auxiliary information enhanced YOLO for small object detection. Sensors 2022, 22, 8221. [CrossRef]
- Ouyang, C.; Zhang, H.; Mu, X.; Wu, Z.; Dai, W. E-VarifocalNet: a lightweight model to detect insulators and their defects under power grid surveillance. In Proceedings of the 2023 IEEE 21st International Conference on Industrial Informatics (INDIN). IEEE, 2023, pp. 1–6.
- Li, W. Analysis of object detection performance based on Faster R-CNN. In Proceedings of the Journal of Physics: Conference Series. IOP Publishing, 2021, Vol. 1827, p. 012085.
- Yadgar, G.; Gabel, M.; Jaffer, S.; Schroeder, B. SSD-based workload characteristics and their performance implications. ACM Transactions on Storage (TOS) 2021, 17, 1–26. [CrossRef]
- Chuang, X.; Qiang, C.; Yinyan, S.; Xiaochan, W.; Xiaolei, Z.; Yao, W.; Yiran, W. Improved lightweight YOLOv5n-based network for bruise detection and length classification of asparagus. Computers and Electronics in Agriculture 2025, 233, 110194. [CrossRef]
- Zheng, X.; Shao, Z.; Chen, Y.; Zeng, H.; Chen, J. MSPB-YOLO: High-Precision Detection Algorithm of Multi-Site Pepper Blight Disease Based on Improved YOLOv8. Agronomy 2025, 15, 839. [CrossRef]
- Ma, N.; Wu, Y.; Bo, Y.; Yan, H. Chili pepper object detection method based on improved YOLOv8n. Plants 2024, 13, 2402. [CrossRef]
- Yaseen, M. What is yolov9: An in-depth exploration of the internal features of the next-generation object detector. arXiv preprint arXiv:2409.07813 2024.
- Wang, Q.; Yan, N.; Qin, Y.; Zhang, X.; Li, X. BED-YOLO: An Enhanced YOLOv10n-Based Tomato Leaf Disease Detection Algorithm. Sensors 2025, 25, 2882. [CrossRef]
- Khanam, R.; Hussain, M. Yolov11: An overview of the key architectural enhancements. arXiv preprint arXiv:2410.17725 2024.
- Dong, X.; Pan, J. DHS-YOLO: Enhanced Detection of Slender Wheat Seedlings Under Dynamic Illumination Conditions. Agriculture 2025, 15, 510. [CrossRef]
- Ali, U.; Ismail, M.A.; Habeeb, R.A.A.; Shah, S.R.A. Performance evaluation of YOLO models in plant disease detection. Journal of Informatics and Web Engineering 2024, 3, 199–211. [CrossRef]
- Wang, C.; Han, Q.; Li, J.; Li, C.; Zou, X. YOLO-BLBE: A Novel Model for Identifying Blueberry Fruits with Different Maturities Using the I-MSRCR Method. Agronomy 2024, 14, 658. [CrossRef]
Figure 1.
Example of blueberry fruit collection images. (a) Green fruit period (b) Purple fruit period (c) Mature period (d) Back light (e) Facing light (f) Occlusion.
Figure 1.
Example of blueberry fruit collection images. (a) Green fruit period (b) Purple fruit period (c) Mature period (d) Back light (e) Facing light (f) Occlusion.
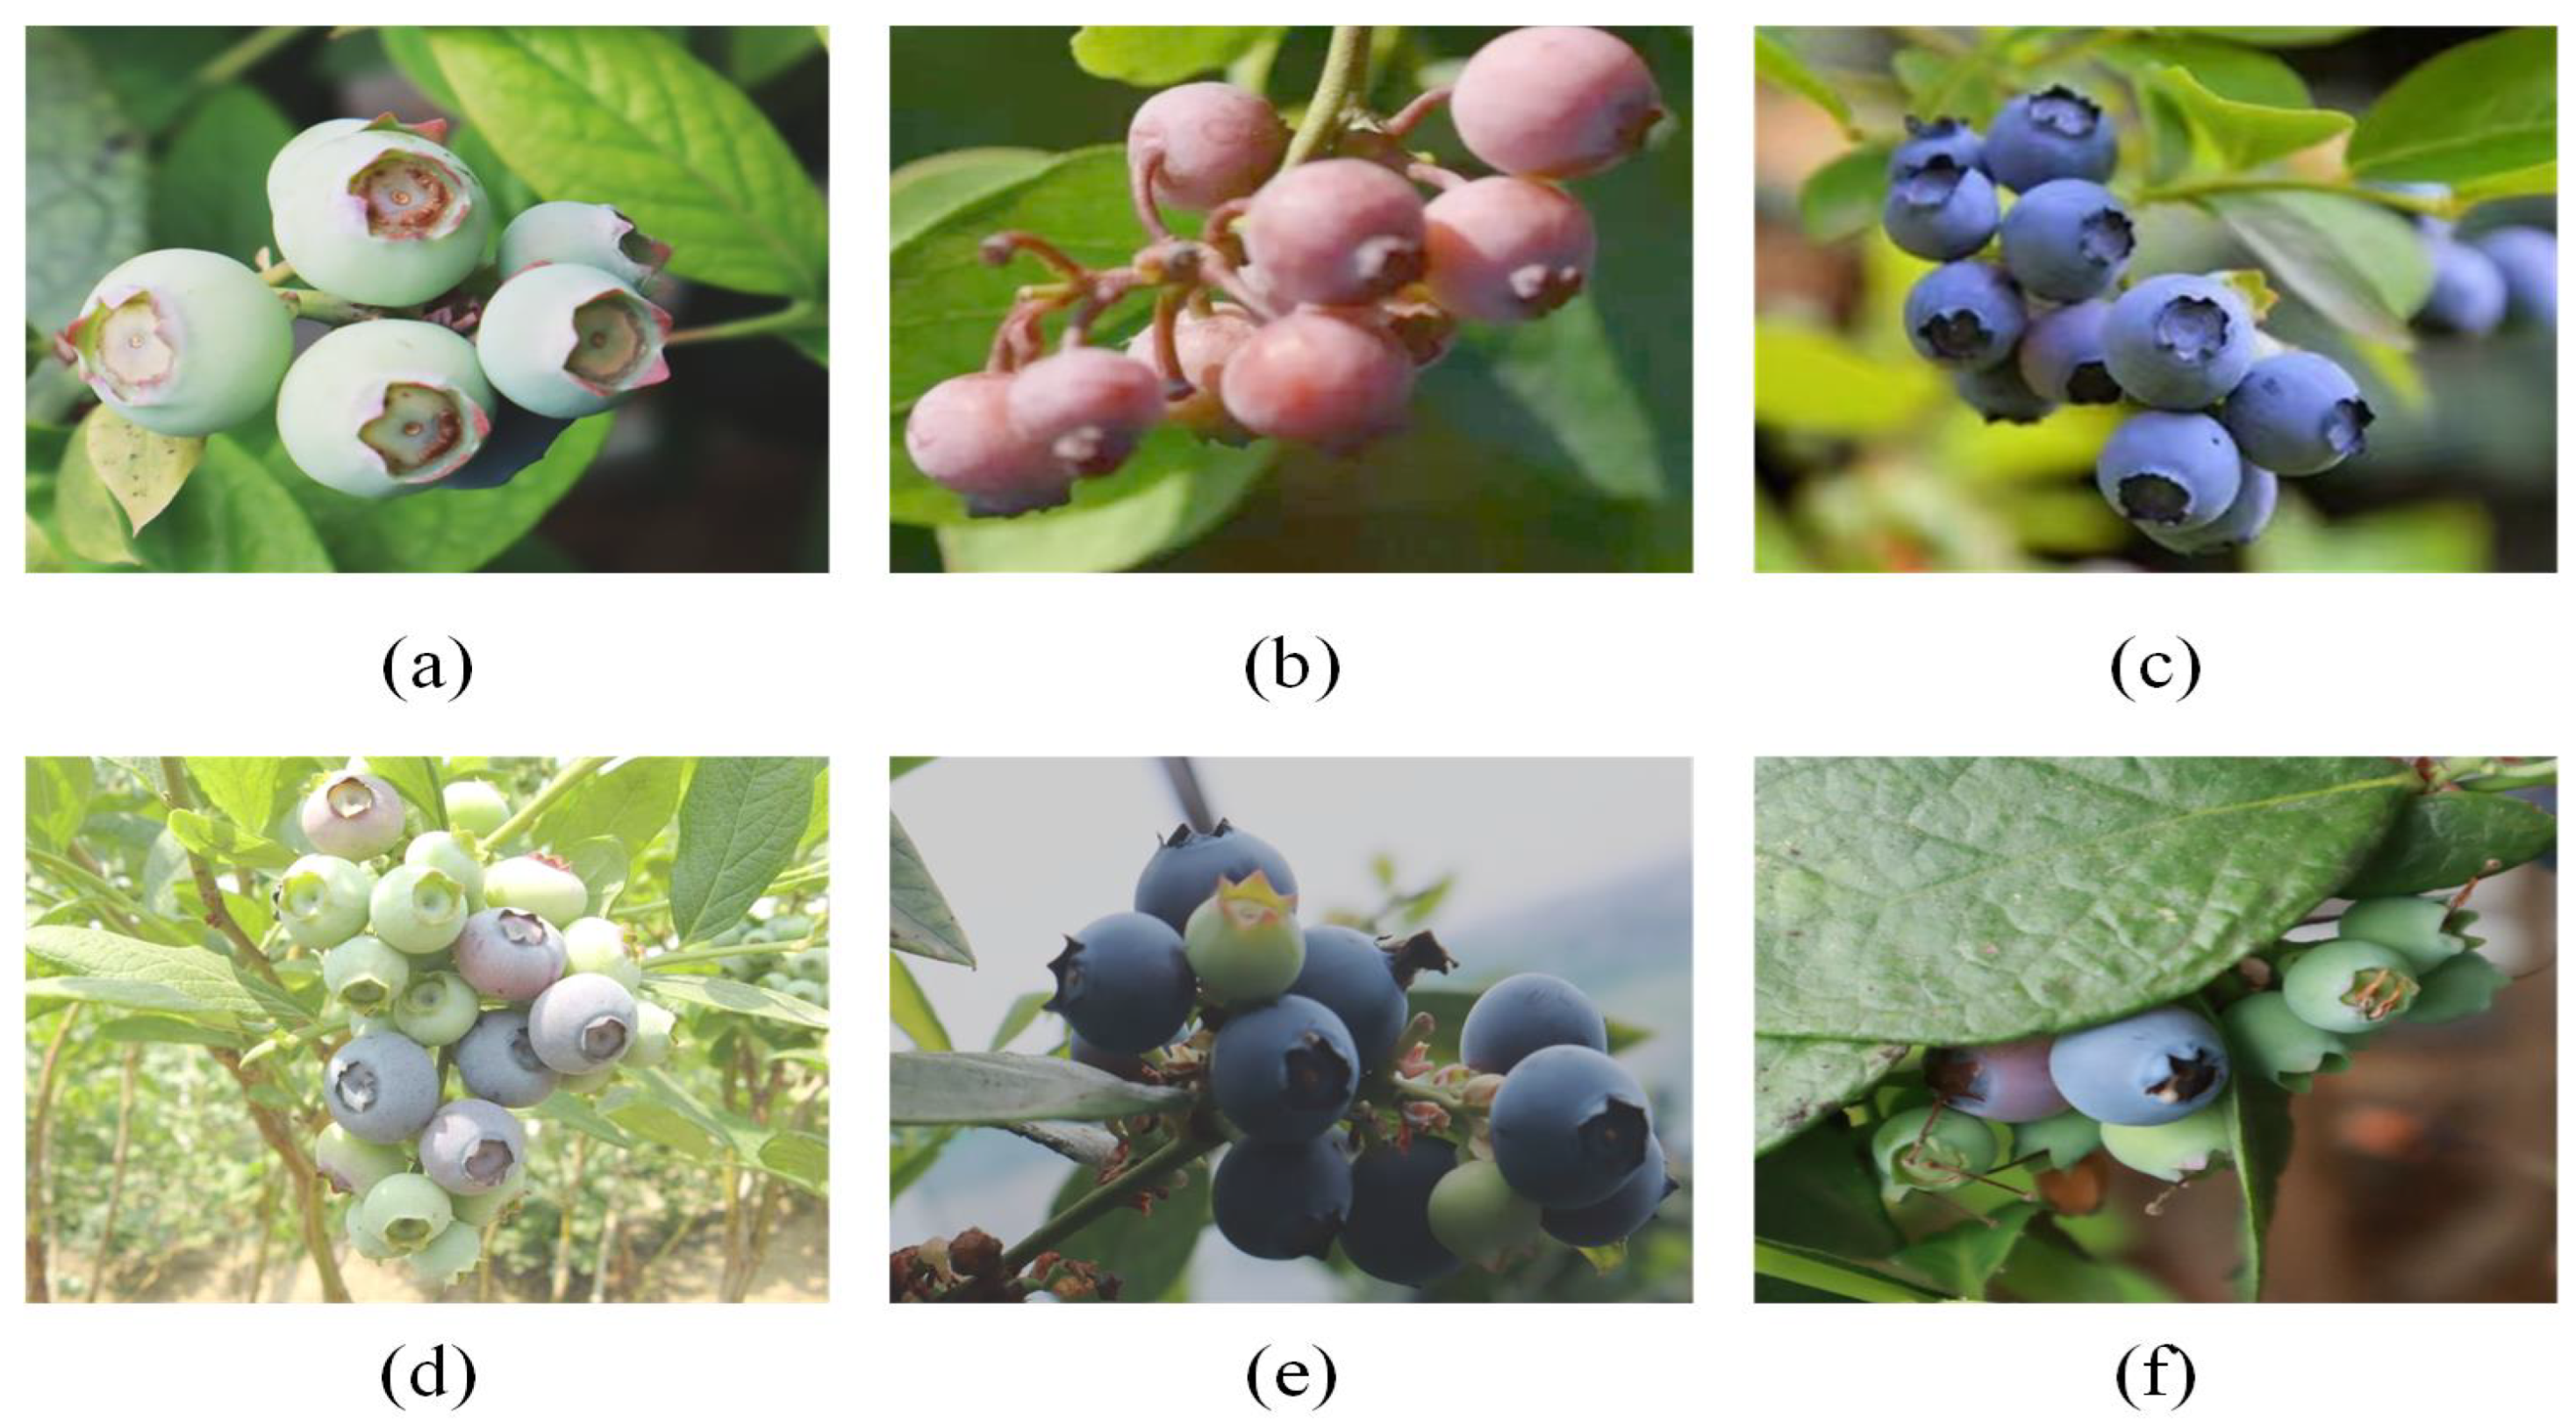
Figure 2.
Samples after data enhancement. (a) Original image (b) Vertical flipping (c) Gaussian blur (d) Horizontally flipping (e) Brightness weakening (f) Mosaic.
Figure 2.
Samples after data enhancement. (a) Original image (b) Vertical flipping (c) Gaussian blur (d) Horizontally flipping (e) Brightness weakening (f) Mosaic.
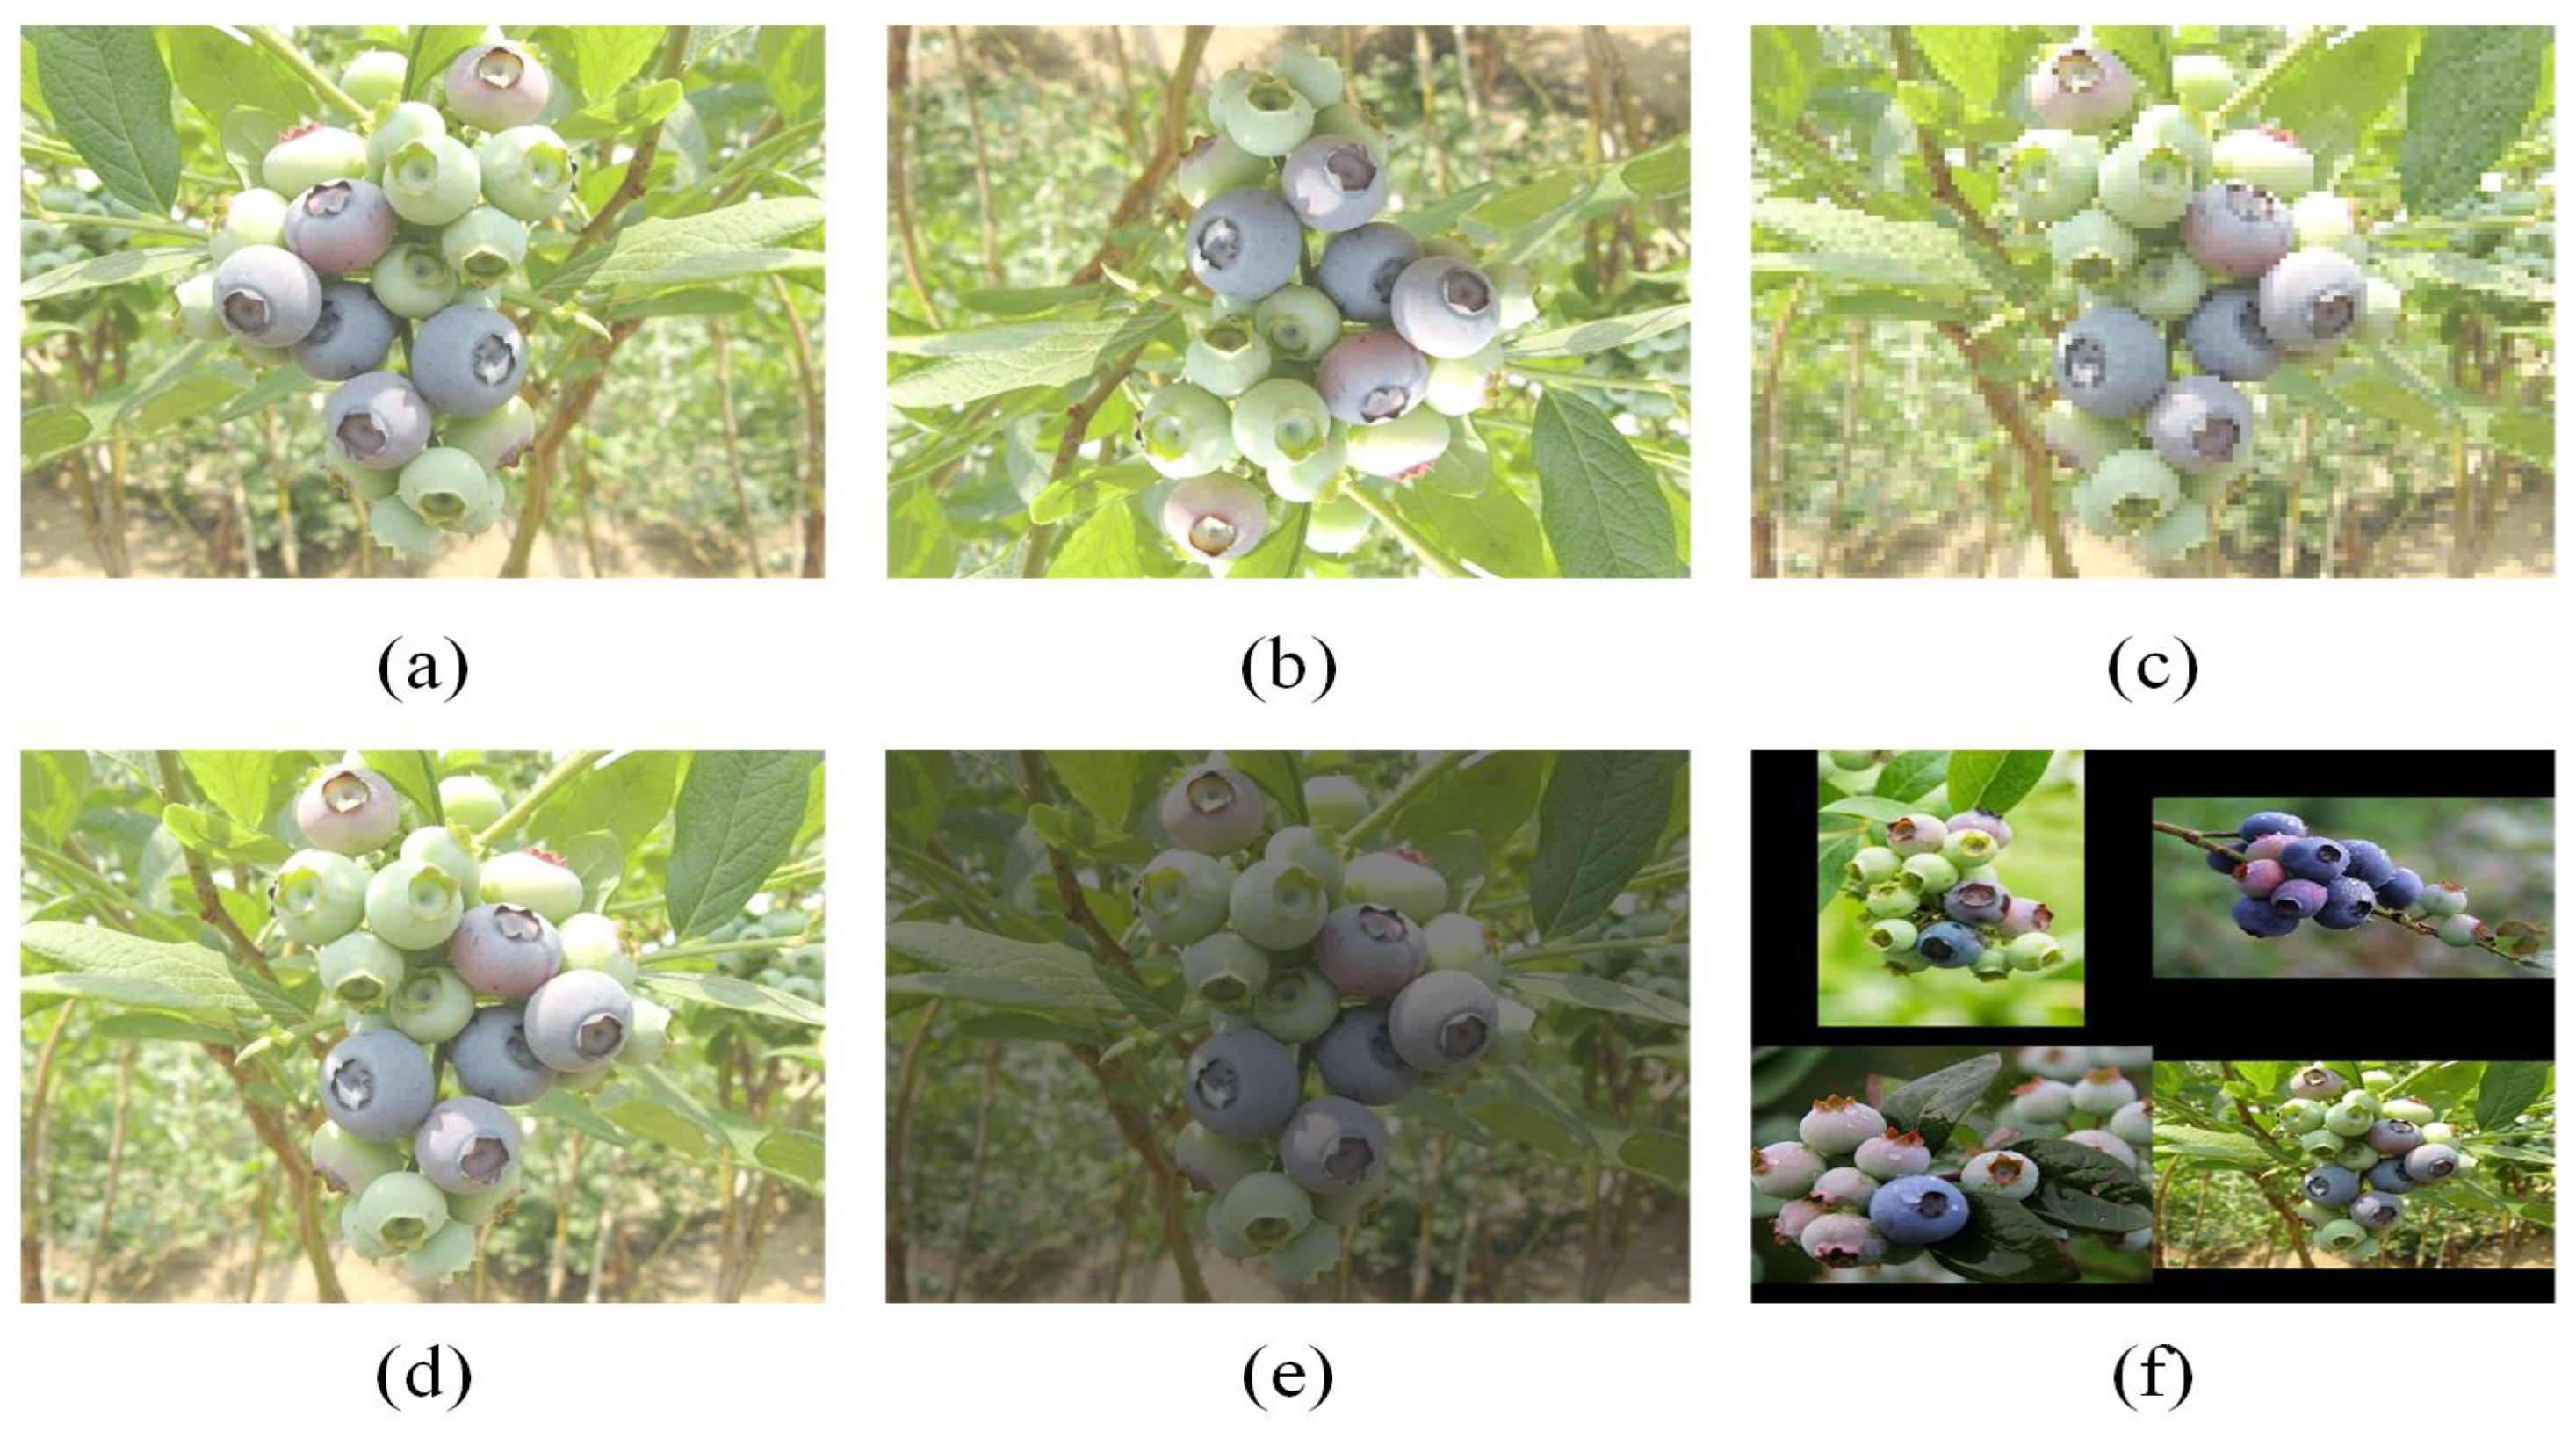
Figure 5.
Structure of Unity Modules.
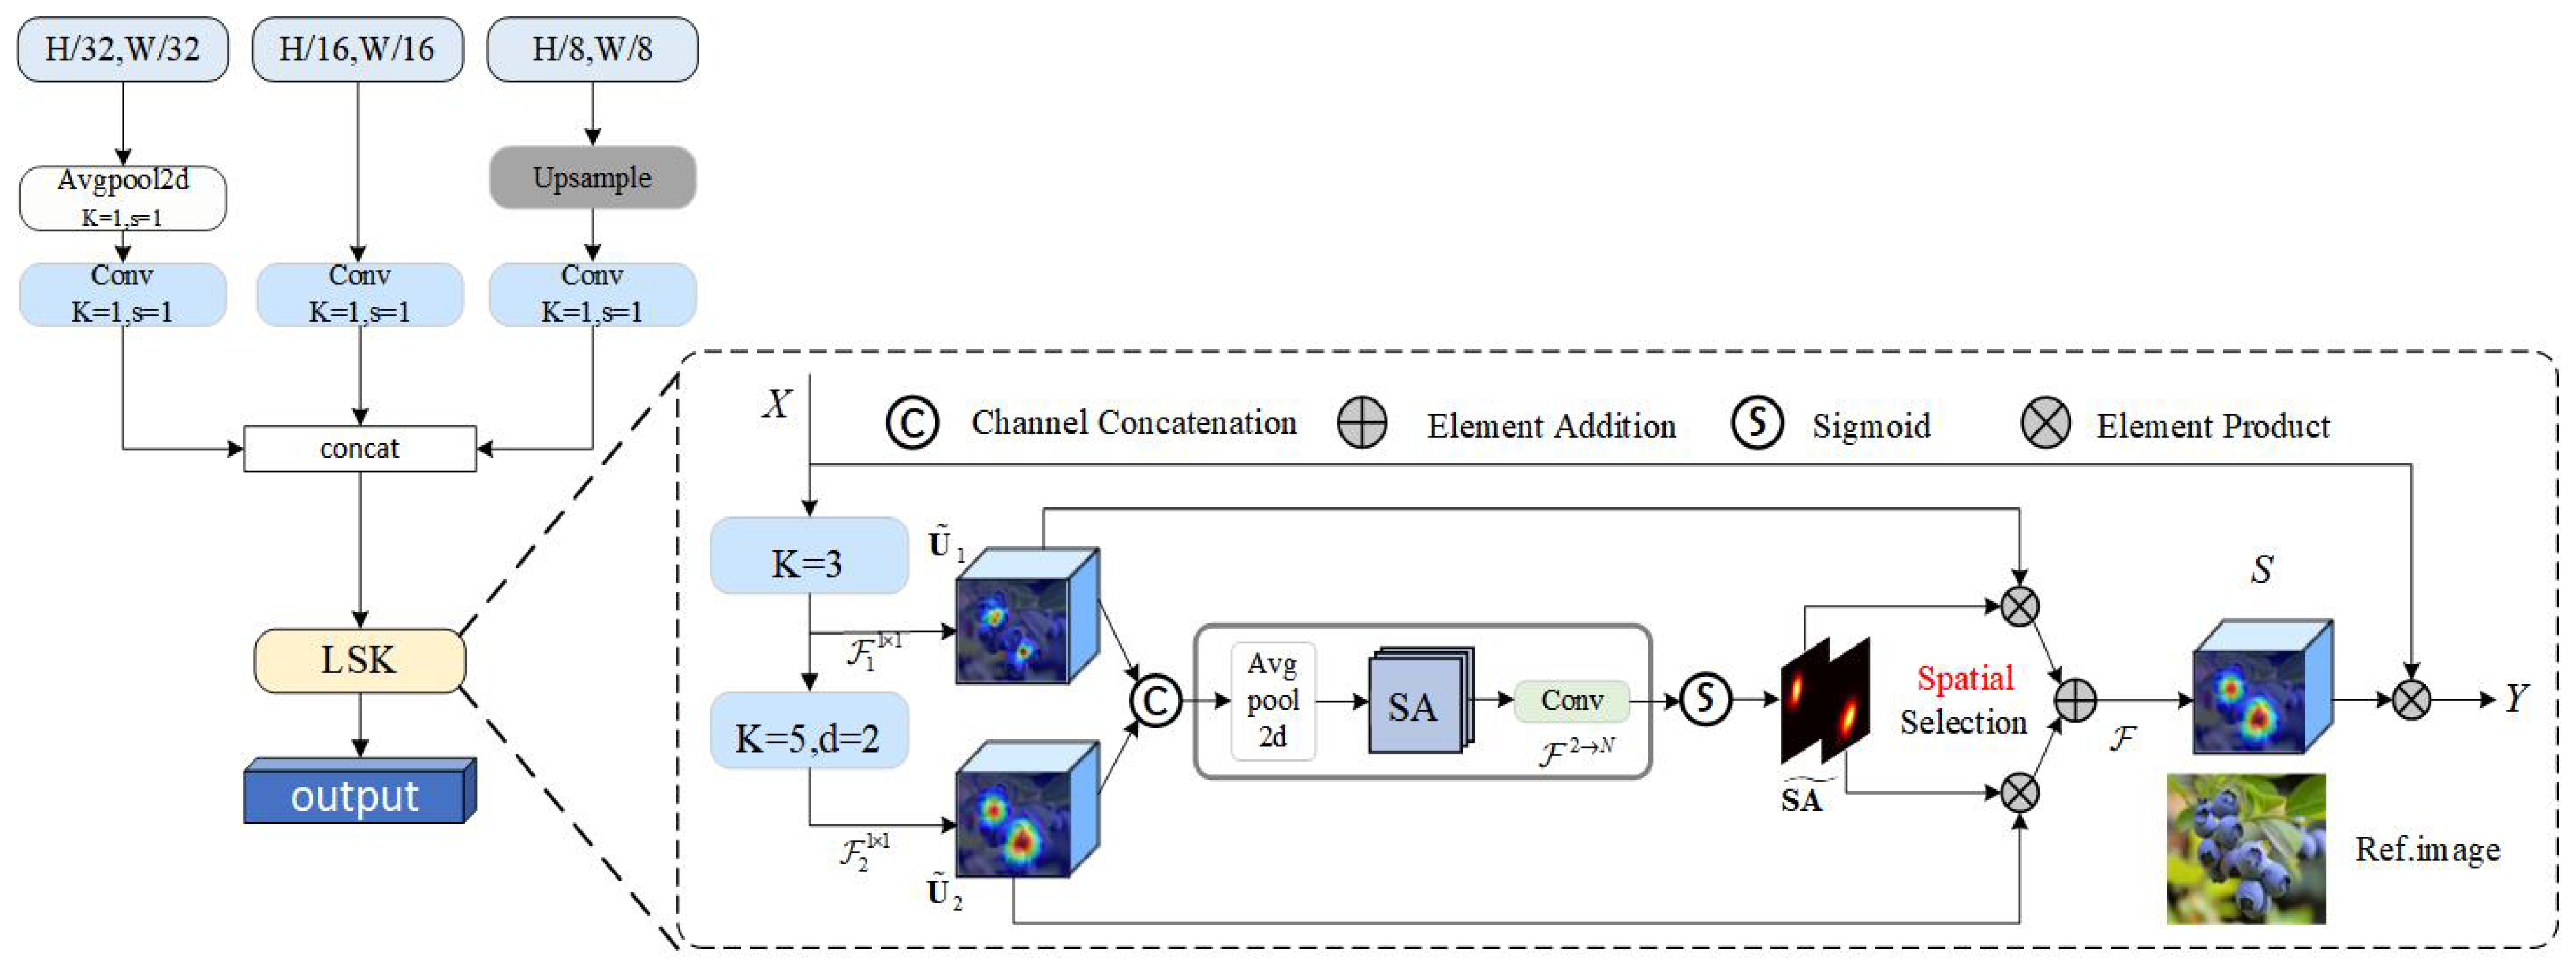
Figure 6.
VariFocal Loss Function.
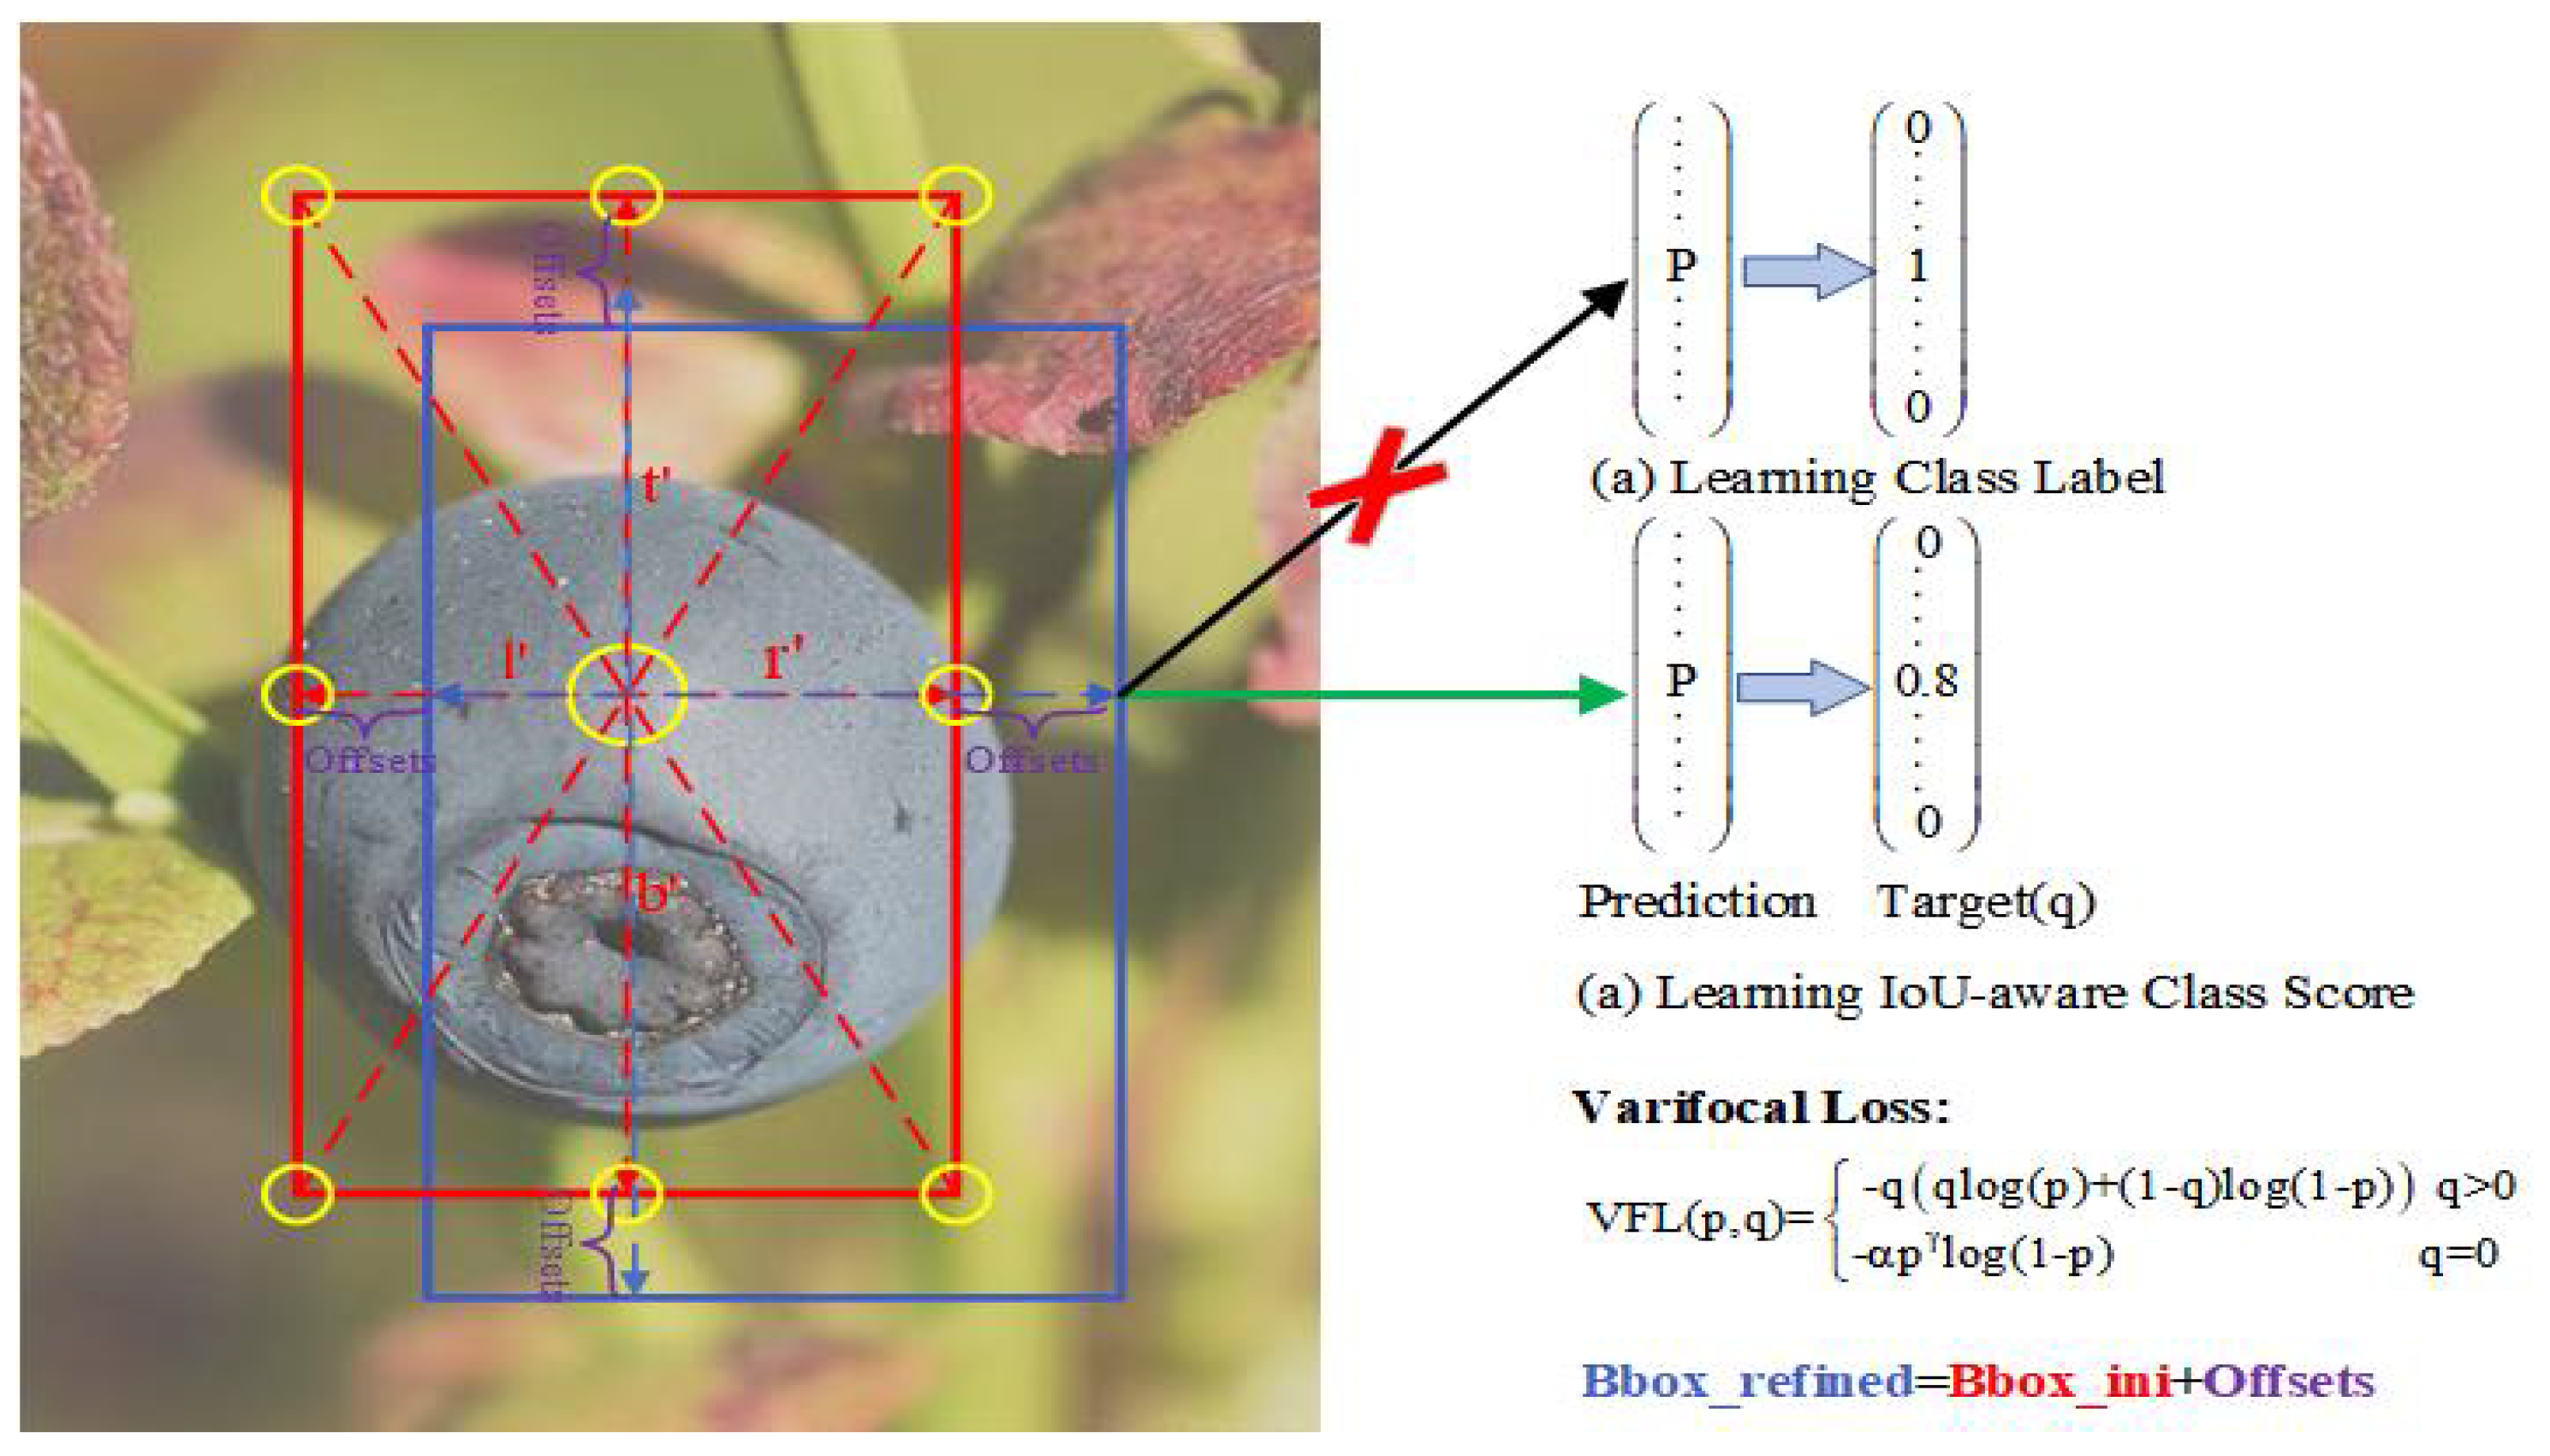
Figure 7.
YOLO-Blueberry detection experiment results. (a) Original image (b) YOLOv8n (c) YOLO-Blueberry(Ours).
Figure 7.
YOLO-Blueberry detection experiment results. (a) Original image (b) YOLOv8n (c) YOLO-Blueberry(Ours).
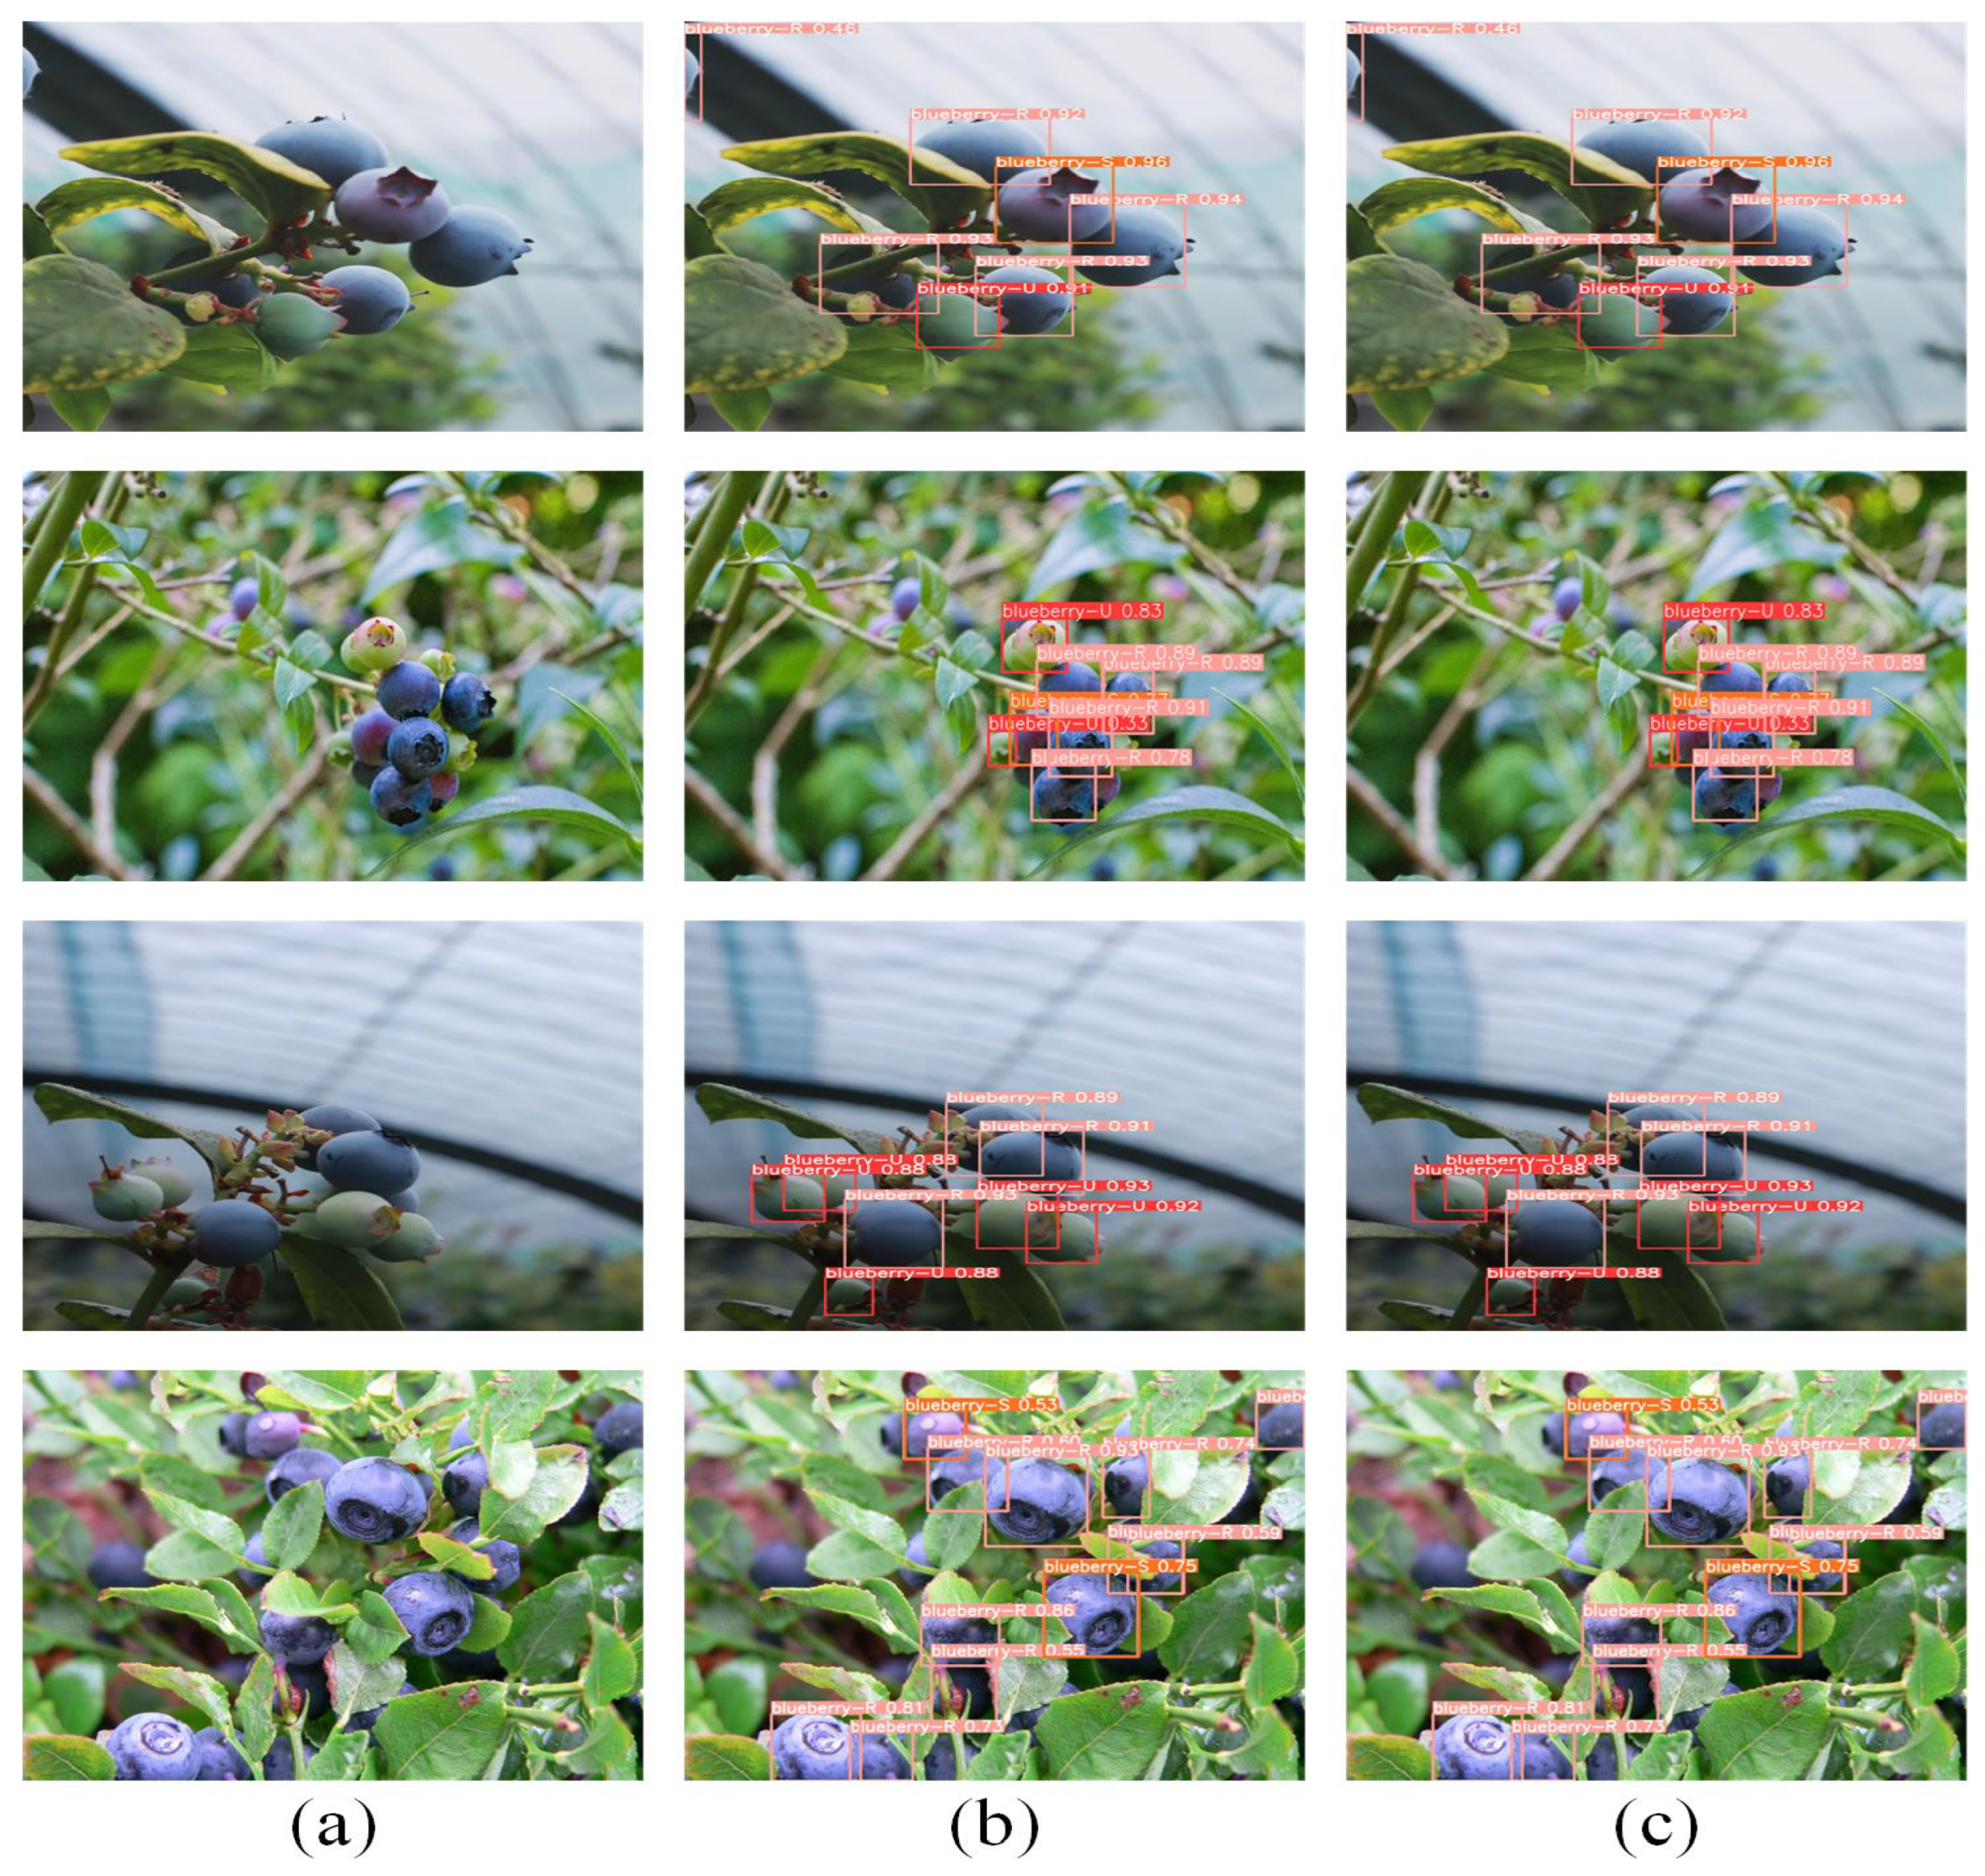
Figure 11.
Feature map visualization. (a) Original image (b) Stage GLKRep Modules features (c) Stage Unify Modules features.
Figure 11.
Feature map visualization. (a) Original image (b) Stage GLKRep Modules features (c) Stage Unify Modules features.
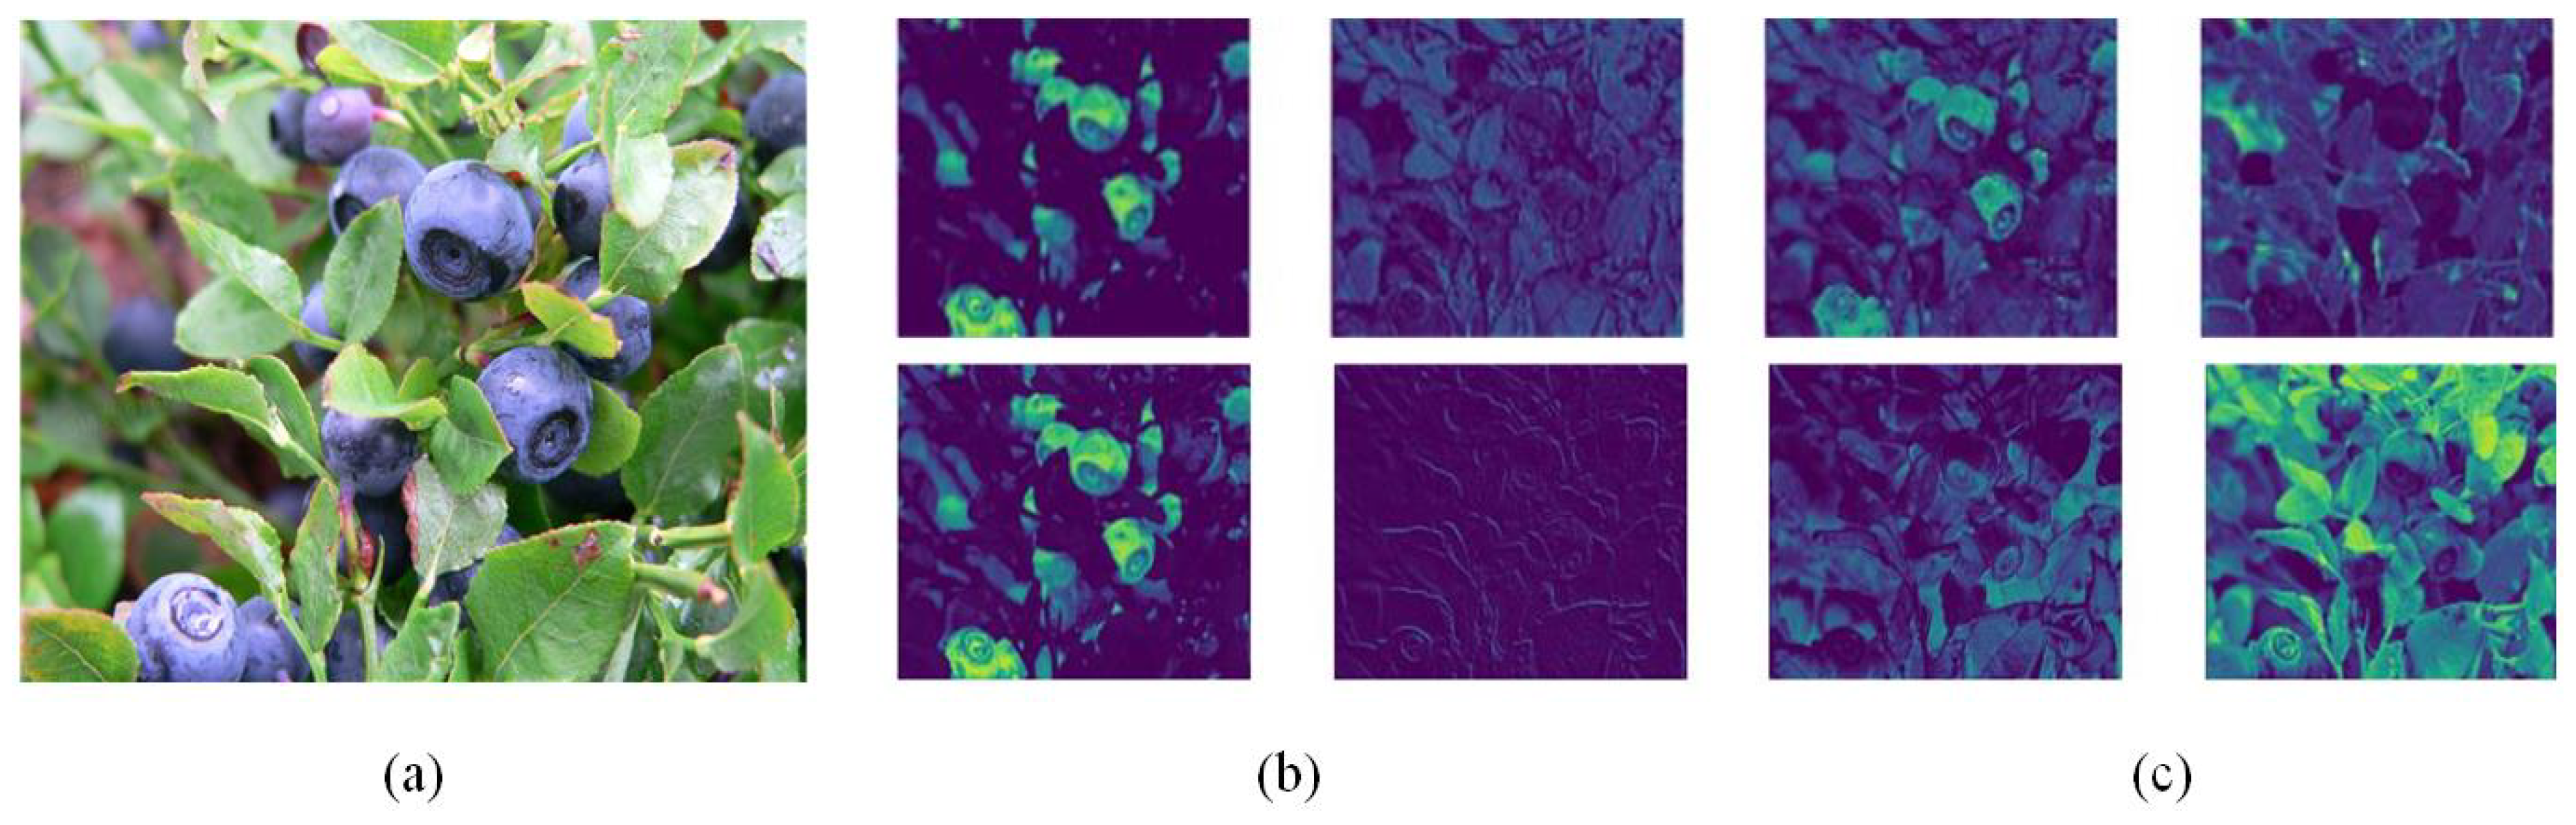
Figure 13.
Model generalization detection diagram. (a) Original image (b) YOLO-Blueberry.
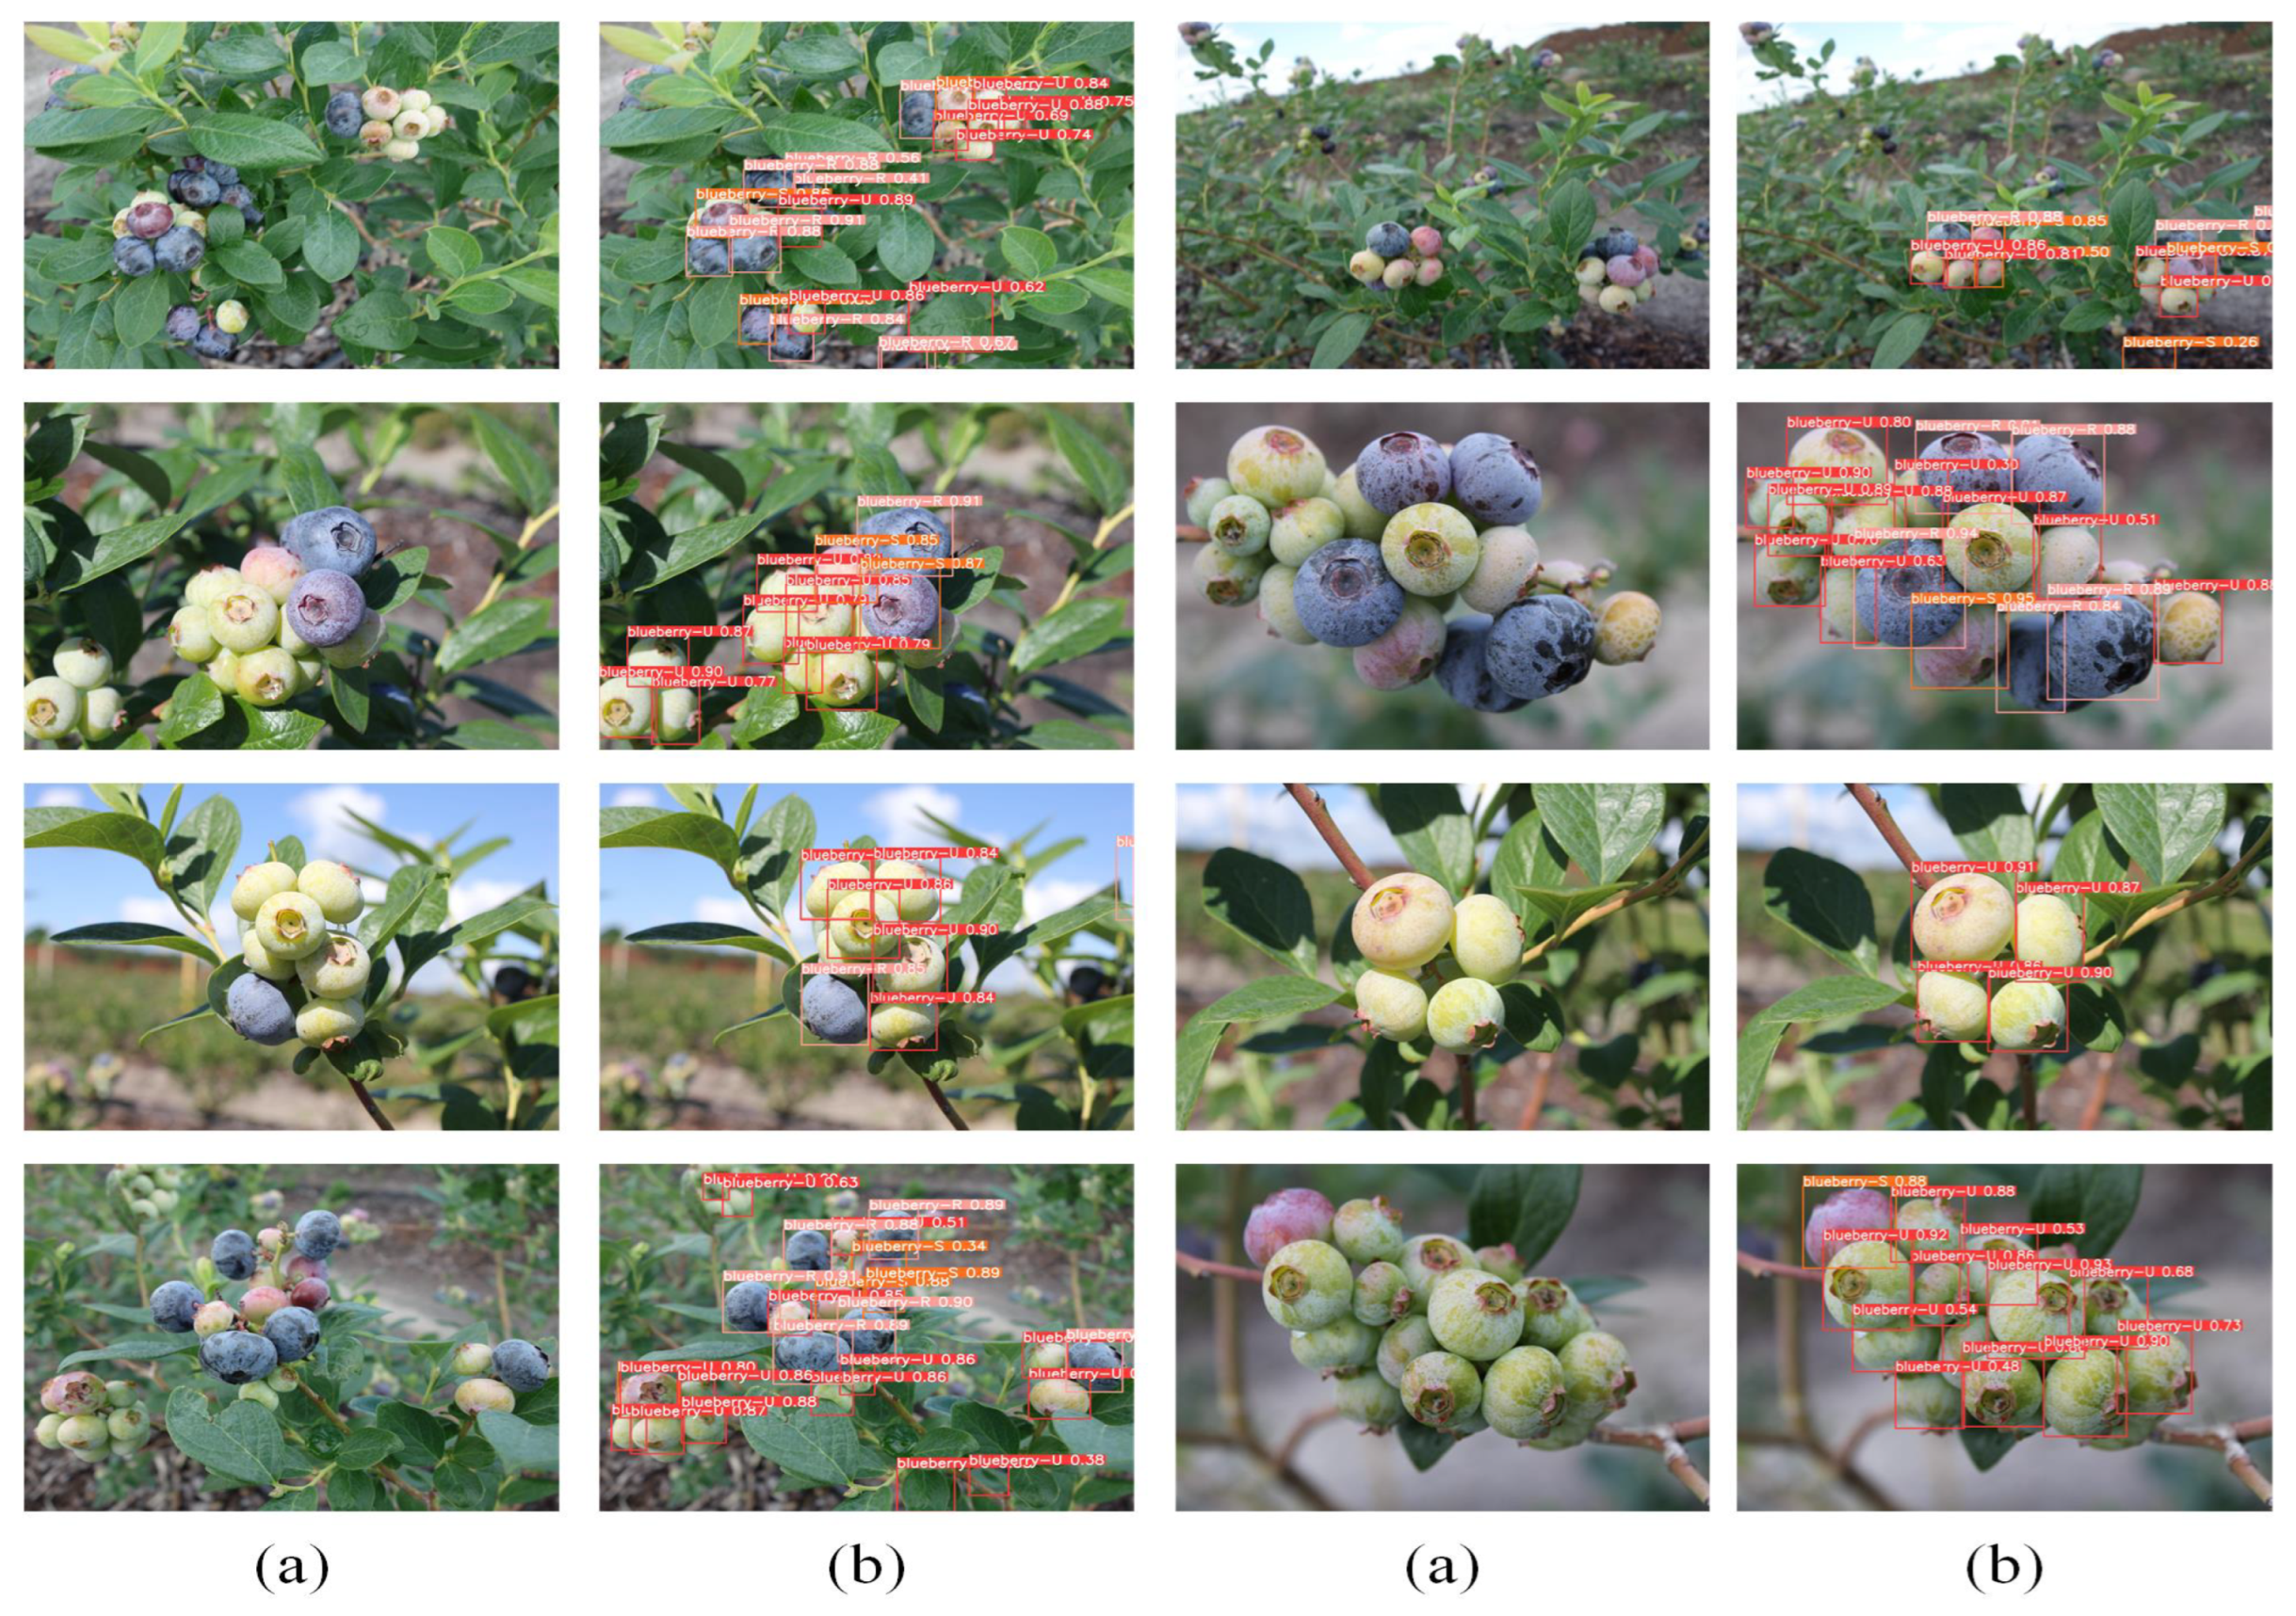
Table 4.
Comparison of models performance.
| Models | Model Size MB | DetectionSpeed s/perImage | Precision P/% | Recall R/% | F1 scoce | mAP/% |
|---|---|---|---|---|---|---|
| YOLO-BLBE | 12.75 | 0.009 | 93.72 | 97.56 | 95.60 | 98.14 |
| YOLO-Blueberry(Ours) | 3.08 | 0.005 | 97.51 | 98.52 | 95.43 | 98.51 |
Disclaimer/Publisher’s Note: The statements, opinions and data contained in all publications are solely those of the individual author(s) and contributor(s) and not of MDPI and/or the editor(s). MDPI and/or the editor(s) disclaim responsibility for any injury to people or property resulting from any ideas, methods, instructions or products referred to in the content. |
© 2025 by the authors. Licensee MDPI, Basel, Switzerland. This article is an open access article distributed under the terms and conditions of the Creative Commons Attribution (CC BY) license (http://creativecommons.org/licenses/by/4.0/).
Copyright: This open access article is published under a Creative Commons CC BY 4.0 license, which permit the free download, distribution, and reuse, provided that the author and preprint are cited in any reuse.


