Submitted:
06 May 2025
Posted:
07 May 2025
You are already at the latest version
Abstract
This study presents a comprehensive physical-statistical analysis of atmospheric partic-ulate matter (PM10 and PM2.5) and trace gases (SO₂ and O₃) over Faial Island in the Azores archipelago during 2024. Real-time data were collected at the Espalhafatos rural back-ground station, covering 35,137 observations per pollutant, with 15-minute intervals. De-scriptive statistics, probability distribution fitting (Normal, Lognormal, Weibull, Gamma), and correlation analyses were employed to characterize pollutant dynamics and identify extreme pollution episodes. The results revealed that PM2.5 concentrations are best mod-eled by a Lognormal distribution, while PM10 concentrations fit a Gamma distribution, highlighting the presence of heavy-tailed, positively skewed behavior in both cases. Sea-sonal and episodic variability was significant, with multiple Saharan dust transport events contributing to PM exceedances, particularly during winter and spring months. These events, confirmed by CAMS and SKIRON dust dispersion models, affected not only southern Europe but also the Northeast Atlantic, including the Azores region.
Weak to moderate correlations were observed between PM concentrations and meteoro-logical variables, indicating complex interactions influenced by atmospheric stability and long-range transport processes. Linear regression analyses between SO₂ and O₃, and be-tween SO₂ and PM2.5, showed statistically significant but low-explanatory relationships, suggesting that other meteorological and chemical factors play a dominant role.
These results highlight the importance of developing air quality policies that address both local emissions and long-range transport phenomena. They support the implementation of early warning systems and health risk assessments based on probabilistic modeling of particulate matter concentrations, even in remote Atlantic locations such as the Azores.
Keywords:
Particulate matter (PM2.5
; PM10)
; air quality
; Saharan dust transport
; statistical models
; Azores
; atmospheric pollutants (O3
; SO2)
; environmental risk
1. Introduction
Air quality deteriorates with the increase in emissions of atmospheric pollutants, contributing negatively to human health and the balance of ecosystems. Kumar et al. [1] examined that the alarming degradation of air quality, atmospheric conditions, economy and human life due to air pollution needs significant in-depth studies to ascertain causes, contributions and impacts for developing and implementing an effective policy to combat these issues. Air pollution is responsible worldwide for 9-12 million deaths annually. Hening [2] investigated that the major contributor to air pollution is particulate matter ≤ 2.5 µg per cubic meter of air (PM2.5) from vehicles, industrial emissions, and wildfire smoke. Nguyen et al. [3] verified that an extensive body of literature has concluded that exposure to air pollution is associated with an increased risk of respiratory hospital admissions in children worldwide. Vallero [4] proposed that an exposure to elevated concentrations of tropospheric (ground-level) ozone is particularly harmful to people with asthma or lung disease and children who are more likely than adults to have asthma, which is aggravated by ozone. Prolonged exposure to air pollutants, as particulate matter (PM), is associated with respiratory and cardiovascular diseases and significant environmental impacts. Among the main types of particles suspended in the air, PM10 (particles with an aerodynamic diameter ≤ 10 µm) and PM2.5 (fine particles with an aerodynamic diameter ≤ 2.5 µm) stand out, which have different behaviors in the atmosphere, due to their diameter, their concentration and their chemical behavior. Wei et al. [5] verified that atmospheric pressure and rainfall were negatively correlated with PM2.5, with notable reductions in concentrations under high pressure conditions and rainfall levels between 0- and 20-mm. Son et al. [6] concluded that annual assessments meaning PM2.5 concentrations in Thailand reached 21.4 μg/m3 in 2020, making it the 34th most polluted country in the world. Alves et al. [7] investigated the toxicity, and consequently the health effects, of PM 2.5 is highly dependent on its chemical composition. Dawidowski et al. [8] in addition to health effects, PM2.5 can generate varied climatic and hydrological effects, as it has the potential to alter the amount of solar radiation incident on the surface, alter the distribution of solar energy in the atmosphere, and alter the growth and hygroscopic activity of the cloud condensation nucleus. Wei et al. [cited by 9] conducted a series of experimental studies and verified that PM2.5 is influenced by complex factors, including meteorological conditions, socio-economic activities, and industrial emissions, making accurate predictions essential for managing air quality and mitigating health risks. Chen et al. [cited by 10] investigated and proposed that PM2.5 is a complex mixture composed of chemical components from various sources, each with unique physical properties and uncertain toxicity. Particulate matter is composed of a complex heterogeneous mixture originating from combustion processes, pollen, sea salt, volcanic ash, suspended dust, industrial activities and vehicle transport processes, with variable composition and concentration in time and space. Its origin is attributed to natural and anthropogenic sources.
In island regions, such as the Azores, air quality is influenced by meteorological factors, local emissions and long-distance atmospheric transport processes. The presence of suspended particles can be affected by the action of winds, relative humidity and the occurrence of natural phenomena, such as dust storms coming from the Sahara, or even resulting from fires on the American continent. Furthermore, the formation and dispersion of these particles are directly related to physical and chemical processes that occur in the atmosphere, including photochemical reactions. Li et al. [cited by 11] concluded that PM 2.5 shows different growth rates at different accumulation stages and may be slow to explosive growth depending on the presence of the precursor. Zhen et al. [12] examined that atmospheric particulate matter comprises organic materials, water-soluble inorganic ions, and other substances, making it a comprehensive mixture. It is also composed of metallic elements, which are highly dangerous even in low concentrations.
In this study we also paid attention to PM10. Canu et al. and Shams et al. [13,14] intensely investigated that exposure to ambient PM10 may increase the risk of chronic obstructive pulmonary disease (COPD) and lung function decline. Alves et al. [15] in fact, it is well known that particulate matter with a diameter lower than 10 or 2.5 μm (PM10 and PM2.5, respectively) poses serious health risks. Due to their small size, these particles can penetrate deep into the lungs, leading to a variety of respiratory and cardiovascular diseases. Núnez [cited by 16] the profile of PM10 in the ambient air of the Faial Island is determined by various sources and factors that depend on region’s characteristics. During 2024, there were 4 times that these particles showed an abnormal value, greater than the medium. These episodes are related to the transport of natural particles with origin in arid regions. One this note, dust storms are particularly interesting because they spread large quantities of mineral particles from arid areas of the planet, which are deposited in distant areas. Neff et al. [cited by 17] these relatively small particles receive much attention because they can travel thousands of kilometers through the atmosphere, and they play a major role in radiative forcing of the atmosphere, thereby affecting climate.
The statistical characterization of PM10 and PM2.5 concentrations is essential to understand their temporal variability and identify patterns of occurrence of extreme events. The application of models such as the log-normal distribution and the Weibull distribution are widely used to describe the behavior of these particles in the atmosphere. Wang et al. [18] investigated that the PM10 concentration distribution was simulated using the lognormal, Weibull and Gamma distributions and the best statistical distribution of PM10 concentration in the 5 cities was detected using the sharpest method. The average daily concentration of PM10 in the 5 cities was fitted using the lognormal distribution. Lu [19] examined that from the statistical properties (probability density) of air pollutants, it is easy to estimate how many times the exceedance compared with air quality standards occurs. In this paper, three distributions (lognormal, Weibull, and V-type distribution) were used to simulate the PM10 concentration distribution in areas of Taiwan. The lognormal distribution is the most popular distribution used to adjust the concentration of air pollutants. Mijió et al. [20] proposed that lognormal, Weibull and type V distributions were chosen to fit the data for PM10 in Belgrade. On the other hand, Sánchez [21] the literature shows the distribution of PM2.5 concentration recorded by eight air quality monitoring stations during 2021, covering a large part of the metropolitan region of Santiago de Chile, can be explained by a q-Weibull function. The q-Weibull function is a generalization of the Weibull distribution.
Piotr et al. [cited by 22] proposed that these types of matter (PM2.5 and PM10) are also subjected to different processes of formation and removal from the atmosphere and have a different impact on human health due to varying degrees of absorption and accumulation in the respiratory system. Depending on their origin, they can form separate populations: nucleation mode particles, Aitken mode particles, and accumulation mode particles. Yang et al. [23] said that in this sense, analyzing the correlation between pollutants and meteorological variables also makes it possible to evaluate the main factors that influence their concentrations over time. Interactions between PM2.5 and meteorological factors play a crucial role in air pollution analysis. St. et al. [24] investigated that fine particle having longer residence time in the atmosphere and being mainly influenced by long range transport proved to be less susceptible than the bigger ones not only to the meteorological parameters’ fluctuations but also to the different circulation types. Li et al. [25] examined that annual PM concentrations were negatively correlated with annual precipitation, wind speed, and relative humidity, but were positively correlated with annual atmospheric pressure. Chen et al. [26] this study showed high temperature, humidity, and low rainfall increased the risk of obstructive lung disease. Synergistic effects were observed between temperature, SO2, and PM2.5. The impact of air pollutants on obstructive lung disease must consider these interactions. Lei et al. [27] proposed that temperature was a significant meteorological parameter influencing the correlation between PM2.5 and O3 concentrations, with a coefficient of determination (R2) of 0.83. Under high temperature conditions, PM2.5 and O3 concentrations exhibited a stronger positive correlation. Carvalho et al. [28] investigated that with respect to serious pathologies (asthma, pneumonia, and rhinitis) the results indicate that the presence of primary pollutants such as NO2 and SO2 in the winter and spring months, may contribute to a greater number of individuals with pathologies in study; Interestingly, PM10 are not dependent on these pathologies. Meirelles et al. [29] show that the study mentioned here provides comparison evidence of the significant influence of meteorological variables and air quality on hospital admissions for cardiovascular diseases, hypertension and circulatory system in Faial Island, Azores, over the period 2010 to 2019. Carvalho et al. [30] proposed that results suggest associations between pneumonia and asthma with high SO2 concentrations, positive correlation of surface O3 concentrations with rhinitis cases, and negative correlation with NO2. PM10 has a small negative correlation with pneumonia. All three diseases correlate with each other as well as with O3 and SO2.
The present study aims to analyze the time series of PM10 and PM2.5 on Faial Island, in the Azores archipelago, throughout the year 2024. The research investigates the occurrence of episodes of particulate matter exceedances, identifies statistical patterns and evaluates the relationship between concentrations of particulate matter, meteorological factors (temperature, pressure, wind speed and relative humidity) and atmospheric trace gases (O3 and SO2). Additionally, statistical distributions are applied to model the data and interpret the physical processes underlying the dispersion and removal of these particles from the atmosphere.
Despite the well-documented health and environmental effects of PM10 and PM2.5 in urban and industrialized areas, studies on air quality in islands remain scarce. The Azores, located between Europe and United States, provide a unique setting to investigate the interplay between local emissions, long-range transport of natural aerosols (e.g., Saharan dust, wildfire plumes), and meteorological variability. This study aims to fill this gap by analyzing the temporal variability of PM concentrations in Faial Island, applying statistical models to identify key atmospheric drivers of air pollution in an island context. Therefore, the main objectives of this study are: (i) to characterize the temporal variability of PM10, PM2.5, SO₂ and O₃ concentrations; (ii) to fit appropriate statistical models to their distributions; (iii) to identify critical pollution episodes associated with atmospheric transport events; and (iv) to evaluate the influence of meteorological factors on pollutant dynamics in a North Atlantic island context.
2. Data Collection, Methods and Processing
2.1. Study Area and Data Set
The Azores are a Portuguese archipelago located in the North Atlantic Ocean Basin, approximately between 39° 43’and 36° 55’north latitude and 24° 46’ to 31° 16’ west longitude. The archipelago is made up of nine islands, divided into three groups: eastern group _ São Miguel and Santa Maria, central group _ Terceira, Graciosa, São Jorge, Pico and Faial and western group _ Flores and Corvo. This archipelago is located approximately 1,500 km west of the city of Lisbon and approximately 3,900 km off the east coast of North America, it is shown in Figure 1. The strategic position of the islands allows them to be an important point for climate and oceanic studies, presenting a unique environment due to their volcanic origin and isolated location in the Atlantic.
The Azores Archipelago, with a total area of 2,322 km², is significantly influenced by the Azores High (or Azores Anticyclone), a semi-permanent high-pressure system located in the North Atlantic. This system plays a crucial role in shaping the climate not only of the Azores but also of surrounding regions across the Atlantic basin. According to the NCEP/NCAR reanalysis data (1961–1990) from the National Centers for Environmental Prediction and the National Center for Atmospheric Research, the Azores High is typically centered near the archipelago or to its southwest (SW) or south (S) throughout most of the year. However, during the months of November to January, the center of this anticyclone tends to shift toward the south or southeast (SE). This system is more intense and developed in the summer months when its action extends to around 45ºN, being less intense and developed in spring and autumn. The major axis of the Anticyclone is normally oriented in a Southwest-Northeast direction, except in the months of October to December when the orientation is approximately West to East.
According to Meirelles et al. [cited by 31], the prevailing atmospheric conditions in the Azores are primarily influenced by the position and intensity of the Azores High, the dynamics of the depressions along the Polar Front, and the moderating effect of the ocean—particularly due to the influence of the warm Gulf Stream. Carvalho et al. [32] further emphasize that the archipelago’s proximity to the North Atlantic Subtropical Anticyclone (commonly known as the Azores High) has established the region as a key reference point for the characterization of atmospheric circulation patterns that influence weather in Western Europe.
Air quality analysis in the Azores region is carried out by monitoring primary pollutants (emitted directly into the atmosphere), secondary pollutants (resulting from photochemical reactions, for example) and particulate matter: nitrogen dioxide (NO2), sulphur dioxide (SO2), fine suspended particles with a diameter of less than 10 μm (PM10) and a diameter of less than 2.5 μm (PM2.5), tropospheric ozone (O3) and carbon monoxide (CO). This analysis is based on the characterization carried out at the monitoring station located on the island of Faial, in Espalhafatos, which began sampling in April 2006 and is part of the country’s monitoring network. The station has 5 automatic analyzers that allow continuous and real-time monitoring of pollutants. This rural background station is the only one representing the Azores Region in the National Ambient Air Quality Monitoring Network. In addition, it measures meteorological parameters such as wind speed, temperature, relative humidity, precipitation and solar radiation. The collected data are validated and sent to QualAr [33], the national air quality database, where daily air quality indices and other statistical parameters are made available. Air quality analysis reports are prepared annually. Continuous monitoring of air quality in the region aims to prevent harmful effects on human health and the environment, ensuring that updated information is made available to the public. In the assessment and management of air quality, at least the following pollutants must be considered: sulfur dioxide (SO2), nitrogen dioxide (NO2), nitrogen oxides (NOx), suspended particles (PM10 and PM2.5), lead (Pb), benzene (C6H6), carbon monoxide (CO), ozone (O3), arsenic (As), cadmium (Cd), nickel (Ni) and mercury (Hg).
In this study, we used data for SO₂, O₃, PM2.5, and PM10, measured with certified analyzers: UV fluorescence (TUV-Report 936/21206773/CEN 14212) for SO₂, UV absorption (TUV-Report 936/21205818/CEN 14625) for O₃, and beta radiation (RC 21195EN 14907) for both PM2.5 and PM10. The time series of these pollutants were analyzed using 15-minute intervals over the full year of 2024. Concentrations observed in ambient air reflect both local emissions and long-range transport processes — including contributions from Saharan dust events and biomass burning in South America, which frequently affect the Azores region.To explore annual patterns and variability, Figure 2 displays scatter plots with linear trend lines for PM2.5, PM10, SO₂, and O₃ concentrations throughout 2024.
2.2. Descriptive Statistics for Pollutants Concentration
For the statistical analysis of particulate matter (PM10 and PM2.5) and primary (SO2) and secondary (O3) pollutants, the mean, median, standard deviation, mode, variance, kurtosis, and the 25th, 50th and 75th percentiles were calculated.
2.3. Performance Indicator_ Coefficient of Determination
The coefficient of determination R2 was calculated to verify what proportion of the data variability is explained by the linear regression model. In the context of the time series, it evaluates how well the model can represent observed values over time.
2.4. Probability Distributions
Four theoretical distributions, namely Weibull, gamma, normal and log-normal, distributions are used to fit the entire measured PM2.5 and PM10 data. Mohamed [34] used for parameters estimation; the method of maximum likelihood estimation was selected.
2.5. Exceedances
After accessing the Air Quality Monitoring Portal in the Autonomous Region of the Azores (PMQA) [35] and reviewing the dates of PM2.5 and PM10 exceedance alerts, moderate and severe outliers were identified in the 2024 time series of particulate matter, SO₂, and O₃. For some exceedance periods, Pearson’s correlation coefficients were calculated between the parameters studied.
3. Results and Discussion
3.1. Data Description
The analyzers installed at the Espalhafatos station measure air pollutants every 15 minutes. For one year, 35.137 values are recorded for each pollutant. However, in the series used in this study there is a significant amount of missing data, ranging from 16.593 (PM10) to 20.248 (SO2). As the interest of this study is centered on some periods of the year, those in which alerts were issued due to excess particles in the atmosphere, we consider that the reliability of the analysis is assured. Table 1 shows the values obtained from the statistical analysis carried out on the time series under study.
During the year 2024 the concentration of half of the PM2. 5 performed showed concentrations below 2.48 µg/m³. A kurtosis equal to 85.31 µg/m³ indicates a distribution with very long tails, that is, there are rare events of concentrations with high values. Most PM2. 5 is at low levels, but there are sporadic events of high concentration, which justifies the high kurtosis.
A standard deviation equal to 6.83 µg/m³ indicates that the values obtained for the PM10 time series have greater variability than the values analyzed in the PM2.5 series. A kurtosis value of 6.08 µg/m³ suggests that PM10 particulate matter has a slightly asymmetric distribution with some extreme measurements. The PM10 time series shows greater variation than the PM2.5 time series, indicating more pronounced pollution episodes, but within generally low limits.
The values of SO₂ concentrations throughout the year 2024 showed average values equal to 5.34 µg/m³, with relatively low variability (standard deviation equal to 2.37 µg/m³) and 75% of the measurements are below 6.69 µg/m³. The concentration of SO₂ appears to be relatively uniformly distributed, without large peaks or extreme variations. Most values remain close to the average.
The time series of O3 concentration values indicate that half of the data analyzed presented values below 72.1 µg/m³. A standard deviation equal to 9.74 µg/m³ indicates significant variability for these data. 14.17 µg/m³ is the kurtosis value, indicating the presence of extreme high concentration events. O3 has high average concentrations. Regions with low primary pollution may have higher average O₃ levels due to their secondary formation process and the lower presence of NO, which could remove it from the atmosphere. Kurtosis suggests the occurrence of high peaks that may pose health risks.
The air quality parameters analyzed at the Espalhafatos station suggest acceptable levels for most of the time, but there are episodes of high concentration, especially for PM2.5 and O₃. The large amount of missing data can limit statistical analysis and interpretation of seasonal patterns. The high kurtosis value for PM2.5 and O₃ suggests that there are specific periods of air quality deterioration, which may be related to meteorological events or intermittent emission sources.
3.2. Dispersion
To analyze the dispersion of PM2. 5, PM10, SO2 and O3 Python software (Matplotlib) was used to create boxplot graphs as shown in Figure 3.
The PM2. 5 and SO₂ present distributions concentrated at low values of their concentration, with some extreme events. The concentration data from the PM10 series presents greater variability than the PM2.5 series.
The statistical analysis of pollutant concentrations in 2024 reveals notable variability, particularly for O₃ and PM2.5. O₃ concentrations have a median value of 72.1 μg/m³ and a wide range, indicating the occurrence of high-concentration episodes. PM2.5 values show extreme outliers, which may correspond to critical pollution events.
3.3. Performance Indicator_ Coefficient of Determination
The coefficient of determination R2 = 0.0296 for PM2.5 particles (Graph 2.1). The straight-line equation indicates a higher concentration at the beginning of the year. Graph 2.2 shows the concentration of PM10 particles, with coefficient of determination R2 = 0.0244. This graph shows variations in the concentration of particles over time, with peaks at certain times of the year. The linear trend is slightly increasing. For SO2, the calculations show a coefficient of determination R2 = 0.2748 (Graph 2.3). The initial concentration is high, followed by stabilization at lower values. The linear trend points to a slight decrease over time. Analyzing Graph 2.4, which shows the concentration of O3 in the atmosphere throughout the year 2024, this concentration presents a very high initial peak, followed by stabilization at lower values. The trend line suggests a slight reduction in concentration over time. The coefficient of determination R2 is equal to 0.0606.
The R2 values in the graphs in Figure 2 indicate that linear trends (concentrations versus days of the year) explain little of the variability in the data, suggesting that other factors may significantly influence the concentration of the parameters under analysis. Therefore, 2.96%, 2.44%, 27.5%, and 6.06% of the variability of the dependent variable is explained by the independent variables included in the regression model. Meaning that the model has little explanatory power, suggesting that the relationship between the variables may be weak. 97.04%, 97.56, 72.5% and 93.94% of the variability in the data is not explained by the model and may be influenced by other factors not included. Graphs 2.1 to 2.4 show distinct patterns, with some showing large spikes and others showing clearer stabilization. Most series have a slightly decreasing trend, except for Graph 2.2, where the slope of the line is positive.
3.4. Probability Distributions for PM2.5 and PM10
Statistical modeling of the concentration of airborne particles, such as PM2. 5 and PM10, is essential to understand their variability and environmental impact. The application of appropriate statistical distributions allows the behavior of these concentrations to be accurately described, facilitating predictions, risk assessments and the formulation of environmental policies. Statistical distributions such as Weibull, Lognormal, Normal, and Gamma are commonly employed to model natural phenomena characterized by asymmetry and variability. For example, Lu [36] used these three theoretical distributions—lognormal, Weibull, and Pearson type V—to fit the distribution of PM10 concentrations at five air monitoring stations in Taiwan from 1995 to 1999.
In this study, we applied these same distributions to the particulate matter concentrations under investigation. Figure 4 illustrates the fits of the Weibull, Lognormal, Normal, and Gamma distributions to the data, highlighting the patterns in the observed concentrations. Additionally, to further clarify the fitting process, the mathematical equations (1), (2), (3), and (4) for the Normal, Lognormal, Weibull, and Gamma distributions are provided below:
- -
- Normal Distribution:
μ is the mean,
σ is the standard deviation,
is the random variable.
- -
- Lognormal Distribution:
μ is the mean of the natural logarithm of ,
σ is the standard deviation of the natural logarithm of .
- -
- Weibull Distribution:
is the shape parameter,
is the scale parameter.
- -
- Gamma Distribution:
is the shape parameter,
is the scale parameter,
is the gamma function.
These mathematical expressions accurately describe the theoretical behavior of the PM2.5 and PM10 concentrations modeled in this study.
Both distributions (Graphics 4.1 and 4.2) present asymmetry to the right, the PM10 distribution is more elongated, indicating greater variability and the presence of extreme values. The distribution of PM2. 5 is more concentrated, while PM10 has a longer tail. In the case of PM2. 5, Lognormal distribution is the one that presents the best fit. PM10 particles present greater variability than PM2. 5, which may indicate different sources or dispersion processes in the environment. The longer tail of the PM10 distribution suggests that high concentration events are more common for these particles than for PM2. 5. PM10 concentration tends to follow asymmetric distributions due to emission and deposition processes, in which case the distribution that best fits is Gamma. The histograms show that both distributions are skewed to the right, indicating that there is a majority of low values, with some sporadic high concentration events. These events may be associated with intermittent sources such as dust storms or irregular industrial emissions.
As mentioned previously, to analyze the distribution pattern of PM2.5 and PM10 concentrations recorded on Faial Island, four theoretical distributions were fitted to the empirical data: Normal, Weibull, Gamma, and Lognormal. Table 2 and Table 3 shows respectively the fitted parameters for the four PM2.5 and PM10 distributions.
After it was assessed the Kolmogorov-Smirnov test, Akaike Information Criterion (AIC = 2k – 2ln(L), K (number of model parameters), L (likelihood function value)) and Bayesian Information Criterion (BIC = K ln(n) – 2 ln(L), n (number of observations)). These criteria are essential to assess the suitability of each model. Table 4 shows the results of these tests for PM2. 5 and Table 5 for PM10.
Among the tested models, the Lognormal distribution exhibited the best fit, showing the lowest KS statistic (0.044) and the lowest AIC (68,7259) and BIC (68,7415) values. This suggests that PM2.5 concentrations are positively skewed and better represented on a logarithmic scale, which is consistent with findings in atmospheric pollution literature.
For PM10 the quality of fit was evaluated using the KS test, along with the AIC and BIC. Among the distributions tested, the Gamma distribution exhibited the best overall performance: it had the lowest KS statistic (0.045), indicating minimal deviation between the empirical and theoretical distributions. It produced the lowest AIC (114,488) and BIC (114,504) values, confirming the best trade-off between model fit and complexity. Although all p-values were very small due to the large sample size, a common occurrence in environmental data, the Gamma distribution still yielded the highest p-value among the alternatives. These results strongly support the use of the Gamma distribution for modeling PM10 concentrations at this location. Its ability to capture the right-skewed and heavy-tailed nature of the observed data makes it particularly suitable for simulating pollution levels, estimating exceedance probabilities, and conducting environmental risk assessments.
To estimate possible critical episodes of PM2. 5 the Probability Density Function (PDF) and the Cumulative Distribution Function (CDF) were calculated. These functions can be seen in Figure 5.
The histogram and PDF reveal that the PM2. 5 tend to cluster between 1 and 4 µg/m³, with the median close to 2.6 µg/m³, below the limits harmful to health recommended by the World Health Organization (WHO). The CDF allows precise estimation of exceedance probabilities. For instance, the probability of exceeding the 15 µg/m³ WHO daily guideline is below 0.5%, suggesting that critical pollution events are rare, but should not be entirely disregarded in risk planning. The lognormal shape implies a positively skewed distribution, meaning that while high concentration events are infrequent, they can reach extreme values, posing episodic health and environmental risks. The same statistical treatment was applied to PM10, Figure 6.
From Figure 6 to PDF analysis shows a distribution with positive asymmetry, characterized by a density peak at the lowest concentrations and a long tail on the right, where episodes of greatest pollution are concentrated. This configuration is typical of environmental phenomena influenced by multiple sources and meteorological variability, as is the case with fine particulate matter. Such characteristics make the use of symmetric models such as the normal distribution unfeasible, and point to asymmetric distributions such as Weibull, Lognormal and Gamma as more appropriate options. The CDF reinforces this observation by representing the cumulative probability of occurrence of concentrations below certain reference values. This function allows, for example, to accurately determine the probability of exceeding regulatory limits (e.g., 25 µg/m³) useful in risk assessments and air quality management.
3.4. Exceedances
The Diário da República, the official gazette of Portugal, defines the upper and lower assessment thresholds for ambient air pollutant SO₂ concentrations in a zone or agglomeration for health and vegetation safety, as presented in Table 6 [37].
Based on the reference mentioned above, Table 7 presents the upper and lower assessment thresholds for particulate matter.
Continuing with the same legislative reference, Table 8 presents the information and alert thresholds for ozone (O₃) concentrations, as defined in Portuguese legislation [37]. These thresholds aim to inform the public and guide actions during episodes of elevated ozone levels.
Similarly, Table 9 summarizes the limit values for PM10 concentrations established to protect human health, also based on the same official source.
In the context of the 2024 dataset, a correlation analysis was conducted between PM2.5 and PM10 concentrations (including exceedance periods) and the levels of SO₂ and O₃, with the goal of understanding their combined influence on air quality and the potential implications for public health and the environment. This analysis takes into account the threshold values established in the Portuguese Official Gazette [37], including the upper and lower assessment levels for each pollutant and the information and alert thresholds for ozone.
3.4.1. PM2.5
Anomalies in the PM2.5 time series for 2024 were identified by calculating moderate and severe outliers, as illustrated in Figure 7 and Figure 8, respectively.
The PM2.5 time series for 2024 includes 961 observations classified as moderate outliers (values exceeding 7.94 μg/m³) and 373 observations classified as severe outliers (values above 11.75 μg/m³). Despite these elevated concentrations, no official alerts were issued during the year for exceedances of PM2.5 thresholds.These extreme values may reflect anomalous atmospheric events, particularly the long-range transport of air masses carrying mineral dust from North Africa (Sahara). Alternatively, they could also be associated with smoke plumes from wildfires in North America, Europe, or the Amazon region, which are occasionally transported across the North Atlantic and affect the Azores.
3.4.2. PM10
Following the same approach applied to PM2.5, the PM10 time series for 2024 was also analyzed to detect anomalies. Figure 9 and Figure 10 illustrate the distribution of moderate and severe outliers, respectively, identified through this analysis.
The analysis of the PM10 time series for 2024 identified 1201 observations exceeding 21.595 μg/m³, classified as moderate outliers. In addition, 314 observations were considered severe outliers, with concentrations above 31.69 μg/m³.In January, the Portuguese Environment Agency (APA) issued PM10 exceedance alerts for the 26th and 27th. Table 10 summarizes the meteorological conditions observed on those days [38,39].
During the January alert period, the maximum recorded PM10 concentration reached 22.8 μg/m³ over a duration of 1 hour and 45 minutes—falling within the range classified as a moderate outlier.A second PM10 exceedance alert was issued by the Portuguese Environment Agency (APA) between February 2nd and 6th. Table 11 details the meteorological conditions associated with this episode [40,41,42,43].
During the four days in February for which PM10 exceedance alerts were issued, the maximum particulate concentration reached 28.2 μg/m³, sustained over a period of 6 hours and 15 minutes—within the range of moderate outliers. Despite not reaching severe thresholds, the recurrence and persistence of the associated synoptic pattern over multiple consecutive days underscores the region’s pronounced vulnerability to Saharan dust transport events, with potential consequences for ambient air quality and public health.In April, the Azores Archipelago was again placed under alert for elevated PM10 levels over a three-day period. The corresponding meteorological conditions, as reported by the Portuguese Environment Agency (APA), are summarized in Table 12 [44,45,46].
Between April 14 and 16, the Azores experienced a Saharan dust intrusion event, driven by specific synoptic conditions that facilitated long-range atmospheric transport from North Africa. Although the episode led to elevated PM10 concentrations, its impact was partially mitigated by precipitation, which contributed to the removal of particulates from the atmosphere.Later in the year, on November 11, the Portuguese Environment Agency (APA) issued another PM10 exceedance alert affecting air quality in the Azores. The meteorological context of this event is detailed in Table 13 [47].
On November 11, 2024, the Azores were once again impacted by a Saharan dust intrusion, facilitated by a southeasterly atmospheric circulation pattern. This event led to elevated PM10 concentrations, though partially attenuated by precipitation. On that day, the population was exposed for a period of 3 hours to a PM10 concentration of 41.4 μg/m³—a value classified as a severe outlier. A subsequent PM10 exceedance episode occurred between December 27 and 29, 2024. The associated meteorological conditions are summarized in Table 14 [48,49,50].
Projections from atmospheric dispersion models suggested that the episode would persist in the following days, emphasizing the prolonged nature of the favorable meteorological conditions for particle intrusion during this period.
3.4.3. PM10 Dust Surface Concentration Maps
Forecast maps for dust transport from arid regions, which depict the surface concentration of particles at 0, 6, 12, and 18 UTC, are provided by the Copernicus Atmosphere Monitoring Service (CAMS) and the University of Athens. These maps offer valuable insights into the temporal and spatial distribution of dust concentrations, aiding in the assessment of potential impacts on air quality. Figure 11 (renumbered hereafter) illustrates these forecast maps, showing the predicted dust transport dynamics over the study period.
The regions most affected by the Saharan dust transport included much of southern Europe—namely Spain, France, Italy, and Greece—as well as the Eastern Mediterranean. Notably, during the episodes in November and December, a significant dispersion of dust towards the Northeast Atlantic was also observed, encompassing the Azores region. This pattern highlights that Saharan dust transport is not restricted to the European continent; it also extends to insular areas of the Atlantic. This finding underscores the importance of integrating these territories into atmospheric and environmental impact assessments, as they are susceptible to dust intrusions with potential implications for air quality, public health, and environmental monitoring.
3.5. Correlations
3.5.1. Correlations Between Particulate Matter PM2.5 and PM10 and the Atmospheric Pollutants O₃ and SO₂
An analysis of the correlations between PM2.5, PM10, SO₂, and O₃ was conducted using hourly data from 2024, with a consistent dataset containing 20,265 simultaneous observations for all variables. Pearson and Spearman coefficients were used to assess relationships. In Table 15 the results reveal distinct interaction patterns among these parameters.
The correlation analysis revealed a weak and negative association between PM2.5 and O₃ concentrations (Pearson = –0.093; Spearman = –0.081), indicating a slight tendency for ozone levels to decline as fine particulate concentrations increase. This inverse relationship may be attributed to the attenuation of solar radiation under polluted conditions, which limits the photochemical reactions necessary for ozone formation. In contrast, the relationship between PM2.5 and SO₂ was negligible (Pearson = +0.022; Spearman = –0.048), suggesting the absence of a meaningful linear or monotonic association. Although SO₂ is a known precursor of secondary aerosols, this mechanism does not appear to be significantly reflected in the observed dataset. Similarly, the correlation between PM10 and SO₂ was weak and negative (Pearson = –0.026; Spearman = –0.030), implying that, despite potentially sharing emission sources such as fossil fuel combustion, these pollutants did not display temporally aligned concentration patterns. The most pronounced association was found between PM10 and O₃, which exhibited a moderate negative correlation (Pearson = –0.125). This finding supports the hypothesis that elevated levels of coarse particulate matter may inhibit ozone formation, either by scattering and absorbing solar radiation or by interfering with atmospheric photochemical pathways.
3.5.2. Correlations/Time Lags Between O₃ and SO₂.
The correlation analysis between ozone (O₃) and sulfur dioxide (SO₂) concentrations revealed a positive and statistically meaningful association. The Pearson correlation coefficient was 0.237, indicating a moderate linear relationship, while the Spearman coefficient was slightly higher at 0.289, suggesting a somewhat stronger monotonic trend (Table 16). These results indicate that increases in SO₂ concentrations are generally accompanied by increases in O₃ levels, albeit with a modest strength of association. This correlation may reflect the influence of common emission sources—such as urban combustion processes—or the effect of shared meteorological drivers, including ambient temperature, solar radiation intensity, and boundary layer dynamics. Nevertheless, it is important to emphasize that correlation does not imply causation.
To further investigate the temporal dynamics between SO₂ and O₃, a simple linear regression model was developed, in which SO₂ concentrations were lagged by three hours — the time offset that yielded the strongest Pearson correlation with O₃. This lag structure allows for the assessment of whether prior levels of sulfur dioxide could statistically explain subsequent variations in ozone concentrations. The model is expressed in Equation (5):
where:
- is the observed ozone concentration at time ,
- the sulfur dioxide concentration measured at a previous time (with a time lag , e.g., 3 hours),
- ntercept of the regression line (value of when is zero),
- regression coefficient (slope) indicating how much changes per unit change in lagged ,
- random error term (residuals) capturing the variation not explained by the model.
The model yielded a statistically significant positive relationship between lagged SO₂ concentrations and ozone levels, with an estimated regression coefficient β1=1.005\beta_1 = 1.005β1=1.005 (p < 0.001). This result suggests that increases in SO₂ are typically followed, after a three-hour lag, by corresponding increases in O₃ concentrations.
However, despite the statistical significance, the model’s explanatory power remains limited. The coefficient of determination (R2=0.056R^2 = 0.056R2=0.056) indicates that lagged SO₂ levels account for only 5.6% of the variability in ozone concentrations, highlighting the influence of other atmospheric processes and precursor pollutants. These results are summarized in Figure 12.
3.5.3. Time Lags Between PM₂.₅ and SO₂
To explore the potential temporal association between sulfur dioxide (SO₂) and fine particulate matter (PM₂.₅), a simple linear regression model was constructed, as shown in Equation (6). In this analysis, the PM₂.₅ time series was lagged by 6 hours, which corresponded to the time shift yielding the highest absolute Pearson correlation with SO₂ concentrations.
The model assumes that variations in earlier PM₂.₅ levels may help explain subsequent changes in SO₂ concentrations. Mathematically, the relationship is described as:
where:
- is the sulfur dioxide concentration at time ,
- is the concentration of fine particulate matter at a previous time (in this case, 6 hours),
- ntercept,
- is the slope coefficient representing the change in SO₂ per unit change in lagged PM₂.₅,
- is the error term accounting for unexplained variability.
In this study, the optimal time lag was determined to be six hours. The objective of the model was to assess whether future PM₂.₅ concentrations could reflect past levels of SO₂ (Figure 13), potentially due to shared emission sources or the formation of secondary aerosols.
The regression model demonstrated statistical significance (p < 0.001), with a negative regression coefficient of -0.033. This implies that higher concentrations of PM₂.₅, occurring approximately six hours after the observed SO₂ levels, were associated with a slight decrease in SO₂ concentrations. However, the coefficient of determination (R² = 0.002) indicated that the model only explains 0.2% of the variability in SO₂ levels, suggesting that the relationship between these two pollutants is weak and likely influenced by factors not captured by the model.
4. Conclusions
Considering PM2.5 concentrations, the strong alignment with the lognormal distribution supports its use in future simulations, air quality forecasts, and public health risk assessments in the Azores. The estimated exceedance probabilities provide a valuable tool for informing early warning systems, exposure limits, and emergency response strategies. Incorporating lognormal-based models into regional air quality management plans may enhance the ability to predict and mitigate extreme pollution events, even in relatively clean and remote Atlantic environments.
For PM10, the combined analysis of the Probability Density Function (PDF) and the Cumulative Distribution Function (CDF) confirms that the Gamma distribution offers the best statistical fit among the tested models. This provides a solid foundation for predictive modeling, scenario simulation of extreme episodes, and public health policy support in the Azores.
Overall, the results highlight the complex, often non-linear interactions between particulate matter, atmospheric trace gases, and meteorological conditions. Although a statistically significant relationship was found between SO₂ and O₃ concentrations (with a time lag), the low explanatory power (R² = 5.6%) indicates that other factors—such as solar radiation, temperature, and atmospheric dynamics—play a dominant role. Similarly, the weak relationship between SO₂ and PM2.5 concentrations suggests that emission sources and chemical transformation processes should be further investigated.
This study emphasizes the need for continuous, high-resolution air quality monitoring and the development of multivariate models that integrate meteorological, chemical, and transport processes to better predict pollution episodes. Future research should prioritize the combined use of satellite observations, numerical weather prediction models, and machine learning techniques to improve the early detection and forecasting of Saharan dust intrusion events.
The documented frequency and persistence of Saharan dust episodes over the Azores in 2024 underscore the necessity to enhance particulate matter surveillance and health impact assessments, particularly in vulnerable island communities. While these intrusions are natural in origin, they can exacerbate respiratory and cardiovascular risks, warranting the implementation of targeted public health interventions and communication strategies tailored to insular regions.
Author Contributions
Conceptualization, M.M. and H.C.V.; methodology, M.M.; software, M.M.; validation, H.C.V.; formal analysis, H.C.V.; investigation, M.M.; data curation, M.M.; writing—original draft preparation, M.M.; writing—review and editing, H.C.V. All authors have read and agreed to the published version of the manuscript.
Funding
This research received no external funding.
References
- Kumar, R.P.; Singh, R.; Kumar, P.; Kumar, R.; Nahid, S.; Singh, S.K.; Nijjar, C.S. Aerosol-PM2.5 Dynamics: In-situ and satellite observations under the influence of regional crop residue burning in post-monsoon over Delhi-NCR, India. Environ. Res. 2024, 255, 119141. [Google Scholar] [CrossRef]
- Henning, R.J. Particulate Matter Air Pollution is a Significant Risk Factor for Cardiovascular Disease. Curr. Probl. Cardiol. 2023, 49, 102094. [Google Scholar] [CrossRef]
- Nguyen, T.T.N.; Vu, T.D.; Vuong, N.L.; Pham, T.V.L.; Le, T.H.; Tran, M.D.; Künzli, N.; Morgan, G. Effect of ambient air pollution on hospital admission for respiratory diseases in Hanoi children during 2007–2019. Environ. Res. 2023, 241, 117633. [Google Scholar] [CrossRef] [PubMed]
- Vallero, D. Respiratory Effects of Air Pollutants, in Fundamentals of Air Pollution, Fifth Ed. ed; Academic Press: Cambridge, MA, USA, 2014; pp. 247–256. ISBN 9780124017337. [Google Scholar] [CrossRef]
- Wei, Q.; Chen, Y.; Zhang, H.; Jia, Z.; Yang, J.; Niu, B. Simulation and prediction of PM2.5 concentrations and analysis of driving factors using interpretable tree-based models in Shanghai, China. Environ. Res. 2025, 270, 121003. [Google Scholar] [CrossRef] [PubMed]
- Son, R.; Stratoulias, D.; Kim, H.C.; Yoon, J.-H. Estimation of surface PM2.5 concentrations from atmospheric gas species retrieved from TROPOMI using deep learning: Impacts of fire on air pollution over Thailand. Atmospheric Pollut. Res. 2023, 14. [Google Scholar] [CrossRef]
- Alves, C.; Evtyugina, M.; Vicente, E.; Vicente, A.; Rienda, I.C.; de la Campa, A.S.; Tomé, M.; Duarte, I. PM2.5 chemical composition and health risks by inhalation near a chemical complex. J. Environ. Sci. 2022, 124, 860–874. [Google Scholar] [CrossRef]
- Dawidowski, L.; Constantin, J.G.; Murillo, J.H.; Gómez-Marín, M.; Nogueira, T.; Jiménez, S.B.; Díaz-Suárez, V.; Victorica, F.B.; Lichtig, P.; Resquin, M.D.; et al. Carbonaceous fraction in PM2.5 of six Latin American cities: Seasonal variations, sources and secondary organic carbon contribution. Sci. Total. Environ. 2024, 948, 174630. [Google Scholar] [CrossRef]
- Wei, Q.; Zhang, H.; Yang, J.; Niu, B.; Xu, Z. PM2.5 concentration prediction using a whale optimization algorithm based hybrid deep learning model in Beijing, China. Environ. Pollut. 2025, 371, 125953. [Google Scholar] [CrossRef]
- Chen, S.; Liu, D.; Huang, L.; Guo, C.; Gao, X.; Xu, Z.; Yang, Z.; Chen, Y.; Li, M.; Yang, J. Global associations between long-term exposure to PM2.5 constituents and health: A systematic review and meta-analysis of cohort studies. J. Hazard. Mater. 2024, 474, 134715. [Google Scholar] [CrossRef]
- Li, H.; Zhang, T.; Su, H.; Liu, S.X.; Shi, Y.Q.; Wang, L.Y.; Xu, D.D.; Zhou, J.M.; Zhao, Z.Z.; Wang, Q.Y.; et al. Factors affecting the different growth rates of PM2.5:Evidence from composition variation, formation mechanisms, and importance analysis of water-soluble inorganic ions with case study in northern China. Atmospheric Environ. 2024, 340. [Google Scholar] [CrossRef]
- Zhen, S.; Luo, M.; Xin, F.; Ma, L.; Xu, D.; Cheng, X.; Shao, Y. Chemical composition, source distribution and health risk assessment of PM2.5 and PM10 in Beijing. Atmospheric Pollut. Res. 2025, 16. [Google Scholar] [CrossRef]
- Canu, I.G.; Wild, P.; Charreau, T.; Freund, R.; Toto, A.; Pralong, J.; Sakthithasan, K.; Jouannique, V.; Debatisse, A.; Suarez, G. Long-term exposure to PM10 and respiratory health among Parisian subway workers. Int. J. Hyg. Environ. Heal. 2023, 256, 114316. [Google Scholar] [CrossRef] [PubMed]
- Kalantary, S.; Jahani, A.; Shams, S.M.P.; Kalantari, B.; Singh, D.; Moeinnadini, M.; Choi, Y. Assessing the effectiveness of artificial neural networks (ANN) and multiple linear regressions (MLR) in forcasting AQI and PM10 and evaluating health impacts through AirQ+ (case study: Tehran). Environ. Pollut. 2023, 338, 122623. [Google Scholar] [CrossRef]
- Alves, C.A.; de la Campa, A.S.; Cipoli, Y.; Furst, L.; Higawa, G.; Leitão, A.; da Silva, A.V.; Feliciano, M.S. PM10-bound elements in Luanda's urban atmosphere: Concentrations, sources, and their environmental and health impacts. Environ. Pollut. 2025, 372, 125995. [Google Scholar] [CrossRef] [PubMed]
- Núñez, A.; Moreno, D.A.; García, A.M. Saharan dust storms affecting the center of the Iberian Peninsula: Effect on the urban aerobiome. Atmospheric Environ. 2024, 328. [Google Scholar] [CrossRef]
- Neff, J.C.; Reynolds, R.L.; Munson, S.M.; Fernandez, D.; Belnap, J. The role of dust storms in total atmospheric particle concentrations at two sites in the western U.S. J. Geophys. Res. Atmos. 2013, 118, 11–201. [Google Scholar] [CrossRef]
- Xi, W.; Jie, C.R.; Heng, C.B.; Dong, K.H. Application of statistical distribution of PM10 concentration in air quality management in 5 representative cities of China. . 2013, 26. [Google Scholar] [CrossRef]
- Lu, H.-C. The statistical characters of PM10 concentration in Taiwan area. Atmospheric Environ. 2002, 36, 491–502. [Google Scholar] [CrossRef]
- Mijić, Z.; Tasić, M.; Rajšić, S.; Novaković, V. The statistical characters of PM10 in Belgrade area. Atmospheric Res. 2009, 92, 420–426. [Google Scholar] [CrossRef]
- Sánchez, E. Q-Weibull distribution to explain the PM2.5 air pollution concentration in Santiago de Chile. Eur. Phys. J. B 2023, 96, 1–8. [Google Scholar] [CrossRef]
- Kunecki, P.; Franus, W.; Wdowin, M. Statistical study and physicochemical characterization of particulate matter in the context of Kraków, Poland. Atmospheric Pollut. Res. 2019, 11, 520–530. [Google Scholar] [CrossRef]
- Yang, Q.; Yuan, Q.; Li, T.; Shen, H.; Zhang, L. The Relationships between PM2.5 and Meteorological Factors in China: Seasonal and Regional Variations. Int. J. Environ. Res. Public Health 2017, 14, 1510. [Google Scholar] [CrossRef]
- Pateraki, S.; Asimakopoulos, D.N.; Flocas, H.A.; Maggos, T.; Vasilakos, C. The role of meteorology on different sized aerosol fractions (PM10, PM2.5, PM2.5–10). Sci. Total Environ. 2012, 419, 124–135. [Google Scholar] [CrossRef]
- Li, X.; Chen, X.; Yuan, X.; Zeng, G.; León, T.; Liang, J.; Chen, G.; Yuan, X. Characteristics of Particulate Pollution (PM2.5 and PM10) and Their Spacescale-Dependent Relationships with Meteorological Elements in China. Sustainability 2017, 9, 2330. [Google Scholar] [CrossRef]
- Chen, T.Y.; Chen, S.C.; Wang, C.W.; et al. The impact of the synergistic effect of SO2 and PM2.5/PM10 on obstructive lung disease in subtropical Taiwan. Front Public Health 2023, 11, 1229820. [Google Scholar] [CrossRef] [PubMed] [PubMed Central]
- Wang, L.; Zhao, B.; Zhang, Y.; Hu, H. Correlation between surface PM2.5 and O3 in eastern China during 2015–2019: Spatiotemporal variations and meteorological impacts. Atmospheric Environ. 2022, 294. [Google Scholar] [CrossRef]
- M, M. Weather and Air Quality Factors Contribution to the Hospital Admissions of Patients with Respiratory Diseases: Case Study of Faial Island (Azores). Int. J. Environ. Sci. Nat. Resour. 2022, 31, 556305. [Google Scholar] [CrossRef]
- Meirelles, M.; Carvalho, F.; Ferreira, A.; Vasconcelos, H.C. Meteorological and Environmental Drivers of Cardiovascular Health Risk in an Insular Region (Azores). Cardiol. Cardiovasc. Res. 2025, 9, 1–24. [Google Scholar] [CrossRef]
- Carvalho, F.; Meirelles, M.; Martins, D.; Vasconcelos, H.C. Yearly Assessment of Weather and Air Quality Impact on Respiratory Disease Hospitalizations: Faial Island (Azores) Study. Am. J. Heal. Res. 2024, 12, 165–178. [Google Scholar] [CrossRef]
- Meirelles, M.; Carvalho, F.; Porteiro, J.; Henriques, D.; Navarro, P.; Vasconcelos, H. Climate Change and Impact on Renewable Energies in the Azores Strategic Visions for Sustainability. Sustainability 2022, 14, 15174. [Google Scholar] [CrossRef]
- Carvalho, F.S.; Meirelles, M.G.; Henriques, D.; Porteiro, J.; Navarro, P.; Vasconcelos, H.C. Climate Change and Extreme Events in Northeast Atlantic and Azores Islands Region. Climate 2023, 11, 238. [Google Scholar] [CrossRef]
- https://qualar.apambiente.pt. Accessed to 20/03/2025.
- N, N.M.; Abdullah, M.; Tan, C.-Y.; Ramli, N.; Yahaya, A.; Fitri, N. Modelling of PM10 concentration for industrialized area in Malaysia: A case study in Shah Alam. Phys. Procedia 2011, 22, 318–324. [Google Scholar] [CrossRef]
- https://ambiente.azores.gov.pt/qualidadedoar/Default.aspx. (accessed on 24 March 2025).
- Lu, H.-C.; Fang, G.-C. Predicting the exceedances of a critical PM10 concentration—a case study in Taiwan. Atmospheric Environ. 2003, 37, 3491–3499. [Google Scholar] [CrossRef]
- Decreto Legislativo Regional nº 32/2012/A, Diário da República 1ª Série, 135, 3706. https://files.diariodarepublica.pt/gratuitos/1s/2012/07/13500.pdf. (accessed on 25 March 2025).
- Portuguese Environment Agency (APA). https://ambiente.azores.gov.pt/qualidadedoar/store/Uploads/AlertasNotas/previsao_en_2024_01_26_acores.pdf. (accessed on 30 March 2025).
- Portuguese Environment Agency (APA). https://ambiente.azores.gov.pt/qualidadedoar/store/Uploads/AlertasNotas/previsao_en_2024_01_27_acores.pdf. (accessed on 30 March 2025).
- Portuguese Environment Agency (APA). https://ambiente.azores.gov.pt/qualidadedoar/store/Uploads/AlertasNotas/previsao_en_2024_02_02.pdf. (accessed on 30 March 2025).
- Portuguese Environment Agency (APA). https://ambiente.azores.gov.pt/qualidadedoar/store/Uploads/AlertasNotas/previsao_en_2024_02_04.pdf. (accessed on 30 March 2025).
- Portuguese Environment Agency (APA). https://ambiente.azores.gov.pt/qualidadedoar/store/Uploads/AlertasNotas/previsao_en_2024_02_05.pdf. (accessed on 30 March 2025).
- Portuguese Environment Agency (APA). https://ambiente.azores.gov.pt/qualidadedoar/store/Uploads/AlertasNotas/previsao_en_2024_02_06.pdf. (accessed on 30 March 2025).
- Portuguese Environment Agency (APA). https://ambiente.azores.gov.pt/qualidadedoar/store/Uploads/AlertasNotas/previsao_en_2024_04_14.pdf. (accessed on 25 April 2025).
- Portuguese Environment Agency (APA). https://ambiente.azores.gov.pt/qualidadedoar/store/Uploads/AlertasNotas/previsao_en_2024_04_15.pdf. (accessed on 25 April 2025).
- Portuguese Environment Agency (APA). https://ambiente.azores.gov.pt/qualidadedoar/store/Uploads/AlertasNotas/previsao_en_2024_04_16.pdf. (accessed on 25 April 2025).
- Portuguese Environment Agency (APA). https://ambiente.azores.gov.pt/qualidadedoar/store/Uploads/AlertasNotas/previsao_en_2024_11_11.pdf. (accessed on 25 April 2025).
- Portuguese Environment Agency (APA). https://ambiente.azores.gov.pt/qualidadedoar/store/Uploads/AlertasNotas/previsao_en_2024_12_27.pdf. (accessed on 25 April 2025).
- Portuguese Environment Agency (APA). https://ambiente.azores.gov.pt/qualidadedoar/store/Uploads/AlertasNotas/previsao_en_2024_12_28.pdf. (accessed on 25 April 2025).
- Portuguese Environment Agency (APA). https://ambiente.azores.gov.pt/qualidadedoar/store/Uploads/AlertasNotas/previsao_en_2024_12_29.pdf. (accessed on 25 April 2025).
Figure 1.
Location of the Azores archipelago.
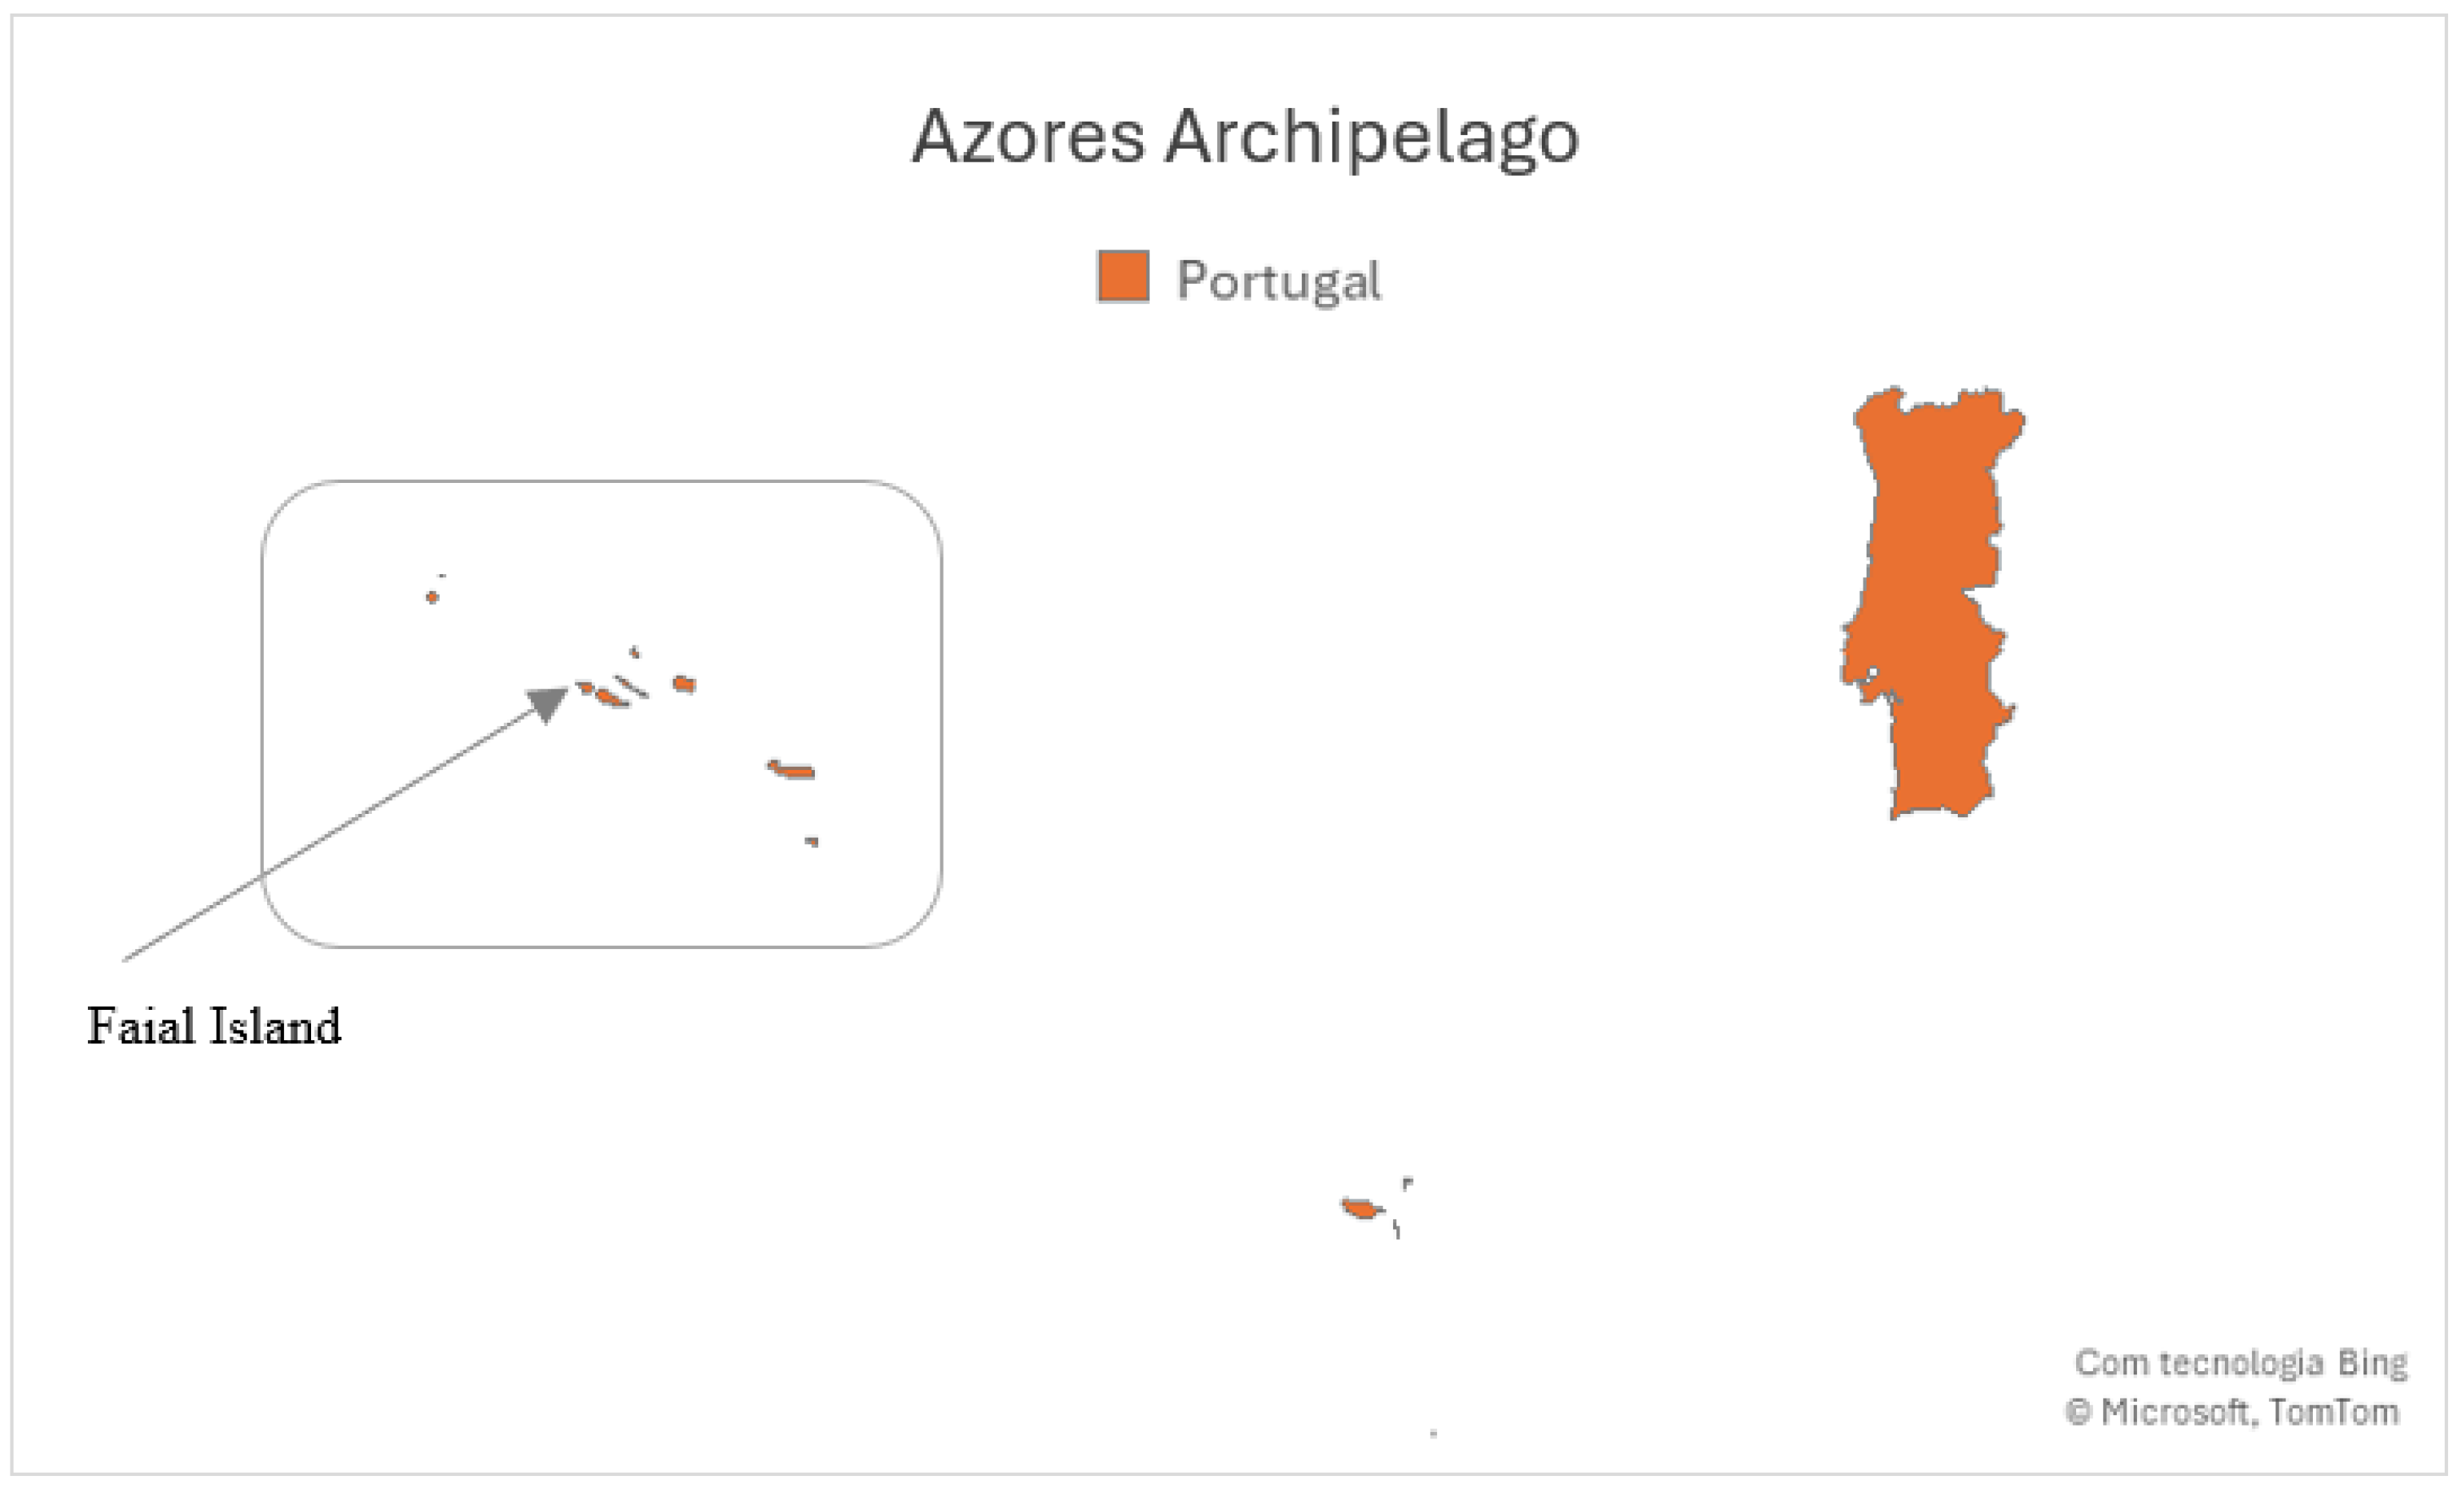
Figure 2.
Concentrations observed at Espalhafatos station (2024): 2.1_PM2.5, 2.2_PM10, 2.3_SO2 and 2.4_O3.
Figure 2.
Concentrations observed at Espalhafatos station (2024): 2.1_PM2.5, 2.2_PM10, 2.3_SO2 and 2.4_O3.
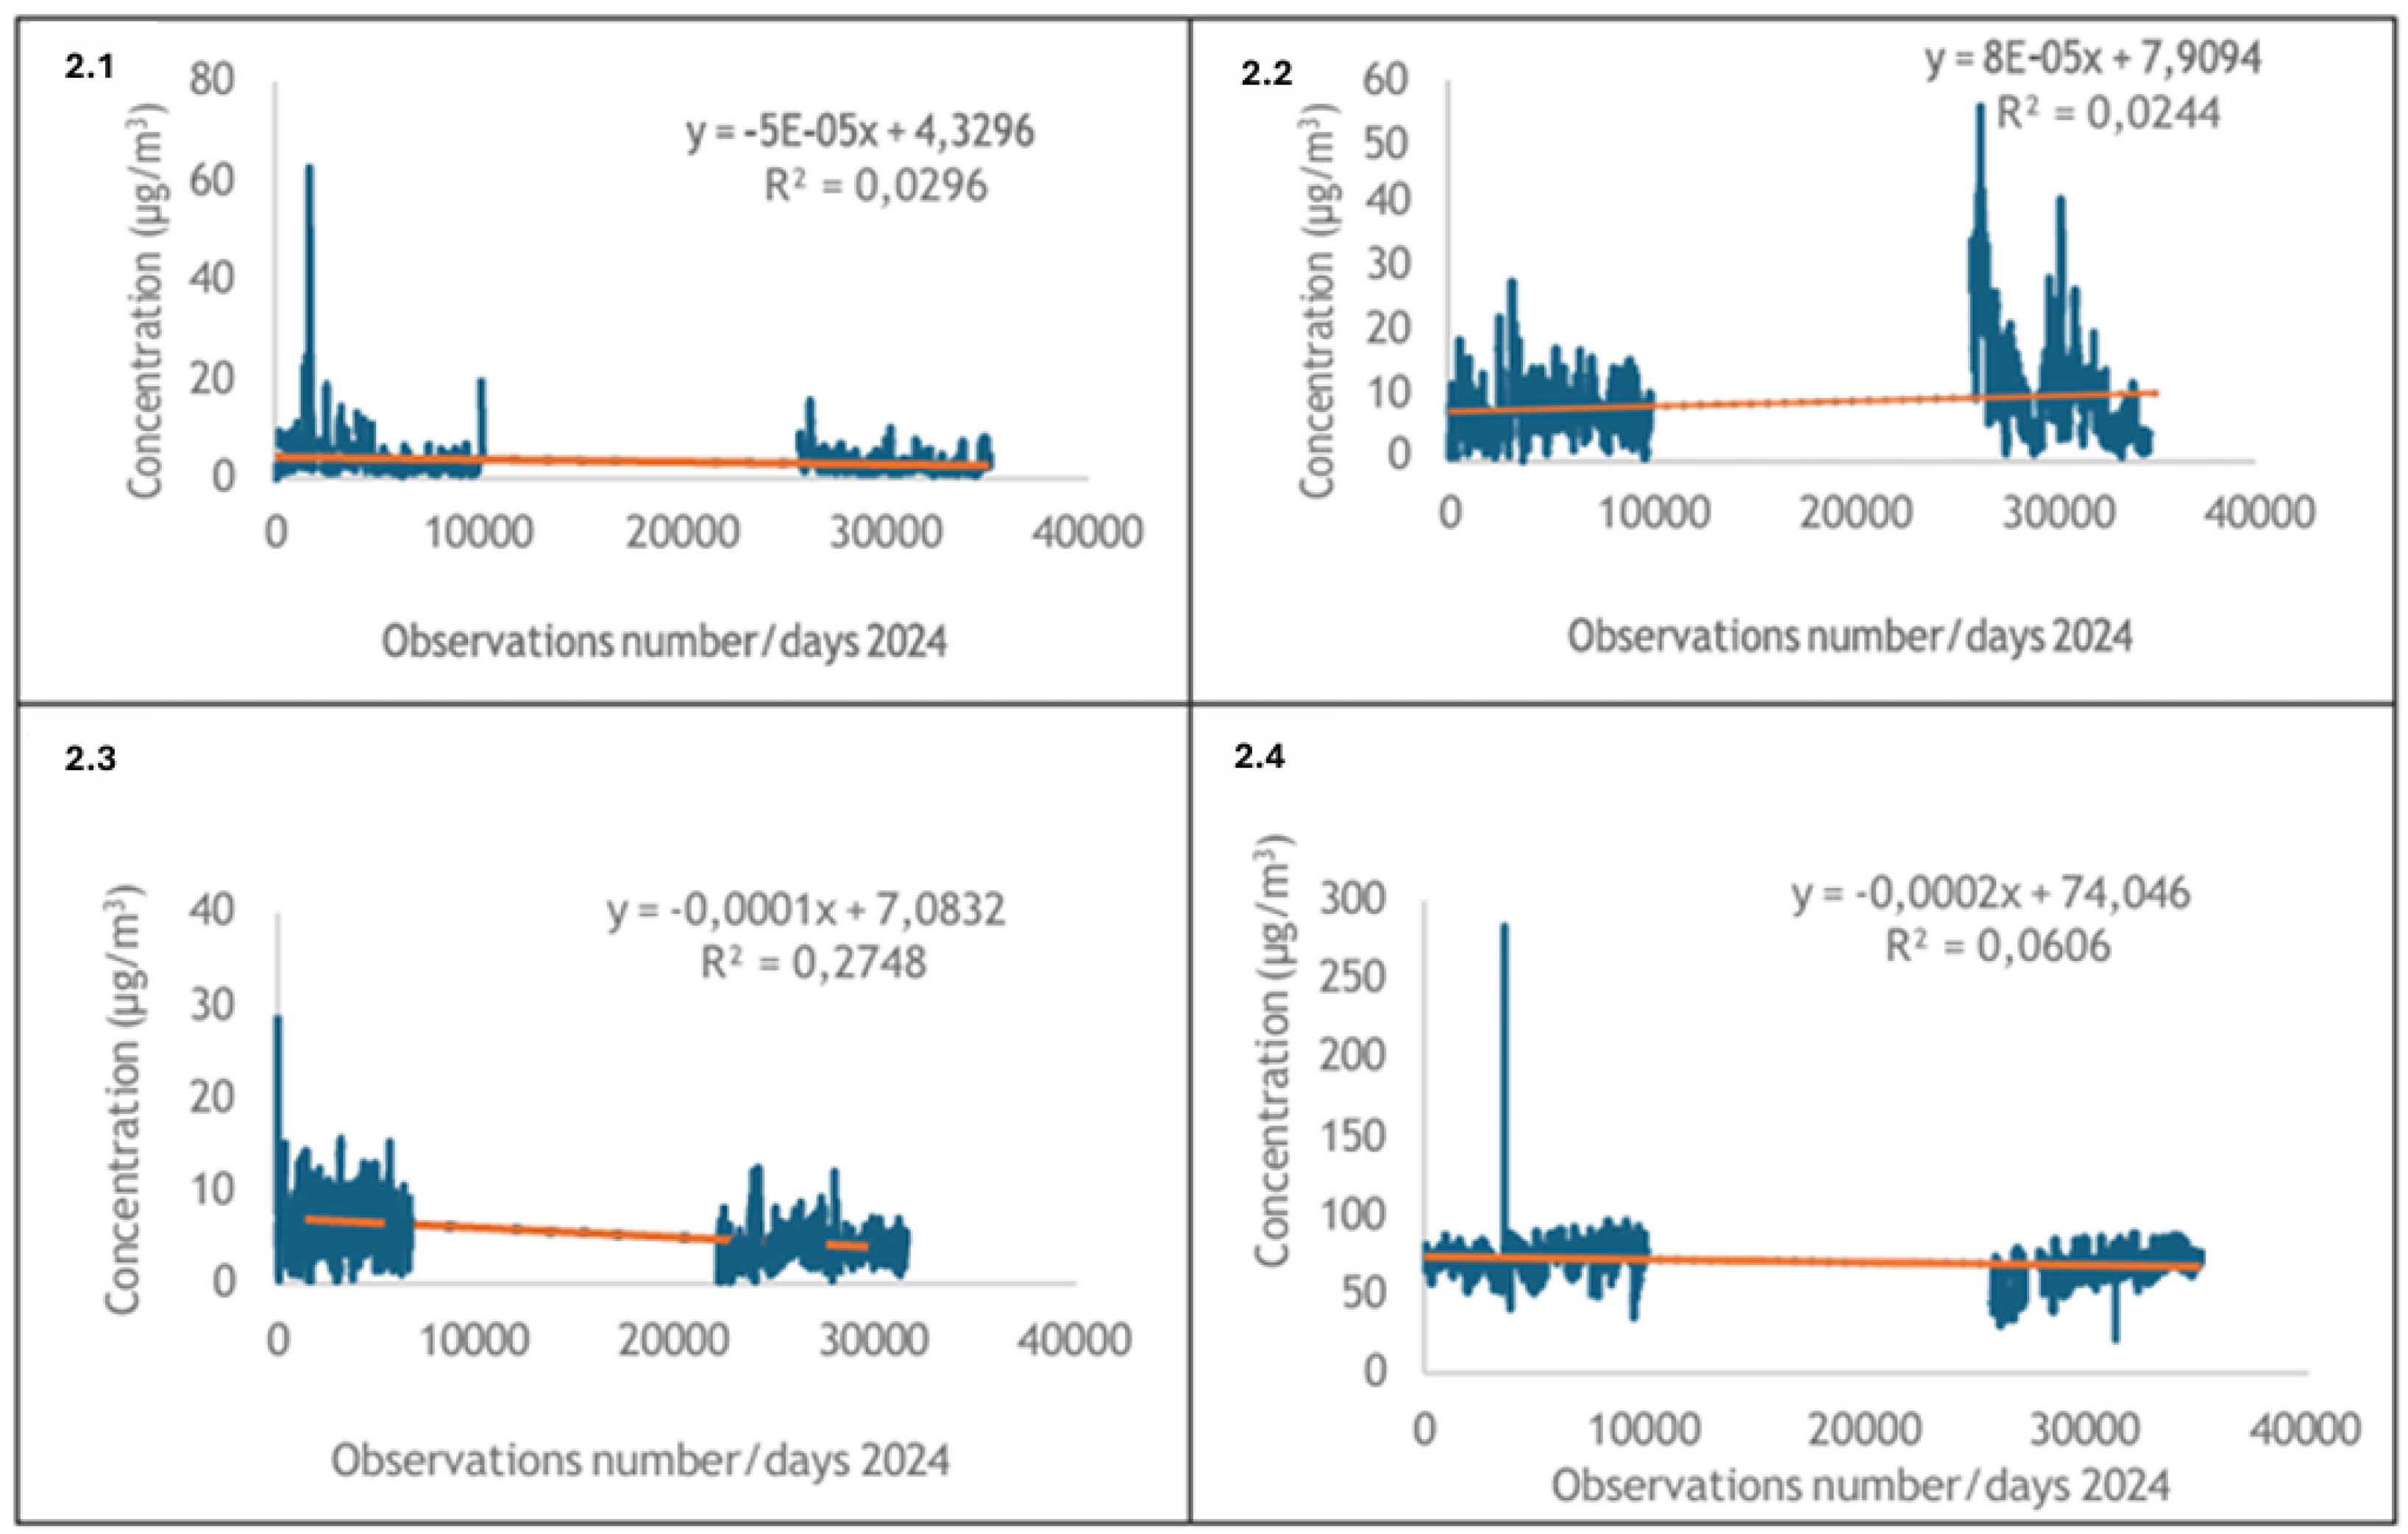
Figure 3.
Boxplot for the distributions of the values of PM2.5, PM10, SO2 e O3.
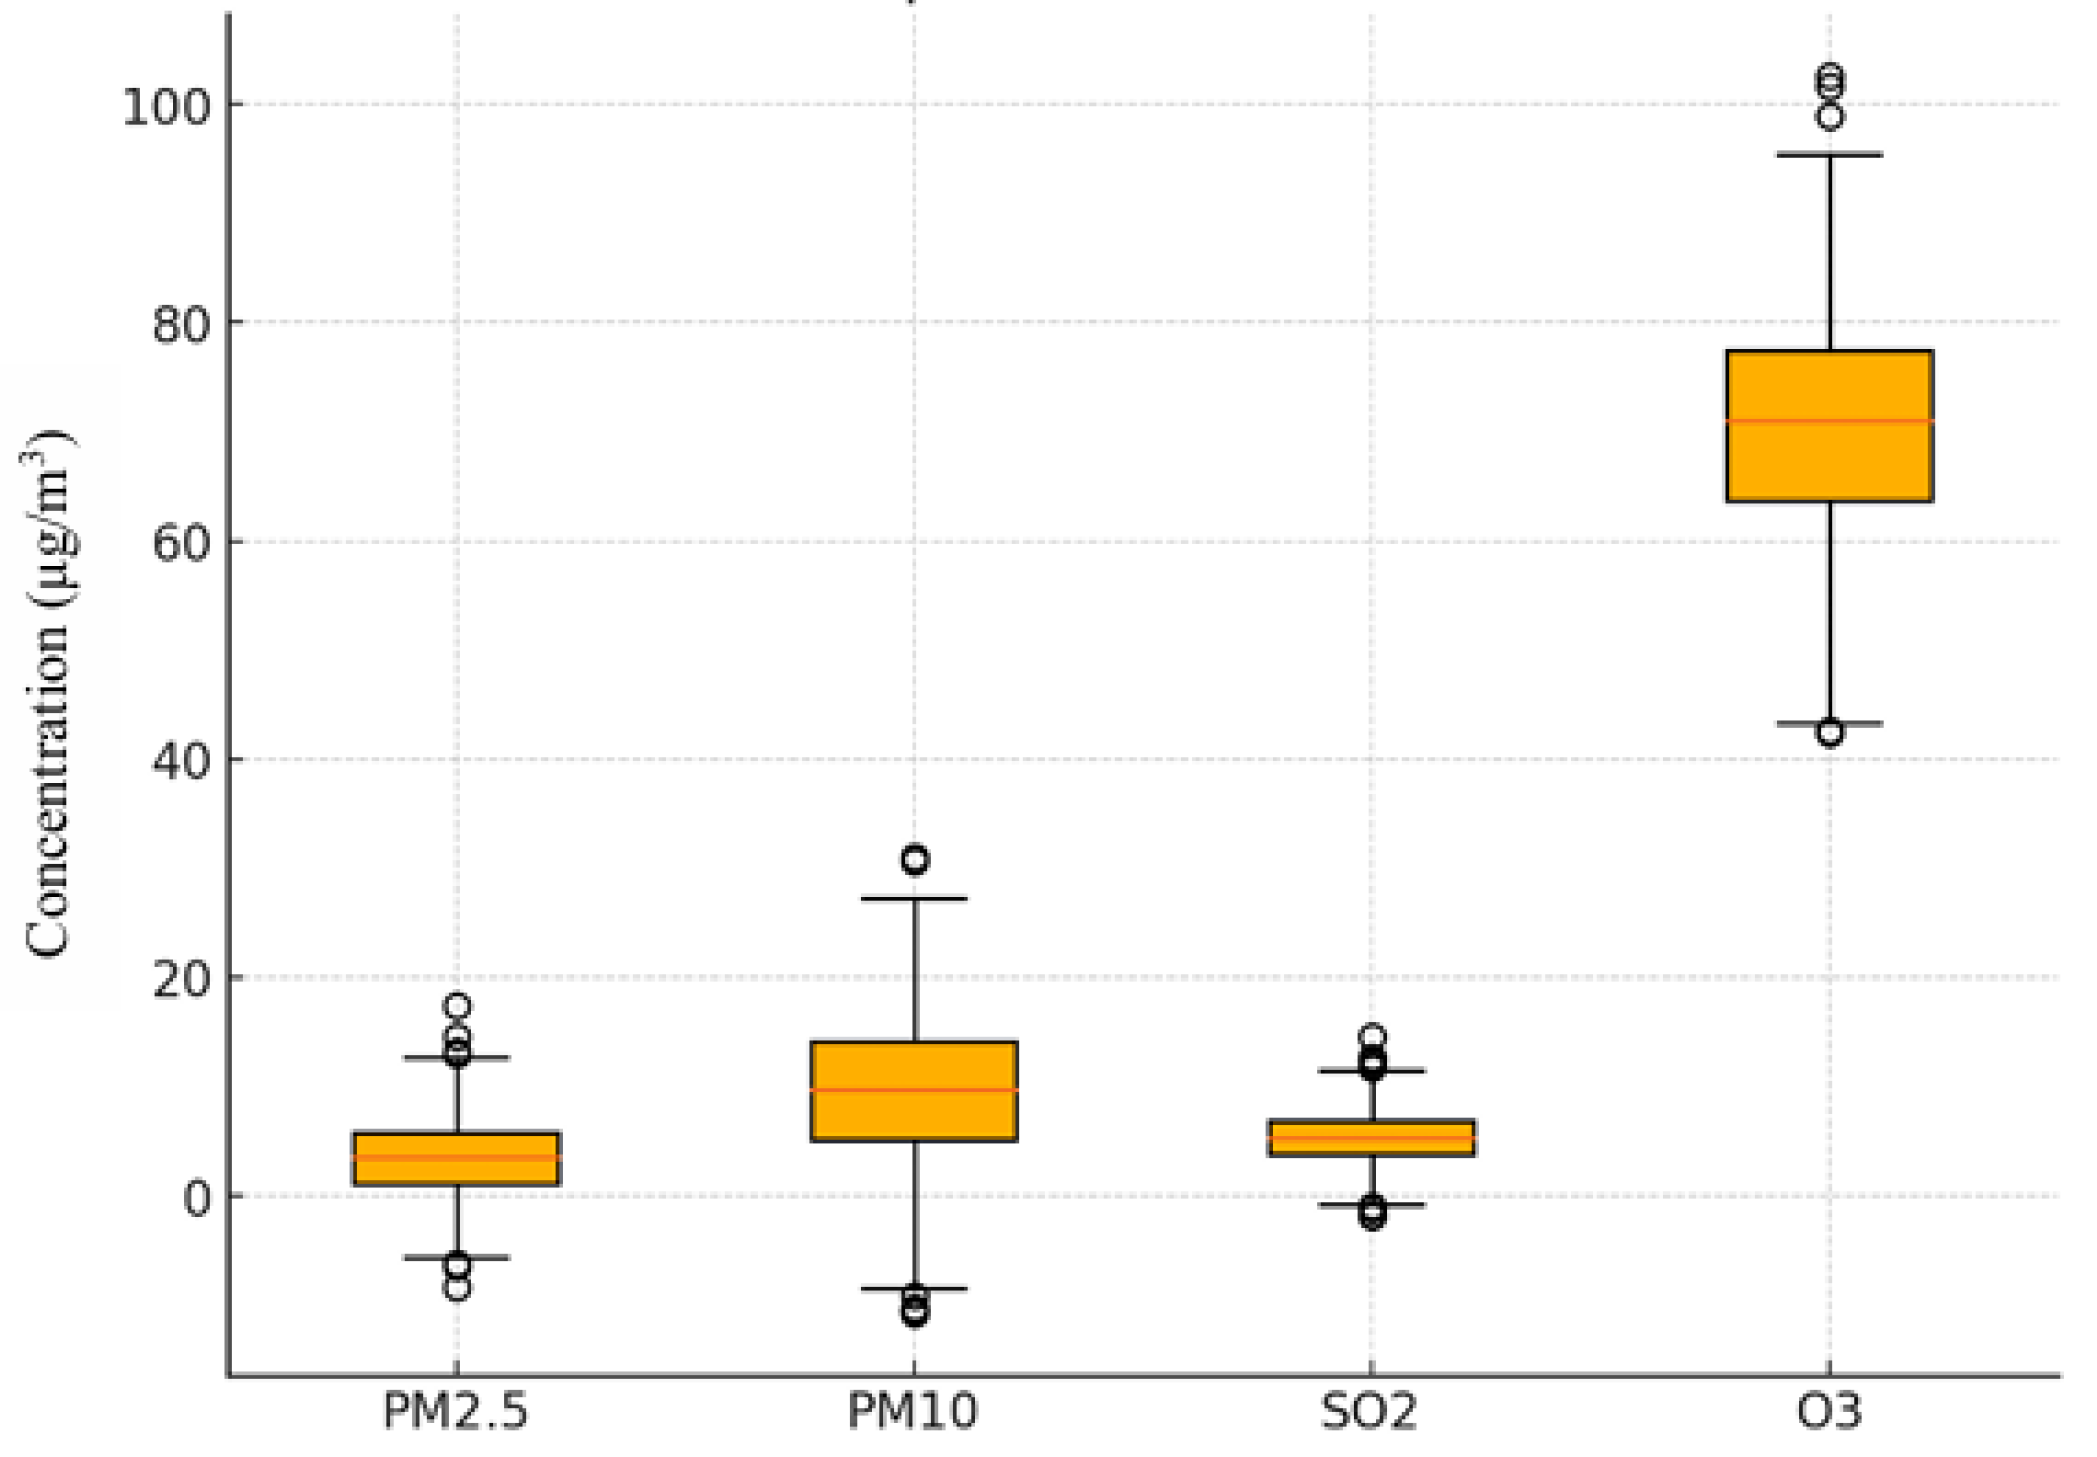
Figure 4.
Adjustments of the Weibull, Lognormal, Normal and Gamma statistical distributions, applied to PM2. 5 and PM10 concentrations.
Figure 4.
Adjustments of the Weibull, Lognormal, Normal and Gamma statistical distributions, applied to PM2. 5 and PM10 concentrations.
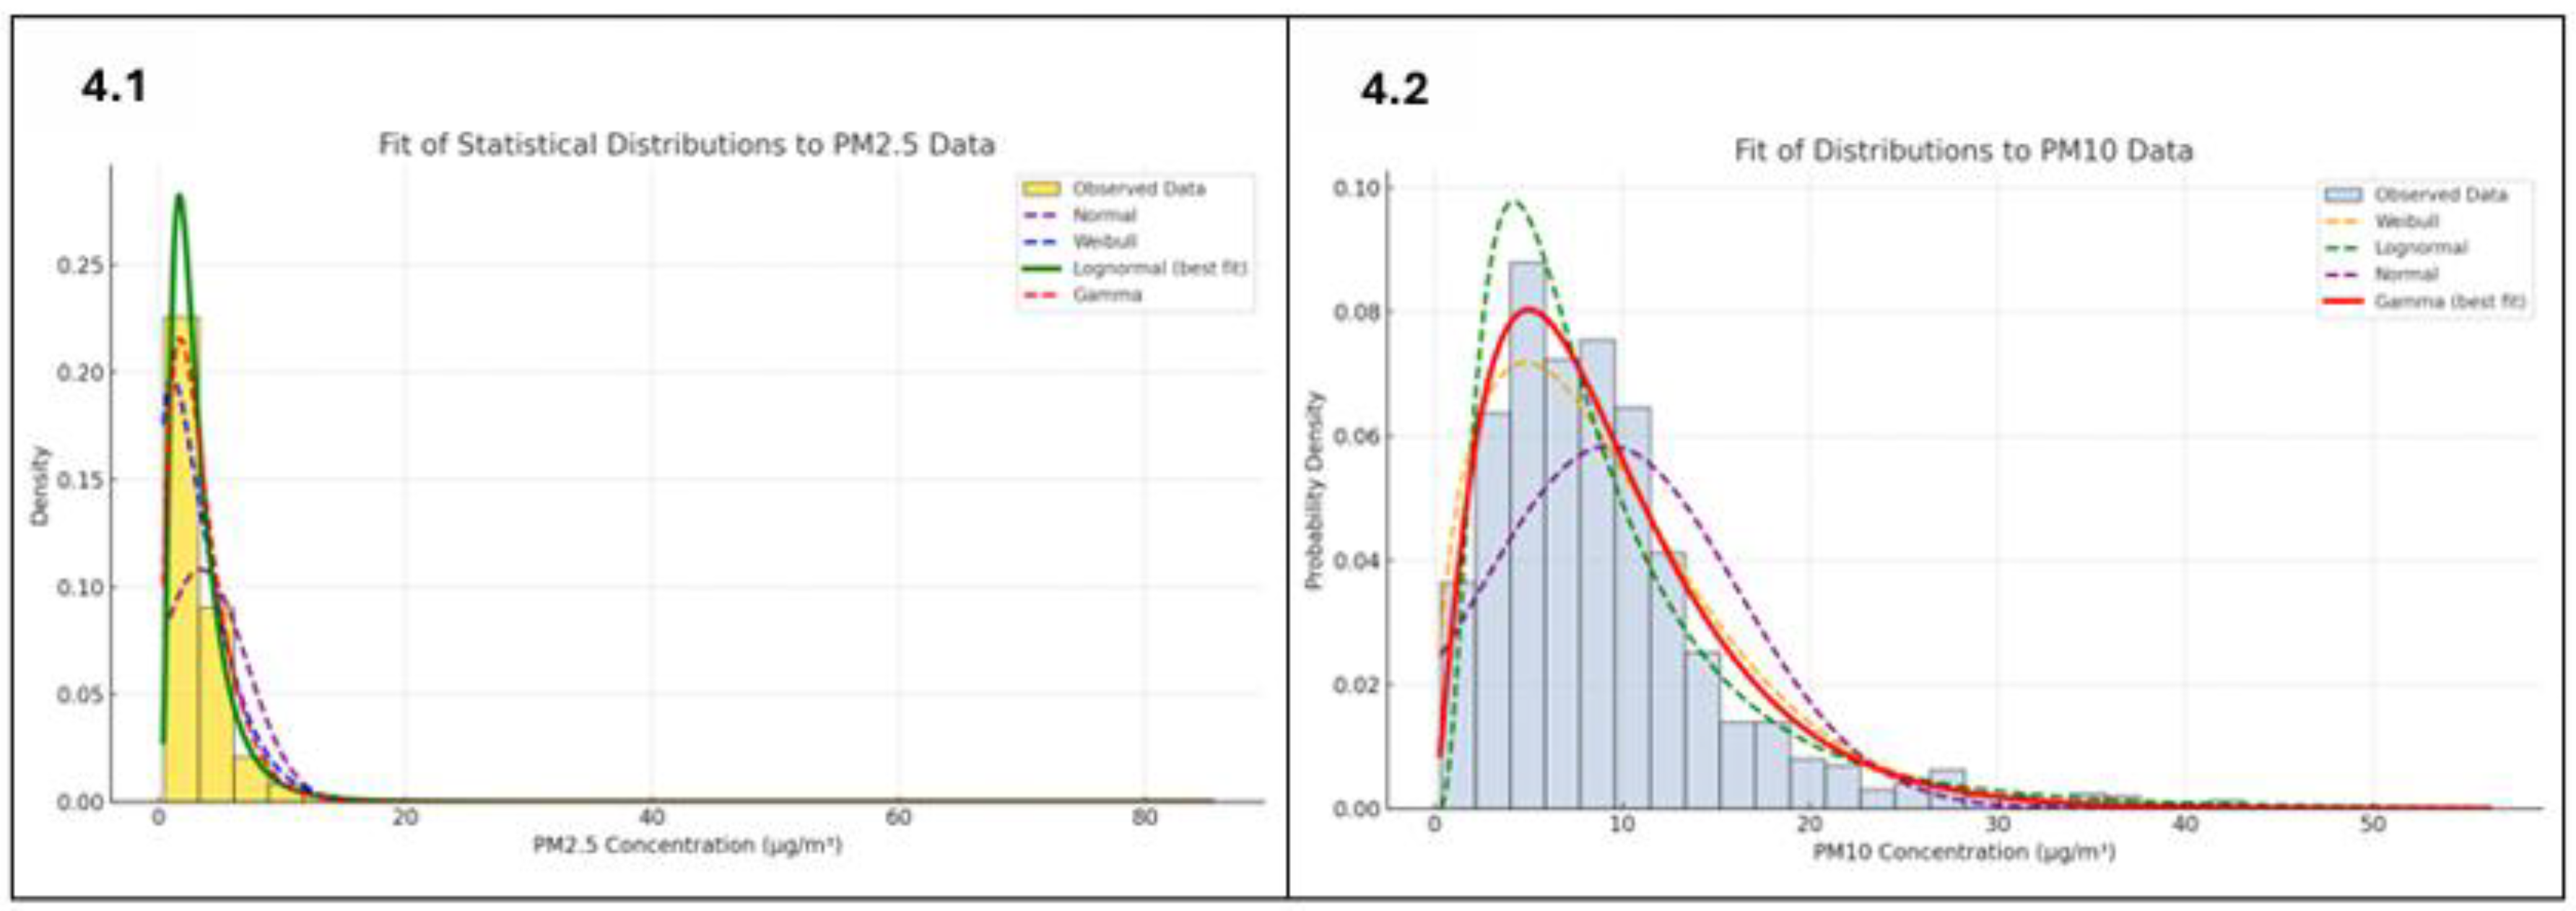
Figure 5.
PM2.5, Left: PDF with histogram of observed data and fitted curves (Normal, Weibull, Lognormal Gamma). Right: Theoretical CDFs for the same distributions, showing cumulative behavior.
Figure 5.
PM2.5, Left: PDF with histogram of observed data and fitted curves (Normal, Weibull, Lognormal Gamma). Right: Theoretical CDFs for the same distributions, showing cumulative behavior.
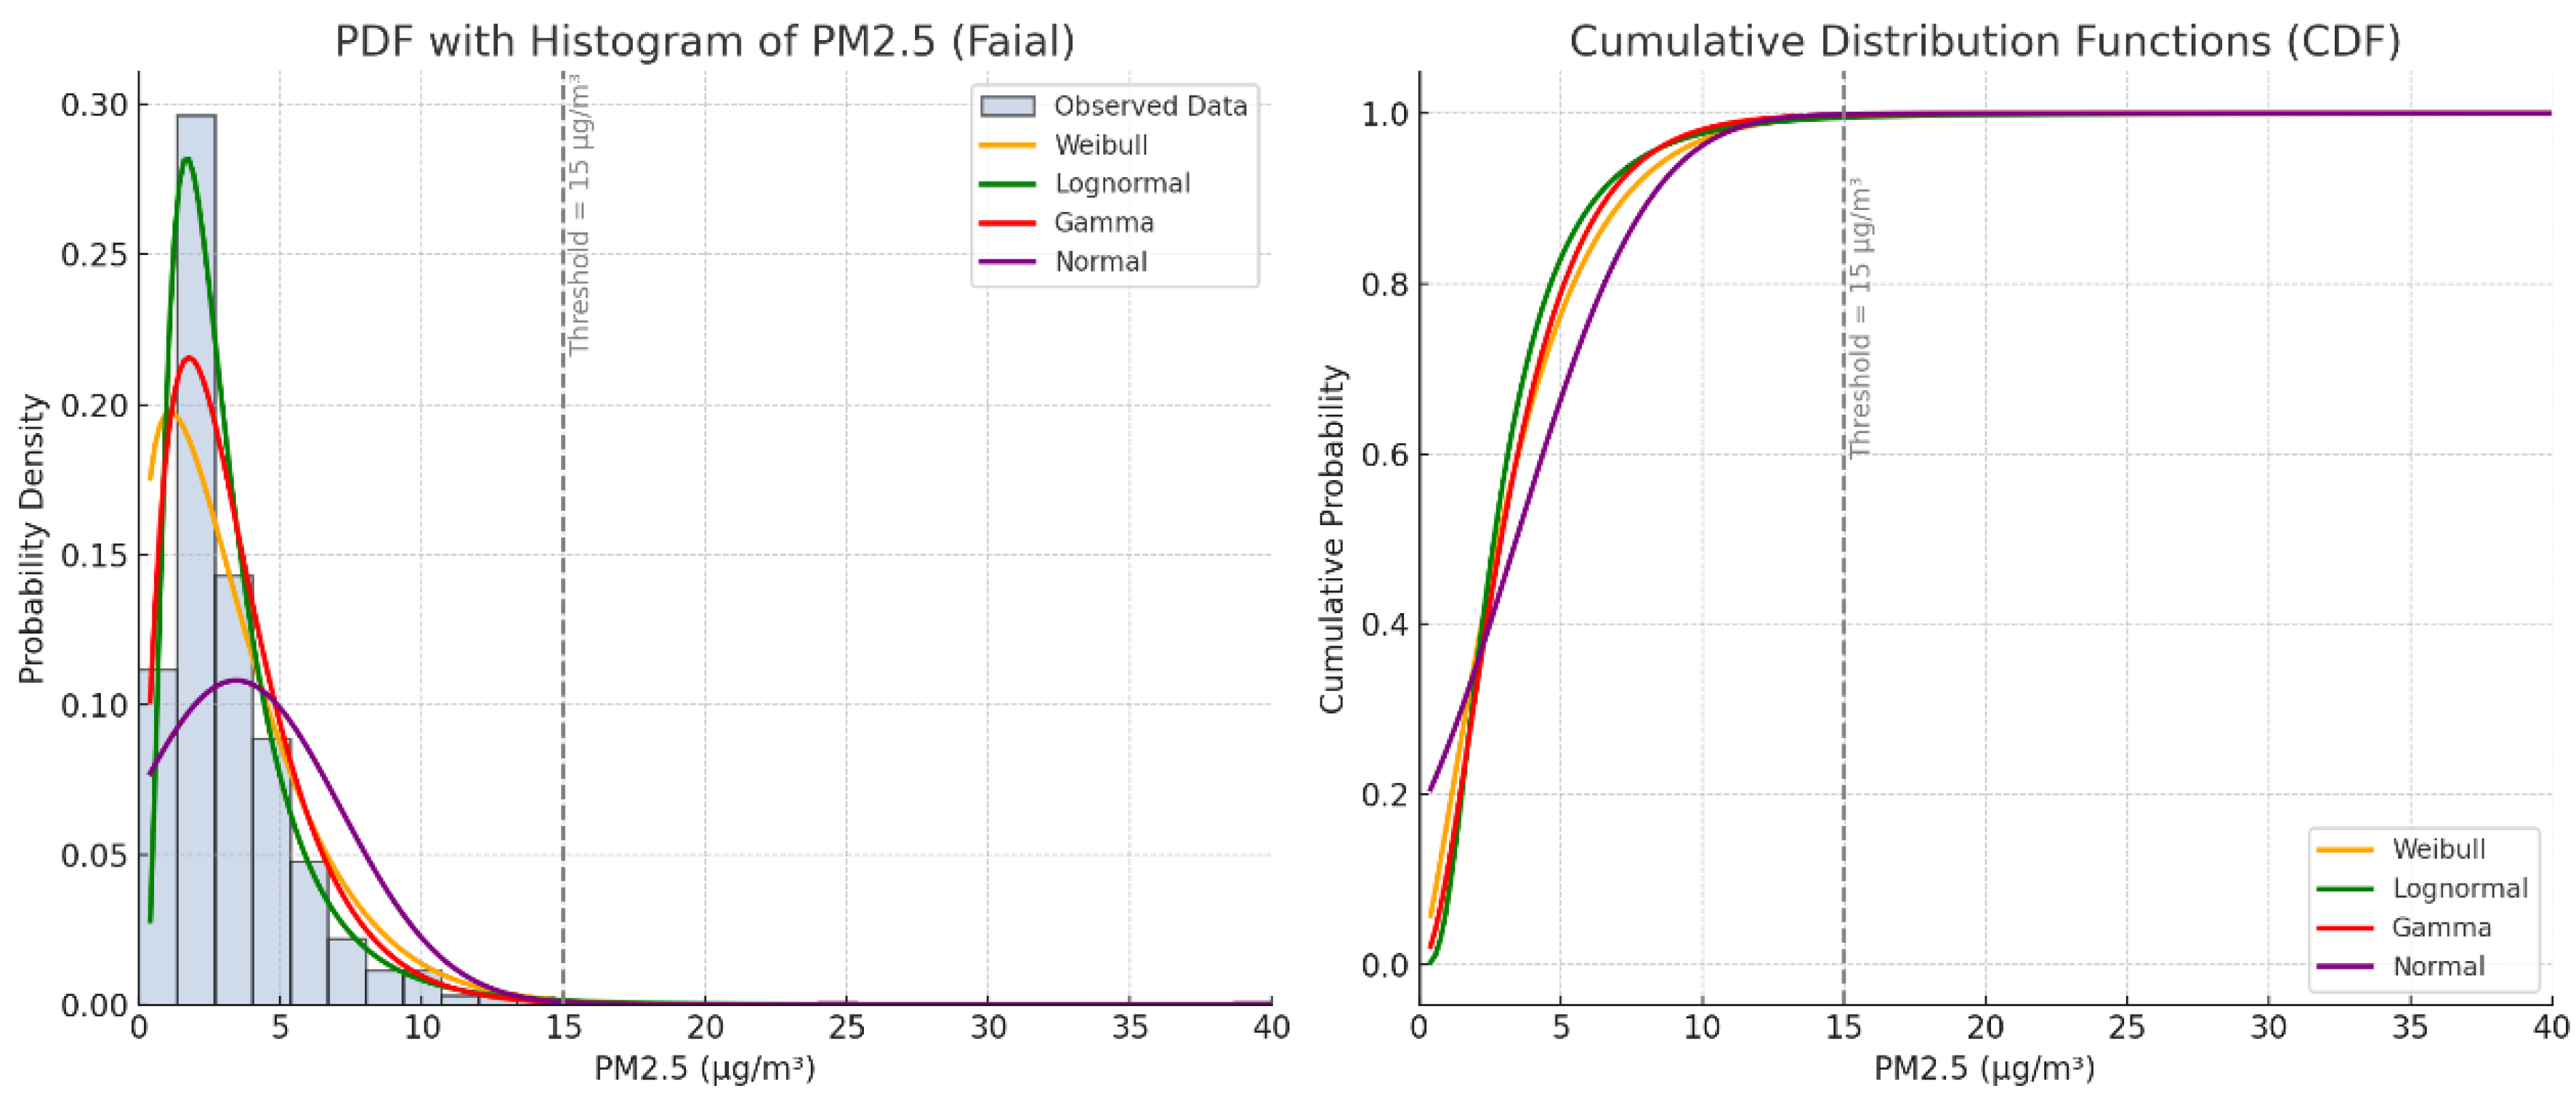
Figure 6.
PM10, Left: PDF with histogram of observed data and fitted curves (Normal, Weibull, Lognormal, Gamma). Right: Theoretical CDFs for the same distributions, showing cumulative behavior.
Figure 6.
PM10, Left: PDF with histogram of observed data and fitted curves (Normal, Weibull, Lognormal, Gamma). Right: Theoretical CDFs for the same distributions, showing cumulative behavior.
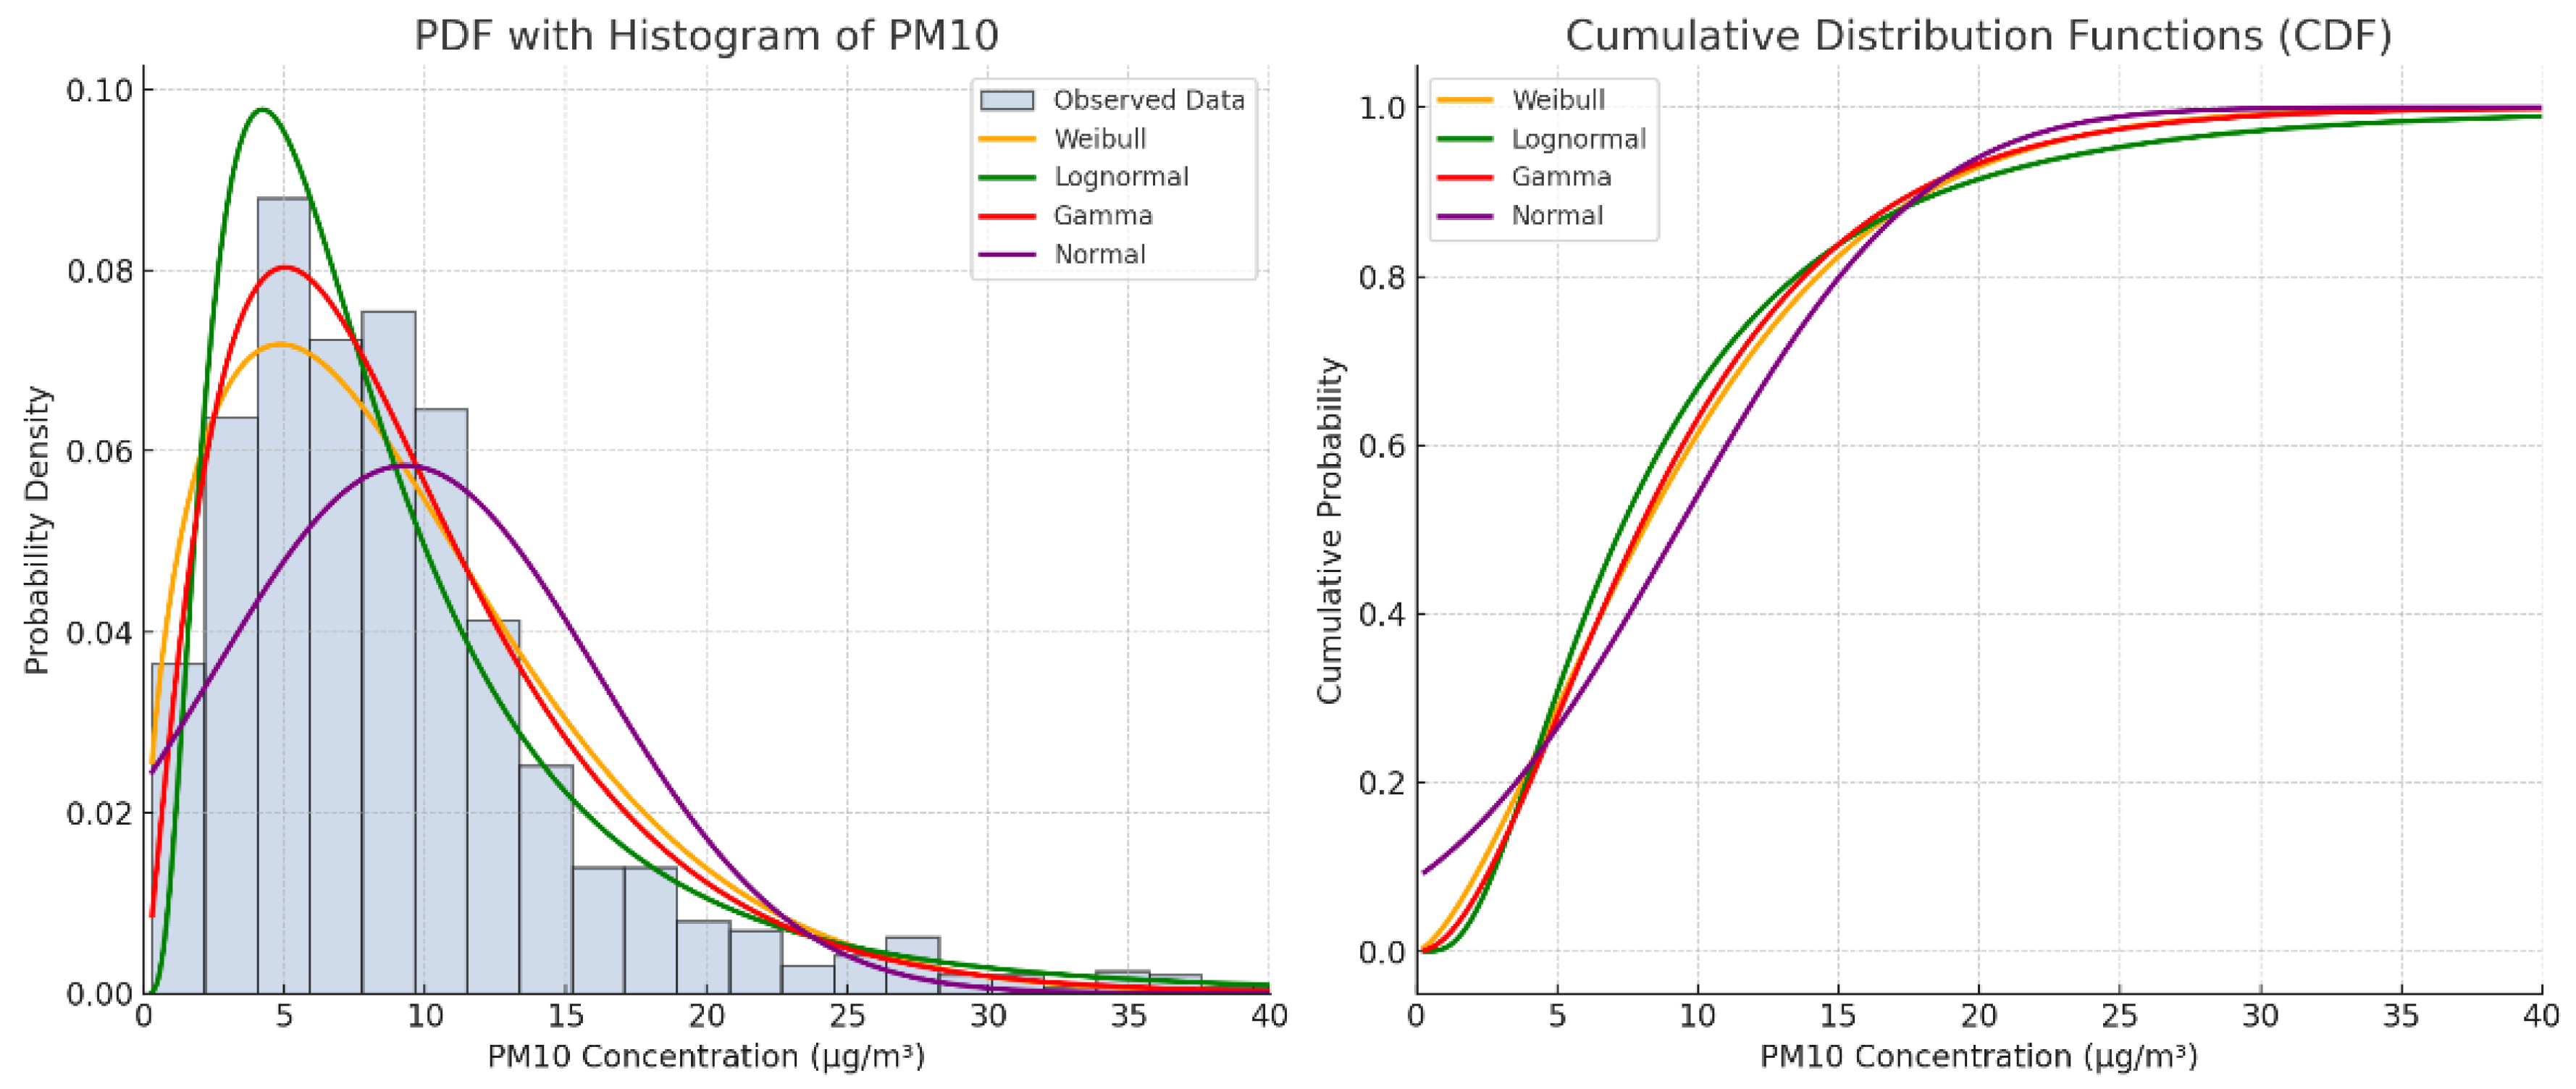
Figure 7.
Moderate outliers from the PM2.5 series for the year 2024.
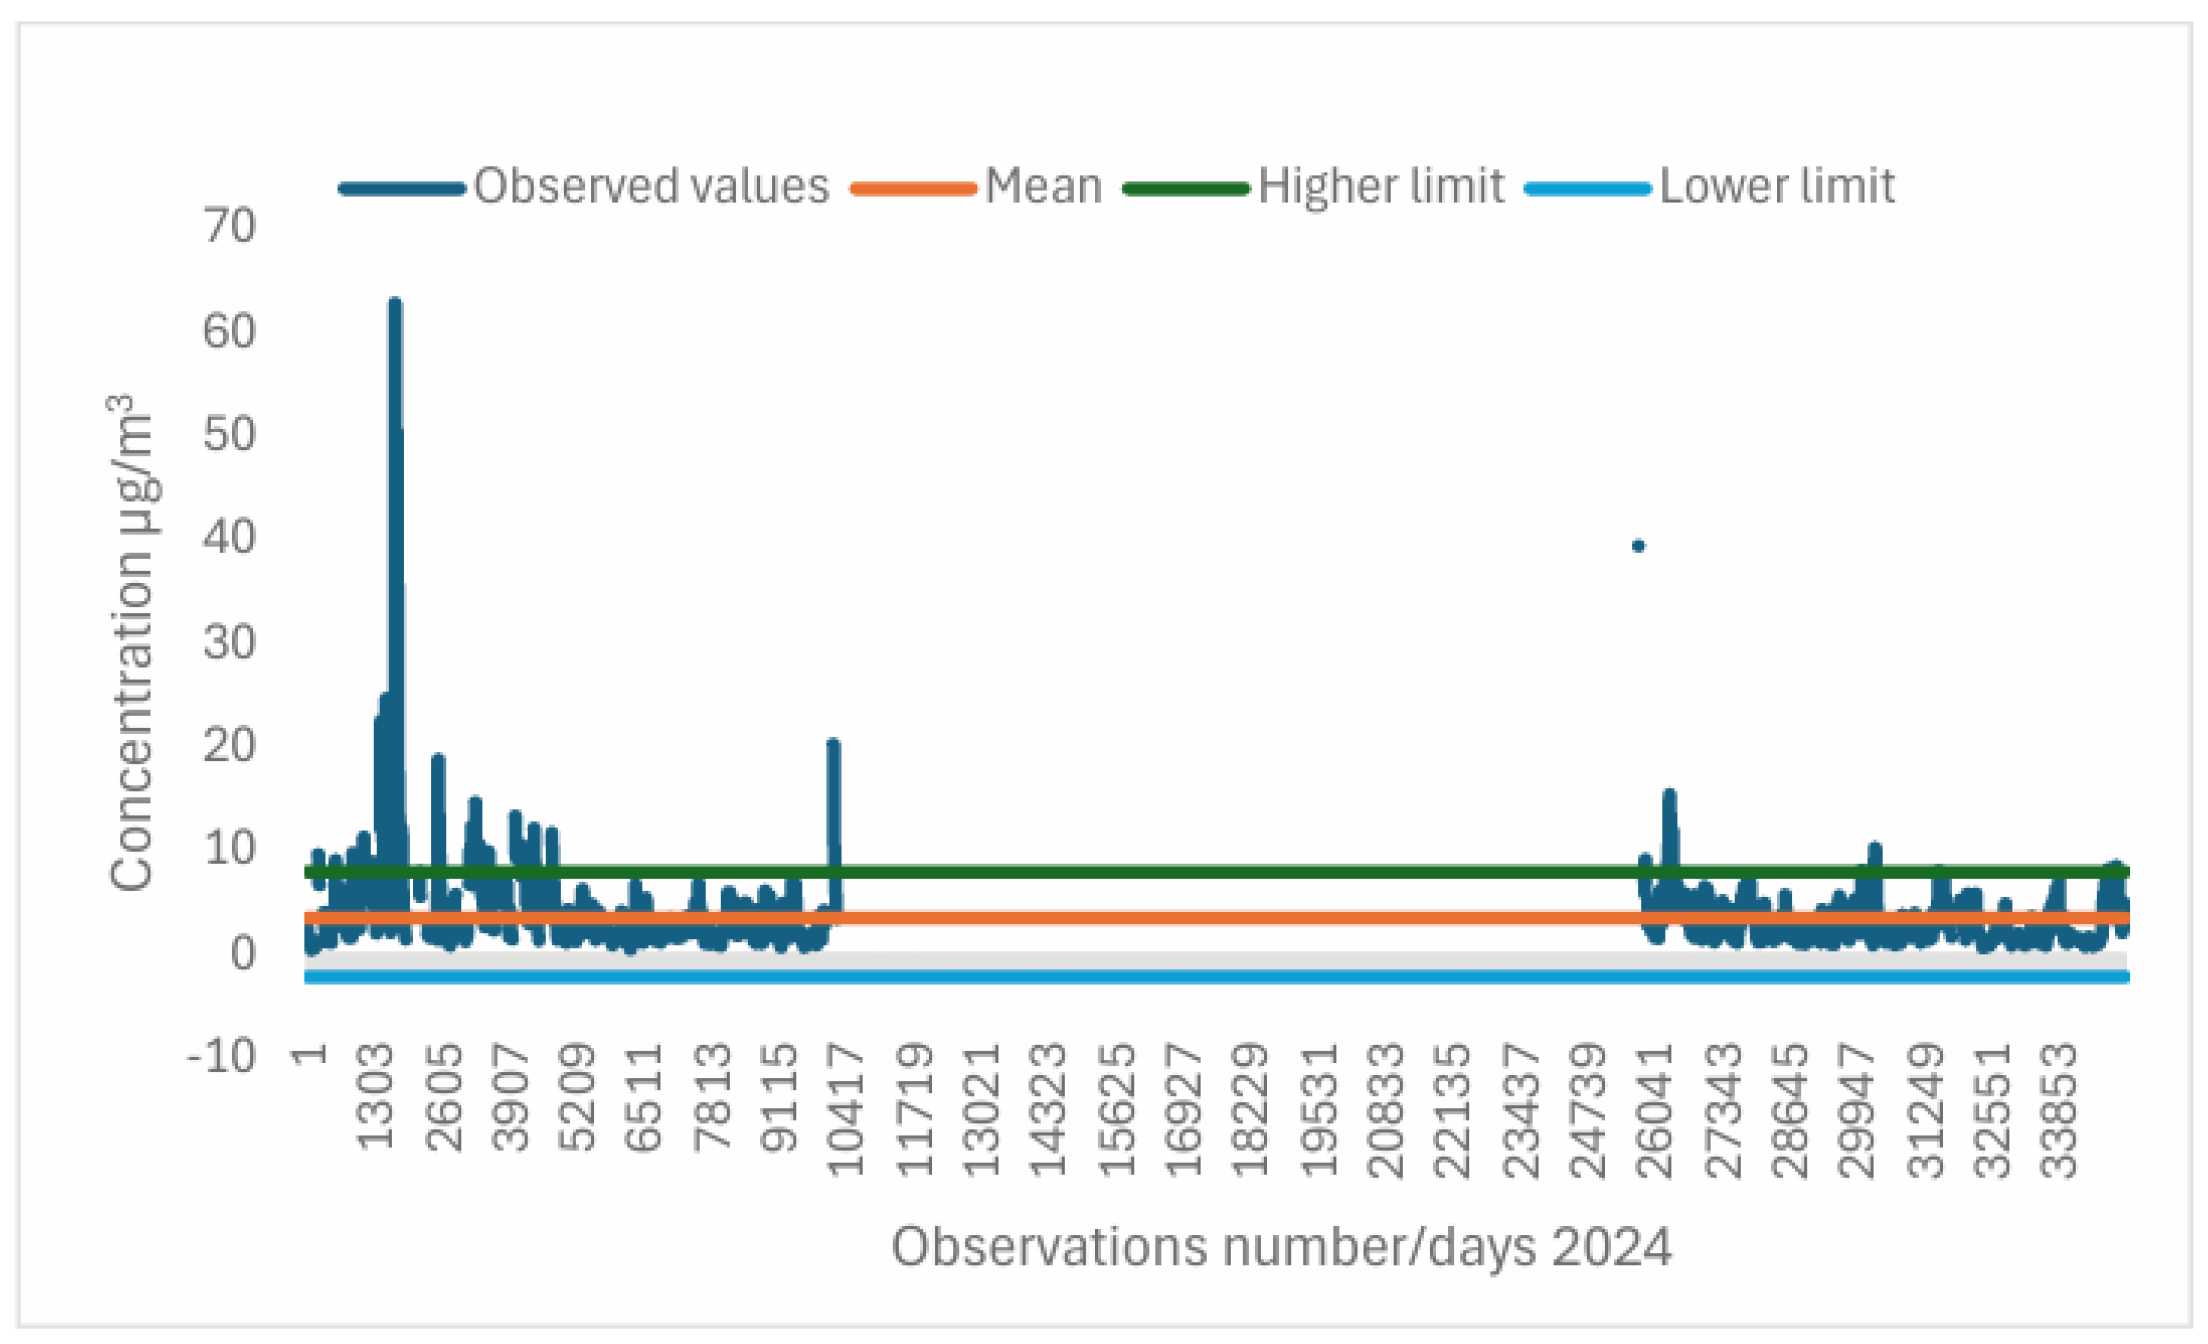
Figure 8.
Severe outliers from the PM2.5 series for the year 2024.
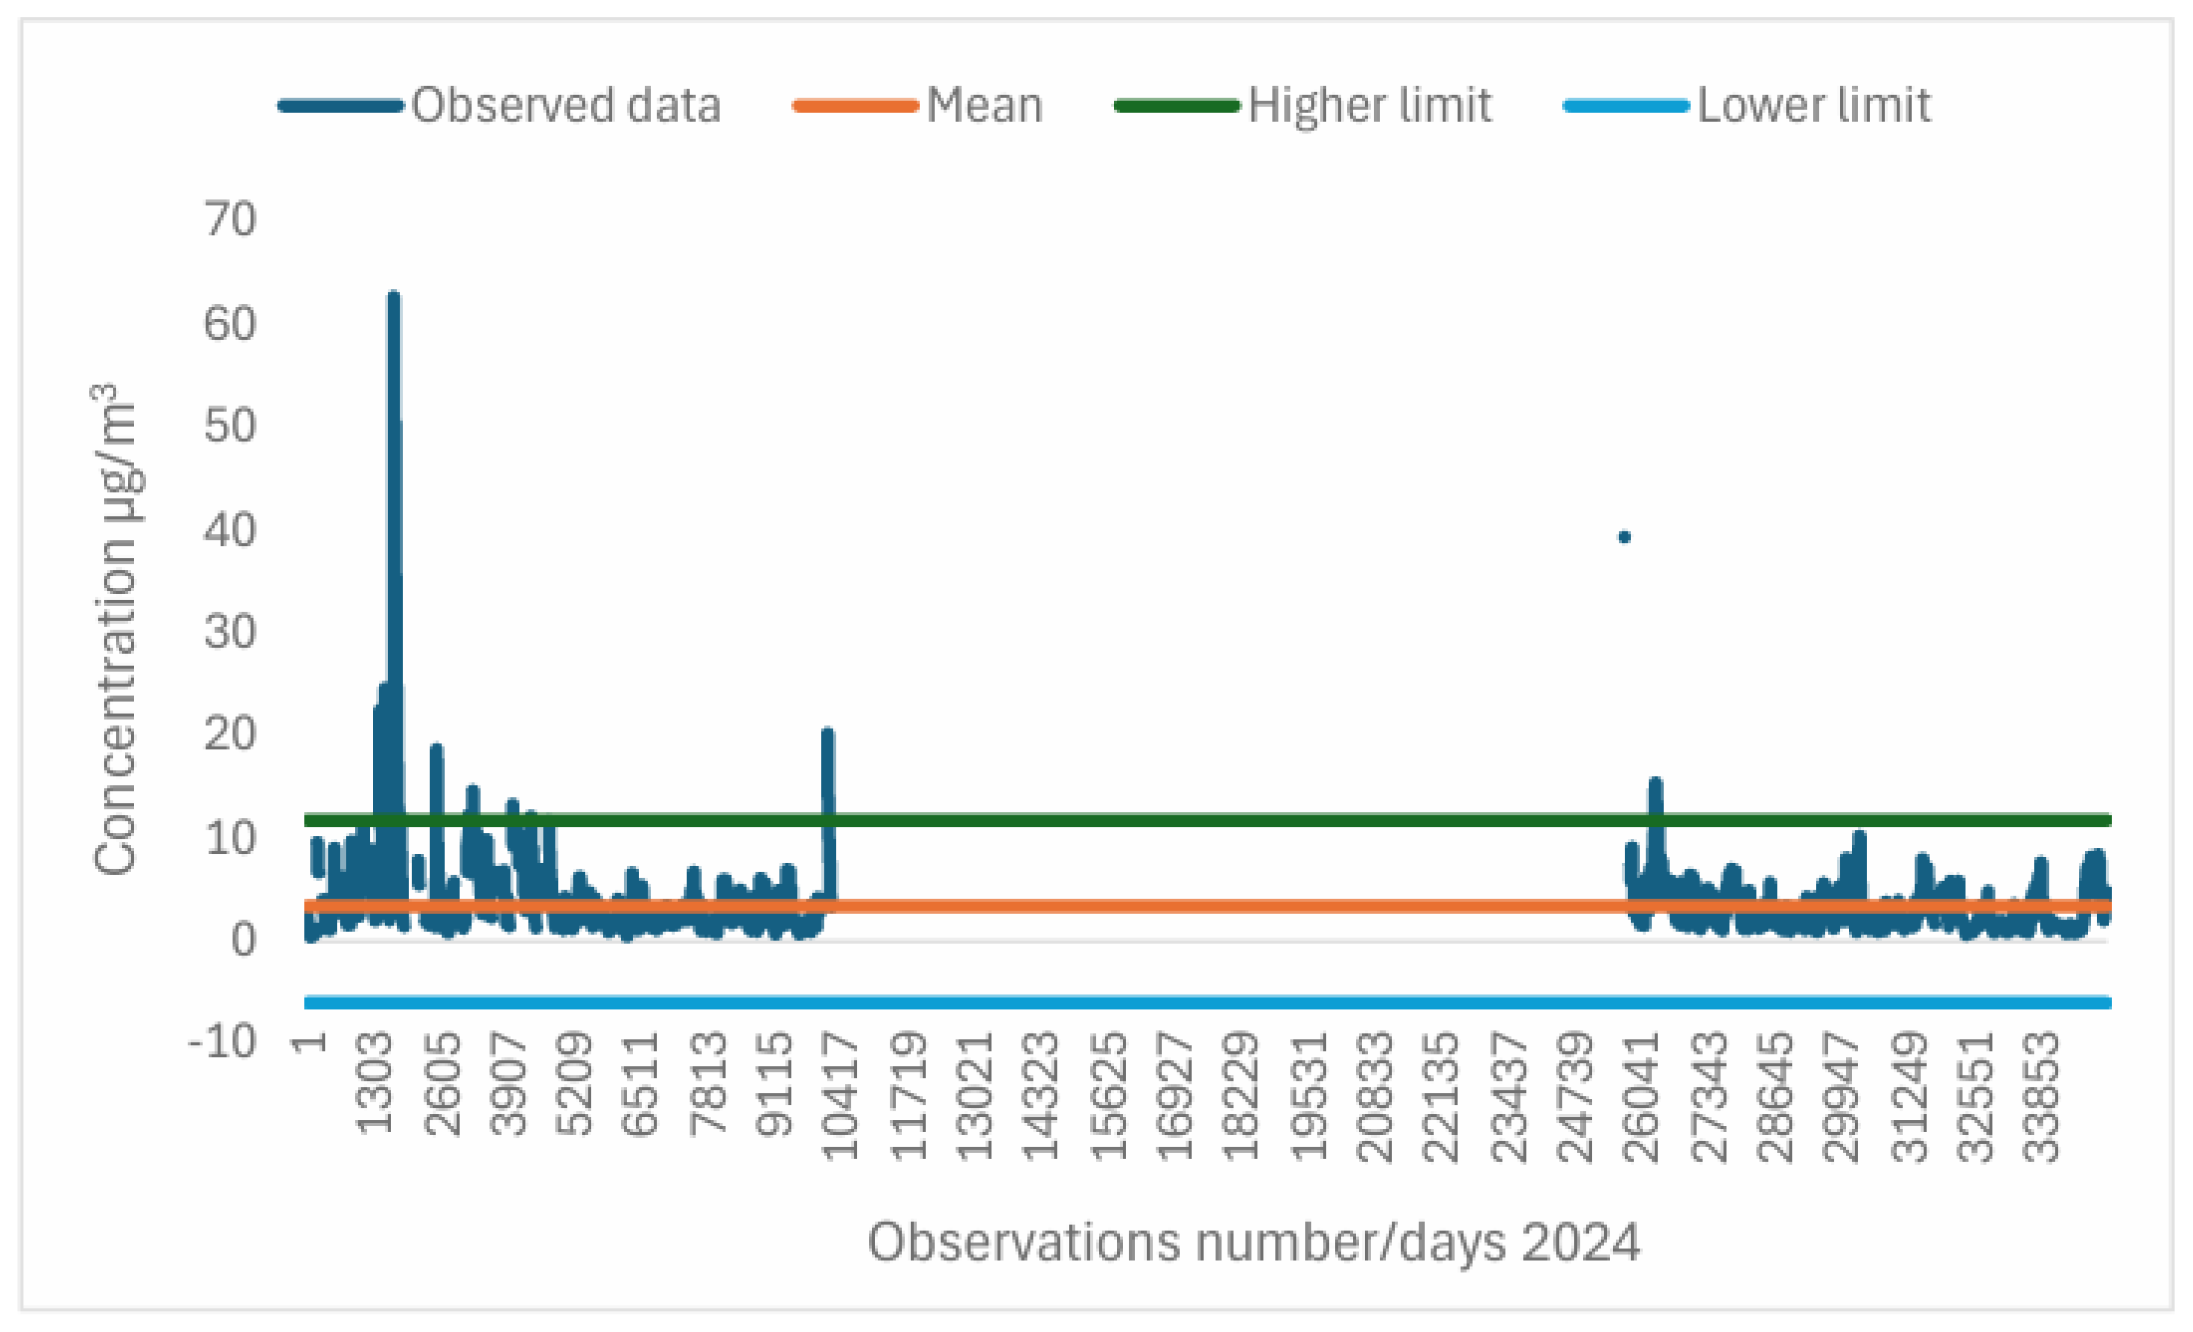
Figure 9.
Moderate outliers from the PM10 series for the year 2024.
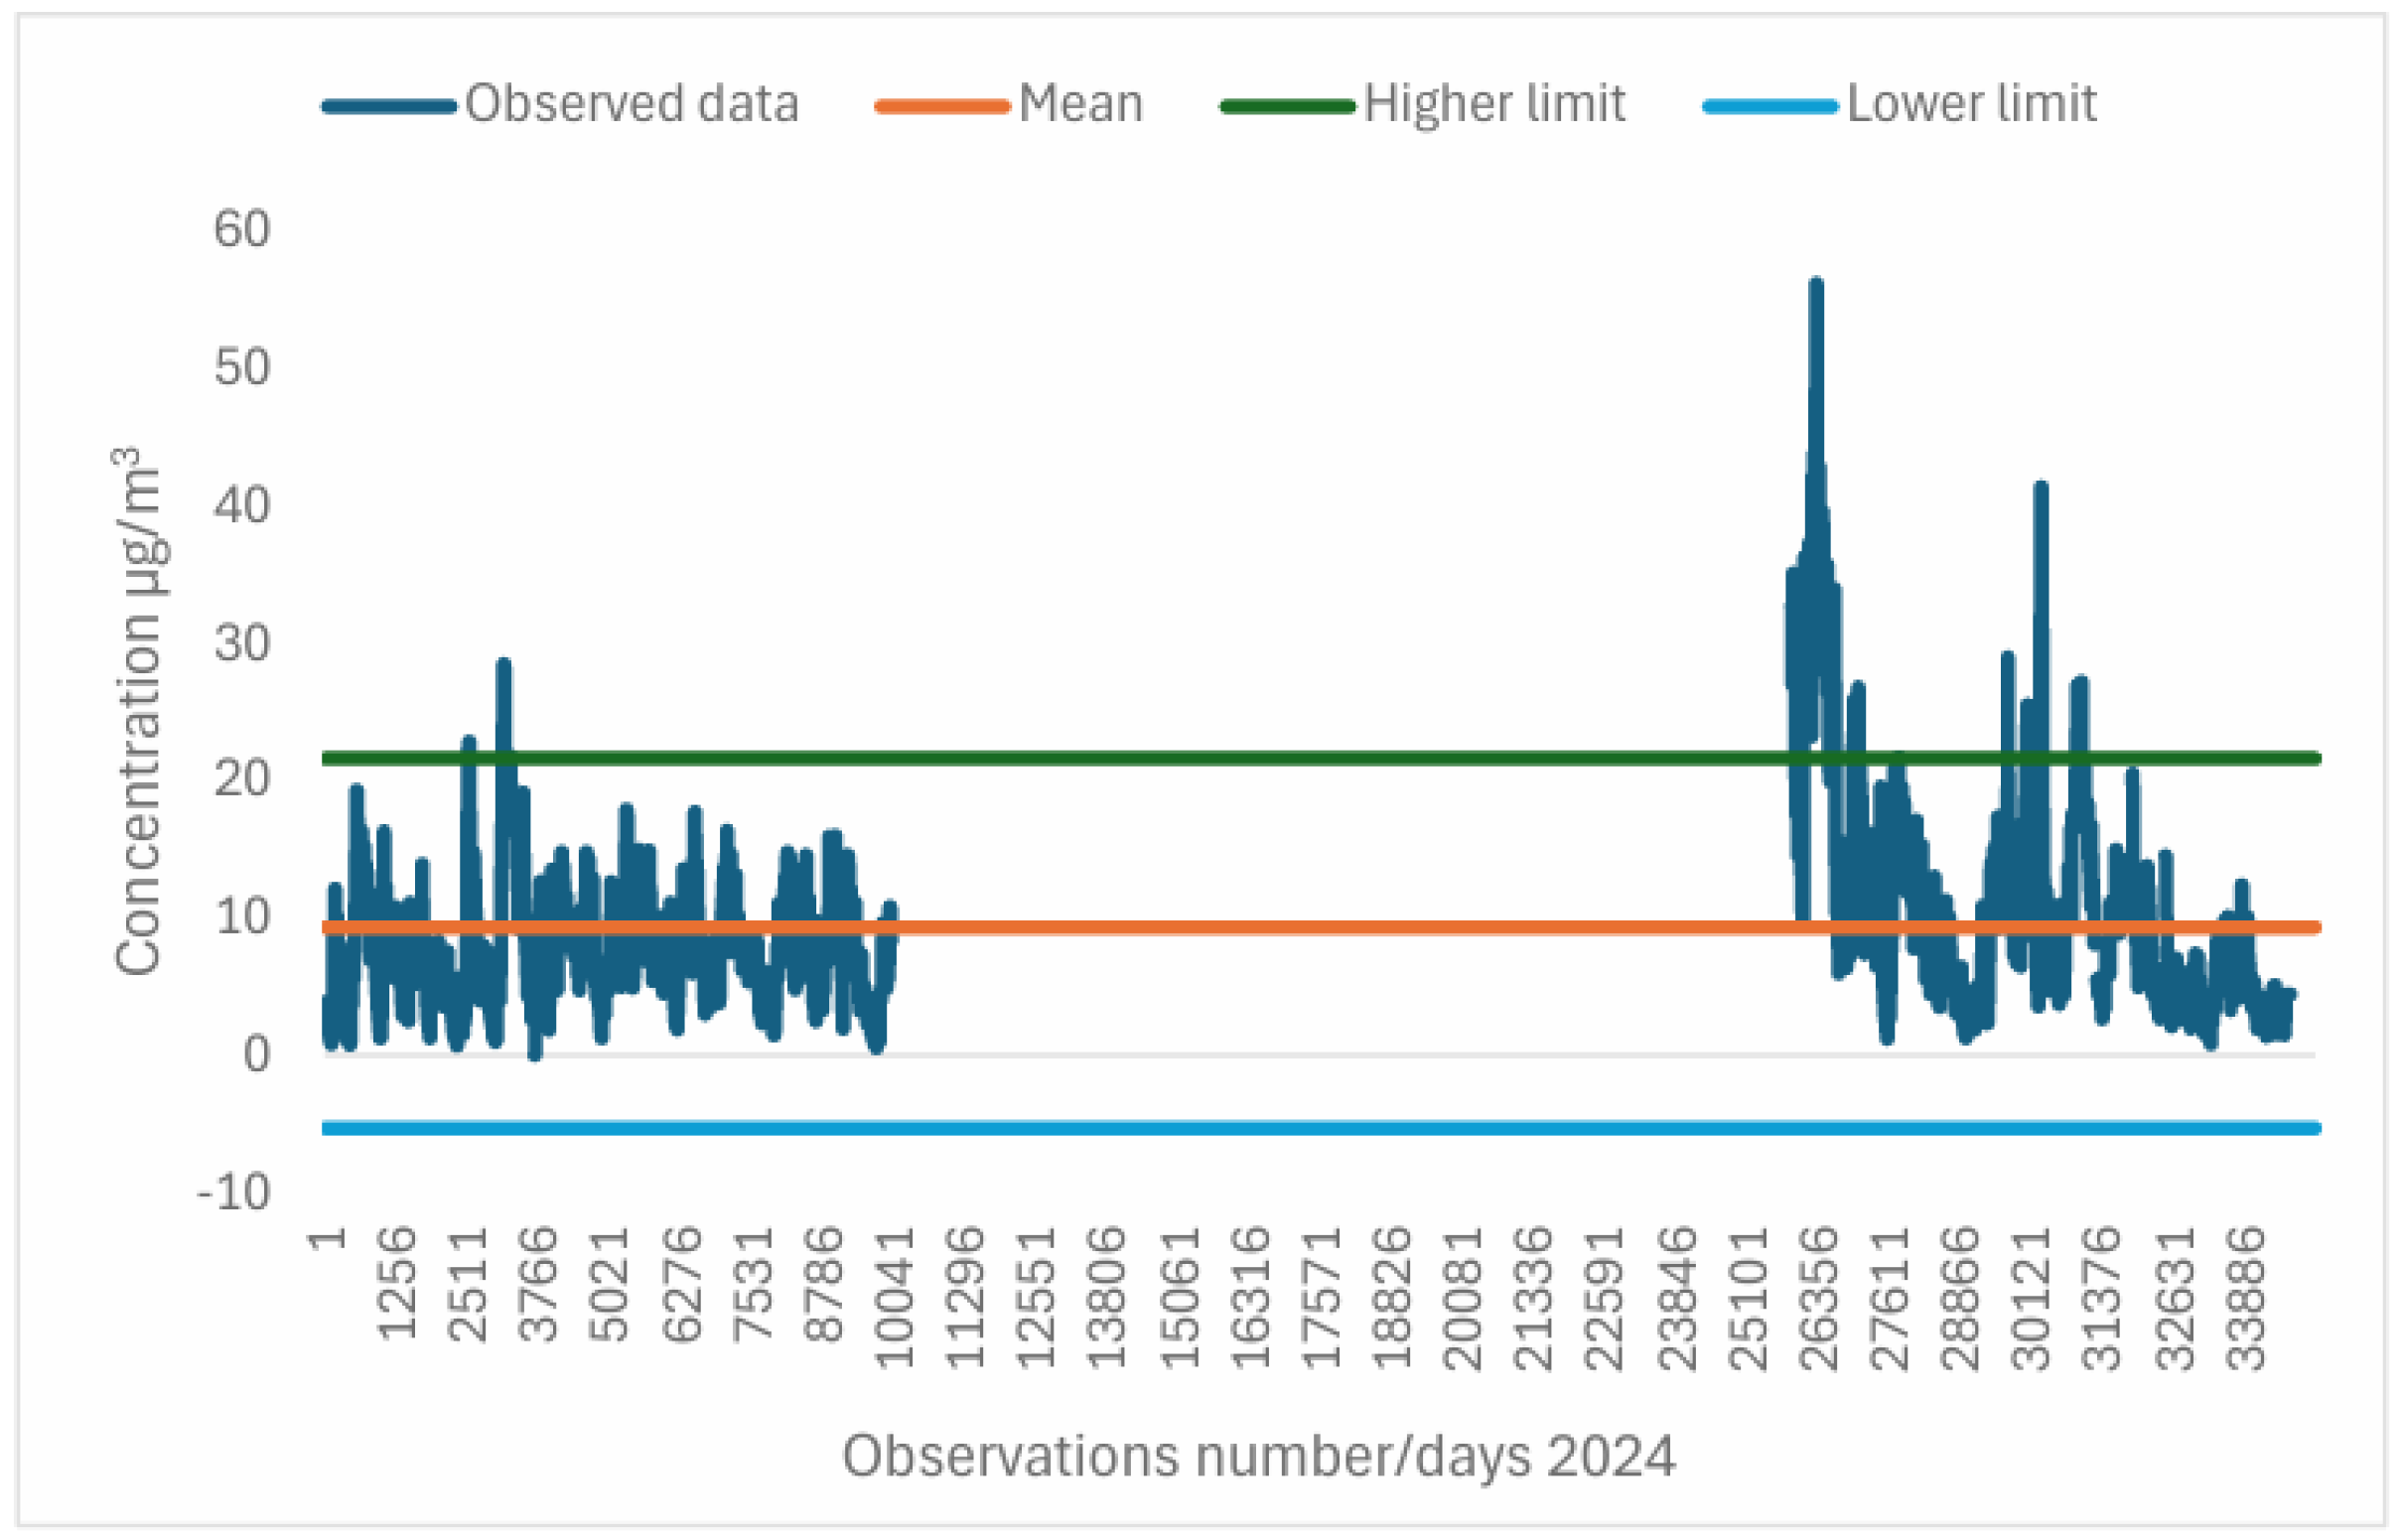
Figure 10.
Severe outliers from the PM10 series for the year 2024.
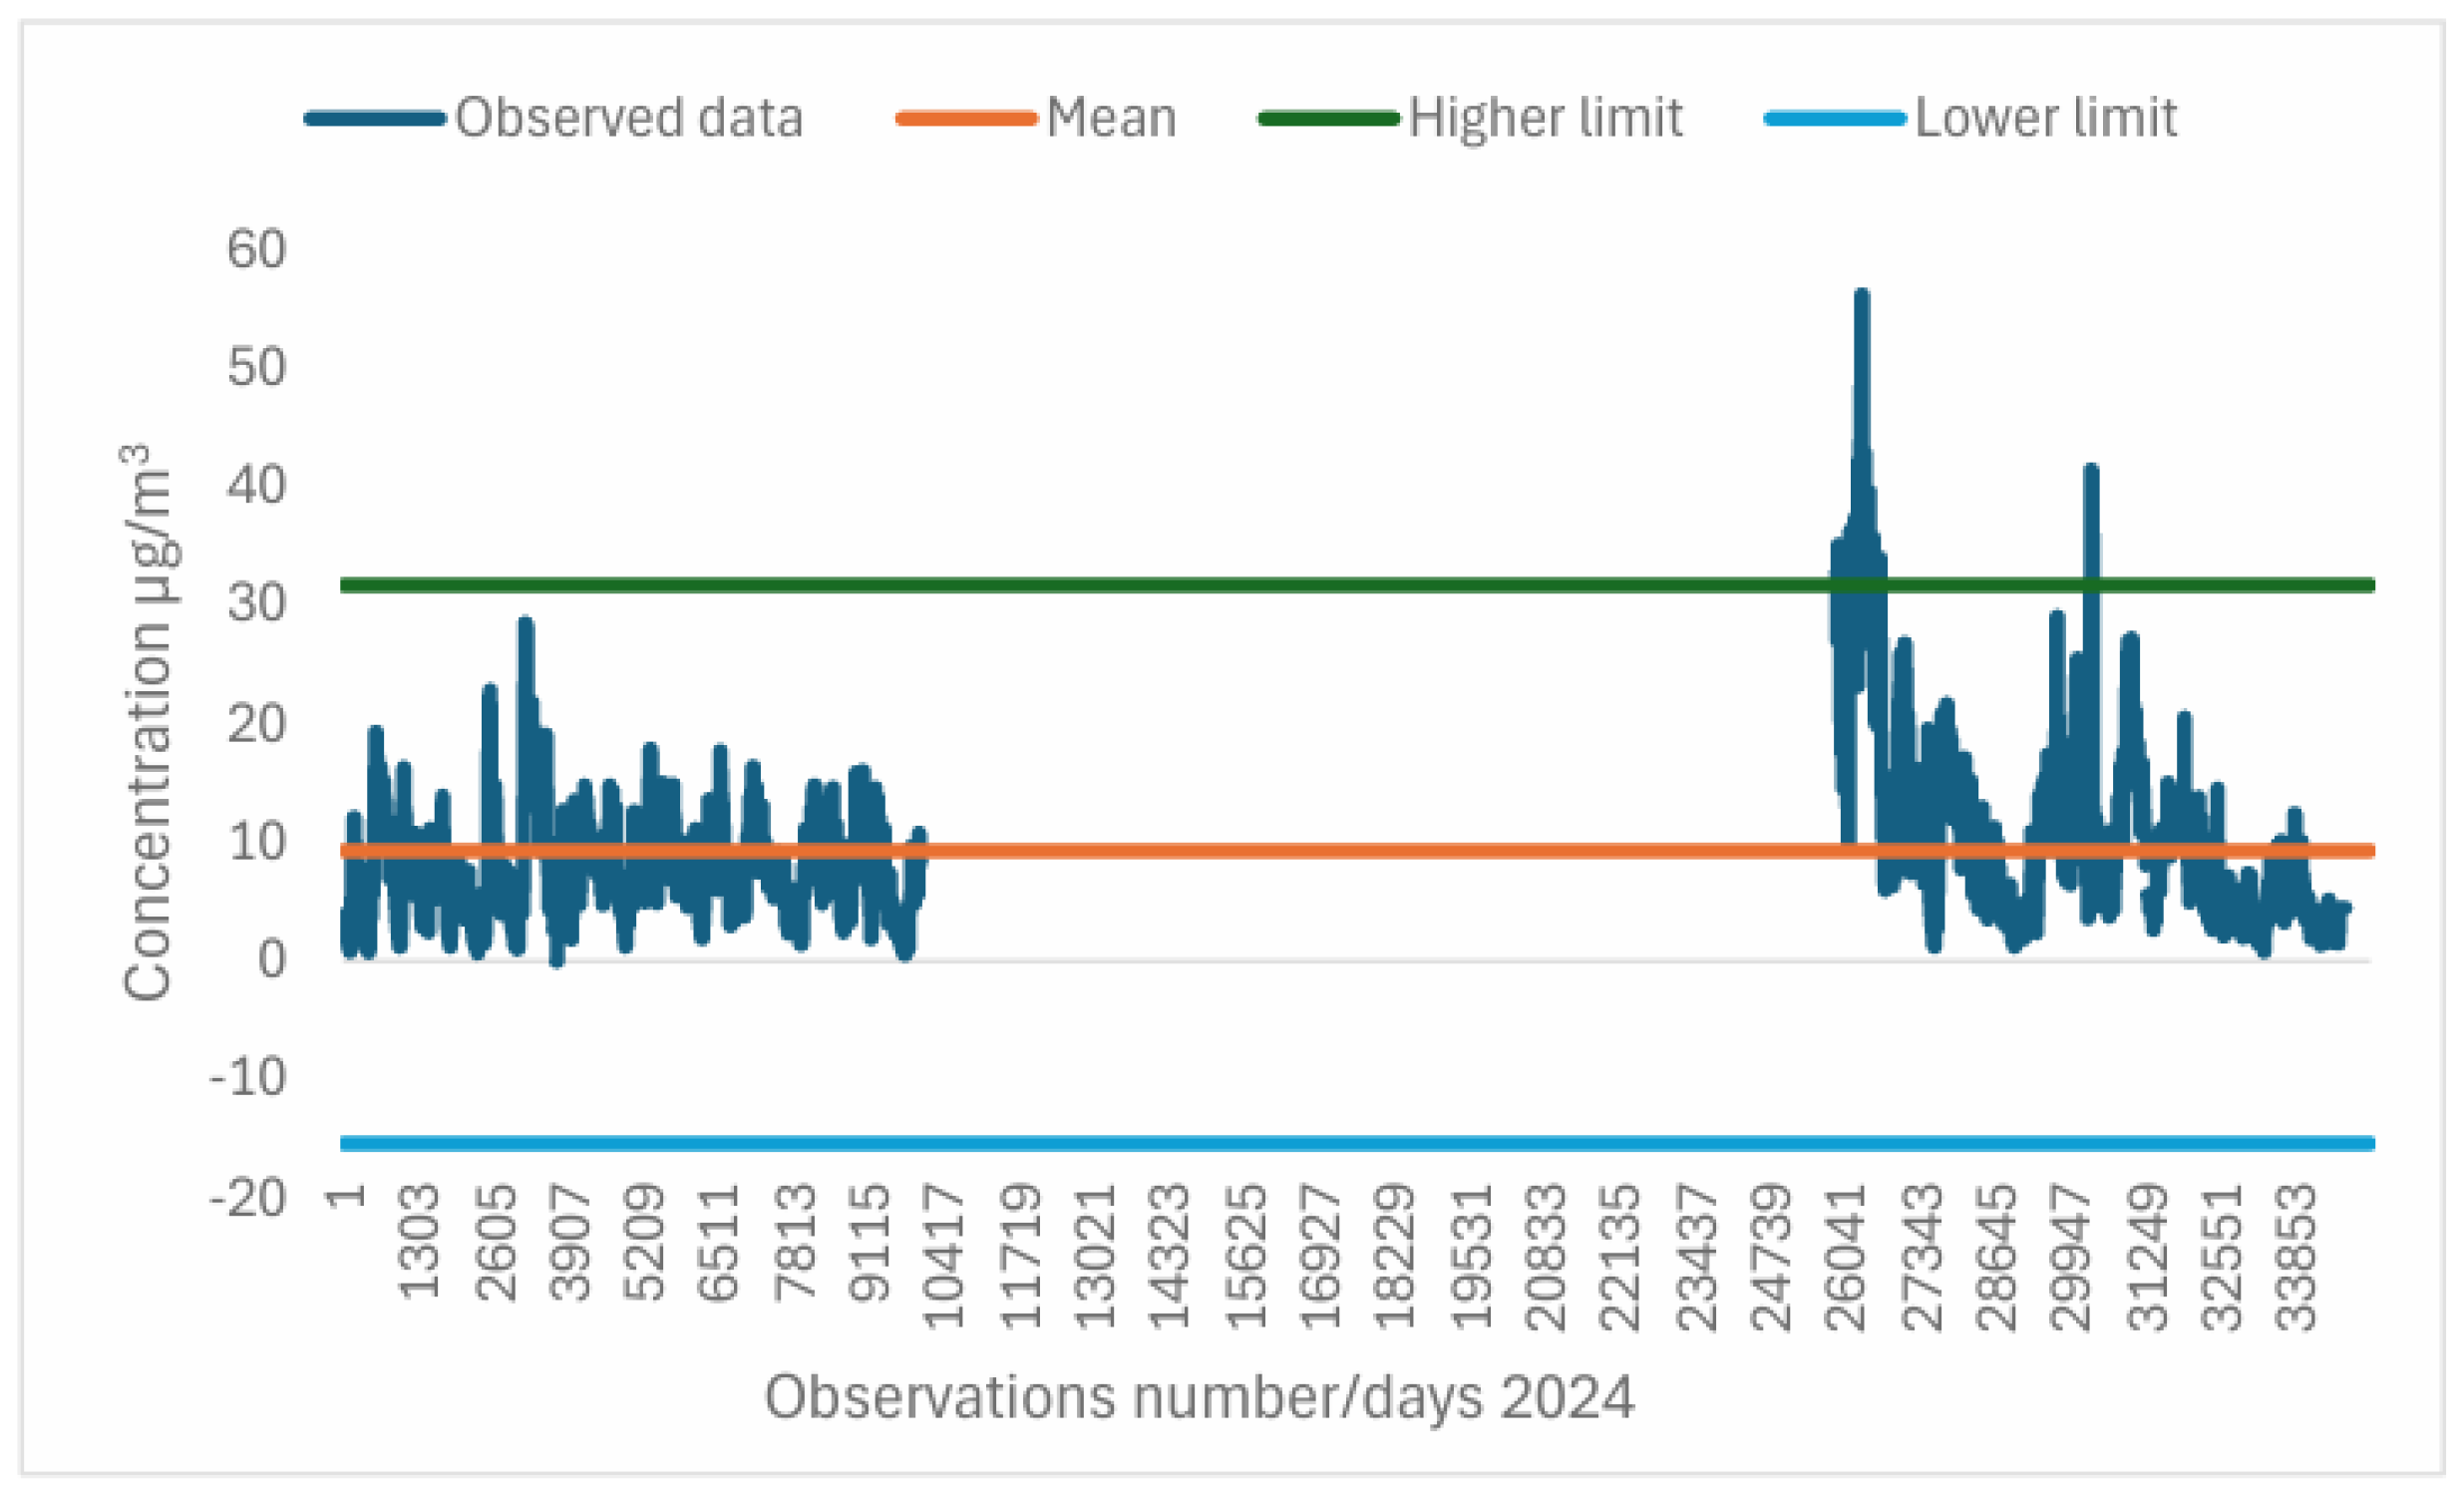
Figure 11.
Maps of the dispersion of PM10 particulate matter, during alert periods in the Azores [38,39,40,41,42,43,44,45,46,47,48,49,50].
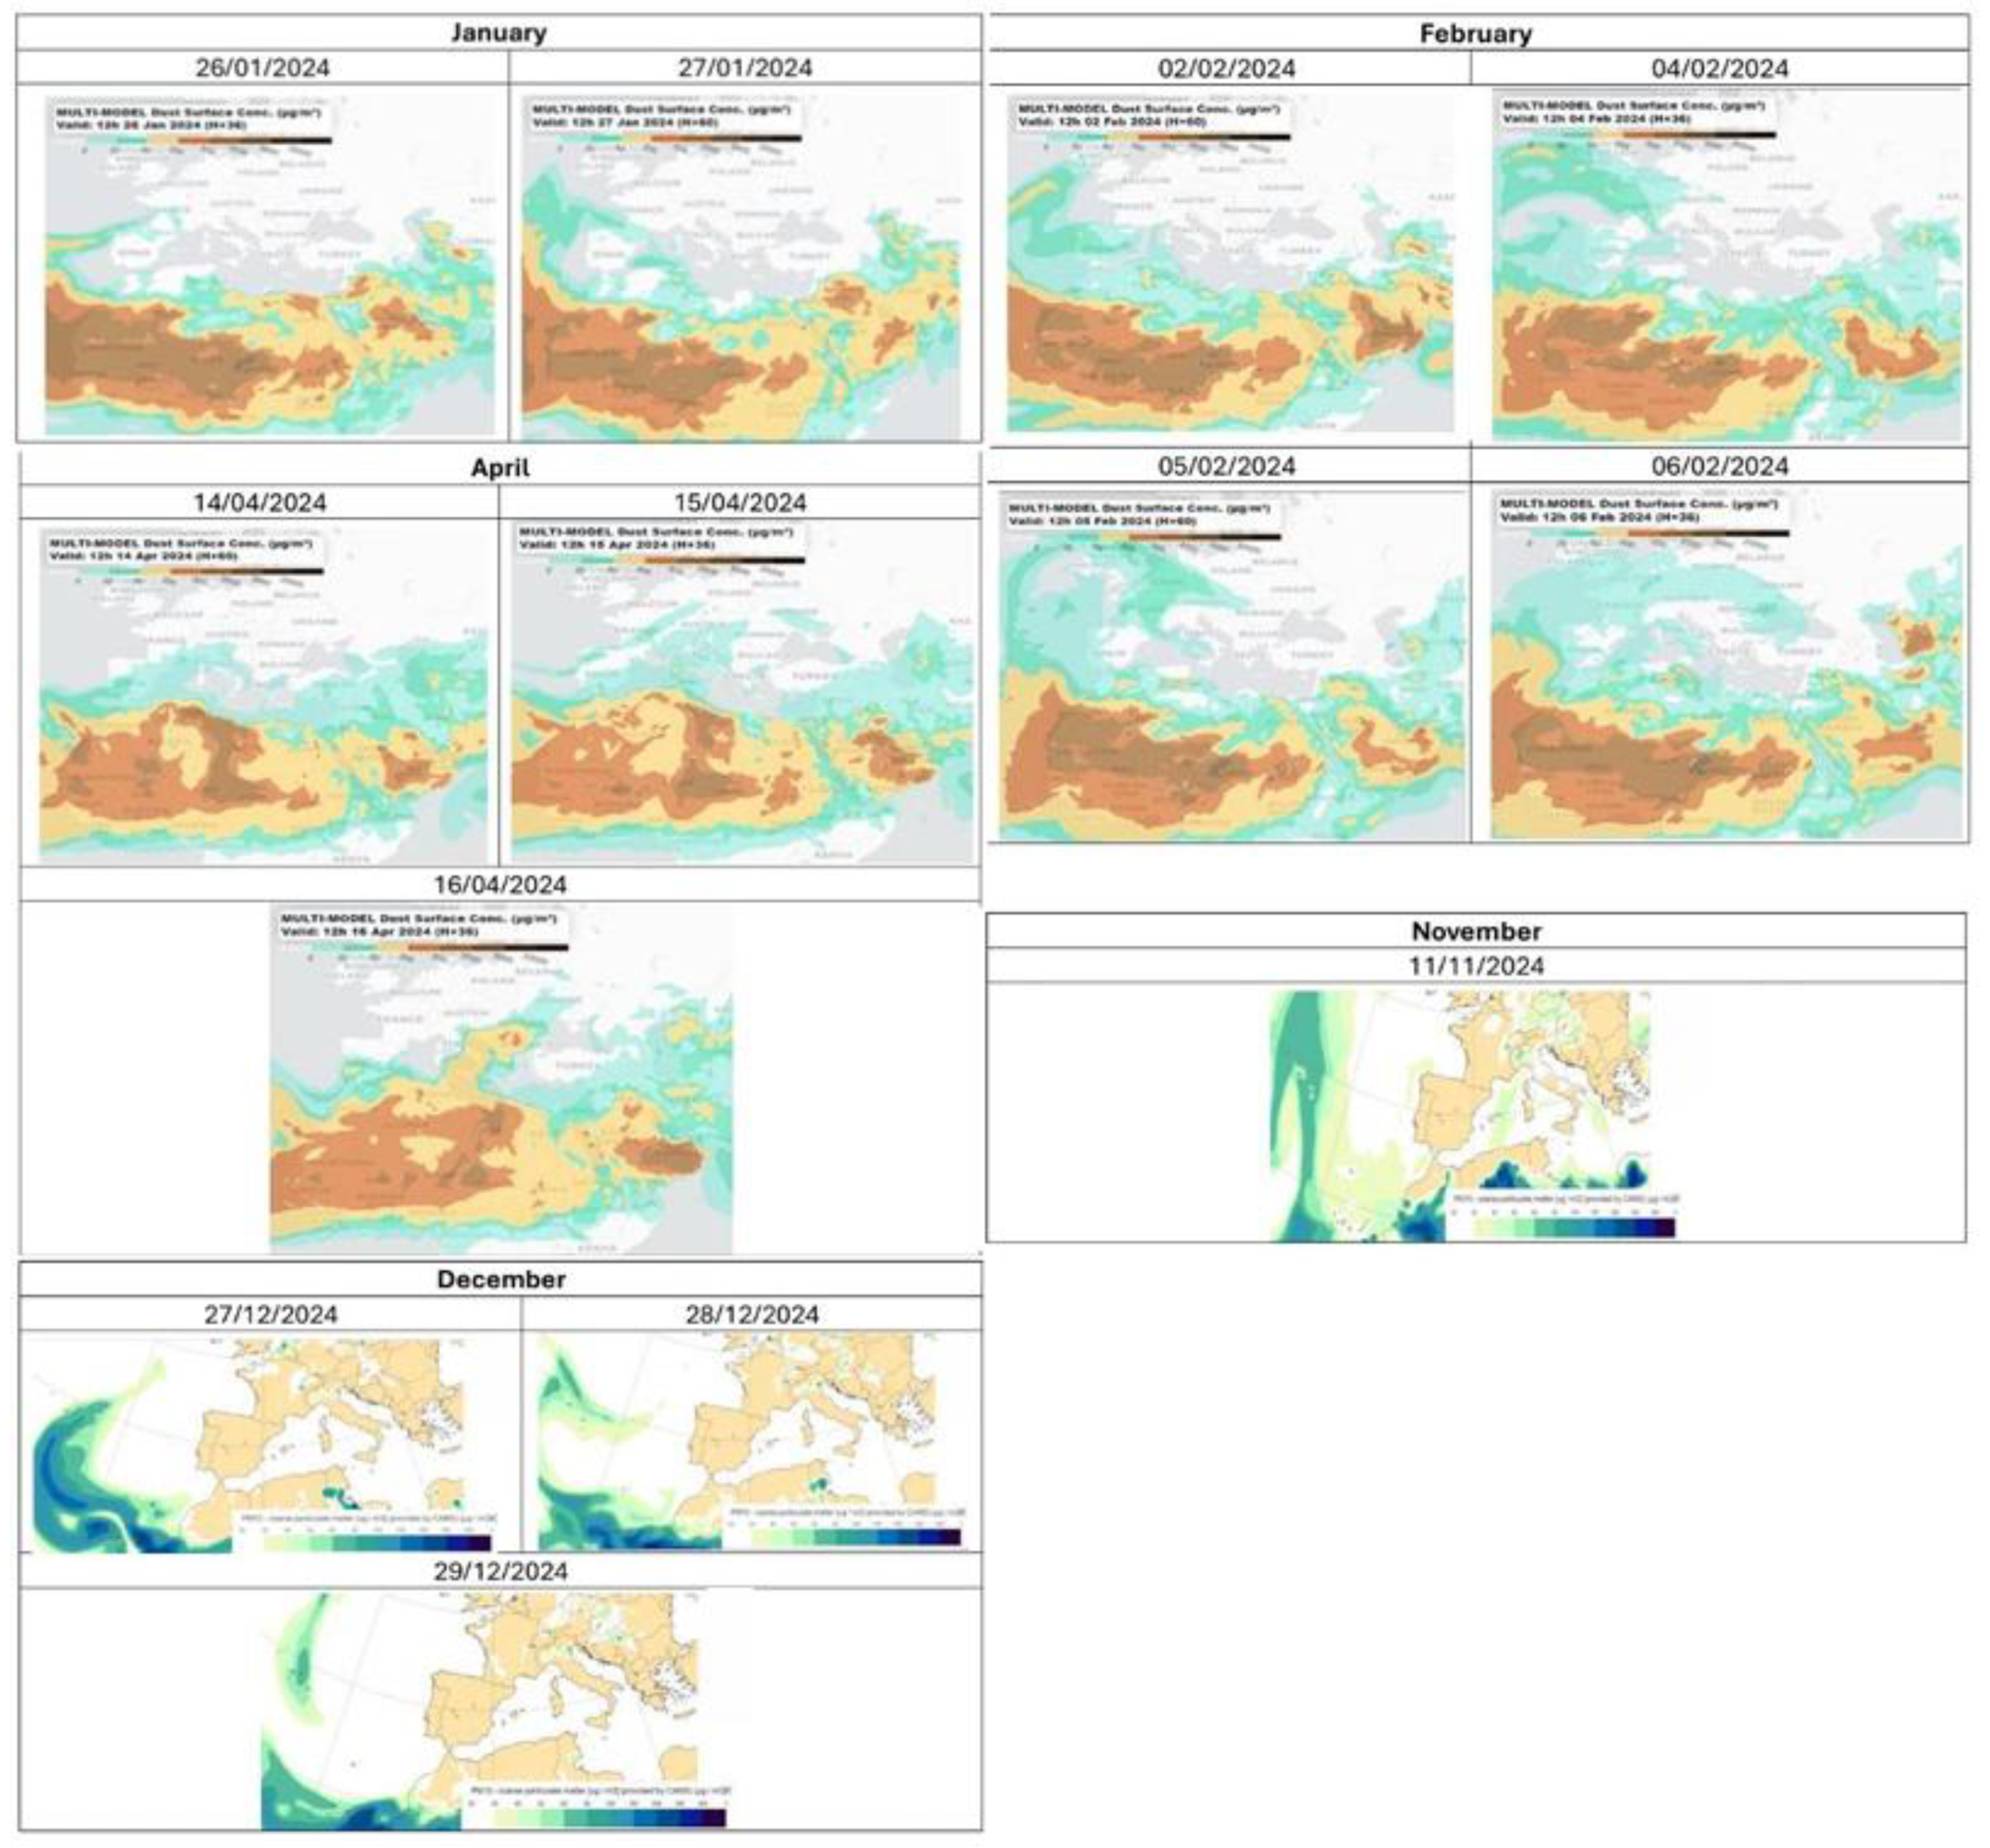
Figure 12.
Observed versus predicted O3 using lagged SO2 (lag = + 3h).
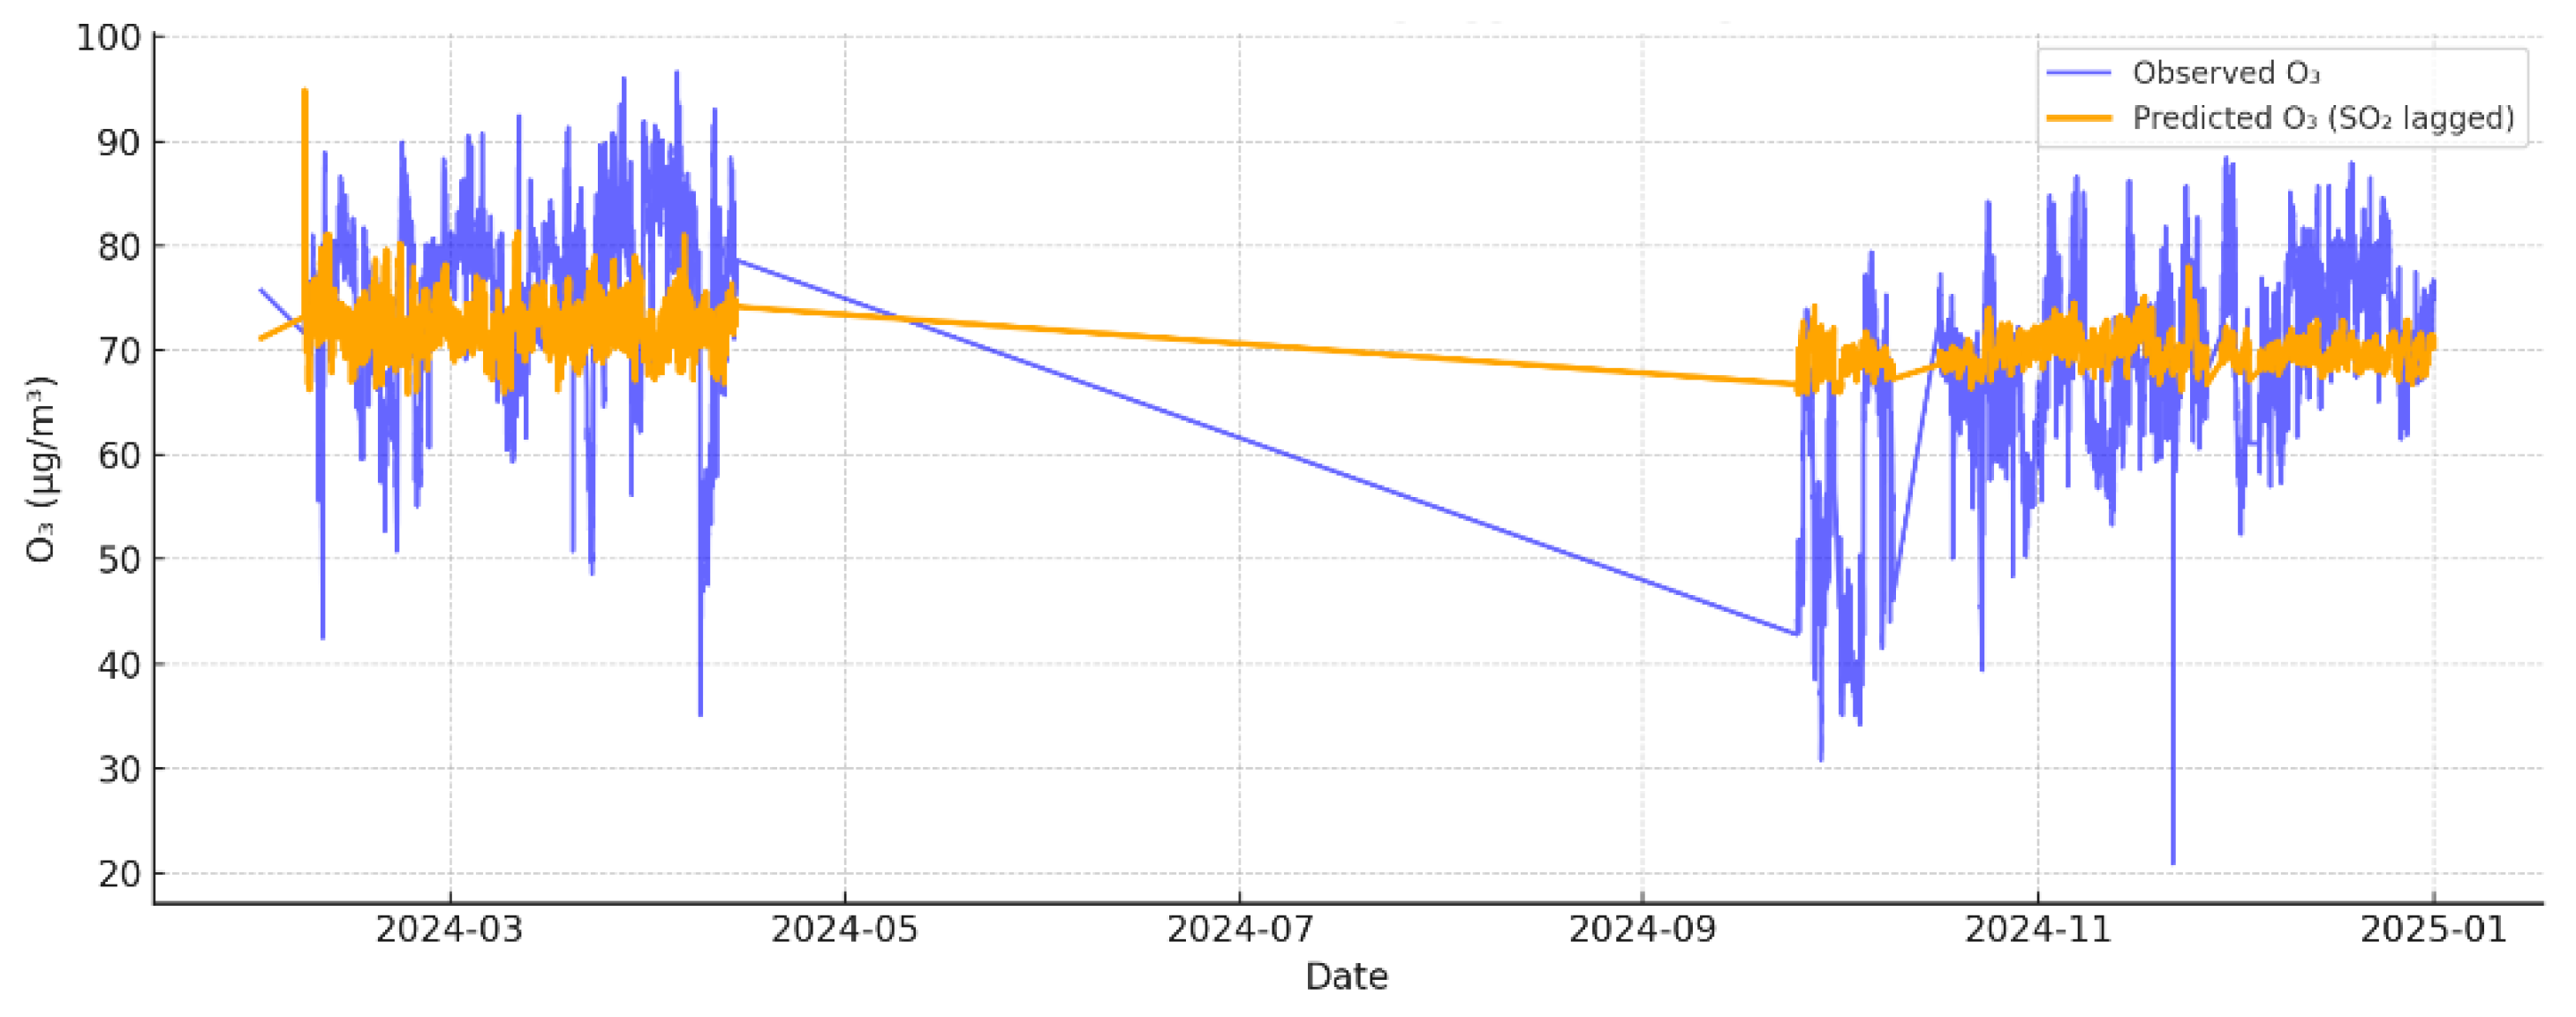
Figure 13.
Observed versus predicted SO₂ using lagged PM₂.₅ (lag = -6h).
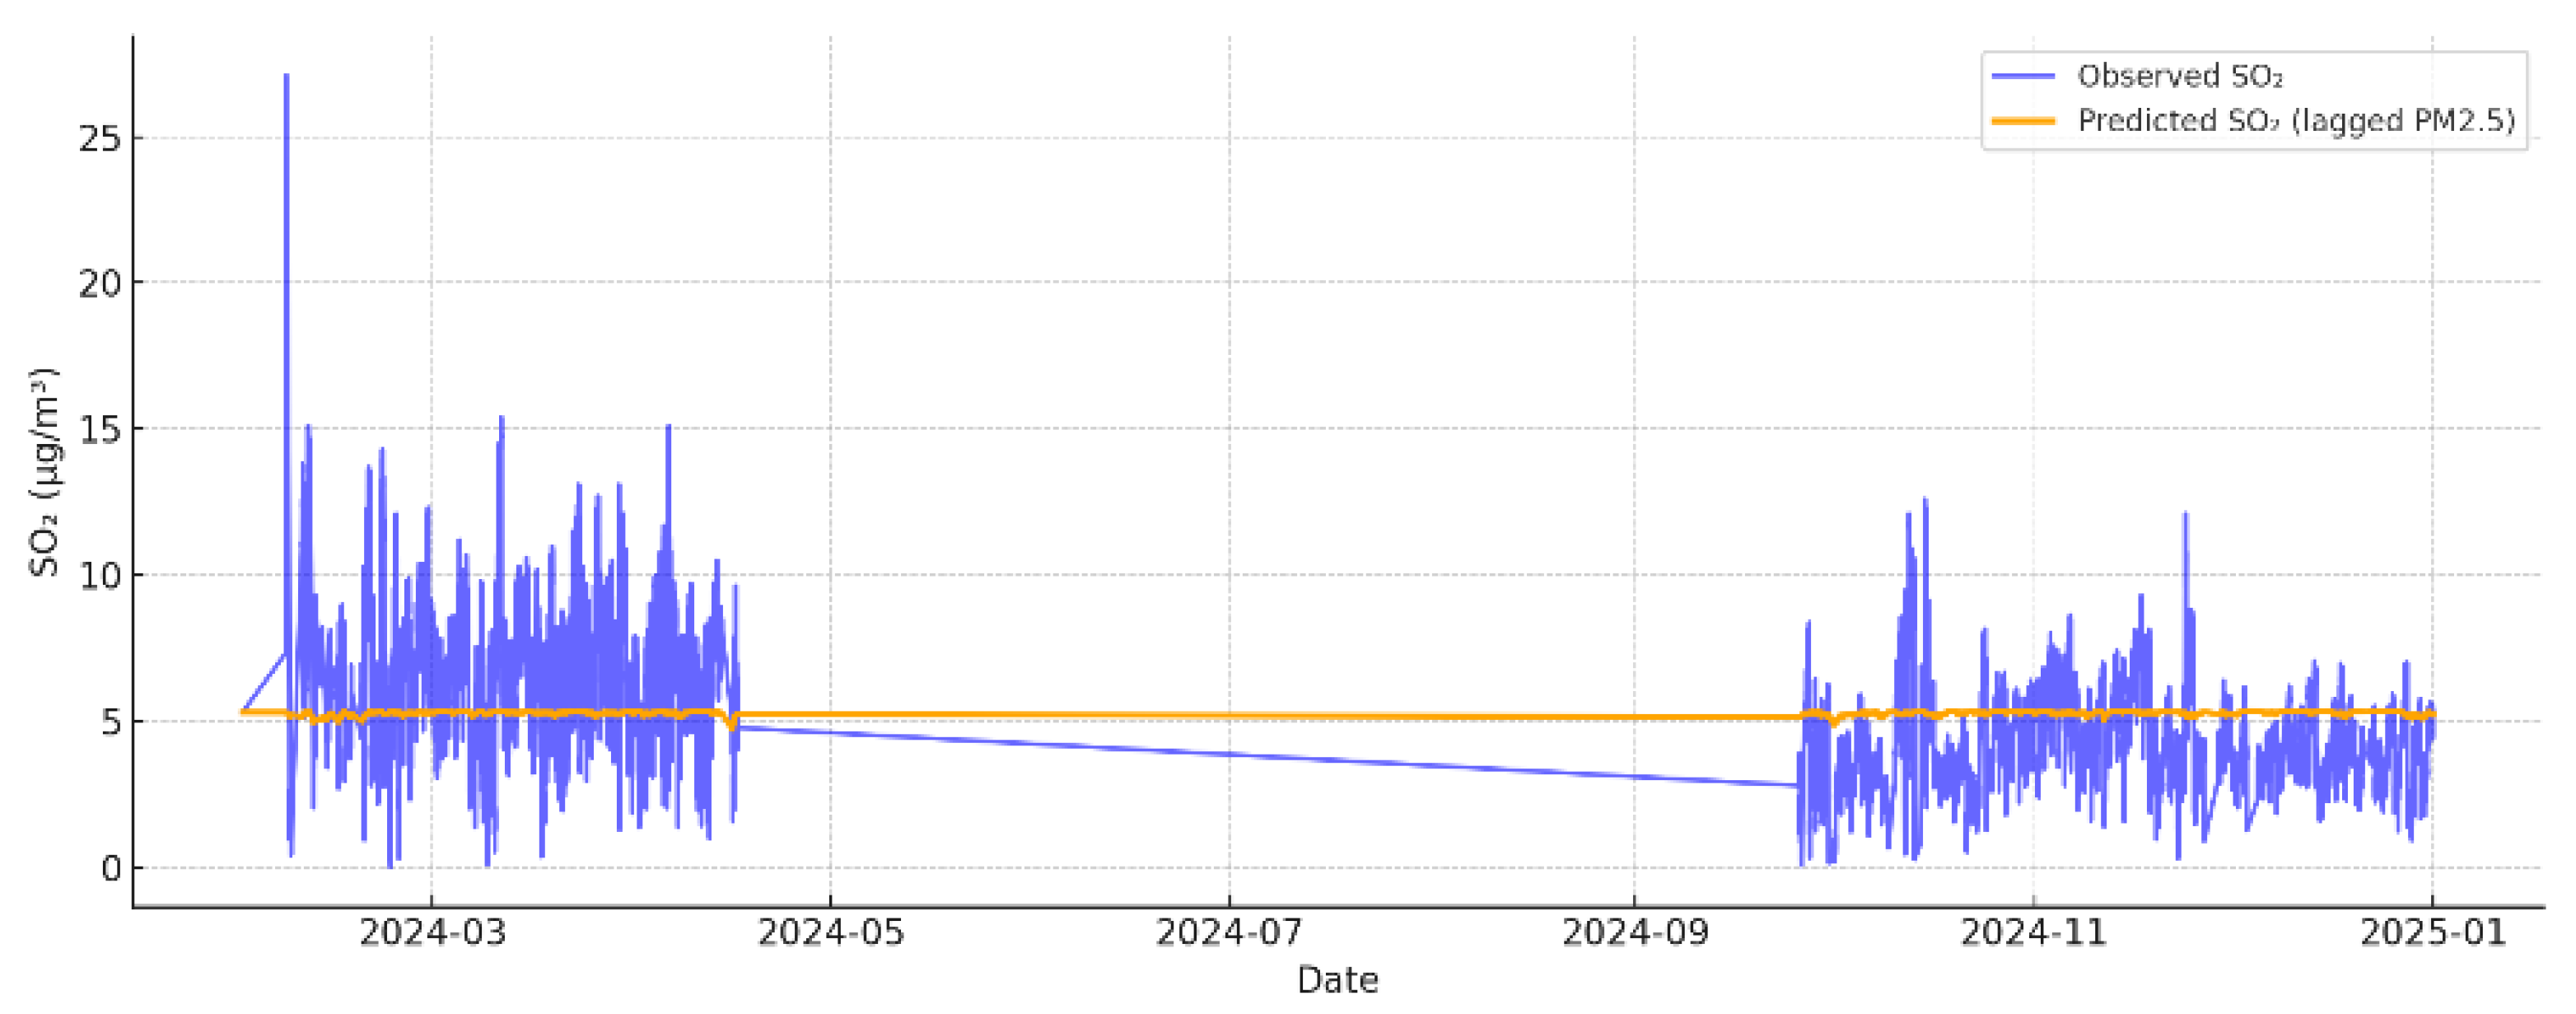

Table 1.
Descriptive statistics for PM2,5, PM10, SO2 and O3 concentration (μg/m3).
| Station _ Espalhafatos Faial (2024) | |||||
|---|---|---|---|---|---|
| PM2,5 | PM10 | SO2 | O3 | ||
| Total Data | 35137 | 35137 | 35137 | 35137 | |
| Missing Data | 17859 | 16593 | 20248 | 16637 | |
| Mean | 3.42 | 9.29 | 5.34 | 70.97 | |
| Median | 2.48 | 7.91 | 5.0 | 72.1 | |
| Standard Deviation | 3.64 | 6.83 | 2.37 | 9.74 | |
| Mode | 1.59 | 10.2 | 5.0 | 70.6 | |
| Variance | 13.25 | 46.67 | 5.61 | 94.92 | |
| Kurtosis | 85.31 | 6.08 | 2.12 | 14.17 | |
| Minimum Value | 0.4 | 0.49 | 0.02 | 9.74 | |
| Maximum Value | 62.7 | 56.2 | 28.9 | 284 | |
| Range | |||||
|
Percentiles |
25 | 1.59 | 4.77 | 3.57 | 66.2 |
| 50 | 3.42 | 9.29 | 5.34 | 70.97 | |
| 75 | 4.13 | 11.5 | 6.69 | 77.5 | |
Table 2.
Parameters of the distributions fitted to the observed PM2.5 data.
| PM2.5 | ||||
|---|---|---|---|---|
| Parameters | Mean | Standard Deviation | Shape | Scale |
| Normal Distribution | μ = 3.43 | σ = 3.69 | --- | --- |
| Weibull Distribution | --- | --- | c = 1.27 | λ = 3.74 |
| Lognormal Distribution | --- | --- | σ = 0.67 | ϴ = 2.64 |
| Gamma Distibution | --- | --- | α = 2.06 | ϴ =1.66 |
Table 3.
Parameters of the distributions fitted to the observed PM10 data.
| PM10 | ||||
|---|---|---|---|---|
| Parameters | Mean | Standard Deviation | Shape | Scale |
| Normal Distribution | μ = 9.3 | σ = 6.83 | --- | --- |
| Weibull Distribution | --- | --- | c = 1.43 | λ = 10.3 |
| Lognormal Distribution | --- | --- | σ = 0.74 | ϴ = 7.26 |
| Gamma Distibution | --- | --- | α = 2.18 | ϴ = 4.27 |
Table 4.
Fitting statistical distributions for PM2.5.
| PM2.5 | ||||
|---|---|---|---|---|
| Distribution | KS Statistic | p-value | AIC | BIC |
| Normal | 0.226 | 0.000000 | 94172.0 | 94187.5 |
| Weibull | 0.128 | 2.07e-246 | 75203.2 | 75218.7 |
| Lognormal | 0.044 | 1.23e-29 | 68725.9 | 68741.5 |
| Gamma | 0.089 | 1.84e-120 | 72812.2 | 72827.7 |
Table 5.
Fitting statistical distributions for PM10.
| PM10 | ||||
|---|---|---|---|---|
| Distribution | KS Statistic | p-value | AIC | BIC |
| Normal | 0.123 | 4.37e-263 | 123842.5 | 123858.1 |
| Weibull | 0.064 | 2.87e-67 | 115423.9 | 115439.6 |
| Lognormal | 0.058 | 4.83e-55 | 114784.3 | 114799.9 |
| Gamma | 0.045 | 1.48e-33 | 114488.1 | 114503.7 |
Table 6.
Upper and lower assessment thresholds for SO2 [37].
Table 6.
Upper and lower assessment thresholds for SO2 [37].
| SO2 | ||
|---|---|---|
| Upper assessment threshold | Health safety | Vegetation safety |
| 60% of the limit value per twenty-four hours period (75 μg/m3, not to be exceeded more than three times per calendar year). | 60% of the critical level applicable in winter (12 μg/m3). | |
| Lower assessment threshold | 40% of the limit value per twenty-four hours period (50 μg/m3, not to be exceeded more than three times per calendar year). | 40% of the critical level applicable in winter (8 μg/m3). |
Table 7.
Upper and lower assessment thresholds for PM2.5/PM10 [37].
Table 7.
Upper and lower assessment thresholds for PM2.5/PM10 [37].
| PM2.5/PM10 | |||
|---|---|---|---|
| Upper assessment threshold | Average per twenty-four-hour period (PM10) | Annual average PM2.5 (1) | Annual average PM10 |
| 70% of the limit value (35 μg/m3, not to be exceeded more than 35 times per calendar year). | 70% of the limit value (17 μg/m3). | 70% limit value (28 μg/m3). | |
| Lower assessment threshold | 50% of the limit value (25 μg/m3, not to be exceeded more than 35 times per calendar year). | 50% of the limit value (12 μg/m3). | 50% of limit value (20 μg/m3). |
(1) The upper assessment threshold and the lower assessment threshold for PMs do not apply to measurements made to assess achievement of the PM exposure reduction target.
Table 8.
Information and alert thresholds for O3 [37].
Table 8.
Information and alert thresholds for O3 [37].
| Objective | Reference period | Thereshold |
| Information Alert |
1 hour 1 hour |
180 μg/m3 240 μg/m3 |
Table 9.
Limit value for PM10 [37].
Table 9.
Limit value for PM10 [37].
| Reference period | Limit value |
|---|---|
| PM10 | |
| One day Calendar year |
50 μg/m3, not to exceed 35 times per calendar year 40 μg/m3 |
| Portuguese Environment Agency (APA) – Alert Excedence PM10 | |
|---|---|
| Date | Weather conditions |
| 01/26/2024 to 01/27/2024 |
In the Azores archipelago region, a synoptic configuration conducive to the transport of suspended particles (PM10) originating from North Africa was observed. On January 26, two anticyclonic nuclei — located over the Bay of Biscay and North Africa — interacted with a depression centered south of the archipelago, generating an easterly to southeasterly airflow in the lower levels of the troposphere. This circulation promoted the advection of air masses laden with Saharan dust, particularly over the Eastern and Central groups. Precipitation recorded in these sectors contributed to the wet deposition of particles, partially reducing atmospheric concentrations. On January 27, the synoptic situation evolved with the establishment of an anticyclone over Central Europe, extending as a ridge toward North Africa, while a depression moved slowly northeast of the Azores. This configuration resulted in a southerly airflow over the Eastern and Central groups, rotating to a northwesterly direction throughout the day, maintaining the regime of dust transport at altitude. The occurrence of precipitation once again played a mitigating role in the levels of PM10 concentrations. Nevertheless, the Portuguese Environment Agency (APA) issued an alert for PM10 exceedance, indicating concentration levels above the recommended air quality limits for the Azores during this episode. |
Table 11.
Weather conditions during a PM10 particle alert (exceedance) event in february [40,41,42,43].
| Portuguese Environment Agency (APA) – Alert Excedence PM10 | |
|---|---|
| Date | Weather conditions |
| 02/02/2024, 02/04/2024 and 02/05/2024, 02/06/2024 |
During early February 2024, multiple episodes of advection of suspended particles (PM10) originating from North Africa were recorded in the Azores, driven by various large-scale synoptic configurations. On February 2, 4, 5, and 6, the persistent presence of anticyclones located over the Iberian Peninsula, the Bay of Biscay, and North Africa, often associated with depressions to the west or northeast of the archipelago, resulted in prevailing easterly, southeasterly, and southerly airflow patterns in the lower levels of the troposphere over the Eastern and Central groups of the Azores. These atmospheric conditions favored the transport of air masses laden with desert dust at altitude, establishing a regime of natural-origin pollution. The occurrence of intermittent precipitation, particularly over the Eastern group, contributed to the attenuation of dust concentrations through wet deposition. |
| Portuguese Environment Agency (APA) – Alert Excedence PM10 | |
|---|---|
| Date | Weather conditions |
| 04/14/2024 to 04/16/2024 |
Between April 14 and 16, 2024, the Azores Archipelago was affected by a prolonged Saharan dust intrusion event, driven by persistent synoptic conditions favorable to the transport of suspended particulate matter (PM10) from North Africa. On April 14, the presence of a slow-moving anticyclone west of the Azores and an upper-level depression centered west of Madeira induced an easterly airflow over the Eastern and Central groups of the Azores at low atmospheric levels, promoting dust advection at altitude. Precipitation recorded over the archipelago contributed to wet deposition, partially mitigating the impact, with estimated PM10 concentrations ranging between 5 and 20 µg/m³ in the affected islands. On April 15, favorable circulation persisted, with easterly winds over the Western and Central groups and southeasterly winds over the Eastern group. This synoptic configuration continued to support the intrusion of desert particles, with estimated PM10 concentrations ranging from 5 to 20 µg/m³ in the Western and Central groups, and 20 to 50 µg/m³ in the Eastern group. By April 16, the anticyclone had shifted toward the west of the British Isles, while the associated depression moved slowly south of the Azores. This resulted in easterly flow over the Central group and southeasterly flow over the Eastern group, initiating the gradual displacement of the dust-laden air mass. Despite continued precipitation, PM10 concentrations remained elevated, with estimates between 5 and 20 µg/m³. Forecast models indicated the dissipation of the intrusion event on the following day. |
Table 13.
Weather conditions during a PM10 particle alert (exceedance) event in november [47].
Table 13.
Weather conditions during a PM10 particle alert (exceedance) event in november [47].
| Portuguese Environment Agency (APA) – Alert Excedence PM10 | |
|---|---|
| Date | Weather conditions |
| 11/11/2024 | On November 11, 2024, the Azores Archipelago was under the influence of a synoptic configuration dominated by an anticyclone centered over the British Isles, extending as a ridge toward the Madeira region. This pattern resulted in a southeasterly airflow in the lower levels of the troposphere, promoting the advection of air masses containing suspended particulate matter (PM10) originating from the deserts of North Africa. Precipitation over the Western and Central Island groups contributed to the wet deposition of dust particles, partially mitigating atmospheric concentrations. Estimates from the Portuguese Environment Agency (APA) indicated an increase in PM10 concentrations ranging from 5 to 20 µg/m³ due to this dust intrusion event. Forecast models for dust transport and dispersion suggested the dissipation of the event on the following day, as the dust-laden air mass moved away from the region. |
Table 14.
Weather conditions during a PM10 particle alert (exceedance) event in december [48,49,50].
| Portuguese Environment Agency (APA) – Alert Excedence PM10 | |
|---|---|
| Date | Weather conditions |
| 12/27/2024 to 12/29/2024 |
Between December 27 and 29, 2024, the Azores Archipelago was affected by a Saharan dust intrusion event, sustained by a synoptic configuration favorable to the long-range transport of suspended particulate matter (PM10) at altitude. On December 27, the presence of an anticyclone centered over Central Europe, extending as a ridge toward the Azores and North Africa, generated a southeasterly flow over the Central and Eastern groups, promoting the advection of Saharan air masses. Precipitation over the Central group contributed to attenuating PM10 concentrations, which were estimated to range between 5 and 20 µg/m³. On December 28 and 29, the anticyclone shifted northwest of the Iberian Peninsula, maintaining a ridge toward Madeira. This configuration resulted in southeasterly winds over the Central and Western groups, and easterly winds over the Eastern group, sustaining the dust transport over the archipelago. On both days, precipitation in the Western group partially mitigated particle concentrations; however, PM10 levels remained within the 5 to 20 µg/m³ range across the region. |
Table 15.
Heatmap of correlations (Pearson and Spearman coefficients) between PM2.5, PM10, O3 and SO2.
Table 15.
Heatmap of correlations (Pearson and Spearman coefficients) between PM2.5, PM10, O3 and SO2.
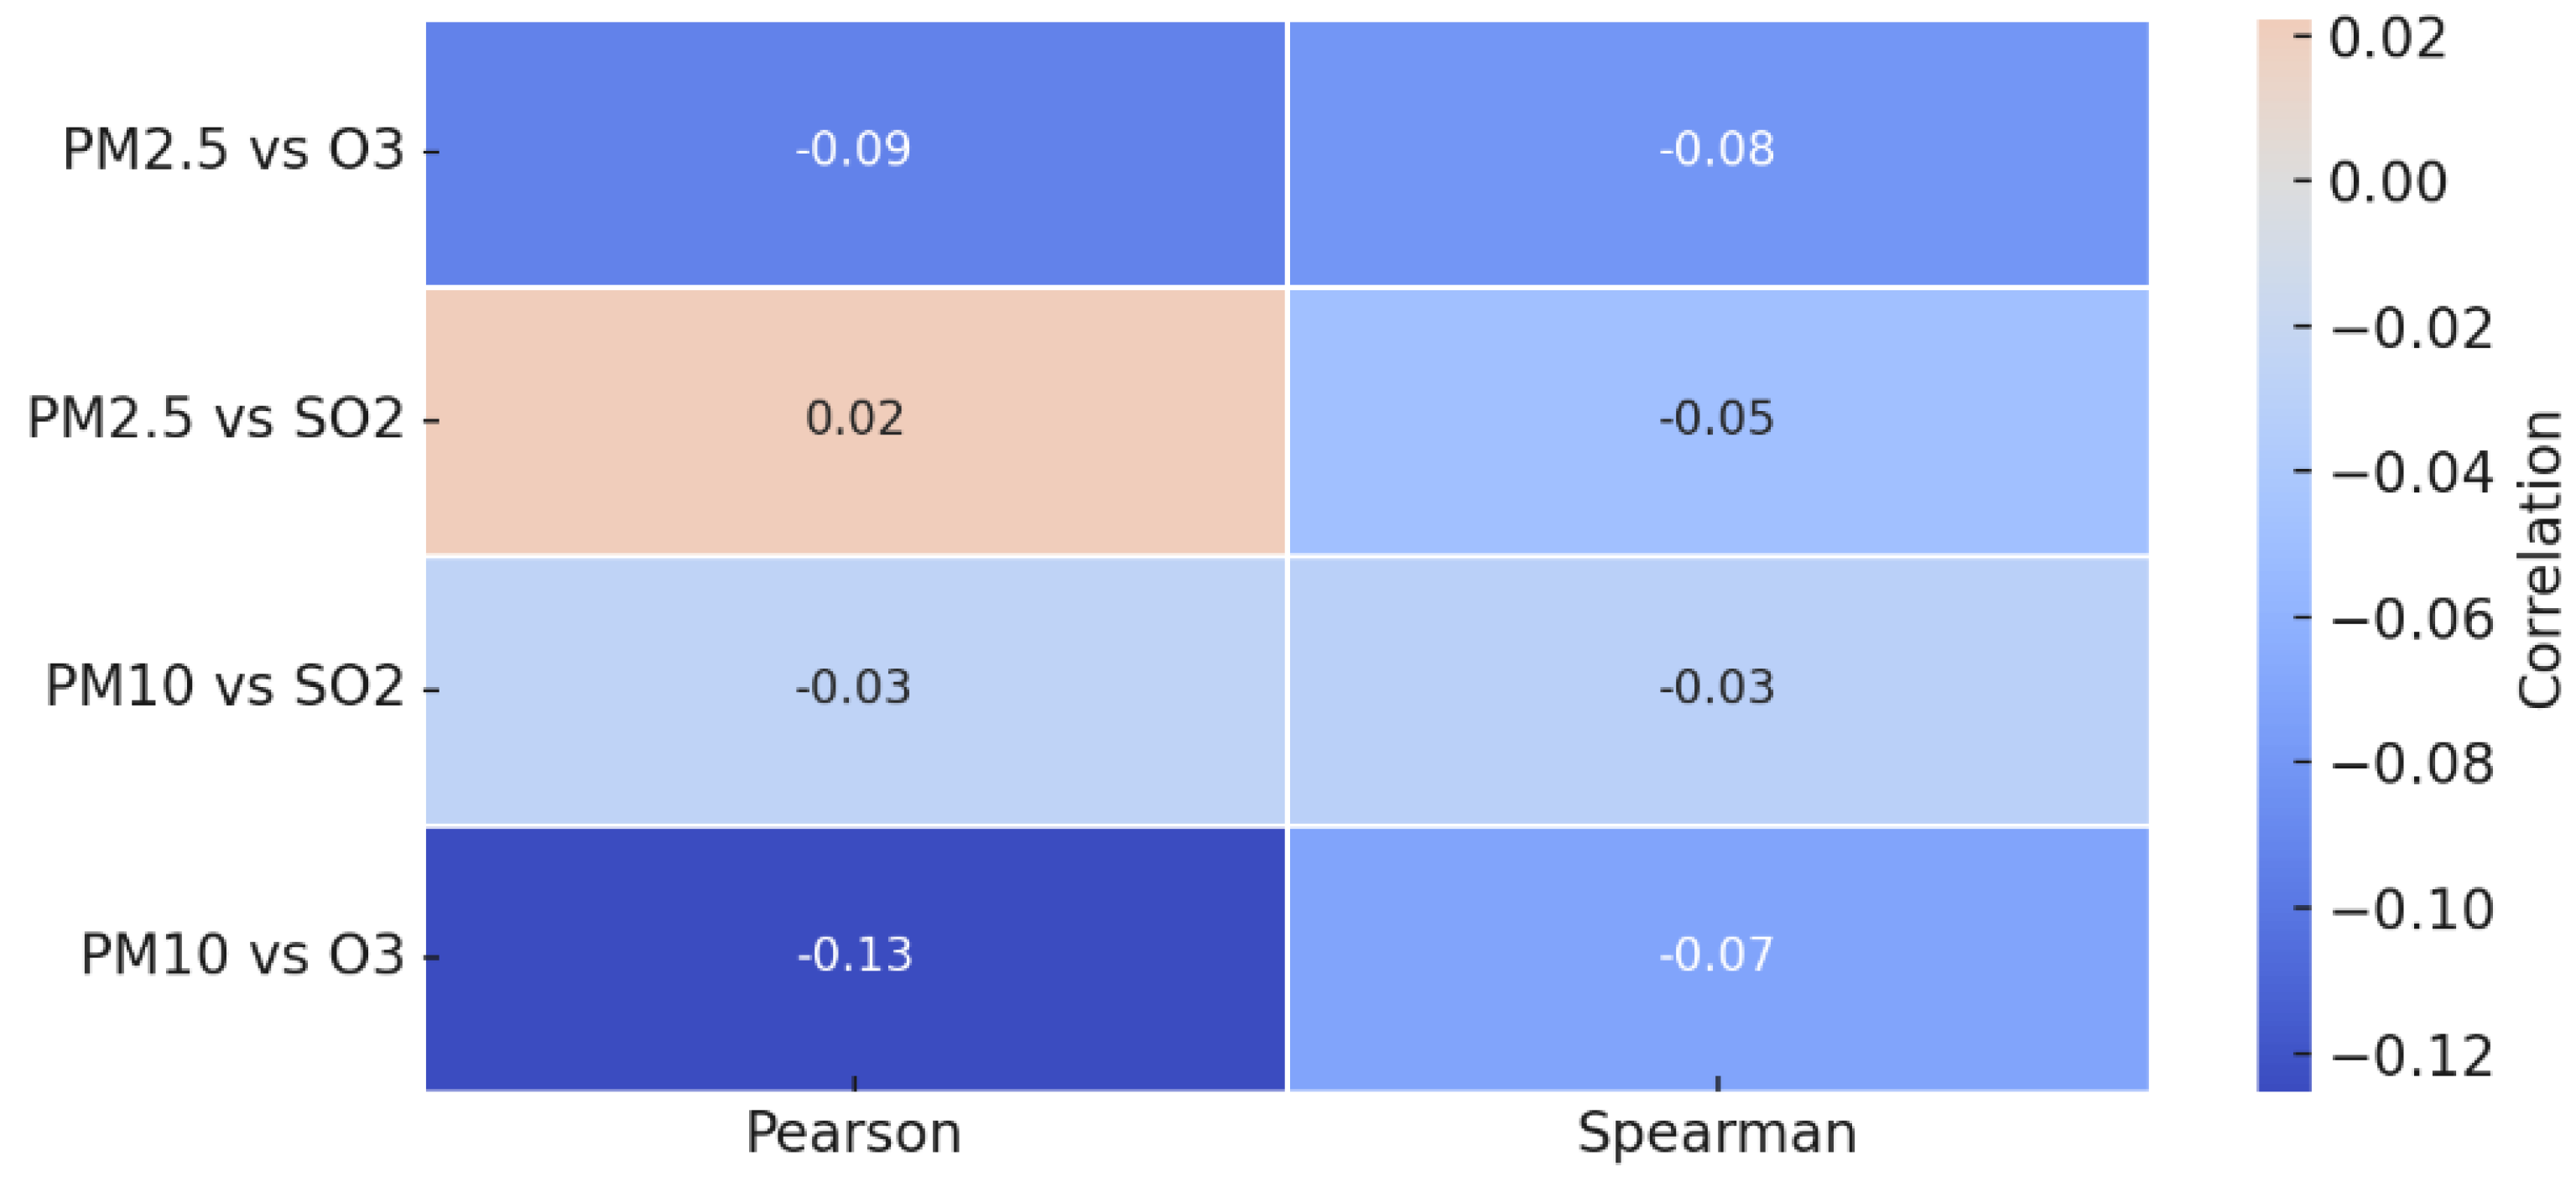 |
Table 16.
Correlations (Pearson and Spearman coefficients) between O3 and SO2.
| Method | Correlation |
|---|---|
| Pearson | 0,237 |
| Spearman | 0,289 |
Disclaimer/Publisher’s Note: The statements, opinions and data contained in all publications are solely those of the individual author(s) and contributor(s) and not of MDPI and/or the editor(s). MDPI and/or the editor(s) disclaim responsibility for any injury to people or property resulting from any ideas, methods, instructions or products referred to in the content. |
© 2025 by the authors. Licensee MDPI, Basel, Switzerland. This article is an open access article distributed under the terms and conditions of the Creative Commons Attribution (CC BY) license (http://creativecommons.org/licenses/by/4.0/).
Copyright: This open access article is published under a Creative Commons CC BY 4.0 license, which permit the free download, distribution, and reuse, provided that the author and preprint are cited in any reuse.


