Submitted:
11 April 2025
Posted:
06 May 2025
You are already at the latest version
Abstract
Residential electric vehicle (EV) charging has the potential to alter long-held assumptions on load characteristics impacting distribution grid planning, operations, and design standards. Indirect managed charging strategies like time-ofuse (TOU) rates can provide load shifting and thus alleviate or exacerbate grid impacts. This study presents findings on how a TOU as-soon-as-possible (TOU-ASAP) strategy increases adverse grid impacts relative to uncontrolled charging by incentivizing higher coincident loading, while TOU as-late-as-possible (TOUALAP) or TOU-Random reduces adverse grid impacts relative to uncontrolled charging. These findings offer key value proposition for utilities to consider as a potential least-cost grid solution under the increasing adoption of EVs in residential sector. Furthermore, this paper highlights the need for field-practical smart charge management algorithms developed using realistic grid data.
Keywords:
Electric vehicles
; managed charging
; time-ofuse
; advanced metering infrastructure
; load coincidence
; transformer loading
; EV-grid integration
1. Introduction
Today’s electric distribution systems have largely grown organically, in a piecemeal fashion, guided by evolving utility design standards for over a century. A changing energy land- scape is creating the need to amend legacy design standards through proactive thought on how distributed energy resources (DERs), building electrification, and electric vehicles (EVs) and EV supply equipment (EVSE (In the context of this study, we used EV supply equipment (EVSE) terminology to describe the device that interconnects the EV to the distribution system via appropriate communication and metering devices to enable smart charging. EV charger, on the other hand, denotes the power electronics converter responsible for AC-DC power conversion on-board the vehicle)) may change the industry’s long-held assumptions on the grid-edge dynamics. Histori- cally, utilities have used relatively simple heuristics to forecast load growth and gauge distribution infrastructure requirements, and until today, these methods have proven adequate. However, among global efforts to reduce carbon emissions, emerging grid-edge technologies have the potential to considerably alter load dynamics, increase infrastructure investments, and lead to overall greater system complexity [1,2,3,4]. Among this energy transition, utilities are grappling with the uncertainty in future load characteristics, adoption levels of new grid- edge technologies, and how to revise design standards such that today’s investments prove sufficient for the lifetime of the installed equipment.
Keeping the electrification trend in mind, this paper presents data-driven insights into the value of managed EV charging utilizing time-of-use (TOU) rate-based structures on two fronts i) load coincidence and transformer sizing requirements, and ii) grid impact analyses under uncontrolled and managed EV charging scenarios. Load coincidence factors are considered as key parameters to size distribution system assets. Research so far has focused on multiple facets of this problem such as demand diversity that EVs bring in for large-scale fleets considering available charging power and ambient temperature [5], impact of number of EVs and available EVSEs on coincidence factor [6], and statistical analysis of the charging behavior of real residential EV users in different geographic regions [7,8]. This study presents an analysis of coincidence factors based on advanced metering infrastructure (AMI) data obtained with utility collaboration and how those factors change with addition of EVSEs for residential consumers.
This study also enriches existing literature on how TOU schedules can shift EV charging loads away from typical peak load hours and the resulting grid benefits from doing so. Previously, extensive research has looked into characterizing the scope of technical and programmatic knowledge pertaining to EV charge management technologies and practices [13]. There has also been published work on finding optimal pricing schemes using actual residential circuit data [9], and utilizing historical datasets of car-sharing services corresponding to a fleet of light-duty EVs [10]. Effectiveness of TOU structures have been studied to ameliorate possible grid impacts of EVs [11,12]. This paper presents grid impacts especially on low-voltage consumers or secondaries based on varying TOU schemes on several distribution feeder models.
The rest of the paper is organized as follows. Section II discusses the load coincidence factor calculations utilizing AMI datasets, EV adoption assumptions, and TOUscenarios. These EV adoption and TOU scenarios are further explained in Section III, whereas data-driven transformer sizing con- sideration from the coincidence perspectives are presented in Section IV. Distribution grid impacts under these TOU based managed charging scenarios are discussed in Section V, before concluding remarks are presented in Section VI.
2. AMI Measurements to Inform Load Coincidence
Distribution design assumptions largely depend on typical load coincidence or the degree to which individual loads contribute to system-wide peak load. Prior to the industry- wide roll-out of AMI, utilities had little data accessible to gauge coincidence, relying mostly on high-level system data (i.e., substation-level SCADA measurements, customer counts, etc.). Notably, evaluating load coincidence at the granularity of a single service transformer is especially challenging, given the lack of data at this scale. Enhanced grid edge visibility can aid in prescribing design standards to appropriately size service transformers. Load coincidence is quantified using a coincidence factor, “the ratio of the maximum coincident demand of a group of consumers to the sum of the maximum power demands of individual consumers comprising the group both taken at the same point of supply for the same time” [14]. The coincidence factor is the reciprocal of the diversity factor and can vary across load types, customer classes, or times of the year.
AMI is providing first-of-its-kind empirical data to evaluate load coincidence at the grid edge. In this study, the National Renewable Energy Laboratory (NREL), in collaboration with a utility company, collected AMI-meter measurements from over 19,000 predominantly residential customers across ten distribution feeders. The datasets consider regions within two Colorado cities: Boulder and Aurora. These regions were selected as areas likely to see increased EV adoption in near future. AMI measurements used in this analysis ranged from September 2ndthrough September 8th, 2023, including active and reactive power measurements at a 15-minute temporal resolution. It is important to note that the selected week may not coincide with the system peak load nor does the data delineate customers with rooftop solar, energy storage, or pre- existing EVSEs (which is likely to be small compared to the assumptions in this study). This dataset only represents net load measurements, during a late-summer week in Colorado.
I. EV Adoption Forecasting and Passive TOU-Based Managed Charging
This study builds on NREL analyses assessing the potential for EV adoption in the selected geographic region by the year 2030 [17], as well as a mobility analysis, modeling the travel and charging itineraries of future EV owners to generate load profiles for each residential EVSE [18]. Across our AMI customer sample, EVs are allocated in a random fashion with about 26% of all customers having at least one EVSE at their home. The mobility analysis produced EV charging profiles for each customer under multiple TOU-based smart charge management (SCM) strategies, as well as uncontrolled charging. This study assumed a 100% participation rate (i.e., all EV customers are auto-enrolled for the program) for each SCM strategy, and that TOU rates are applied only to EV loads. The four SCM strategies are defined below:
- Uncontrolled: Customers begin charging as soon as they plug in, continuing until their energy needs are met.
TOU As-Soon-As-Possible (TOU-ASAP): Minimize to- tal charging costs while meeting energy requirements under a TOU rate, prioritizing completion of charging as soon as possible within the dwell period beginning at 7 PM and ending at the morning departure time which is different for each customer modeled.
- TOU As-Late-As-Possible (TOU-ALAP): Minimize to- tal charging costs while meeting energy requirements under the TOU rate, prioritizing charging completion as close to departure time as possible within the dwell period.
- TOU Random (TOU-Random): Minimize total charg- ing costs while satisfying energy needs under the TOU rate, with random charging periods chosen within the dwell period. Randomization is done via a random weight function to randomly assign charging start time between the plug-in and -out times, while also minimizing the charging cost [18].
All TOU-based SCM algorithms assume minimal to no interaction with EV customers with the help of inferring data from historical measurements from customers such as departure times.
II. Load Coincidence and Transformer Sizing
The AMI dataset was used to create a basecase load characterization of residential loads in the study area. This alone, provides insights into real-world load characteristics and the adequacy of today’s design standards. Coincidence factors generally decrease with increasing customer sample sizes, asymptotically approaching a value at larger sample sizes. Given the objective of this analysis is to inform service transformer design standards for residential services with increasing EV adoption, we cap our maximum sample size to 50 customers, as more than this would likely not be served by a single transformer of the evaluated single-phase sizes: 25 kVA, 50 kVA, and 100 kVA.
Coincident and non-coincident peak load is calculated across the modeling time frame for each customer sample size (1 to 50) using 1,000 random customer samples for each sam- ple size. For example, given a sample size of ten customers, we make 1,000 random selections of ten customers from the AMI dataset and calculate coincident and non-coincident peak load for each selection. The values in Figure 1 represent the top-quartile mean across the 1,000 randomized samples. Figure 2 shows the customer counts at which the calculated coincident peak load reaches 100% of the nameplate rating for the three evaluated transformer sizes. Within the basecase, we see our coincidence factor asymptotically approach 0.44 for a 50 customer sample, yielding 6-, 16-, and 36-customer limits for a 25, 50, and 100 kVA transformer, respectively.
Under the four SCM algorithms, we see notable differences in transformer customer limits. Relative to the basecase, the addition of EVs utilizing uncontrolled charging increases coincident loading, though the coincidence factor is largely un- changed, reducing the allowable transformer customer limits. For smaller transformers (25 and 50 kVA), the customer-limit is about halved. TOU-ASAP results in a higher coincidence factor and higher coincident load, given that EVSEs start their charge cycle at the same time to minimize charging cost, further reducing transformer customer limits relative to uncontrolled charging. This indicates that uncontrolled charg- ing may actually out-perform a TOU-ASAP strategy. Both TOU-Random and TOU-ALAP effectively spread out charging throughout the night, reducing load coincidence compared with uncontrolled charging, and increasing the transformer customer limits.
The improvements in load coincidence and transformer cus- tomer limits under TOU-ALAP and TOU-Random represents one of the value propositions for indirect managed charging. These programs, as modeled, show promise in reducing po- tential transformer overloads of existing distribution assets as EVSEs are added to existing services and reducing the number of new transformers and accompanying infrastructure needed to serve new residential services. While this study highlights the potential value of indirect managed charging, a logical next step in future work is to investigate more direct control options and uncover further increases in equipment utilization.
3. Distribution Load-Flow Modeling for Grid Impact Assessment
The previous analysis does not rely on extensive system datasets like Geographic Information System (GIS) datasets or load flow models, and as such, can be performed relatively easily as AMI is integrated with utility planning and fore- casting. This section, however, sought to examine the broader distribution grid impacts of EV adoption and the stacked value proposition of SCM strategies.
The NREL team obtained several datasets collaborating with the utility partner to construct primary and secondary distribu- tion models in OpenDSS. Primary-only (not including service transformers or secondaries) Synergi load-flow models for ten selected feeders were converted to OpenDSS using NREL’s DITTO tool [16]. These feeders were chosen to examine system impacts of higher EV adoption in residential areas. To craft secondary models, the NREL team developed methods to integrate myriad additional datasets (including GIS representa- tions of secondary topologies, customer-transformer mappings, conductor and transformer specifications, and more) to the best of our ability. While the datasets were extensive, conflict- ing and/or missing information required many simplifications and/or assumptions to be made, yielding imperfect primary- plus-secondary load flow models. Assumptions were largely based on engineering judgment or guidance from the collabo- rating utility team and were made regarding several character- istics of the grid model like customer-transformer groupings, transformer locations within secondary networks, secondary conductors used, transformer and conductor impedance, and any additional missing or inconsistent data points. Addition- ally, these models have no direct representation of premise- level load unbalance; secondary-system capacitors or VAR compensators; centralized control schemes used in Volt-VAR optimization schemes; behind-the-meter assets like solar, stor- age, or existing EVs. As such, the results should be taken with the appropriate level of discretion, but nonetheless, we believe they contain valuable insights. The resulting feeder model statistics are provided as well to contextualize the findings. One should also note that aggregated load profiles at the service transformer level were used for this modeling exercise (allocated evenly across all customers served by the transformer) rather than the customer-level measurements used in the previous analysis. The NREL team also synthesized some missing AMI data to approximate total loading on a given service transformer with incomplete AMI coverage. The following results represent the modeling of one sample feeder, with the technical characteristics summarized in Table 1.
A. Feeder-Level Loading
Figure 3 shows the feeder-head loading for our test feeder, under the various SCM scenarios and the basecase. On a feeder level, we see substantial changes in loading (kVA) with the addition of EVs with the percentage increases in peak loading (relative to the basecase) listed next to each legend entries. One should note that while the AMI datasets provided both active and reactive power, the on-board EV chargers are assumed to operate at unity power factor, resulting in minimal changes in reactive power loading across scenarios.
Due to the high coincidence of EV charging loads under some scenarios, namely TOU-ASAP, we see very large load- ing increases in the evenings at the beginning of the rate change (7 PM). Under TOU-ASAP, this more than doubles the feeder-wide peak load (+143%) compared with a +55% increase for uncontrolled charging. In contrast, a TOU-ALAP or TOU-Random provide substantial reductions in loading relative to uncontrolled charging each increasing load by about 12% relative to the basecase. This result reinforces the same conclusions from the AMI-based analysis: SCM strategies that encourage higher load coincidence will lead to higher overall loading and may increase infrastructure costs, whereas SCM strategies that lower load coincidence may present a value stream in deferred or avoided upgrades or fewer/smaller asset needs for new builds. Figure 3 also illustrates the potential for further improvements in the feeder loading via well-informed strategies to shift EV charging loads throughout the day. This is a topic of future study.
B. Point of Common Coupling (PCC) Voltage and Imbalance Analysis
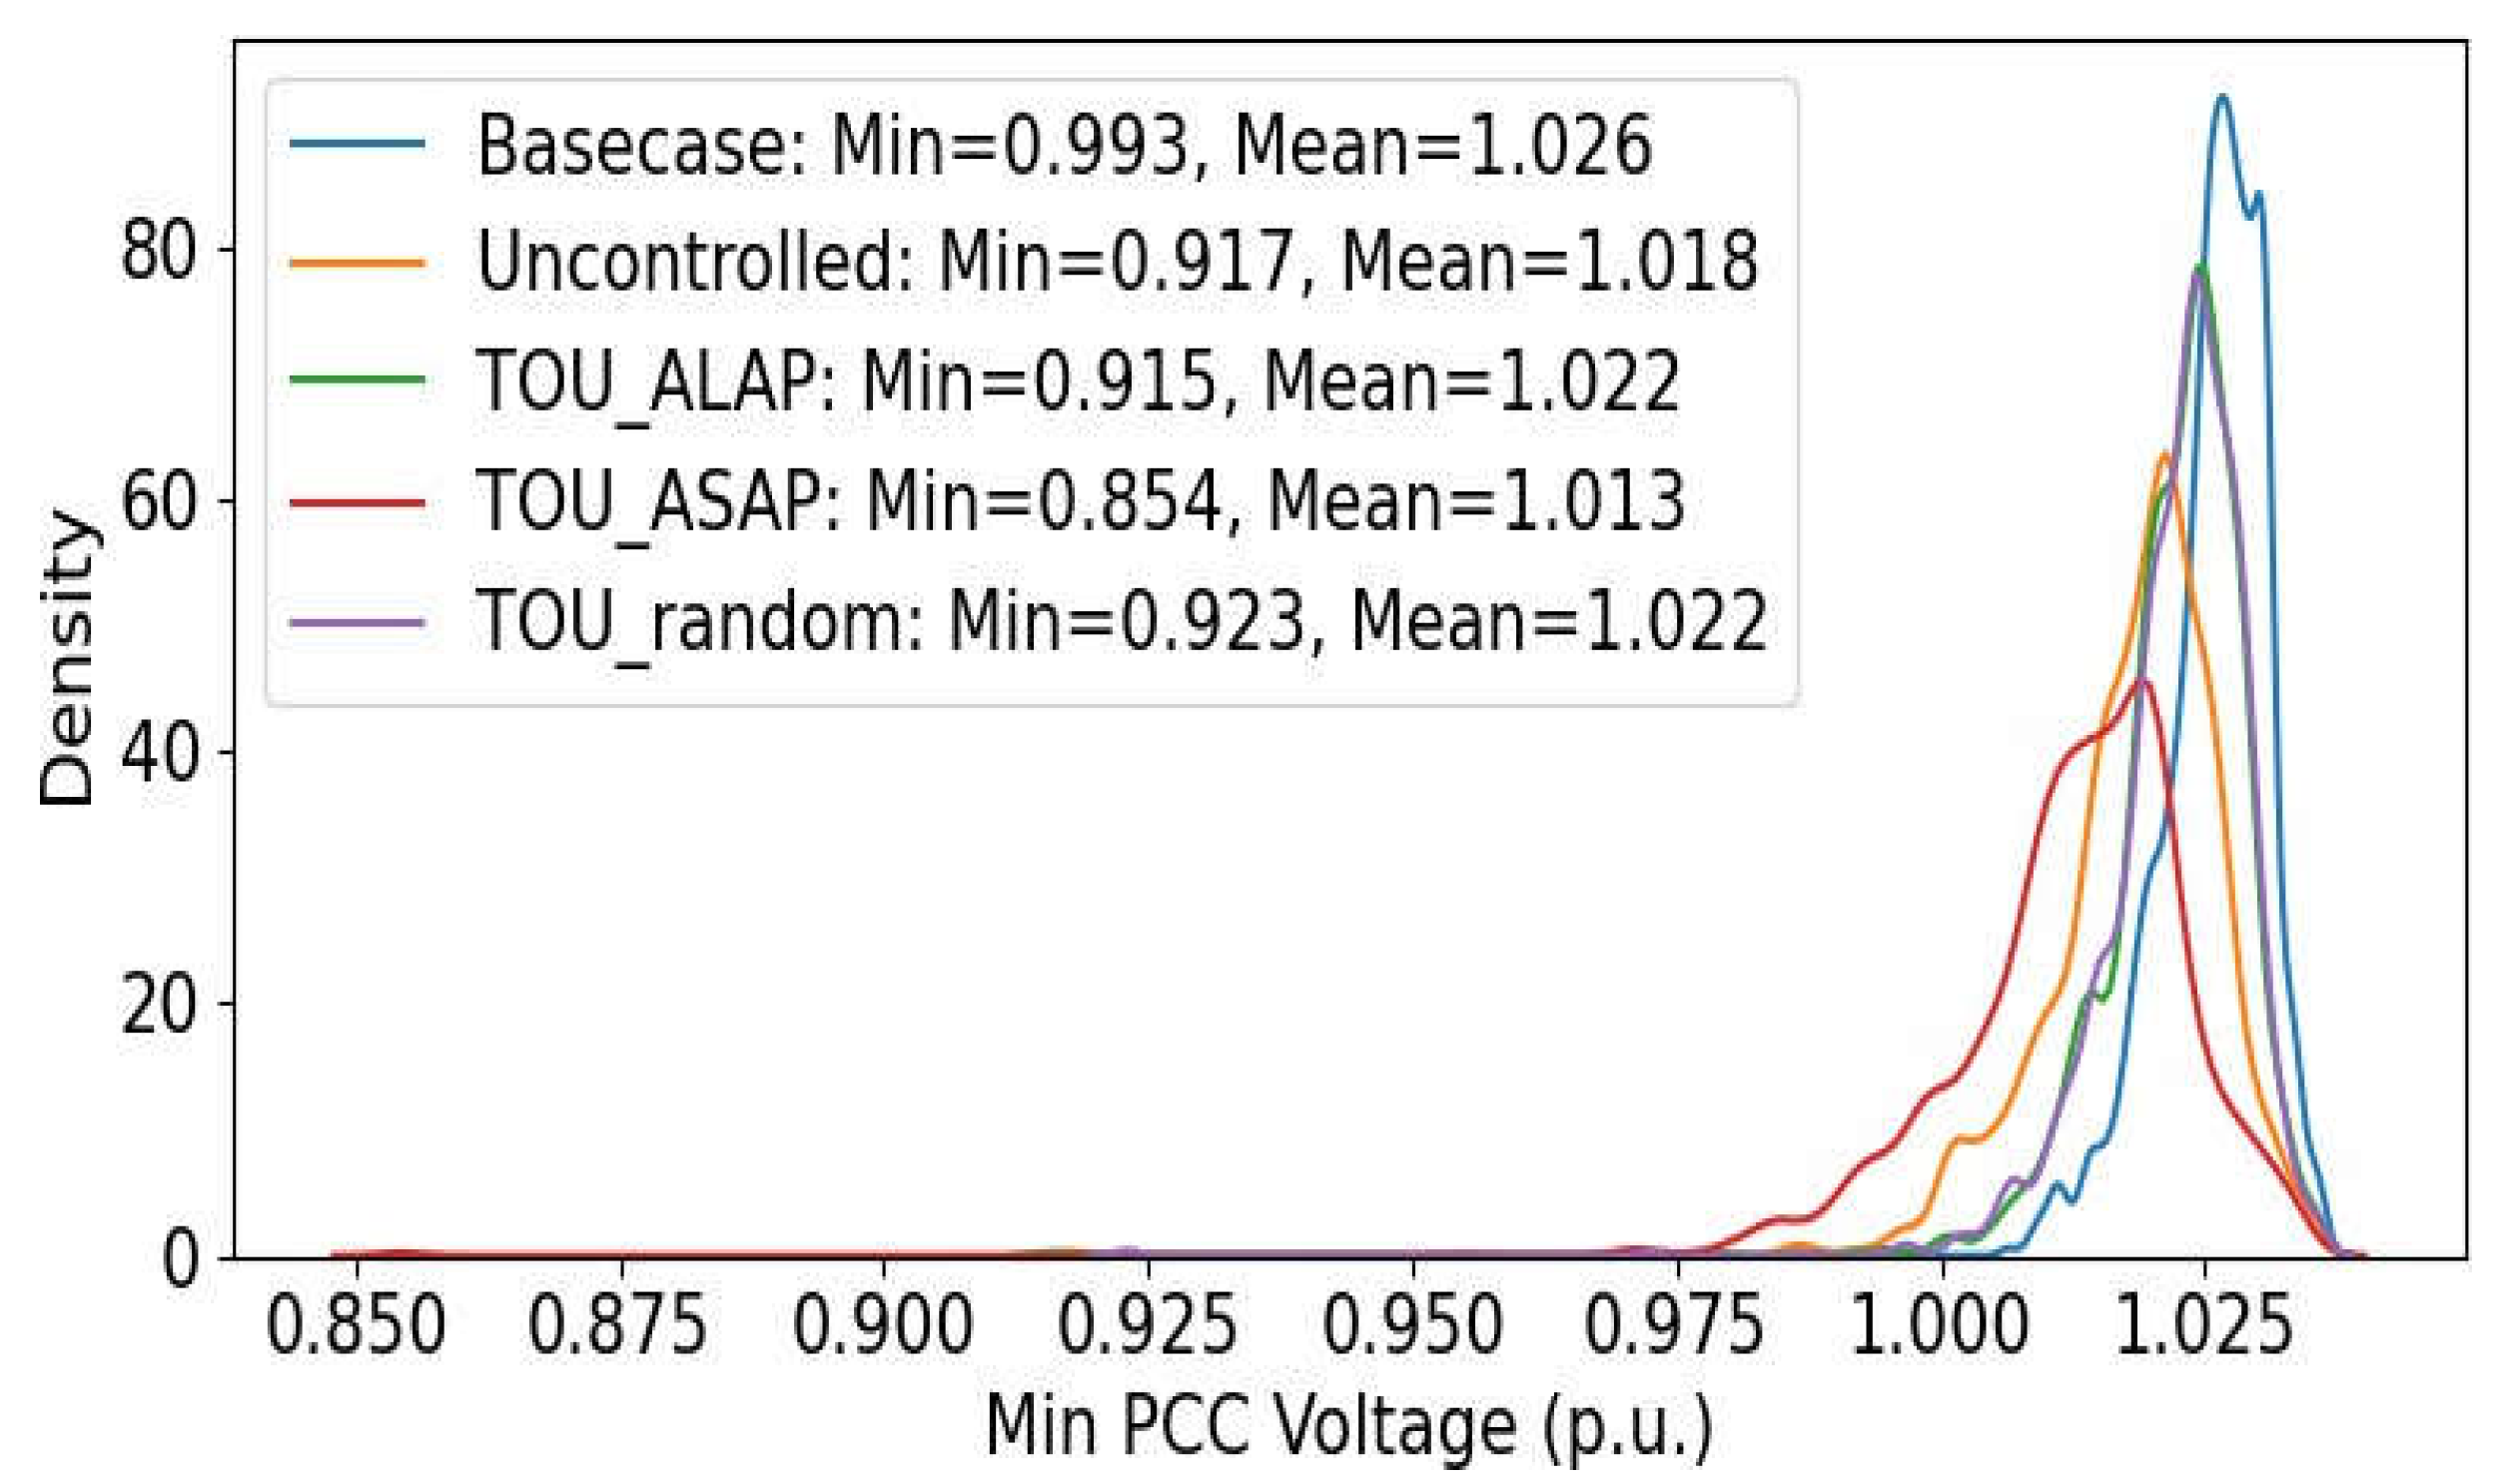
In addition to loading levels, we assessed the power quality measures across EV adoption and SCM strategies. We perform this assessment in two ways: by mapping voltages measured at the PCC and calculating feeder-wide voltage imbalance. For the former, we look at all customers for which there were sufficient data to fully resolve the secondary conductors in our load flow model (4455/4809 customers (The remaining 354 customers are modeled as connected directly to the load-side bushing of a service transformer and thus not considered in this voltage analysis), and plot the minimum voltage they experience across the modeled time frame. Note that the lowest voltage for each customer may not occur at the same time, and the durations of these under-voltage events are not considered. The plot in Fig. 4 is a kernel density estimate (KDE)44KDE plot with a bandwidth of 0.7 for moderate smoothing, showing the distribution of minimum PCC voltages. The addition of EVs produces a notable leftward shift in the distribution (towards lower voltages), and reductions in the global minimum and mean PCC voltages shown in the legend entries. Unsurprisingly, the effects are most pronounced for TOU-ASAP and uncontrolled charging, and again, TOU-ALAP and TOU-Random show improvements over uncontrolled charging. The effects of EV adoption on system voltages are highly circuit- and location- dependent. In our analysis, EV loads were randomly allocated across our feeder. In reality, the effect on system voltages may be more or less pronounced depending on the circuit locations to which EVSEs interconnect.
Figure 4.
Distribution of minimum PCC voltages.
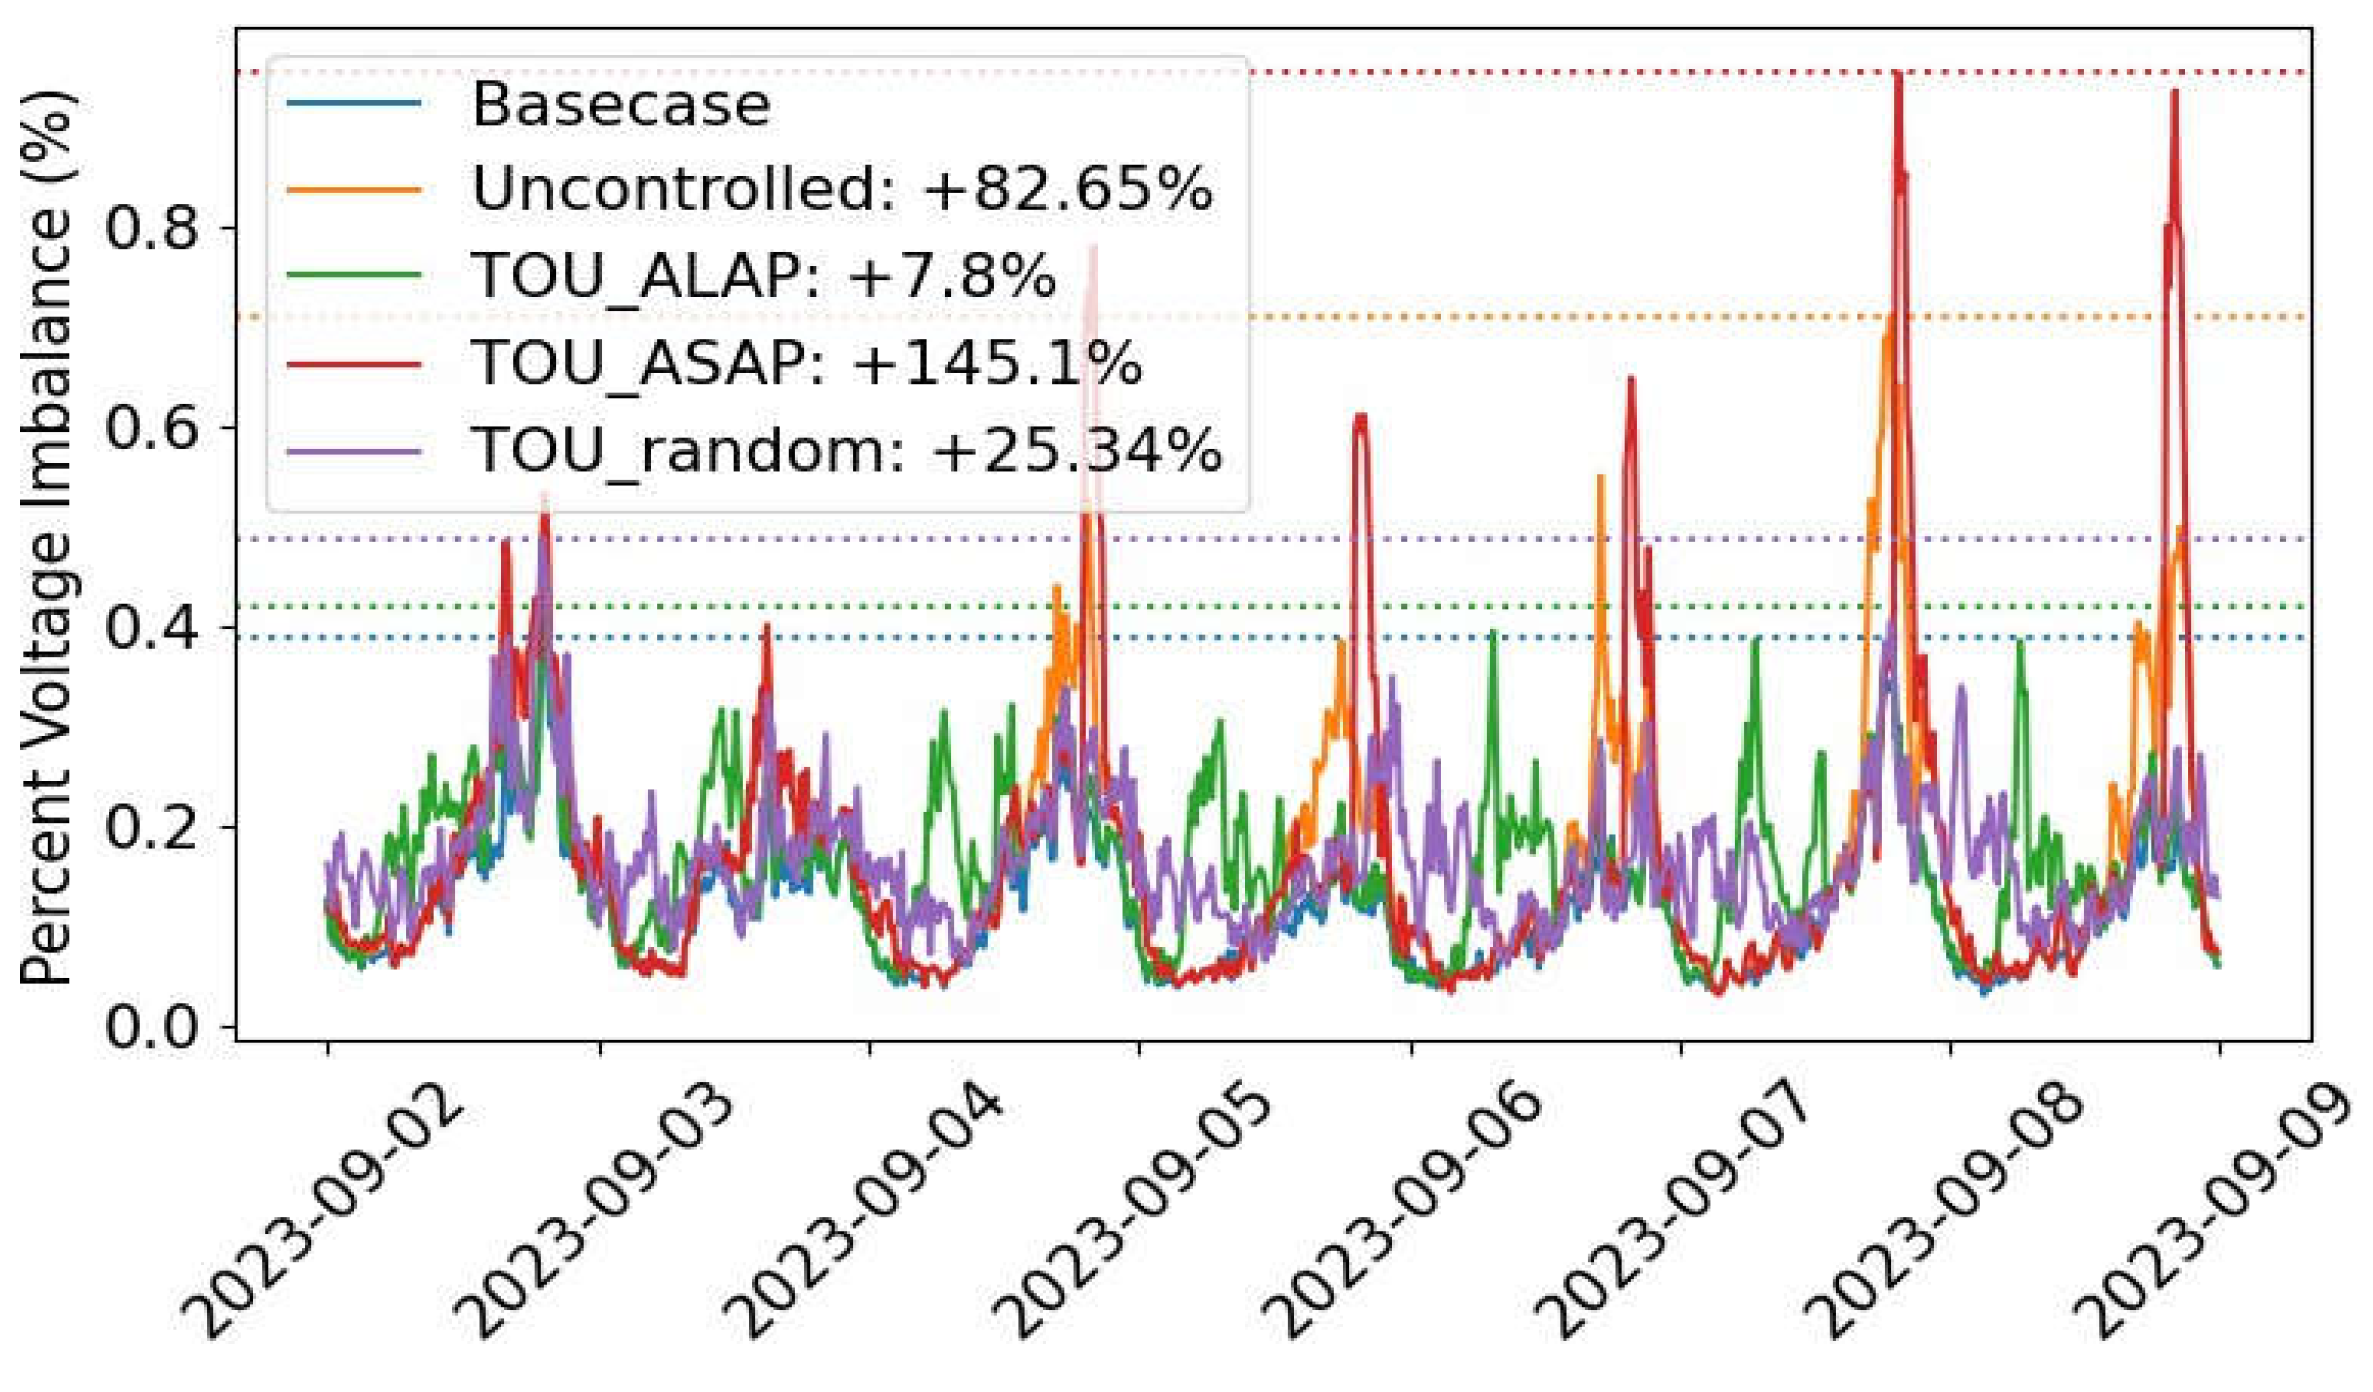
Lastly, we calculate voltage imbalance to further assess power quality. Voltage imbalance is defined as the maximum phase voltage deviation from the average phase voltage divided by the average phase voltage. This represents, at each time step, the feeder-wide worst voltage imbalance. In this study, all residential charging loads are single-phase. As such, depending on the location they interconnect, this has the potential to exacerbate or even alleviate voltage imbalance. Given that res- idential chargers may be added to existing services, there may be less flexibility for the utility to designate the phase to which they interconnect and may require additional phase balancing elsewhere on the feeder. The approach here goes beyond simply measuring imbalance at the feeder head (by SCADA), and looks at all sections of the feeder. This comprehensive approach can aid in addressing power quality complaints, inform load transfers from one feeder to another, or even improve sensitivity of certain protective devices55For protective devices with a neutral element (eg. 50N/51N), the pickup value must be low enough to detect high-impedance faults but high enough to not trip on neutral current from typical load imbalance.
Our results show that while voltage imbalance on this feeder remains low according to [15] which recommends a maximum imbalance of 3% under no load conditions, there is still a notable increase in imbalance due to EVs, more than doubling under TOU- ASAP, with considerable spikes during peak load hours. These results are highly dependent on EV charging locations, phase connections, and existing system imbalances, but nevertheless, highlights the importance of conducting studies that scan the entire feeder for imbalance as large single phase loads like residential EVSEs are added to distribution systems.
Figure 5.
Maximum feeder-wide voltage imbalance.
4. Conclusions
Building on accompanying studies of EV adoption forecasts and mobility energy demand analysis, this study quantifies changes in load characteristics, possible input to distribution design standards, and potential grid impacts for a 2030 EV adoption scenario, while building potential analysis frame- works for use in future studies. Results presented here suggest that the utilities need to conduct similar studies as our clean energy future comes to fruition, and reassess frequently as system forecasts evolve. This study illustrates that some SCM strategies may in fact exacerbate negative grid impacts, relative to uncontrolled EV charging, while others may alleviate grid impacts. The underlying principle to consider is using SCM methods carefully to reduce load coincidence across both EV and non-EV loads. Ultimately, a detailed cost-benefit analysis would be warranted to determine if implementing a particular SCM strategy is a worthwhile investment, considering its field practicality and implementation costs. The results can be largely system specific and should consider additional variables such as participation rates, customer behavior in response to TOU rates (including non-EV loads), and the feasibility of EV-specific TOU rates, and non-TOU based direct control approaches such as service transformer loading mitigation and/or optimization. Further work in this area can be done to incorporate more accurate input datasets, additional test feeders, and more direct SCMs operating on real-time grid feedback.
Acknowledgements
This work is supported by Xcel Energy. We would like to thank our technical point of contacts Ryan Gannon and Matt Renwick for coordinating all the technical support we received from Xcel Energy for this project. This work was authored in part by the National Renewable Energy Laboratory, operated by Alliance for Sustainable En- ergy, LLC, for the U.S. Department of Energy (DOE) under Contract No. DE-AC36-08GO28308. The contents of this pa- per reflect the view of the authors who are responsible for the facts and accuracy of the data presented herein. The contents do not necessarily reflect the official view or policies of the U.S. DOE. The U.S. Government retains and the publisher, by accepting the article for publication, acknowledges that the U.S. Government retains a nonexclusive, paid-up, irrevocable, worldwide license to publish or reproduce the published form of this work, or allow others to do so, for U.S. Government purposes.
References
- Yazdaninejadi, A.; Hamidi, A.; Golshannavaz, S.; Aminifar, F.; Teimourzadeh, S. Impact of inverter-based DERs integration on protection control operation and planning of electrical distribution grids. Electr. J. 2019, 32, 43–56. [Google Scholar] [CrossRef]
- Aguero, J.R.; Khodaei, A. Grid Modernization, DER Integra- tion & Utility Business Models - Trends & Challenges. IEEE Power Energy Mag. 2018, 16, 112–121. [Google Scholar]
- Quint, R.; et al. Transformation of the Grid: The Impact of Distributed Energy Resources on Bulk Power Systems. IEEE Power Energy Mag. 2019, 17, 35–45. [Google Scholar] [CrossRef]
- Sheth; Patel; D. (2024). Comprehensive examination of solar panel design: A focus on thermal dynamics. Smart Grid and Renewable Energy, 15(1), 12–28. [CrossRef]
- I. Jokinen and M. Lehtonen, ”Modeling of Electric Vehicle Charging.
- Demand and Coincidence of Large-Scale Charging Loads in Different Charging Locations. IEEE Access 2023, 11, 114291–114315. [CrossRef]
- Bollerslev, J.; et al. Coincidence Factors for Domestic EV Charging From Driving and Plug-In Behavior. IEEE Tran. Transport. Elec-trific. 2022, 8, 808–819. [Google Scholar] [CrossRef]
- Swami; Sheth; Patel; D. (2024). PV capacity evaluation using ASTM E2848: Techniques for accuracy and reliability in bifacial systems. Smart Grid and Renewable Energy, 15(9), Article 159012. [CrossRef]
- Calearo, L.; Thingvad, A.; Suzuki, K.; Marinelli, M. Grid Loading Due to EV Charging Profiles Based on Pseudo-Real Driving Pattern and User Behavior. IEEE Tran. Transport. Electrific 2019, 5, 683–694. [Google Scholar] [CrossRef]
- Sheth; Patel; Swami; G. (2024). Reducing electrical consumption in stationary long-haul trucks. Open Journal of Energy Efficiency, 13(3), 88–99. [CrossRef]
- Vuelvas, J.; Ruiz, F.; Gruosso, G. A time-of-use pricing strategy for managing electric vehicle clusters. Sustain. Energy Grids Netw 2021, 25. [Google Scholar] [CrossRef]
- Impact of Electric Vehicle customer response to Time-of-Use rates on distribution power grids. Energy Reports 2022, 8, 8225–8235. [CrossRef]
- Empirical grid impact of in-home electric vehicle charging differs from predictions. Resource Energy Economics 2022, 67, 101275. [CrossRef]
- Black, *!!! REPLACE !!!*; et al. , ”Survey and Gap Prioritization of U.S. Electric Ve- hicle Charge Management Deployments”, Technical Report, Lawrence Berkeley National Laboratory, 2024. [CrossRef]
- American Institute of Electrical Engineers, ASA: American Standard Definitions of Electric Terms, Group 35, Generation, Transmission, and Distribution, vol. C42.35. Alexandra, VA, 1957. American National Standards Institute, Inc., “ANSI C84.1-2016: Amer- ican National Standard for Electric Power Systems and Equipment - Voltage Ratings (60 Hertz),” American National Standards Institute, Inc., Jun. 2016.
- Elgindy, T.; et al. , DiTTo: Distribution Transformation Tool. National Renewable Energy Laboratory. [Online]. Available: https://nrel.github.io/ditto/.
- Sheth; Patel; D. (2024). Strategic placement of charging stations for enhanced electric vehicle adoption in San Diego, California. Journal of Transportation Technologies, 14(1), 64–81. [CrossRef]
- Zhang, M.; et al. , ”Distribution Service Transformer Loading Analysis with Electric Vehicle Grid Integration,” unpublished, submitted to IEEE Power Energy Soc. General Meeting (PESGM), 2025.
Figure 1.
Calculated load coincidence factors.
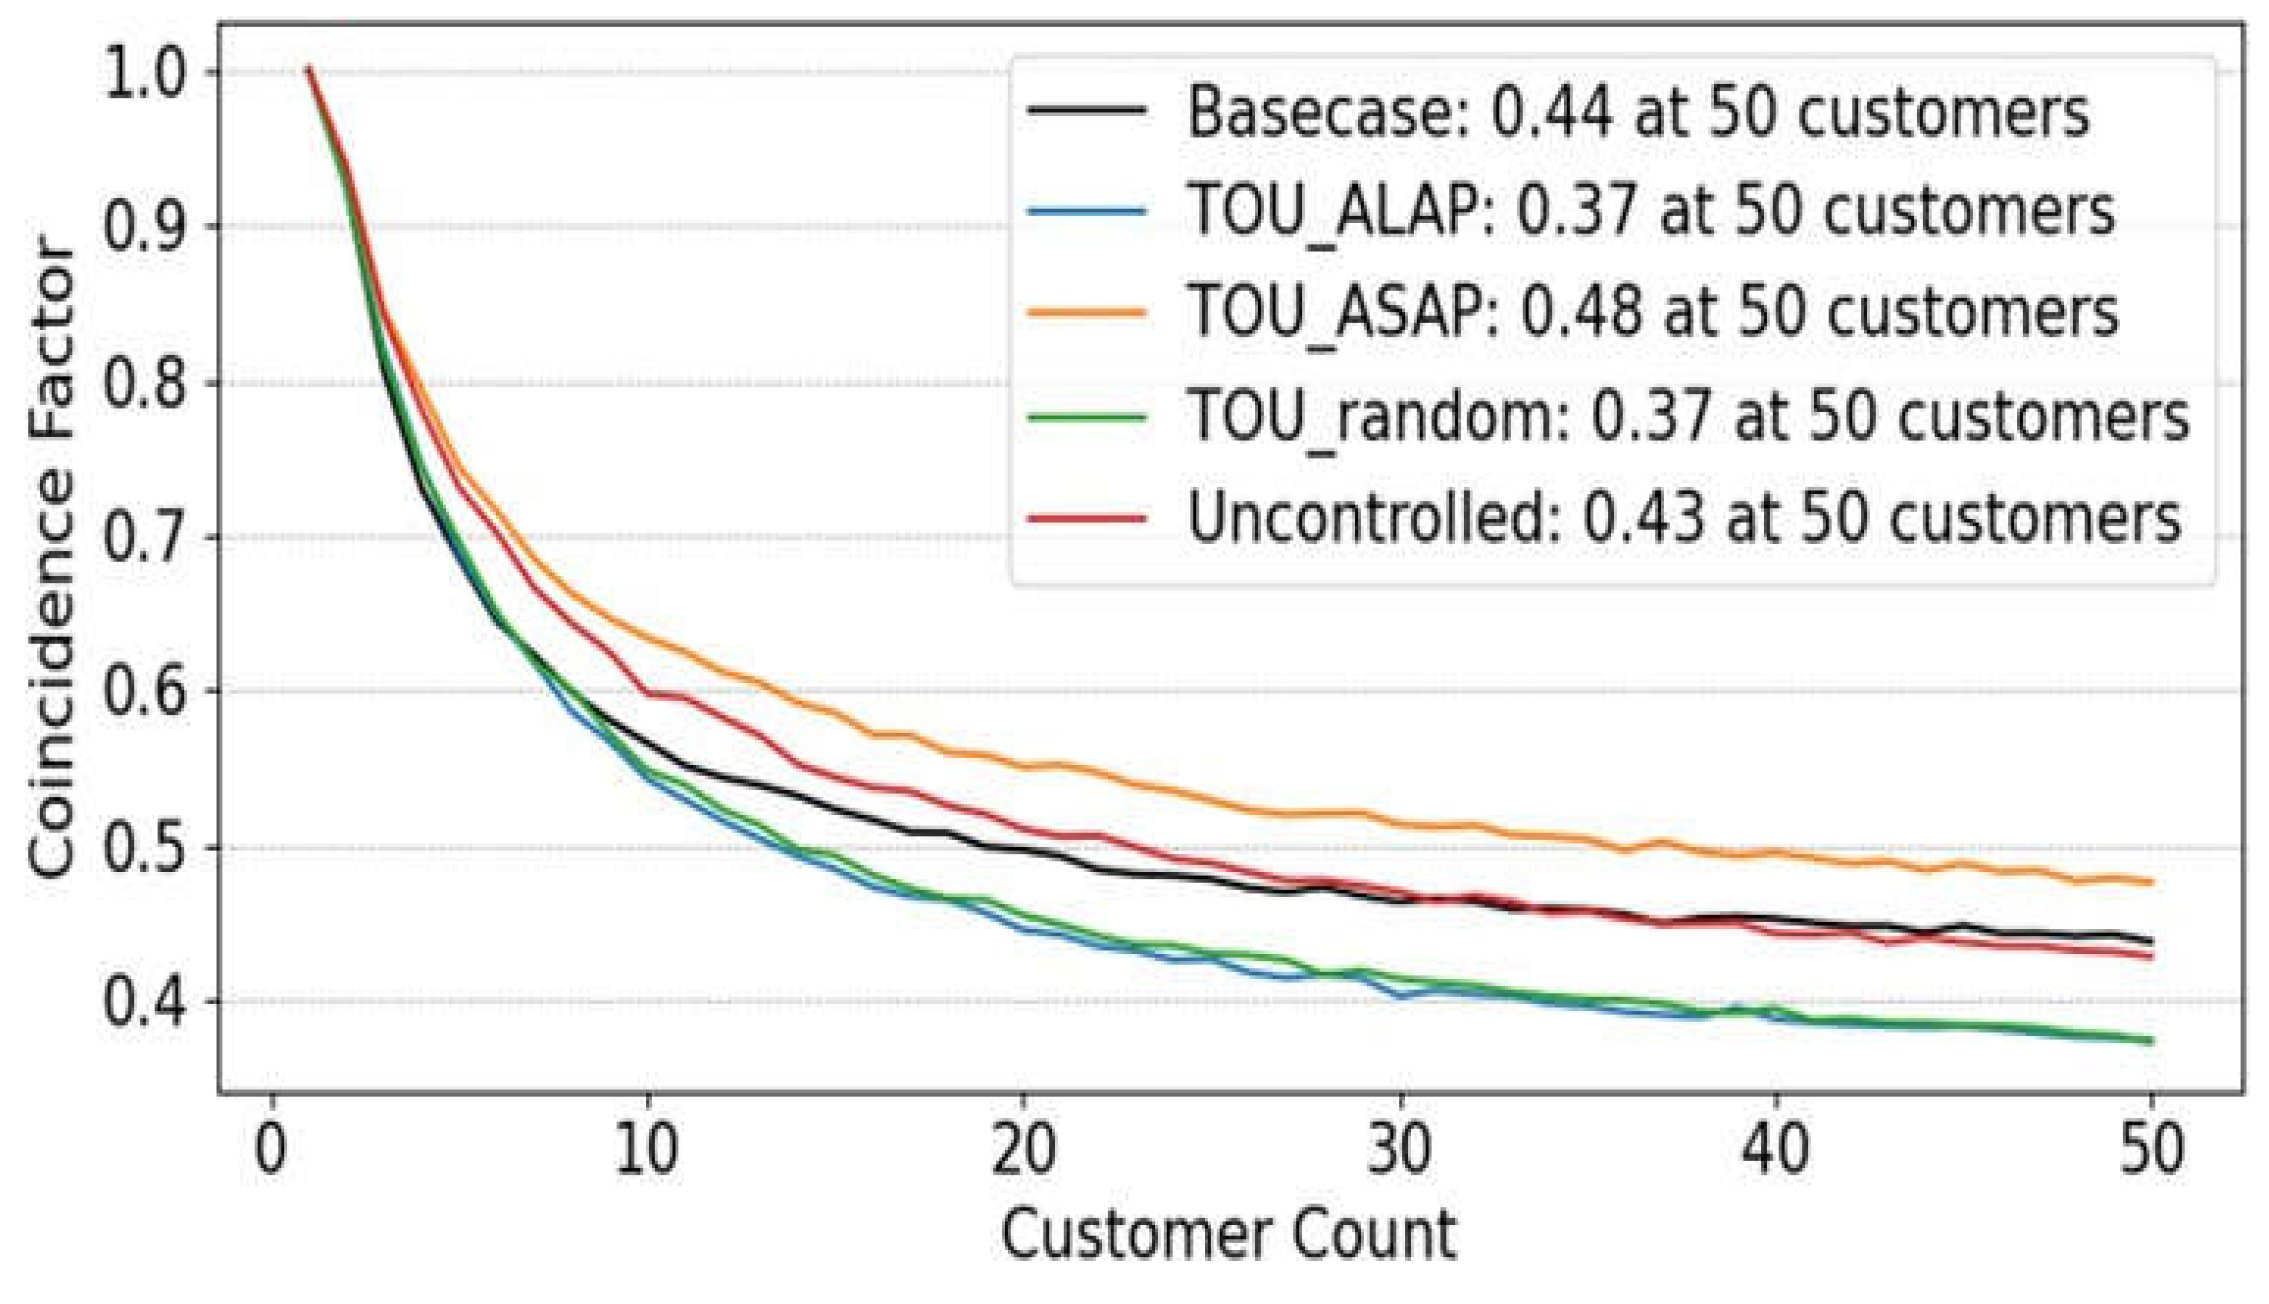
Figure 2.
Customer count limits for residential service transformers.
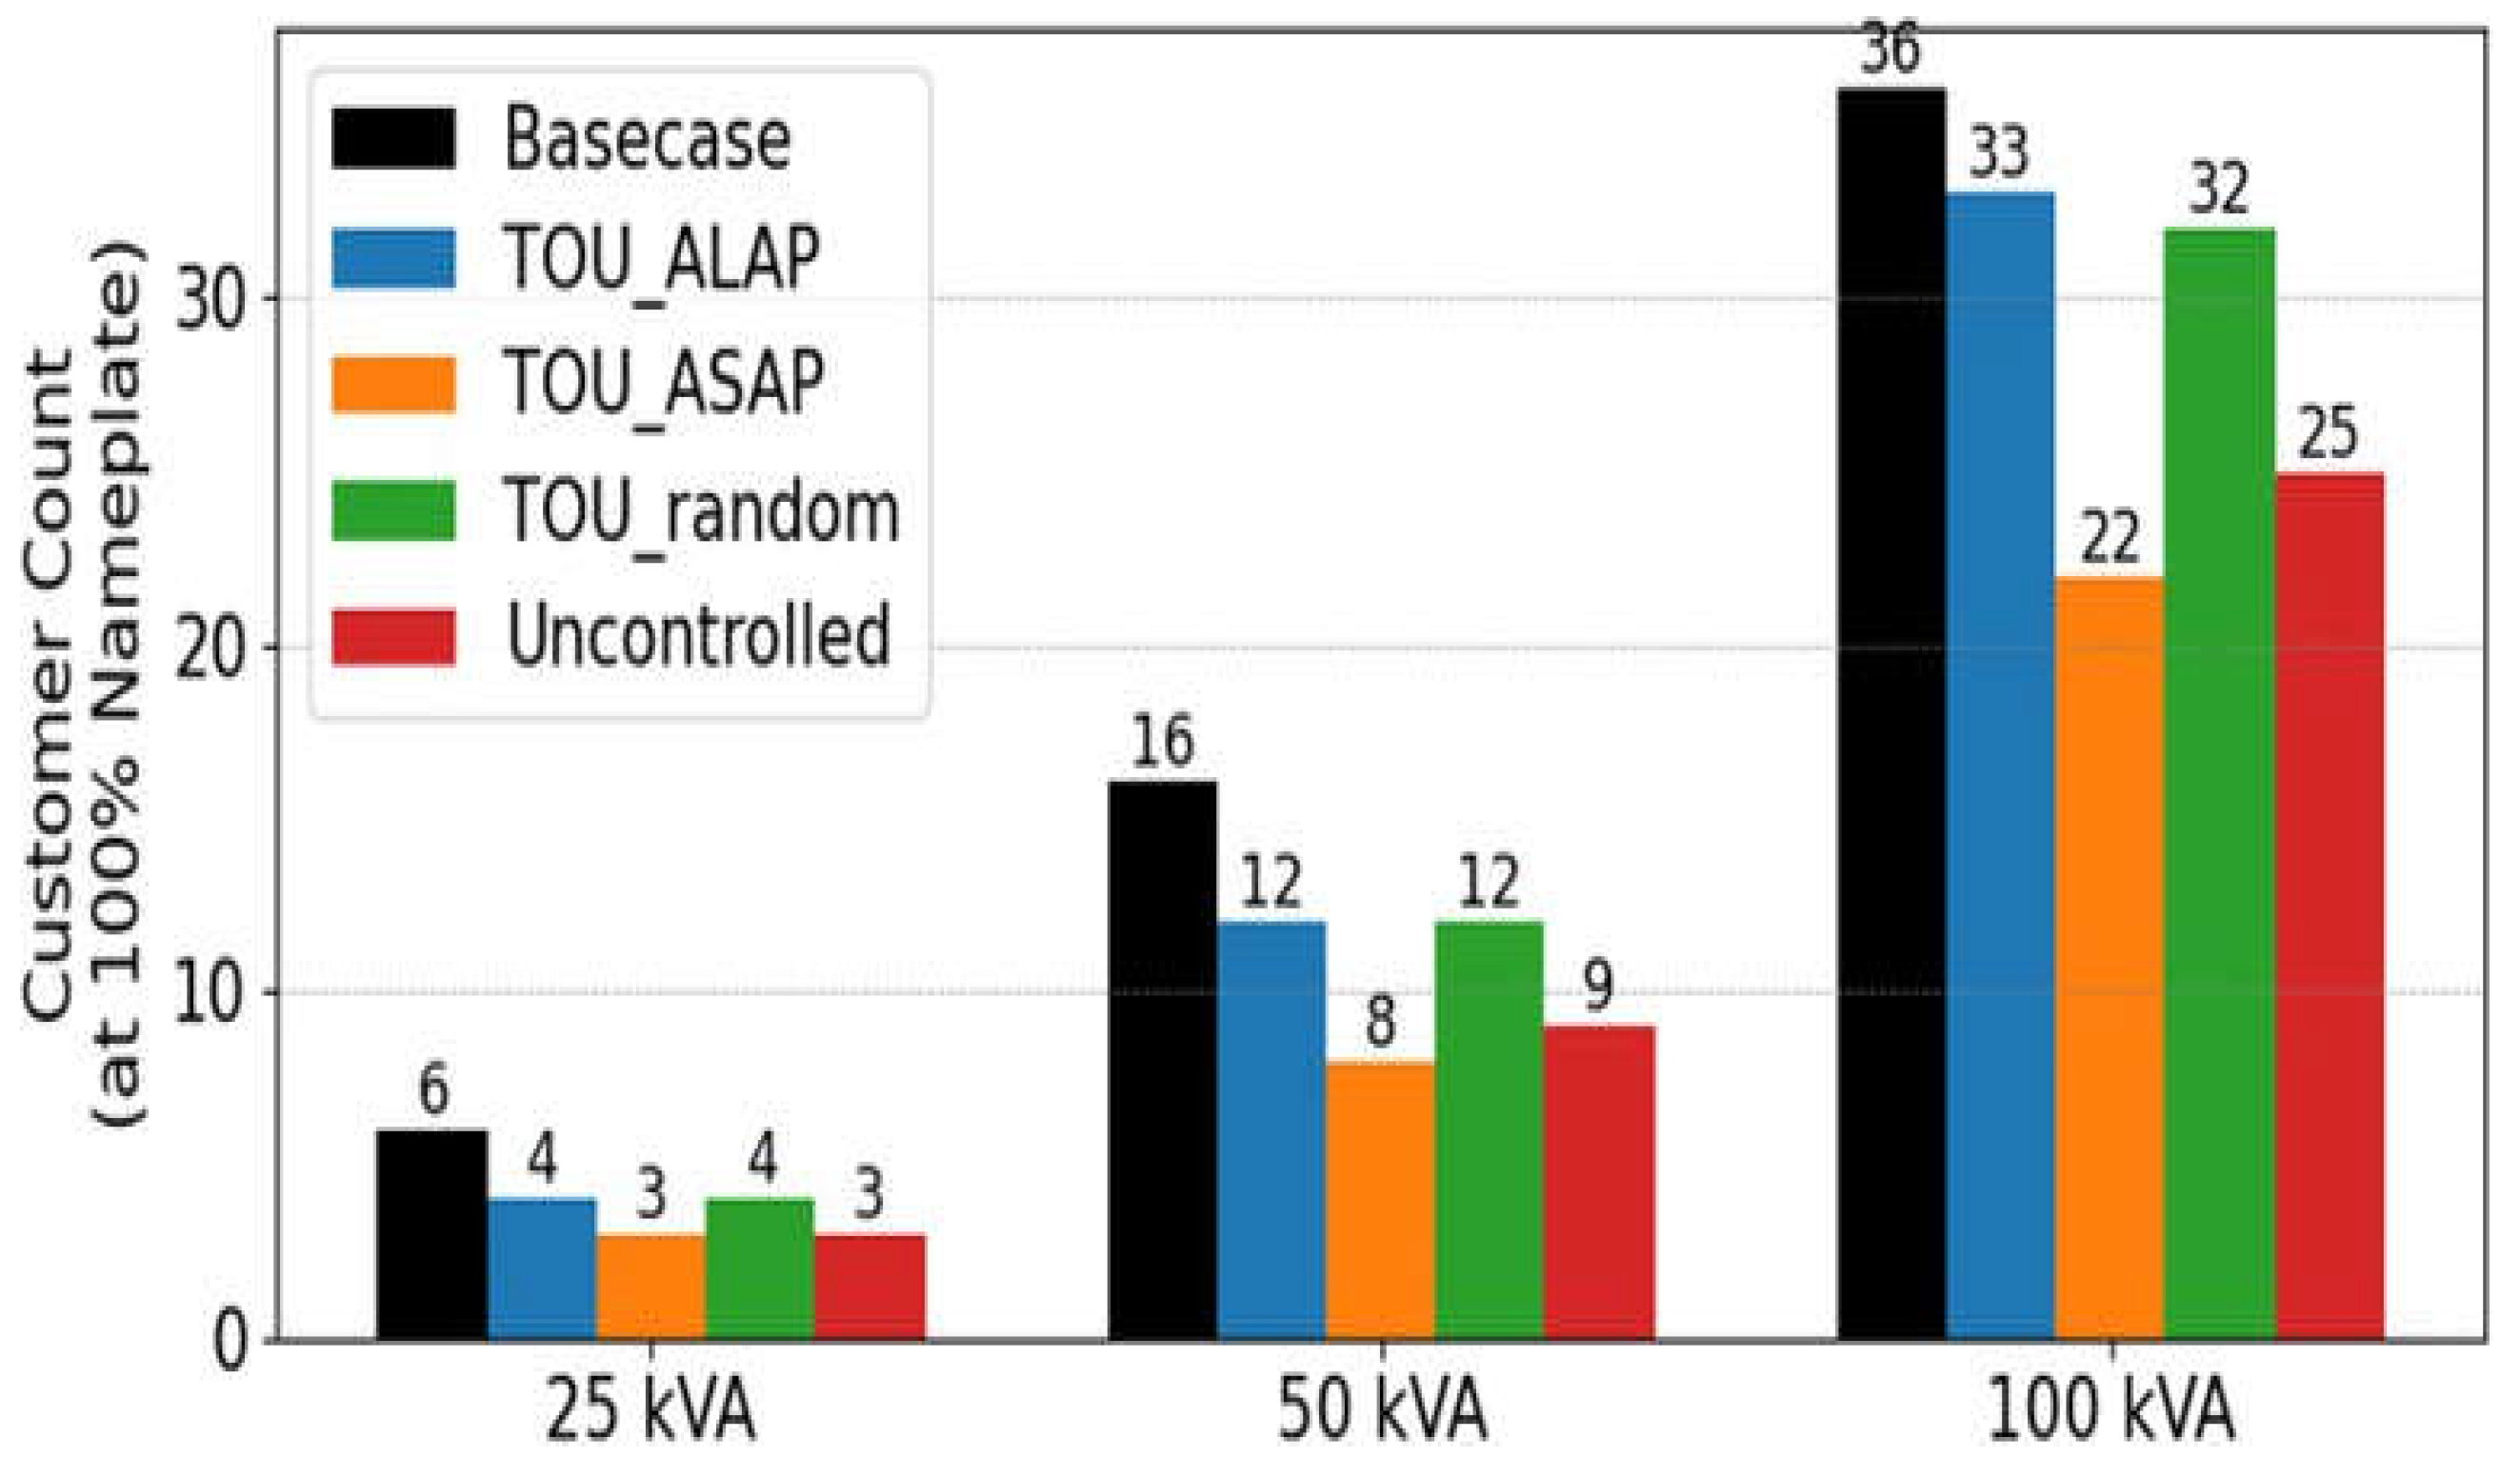
Figure 3.
Feeder loading for the test feeder.
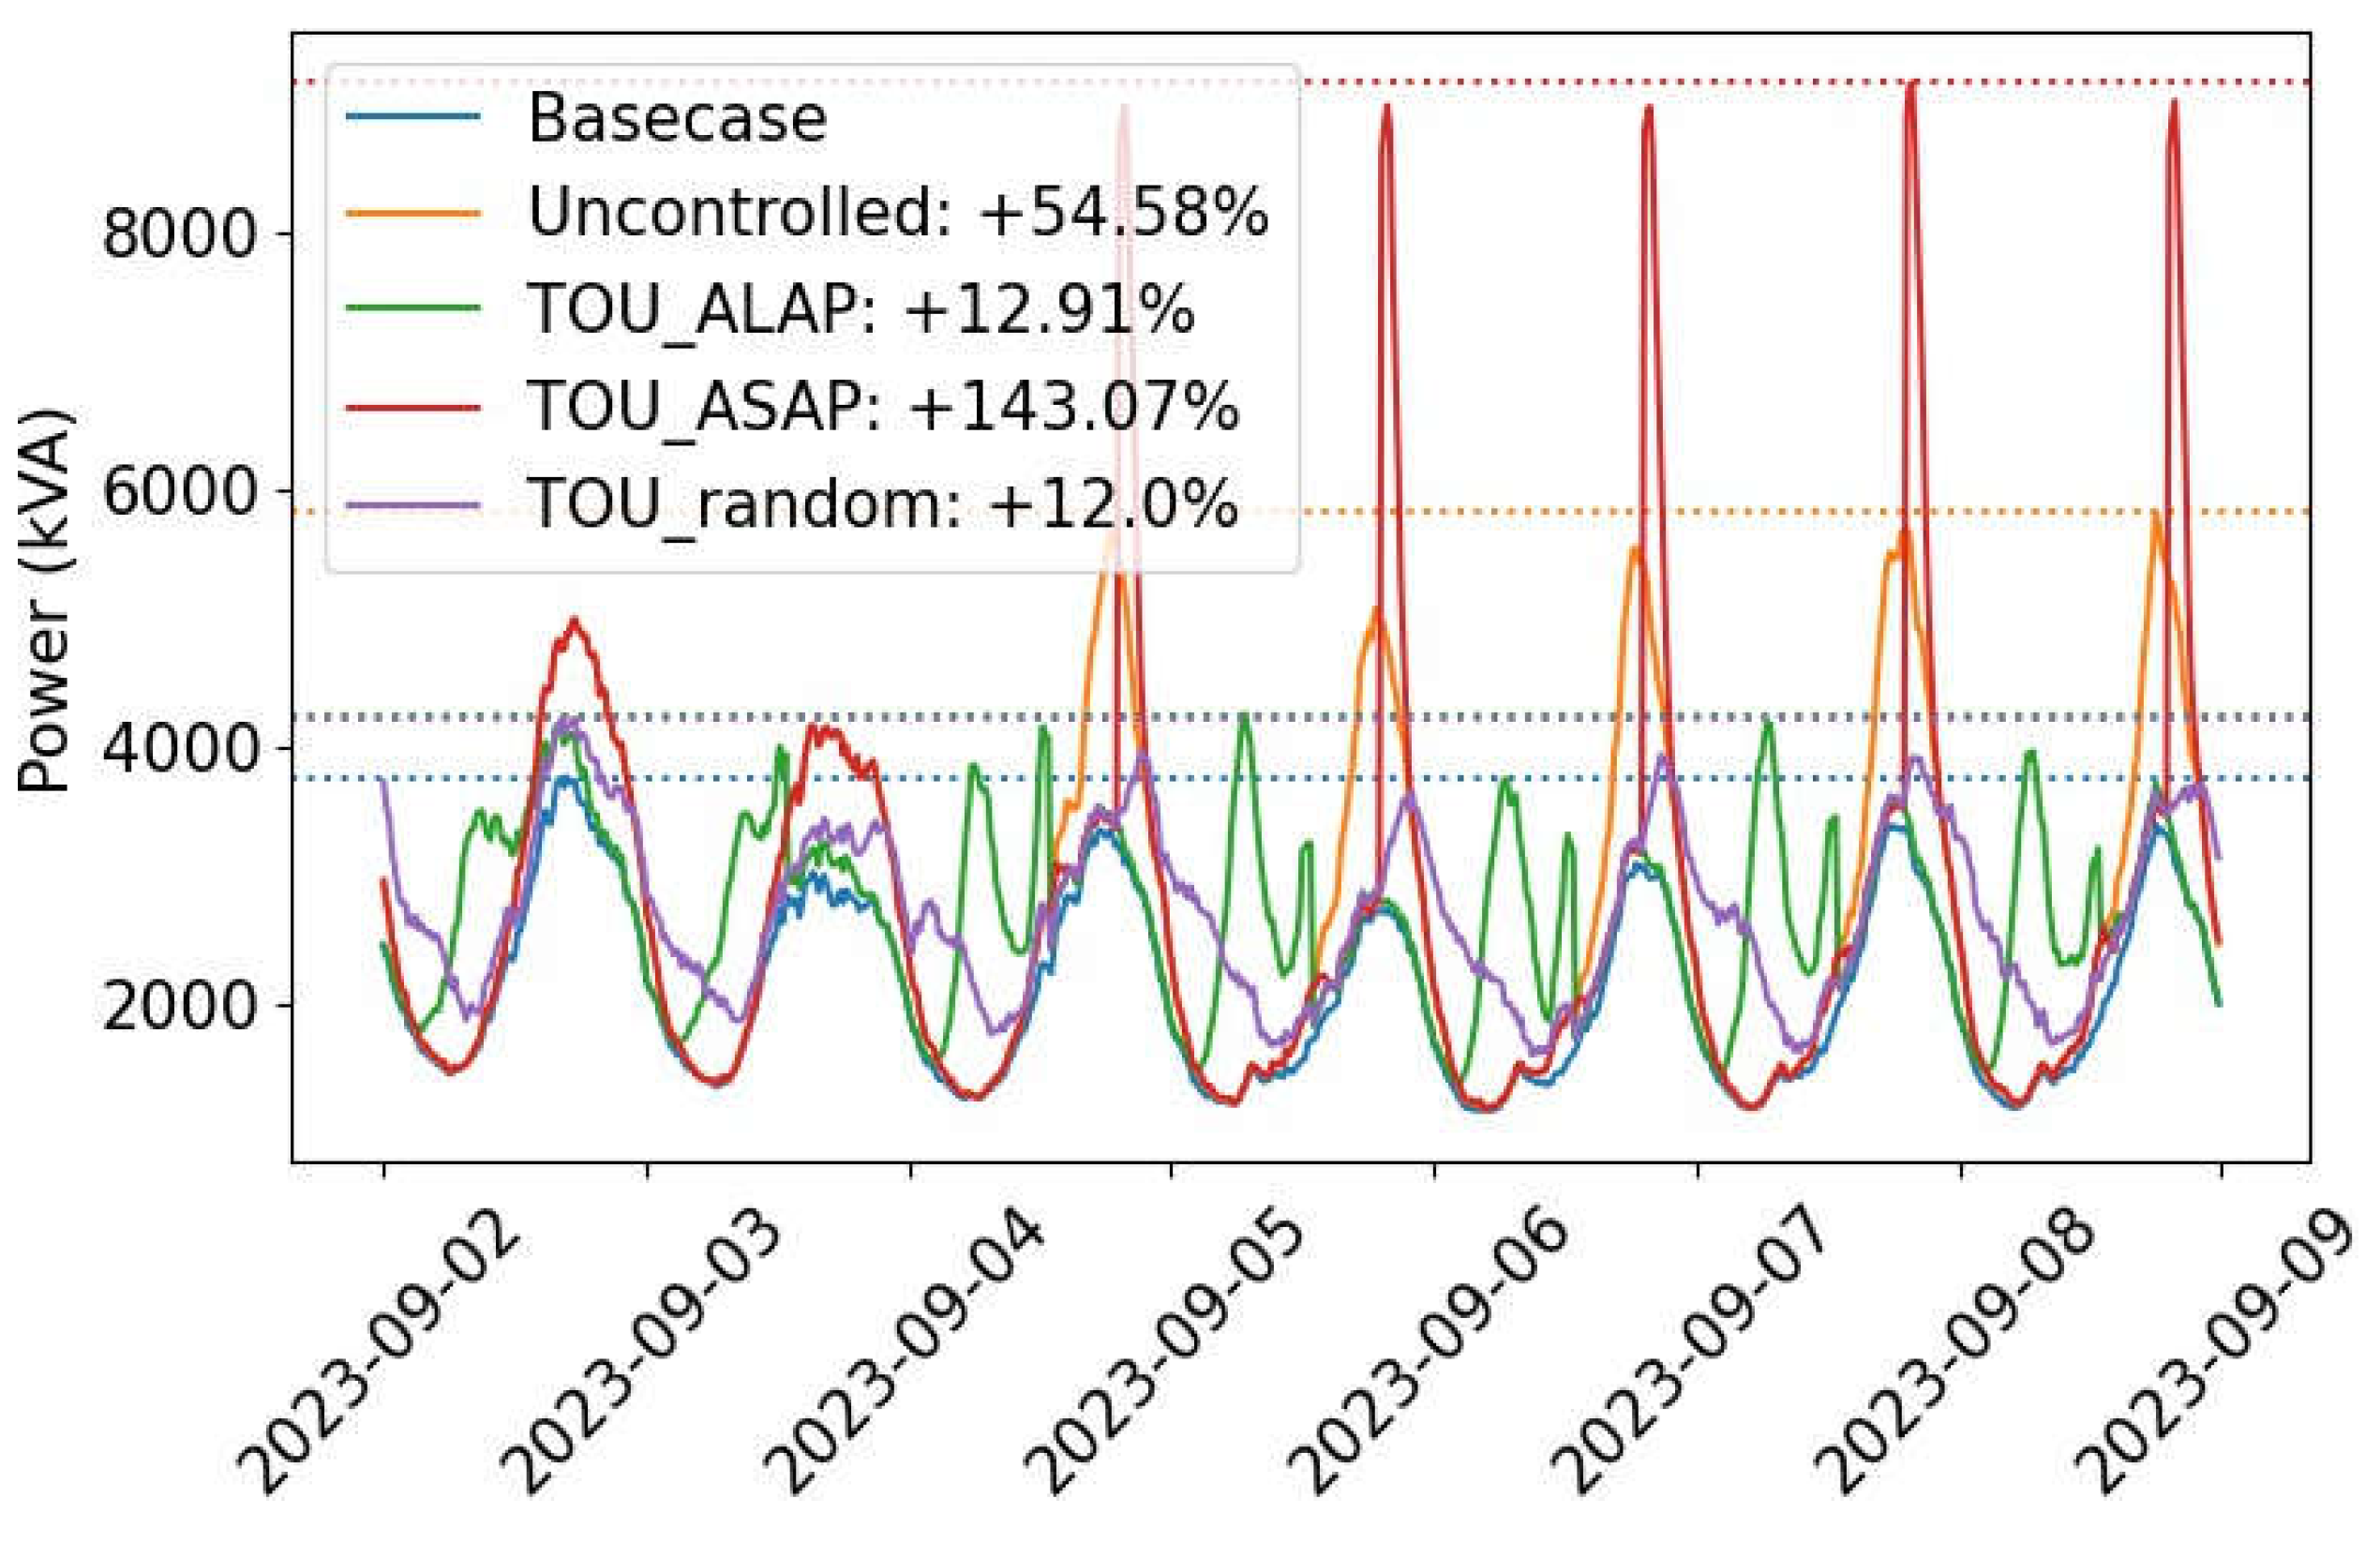

Table 1.
Characteristics of the selected utility feeder model.
| Feeder Summary | |
|---|---|
| 1ph / 3ph Customers | 3611 / 1208 |
| Total EV Count | 1497 |
| Percent OH / UG | 16.29% / 83.71% |
| Feeder Length | 3.82 mi |
| Percent of Feeder Loads Included in Model2 | 82.99% |
2Due to a combination of incomplete secondary data and incomplete AMI data, not all customers in the real-world system are included in this model.
Disclaimer/Publisher’s Note: The statements, opinions and data contained in all publications are solely those of the individual author(s) and contributor(s) and not of MDPI and/or the editor(s). MDPI and/or the editor(s) disclaim responsibility for any injury to people or property resulting from any ideas, methods, instructions or products referred to in the content. |
© 2025 by the authors. Licensee MDPI, Basel, Switzerland. This article is an open access article distributed under the terms and conditions of the Creative Commons Attribution (CC BY) license (http://creativecommons.org/licenses/by/4.0/).
Copyright: This open access article is published under a Creative Commons CC BY 4.0 license, which permit the free download, distribution, and reuse, provided that the author and preprint are cited in any reuse.


