
Submitted:
12 September 2025
Posted:
15 September 2025
You are already at the latest version
Abstract
This systematic review and diagnostic test accuracy meta-analysis evaluated the performance of Doppler ultrasound (DUS) for diagnosing acute appendicitis (AA) and its ability to distinguish complicated (CAA) from non-complicated acute appendicitis (NCAA). The review was registered in PROSPERO (CRD42025641841), and a comprehensive search was conducted across PubMed, Web of Science, Scopus, and Ovid. Twenty-one studies were included. Study quality was assessed using the QUADAS-2 tool. Continuous quantitative parameters were synthesized using random-effects models (REML) while diagnostic performance data were analyzed through hierarchical models. For Spectral Doppler parameters, PSV showed a pooled sensitivity of 94% [89–97] and specificity of 87% [71–95], while RI showed a pooled sensitivity of 81% [68–89] and specificity of 88% [73–95]. Color Doppler (CD) achieved a pooled sensitivity of 82% [70–90], specificity of 97% [92–99], and AUC of 0.97 [0.95–0.98], with potential evidence of small-study effects (Deeks’ test p = 0.08). Evidence for discriminating CAA from NCAA was limited and heterogeneous. Although DUS—particularly CD and SD—shows encouraging diagnostic potential for AA, the presence of moderate heterogeneity, retrospective study designs, potential small-study effects (CD), and significant spectrum bias suggests that its performance is probably overestimated. Nevertheless, the consistently high accuracy estimates across multiple modalities, together with its radiation-free nature and broad availability, highlight DUS as a highly attractive complementary imaging option. Therefore, while conclusions must be interpreted cautiously until validated by large, prospective, multicenter studies with standardized thresholds and imaging protocols, our findings support DUS as a promising diagnostic tool for AA assessment, particularly in pediatric and radiation-sensitive populations, provided that the cecal appendix is adequately visualized.
Keywords:
ultrasonography
; Doppler
; appendicitis
; sensitivity and specificity
; diagnostic accuracy
; diagnostic imaging
; adult
; child
Introduction
Acute appendicitis (AA) remains the leading cause of emergency abdominal surgery worldwide [1]. Although its overall mortality rate is low, diagnostic delays significantly increase the risk of complications and morbidity [2,3].
AA diagnosis is primarily based on physical examination, a focused clinical history, and basic laboratory tests, including complete blood count and acute-phase reactants. The current recommended approach emphasizes risk stratification to guide clinical decision-making, employing multivariable scoring systems such as the AIR score, the RIPASA score, the PAS score, and the BIDIAP score—the latter two specifically developed for pediatric populations—to identify patients who require additional imaging and/or hospital admission, and to reduce the incidence of negative surgical explorations [4,5,6]. Although these scoring systems have proven highly effective for the initial triage of patients with suspected AA, imaging techniques—primarily ultrasound (US) and computed tomography (CT)—remain essential for confirming or ruling out the diagnosis and for differentiating between complicated (CAA) and uncomplicated (NCAA) appendicitis [7,8].
Computed tomography (CT) is a widely recognized diagnostic tool for AA, particularly in cases with a high clinical suspicion and inconclusive US findings, having shown superior diagnostic performance compared to US in recent meta-analyses [7]. However, using CT involves considerable expenditure of human and economic resources. In addition, despite ongoing advances in low-dose imaging protocols, CT remains a significant source of ionizing radiation, which limits its unrestricted use, particularly in vulnerable populations such as children and pregnant women [1,4,7]. Despite the available evidence, recent studies continue demonstrating an overuse of CT imaging in pediatric populations [9].
Other imaging modalities, such as magnetic resonance imaging (MRI), have also demonstrated excellent diagnostic performance in AA [10,11]. However, their clinical implementation remains challenging and costly in current practice. For instance, pediatric patients often require sedation to undergo MRI examinations, adding complexity to its routine use.
US has demonstrated excellent diagnostic performance in the evaluation of appendicitis, both when performed by specialized radiologists [7] and when conducted by clinicians using point-of-care ultrasound (POCUS) [12,13]. Nevertheless, US remains a highly operator-dependent modality, and considerable rates of non-visualization of the cecal appendix are reported in recent literature [14]. Non-visualization may be attributed to several factors, including patient obesity, the anatomical location of the appendix, poor acoustic windows due to interposed bowel loops, and the operator’s experience level. The adoption of standardized protocols, such as the graded compression technique described by Puylaert in 1986 [15], the three-step positioning algorithm [16], and structured coaching strategies [17], has significantly improved appendiceal visualization rates, but they remain far from perfect.
Quillin et al. first reported using Doppler US (DUS) as an additional diagnostic tool in evaluating AA in 1992 [18]. Based on the pathophysiological premise that inflammation of the cecal appendix leads to increased blood flow that can be detected and quantified using Doppler techniques, numerous studies have evaluated the potential diagnostic performance of DUS—including color Doppler (CD), power Doppler (PD), contrast-enhanced power Doppler (CEPD), and more recently, spectral Doppler (SD)—in AA, as well as its ability to discriminate between CAA and NCAA [19,20,21,22,23,24,25,26,27,28,29,30,31,32,33,34,35,36,37,38]. However, the available evidence remains fragmented: most studies are small, single-center, and heterogeneous in design, and previous reviews have not provided a quantitative synthesis of DUS performance across modalities. In particular, little is known about whether DUS can aid in discriminating CAA from NCAA, a clinically relevant distinction that influences urgency and management strategy. This systematic review and DTA meta-analysis addresses these gaps by providing a modality-specific quantitative synthesis and exploring discrimination between CAA and NCAA.
Methods
Literature Search and Selection
We followed the Preferred Reporting Items for Systematic Reviews and Meta-Analyses in Diagnostic Test Accuracy Studies (PRISMA-DTA) guidance [39]. Supplementary File 1 shows the PRISMA-DTA Checklist. We prospectively registered the present review in the International Prospective Register of Systematic Reviews (PROSPERO ID CRD42025641841).
Eligible studies were identified by searching the primary existing medical bibliography databases (PubMed, Web of Science, Scopus, and Ovid). Supplementary File 2 shows the detailed search strategy for each bibliographic database. The search was last executed on 22.04.2025.
JAM and MRJ selected articles using the COVIDENCE ® tool. The search results were imported into the platform, and both authors screened the articles separately. Disagreements were resolved by consensus. We included prospective or retrospective observational clinical studies evaluating the diagnostic performance of any Doppler ultrasound modality (e.g., CD, PD, or SD) for acute appendicitis in adult or pediatric populations, with histopathology of the resected appendix as the reference standard. We excluded case reports, reviews, duplicate or overlapping datasets, retracted publications, studies in languages other than English or Spanish, and those not involving surgical confirmation or populations outside the scope of interest (e.g., immunocompromised patients, abdominal malignancy, hematological disorders). Supplementary File 3 shows the inclusion and exclusion criteria.
Quality Assessment
The QUADAS-2 (Quality Assessment of Diagnostic Accuracy Studies 2) tool was used to evaluate each selected article’s methodological quality and risk of bias [40]. Each article evaluated patient selection, index test, reference standard, flow, and timing. Applicability concerns regarding patient selection, index tests, and reference standards were also assessed. Two authors independently performed the assessments, and disagreements were resolved by consensus. As no conflicts remained unresolved, a third reviewer was not required.
Data Extraction and Synthesis
The target condition was defined as AA confirmed either by histopathological examination or intraoperative findings. The index test was DUS (all modes). The reference standard was the histopathological examination of the resected cecal appendix. Two independent reviewers (JAM, MRJ) extracted the relevant data from the selected articles following a standardized procedure. Extracted data included author, country where the study was conducted, year of publication, study design, study population (sample size, age range, and sex distribution), AA group and control group (CG) definitions, reference standard used in AA group, mean or median and standard deviation or range or interquartile range for peak systolic velocity (PSV) and resistive index (RI) determinations, statistical p-value for the between-group comparison, PSV and RI cut-off value (if established), and its associated sensitivity and specificity. There were no disagreements between the reviewers after collating the extracted data. The metrics used in each study were reviewed, and it was determined that a standardization of units was not required. Means (ranges) were converted to means (standard deviations) following a standardized procedure [41,42] in two cases [33,38]. True positives (TP), false positives (FP), true negatives (TN), and false negatives (FN) were obtained either directly from the included studies or estimated, when not explicitly reported, based on available sensitivity, specificity, and the number of patients with and without the target condition, using standardized statistical formulae [43]. Reported sensitivities, specificities, sample sizes per group, and predictive values were used to cross-validate the calculations.
The diagnostic odds ratio (DOR) was calculated for each study as (TP × TN) / (FP × FN). A continuity correction of 0.5 was applied to all zero-valued contingency table cells to avoid division by zero. Subsequently, DOR was log-transformed to stabilize variances and allow for linear approximation. The log-transformed DOR’s standard error (SE) was calculated using standard formulae based on the corrected contingency table counts. The 95% confidence intervals (CIs) for the log(DOR) were obtained by applying the normal approximation method (log(DOR) ± 1.96 × SE). They were then exponentiated to derive the 95% CIs on the original DOR scale.
Random-Effects Meta-Analysis
Two random-effects meta-analyses (MAs) for DUS quantitative parameters were performed using the restricted maximum likelihood (REML) method: (1) a meta-analysis of PSV values (measured in cm/s) comparing AA and CG patients, and (2) a meta-analysis of RI values comparing AA and CG patients. Confidence intervals (CIs) were adjusted using the truncated Hartung–Knapp–Sidik–Jonkman (t-HKSJ) approach whenever the number of studies (k) was greater than two and the between-study variance (τ2) was non-zero.
These analyses, which did not formally evaluate diagnostic performance, were conducted in an exploratory manner, aiming to obtain numerical reference values with potential clinical applicability. All studies with available data were included. Due to the limited number of studies reporting PSV and RI, no additional sensitivity analyses were conducted. Results were expressed as mean differences with corresponding 95% confidence intervals (CIs) and 95% prediction intervals (PIs) and were depicted using forest plots. Between-study heterogeneity was assessed using Cochran’s Q test, the between-study variance (τ2), and the inconsistency index (I2). Two leave-one-out sensitivity analyses were conducted (one for each meta-analysis).
Diagnostic Test Accuracy Meta-analysis
Four main hierarchical (DTA) meta-analytical models were conducted: (1) overall diagnostic performance of DUS (AA versus CG), (2) diagnostic performance of SD (PSV modality), (3) diagnostic performance of SD (RI modality) (AA versus CG), and 4) diagnostic performance of CD (AA versus CG).
In the overall DUS model (1), different Doppler modalities from the same study populations were combined, meaning that some studies contributed more than one observation. This lack of statistical independence can reduce estimated variance and artificially inflate precision. Therefore, the overall model is presented strictly as exploratory and descriptive, while confirmatory inferences rely on the modality-specific models (CD and SD). Pooled sensitivity, specificity, and area under the curve (AUC) estimates were reported for each model. Results were presented as forest plots of sensitivity and specificity and hierarchical summary receiver operating characteristic (HSROC) curves. Pre-specified meta-regression analyses were conducted on the primary model to explore the influence of study design (prospective vs. retrospective) and population characteristics (pediatric vs. mixed/adult) on diagnostic performance. The metadta, midas, and metandi modules in STATA were used to conduct the DTA meta-analyses [44,45,46]. The mada module in R and the midas module in STATA were used for the meta-regression DTA analyses [47].
Fagan Nomogram
A Fagan nomogram was constructed to assess the clinical utility of DUS by estimating post-test probabilities based on pooled likelihood ratios in CD and SD DTA models. A pretest probability of 20% was selected to reflect a typical clinical scenario of intermediate suspicion for acute appendicitis in Emergency settings. Pooled positive and negative likelihood ratios (LR+ and LR−) derived from the hierarchical meta-analysis were applied to calculate post-test probabilities following positive and negative test results.
Publication Bias and Small-Study Effects Assessment
For the random-effects meta-analytical models, Egger’s and Begg’s tests, funnel plots, and the trim-and-fill method were initially considered to assess the risk of publication bias [48]. However, since neither model included a sufficient number of studies (n < 10), these analyses were not performed. For the DTA meta-analytical models, Deeks’ asymmetry test was performed when more than 10 studies were included in the analysis to evaluate the presence of publication bias [49]. A p-value <0.10 was considered suggestive of publication bias, in line with established guidelines.
Statistical analyses were conducted using Stata version 19.0 (StataCorp LLC, College Station, TX, USA) with the metandi, midas, and metadta modules, and R version 4.3.2 (R Foundation for Statistical Computing, Vienna, Austria) with the mada module (version 0.5.12).
Results
The search returned 405 articles (Scopus, n = 92; PubMed, n = 91; Web of Science, n = 192; Ovid MEDLINE, n = 30). One hundred seventeen duplicates were removed. Among the remaining 288 articles, we excluded 267 (inclusion and exclusion criteria, n=267; reports not retrieved, n=0). This review finally included 21 studies [18,19,20,21,22,23,24,25,26,27,28,29,30,31,32,33,34,35,36,37,38]. A total sample size, as well as specific counts per group (AA/CG and gender), could not be reliably provided. This is due to the identification of multiple discrepancies across studies, which often lacked explicit reporting of these figures. The flowchart of the search and selection process is shown in Figure 1.
The risk of bias concerning the selection of patients was considered low in three of the studies [18,19,20], unclear in 17 of them [21,22,23,25,26,27,28,29,31,32,33,34,35,36,37,38], and high in two of them [24,30]. The risk of bias concerning the index test was considered low in 11 studies [18,21,22,23,24,25,26,27,28,30,32], unclear in six [19,20,22,29,31,34], and high in five [33,35,36,37,38]. The risk of bias concerning the reference standard was considered low in four studies [20,31,32,34], unclear in 17 [19,21,22,23,24,25,26,27,28,29,30,33,35,36,37,38], and high in one of them [18]. The risk of bias concerning flow and timing was considered low in 15 studies [18,19,21,22,23,24,25,26,27,28,32,35,36,37,38], unclear in six studies [20,22,29,31,33,34], and high in one of them [30]. Regarding patient selection applicability concerns, the risk was considered low in three of the studies [18,19,20], unclear in 17 of them [21,22,23,25,26,27,28,29,31,32,33,34,35,36,37,38], and high in two of them [24,30]. Regarding the index test applicability concern, the risk was considered low in 18 studies [18,20,21,22,23,24,25,26,27,28,29,30,32,35,36,37,38] and unclear in four studies [19,31,33,34]. Concerning reference standard applicability concerns, the risk was considered low in 20 studies [19,20,21,22,23,24,25,26,27,28,29,30,31,32,33,34,35,36,37,38] and high in one [18]. In the case of Lim et al. [22], prospective and retrospective cohorts were analyzed separately. For this reason, the reference may be considered as both low risk and unclear risk in certain categories (such as index test or flow and timing). The QUADAS-2 results are depicted in Figure 2.
Doppler Ultrasound in Acute Appendicitis
Sociodemographic Characteristics
Table 1 summarizes the data extracted from the twenty-one studies that evaluated DUS. All studies were conducted between 1992 and 2025 [18,19,20,21,22,23,24,25,26,27,28,29,30,31,32,33,34,35,36,37,38]. Seven were from the United States [18,19,20,24,29,31,33], three were from India [30,37,38], three were from Turkey [26,32,34], one was from Canada [21], one was from South Korea [22], one was from Italy [23], one was from France [25], one was from Brazil [27], one was from Israel [28], one was from Iran [35], one was from Egypt [36]. Thirteen studies were prospective [18,19,20,21,23,24,25,26,27,32,36,37,38], and five were retrospective [28,29,31,33,34]. One study reported two cohorts, one prospective and one retrospective [22]. One study did not explicitly report its design; after reviewing it, we classified it as retrospective [30]. One study was reported as cross-sectional, and after reviewing its design, we classified it as retrospective [35]. Four studies involved exclusively pediatric populations [18,19,20,27].
Fifteen studies included patients with clinical suspicion of AA as their study population [18,19,20,23,25,26,27,28,29,30,33,35,36,37,38]. One study included a selective group of patients presenting with atypical manifestations of AA [24]. In two cases, populations with histopathologically confirmed AA and various types of CG were included separately [21,22]. Three studies included only patients who underwent surgical intervention for suspected AA [31,32,34].
Twenty studies consistently defined ‘case’ as the histopathological confirmation of AA in the surgical specimen [19,20,21,22,23,24,25,26,27,28,29,30,31,32,33,34,35,36,37,38]. AA was based on surgical findings in one study, and a histopathological study was not explicitly reported [18]. Twelve studies stratified the AA group into NCAA and CAA [18,19,20,21,23,24,25,26,27,28,31,32]
This was not the case for the definition of ‘control’, which constituted either patients seen at the Emergency Department in which the diagnosis of AA was finally excluded (also known as non-surgical abdominal pain or NSAP) [18,22,23,24,25,26,27,28,29,30,33,34], patients with AA suspicion which finally had other surgical pathology [18,24,28], negative appendectomies (NA) [19,23,24,26,27,28,29,30,32] or specifically lymphoid hyperplasia as a form of NA [34], healthy control with ultrasound performed for other reasons (i.e, urological pathology) [21], patients with irritable bowel syndrome suspicion who underwent a barium enema [22].
In 12 studies, the authors restricted their analyses to the subgroup of patients in whom the cecal appendix was identified using grayscale ultrasound (US) [21,22,23,25,27,28,29,30,33,35,36,38]. Additionally, in some of these cases, the inclusion criteria were even more restrictive. For instance, in the study by Daga et al., only the 85 patients with appendiceal identification on US and sonographic criteria for acute appendicitis were included [30], while in the study by Anuj et al., only patients with an appendix visible on grayscale US and spectral Doppler waveforms on appendiceal US were considered [38]. In three of these cases, only US examinations with borderline features were included [22,29,35].
Table 1 shows the main characteristics of the studies included in this review, including the Doppler modalities assessed and the technical parameters of the sonographic examinations.
Overall Doppler Ultrasound Diagnostic Performance in Acute Appendicitis
Exploratory Diagnostic Test Accuracy Meta-Analysis for Overall Doppler Modalities (AA versus CG, Non-Independent)
In the case of Baldisserotto et al., the most favorable TP, FP, TN, and FN data reported by the authors were used, based on the classification of appendiceal Doppler flow adopted in each study (see Youden’s J index value in Table 1). Daga et al. were excluded from the DTA meta-analyses because the diagnostic performance data reported included only patients with AA, and the manuscript contained numerical inconsistencies (see Table 1).
The DTA meta-analysis for overall Doppler modalities, including CD, PD, CEPD, and SD (AA versus CG), included 26 observations from 21 studies and yielded a pooled sensitivity and specificity [95% CI] of 86% [79–91] and 94% [90–96], respectively (Supplementary File 4). The pooled area under the ROC curve (AUC) [95% CI] was 0.96 [0.94-0.97]. Between-study heterogeneity (τ2) was 1.06 for sensitivity and 1.48 for specificity, with a negative correlation (ρ = –0.36) between them.
This pooled DUS model combined multiple modalities from the same cohorts; observations are therefore non-independent, which may reduce variance and inflate precision. Accordingly, this analysis should be regarded strictly as exploratory, intended to provide an approximate overview of DUS performance across modalities rather than definitive evidence.
We performed prespecified univariable meta-regressions to explore whether study design (prospective versus retrospective) or population type (pediatric versus mixed/adult) influenced the diagnostic performance of DUS. Each covariate was analyzed separately. No statistically significant association was found in the joint models. However, prospective studies showed significantly lower specificity (93% versus 95%; p = 0.01), and pediatric studies showed a non-significant trend toward higher sensitivity (93% versus 85%; p = 0.13). Deeks’ funnel plot asymmetry test did not indicate significant small-study effects (slope = 7.31, p = 0.34).
Supplementary File 5 includes the raw TP, FP, FN, and TN dataset used for all DTA analyses. It also includes the DOR (95% CI) calculated for each study.
Spectral Doppler
Spectral Doppler Measurement Units
Nine studies reported the use of SD for diagnosing acute appendicitis (AA) [21,22,29,32,33,35,36,37,38]; among them, seven provided numerical values and/or specific diagnostic performance data [21,32,33,35,36,37,38]. The authors who reported SD numerical values and/or diagnostic performance data assessed it using three continuous quantitative parameters: PSV, RI, and pulsatility index (PI). PSV was consistently reported across all studies in centimeters per second (cm/s), whereas RI is a dimensionless parameter.
In two instances, where studies reported means and ranges instead of standard deviations, the missing standard deviations were estimated using the method described by Wan et al. [41] to enable meta-analytic pooling. Although the Wan et al. method was initially developed to estimate means and standard deviations from medians and ranges (or interquartile ranges), the studies in question reported means (not medians). To minimize potential inaccuracies, results were compared with estimates obtained using the method proposed by Hozo et al. [42]. In addition, an exploratory assessment of skewness following the approach of Shi et al. did not suggest that the underlying distributions were formally skewed. Therefore, conversions based on quantiles, such as those proposed by McGrath et al., were not applied. Nevertheless, this approach constitutes a methodological limitation, as combining means and ranges alone does not reliably allow accurate estimation of standard deviation and may not accurately reflect the underlying data distribution.
Diagnostic Performance of Peak Systolic Velocity and Resistive Index (AA Versus CG)
Seven studies reported quantitative values of the RI [21,26,32,33,36,37,38]. Five of them [33,35,36,37,38] reported a cut-off value for RI, ranging from 0.495 [35] to 0.65 [33,38]. Sensitivities and specificities for RI ranged from 63.9% [33] to 90.5% [35] and from 58.3% [37] to 96.5% [33], respectively. Four studies reported quantitative values in cm/s for PSV [33,36,37,38]. They all reported a PSV cut-off, ranging from 8.6 cm/s [36] to 11.8 cm/s [37]. Sensitivities and specificities for PSV ranged from 85.3% [38] to 98.3% [36] and from 54.2% [37] to 94.7% [33,35], respectively. One study reported PI values as means [32]. In five studies, true positive, false positive, true negative, and false negative values could be calculated for both PSV and RI [33,35,36,37,38].
Four studies provided a p-value for the comparison of PSV and RI values between the AA and CG, three of which were statistically significant (p<0.001) [33,36,38]. In the study by Saini et al. [37], the p-value for the comparison of PSV between groups was statistically significant (p<0.009). In contrast, the p-value for the comparison of RI only reached marginal significance (p=0.056). The reported sensitivity and specificity for each study are shown in Table 1.
Random-Effects Meta-Analysis for Spectral Doppler (AA Versus CG)
The random-effects meta-analysis of PSV (AA versus CG) included four studies (139 AA patients and 139 CG) and showed a significant mean difference [95% CI] of 7.43 [5.37–9.48] cm/s (p = 0.01). Cochran’s Q test yielded a χ2 value of 7.62, I2 indicated moderate heterogeneity (59.6%), and the between-study variance (τ2) was 2.53. After applying the t-HKSJ adjustment, the 95% CI was [4.08–10.77] cm/s. The 95% PI was [-0.77,15.63] cm/s. The forest plot of this meta-analysis is shown in Figure 3 (upper panel).
A leave-one-out analysis was performed, carrying out iterations on the present model, excluding one of the studies included in each iteration (forest plot not shown). The leave-one-out analysis revealed that the article that most negatively conditioned the model was El-Aleem et al. [36]. Its exclusion from the model resulted in a mean difference [95% CI] of 8.34 [6.42-10.27] cm/s (p<0.001). Given that fewer than 10 studies were included in the model, no formal assessment of publication bias was conducted, and no trim-and-fill imputation methods were applied, in line with current methodological recommendations.
Concerning the random-effects meta-analysis of RI, Patriquin et al. [21] reported CG RI values as a range without a measure of central tendency; thus, the study could not be included in the meta-analytical models. Incesu et al. [26] did not provide a dispersion measure for RI, and Uzunosmanoğlu et al. (2017) [32] likewise reported RI values without dispersion data; consequently, both studies were also excluded from the meta-analyses. The random-effects meta-analysis of RI (AA versus CG) included four articles (139 AA and 139 controls) and yielded a significant mean difference [95% CI] of 0.14 [0.10-0.19] (p < 0.01). Cochran’s Q test yielded a χ2 value of 6.19, I2 indicated moderate heterogeneity (52%), and the between-study variance was τ2 = 0.00. This discrepancy between I2 and τ2 can occur in meta-analyses with a small number of studies because the model has insufficient statistical power to distinguish true between-study differences from random sampling error reliably. In this case, no t-HKSJ adjustment was applied. The 95% PI was [-0.02, 0.31]. The forest plot of this meta-analysis is shown in Figure 3 (lower panel).
A leave-one-out analysis was performed, carrying out iterations on the present model, excluding one of the studies included in each iteration (forest plot not shown). The leave-one-out analysis revealed that the article that most negatively conditioned the model was Saini et al. [37]. Its exclusion from the model resulted in a mean difference [95% CI] of 0.17 [0.13-0.20](p<0.001). Given that fewer than 10 studies were included in the model, no formal assessment of publication bias was conducted, and no trim-and-fill imputation methods were applied, in line with current methodological recommendations.
Diagnostic Test Accuracy Meta-Analysis for Spectral Doppler (AA versus CG)
The model for PSV (AA versus CG) included five studies and yielded a pooled sensitivity and specificity [95% CI] of 94% [89–97] and 87% [71–95], respectively (Figure 4). Between-study heterogeneity (τ2) was 0.29 for sensitivity and 1.05 for specificity, with a perfect negative correlation between them (ρ = –1.00). Such a perfect correlation is unusual and most likely reflects model instability due to the small number of studies rather than a reliable estimate. A Fagan nomogram was used with a pretest probability of 20%. The post-test probability increased to 63.6% after a positive result (LR+ = 7) and decreased to 5.2% after a negative result (LR− = 0.22).
The model for RI (AA versus CG) included five studies and yielded a pooled sensitivity and specificity [95% CI] of 81% [68–89] and 88% [73–95] (Figure 5). Between-study heterogeneity (τ2) was 0.41 for sensitivity and 0.91 for specificity, with a strong negative correlation between them (ρ = –0.91). A Fagan nomogram was used to estimate post-test probabilities based on a pretest probability of 20%. The post-test probability increased to 62% following a positive result (LR+ = 7) and decreased to 5% after a negative result (LR− = 0.22).
Color Doppler
Fifteen authors evaluated CD as a diagnostic tool in acute appendicitis (AA) [18,19,20,21,22,23,24,25,27,28,29,30,31,32,34]. Of these authors, two exclusively assessed the ability of CD to discriminate between NCAA and CAA [20,31], while the rest evaluated the ability of CD to diagnose AA in comparison to the CG [18,19,21,22,23,24,25,27,28,29,30,32,34]. A considerable heterogeneity was identified in the reported definitions of positivity (pathological findings) for CD imaging in acute appendicitis (AA). While some authors considered any detection of CD flow in the cecal appendix as positive, others only considered positivity when hyperemia or increased appendiceal flow was observed. Some authors, such as Patriquin et al. [21], used a multicategory scale based on the number of CD signals detected in the appendiceal wall (0 = none, 1–2 = few, 3–4 = moderate, >4 = abundant). This scale was later replicated by other authors, such as Gaitini et al. [28]. Some studies reported different diagnostic performance estimates depending on the cut-off point selected for the proposed scale; for example, Xu et al. [29] reported varying results depending on whether elevated flow or “type 2 flow” was considered diagnostic of AA, or whether the absence of flow was deemed sufficient to exclude AA. Other authors, such as Daga et al. [30], also reported different diagnostic outcomes depending on whether any detected appendiceal Doppler flow was considered diagnostic, or only cases showing hyperemia.
Diagnostic Test Accuracy Meta-Analysis for Color Doppler (AA versus CG)
The DTA meta-analysis for CD (AA versus CG) included 13 independent observations from 12 studies and yielded a pooled sensitivity and specificity [95% CI] of 82 [70–90] % and 97 [92–99] % (Figure 6). Between-study heterogeneity was moderate to substantial. τ2 was 1.04 for sensitivity and 1.39 for specificity. The correlation between sensitivity and specificity was weakly negative (ρ = –0.11). The pooled AUC [95% CI] was 0.97 [0.95-0.98]. Visual inspection of Deeks’ funnel plot and the results of the asymmetry test (p = 0.08) did suggest the presence of potential publication bias among the included studies (figure not shown). The potential presence of publication bias suggests that the pooled sensitivity and specificity estimates for CD should be interpreted with caution, as they likely represent the most optimistic scenario of the available evidence. A Fagan nomogram was used to estimate post-test probabilities based on a pretest probability of 20%. The post-test probability increased to 86% following a positive DUS result (LR+ = 24) and decreased to 4% after a negative result (LR− = 0.19). These findings support DUS’s strong rule-in and moderate rule-out value in clinical scenarios with intermediate pretest suspicion.
Lastly, a post-hoc exploratory DTA sensitivity analysis was performed to address a discrepancy identified during data extraction for the Aydin et al. study. This analysis, which excluded the said study to assess its impact on the pooled estimates, showed a pooled sensitivity of 84% [95% CI: 71–91] and a specificity of 97% [95% CI: 92–99]. These values do not substantially differ from those obtained in the main model, which included 13 observations.
Power Doppler
Three authors reported evaluating PD to diagnose acute appendicitis (AA) [23,26,34]. Pinto et al. reported a higher diagnostic performance of PD over CD [23]. Incesu et al. PD with CEPD, demonstrating the latter’s superiority over standalone PD [26]. Aydin et al. reported diagnostic performance data that combined results from both CD and PD modalities without distinction [34].
Only three studies’ contingency table data (TP, FP, TN, FN) were available for the power Doppler modality. Therefore, a DTA meta-analytical model could not be performed, as at least four studies are required to fit such models reliably.
Doppler Ultrasound (Complicated Appendicitis versus Non-Complicated Appendicitis)
Diagnostic Performance of Doppler Ultrasound (NCAA versus CAA)
Four studies reported the sensitivity and specificity of CD for discriminating NCAA and CAA: Quillin et al. [20] (77.8% and 60%), Patriquin et al. [21] (100% for both), Uzunosmanoğlu et al. [32] (93% and 85%), and Xu et al. [31] (25% and 72.4%). Two studies also provided SD measurements for the CAA and NCAA groups, using RI values [21] or PI values [32].
Discussion
The present systematic review and meta-analysis evaluated the role of all Doppler US modalities in diagnosing AA, consistently demonstrating excellent diagnostic yield.
Concerning the biological plausibility and the pathophysiological rationale for using DUS to diagnose AA, inflammation of the cecal appendix is associated with a localized increase in vascular perfusion secondary to the release of inflammatory mediators. These changes can be potentially detected through Doppler imaging techniques. However, it is essential to note that this phenomenon is not specific to AA and may occur in any infectious or inflammatory process. Consequently, conditions such as colitis or ileitis may also present with increased Doppler signal on ultrasound evaluation. However, it should be considered that based on this same pathophysiological premise, the occurrence of appendiceal tissue ischemia in the context of gangrenous acute appendicitis (GAA) or CAA may be associated with a reduction or absence of Doppler flow within the appendix. This phenomenon has been previously reported by authors such as Quillin et al. [20], who observed that appendiceal hyperemia was more frequent in non-perforated AA compared to perforated cases, and Patriquin et al. [21], who described the absence of a Doppler signal at the appendiceal tip in a high proportion of CAA cases.
Regarding the different Doppler modalities, CD, PD, and SD have been primarily evaluated. CD was the first modality used for diagnosing AA and remains the most extensively characterized in the medical literature, demonstrating strong diagnostic yield. PD has also shown excellent, and in some cases superior, performance; however, the limited number of published studies and the inability to conduct meta-analytical models to assess its diagnostic accuracy quantitatively prevent definitive conclusions from being drawn. CEPD, although promising, was evaluated in only one article. On the other hand, recent literature has focused on using SD, mainly through analyzing PSV and RI. In this regard, SD offers a significant advantage over CD and PD, namely the ability to obtain objective quantitative measurements, which could potentially reduce interobserver variability inherent to ultrasound examinations, particularly when using CD or PD modes. Regarding the discriminative capacity of DUS to distinguish NCAA from CAA, the available evidence is limited and currently markedly inferior to that reported for the diagnosis of AA versus a CG. This is a significant limitation, given that the potential presence of selection bias must be assumed in all cases.
An additional consideration is operator expertise. Most of the included studies were performed in academic centers, and examinations were conducted by experienced pediatric or abdominal radiologists, with some explicitly requiring more than five years of prior expertise in appendiceal US. Other reports indirectly underscored this dependence by restricting DUS examinations to working hours when trained radiologists were available. However, we did not identify any study that formally compared diagnostic performance stratified by operator expertise. This represents an important gap in the evidence and highlights a relevant avenue for future research.
Another relevant aspect is the lack of experience with the normal Doppler imaging appearance of the cecal appendix. This represents a significant limitation, as distinguishing between normal and pathological findings is critical for accurately characterizing the diagnostic performance of DUS in AA. It should also be considered that although the equipment used in the earlier studies was technologically more primitive and therefore less sensitive, it was reasonable to interpret a positive Doppler signal as pathological at that time. However, this concept likely requires re-evaluation given the greater sensitivity of current US machines.
Regarding study design, most studies were prospective with consecutive patient recruitment. However, a significant number of studies exhibited a potential risk of selection bias, as many included only patients in whom the appendix was visualized on grayscale US, and, in several cases, specifically those with borderline sonographic findings for AA diagnosis (e.g., non-compressible appendices or those measuring 6–8 mm). On the one hand, this represents an advantage, as the overall diagnostic performance of the tool is assessed in a population where diagnostic uncertainty is frequent, such as in cases of borderline visualized appendices. On the other hand, it must be noted that the diagnostic performance data provided in these studies may not reflect the general population of patients undergoing primary US for suspected AA, as cases without appendiceal visualization were systematically excluded in some studies. Considering the significant rate of non-visualization of the appendix reported in recent series, we believe that (1) the overall diagnostic performance of DUS in AA is likely overestimated in these studies, but on the other hand (2) this tool demonstrates potential diagnostic utility specifically in cases where the appendix is positively visualized, including those with borderline sonographic criteria.
Many retrospective studies relied on the retrospective review of static images or videotapes of examinations originally performed by other radiologists. We believe this represents a significant limitation and should be considered when evaluating the diagnostic performance reported in these studies. Additionally, the retrospective nature of these studies introduces essential limitations, such as (1) the lack of an accurate epidemiological representation of the prevalence of AA and its distribution by age and sex (for example, several studies report a disproportionately higher number of female patients, despite AA being a condition with a slight male predominance) [24]. Concerning the geographic distribution of the studies included, it is sufficiently broad not to limit the extrapolation of the results of this work.
Diagnostic odds ratios (DORs) across individual studies (Supplementary File 5) showed substantial variability, with some suggesting near-perfect performance but accompanied by wide confidence intervals. This asymmetry, with much wider upper bounds, is expected due to the log transformation applied during analysis and reflects the natural variability common to diagnostic accuracy studies [50]. Although DOR is less intuitive for clinical interpretation than sensitivity, specificity, or likelihood ratios, it remains a valuable composite measure of test performance. Overall, these findings highlight the influence of methodological and contextual factors not fully captured by subgroup analyses and underscore the need for standardized thresholds and prospective multicenter validation.
As a final remark, and as briefly mentioned in the Introduction, considering the rising prevalence of obesity in both pediatric and adult populations, it is essential to note that body habitus is a significant determinant of appendix visualization. Large retrospective and prospective series consistently show that overweight and obese patients are substantially more likely to have nondiagnostic examinations: visualization rates decrease from 85.7% in underweight children to only 29.3% in those with BMI z-scores >2 [51]; in another emergency cohort, 68% of nondiagnostic studies occurred in overweight patients, with BMI >85th percentile conferring nearly a five-fold increased odds of nondiagnostic results [52]; and a third prospective pediatric series confirmed reduced diagnostic accuracy in obese children (83% versus 93% in lean counterparts) [53]. Beyond obesity, anatomical factors such as retrocecal or pelvic locations further hinder sonographic identification. These findings underscore that patient habitus and appendix location remain critical constraints on ultrasound performance in suspected appendicitis.
The present study has key strengths, including its rigorous methodology aligned with PRISMA-DTA and the Cochrane Handbook for Diagnostic Test Accuracy Reviews, as well as the advanced meta-analytical models applied. *However, it has significant limitations: 1) the potential selection (spectrum) bias in most articles. Many of the included studies restricted their analyses to patients in whom the appendix could be visualized, or even to those with borderline grayscale findings. This approach artificially enriches the study population and likely inflates diagnostic accuracy estimates, since it systematically excludes the large proportion of patients with non-visualized appendices. Given the well-documented frequency of nondiagnostic examinations—particularly in obese patients or when the appendix is located in retrocecal or pelvic positions—our pooled estimates should be interpreted as applicable only to the subset of patients in whom the appendix is clearly identified, 2) the limitations inherent to the inferential statistical procedures used, 3) the small sample size and the retrospective nature of some of the included studies, 4) the high heterogeneity observed in some of the DTA meta-analytic models conducted, 5) the high heterogeneity in the CG definition, 6) the hierarchical model assessing “overall Doppler modalities” combines different Doppler techniques (CD, PD, CEPD, and SD) from overlapping study populations. This violates the assumption of independent observations and may lead to inflated estimates of precision. For this reason, this combined model should be interpreted strictly as exploratory. In contrast, separate models by modality provide more reliable estimates, 7) the pooled AUC estimates derived from hierarchical models extend beyond the empirical ROC space of the included studies, representing a model-based extrapolation rather than an observed summary measure. Consequently, AUC values should be interpreted cautiously, as they may overestimate diagnostic performance, especially in the presence of heterogeneity or limited study numbers, 8) Although meta-regressions were pre-specified a priori, their inherently exploratory nature warrants cautious interpretation, 9) in the study by Aydin et al. (2019), the reported 2×2 contingency table was internally inconsistent. After failing to obtain clarification from the original authors, we adopted the most plausible interpretation, inverting the reported cells. While this unverifiable decision introduces a potential source of bias, the uncorrected data would have yielded a diagnostic odds ratio close to zero—suggesting a useless test—completely at odds with the broader literature on color Doppler. By contrast, the corrected data align with previously reported diagnostic performance and are thus more biologically and clinically plausible. Nevertheless, this intervention must be acknowledged as a critical limitation, and the robustness of our conclusions should be interpreted with this caveat in mind, and 10) Deeks’ funnel plot asymmetry test was statistically significant for the Color Doppler model (p=0.08), indicating potential small-study effects or publication bias.
With the current evidence, DUS has not proven to be a reliable tool for differentiating between CAA and NCAA. Therefore, its use cannot be recommended for this specific purpose. Nevertheless, it remains an interesting avenue for future research. On the other hand, when the cecal appendix is adequately visualized, DUS demonstrates high diagnostic accuracy for confirming or ruling out acute appendicitis. Given its non-invasive nature and robust diagnostic performance, DUS holds promise as a vital diagnostic tool for the diagnosis of acute appendicitis. However, the limitations of this review, which are inherent to the primary studies, warrant further validation through large, well-designed multicenter studies.
Supplementary Materials
The following supporting information can be downloaded at the website of this paper posted on Preprints.org.
Funding
This review did not receive any specific grant from funding agencies in the public, commercial, or not-for-profit sectors, and none of the authors has external funding to declare.
Ethical Approval:
This study did not involve the participation of human or animal subjects, and therefore, IRB approval was not sought.
Statement of Availability of the Data Used During the Systematic Review
All data used for the meta-analytical models are available in the accompanying supplementary dataset file.
CRediT authorship contribution statement:
JAM: Conceptualization and study design; literature search and selection; data curation and extraction; formal analysis; investigation; methodology; project administration; resources; validation; visualization; writing – original draft; writing – review and editing. MRJ: Literature search and selection; data curation and extraction; project administration; resources; validation; visualization; writing, review, and editing.
Registration
PROSPERO (CRD42025641841).
Conflicts of Interest
The authors declare that they have no conflict of interest.
References
- Lotfollahzadeh S, Lopez RA, Deppen JG. Appendicitis. 2024 Feb 12. In: StatPearls [Internet]. Treasure Island (FL): StatPearls Publishing; 2024 Jan–. [PubMed]
- Tang G, Zhang L, Xia L, Zhang J, Chen R, Zhou R. Preoperative in-hospital delay increases postoperative morbidity and mortality in patients with acute appendicitis: a meta-analysis. Int J Surg. 2025 Jan 1;111(1):1275-1284. [CrossRef] [PubMed] [PubMed Central]
- Bolmers MDM, de Jonge J, Bom WJ, van Rossem CC, van Geloven AAW, Bemelman WA; Snapshot Appendicitis Collaborative Study group. In-hospital Delay of Appendectomy in Acute, Complicated Appendicitis. J Gastrointest Surg. 2022 May;26(5):1063-1069. [CrossRef] [PubMed]
- Di Saverio S, Podda M, De Simone B, Ceresoli M, Augustin G, Gori A, Boermeester M, Sartelli M, Coccolini F, Tarasconi A, De’ Angelis N, Weber DG, Tolonen M, Birindelli A, Biffl W, Moore EE, Kelly M, Soreide K, Kashuk J, Ten Broek R, Gomes CA, Sugrue M, Davies RJ, Damaskos D, Leppäniemi A, Kirkpatrick A, Peitzman AB, Fraga GP, Maier RV, Coimbra R, Chiarugi M, Sganga G, Pisanu A, De’ Angelis GL, Tan E, Van Goor H, Pata F, Di Carlo I, Chiara O, Litvin A, Campanile FC, Sakakushev B, Tomadze G, Demetrashvili Z, Latifi R, Abu-Zidan F, Romeo O, Segovia-Lohse H, Baiocchi G, Costa D, Rizoli S, Balogh ZJ, Bendinelli C, Scalea T, Ivatury R, Velmahos G, Andersson R, Kluger Y, Ansaloni L, Catena F. Diagnosis and treatment of acute appendicitis: 2020 update of the WSES Jerusalem guidelines. World J Emerg Surg. 2020 Apr 15;15(1):27. [CrossRef] [PubMed] [PubMed Central]
- Andersson RE, Stark J. Diagnostic value of the appendicitis inflammatory response (AIR) score. A systematic review and meta-analysis. World J Emerg Surg. 2025 Feb 8;20(1):12. [CrossRef] [PubMed] [PubMed Central]
- Arredondo Montero J, Bardají Pascual C, Antona G, Ros Briones R, López-Andrés N, Martín-Calvo N. The BIDIAP index: a clinical, analytical and ultrasonographic score for the diagnosis of acute appendicitis in children. Pediatr Surg Int. 2023 Apr 10;39(1):175. [CrossRef] [PubMed] [PubMed Central]
- Arruzza E, Milanese S, Li LSK, Dizon J. Diagnostic accuracy of computed tomography and ultrasound for the diagnosis of acute appendicitis: A systematic review and meta-analysis. Radiography (Lond). 2022 Nov;28(4):1127-1141. [CrossRef] [PubMed]
- Bom WJ, Bolmers MD, Gans SL, van Rossem CC, van Geloven AAW, Bossuyt PMM, Stoker J, Boermeester MA. Discriminating complicated from uncomplicated appendicitis by ultrasound imaging, computed tomography or magnetic resonance imaging: systematic review and meta-analysis of diagnostic accuracy. BJS Open. 2021 Mar 5;5(2):zraa030. [CrossRef] [PubMed] [PubMed Central]
- Chidiac C, Issa O, Garcia AV, Rhee DS, Slidell MB. Failure to Significantly Reduce Radiation Exposure in Children with Suspected Appendicitis in the United States. J Pediatr Surg. 2024 Aug 22:161701. Epub ahead of print. [CrossRef] [PubMed]
- D’Souza N, Hicks G, Beable R, Higginson A, Rud B. Magnetic resonance imaging (MRI) for diagnosis of acute appendicitis. Cochrane Database Syst Rev. 2021 Dec 14;12(12):CD012028. [CrossRef] [PubMed] [PubMed Central]
- Kim D, Woodham BL, Chen K, Kuganathan V, Edye MB. Rapid MRI Abdomen for Assessment of Clinically Suspected Acute Appendicitis in the General Adult Population: a Systematic Review. J Gastrointest Surg. 2023 Jul;27(7):1473-1485. [CrossRef] [PubMed] [PubMed Central]
- Matthew Fields J, Davis J, Alsup C, Bates A, Au A, Adhikari S, Farrell I. Accuracy of Point-of-care Ultrasonography for Diagnosing Acute Appendicitis: A Systematic Review and Meta-analysis. Acad Emerg Med. 2017 Sep;24(9):1124-1136. [CrossRef] [PubMed]
- Cho SU, Oh SK. Accuracy of ultrasound for the diagnosis of acute appendicitis in the emergency department: A systematic review. Medicine (Baltimore). 2023 Mar 31;102(13):e33397. [CrossRef] [PubMed] [PubMed Central]
- Harel S, Mallon M, Langston J, Blutstein R, Kassutto Z, Gaughan J. Factors Contributing to Nonvisualization of the Appendix on Ultrasound in Children With Suspected Appendicitis. Pediatr Emerg Care. 2022 Feb 1;38(2):e678-e682. [CrossRef] [PubMed]
- Puylaert JB. Acute appendicitis: US evaluation using graded compression. Radiology. 1986 Feb;158(2):355-60. [CrossRef] [PubMed]
- Chang ST, Jeffrey RB, Olcott EW (2014) Three-step sequential positioning algorithm during sonographic evaluation for appendicitis increases appendiceal visualization rate and reduces CT use. AJR Am J Roentgenol 203(5):1006–1012. [CrossRef]
- Pfeifer CM, Carrejo B, Lewis S, Hutchinson K, Gokli A, Kwon J. Structured coaching as a means to improve sonographic visualization of the appendix: a quality improvement initiative. Emerg Radiol. 2023 Apr;30(2):161-166. [CrossRef] [PubMed]
- Quillin SP, Siegel MJ. Appendicitis in children: color Doppler sonography. Radiology. 1992 Sep;184(3):745-7. [CrossRef] [PubMed]
- Quillin SP, Siegel MJ. Appendicitis: efficacy of color Doppler sonography. Radiology. 1994 May;191(2):557-60. [CrossRef] [PubMed]
- Quillin SP, Siegel MJ. Diagnosis of appendiceal abscess in children with acute appendicitis: value of color Doppler sonography. AJR Am J Roentgenol. 1995 May;164(5):1251-4. [CrossRef] [PubMed]
- Patriquin HB, Garcier JM, Lafortune M, Yazbeck S, Russo P, Jequier S, Ouimet A, Filiatrault D. Appendicitis in children and young adults: Doppler sonographic-pathologic correlation. AJR Am J Roentgenol. 1996 Mar;166(3):629-33. [CrossRef] [PubMed]
- Lim HK, Lee WJ, Kim TH, Namgung S, Lee SJ, Lim JH. Appendicitis: usefulness of color Doppler US. Radiology. 1996 Oct;201(1):221-5. [CrossRef] [PubMed]
- Pinto, F., Lencioni, R., Falleni, A. et al. Assessment of hyperemia in acute appendicitis: Comparison between power Doppler and color Doppler sonography. Emergency Radiology 5, 92–96 (1998). [CrossRef]
- Gutierrez CJ, Mariano MC, Faddis DM, Sullivan RR, Wong RS, Lourie DJ, Stain SC. Doppler ultrasound accurately screens patients with appendicitis. Am Surg. 1999 Nov;65(11):1015-7. [CrossRef] [PubMed]
- Kessler N, Cyteval C, Gallix B, Lesnik A, Blayac PM, Pujol J, Bruel JM, Taourel P. Appendicitis: evaluation of sensitivity, specificity, and predictive values of US, Doppler US, and laboratory findings. Radiology. 2004 Feb;230(2):472-8. [CrossRef] [PubMed]
- Incesu L, Yazicioglu AK, Selcuk MB, Ozen N. Contrast-enhanced power Doppler US in the diagnosis of acute appendicitis. Eur J Radiol. 2004 May;50(2):201-9. [CrossRef] [PubMed]
- Baldisserotto M, Peletti AB. Is colour Doppler sonography a good method to differentiate normal and abnormal appendices in children? Clin Radiol. 2007 Apr;62(4):365-9. [CrossRef] [PubMed]
- Gaitini D, Beck-Razi N, Mor-Yosef D, Fischer D, Ben Itzhak O, Krausz MM, Engel A. Diagnosing acute appendicitis in adults: accuracy of color Doppler sonography and MDCT compared with surgery and clinical follow-up. AJR Am J Roentgenol. 2008 May;190(5):1300-6. [CrossRef] [PubMed]
- Xu Y, Jeffrey RB, Shin LK, DiMaio MA, Olcott EW. Color Doppler Imaging of the Appendix: Criteria to Improve Specificity for Appendicitis in the Borderline-Size Appendix. J Ultrasound Med. 2016 Oct;35(10):2129-38. [CrossRef] [PubMed]
- Daga, Soniya; Kachewar, Sushil; Lakhkar, Dilip L; Jethlia, Kalyani; Itai, Abhijeet. Sonographic evaluation of acute appendicitis and its complications. West African Journal of Radiology 24(2):p 152-156, Jul–Dec 2017. [CrossRef]
- Xu Y, Jeffrey RB, Chang ST, DiMaio MA, Olcott EW. Sonographic Differentiation of Complicated From Uncomplicated Appendicitis: Implications for Antibiotics-First Therapy. J Ultrasound Med. 2017 Feb;36(2):269-277. [CrossRef] [PubMed]
- Uzunosmanoğlu H, Çevik Y, Çorbacıoğlu ŞK, Akıncı E, Buluş H, Ağladıoğlu K. Diagnostic value of appendicular Doppler ultrasonography in acute appendicitis. Ulus Travma Acil Cerrahi Derg. 2017 May;23(3):188-192. [CrossRef] [PubMed]
- Shin LK, Jeffrey RB, Berry GJ, Olcott EW. Spectral Doppler Waveforms for Diagnosis of Appendicitis: Potential Utility of Point Peak Systolic Velocity and Resistive Index Values. Radiology. 2017 Dec;285(3):990-998. [CrossRef] [PubMed]
- Aydin S, Tek C, Ergun E, Kazci O, Kosar PN. Acute Appendicitis or Lymphoid Hyperplasia: How to Distinguish More Safely? Can Assoc Radiol J. 2019 Nov;70(4):354-360. [CrossRef] [PubMed]
- Bakhshandeh T, Maleknejad A, Sargolzaie N, Mashhadi A, Zadehmir M. The utility of spectral Doppler evaluation of acute appendicitis. Emerg Radiol. 2022 Apr;29(2):371-375. [CrossRef] [PubMed]
- El-Aleem RA, Abd Allah AA, Shehata MR, Seifeldein GS, Hassanein SM. Diagnostic performance of spectral Doppler in acute appendicitis with an equivocal Alvarado score. Emerg Radiol. 2024 Apr;31(2):141-149. [CrossRef] [PubMed]
- Saini S, Mittal MK, Kanaujia R et al. (2024) Exploring the role of spectral Doppler in acute appendicitis. Egypt J Radiol Nucl Med 55:218. [CrossRef]
- Anuj, G., S., R.R., Ashok, Y. et al. Diagnostic Utility of Spectral Doppler Ultrasound in Acute Appendicitis: a Prospective Study. Indian J Surg (2025). [CrossRef]
- McInnes MDF, Moher D, Thombs BD, McGrath TA, Bossuyt PM, and the PRISMA-DTA Group. Preferred Reporting Items for a Systematic Review and Meta-analysis of Diagnostic Test Accuracy Studies: The PRISMA-DTA Statement. JAMA. 2018;319(4):388–396. [CrossRef]
- Whiting PF, Rutjes AW, Westwood ME, Mallett S, Deeks JJ, Reitsma JB, Leeflang MM, Sterne JA, Bossuyt PM; QUADAS-2 Group. QUADAS-2: a revised tool for the quality assessment of diagnostic accuracy studies. Ann Intern Med. 2011 Oct 18;155(8):529-36. [CrossRef] [PubMed]
- Wan X, Wang W, Liu J, Tong T. Estimating the sample mean and standard deviation from the sample size, median, range and/or interquartile range. BMC Med Res Methodol. 2014 Dec 19;14:135. [CrossRef] [PubMed] [PubMed Central]
- Hozo, D., Djulbegovic, B., & Hozo, I. (2005). Estimating the mean and variance from the median, range, and the size of a sample. BMC Medical Research Methodology, 5(1), 13. [CrossRef]
- Šimundić AM. Measures of Diagnostic Accuracy: Basic Definitions. EJIFCC. 2009 Jan 20;19(4):203-11. [PubMed] [PubMed Central]
- Nyaga, V.N., Arbyn, M. Metadta: a Stata command for meta-analysis and meta-regression of diagnostic test accuracy data – a tutorial. Arch Public Health 80, 95 (2022). [CrossRef]
- Roger M. Harbord & Penny Whiting, 2009. “metandi: Meta-analysis of diagnostic accuracy using hierarchical logistic regression,” Stata Journal, StataCorp LP, vol. 9(2), pages 211-229, June. [CrossRef]
- Dwamena BA. MIDAS: Stata module for meta-analytical integration of diagnostic test accuracy studies. Statistical Software Components S456880, Boston College Department of Economics, revised 13 Dec 2009.
- Doebler P, Holling H, Rojas-Garcia A, Hillebrand T (2023). mada: Meta-Analysis of Diagnostic Accuracy. R package version 0.5.12. Available online: https://CRAN.R-project.org/package=mada.
- Shi L, Lin L. The trim-and-fill method for publication bias: practical guidelines and recommendations based on a large database of meta-analyses. Medicine (Baltimore). 2019 Jun;98(23):e15987. [CrossRef] [PubMed] [PubMed Central]
- Deeks JJ, Macaskill P, Irwig L. The performance of tests of publication bias and other sample size effects in systematic reviews of diagnostic test accuracy was assessed. J Clin Epidemiol. 2005 Sep;58(9):882-93. [CrossRef] [PubMed]
- Glas AS, Lijmer JG, Prins MH, Bonsel GJ, Bossuyt PM. The diagnostic odds ratio: a single indicator of test performance. J Clin Epidemiol. 2003 Nov;56(11):1129-35. [CrossRef] [PubMed]
- Pfeifer CM, Xie L, Atem FD, Mathew MS, Schiess DM, Messiah SE. Body mass index as a predictor of sonographic visualization of the pediatric appendix. Pediatr Radiol. 2022 Jan;52(1):42-49. [CrossRef] [PubMed]
- Keller C, Wang NE, Imler DL, Vasanawala SS, Bruzoni M, Quinn JV. Predictors of Nondiagnostic Ultrasound for Appendicitis. J Emerg Med. 2017 Mar;52(3):318-323. [CrossRef] [PubMed]
- Schuh S, Man C, Cheng A, Murphy A, Mohanta A, Moineddin R, Tomlinson G, Langer JC, Doria AS. Predictors of non-diagnostic ultrasound scanning in children with suspected appendicitis. J Pediatr. 2011 Jan;158(1):112-8. [CrossRef] [PubMed]
Figure 1.
Flowchart of the search and selection process.
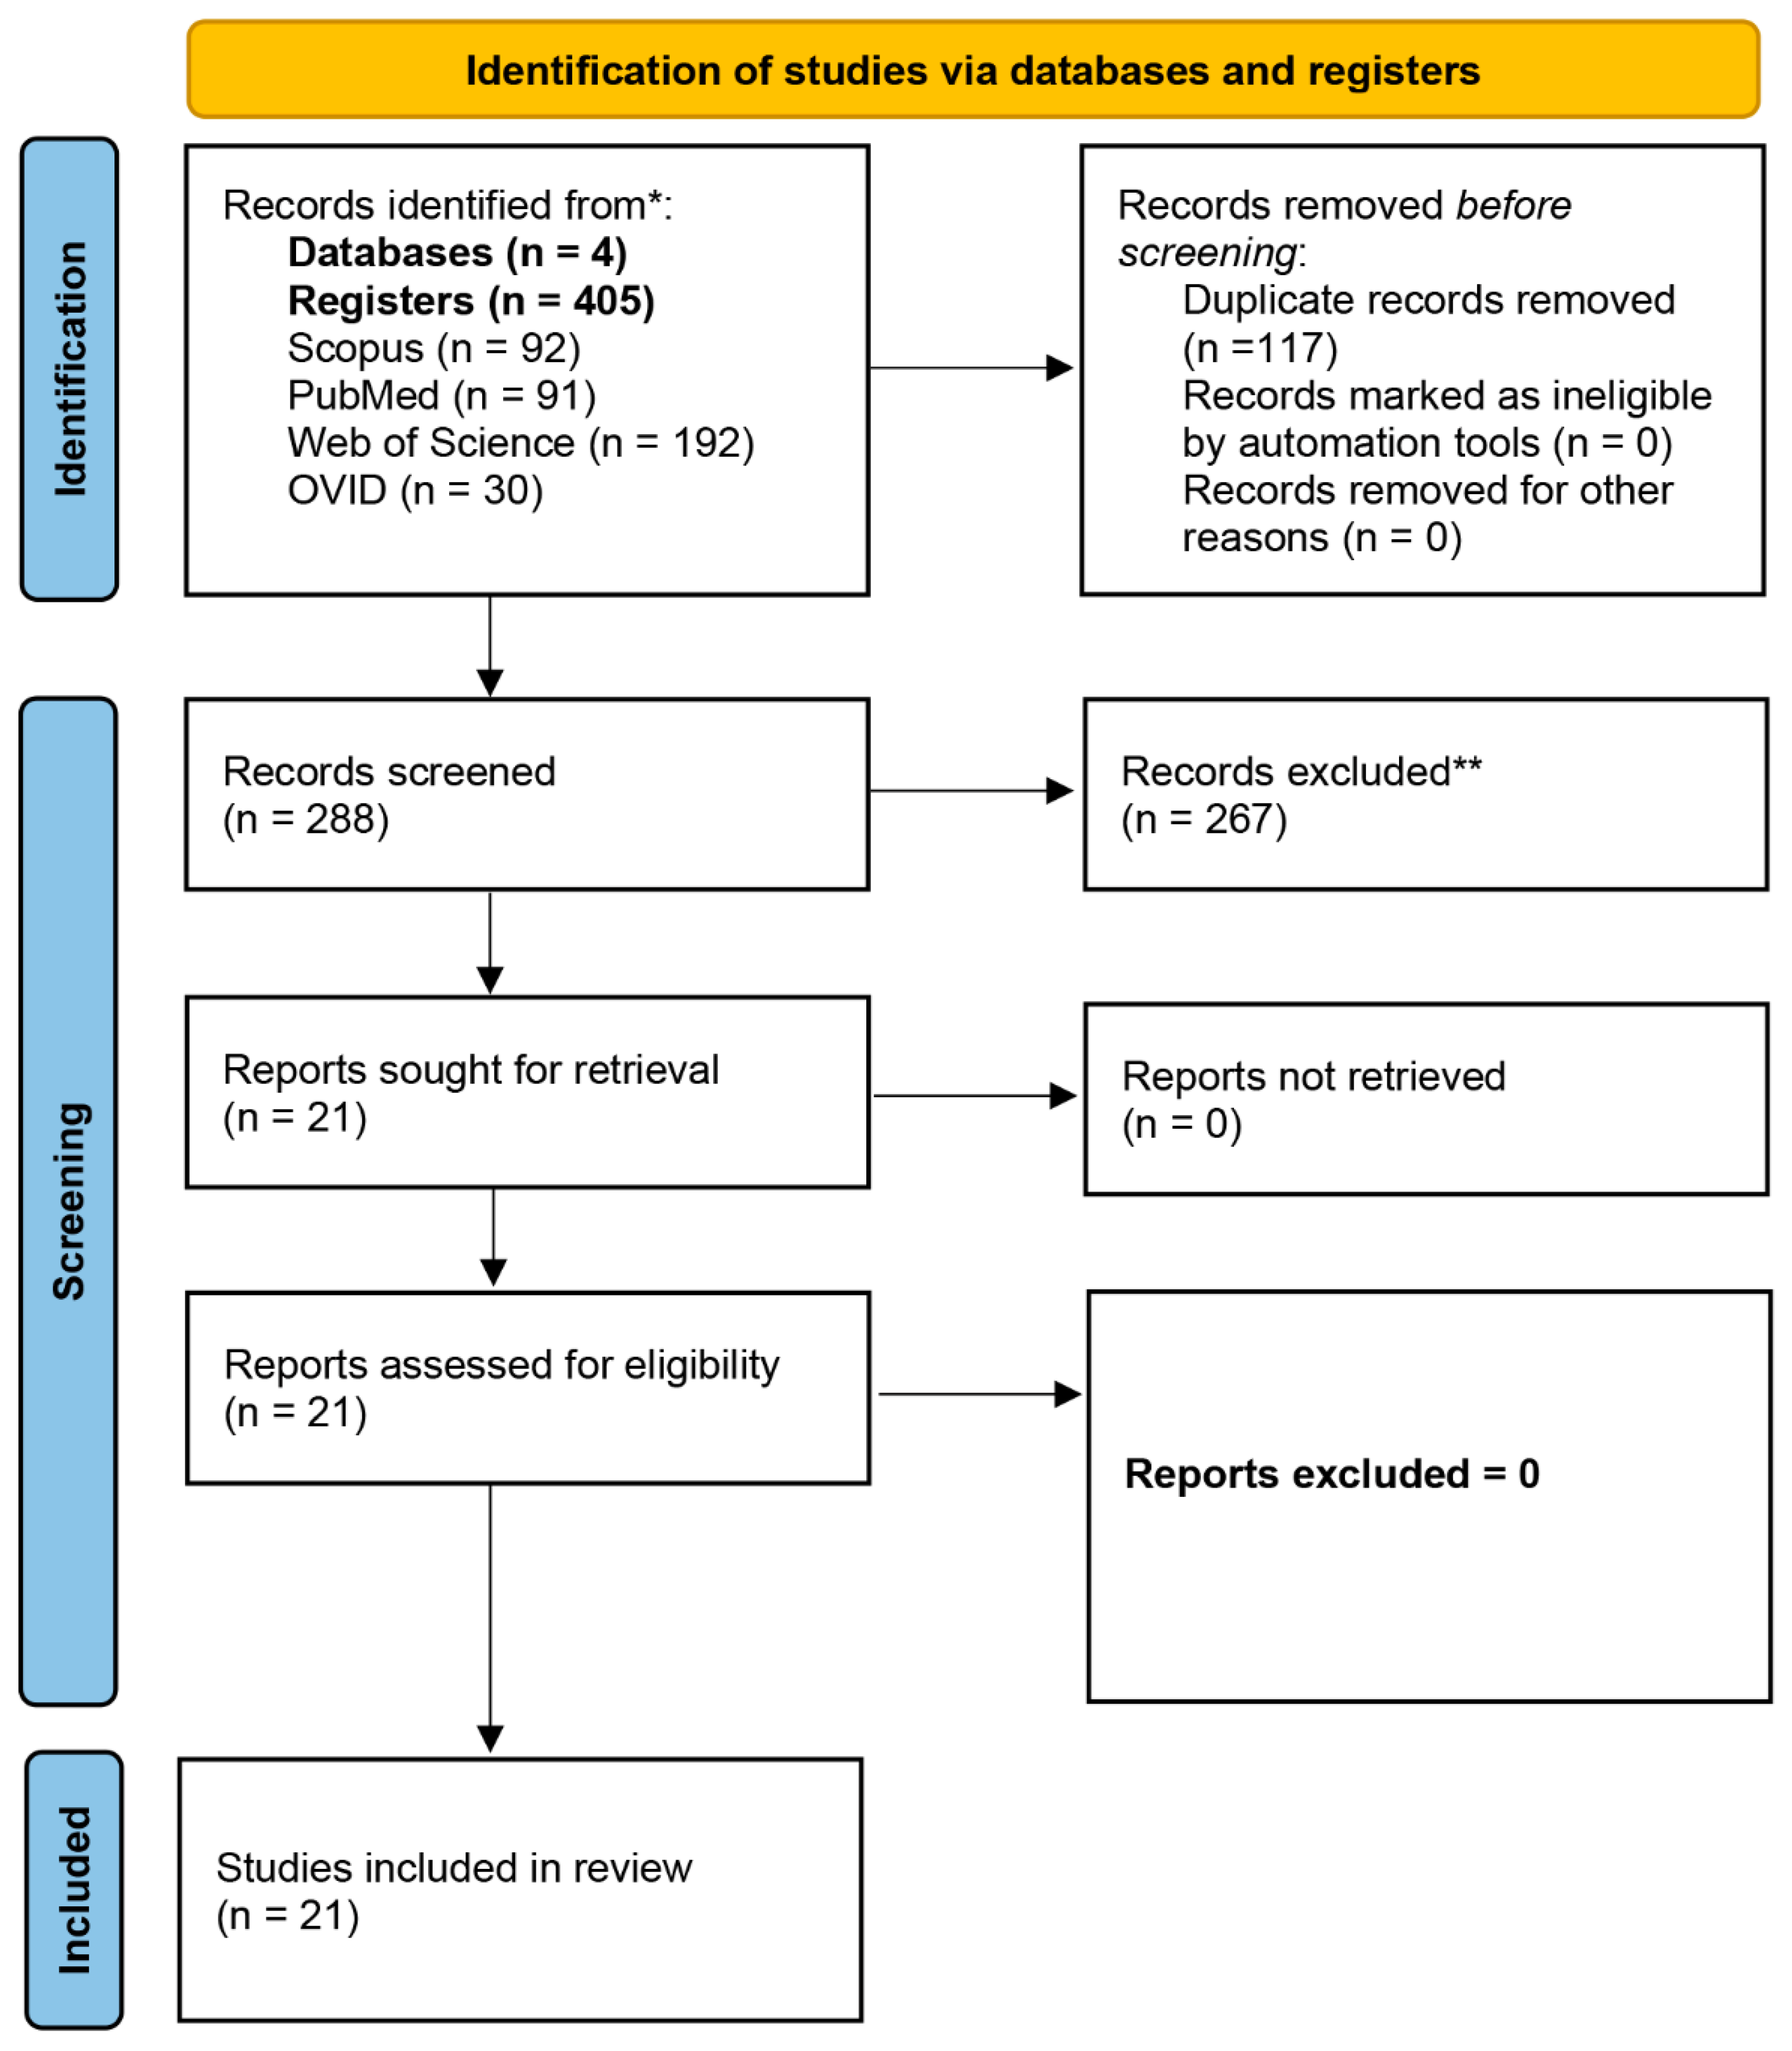
Figure 2.
Graphical representation of the quality assessment of the diagnostic accuracy studies included in the review (QUADAS-2 tool).
Figure 2.
Graphical representation of the quality assessment of the diagnostic accuracy studies included in the review (QUADAS-2 tool).
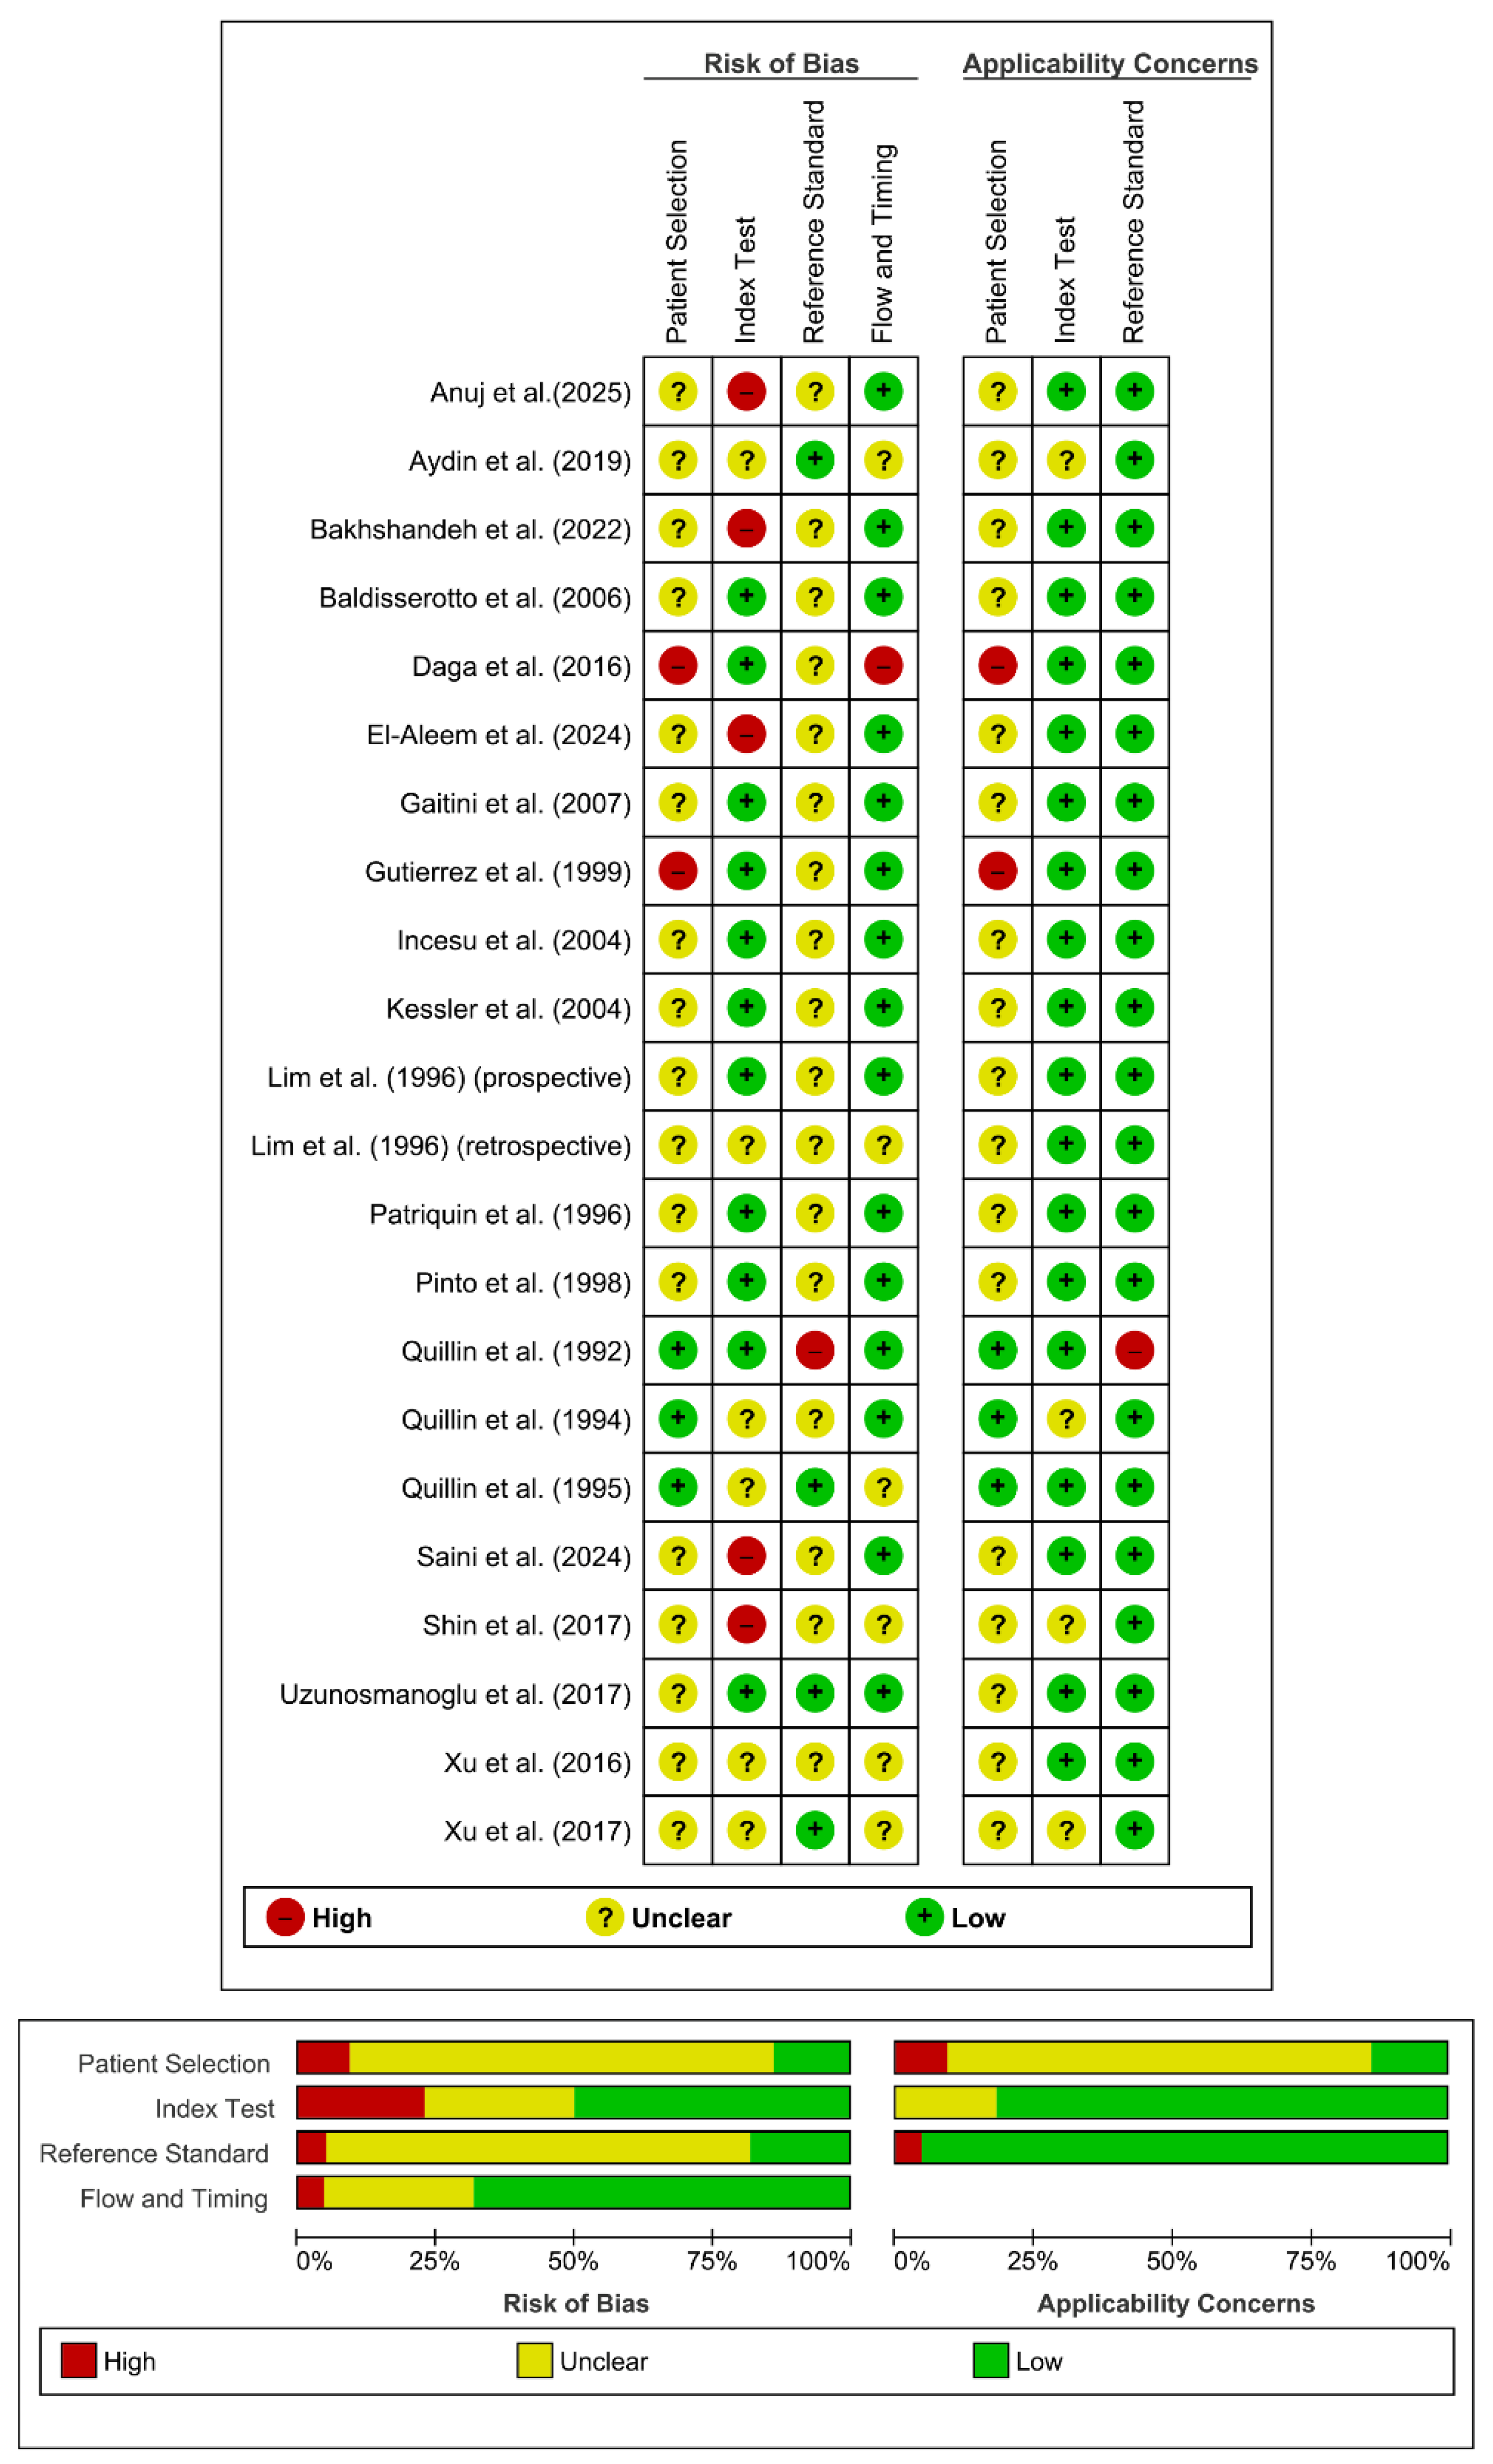
Figure 3.
Above: Forest plot of the REML random-effects meta-analysis performed for PSV (cm/s) (AA versus CG). Bottom: Forest plot of REML random-effects meta-analysis performed for RI (AA versus CG).
Figure 3.
Above: Forest plot of the REML random-effects meta-analysis performed for PSV (cm/s) (AA versus CG). Bottom: Forest plot of REML random-effects meta-analysis performed for RI (AA versus CG).
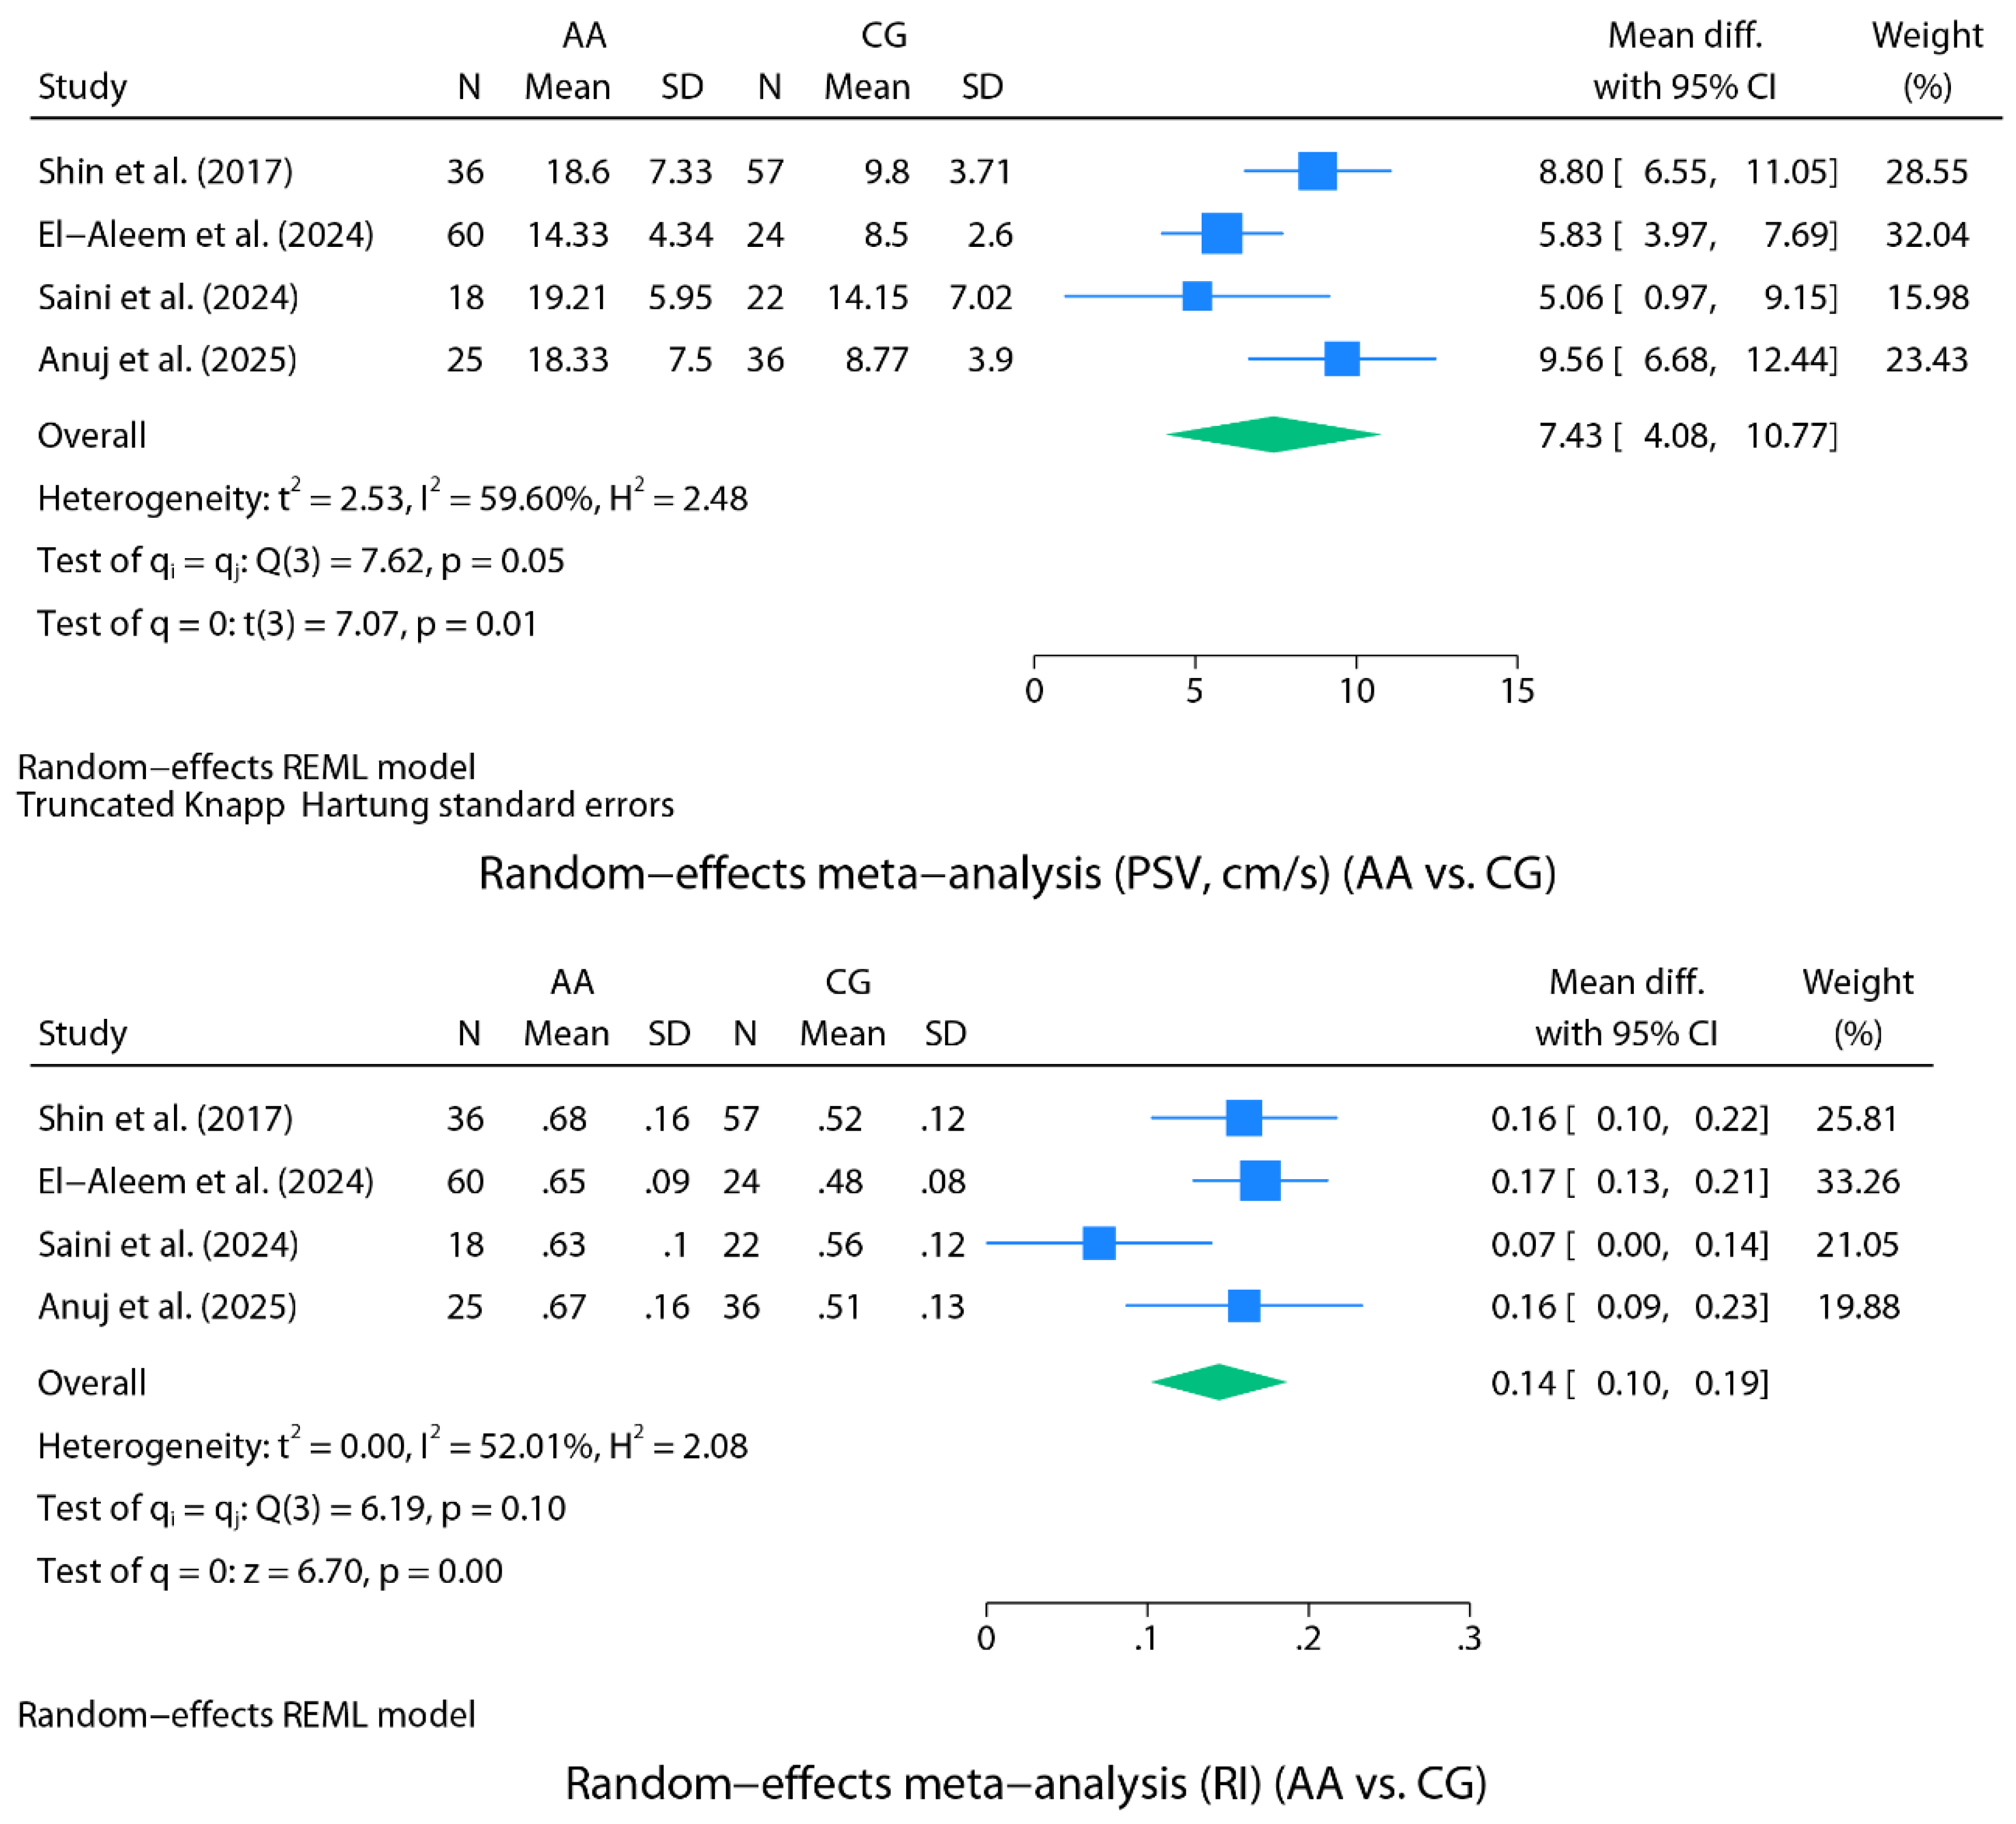
Figure 4.
Above: DTA meta-analysis for PSV (AA versus CG). HSROC curve. Bottom: Forest plot of the DTA meta-analysis performed for PSV (AA versus CG).
Figure 4.
Above: DTA meta-analysis for PSV (AA versus CG). HSROC curve. Bottom: Forest plot of the DTA meta-analysis performed for PSV (AA versus CG).
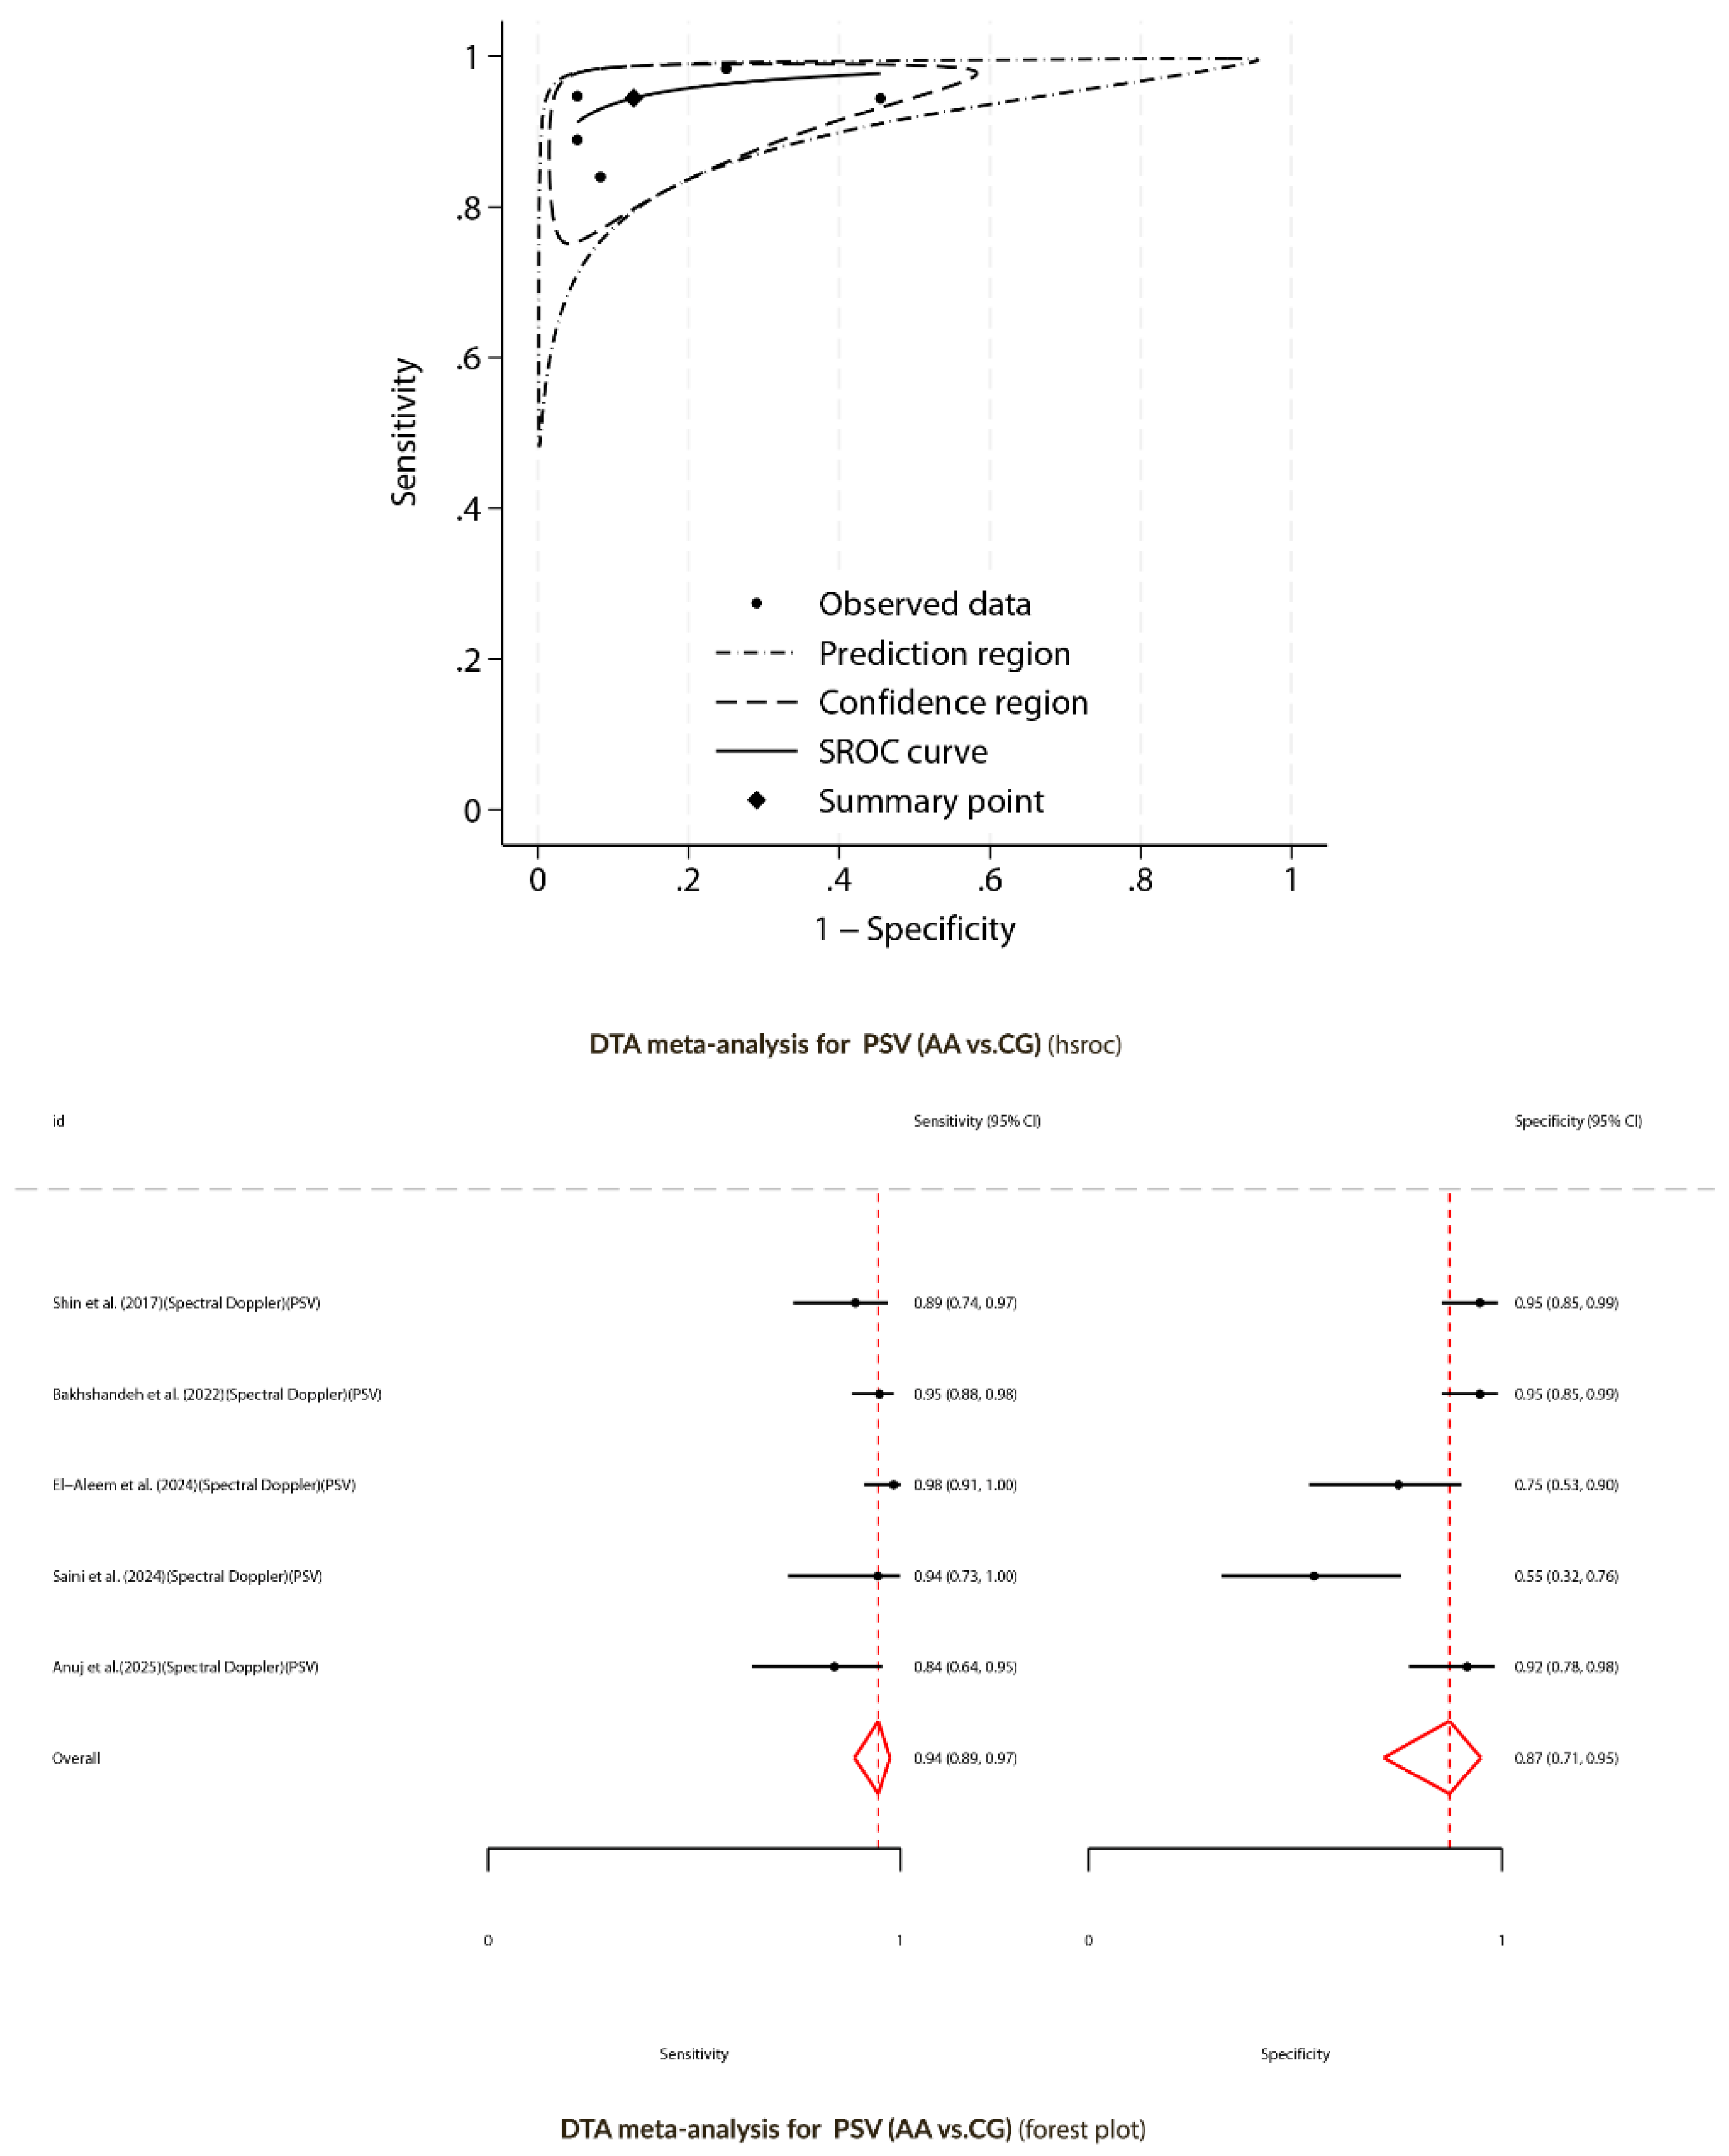
Figure 5.
Above: DTA meta-analysis for RI (AA versus CG). HSROC curve. Bottom: Forest plot of the DTA meta-analysis performed for RI (AA versus CG).
Figure 5.
Above: DTA meta-analysis for RI (AA versus CG). HSROC curve. Bottom: Forest plot of the DTA meta-analysis performed for RI (AA versus CG).
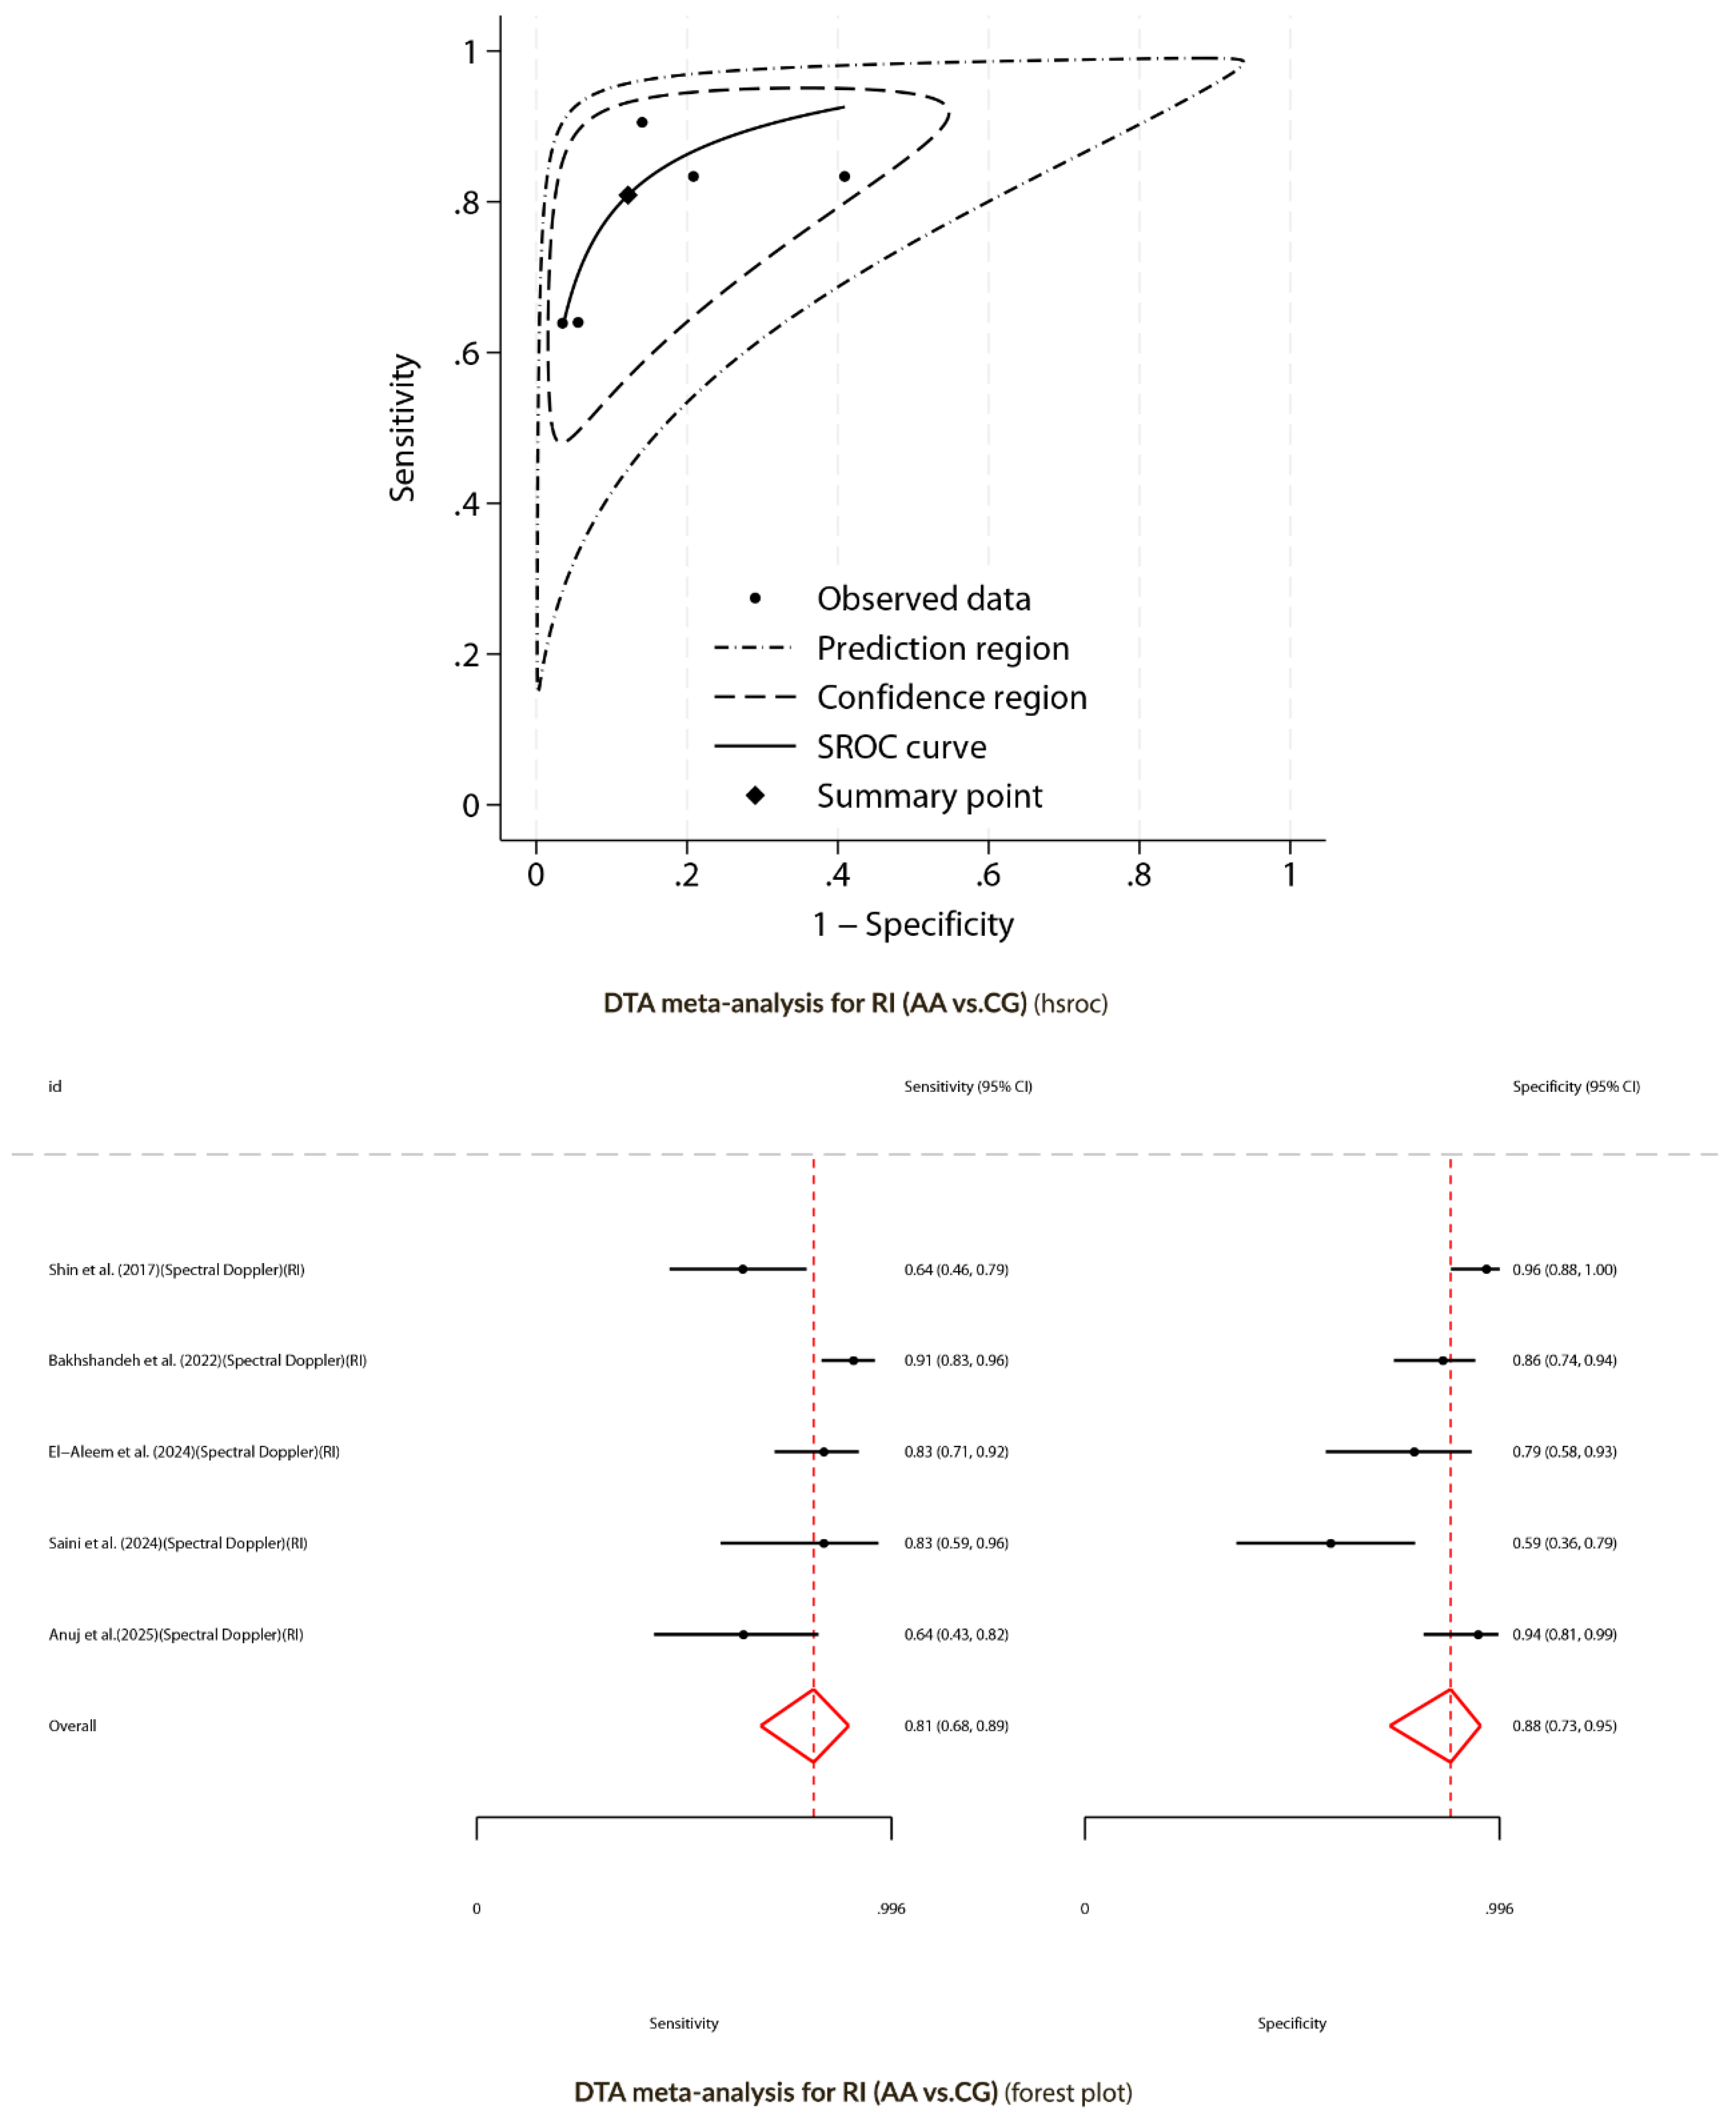
Figure 6.
Above: DTA meta-analysis for color Doppler (AA versus CG). HSROC curve. Bottom: Forest plot of the DTA meta-analysis performed for color Doppler (AA versus CG).
Figure 6.
Above: DTA meta-analysis for color Doppler (AA versus CG). HSROC curve. Bottom: Forest plot of the DTA meta-analysis performed for color Doppler (AA versus CG).
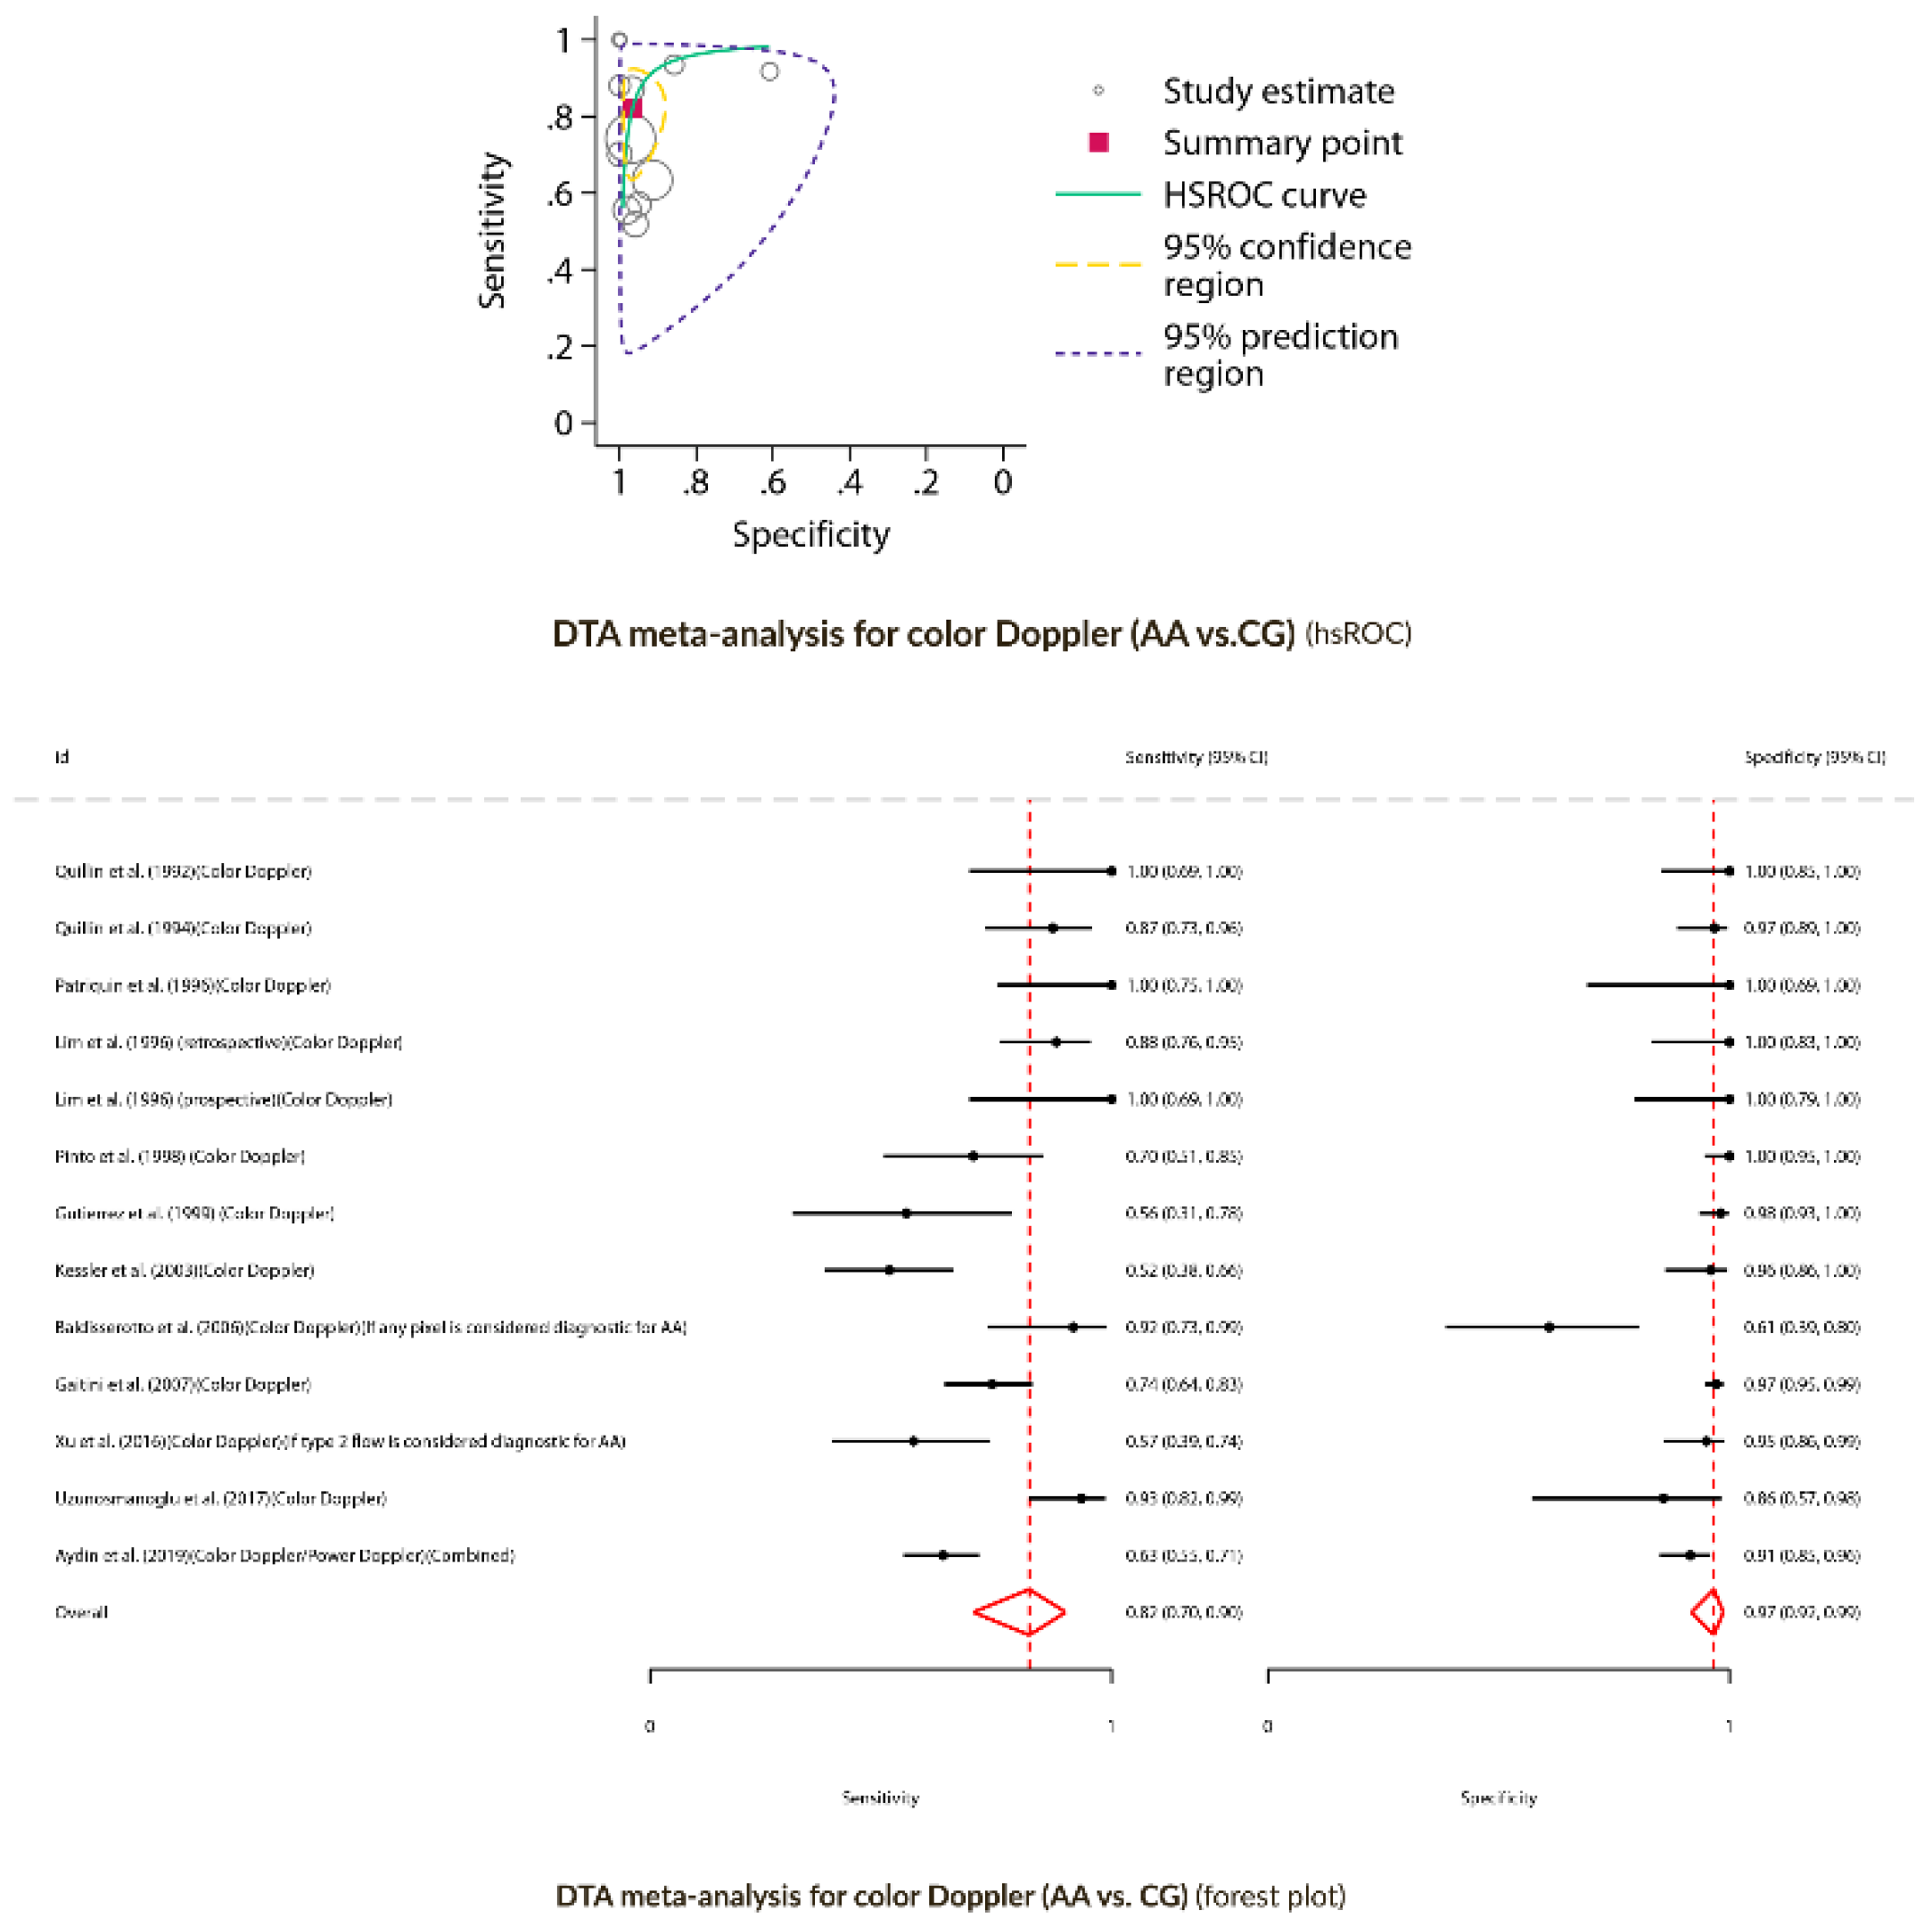

Table 1.
Summary of publications included in this review.
| Author | Country | Study design | Population | Age | Sex M/F | Total N | Group definitions | N in AA | N in CG | US Doppler settings | US doppler Diagnostic performance |
Sensitivity (%) Specificity (%) |
Commentaries |
|---|---|---|---|---|---|---|---|---|---|---|---|---|---|
| Quillin et al. (1992) [18] | USA | Prospective (consecutive recruitment) | Pediatric | 11(2-18)y2 | 14/19 | 33 |
IC: Patients with suspected AA AA: AA surgical findings. No histopathological confirmation. CG: NSAP (mesenteric adenitis, hemorrhagic ovarian cyst, viral syndrome, infectious enteritis) + hemorrhagic mesenteric cyst (surgical). Clinical follow-up to exclude AA |
10 CAA:1 NCAA:9 |
23 NSAP:22 Hemorrhagic mesenteric cyst (surgical):1 |
Examiner: PR DUM: CD USP: 5 MHz (linear) Parameters: Bandpass filter: 100 Hz, flow settings: lowest |
TP:10 TN:23 FP:0 FN:0 |
Se:100% Sp:100% |
- |
| Quillin et al. (1994) [19] | USA | Prospective (consecutive recruitment) | Pediatric | 11(1-19)y2 (AA group) |
16/23 (AA group) |
100 |
IC: Patients with suspected AA AA: Histopathological confirmation CG: NSAP (gastrointestinal disease, gynecologic disease, renal disease, no abnormalities) with clinical follow-up to exclude AA. NA |
39 NPAA:26 PAA:13 |
61 |
Examiner: PS under PR supervision DUM: CD USP: 5-7.5 MHz (linear) Parameters: Max. power: 500W/Cm2, Gate: 2, Wall filter: 1, scale: 23 cm/sec |
TP:34 TN:59 FP:2 FN:5 |
Se:87% Sp:97% |
The authors present a contingency table comparing the diagnostic performance of gray-scale ultrasound, color Doppler ultrasound, and their combined use. |
| Quillin et al. (1995) [20] | USA | Prospective (consecutive recruitment) | Pediatric | 11(1-19)y2 (AA group) |
19/28 | 47 |
IC: Patients with suspected AA AA: Histopathological confirmation. |
47 NPAA: 27 PAA: 20 |
NS |
Examiner: 2 Blinded experienced radiologists (image review) DUM: CD. USP: 5 or 7.5 MHz (linear). Parameters: Max. power: 500W/Cm2, Gate: 2, Wall filter: 1, scale: 23 cm/sec |
NCAA vs. CAA: Appendiceal hyperemia (favoring NCAA): TP:21b TN:12b FP:8b FN:6b |
NCAA vs. CAA: Appendiceal hyperemia (favoring NCAA): Se:77.8%b Sp:60%b |
Since US is a dynamic examination, retrospective evaluation through static images may constitute a bias. Appendiceal hyperemia was more frequent in NPAA than in PAA, suggesting absence of perforation. |
| Patriquin et al. (1996) [21] | Canada | Prospective | Mixed | HC: 4-25y1 AA: 10(3-25)y2 |
NS | 55 |
AA: Histopathological confirmation CG: HC (2-8 hours of fasting, ultrasound performed for other reasons, i.e., urological) |
30 NCAA: 13 CAA: 11 AA over CA: 3 CrD: 2 Misdiagnosed pregnancy: 1 |
25 (10 with US-appendiceal identification) |
Examiner: Radiologist DUM: CD + SD. USP: 3-5/5/ or 7.5 MHz (linear) Parameters: Low-flow settings: lowest available pulse repetition frequency, highest color doppler gain possible, wall filter: 50 KHz, restricted color window (probably 50 KHz was a mistake from the authors, since the normal range varies between 50 and 800 Hz for CD studies). CD Scale: Number of color doppler signals within the appendiceal wall: absent (0), sparse (1-2), moderate (3-4), or abundant (>4) |
RI (CG): 0.85-11 RI (NCAA): 0.54(0.4-0.77)2 RI (CAA): 0.54(0.33-0.9)2 CD (AA vs. CG): (13 NCAA patients vs. 10 controls with US-appendiceal identification): TP:13b NCAA: Abundant Doppler signal (4) in 13/13 TN:10b CG: No doppler signal (0) in 6/10; sparse doppler signal (1-2) in 4/10. FP:0b FN:0b |
CD: Se:100%b Sp:100%b |
The appendix identification rate in the healthy control (HC) group was very low (10/25), possibly leading to selection bias (spectrum bias). In the AA group, some patients were difficult to classify within the study’s two groups (AA and CG), such as those with CrD or the misdiagnosed pregnancy. This may also represent a potential source of bias. The authors describe for the first time the absence of a Doppler signal at the appendiceal tip in CAA (8 out of 11 cases) |
| Lim et al. (1996)c [22] | South Korea | Retrospective | Mixed | AA: 28(7-72)y2 CG:22(4-62)y2 |
AA: 32/18 CG: 14/6 |
70 |
AA: Histopathological confirmation CG: IBS suspicion patients who underwent barium enema |
50 | 20 |
Examiner: Experienced radiologist DUM: CD + DD + SD USP: 5-10 MHz (linear) Parameters: Wall filter: 100 Hz, low-velocity scale (pulse repetition frequency, 1500 Hz), constant color sensitivity (78%) |
CD: TP:44b TN:20b FP:0b FN:6b |
CD: Se:88%b Sp:100%b |
The six patients classified as FN correspond to six cases of advanced AA (severely necrotic appendix) in which no appendiceal Doppler flow was identified. Patients with non-visualized or partially visualized appendix at barium enema were excluded, which may constitute a selection bias |
| Lim et al. (1996)c [22] | South Korea | Prospective | Mixed | 27(6-56)y2 | 17/9 | 128 (26 with US-appendiceal identification and borderline appendix) |
IC: Patients with suspected AA and borderline US criteria AA: Histopathological confirmation CG: NSAP with clinical follow-up/barium enema for excluding AA |
10 | 16 |
Examiner: Experienced radiologist DUM: CD + DD + SD (no RI/PI calculation) USP: 5-10 MHz (linear) Parameters: Wall filter: 100 Hz, low-velocity scale (pulse repetition frequency, 1500 Hz), constant color sensitivity (78%) |
CD: TP:10b TN:16b FP:0b FN:0b |
CD: Se:100%b Sp:100%b |
Of the 126 patients, the cecal appendix was identified by ultrasound in 102. Among these, 26 had borderline criteria (5–7 mm). Since the color Doppler diagnostic performance assessment was limited to this subgroup of patients, a selection bias (spectrum bias) may have been introduced |
| Pinto et al. (1998) [23] | Italy | Prospective (consecutive recruitment) | Mixed | 24.7(7-61)y2 | 46/54 | 100 |
IC: Patients with suspected AA AA: Histopathological confirmation CG: NA, NSAP |
34 (30 with US-appendiceal identification) NCAA: 24 CAA (GA+PAA):10 |
NSAP: 62 NA: 4 (CrD: N=1) (Salpingitis: N=2) (Cecal diverticulitis: N=1) |
Examiner: Certified radiologist DUM: CD + PD USP: 3.75 (convex) /7.5 MHz (linear) Parameters: Bandpass filter: 50 Hz, pulse repetition frequency (PRF) 500-750 Hz, Doppler encoded area restriction, color gain adjustment |
CD: TP:21b TN:66b FP:0b FN:9b PD: TP:28b TN:66b FP:0b FN:2b |
CD: Se:70%b Sp:100%b PD: Se:93.3%b Sp:100%b |
The reported diagnostic performance includes only the subgroup of patients with AA in whom the cecal appendix was identified (30/34). Although authors state that there were no FP in either DUM modality (Color and Power), they do not specify how many in CG patients the appendix was identified. A selection bias (spectrum bias) may have been introduced |
| Gutierrez et al. (1999) [24] | USA | Prospective (consecutive recruitment) | Mixed | 32(3-77)y2 | 20/105 | 125 |
IC: Patients with suspected AA (atypical presentation) AA: Histopathological confirmation CG: NSAP, Non-appendiceal surgical pathology (foreign body perforation, hemoperitoneum secondary to omental arteritis) + NA |
20 NCAA: 16 PAA: 4 |
105 NSAP: 93 NA: 10 (inferential) Non-appendiceal surgical pathology: 2 |
Examiner: NS DUM: CD USP: 5 MHz Parameters: NS |
TP:10b, o TN:105b, o FP:2b, o FN:8b, o |
Se:55.6%b, o Sp:98.1%b, o |
Patients with atypical presentations of acute appendicitis (AA) were specifically selected, which may have introduced a selection bias (spectrum bias). The cecal appendix was only visualized in 23 out of 125 patients, a particularly low rate, representing a significant limitation of the study. However, the final sample for analysis included the ultrasounds of all 125 patients, and the data on TP, FN, TN, and FP are based on the total cohort. The two false positives were the patients with non-appendiceal surgical pathology. |
| Kessler et al. (2003) [25] | France | Prospective (consecutive recruitment) | Adult | 29.5(15-83)y2 | 58/67 | 125 (104 with US-appendiceal identification)d |
IC: Patients with suspected AA AA: Histopathological confirmation CG: NSAP (including non-specific abdominal, mesenteric adenitis, pain, ileitis, gynecologic disease, gastroenteritis, colic pain, psoas hematoma, cystitis, mesenteric ischemia, prostatitis, sigmoid diverticulitis, and gastric ulcer) |
57 (55 with US-appendiceal identification) NPAA: 42 PAA: 15 |
68 (49 with US-appendiceal identification) Non-specific abdominal pain: 26 Mesenteric adenitis: 13 Ileitis or colitis: 9 Gynecologic diseases: 8 Gastroenteritis: 5 Others: 7 |
Examiner: Radiologist with experience in gastrointestinal US examination DUM: CD USP: 4-7 MHz (convex) /5-10 MHz (linear). Parameters: low velocity scale (pulse repetition frequency 1500 Hz, wall filter: 100 Hz) |
TP:28 TN:47 FP:2 FN:26 |
Se:52% Sp:96% |
The reported diagnostic performance is limited to patients in whom the cecal appendix was identified: 55 out of 57 in the AA group and 49 out of 68 in the CG group. A selection bias (spectrum bias) may have been introduced |
| Incesu et al. (2004) [26] | Turkey | Prospective (consecutive recruitment) | Mixed | 4-591 | 36/14 | 50 |
IC: Patients with suspected AA AA: Histopathological confirmation CG: NSAP (non-specific abdominal pain, urinary tract infection, inguinal hernia, typhlitis, CrD, mesenteric adenitis) + NA |
35 ASA: 16 PLA: 3 GA: 7 PAA: 9 |
15 (12 with US-appendiceal identification) NSAP: 14 NA: 1 |
Examiner: Radiologist DUM: PD, CEPD USP: 5-10 MHz (multifrequency linear) Parameters: B-mode, parameter optimization (NS) |
RI: ASA: 0.663 PLA: 0.713 GA: 0.923 PAA: 0.793 PD: TP:26 TN:14 FP:1 FN:9 CEPD: TP:35 TN:14 FP:1 FN:0 |
PD: Se:74.3% Sp:93.3% CEPD: Se:100% Sp:93.3% |
All RI comparisons between groups were reported as statistically significant. |
| Baldisserotto et al. (2006) [27] | Brazil | Prospective (consecutive recruitment) | Pediatric | 7.6(2-12)y2 | 31/19 | 50 (47 with US-appendiceal identification) |
IC: Patients with suspected AA AA: Histopathological confirmation CG: NSAP + NA |
24 (24 with US-appendiceal identification) NCAA: 18 CAA (GA, PAA): 6 |
26 (23 with US-appendiceal identification) NSAP: 25 NA: 1 |
Examiner: Experienced pediatric radiologists DUM: CD USP: 4-7 MHz (curved) / 5-12 MHz (linear). Parameters: adjusted to optimize detection of low velocity flows. CD Scale: Number of color doppler pixels within the appendiceal wall: absent (0), low (1-2), moderate (3-4), or abundant (>4) |
If 3-4 pixels and >4 pixels are considered diagnostic: TP:15b TN:19b FP:4b FN:9b If any pixel present is considered diagnostic: TP:22b TN:14b FP:9b FN:2b |
If 3-4 pixels and >4 pixels are considered diagnostic: Se: 62.5%b Sp: 82.6%b If any pixel present is considered diagnostic: Se: 91.7%b Sp: 60.9%b |
The reported diagnostic performance includes only the subgroup of patients in whom the cecal appendix was identified (47/50), which may have introduced selection bias. Since these authors use a multicategorical scale to classify Doppler flow, diagnostic performance varies depending on the categories considered. Two possible scenarios were created: 1) considering 3–4 pixels and >4 pixels as pathological, or 2) considering any number of pixels as pathological. When any pixel is considered pathological, sensitivity is high (91.7%), whereas restricting the diagnosis to 3–4 and >4 pixels yields better specificity (82.6%). Overall, the Youden index (J) was higher when the presence of any pixel was considered pathological (J = 0.526), compared to using only 3–4 pixels or >4 pixels as diagnostic criteria (J = 0.451) |
| Gaitini et al. (2007) [28] | Israel | Retrospective (consecutive inclusion) | Adult | 28.4(18-73)y2 | 149/271 | 420 (401 with US-appendiceal identification) |
IC: Patients with suspected AA AA: Histopathological confirmation CG: NSAP + Other surgical etiologies + NA |
95 PLA: 84 GA (necrotic): 7 PAA: 4 |
323 NSAP, other medical diagnoses: 316 Other surgical etiologies: 5 NA: 2 |
Examiner: Sonography technician vs radiology resident + confirmation from a senior radiologist DUM: CD USP: 3-5 MHz (convex) / 5-12 vs. 4-8 MHz (linear) Parameters: adjusted to optimize detection of low velocity flows CD Scale: Number of color doppler signals within the appendiceal wall: absent (0), sparse (1-2), moderate (3-4), or abundant (>4) |
CD: TP:66b TN:303b FP:9b FN:23b |
CD: Se: 74.2% Sp: 97.1% |
The reported diagnostic performance study includes only the subgroup of patients in whom the cecal appendix was clearly identified through US (401/420). Seventeen indeterminate cases and two patients with lost reports were excluded from the final analyses. A selection bias (spectrum bias) may have been introduced |
| Xu et al. (2016) [29] | USA | Retrospective | Mixed | 16(2-62)y2 (Data concerning the 94 patients included in the analyses) |
46/48 (Data concerning the 94 patients included in the analyses) |
103 (94 with US-appendiceal identification)e |
IC: Patients with suspected AA whose US showed non-compressible appendices with 6-8 outer diameters. AA: Histopathological confirmation. CG: NSAP (6 weeks follow-up period) + NA |
35 | 59 NSAP: 54 NA: 5 |
Examiner: Experienced sonographers (US performance) + 2 blinded abdominal radiologists (image review) DUM: CD +/- SD (no RI/PI calculation) +/- PD USP: 9-15 MHz Parameters: adjusted to optimize detection of low volume flows. CD Scale: Color Doppler Flow pattern: absent signal (1), type 1 flow (punctate and dispersed signal foci (2), type 2 flow (continuous linear or curvilinear signal extending at least 3 mm in long or short axis view) (3) |
If type 2 flow is considered diagnostic for AA: TP:20 TN:56 FP:3 FN:15 If absent flow is considered diagnostic for not having AA: TP:28 TN:25 FP:10 FN:31 |
If type 2 flow is considered diagnostic for AA: Se: 57.1% Sp: 94.9% If absent flow is considered diagnostic for not having AA: Se: 47.5% Sp: 71.4% |
The reported diagnostic performance study includes only the subgroup of patients in whom the cecal appendix was clearly identified (94/103). A selection bias (spectrum bias) may have been introduced Since US is a dynamic examination, retrospective evaluation through static images may constitute a bias. Discrepancies in CD scale categories were resolved by consensus. The authors limited their sample to patients with an appendix identified on ultrasound and showing borderline characteristics (6–8 mm, non-compressible), which may constitute a selection bias (spectrum bias). The authors report an interobserver agreement kappa value of 0.59 (moderate). This may have been influenced by the study’s methodology (retrospective review of static Doppler images). The Youden index was higher when type 2 flow was considered diagnostic for AA (J = 0.52), compared to absent flow used to rule out AA (J = 0.18), indicating better overall diagnostic performance in the former approach |
| Daga et al. (2017) [30] | India | NS | Mixed | 8-62y1 | NS | 100 (91 with US-appendiceal identification)f |
IC: Patients with a strong suspicion of AA and US criteria for diagnosing AA AA: Histopathological confirmation CG: NSAP (6 weeks follow-up period) + NA |
AA: 85 |
15 NSAP: 5 NA: 4 Interval appendectomy (appendicular mass): 4 (inferentially classified in CG group) Drainage of abscess: 2 (inferentially classified in CG group) |
Examiner: NS DUM: CD USP: 3.5-5 MHz (curvilinear) / 7.5-10 MHz (linear) Parameters: NS |
If increased CD flow (hyperemia) is considered diagnostic for AA: TP:64b,f TN:0b,f FP:0b,f FN:21b,f If any CD flow is considered diagnostic for AA: TP:79b,f TN:0b,f FP:0b,f FN:6b,f |
If increased CD flow (hyperemia) is considered diagnostic for AA: Se:NCf Sp:NCf If any CD flow is considered diagnostic for AA: Se:NC%f Sp: NC%f |
Of the 100 patients, the cecal appendix was identified by ultrasound in 90. Among these, 85 had a US AA diagnosis. Since the CD diagnostic performance assessment was limited to this last subgroup of patients, only TP and FP could be calculated. A selection bias (spectrum bias) may have been introduced. The Youden index, Se, and Sp were NC due to insufficient data. |
| Xu et al. (2017) [31] | USA | Retrospective | Mixed | 16.5(3-57)y2 | 64/55 Adults:17/22 Children: 47/33 |
119 |
IC: Patients operated on for AA with histopathologically-proven AA |
119 NCAA: 87 CAA: 32 (GA:11, PAA:21) |
- |
Examiner: Experienced sonographer (retrospective revision by abdominal radiologist) DUM: CD USP: 8-15 MHz (linear) Parameters: NS CD scale: Mural hyperemia was defined as at least 3 mm of contiguous color Doppler flow identified (long or short axis). |
NCAA vs. CAA (Mural hyperemia: 3 mm of contiguous color Doppler flow identified): TP:8 TN:63 FP:24 FN:24 |
NCAA vs. CAA (Mural hyperemia: 3 mm of contiguous color Doppler flow identified): Se: 25%b Sp: 72.4%b |
Since US is a dynamic examination, retrospective evaluation through static images may constitute a bias. The poor diagnostic performance is likely due to the use of mural hyperemia as the diagnostic criterion for complicated acute appendicitis (CAA). Based on biological plausibility and previous literature, this marker should have been applied to non-complicated acute appendicitis (NCAA). The absence of Doppler flow in the appendiceal wall would have been a more appropriate indicator for CAA. |
| Uzunosmanoğlu et al. (2017) [32] | Turkey | Prospective (non-consecutive)g | Adult | 30.3(19-61)y2 | 33/27 | 60h |
IC: Patients operated on for AA AA: Histopathological confirmation CG: NA |
AA: 46 NCAA: 25 CAA (PAA): 21 |
NA: 14 |
Examiner: Radiologist DUM: CD + SD USP: 5 MHz (Color and pulse) / 3-9 MHz (electronic phased array) Parameters: NS |
RI (NCAA): 0.783 RI (CAA): 0.813 PI (NCAA): 1.23 PI (CAA): 13 Doppler US: TP:43b TN:12b FP:2b FN:3b |
Doppler US: Se: 93% Sp: 85% |
Since US is a dynamic examination, retrospective evaluation through static images may constitute a bias. The authors state that although they had 21 cases of PAA, they had no cases of GA or necrotic AA |
| Shin et al. (2017) [33] | USA | Retrospective (consecutive) | Mixed | 14.5(1-56)y2 | 53/40 | 337 (93 with US-appendiceal identification and CD on appendiceal wall) |
IC: Patients with suspected AA AA: Histopathological confirmation CG: NSAP |
36 | 57 |
Examiner: Experienced radiologist DUM: CD + SD USP: 8-15 MHz (linear) Parameters: adjusted to optimize detection of low volume flows (lowest wall filter value, lowest pulse repetition frequency) |
PSV (cm/s): AA: 19.7(2-33)2 18.6(7.33)5 CG:7.1(4-21)2 9.8(3.71)5 RI AA: 0.69(0.33-1)2 0.68(0.16)5 CG: 0.5(0.24-0.82)2 0.52(0.12)5 PSV TP:32b TN:54b FP:3b FN:4b RI: TP:23b TN:55b FP:2b FN:13b |
PSV ≥ 10 (cm/s) Se:88.9% Sp:94.7% RI ≥ 0.65 Se:63.9% Sp:96.5% |
The authors limited their sample to patients with an appendix identified on ultrasound and a CD signal within the appendiceal wall (93/337), which may constitute a selection bias (spectrum bias). PSV and RI comparisons between groups were statistically significant (p<0.001) |
| Aydin et al. (2019) [34] | Turkey | Retrospective | Mixed | 26(4-78)y2 | 131/128 | 280 (259 with sufficient sonographic information) |
IC: patients who have undergone an appendectomy AA: histopathological confirmation CG: NA (lymphoid hyperplasia) |
142 | NA (lymphoid hyperplasia): 117 |
Examiner: Radiologist DUM: CD + PD USP: 7 MHz (linear) Parameters: NS |
AA (Mural hyperemia: any flow within the appendiceal wall): TP:90b, n TN:107b, n FP:10b, n FN:52b, n |
AA (Mural hyperemia: any flow within the appendiceal wall): Se:63.4% Sp:91.5% |
The retrospective analysis of static images in a dynamic test such as US may introduce bias. The authors limited their sample to patients with adequate sonographic data (259/280), which may lead to spectrum bias. Mural hyperemia was defined as the presence of wall flow on CD or PD. The use of a CG with lymphoid hyperplasia rather than NSAP may also limit the interpretability of the results—particularly given that the reported Se and Sp for grayscale US (appendix >7 mm) were low (63.4% and 77.8%) compared to previous literature. |
| Bakhshandeh et al. (2022) [35] | Iran | Cross sectional | Mixed | 24(12.6)y4 | 82/70 | 152k |
IC: Patients with suspected AA and borderline US AA criteria AA: Histopathological confirmation CG: NSAP + NA |
95k | 57k NSAP:?k NA: 57k |
Examiner: Radiologist DUM: CD + SD USP: 7 MHz (linear) Parameters: pulse repetition frequency 1- 1.3 kHz, reduced wall filter |
PSVm: TP:90 TN:54 FP:3 FN:5 RIm: TP:86 TN:49 FP:8 FN:9 |
PSV ≥ 9.6 (cm/s) Se:94.7% Sp:94.7% RI ≥ 0.495 Se:90.5% Sp:86% |
The authors limited their sample to patients with an appendix identified on ultrasound and showing borderline characteristics (6–8 mm), which may constitute a selection bias (spectrum bias). Patients with definite AA on US were also excluded from the study, which may also constitute a selection bias. The numerical values for PSV and RI reported in the manuscript correspond to the entire cohort and are not specific to any subgroups |
| El-Aleem et al. (2024) [36] | Egypt | Prospective | Mixed |
AA: 22.95 (6-43)y2 CG: 17.92 (4-62)y2 |
AA: 36/24 CG: 14/10 |
100 (84 with US-appendiceal identification and with appendiceal CD flow present)i |
IC: Patients with suspected AA and with a visible appendix in grayscale US AA: Histopathological confirmation CG: NSAP (6 weeks follow-up period) + NA |
60 | 24 |
Examiner: Senior resident (4y experience) and Abdominal radiology consultant (12y experience) DUM: CD + SD USP: 5 MHz (Curvilinear) / 6-12 MHz (multifrequency linear) Parameters: Lowest wall filter value and pulse repetition frequency |
PSV (cm/s) AA: 14.33(4.34)4 CG: 8.5(2.6)4 RI AA: 0.65(0.09)4 CG:0.48(0.08)4 PSV TP:59b TN:18b FP:6b FN:1b RI: TP:50b TN:19b FP:5b FN:10b |
PSV ≥ 8.6 (cm/s) Se:98.3% Sp:75% RI ≥ 0.58 Se:83.3% Sp:79.2% |
The exclusive inclusion of patients with AA whose appendix was visible on grayscale US and who had CD flow on appendiceal US (84/100) may constitute selection bias (spectrum bias). PSV and RI comparisons between groups were statistically significant (p<0.001) |
| Saini et al. (2024) [37] | India | Prospective | Mixed | 2-50y1 | NS | 40 |
IC: Patients with suspected AA AA: Histopathological confirmation CG: NSAP + NA |
18 |
22 NA:3 |
Examiner: Postgraduate radiology resident + Senior radiologist supervision DUM: CD + SD USP: 12 MHz (Linear) Parameters: NS |
PSV (cm/s) AA: 19.21(5.95)4 CG: 14.15(7.02)4 RI AA: 0.63(0.1)4 CG: 0.56 (0.12)4 PSV TP:17b TN:12b FP:10b FN:1b RI: TP:15b TN:13b FP:9b FN:3b |
PSV ≥ 11.8 (cm/s) Se:93.8% Sp:54.2% RI ≥ 0.56 Se: 81.2% 83.3%b Sp: 58.3% 59.1%b |
Patients with complicated AA (PAA, abscess) were excluded from the study, which may represent a selection bias. PSV comparison between groups was statistically significant (p=0.009) RI comparison between groups reached marginal significance (p=0.056) A small difference was found between the sensitivity and specificity reported by the authors and those calculated inferentially based on TP, FP, TN, and FN |
| Anuj et al.(2025) [38] | India | Prospective (consecutive recruitment) | Mixed |
AA: 35(10-60)y2 CG: 34(12-58)y2 |
AA: 15/10 CG: 20/16 |
180 (64 with US-appendiceal identification and with appendiceal doppler data. Finally, the authors included 61 patients)l |
IC: Patients with suspected AA AA: Histopathological confirmation CG: NSAP |
25 | 36 |
Examiner: Experienced radiologists DUM: SD USP: NS Parameters: NS |
PSV (cm/s) AA: 18.9(3-32.5)2 18.33(7.5)5 CG: 6.8(2.5-19)2 8.77(3.9)5 RI AA: 0.68(0.35-0.98)2 0.67(0.16)5 CG: 0.51 (0.22-0.79)2 0.51(0.13)5 PSV TP:21 TN:33 FP:3 FN:4 RI: TP:16 TN:34 FP:2 FN:9 |
PSV ≥ 10 (cm/s) Se:85.3% Sp:92.5% RI ≥ 0.65 Se:64% Sp:95% |
The exclusive inclusion of patients with AA whose appendix was visible on grayscale US and who had CD flow and spectral Doppler waveforms on appendiceal US (61/180) may constitute selection bias (spectrum bias)l PSV and RI comparisons between groups were statistically significant (p<0.001) |
IC: Inclusion criteria; NS: Not specified; y: Years. AA: Acute appendicitis group; CG: Control group; NSAP: Non-surgical abdominal pain; HC: Healthy controls; CAA: Complicated acute appendicitis; NCAA: Non-complicated acute appendicitis; PAA: Perforated acute appendicitis; NPAA: Non-perforated acute appendicitis; NA: Negative appendectomy; ASA: Acute suppurative appendicitis; PLA: Phlegmonous appendicitis; GA: Gangrenous appendicitis; CA: Chronic appendicitis; IBS: Irritable bowel syndrome; CrD: Crohn’s disease. TP: True positives; TN: True negatives; FP: False positives; FN: False negatives; Se: Sensitivity; Sp: Specificity; NC: Not-calculable. PR: Pediatric Radiologist; PS: Pediatric sonographer (It is inferentially understood that they are referring to a clinical pediatrician with ultrasound skills); US: Ultrasound; DUM: Doppler ultrasound mode; USP: Ultrasound probe; CD: Color Doppler; PD: Power Doppler, SD: Spectral Doppler; DD: Duplex Doppler; CEPD: Contrast-enhanced power Doppler; RI: Resistive/resistance index; PSV: Peak systolic velocity; PI: Pulsatility index; SML: submucosal layer. 1: Range; 2: Mean (range); 3: Mean; 4: Mean (standard deviation); 5: Mean (standard deviation) estimated from mean (range). a: Calculation based on the contingency table generated with the values of TP, TN, FP, and FN; b: Inferential calculation (i.e., based on the % of patients with the sonographic Doppler finding in each group); c: Lim et al. included one publication with two patient samples, one prospective and one retrospective. Both are included and analyzed as separate studies in the present review.; d: The sum of the reported TP, TN, FP, and FN values from Kessler et al. (Table 2) yields 103, whereas they report 104 patients with the cecal appendix identified on ultrasound.; e: Xu et al. report that they included all patients who underwent US due to suspected appendicitis (AA) during the study period and identified 94 patients with borderline appendices. They mention that 9 cases with non-visualized appendices were excluded, but later state that their institution’s appendix non-visualization rate is 50%. Also, they do not mention which percentage of patients with a normal appendix (not borderline) were identified and excluded from the study; f: Daga et al.’s work presents numerical inconsistencies (i.e., in the main text, the authors report: “overall, out of 100 patients, 90 patients were diagnosed appendicitis on US examination,” but in Table 1, they report that the US was positive for AA in 85 cases and a normal cecal appendix was identified in 6 cases). Given that all percentage values are calculated over 85 patients in the rest of the main text, we have opted to keep this data. Their CD diagnostic performance results are reported only for the AA group, so only TP and FP could be estimated. This should be considered a significant limitation and a potential high risk of bias. g: In the study by Uzunosmanoğlu et al., it is reported that patients were recruited when there was a radiologist available to perform CD (8 am to 5 pm); h: In the study by Uzunosmanoğlu et al., 92 patients were included, but 32 were excluded due to missing data; i: Of the 100 patients identified during the study period (patients with suspected AA and with visualization of the cecal appendix on grayscale US), only 48 were included—those in whom CD flow was identified in the cecal appendix; j: Inferentially, Ohba et al. work appears to be a retrospective study: k: Although Bakhshandeh et al. state in the methods section that patients were divided into two groups—those who underwent appendectomy and those with non-surgical abdominal pain (NSAP) who were followed clinically—this distinction is not reflected in the results. In the article’s tables (Tables 2 and 3), the only patients accounted for are those with a final diagnosis confirmed by histopathology: 95 with appendicitis and 57 without, totalling exactly the 152 patients included in the study. This implies either that all patients were ultimately operated on, contradicting the supposed existence of an NSAP control group, or that the data is incorrect; l: In the study by Anuj et al., 150 patients were initially included, of whom sufficient Doppler data on the cecal appendix were obtained in 64. Following additional exclusion criteria, the final cohort included 61 patients; m: Although mean PSV and RI values are reported for the entire cohort, they are not presented separately by group (AA vs. CG), and therefore were not included in the comparative analysis; n: In the study by Aydin et al., the values for TP, FP, TN, and FN were calculated based on the sensitivity and specificity reported by the authors specifically for “Mural hyperemia within the appendix” (Se 63.4%, Sp 91.5%). However, the authors report that among 142 patients with appendicitis, 90 did not show hyperemia and 52 did, while among 117 patients with lymphoid hyperplasia, 107 presented hyperemia and 10 did not. This finding contradicts previous literature, although the control group selection criteria could explain it. On the other hand, on the discussion authors state: “In the current study, it was determined that the presence of local fluid collection in the periappendiceal area, mural hyperemia within the appendix, and increased echogenicity of the pericaecal fat also increased the possibility of having appendicitis, which was consistent with literature”. The most plausible interpretation is that the authors reversed the data in the table (i.e., that among 142 cases of appendicitis, 90 presented mural hyperemia, and among 117 patients with lymphoid hyperplasia, 10 presented mural hyperemia). This is consistent with the reported sensitivity and specificity values; therefore, we have used these corrected data for the meta-analysis. We contacted the authors to clarify this issue and obtained no response; o: In the study by Gutierrez et al., there is a discrepancy between the data reported in the main text and in Table 1. In the main text, pathological CD findings are reported in 12 patients, 10 of whom had appendicitis, and normal CD findings in 105 patients, 5 of whom had appendicitis (i.e., 10 TP, 2 FP, 100 TN, 5 FN). However, the total number of patients for this analysis would be 117, whereas the study reports a total sample size of 125. Moreover, Table 1 presents different data for the CD analysis (10 TP, 2 FP, 105 TN, 8 FN). We attempted to contact the authors to clarify this issue but did not receive a response. Therefore, we ultimately chose to include the data from Table 1, as they are consistent with the reported sample size.
Disclaimer/Publisher’s Note: The statements, opinions and data contained in all publications are solely those of the individual author(s) and contributor(s) and not of MDPI and/or the editor(s). MDPI and/or the editor(s) disclaim responsibility for any injury to people or property resulting from any ideas, methods, instructions or products referred to in the content. |
© 2025 by the authors. Licensee MDPI, Basel, Switzerland. This article is an open access article distributed under the terms and conditions of the Creative Commons Attribution (CC BY) license (http://creativecommons.org/licenses/by/4.0/).
Copyright: This open access article is published under a Creative Commons CC BY 4.0 license, which permit the free download, distribution, and reuse, provided that the author and preprint are cited in any reuse.


