Submitted:
12 May 2025
Posted:
13 May 2025
Read the latest preprint version here
Abstract
Background: This study analyzed the diagnostic performance of Doppler ultrasound (DUS) in acute appendicitis (AA) and its ability to discriminate complicated acute appendicitis (CAA) from non-complicated acute appendicitis (NCAA).
Methods: This systematic review was prospectively registered in PROSPERO (CRD42025641841). A systematic search was conducted in PubMed, Web of Science, Scopus, and Ovid. Two independent reviewers selected studies and extracted data. Methodological quality was assessed with QUADAS-2. Random-effects (RE) meta-analyses (REML method) and diagnostic test accuracy (DTA) meta-analyses were performed. Publication bias was assessed using Egger’s and Begg´s tests and Deeks' asymmetry test.
Results: Twenty-one studies containing 2,774 participants with 1,112 AA patients and 1,145 controls (CG) were included. Overall DUS modalities DTA meta-analysis (26 observations) yielded a pooled sensitivity and specificity [95% CI] of 86% [79-91] and 94% [90-96]. The pooled area under the ROC curve (AUROC) was 0.96. The DTA meta-analysis for spectral Doppler (AA vs. CG) included 10 observations and yielded a pooled sensitivity and specificity [95% CI] of 88% [80–93] and 87% [77–93], respectively. The pooled AUC was 0.94. The DTA meta-analysis for color Doppler (AA vs. CG) included 13 observations and yielded a pooled sensitivity and specificity [95% CI] of 82 [70-90] % and 97 [92-99] %. The pooled AUC was 0.97.
Conclusions: DUS is a highly specific tool with excellent diagnostic performance for AA in patients with appendiceal visualization on grayscale US. However, evidence regarding its ability to discriminate between CAA and NCAA remains limited. Given the potential for publication bias, the retrospective design of some included studies, and the presence of moderate to substantial heterogeneity, future multicenter studies with robust methodology and larger sample sizes are warranted to validate these findings.
Keywords:
Doppler
; ultrasound
; resistive index
; peak systolic velocity
; doppler flow
; power doppler
; acute appendicitis
; systematic review
; meta-analysis
; pediatric
; diagnostic test accuracy
Introduction
Acute appendicitis (AA) remains the leading cause of emergency abdominal surgery worldwide [1]. Although its overall mortality rate is low, diagnostic delays significantly increase the risk of complications and morbidity [2,3].
Acute appendicitis (AA) diagnosis is primarily based on physical examination, a focused clinical history, and basic laboratory tests, including complete blood count and acute-phase reactants. The current recommended approach emphasizes risk stratification to guide clinical decision-making, employing multivariable scoring systems such as the AIR score, the RIPASA score, the PAS score, and the BIDIAP score—the latter two specifically developed for pediatric populations—to identify patients who require additional imaging and/or hospital admission, and to reduce the incidence of negative surgical explorations [4,5,6]. Although these scoring systems have proven highly effective for the initial triage of patients with suspected AA, imaging techniques—primarily ultrasound (US) and computed tomography (CT)—remain essential for confirming or ruling out the diagnosis and for differentiating between complicated (CAA) and uncomplicated (NCAA) appendicitis [7,8].
Computed tomography (CT) is a widely recognized diagnostic tool for acute appendicitis (AA), particularly in cases with a high clinical suspicion and inconclusive ultrasound (US) findings, having shown superior diagnostic performance compared to US in recent meta-analyses [7]. However, using CT involves considerable expenditure of human and economic resources. In addition, despite ongoing advances in low-dose imaging protocols, CT remains a significant source of ionizing radiation, which limits its unrestricted use, particularly in vulnerable populations such as children and pregnant women [1,4,7]. Despite the available evidence, recent studies continue demonstrating an overuse of CT imaging in pediatric populations [9].
Other imaging modalities with higher specificity, such as magnetic resonance imaging (MRI), have also demonstrated excellent diagnostic performance in acute appendicitis (AA) [10,11]. However, their clinical implementation remains challenging and costly in current practice. For instance, pediatric patients often require sedation to undergo MRI examinations, adding complexity to its routine use.
Ultrasound (US) has demonstrated excellent diagnostic performance in the evaluation of appendicitis, both when performed by specialized radiologists [7] and when conducted by clinicians using point-of-care ultrasound (POCUS) [12,13]. Nevertheless, US remains a highly operator-dependent modality, and considerable rates of non-visualization of the cecal appendix are reported in recent literature [14]. Non-visualization may be attributed to several factors, including patient obesity, the anatomical location of the appendix, poor acoustic windows due to interposed bowel loops, and the operator's experience level. The adoption of standardized protocols, such as the graded compression technique described by Puylaert in 1986 [15], the three-step positioning algorithm [16], and structured coaching strategies [17], has significantly improved appendiceal visualization rates.
Quillin et al. first reported using Doppler US (DUS) as an additional diagnostic tool in evaluating acute appendicitis (AA) in 1992 [18]. Based on the pathophysiological premise that inflammation of the cecal appendix leads to increased blood flow that can be detected and quantified using Doppler techniques, numerous studies have evaluated the potential diagnostic performance of DUS—including color Doppler (CD), power Doppler (PD), contrast-enhanced power Doppler (CEPD), and more recently, spectral Doppler (SD)—in acute appendicitis (AA), as well as its ability to discriminate between complicated (CAA) and uncomplicated (NCAA) forms [19,20,21,22,23,24,25,26,27,28,29,30,31,32,33,34,35,36,37,38]. This systematic review aims to synthesize the existing evidence on this topic.
Methods
Literature Search and Selection
We followed the Preferred Reporting Items for Systematic Reviews and Meta-Analyses in Diagnostic Test Accuracy Studies (PRISMA-DTA) guidance [39]. Supplementary File 1 shows the PRISMA-DTA Checklist. We prospectively registered the present review in the International Prospective Register of Systematic Reviews (PROSPERO ID CRD42025641841).
Eligible studies were identified by searching the primary existing medical bibliography databases (PubMed, Web of Science, Scopus, and Ovid). Supplementary File 2 shows the detailed search strategy for each bibliographic database. The search was last executed on 22.04.2025.
JAM and MRJ selected articles using the COVIDENCE ® tool. The search results were imported into the platform, and both authors screened the articles separately. Disagreements were resolved by consensus. Supplementary File 3 shows the inclusion and exclusion criteria.
Quality Assessment
The QUADAS-2 (Quality Assessment of Diagnostic Accuracy Studies 2) tool was used to evaluate each selected article´s methodological quality and risk of bias [40]. Each article evaluated patient selection, index test, reference standard, flow, and timing. Applicability concerns regarding patient selection, index tests, and reference standards were also assessed.
Data Extraction and Synthesis
The target condition was defined as acute appendicitis (AA) confirmed either by histopathological examination or intraoperative findings. The index test was DUS (all modes). The reference standard was the histopathological examination of the resected cecal appendix. Two independent reviewers (JAM, MRJ) extracted the relevant data from the selected articles following a standardized procedure. Extracted data included author, country where the study was conducted, year of publication, study design, study population (sample size, age range, and sex distribution), AA group and control group (CG) definitions, reference standard used in AA group, mean or median and standard deviation or range or interquartile range for peak systolic velocity (PSV) and resistive index (RI) determinations, statistical p-value for the between-group comparison, PSV and RI cut-off value (if established), and its associated sensitivity and specificity. There were no disagreements between the reviewers after collating the extracted data. The metrics used in each study were reviewed, and it was determined that a standardization of units was not required. Means (ranges) were converted to means (standard deviations) following a standardized procedure [41,42] in two cases [33,38]. True positives (TP), false positives (FP), true negatives (TN), and false negatives (FN) were obtained either directly from the included studies or estimated, when not explicitly reported, based on available sensitivity, specificity, and the number of patients with and without the target condition, using standardized statistical formulae [43]. Reported sensitivities, specificities, sample sizes per group, and predictive values were used to cross-validate the calculations.
The diagnostic odds ratio (DOR) was calculated for each study as (TP × TN) / (FP × FN). A continuity correction of 0.5 was applied to all zero-valued contingency table cells to avoid division by zero. Subsequently, DOR was log-transformed to stabilize variances and allow for linear approximation. The log-transformed DOR's standard error (SE) was calculated using standard formulae based on the corrected contingency table counts. The 95% confidence intervals (CIs) for the log(DOR) were obtained by applying the normal approximation method (log(DOR) ± 1.96 × SE). They were then exponentiated to derive the 95% CIs on the original DOR scale.
Meta-Analysis
Two random-effects meta-analyses (MA) for DUS were performed using the restricted maximum likelihood (REML) method: (1) a meta-analysis of resistance index (RI) values comparing acute appendicitis (AA) and control group (CG) patients, and (2) a meta-analysis of PSV values (measured in cm/s) comparing AA and CG patients. All studies with available data were included. Due to the limited number of studies reporting PSV and RI data, no additional sensitivity analyses were conducted. Results were expressed as mean differences with corresponding 95% confidence intervals (CIs) and were depicted using forest plots. Between-study heterogeneity was assessed using the I² statistic. Two leave-one-out sensitivity analyses were conducted (one for each REML meta-analysis).
Diagnostic Test Accuracy Meta-Analysis
Three main diagnostic test accuracy (DTA) meta-analytical models were conducted: (1) overall diagnostic performance of DUS (AA vs. CG), (2) diagnostic performance of CD (AA vs. CG), and (3) diagnostic performance of SD (AA vs. CG). Pooled sensitivity, specificity, and area under the curve (AUC) estimates were reported for each model. Results were presented as forest plots of sensitivity and specificity and hierarchical summary receiver operating characteristic (HSROC) curves. Meta-regression analyses were performed to assess the impact of study design (prospective vs retrospective) and population characteristics (pediatric vs mixed/adult) on diagnostic performance. To perform meta-regression analyses, sensitivity and specificity were logit-transformed, and univariate models were fitted separately for each outcome, incorporating standard errors derived from contingency table data. The Knapp-Hartung method was applied to adjust standard errors, and the proportion of variance explained by each covariate was estimated using the adjusted R² statistic. The metadta, midas, and metandi modules in STATA were used to conduct the DTA meta-analyses [44,45,46]. The mada module in R and the midas module in STATA were used for the meta-regression DTA analyses [47].
Fagan Nomogram
A Fagan nomogram was constructed to assess the clinical utility of DUS by estimating post-test probabilities based on pooled likelihood ratios in CD and SD DTA models. A pretest probability of 20% was selected to reflect a typical clinical scenario of intermediate suspicion for acute appendicitis in Emergency settings. Pooled positive and negative likelihood ratios (LR⁺ and LR⁻) derived from the bivariate meta-analysis were applied to calculate post-test probabilities following positive and negative test results.
Publication Bias and Small-Study Effects Assessment
Concerning the REML meta-analytical models, Egger's and Begg´s tests and funnel plots (not shown) were used to assess the risk of publication bias. When evidence of publication bias was identified, the trim-and-fill method was applied to estimate its potential impact on the results [48]. For the DTA meta-analytical models, Deeks' asymmetry test was performed when more than 10 studies were included in the analysis to evaluate the presence of publication bias [49]. A weighted linear regression of log(DOR) against the inverse square root of the sample size was performed. The p-value of the slope coefficient was used to determine the presence of asymmetry, with a p-value <0.10 considered suggestive of publication bias, in line with established guidelines for Deeks' test in diagnostic test accuracy meta-analyses.
Statistical analyses were conducted using Review Manager (RevMan) version 5.4 (The Cochrane Collaboration, 2020), Stata version 19.0 (StataCorp LLC, College Station, TX, USA) with the metandi, midas, and metadta modules, and R version 4.3.2 (R Foundation for Statistical Computing, Vienna, Austria) with the mada module (version 0.5.12).
Results
The search returned 405 articles (Scopus n=92; Pubmed n=91; Web of Science n=192; Ovid MEDLINE n=30). One hundred seventeen duplicates were removed. Among the remaining 288 articles, we excluded 267 (inclusion and exclusion criteria, n=267; reports not retrieved, n=0). This review finally included 21 studies with data from 2,774 participants (946 males, 1,061 females, 767 without gender specification), including 1,112 patients with a confirmed diagnosis of AA and 1,145 controls (CG) [18,19,20,21,22,23,24,25,26,27,28,29,30,31,32,33,34,35,36,37,38]. Discrepancies were identified between the number of patients included per group (AA and CG), the number of patients per gender (male/female), and the total number of patients reported in the review, attributable to the lack of explicit reporting in some studies. The flowchart of the search and selection process is shown in Figure 1.
The risk of bias concerning the selection of patients was considered low in three of the studies [18,19,20], unclear in seventeen of them [21,22,23,25,26,27,28,29,31,32,33,34,35,36,37,38], and high in two of them [24,30]. The risk of bias concerning the index test was considered low in fifteen studies [18,21,22,23,24,25,26,27,28,30,32,35,36,37,38] and unclear in seven [19,20,22,29,31,33,34]. The risk of bias concerning the reference standard was considered low in four studies [20,31,32,34], unclear in seventeen [19,21,22,23,24,25,26,27,28,29,30,33,35,36,37,38], and high in one of them [18]. The risk of bias concerning flow and timing was considered low in fifteen studies [18,19,21,22,23,24,25,26,27,28,32,35,36,37,38], unclear in six studies [20,22,29,31,33,34], and high in one of them [30]. Regarding patient selection applicability concerns, the risk was considered low in three of the studies [18,19,20], unclear in seventeen of them [21,22,23,25,26,27,28,29,31,32,33,34,35,36,37,38], and high in two of them [24,30]. Regarding the index test applicability concern, the risk was considered low in eighteen studies [18,20,21,22,23,24,25,26,27,28,29,30,32,35,36,37,38] and unclear in four studies [19,31,33,34]. Concerning reference standard applicability concerns, the risk was considered low in twenty studies [19,20,21,22,23,24,25,26,27,28,29,30,31,32,33,34,35,36,37,38] and high in one [18]. In the case of Lim et al. [22], prospective and retrospective cohorts were analyzed separately. For this reason, the reference may be considered as both low risk and unclear risk in certain categories (such as index test or flow and timing). The QUADAS-2 results are depicted in Figure 2.
Doppler Ultrasound in Acute Appendicitis
Sociodemographic Characteristics
Table 1 summarizes the data extracted from the twenty-one studies that evaluated DUS. All studies were conducted between 1992 and 2025 [18,19,20,21,22,23,24,25,26,27,28,29,30,31,32,33,34,35,36,37,38]. Seven were from the United States [18,19,20,24,29,31,33], three were from India [30,37,38], three were from Turkey [26,32,34], one was from Canada [21], one was from South Korea [22], one was from Italy [23], one was from France [25], one was from Brazil [27], one was from Israel [28], , one was from Iran [35], one was from Egypt [36]. Thirteen studies were prospective [18,19,20,21,23,24,25,26,27,32,36,37,38], and five were retrospective [28,29,31,33,34]. One study reported two cohorts, one prospective and one retrospective [22]. One study did not explicitly report its design; after reviewing it, we classified it as retrospective [30]. One study was reported as cross-sectional, and after reviewing its design, we classified it as retrospective [35]. Four studies involved exclusively pediatric populations [18,19,20,27].
Fifteen studies included patients with clinical suspicion of AA as their study population [18,19,20,23,25,26,27,28,29,30,33,35,36,37,38]. One study included a selective group of patients presenting with atypical manifestations of AA [24]. In two cases, populations with histopathologically confirmed AA and various types of control groups were included separately [21,22]. Three studies included only patients who underwent surgical intervention for suspected AA [31,32,34].
Twenty studies consistently defined 'case' as the histopathological confirmation of AA in the surgical specimen [19,20,21,22,23,24,25,26,27,28,29,30,31,32,33,34,35,36,37,38]. AA was based on surgical findings in one study, and a histopathological study was not explicitly reported [18]. Twelve studies stratified the AA group into NCAA and CAA [18,19,20,21,23,24,25,26,27,28,31,32]
This was not the case for the definition of 'control', which constituted either patients seen at the Emergency Department in which the diagnosis of AA was finally excluded (also known as non-surgical abdominal pain or NSAP) [18,22,23,24,25,26,27,28,29,30,33,34], patients with AA suspicion which finally had other surgical pathology [18,24,28], negative appendectomies (NA) [19,23,24,26,27,28,29,30,32] or specifically lymphoid hyperplasia as a form of NA [34], healthy control with ultrasound performed for other reasons (i.e, urological pathology) [21], patients with irritable bowel syndrome suspicion who underwent a barium enema [22].
In twelve studies, the authors restricted their analyses to the subgroup of patients in whom the cecal appendix was identified using grayscale ultrasound (US) [21,22,23,25,27,28,29,30,33,35,36,38]. Additionally, in some of these cases, the inclusion criteria were even more restrictive. For instance, in the study by Daga et al., only the 85 patients with appendiceal identification on US and sonographic criteria for acute appendicitis were included [30], while in the study by Anuj et al., only patients with an appendix visible on grayscale US and spectral Doppler waveforms on appendiceal US were considered [38]. In three of these cases, only US examinations with borderline features were included [22,29,35].
Table 1 shows the main characteristics of the studies included in this review, including the Doppler modalities assessed and the technical parameters of the sonographic examinations.
Overall Doppler Ultrasound Diagnostic Performance in Acute Appendicitis
Diagnostic Test Accuracy Meta-Analysis for Overall Doppler Modalities (AA Vs. CG)
In the case of Baldisserotto, the most favorable TP, FP, TN, and FN data reported by the authors were used, based on the classification of appendiceal Doppler flow adopted in each study (see Youden's J index value in Table 1). Daga et al. were excluded from the DTA meta-analyses because the diagnostic performance data reported included only patients with AA, and the manuscript contained numerical inconsistencies (see Table 1).
The DTA meta-analysis for overall Doppler modalities, including CD, PD, CEPD, and SD (AA vs. CG), included 26 observations and yielded a pooled sensitivity and specificity [95% CI] of 86% [79–91] and 94% [90–96], respectively. The pooled area under the ROC curve (AUROC) was 0.96. Between-study heterogeneity (τ²) was 1.06 for sensitivity and 1.48 for specificity, with a negative correlation (ρ = –0.36) between them. The generalized between-study variance was τ² = 1.37. Reliable AUC confidence intervals could not be estimated. Figure 3 shows the forest plot and the HSROC curve resulting from this meta-analysis.
We performed univariable meta-regression to explore whether study design (prospective vs. retrospective) or population type (pediatric vs. mixed/adult) influenced the diagnostic performance of DUS. Each covariate was analyzed separately. No statistically significant association was found in the joint models. However, prospective studies showed significantly lower specificity (93% vs. 95%; p = 0.01), and adult/mixed population studies showed a non-significant trend toward higher sensitivity (93% vs. 85%; p = 0.13).
Deeks’ funnel plot asymmetry test showed a trend toward small-study effects, with a negative slope (coefficient = –14.88) and a borderline p-value (p = 0.054), suggesting potential but not conclusive evidence of publication bias.
Supplementary File 4 includes the raw TP, FP, FN, and TN dataset used for all DTA analyses. It also includes the DOR (95% CI) calculated for each study.
Spectral Doppler
Spectral Doppler Measurement Units
Nine studies reported the use of SD for diagnosing acute appendicitis (AA) [21,22,29,32,33,35,36,37,38]; among them, seven provided numerical values and/or specific diagnostic performance data [21,32,33,35,36,37,38]. The authors who reported SD numerical values and/or diagnostic performance data assessed it using three continuous quantitative parameters: PSV, RI, and pulsatility index (PI). PSV was consistently reported across all studies in centimeters per second (cm/s), whereas RI is a dimensionless parameter. In two instances, where studies reported means and ranges instead of standard deviations, the missing standard deviations were estimated using the method described by Wan et al. [41] to enable meta-analytic pooling. Although the Wan et al. method was originally developed to estimate means and standard deviations from medians and ranges (or interquartile ranges), the studies in question reported means (not medians). To minimize potential inaccuracies, results were compared with estimates obtained using the method proposed by Hozo et al. [42]. Nevertheless, this approach constitutes a methodological limitation, as combining means and ranges alone does not reliably allow accurate estimation of standard deviation and may not accurately reflect the underlying data distribution.
Diagnostic Performance of Peak Systolic Velocity and Resistive Index (AA Vs. CG)
Seven studies reported quantitative values of the RI [21,26,32,33,36,37,38]. Five of them [33,35,36,37,38] reported a cut-off value for RI, ranging from 0.495 [35] to 0.65 [33,38]. Sensitivities and specificities for RI ranged from 63.9% [33] to 90.5% [35] and from 58.3% [37] to 96.5% [33], respectively. Four studies reported quantitative values in cm/s for PSV [33,36,37,38]. They all reported a PSV cut-off, ranging from 8.6 cm/s [36] to 11.8 cm/s [37]. Sensitivities and specificities for PSV ranged from 85.3% [38] to 98.3% [36] and from 54.2% [37] to 94.7% [33,35], respectively. One study reported PI values as means [32]. In five studies, true positive, false positive, true negative, and false negative values could be calculated for both PSV and RI [33,35,36,37,38].
Four studies provided a p-value for the comparison of PSV and RI values between the AA and CG, three of which were statistically significant (p<0.001) [33,36,38]. In the study by Saini et al. [37], the p-value for the comparison of PSV between groups was statistically significant (p<0.009). In contrast, the p-value for the comparison of RI only reached marginal significance (p=0.056). The reported sensitivity and specificity for each study are shown in Table 1.
Random-Effects Meta-Analysis for Spectral Doppler (AA Vs. CG)
The random-effects meta-analysis of PSV (AA vs. CG) included four studies (139 AA patients and 139 CG) and showed a significant mean difference [95% CI] of 7.43 [5.37–9.48] cm/s (p < 0.01). After applying the HKSJ adjustment, the mean difference remained 7.43 cm/s, with a wider 95% CI of [4.08–10.78]. Cochran’s Q test yielded a χ² value of 7.62, and I² indicated moderate heterogeneity (59.6%). The forest plot of this meta-analysis is shown in Figure 4. A leave-one-out analysis was performed, carrying out iterations on the present model, excluding one of the studies included in each iteration (forest plot not shown). The leave-one-out analysis showed that the article that conditioned the model most negatively was El-Aleem et al. [36]. Its exclusion from the model resulted in a mean difference [95% CI] of 8.34 [6.42-10.27] cm/s (p<0.001). An Egger test obtained a p-value of 0.78, and the Begg test obtained a value of 0.73. Therefore, a trim-and-fill analysis was not performed.
Concerning the random-effects meta-analysis of RI, Patriquin et al. [21] reported CG RI values as a range without a measure of central tendency; thus, the study could not be included in the meta-analytical models. Incesu et al. [26] did not provide a dispersion measure for RI, and Uzunosmanoğlu et al. (2017) [32] likewise reported RI values without dispersion data; consequently, both studies were also excluded from the meta-analyses. The random-effects meta-analysis of RI (AA vs. CG) included four articles (139 AA and 139 controls) and resulted in a significant mean difference [95% CI] of 0.14 [0.10-0.19] (p<0.01). After applying the HKSJ adjustment, the mean difference remained 0.14, with a wider 95% CI of [0.07-0.22]. Cochran’s Q test yielded a χ² value of 6.19, and I² indicated moderate heterogeneity (52%). The forest plot of this meta-analysis is shown in Figure 4. A leave-one-out analysis was performed, carrying out iterations on the present model, excluding one of the studies included in each iteration (forest plot not shown). The leave-one-out analysis showed that the article that conditioned the model most negatively was Saini et al. [37]. Its exclusion from the model resulted in a mean difference [95% CI] of 0.17 [0.13-0.20](p<0.001). An Egger test obtained a p-value of 0.31, and the Begg test obtained a value of 0.31. Therefore, a trim-and-fill analysis was not performed.
Diagnostic Test Accuracy Meta-Analysis for Spectral Doppler (AA Vs. CG)
The DTA meta-analysis for SD (AA vs. CG) included 10 observations and yielded a pooled sensitivity and specificity [95% CI] of 88% [80–93] and 87% [77–93], respectively. Between-study heterogeneity was moderate to substantial. The estimated τ² was 0.74 for sensitivity and 0.97 for specificity, with a generalized between-study variance of 0.46. The pooled AUC was 0.94; however, a reliable confidence interval for the AUC could not be estimated due to model limitations. Deeks’ test for funnel plot asymmetry showed a significant association between study size and diagnostic odds ratio (coefficient = –31.34; p = 0.015), suggesting potential publication bias or small-study effects.
Using a Fagan nomogram with a pretest probability of 20%, the SD model yielded a post-test probability of 64% for a positive result (LR⁺ = 7) and 3% for a negative result (LR⁻ = 0.13), supporting its moderate rule-in and strong rule-out value in clinical practice.
Separate DTA models were performed for PSV and RI (figures not shown). The model for PSV (AA vs. CG) included five observations and yielded a pooled sensitivity and specificity [95% CI] of 94%% [89–97] and 87% [71–95], respectively. The model for RI (AA vs. CG) included five observations and yielded a pooled sensitivity and specificity [95% CI] of 81% [68–89] and 88% [73–95].
Color Doppler
Fifteen authors evaluated CD as a diagnostic tool in acute appendicitis (AA) [18,19,20,21,22,23,24,25,27,28,29,30,31,32,34]. Of these authors, two exclusively assessed the ability of CD to discriminate between NCAA and CAA [20,31], while the rest evaluated the ability of CD to diagnose AA in comparison to the control group [18,19,21,22,23,24,25,27,28,29,30,32,34]. A considerable heterogeneity was identified in the reported definitions of positivity (pathological findings) for CD imaging in acute appendicitis (AA). While some authors considered any detection of CD flow in the cecal appendix as positive, others only considered positivity when hyperemia or increased appendiceal flow was observed. Some authors, such as Patriquin et al.[21], used a multicategory scale based on the number of CD signals detected in the appendiceal wall (0 = none, 1–2 = few, 3–4 = moderate, >4 = abundant). This scale was later replicated by other authors, such as Gaitini et al. [28]. Some studies reported different diagnostic performance estimates depending on the cut-off point selected for the proposed scale; for example, Xu et al.[29] reported varying results depending on whether elevated flow or "type 2 flow" was considered diagnostic of AA, or whether the absence of flow was deemed sufficient to exclude AA. Other authors, such as Daga et al.[30], also reported different diagnostic outcomes depending on whether any detected appendiceal Doppler flow was considered diagnostic, or only cases showing hyperemia.
Diagnostic Test Accuracy Meta-Analysis for Color Doppler (AA Vs. CG)
The DTA meta-analysis for CD (AA vs. CG) included 13 observations and yielded a pooled sensitivity and specificity [95% CI] of 82 [70–90] % and 97 [92–99] %. Between-study heterogeneity was moderate to substantial. τ² was 1.04 for sensitivity and 1.39 for specificity. The correlation between sensitivity and specificity was weakly negative (ρ = –0.11). The pooled AUC was 0.97; however, a reliable confidence interval for the AUC could not be estimated due to model limitations.
Visual inspection of Deeks’ funnel plot and the results of the asymmetry test (p = 0.684) did not suggest the presence of publication bias among the included studies. Figure 5 and Figure 6 show the forest plot and the HSROC curve resulting from this meta-analysis.
A Fagan nomogram was used to estimate post-test probabilities based on a pretest probability of 20%. The post-test probability increased to 86% following a positive DUS result (LR⁺ = 24) and decreased to 4% after a negative result (LR⁻ = 0.19). These findings support DUS's strong rule-in and moderate rule-out value in clinical scenarios with intermediate pretest suspicion.
Power Doppler
Three authors reported evaluating PD to diagnose acute appendicitis (AA) [23,26,34]. Pinto et al. reported a higher diagnostic performance of PD over CD [23]. Incesu et al. PD with CEPD, demonstrating the latter's superiority over standalone PD [26]. Aydin et al. reported diagnostic performance data that combined results from both CD and PD modalities without distinction [34].
Only three studies' contingency table data (TP, FP, TN, FN) were available for the power Doppler modality. Therefore, a DTA meta-analytical model could not be performed, as at least four studies are required to fit such models reliably.
Doppler Ultrasound (Complicated Appendicitis vs. Non-Complicated Appendicitis)
Diagnostic Performance of Doppler Ultrasound (NCAA vs. CAA)
Four studies reported the sensitivity and specificity of CD for discriminating NCAA and CAA: Quillin et al. [20] (77.8% and 60%), Patriquin et al. [21] (100% for both), Uzunosmanoğlu et al. [32] (93% and 85%), and Xu et al. [31] (25% and 72.4%). Two studies also provided SD measurements for the CAA and NCAA groups, using RI values [21] or PI values [32].
Discussion
The present systematic review and meta-analysis evaluated the role of all Doppler US modalities in diagnosing AA, consistently demonstrating excellent diagnostic yield.
Concerning the biological plausibility and the pathophysiological rationale for using DUS to diagnose acute appendicitis (AA), inflammation of the cecal appendix is associated with a localized increase in vascular perfusion secondary to the release of inflammatory mediators. These changes are potentially detectable through Doppler imaging techniques. However, it is essential to note that this phenomenon is not specific to AA and may occur in any infectious or inflammatory process. Consequently, conditions such as colitis or ileitis may also present with increased Doppler signal on ultrasound evaluation. However, it should be considered that based on this same pathophysiological premise, the occurrence of appendiceal tissue ischemia in the context of gangrenous acute appendicitis (GAA) or complicated acute appendicitis (CAA) may be associated with a reduction or absence of Doppler flow within the appendix. This phenomenon has been previously reported by authors such as Quillin et al. [20], who observed that appendiceal hyperemia was more frequent in non-perforated AA compared to perforated cases, and Patriquin et al. [21], who described the absence of Doppler signal at the appendiceal tip in a high proportion of CAA cases.
Regarding the different Doppler modalities, CD, PD, and SD have been primarily evaluated. CD was the first modality used for diagnosing AA and remains the most extensively characterized in the medical literature, demonstrating strong diagnostic yield. PD has also shown excellent, and in some cases superior, performance; however, the limited number of published studies and the inability to conduct meta-analytical models to assess its diagnostic accuracy quantitatively prevent definitive conclusions from being drawn. CEPD, although promising, was only evaluated in one article. On the other hand, recent literature has focused on using SD, mainly through analyzing PSV and RI. In this regard, SD offers a significant advantage over CD and PD, namely the ability to obtain objective quantitative measurements, which could potentially reduce interobserver variability inherent to ultrasound examinations, particularly when using CD or PD modes. Regarding the discriminative capacity of DUS to distinguish non-complicated acute appendicitis (NCAA) from complicated acute appendicitis (CAA), the available evidence is limited and currently markedly inferior to that reported for the diagnosis of acute appendicitis (AA) versus a control group (CG). This is a significant limitation, given that the potential presence of selection bias must be assumed in all cases.
Another relevant aspect is the lack of experience with the normal Doppler imaging appearance of the cecal appendix. This represents a significant limitation, as distinguishing between normal and pathological findings is critical for accurately characterizing the diagnostic performance of DUS in acute appendicitis (AA). It should also be considered that although the equipment used in the earlier studies was technologically more primitive and therefore less sensitive, it was reasonable to interpret a positive Doppler signal as pathological at that time. However, this concept likely requires re-evaluation given the greater sensitivity of current US machines.
Regarding study design, most studies were prospective with consecutive patient recruitment. However, a significant number of studies exhibited a potential risk of selection bias, as many included only patients in whom the appendix was visualized on grayscale US, and, in several cases, specifically those with borderline sonographic findings for acute appendicitis (AA) diagnosis (e.g., non-compressible appendices or those measuring 6–8 mm). On the one hand, this represents an advantage, as the overall diagnostic performance of the tool is assessed in a population where diagnostic uncertainty is frequent, such as in cases of borderline visualized appendices. On the other hand, it must be noted that the diagnostic performance data provided in these studies may not reflect the general population of patients undergoing primary US for suspected AA, as cases without appendiceal visualization were systematically excluded in some studies. Considering the significant rate of non-visualization of the appendix reported in recent series, we believe that (1) the overall diagnostic performance of DUS in AA is likely overestimated in these studies, but on the other hand (2) this tool demonstrates potential diagnostic utility specifically in cases where the appendix is positively visualized, including those with borderline sonographic criteria.
Many retrospective studies relied on the retrospective review of static images or videotapes of examinations originally performed by other radiologists. We believe this represents a significant limitation and should be considered when evaluating the diagnostic performance reported in these studies. Additionally, the retrospective nature of these studies introduces essential limitations, such as (1) the lack of an accurate epidemiological representation of the prevalence of acute appendicitis (AA) and its distribution by age and sex (for example, several studies report a disproportionately higher number of female patients, despite AA being a condition with a slight male predominance) [24]. Concerning the geographic distribution of the studies included, it is sufficiently broad not to limit the extrapolation of the results of this work.
Diagnostic odds ratios (DORs) across individual studies (AA vs.CG) showed considerable variability, ranging from 2.26 to 1848 (Supplementary File 4). Most studies reported high DORs, suggesting that DUS performs very well in distinguishing acute appendicitis (AA) from control groups (CG). Several studies reached extremely high DOR values, pointing to near-perfect diagnostic performance. However, the broad confidence intervals around these estimates indicate some imprecision, probably related to smaller sample sizes or low event rates. The asymmetry observed in the confidence intervals, with much wider upper bounds, is expected due to the log transformation applied during analysis and reflects the natural variability common to diagnostic accuracy studies [50]. It should also be noted that the clinical interpretation and translation of the DOR is less intuitive than that of sensitivity and specificity. Therefore, it is not commonly reported or used in clinical practice.
While the overall diagnostic performance of Doppler US was high, the observed variability in diagnostic odds ratios across studies, ranging from modest to extremely high values, underscores the influence of contextual and methodological factors not fully captured by the subgroup analyses. The magnitude of between-study heterogeneity, as reflected in the I² estimates, suggests the presence of residual confounding, possibly related to operator expertise, ultrasound protocol standardization, or case mix. Moreover, the lack of statistically significant findings in the meta-regressions should be interpreted cautiously, as the directionality and consistency of some associations (e.g., lower specificity in prospective studies or higher diagnostic performance in pediatric populations) indicate potential underlying patterns that may not reach formal significance due to sample size or heterogeneity. These findings support the need for more detailed investigations into how Doppler performance varies across clinical settings and patient subgroups.
The present study has essential strengths, such as the robust methodology based on the PRISMA-DTA guidelines and the DTA meta-analytical models used. However, it has significant limitations: 1) the potential selection (spectrum) bias in most articles, 2) the limitations inherent to the inferential statistical procedures used, 3) the small sample size and the retrospective nature of some of the included studies, 4) the high heterogeneity observed in some of the DTA meta-analytic models conducted, 5) the high heterogeneity in the control group definition.
Given its noninvasive nature and robust diagnostic performance, DUS holds promise as an essential diagnostic tool for acute appendicitis. However, it needs further validation through large, well-designed multicenter studies.
Supplementary Materials
The following supporting information can be downloaded at the website of this paper posted on Preprints.org. Supplementary File 1. PRISMA-DTA checklist. Supplementary File 2. Full search strategy. Supplementary File 3. Inclusion and exclusion criteria. Supplementary File 4. DTA dataset. Supplementary File 5. Above: DTA meta-analysis for PSV (AA vs. CG [control group]). HSROC curve. Bottom: Forest plot of the DTA meta-analysis performed for PSV (AA vs. CG). Supplementary File 6. Above: DTA meta-analysis for RI (AA vs. CG). HSROC curve. Bottom: Forest plot of the DTA meta-analysis performed for RI (AA vs. CG).
CRediT Authorship Contribution Statement: JAM: Conceptualization and study design; literature search and selection; data curation and extraction; formal analysis; investigation; methodology; project administration; resources; validation; visualization; writing – original draft; writing – review and editing. MRJ: Literature search and selection; data curation and extraction; project administration; resources; validation; visualization; writing, review, and editing.
Conflicts of Interest
The authors declare that they have no conflict of interest.
Financial Statement/Funding: This review did not receive any specific grant from funding agencies in the public, commercial, or not-for-profit sectors, and none of the authors has external funding to declare.
Ethical Approval: This study did not involve the participation of human or animal subjects, and therefore, IRB approval was not sought.
Statement of Availability of the Data Used During the Systematic Review: All data used for the meta-analytical models are available in the accompanying supplementary dataset file.
References
- Lotfollahzadeh S, Lopez RA, Deppen JG. Appendicitis. 2024 Feb 12. In: StatPearls [Internet]. Treasure Island (FL): StatPearls Publishing; 2024 Jan–. PMID: 29630245.
- Tang, G.; Zhang, L.; Xia, L.; Zhang, J.; Chen, R.; Zhou, R. Preoperative in-hospital delay increases postoperative morbidity and mortality in patients with acute appendicitis: a meta-analysis. Int. J. Surg. 2024, 111, 1275–1284. [CrossRef]
- Bolmers, M.D.M.; de Jonge, J.; Bom, W.J.; van Rossem, C.C.; van Geloven, A.A.W.; Bemelman, W.A. In-hospital Delay of Appendectomy in Acute, Complicated Appendicitis. J. Gastrointest. Surg. 2022, 26, 1063–1069. [CrossRef]
- Di Saverio, S.; Podda, M.; De Simone, B.; Ceresoli, M.; Augustin, G.; Gori, A.; Boermeester, M.; Sartelli, M.; Coccolini, F.; Tarasconi, A.; et al. Diagnosis and treatment of acute appendicitis: 2020 update of the WSES Jerusalem guidelines. World J. Emerg. Surg. 2020, 15, 1–42. [CrossRef]
- Andersson, R.E.; Stark, J. Diagnostic value of the appendicitis inflammatory response (AIR) score. A systematic review and meta-analysis. World J. Emerg. Surg. 2025, 20, 1–12. [CrossRef]
- Montero, J.A.; Pascual, C.B.; Antona, G.; Briones, R.R.; López-Andrés, N.; Martín-Calvo, N. The BIDIAP index: a clinical, analytical and ultrasonographic score for the diagnosis of acute appendicitis in children. Pediatr. Surg. Int. 2023, 39, 1–8. [CrossRef]
- Arruzza, E.; Milanese, S.; Li, L.; Dizon, J. Diagnostic accuracy of computed tomography and ultrasound for the diagnosis of acute appendicitis: A systematic review and meta-analysis. Radiography 2022, 28, 1127–1141. [CrossRef]
- Bom, W.J.; Bolmers, M.D.; Gans, S.L.; van Rossem, C.C.; Geloven, A.A.W.v.; Bossuyt, P.M.M.; Stoker, J.; A Boermeester, M. Discriminating complicated from uncomplicated appendicitis by ultrasound imaging, computed tomography or magnetic resonance imaging: systematic review and meta-analysis of diagnostic accuracy. BJS Open 2020, 5. [CrossRef]
- Chidiac, C.; Issa, O.; Garcia, A.V.; Rhee, D.S.; Slidell, M.B. Failure to significantly reduce radiation exposure in children with suspected appendicitis in the United States. J. Pediatr. Surg. 2024, 59, 161701. [CrossRef]
- D'Souza, N.; Hicks, G.; Beable, R.; Higginson, A.; Rud, B. Magnetic resonance imaging (MRI) for diagnosis of acute appendicitis. Cochrane Database Syst. Rev. 2021, 2021. [CrossRef]
- Kim, D.; Woodham, B.L.; Chen, K.; Kuganathan, V.; Edye, M.B. Rapid MRI Abdomen for Assessment of Clinically Suspected Acute Appendicitis in the General Adult Population: a Systematic Review. J. Gastrointest. Surg. 2023, 27, 1473–1485. [CrossRef]
- Fields, J.M.; Davis, J.; Alsup, C.; Bates, A.; Au, A.; Adhikari, S.; Farrell, I. Accuracy of Point-of-care Ultrasonography for Diagnosing Acute Appendicitis: A Systematic Review and Meta-analysis. Acad. Emerg. Med. 2017, 24, 1124–1136. [CrossRef]
- Cho, S.U.; Oh, S.K. Accuracy of ultrasound for the diagnosis of acute appendicitis in the emergency department: A systematic review. Medicine 2023, 102, e33397. [CrossRef]
- Harel, S.D.; Mallon, M.; Langston, J.; Blutstein, R.; Kassutto, Z.; Gaughan, J.M. Factors Contributing to Nonvisualization of the Appendix on Ultrasound in Children With Suspected Appendicitis. Pediatr. Emerg. Care 2021, 38, e678–e682. [CrossRef]
- Puylaert, J.B. Acute appendicitis: US evaluation using graded compression.. Radiology 1986, 158, 355–360. [CrossRef]
- Chang, S.T.; Jeffrey, R.B.; Olcott, E.W. Three-Step Sequential Positioning Algorithm During Sonographic Evaluation for Appendicitis Increases Appendiceal Visualization Rate and Reduces CT Use. Am. J. Roentgenol. 2014, 203, 1006–1012. [CrossRef]
- Pfeifer, C.M.; Carrejo, B.; Lewis, S.; Hutchinson, K.; Gokli, A.; Kwon, J. Structured coaching as a means to improve sonographic visualization of the appendix: a quality improvement initiative. Emerg. Radiol. 2023, 30, 161–166. [CrossRef]
- Quillin, S.P.; Siegel, M.J. Appendicitis in children: color Doppler sonography.. Radiology 1992, 184, 745–747. [CrossRef]
- Quillin, S.P.; Siegel, M.J. Appendicitis: efficacy of color Doppler sonography.. Radiology 1994, 191, 557–560. [CrossRef]
- Quillin, S.P.; Siegel, M.J.; Siegel, S.P.Q.A.M.J.; Coffin, C.M.; Patriquin, H.B.; Garcier, J.M.; Lafortune, M.; Yazbeck, S.; Russo, P.; Jequier, S.; et al. Diagnosis of appendiceal abscess in children with acute appendicitis: value of color Doppler sonography.. Am. J. Roentgenol. 1995, 164, 1251–1254. [CrossRef]
- Patriquin, H.B.; Garcier, J.M.; Lafortune, M.; Yazbeck, S.; Russo, P.; Jequier, S.; Ouimet, A.; Filiatrault, D.; Patriquin, J.M.G.H.B.; Gaitini, D.; et al. Appendicitis in children and young adults: Doppler sonographic-pathologic correlation.. Am. J. Roentgenol. 1996, 166, 629–633. [CrossRef]
- Lim, H.K.; Lee, W.J.; Kim, T.H.; Namgung, S.; Lee, S.J.; Lim, J.H. Appendicitis: usefulness of color Doppler US.. Radiology 1996, 201, 221–225. [CrossRef]
- Pinto, F.; Lencioni, R.; Falleni, A.; Tozzini, A.; Scaglione, M.; Stringari, R.; Neri, E. Assessment of hyperemia in acute appendicitis: Comparison between power Doppler and color Doppler sonography. Emerg. Radiol. 1998, 5, 92–96. [CrossRef]
- Gutierrez, C.J.; Mariano, M.C.; Faddis, D.M.; Sullivan, R.R.; Wong, R.S.; Lourie, D.J.; Stain, S.C. Doppler Ultrasound Accurately Screens Patients with Appendicitis. Am. Surg. 1999, 65, 1015–1017. [CrossRef]
- Kessler, N.; Cyteval, C.; Gallix, B.; Lesnik, A.; Blayac, P.-M.; Pujol, J.; Bruel, J.-M.; Taourel, P. Appendicitis: Evaluation of Sensitivity, Specificity, and Predictive Values of US, Doppler US, and Laboratory Findings. Radiology 2004, 230, 472–478. [CrossRef]
- Incesu, L.; Yazicioglu, A.; Selcuk, M.; Ozen, N. Contrast-enhanced power Doppler US in the diagnosis of acute appendicitis. Eur. J. Radiol. 2004, 50, 201–209. [CrossRef]
- Baldisserotto, M.; Peletti, A. Is colour Doppler sonography a good method to differentiate normal and abnormal appendices in children?. Clin. Radiol. 2007, 62, 365–369. [CrossRef]
- Gaitini, D.; Beck-Razi, N.; Mor-Yosef, D.; Fischer, D.; Ben Itzhak, O.; Krausz, M.M.; Engel, A. Diagnosing Acute Appendicitis in Adults: Accuracy of Color Doppler Sonography and MDCT Compared with Surgery and Clinical Follow-Up. Am. J. Roentgenol. 2008, 190, 1300–1306. [CrossRef]
- Xu, Y.; Jeffrey, R.B.; Shin, L.K.; DiMaio, M.A.; Olcott, E.W. Color Doppler Imaging of the Appendix. J. Ultrasound Med. 2016, 35, 2129–2138. [CrossRef]
- Daga, S.; Kachewar, S.; Lakhkar, D.L.; Jethlia, K.; Itai, A. Sonographic evaluation of acute appendicitis and its complications. West Afr. J. Radiol. 2017, 24, 152. [CrossRef]
- Xu, Y.; Jeffrey, R.B.; Chang, S.T.; DiMaio, M.A.; Olcott, E.W. Sonographic Differentiation of Complicated From Uncomplicated Appendicitis: Implications for Antibiotics-First Therapy. J. Ultrasound Med. 2016, 36, 269–277. [CrossRef]
- Uzunosmanoglu, H. Diagnostic Value of Appendicular Doppler USG in Acute Appendicitis. Turk. J. Trauma Emerg. Surg. 2016, 23, 188–192. [CrossRef]
- Shin, L.K.; Jeffrey, R.B.; Berry, G.J.; Olcott, E.W. Spectral Doppler Waveforms for Diagnosis of Appendicitis: Potential Utility of Point Peak Systolic Velocity and Resistive Index Values. Radiology 2017, 285, 990–998. [CrossRef]
- Aydin, S.; Tek, C.; Ergun, E.; Kazci, O.; Kosar, P.N. Acute Appendicitis or Lymphoid Hyperplasia: How to Distinguish More Safely?. Can. Assoc. Radiol. J. 2019, 70, 354–360. [CrossRef]
- Bakhshandeh, T.; Maleknejad, A.; Sargolzaie, N.; Mashhadi, A.; Zadehmir, M. The utility of spectral Doppler evaluation of acute appendicitis. Emerg. Radiol. 2022, 29, 371–375. [CrossRef]
- El-Aleem, R.A.; Allah, A.A.A.; Shehata, M.R.; Seifeldein, G.S.; Hassanein, S.M. Diagnostic performance of spectral Doppler in acute appendicitis with an equivocal Alvarado score. Emerg. Radiol. 2024, 31, 141–149. [CrossRef]
- Saini S, Mittal MK, Kanaujia R et al (2024) Exploring the role of spectral Doppler in acute appendicitis. Egypt J Radiol Nucl Med 55:218.
- Anuj, G.; S., R.R.; Ashok, Y.; Rajeev, Y. Diagnostic Utility of Spectral Doppler Ultrasound in Acute Appendicitis: a Prospective Study. Indian J. Surg. 2025. [CrossRef]
- McInnes, M.D.F.; Moher, D.; Thombs, B.D.; McGrath, T.A.; Bossuyt, P.M.; Clifford, T.; Cohen, J.F.; Deeks, J.J.; Gatsonis, C.; Hooft, L.; et al. Preferred Reporting Items for a Systematic Review and Meta-analysis of Diagnostic Test Accuracy Studies. The PRISMA-DTA Statement. JAMA 2018, 319, 388–396. Erratum in JAMA 2019, 322, 2026. [CrossRef]
- Whiting, P.F.; Rutjes, A.W.S.; Westwood, M.E.; Mallett, S.; Deeks, J.J.; Reitsma, J.B.; Leeflang, M.M.G.; Sterne, J.A.C.; Bossuyt, P.M.M.; QUADAS-2 Group. QUADAS-2: A Revised Tool for the Quality Assessment of Diagnostic Accuracy Studies. Ann. Intern. Med. 2011, 155, 529–536. [CrossRef]
- Wan, X.; Wang, W.; Liu, J.; Tong, T. Estimating the sample mean and standard deviation from the sample size, median, range and/or interquartile range. BMC Med Res. Methodol. 2014, 14, 1–13. [CrossRef]
- Hozo, S.P.; Djulbegovic, B.; Hozo, I. Estimating the mean and variance from the median, range, and the size of a sample. BMC Med. Res. Methodol. 2005, 5, 13. [CrossRef]
- imundić AM. Measures of Diagnostic Accuracy: Basic Definitions. EJIFCC. 2009 Jan 20;19(4):203-11. PMID: 27683318; PMCID: PMC4975285.
- Nyaga, V.N.; Arbyn, M. Metadta: a Stata command for meta-analysis and meta-regression of diagnostic test accuracy data – a tutorial. Arch. Public Heal. 2022, 80, 1–15. [CrossRef]
- Harbord, R.M.; Whiting, P. Metandi: Meta-analysis of Diagnostic Accuracy Using Hierarchical Logistic Regression. Stata Journal: Promot. Commun. Stat. Stata 2009, 9, 211–229. [CrossRef]
- Dwamena BA. MIDAS: Stata module for meta-analytical integration of diagnostic test accuracy studies. Statistical Software Components S456880, Boston College Department of Economics, revised 13 Dec 2009.
- Doebler P, Holling H, Rojas-Garcia A, Hillebrand T (2023). mada: Meta-Analysis of Diagnostic Accuracy. R package version 0.5.12. Available from: https://CRAN.R-project.org/package=mada.
- Shi, L.; Lin, L. The trim-and-fill method for publication bias: Practical guidelines and recommendations based on a large database of meta-analyses. Medicine 2019, 98, e15987. [CrossRef]
- Deeks, J.J.; Macaskill, P.; Irwig, L. The performance of tests of publication bias and other sample size effects in systematic reviews of diagnostic test accuracy was assessed. J. Clin. Epidemiology 2005, 58, 882–893. [CrossRef]
- Glas, A.S.; Lijmer, J.G.; Prins, M.H.; Bonsel, G.J.; Bossuyt, P.M.M. The diagnostic odds ratio: a single indicator of test performance. J. Clin. Epidemiol. 2003, 56, 1129–1135. [CrossRef]
Figure 1.
Flowchart of the search and selection process.
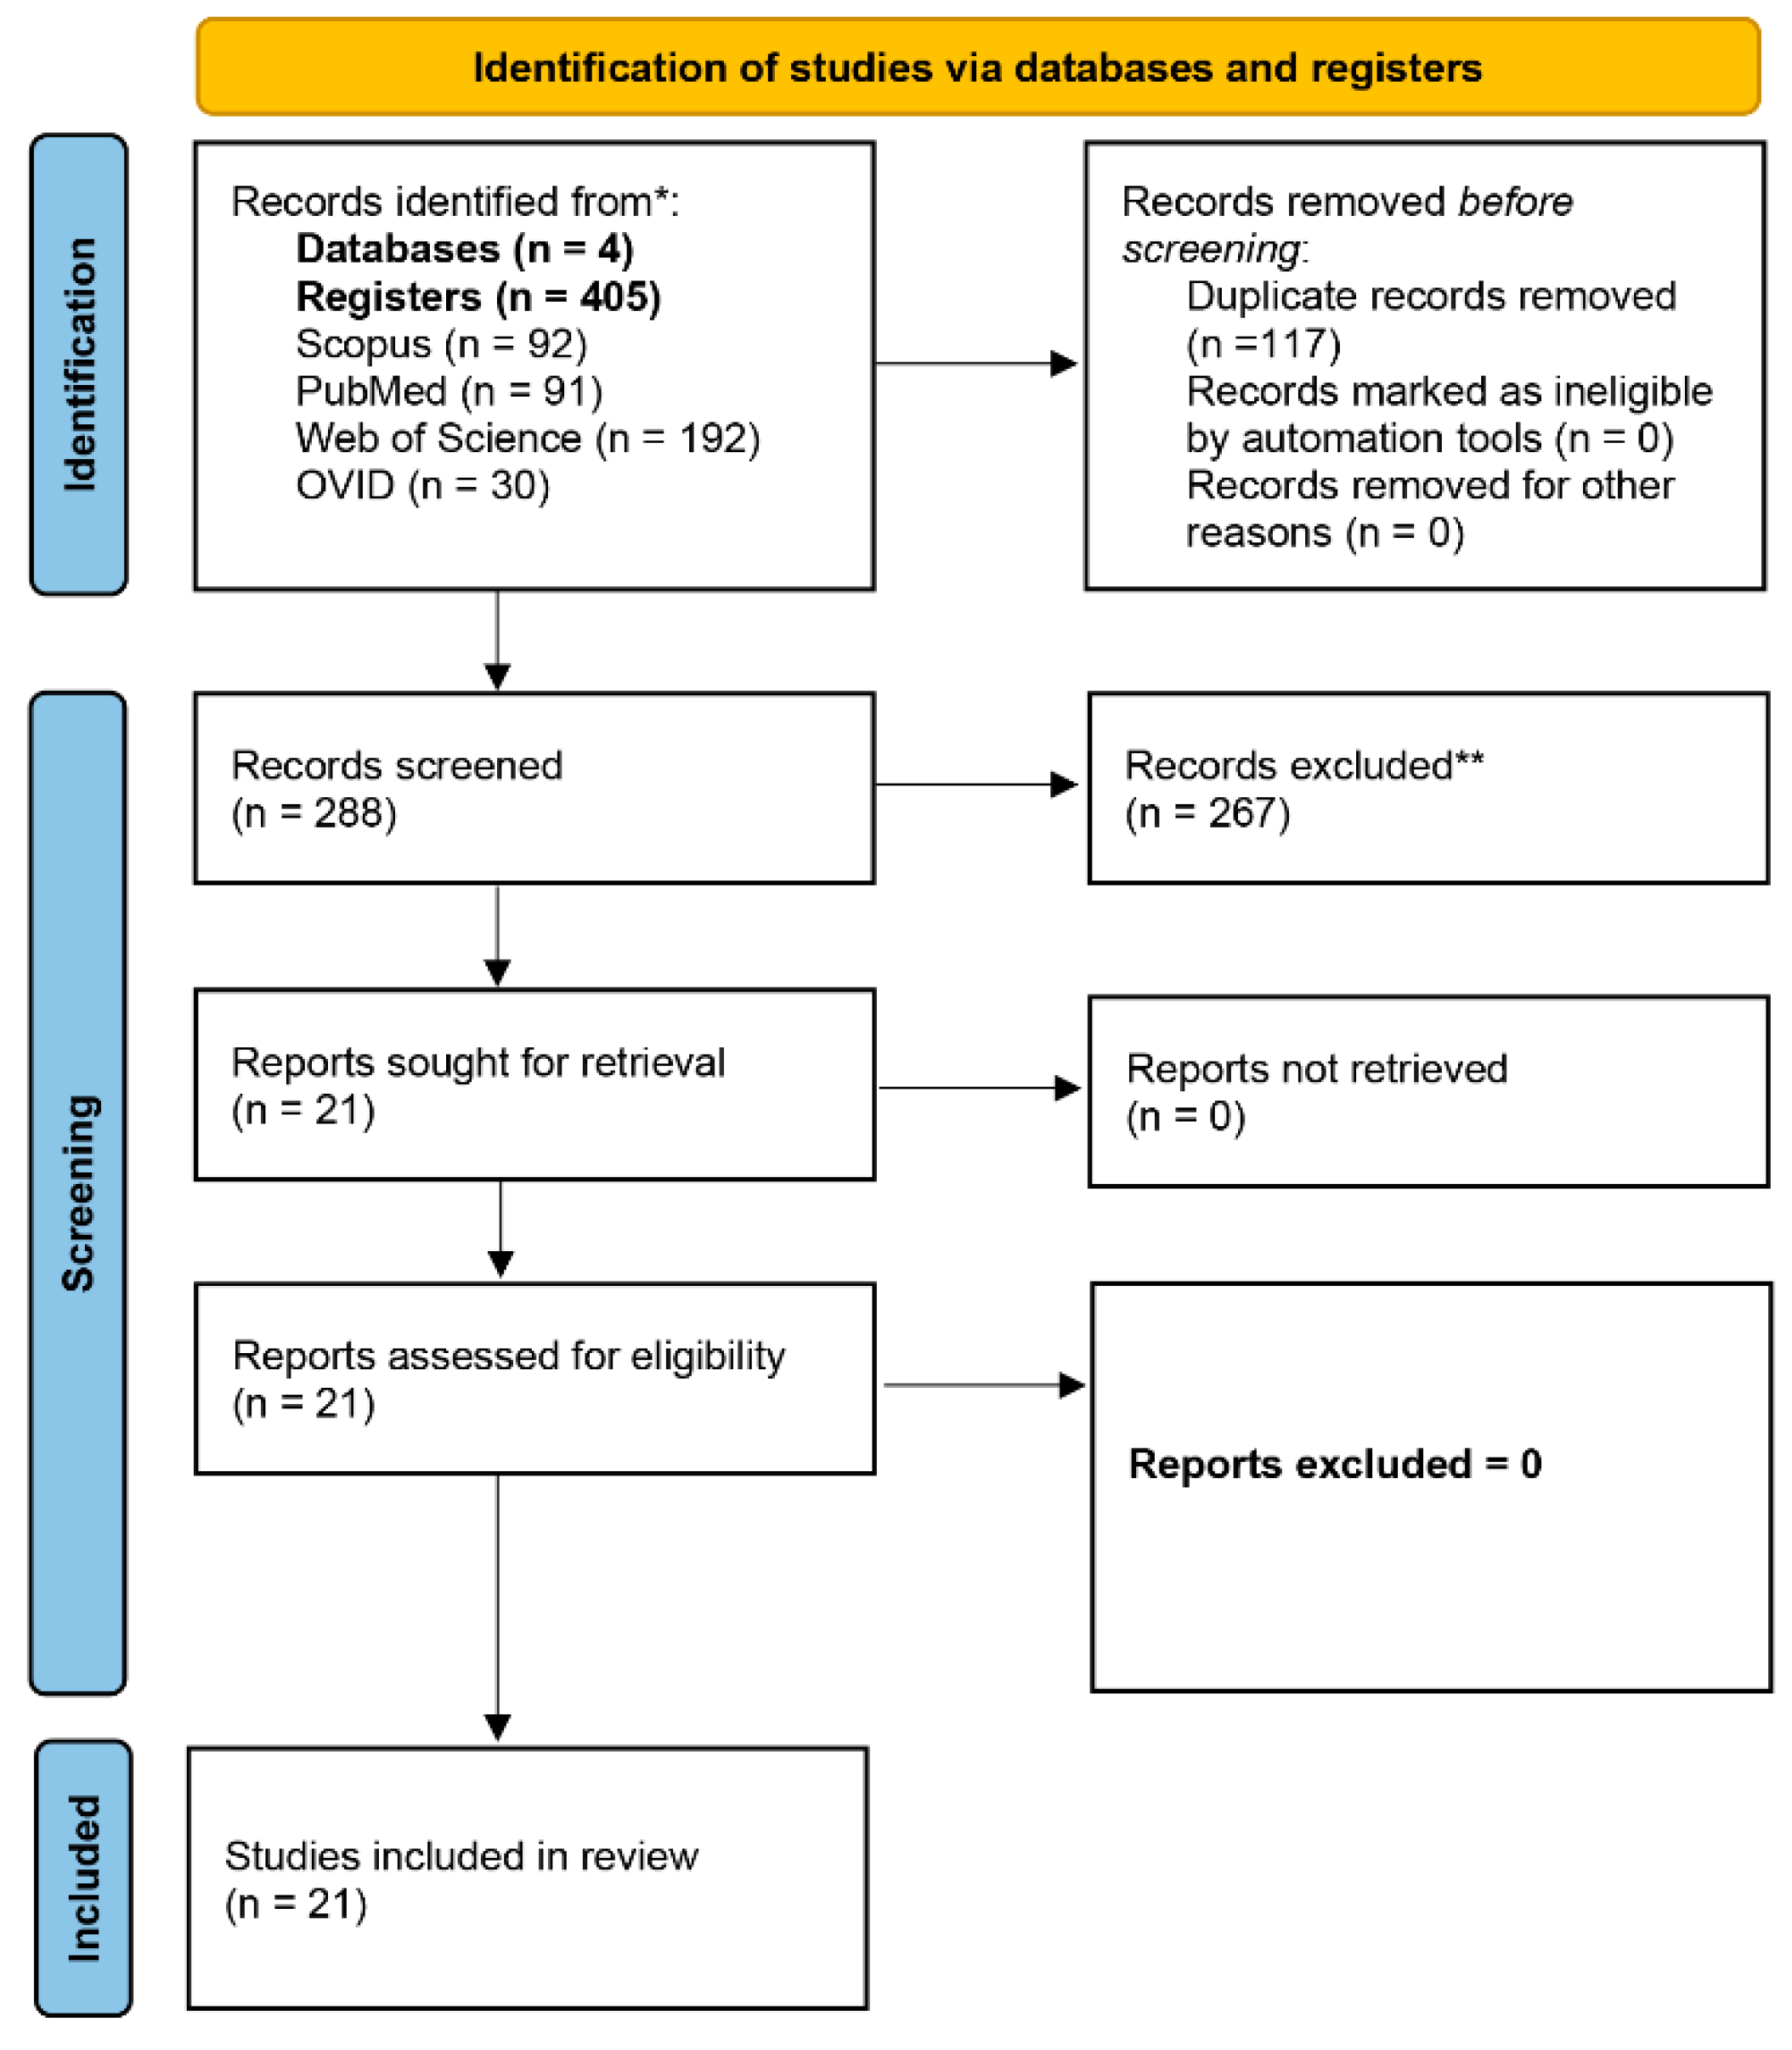
Figure 2.
Graphical representation of the quality assessment of the diagnostic accuracy studies included in the review (QUADAS-2 tool).
Figure 2.
Graphical representation of the quality assessment of the diagnostic accuracy studies included in the review (QUADAS-2 tool).
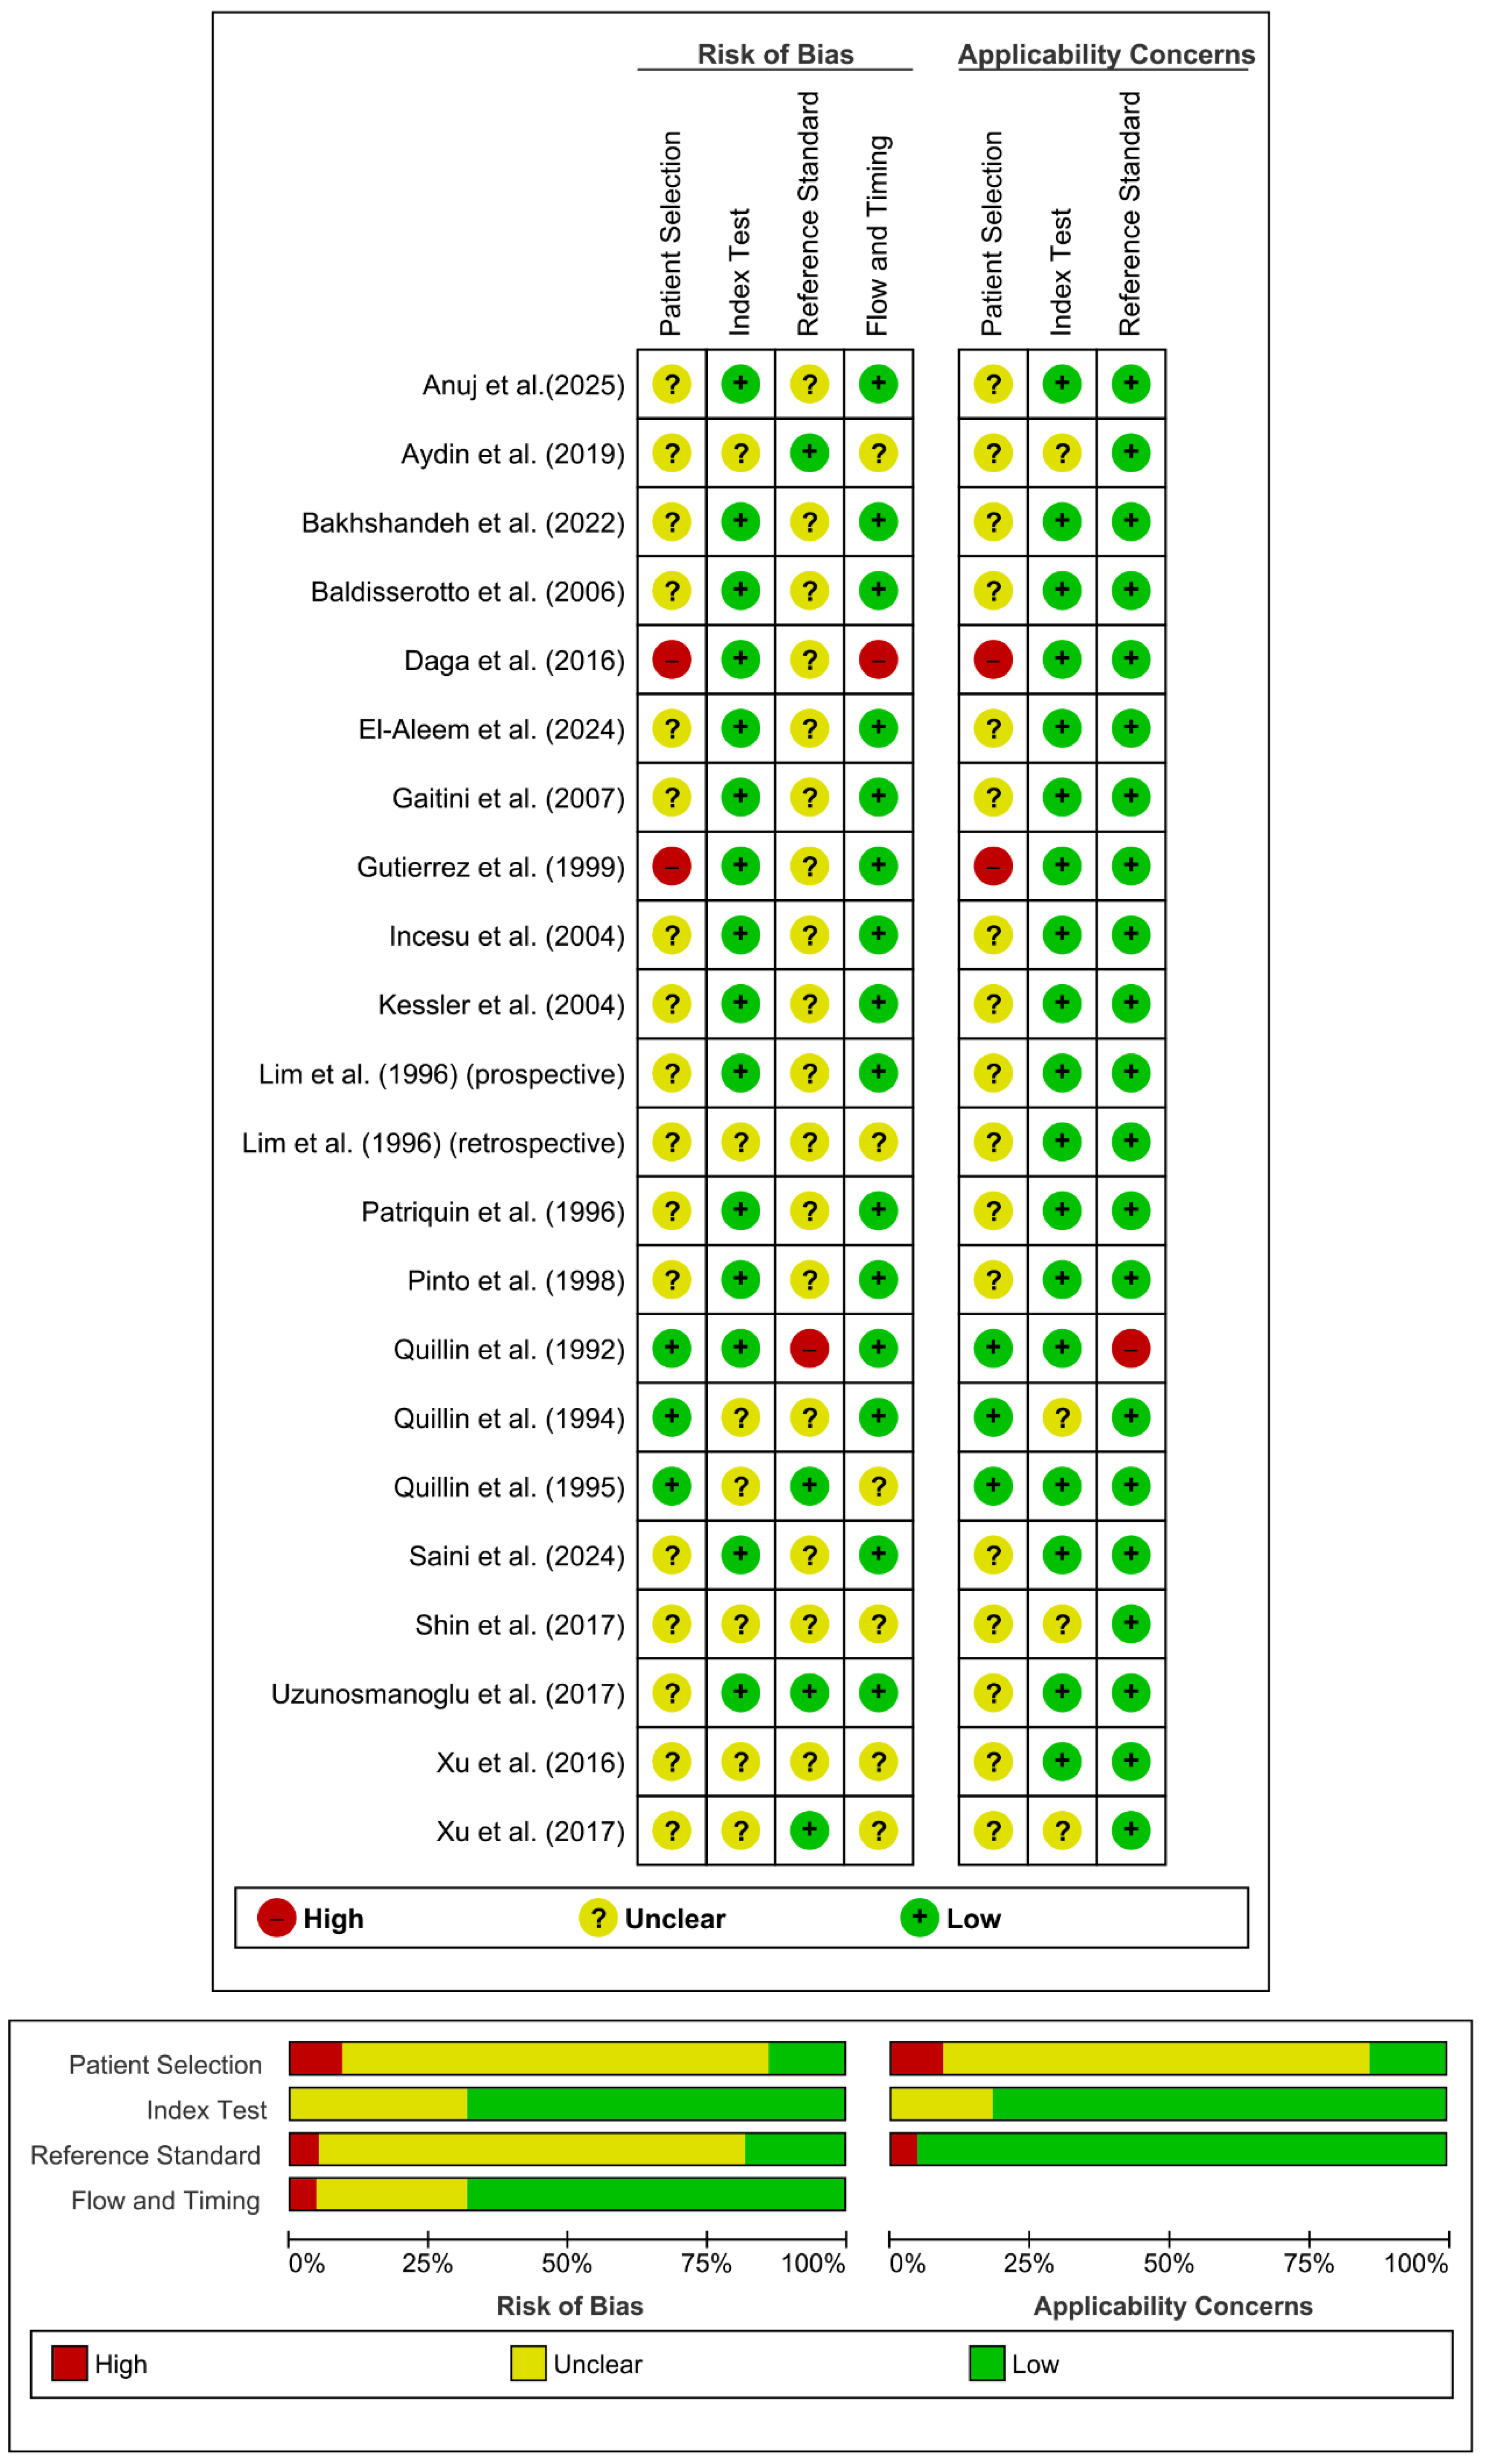
Figure 3.
Above: DTA meta-analysis for overall Doppler (AA vs. CG [control group]). HSROC curve. Bottom: Forest plot of the DTA meta-analysis performed for overall Doppler (AA vs. CG).
Figure 3.
Above: DTA meta-analysis for overall Doppler (AA vs. CG [control group]). HSROC curve. Bottom: Forest plot of the DTA meta-analysis performed for overall Doppler (AA vs. CG).
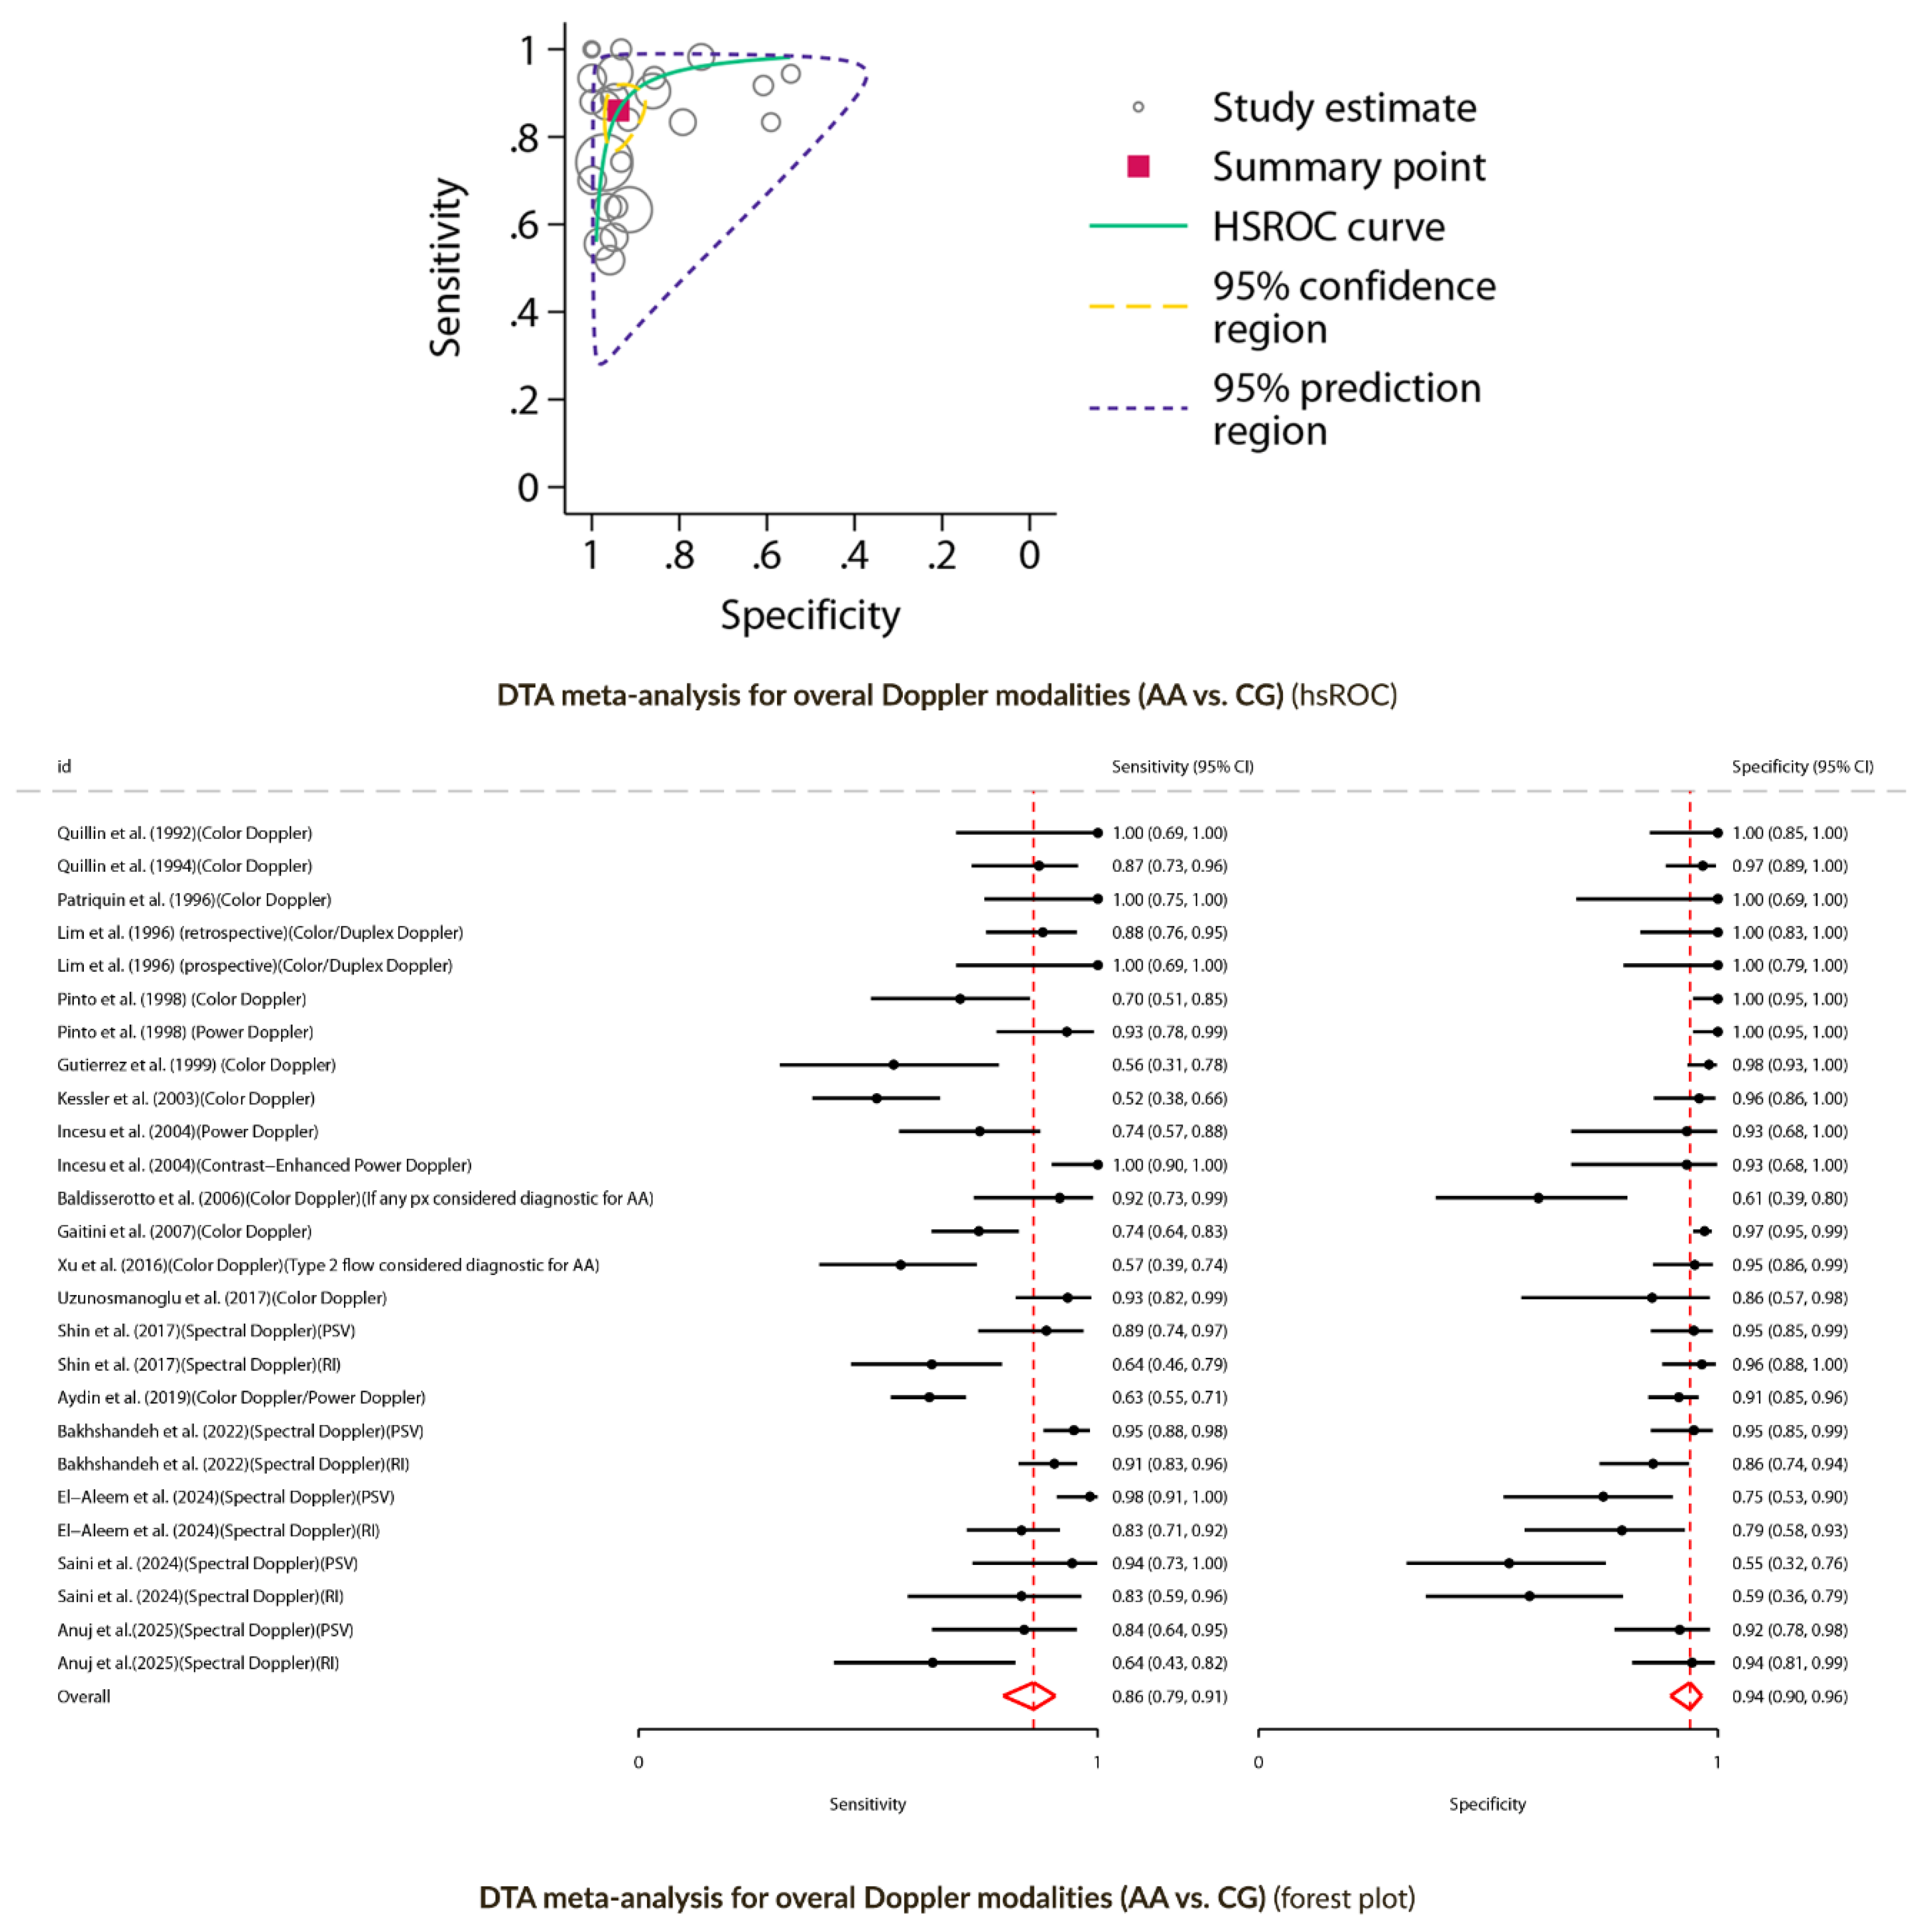
Figure 4.
Above: Forest plot of the REML random-effects meta-analysis performed for PSV (cm/s) (AA vs. CG). Bottom: Forest plot of REML random-effects meta-analysis performed for RI (AA vs. CG).
Figure 4.
Above: Forest plot of the REML random-effects meta-analysis performed for PSV (cm/s) (AA vs. CG). Bottom: Forest plot of REML random-effects meta-analysis performed for RI (AA vs. CG).
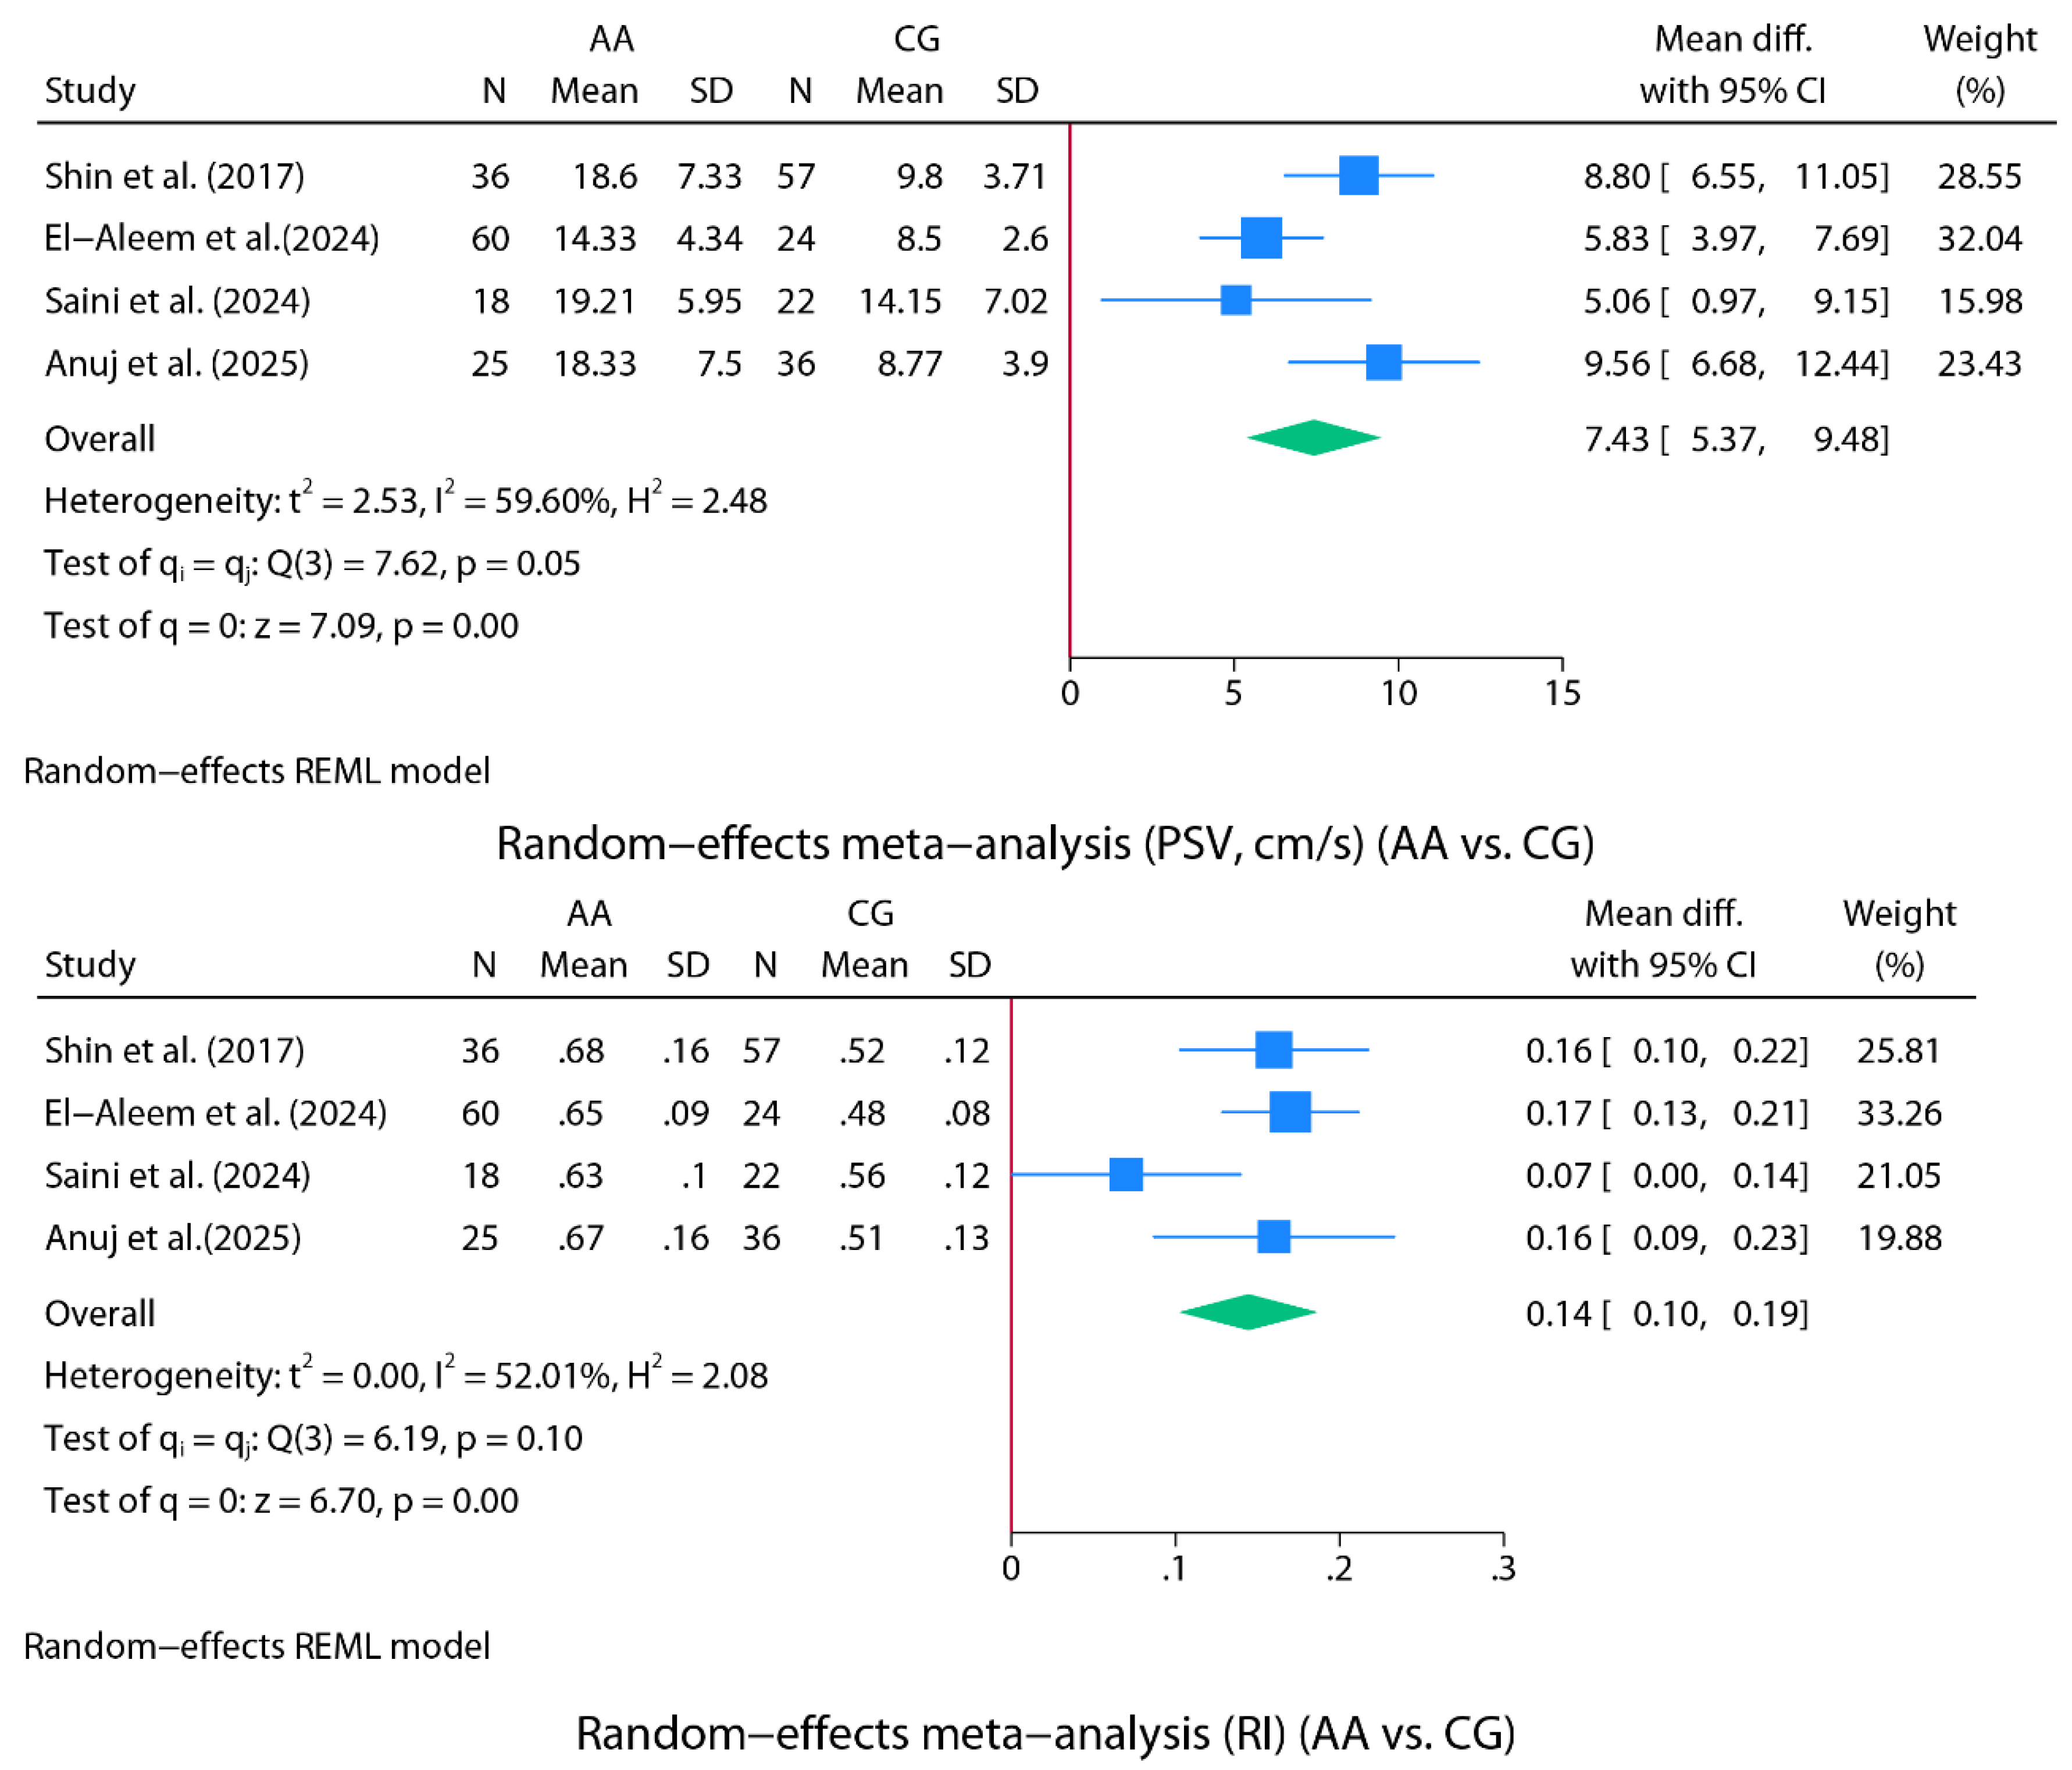
Figure 5.
Above: Forest plot of the DTA meta-analysis performed for color Doppler (AA vs. CG). Bottom: Forest plot of the DTA meta-analysis performed for spectral Doppler (AA vs. CG).
Figure 5.
Above: Forest plot of the DTA meta-analysis performed for color Doppler (AA vs. CG). Bottom: Forest plot of the DTA meta-analysis performed for spectral Doppler (AA vs. CG).
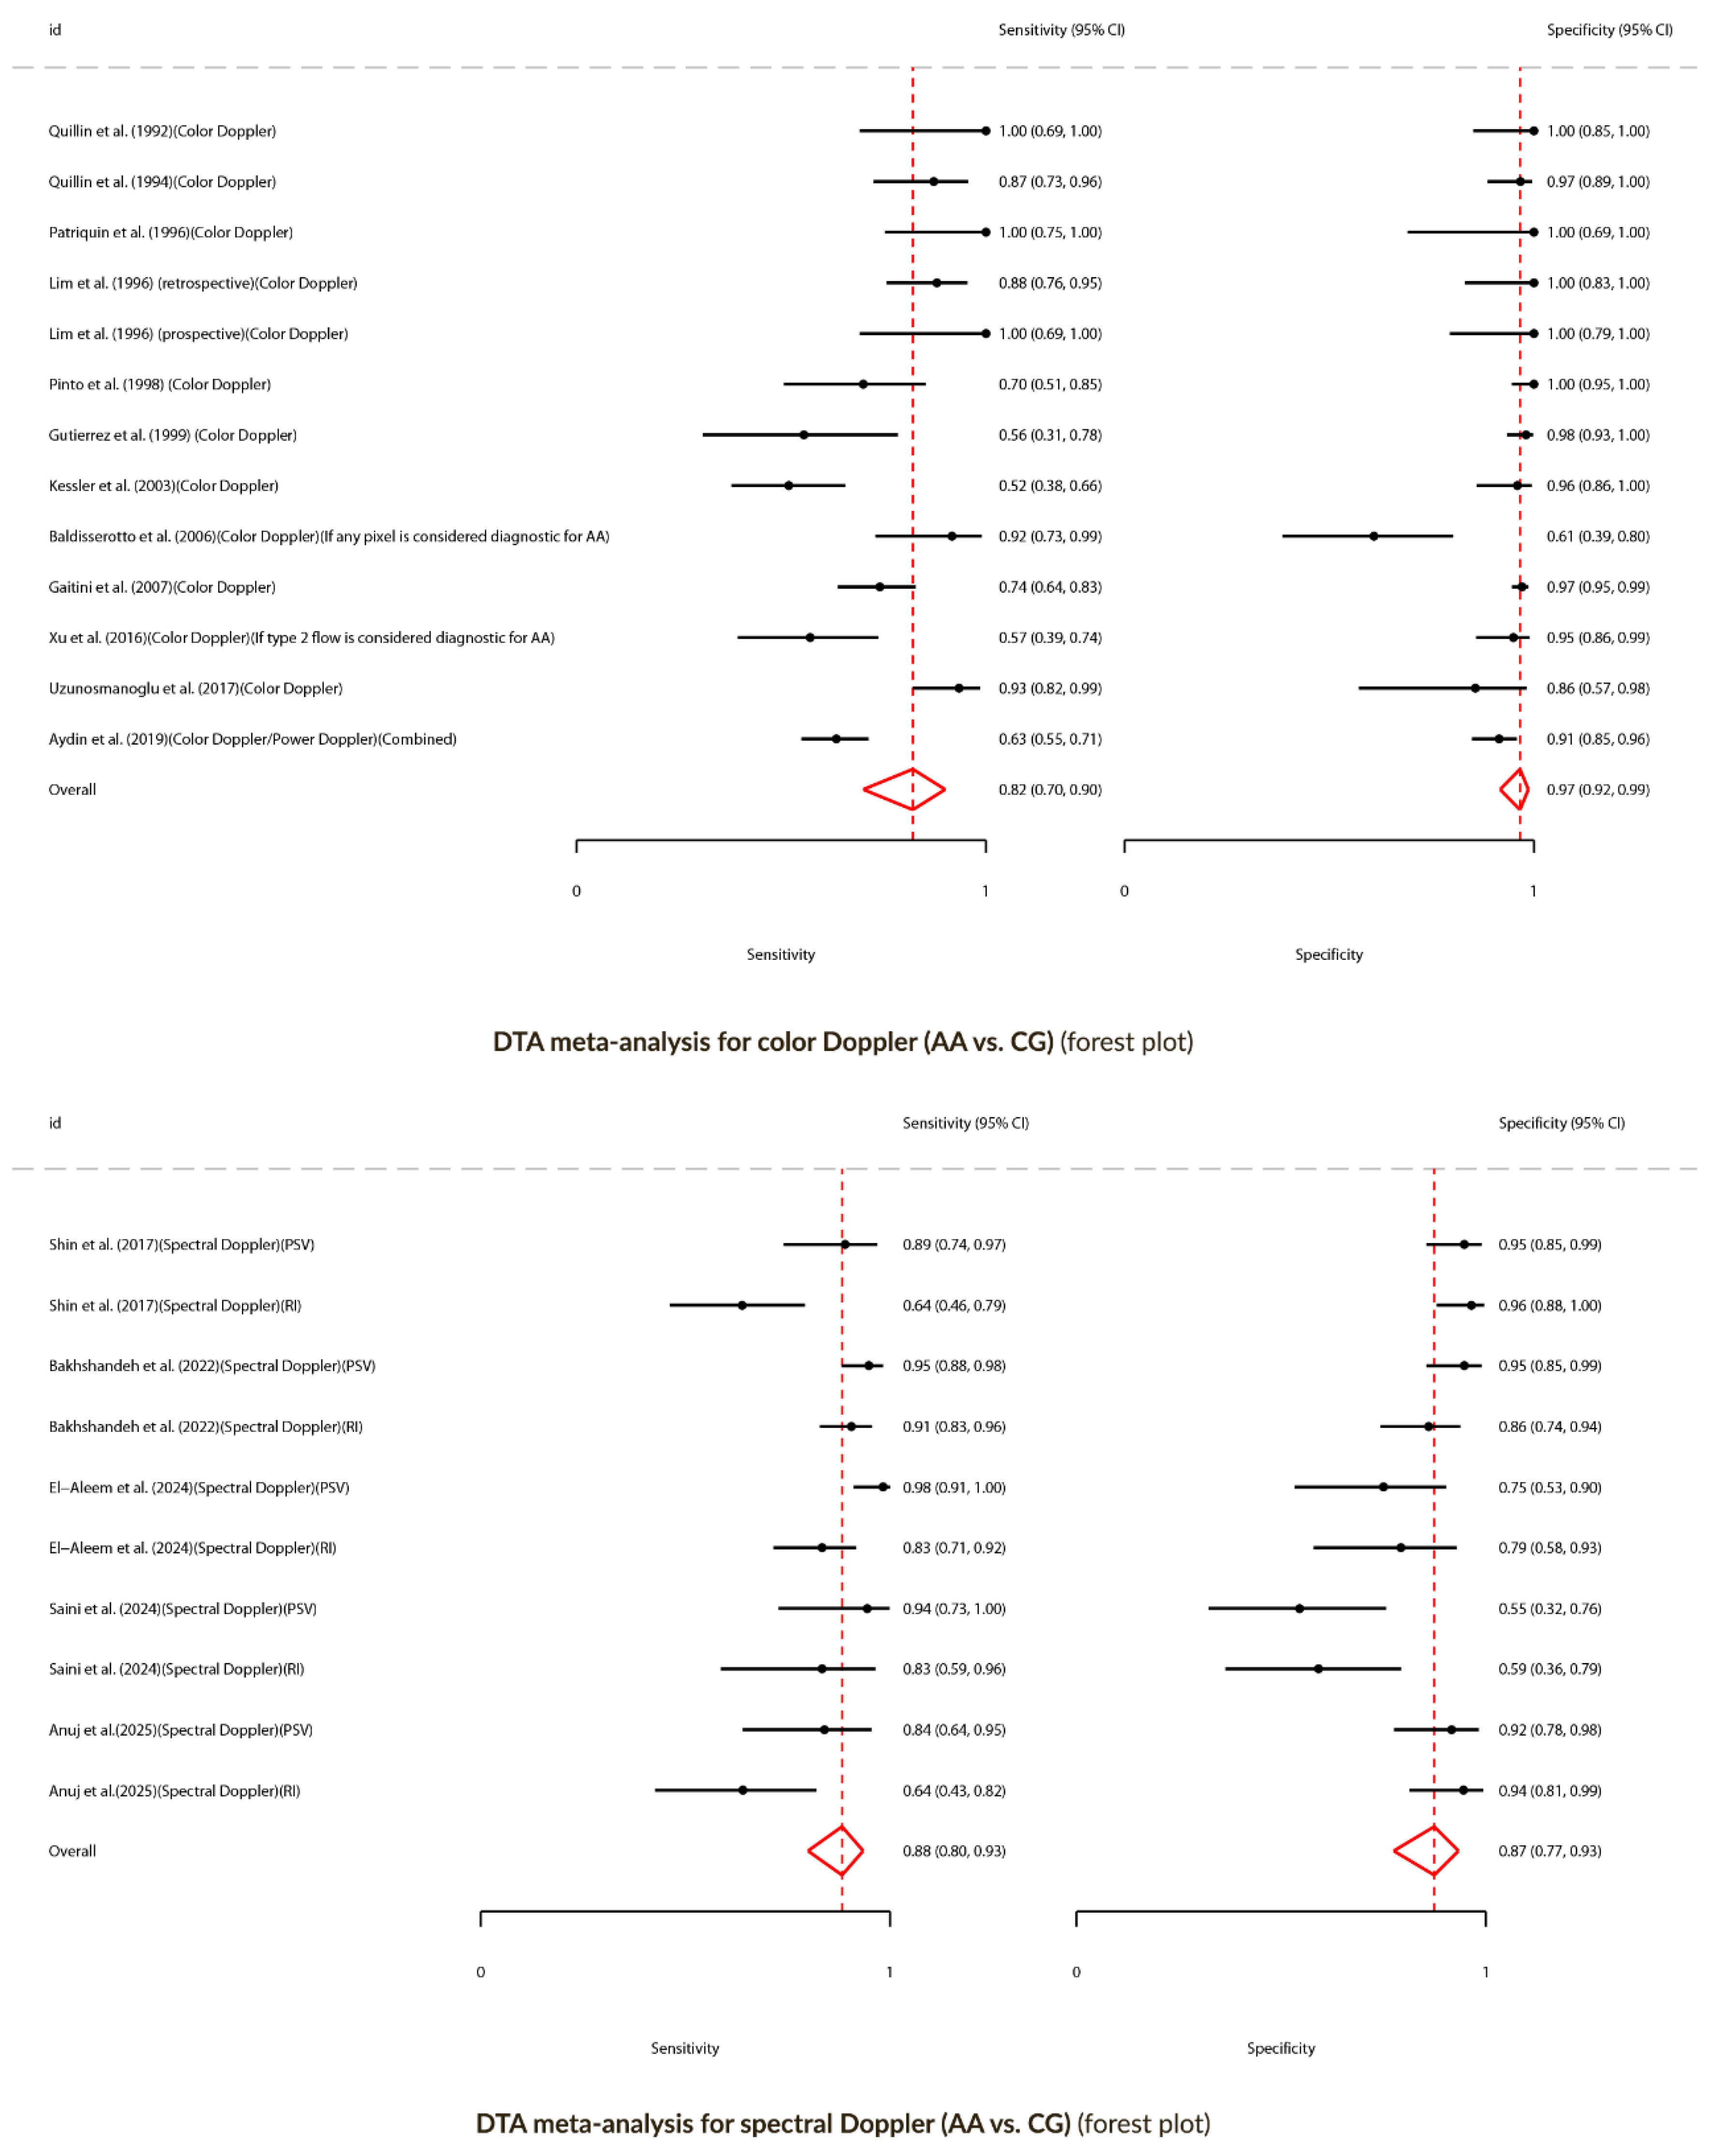
Figure 6.
Left: DTA meta-analysis for color Doppler (AA vs. CG). HSROC curve. Right: DTA meta-analysis for spectral Doppler (AA vs. CG). HSROC curve.
Figure 6.
Left: DTA meta-analysis for color Doppler (AA vs. CG). HSROC curve. Right: DTA meta-analysis for spectral Doppler (AA vs. CG). HSROC curve.
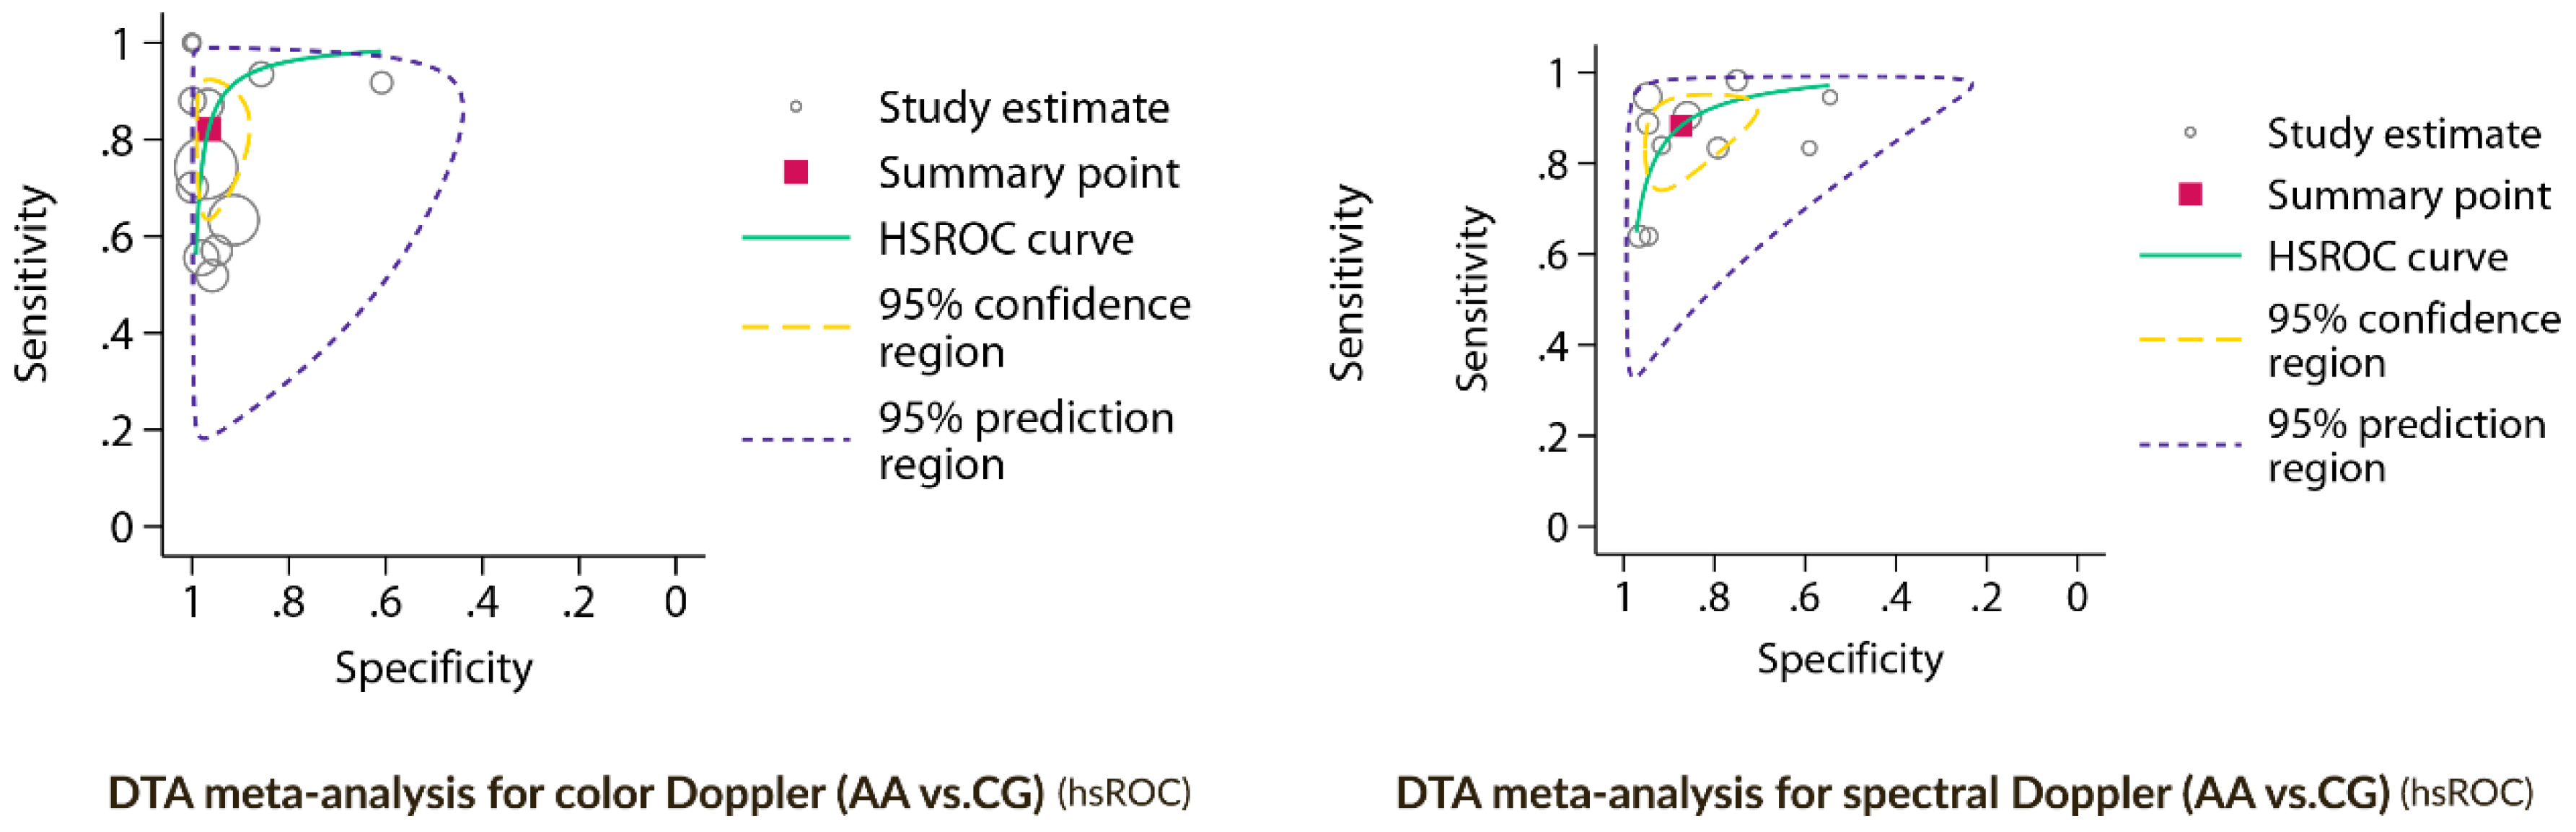

Table 1.
Summary of publications included in this review.
| Author | Country | Study design | Population | Age | Sex M/F | Total N | Group definitions | N in AA | N in CG | US Doppler settings |
US doppler Diagnostic performance |
Sensitivity (%) Specificity (%) |
Commentaries |
| Quillin et al. (1992) [18] | USA | Prospective (consecutive recruitment) | Pediatric | 11(2-18)y2 | 14/19 | 33 |
IC: Patients with suspected AA AA: AA surgical findings. No histopathological confirmation. CG: NSAP (mesenteric adenitis, hemorrhagic ovarian cyst, viral syndrome, infectious enteritis) + hemorrhagic mesenteric cyst (surgical). Clinical follow-up to exclude AA |
10 CAA:1 NCAA:9 |
23 NSAP:22 Hemorrhagic mesenteric cyst (surgical):1 |
Examiner: PR DUM: CD USP: 5 MHz (linear) Parameters: Bandpass filter: 100 Hz, flow settings: lowest |
TP:10 TN:23 FP:0 FN:0 |
Se:100% Sp:100% |
- |
| Quillin et al. (1994) [19] | USA | Prospective (consecutive recruitment) | Pediatric | 11(1-19)y2 (AA group) |
16/23 (AA group) |
100 |
IC: Patients with suspected AA AA: Histopathological confirmation CG: NSAP (gastrointestinal disease, gynecologic disease, renal disease, no abnormalities) with clinical follow-up to exclude AA. NA |
39 NPAA:26 PAA:13 |
61 |
Examiner: PS under PR supervision DUM: CD USP: 5-7.5 MHz (linear) Parameters: Max. power: 500W/Cm2, Gate: 2, Wall filter: 1, scale: 23 cm/sec |
TP:34 TN:59 FP:2 FN:5 |
Se:87% Sp:97% |
The authors present a contingency table comparing the diagnostic performance of gray-scale ultrasound, color Doppler ultrasound, and their combined use. |
| Quillin et al. (1995) [20] | USA | Prospective (consecutive recruitment) | Pediatric | 11(1-19)y2 (AA group) |
19/28 | 47 |
IC: Patients with suspected AA AA: Histopathological confirmation. |
47 NPAA: 27 PAA: 20 |
NS |
Examiner: 2 Blinded experienced radiologists (image review) DUM: CD. USP: 5 or 7.5 MHz (linear). Parameters: Max. power: 500W/Cm2, Gate: 2, Wall filter: 1, scale: 23 cm/sec |
NCAA vs. CAA: Appendiceal hyperemia (favoring NCAA): TP:21b TN:12b FP:8b FN:6b |
NCAA vs. CAA: Appendiceal hyperemia (favoring NCAA): Se:77.8%b Sp:60%b |
Since US is a dynamic examination, retrospective evaluation through static images may constitute a bias. Appendiceal hyperemia was more frequent in NPAA than in PAA, suggesting absence of perforation. |
| Patriquin et al. (1996) [21] | Canada | Prospective | Mixed | HC: 4-25y1 AA: 10(3-25)y2 |
NS | 55 |
AA: Histopathological confirmation CG: HC (2-8 hours of fasting, ultrasound performed for other reasons, i.e., urological) |
30 NCAA: 13 CAA: 11 AA over CA: 3 CrD: 2 Misdiagnosed pregnancy: 1 |
25 (10 with US-appendiceal identification) |
Examiner: Radiologist DUM: CD + SD. USP: 3-5/5/ or 7.5 MHz (linear) Parameters: Low-flow settings: lowest available pulse repetition frequency, highest color doppler gain possible, wall filter: 50 KHz, restricted color window (probably 50 KHz was a mistake from the authors, since the normal range varies between 50 and 800 Hz for CD studies). CD Scale: Number of color doppler signals within the appendiceal wall: absent (0), sparse (1-2), moderate (3-4), or abundant (>4) |
RI (CG): 0.85-11 RI (NCAA): 0.54(0.4-0.77)2 RI (CAA): 0.54(0.33-0.9)2 CD (AA vs. CG): (13 NCAA patients vs. 10 controls with US-appendiceal identification): TP:13b NCAA: Abundant Doppler signal (4) in 13/13 TN:10b CG: No doppler signal (0) in 6/10; sparse doppler signal (1-2) in 4/10. FP:0b FN:0b |
CD: Se:100%b Sp:100%b |
The appendix identification rate in the healthy control (HC) group was very low (10/25), possibly leading to selection bias (spectrum bias). In the AA group, some patients were difficult to classify within the study’s two groups (AA and CG), such as those with CrD or the misdiagnosed pregnancy. This may also represent a potential source of bias. The authors describe for the first time the absence of a Doppler signal at the appendiceal tip in CAA (8 out of 11 cases) |
| Lim et al. (1996)c[22] | South Korea | Retrospective | Mixed | AA: 28(7-72)y2 CG:22(4-62)y2 |
AA: 32/18 CG: 14/6 |
70 |
AA: Histopathological confirmation CG: IBS suspicion patients who underwent barium enema |
50 | 20 |
Examiner: Experienced radiologist DUM: CD + DD + SD USP: 5-10 MHz (linear) Parameters: Wall filter: 100 Hz, low-velocity scale (pulse repetition frequency, 1500 Hz), constant color sensitivity (78%) |
CD: TP:44b TN:20b FP:0b FN:6b |
CD: Se:88%b Sp:100%b |
The six patients classified as FN correspond to six cases of advanced AA (severely necrotic appendix) in which no appendiceal Doppler flow was identified. Patients with non-visualized or partially visualized appendix at barium enema were excluded, which may constitute a selection bias |
| Lim et al. (1996)c[22] | South Korea | Prospective | Mixed | 27(6-56)y2 | 17/9 | 128 (26 with US-appendiceal identification and borderline appendix) |
IC: Patients with suspected AA and borderline US criteria AA: Histopathological confirmation CG: NSAP with clinical follow-up/barium enema for excluding AA |
10 | 16 |
Examiner: Experienced radiologist DUM: CD + DD + SD (no RI/PI calculation) USP: 5-10 MHz (linear) Parameters: Wall filter: 100 Hz, low-velocity scale (pulse repetition frequency, 1500 Hz), constant color sensitivity (78%) |
CD: TP:10b TN:16b FP:0b FN:0b |
CD: Se:100%b Sp:100%b |
Of the 126 patients, the cecal appendix was identified by ultrasound in 102. Among these, 26 had borderline criteria (5–7 mm). Since the color Doppler diagnostic performance assessment was limited to this subgroup of patients, a selection bias (spectrum bias) may have been introduced |
| Pinto et al. (1998) [23] | Italy | Prospective (consecutive recruitment) | Mixed | 24.7(7-61)y2 | 46/54 | 100 |
IC: Patients with suspected AA AA: Histopathological confirmation CG: NA, NSAP |
34 (30 with US-appendiceal identification) NCAA: 24 CAA (GA+PAA):10 |
NSAP: 62 NA: 4 (CrD: N=1) (Salpingitis: N=2) (Cecal diverticulitis: N=1) |
Examiner: Certified radiologist DUM: CD + PD USP: 3.75 (convex) /7.5 MHz (linear) Parameters: Bandpass filter: 50 Hz, pulse repetition frequency (PRF) 500-750 Hz, Doppler encoded area restriction, color gain adjustment |
CD: TP:21b TN:66b FP:0b FN:9b PD: TP:28b TN:66b FP:0b FN:2b |
CD: Se:70%b Sp:100%b PD: Se:93.3%b Sp:100%b |
The reported diagnostic performance includes only the subgroup of patients with AA in whom the cecal appendix was identified (30/34). Although authors state that there were no FP in either DUM modality (Color and Power), they do not specify how many in CG patients the appendix was identified. A selection bias (spectrum bias) may have been introduced |
| Gutierrez et al. (1999) [24] | USA | Prospective (consecutive recruitment) | Mixed | 32(3-77)y2 | 20/105 | 125 |
IC: Patients with suspected AA (atypical presentation) AA: Histopathological confirmation CG: NSAP, Non-appendiceal surgical pathology (foreign body perforation, hemoperitoneum secondary to omental arteritis) + NA |
20 NCAA: 16 PAA: 4 |
105 NSAP: 93 NA: 10 (inferential) Non-appendiceal surgical pathology: 2 |
Examiner: NS DUM: CD USP: 5 MHz Parameters: NS |
TP:10b, o TN:105b, o FP:2b, o FN:8b, o |
Se:55.6%b, o Sp:98.1%b, o |
Patients with atypical presentations of acute appendicitis (AA) were specifically selected, which may have introduced a selection bias (spectrum bias). The cecal appendix was only visualized in 23 out of 125 patients, a particularly low rate, representing a significant limitation of the study. However, the final sample for analysis included the ultrasounds of all 125 patients, and the data on TP, FN, TN, and FP are based on the total cohort. The two false positives were the patients with non-appendiceal surgical pathology. |
| Kessler et al. (2003) [25] | France | Prospective (consecutive recruitment) | Adult | 29.5(15-83)y2 | 58/67 | 125 (104 with US-appendiceal identification)d |
IC: Patients with suspected AA AA: Histopathological confirmation CG: NSAP (including non-specific abdominal, mesenteric adenitis, pain, ileitis, gynecologic disease, gastroenteritis, colic pain, psoas hematoma, cystitis, mesenteric ischemia, prostatitis, sigmoid diverticulitis, and gastric ulcer) |
57 (55 with US-appendiceal identification) NPAA: 42 PAA: 15 |
68 (49 with US-appendiceal identification) Non-specific abdominal pain: 26 Mesenteric adenitis: 13 Ileitis or colitis: 9 Gynecologic diseases: 8 Gastroenteritis: 5 Others: 7 |
Examiner: Radiologist with experience in gastrointestinal US examination DUM: CD USP: 4-7 MHz (convex) /5-10 MHz (linear). Parameters: low velocity scale (pulse repetition frequency 1500 Hz, wall filter: 100 Hz) |
TP:28 TN:47 FP:2 FN:26 |
Se:52% Sp:96% |
The reported diagnostic performance is limited to patients in whom the cecal appendix was identified: 55 out of 57 in the AA group and 49 out of 68 in the CG group. A selection bias (spectrum bias) may have been introduced |
| Incesu et al. (2004) [26] | Turkey | Prospective (consecutive recruitment) | Mixed | 4-591 | 36/14 | 50 |
IC: Patients with suspected AA AA: Histopathological confirmation CG: NSAP (non-specific abdominal pain, urinary tract infection, inguinal hernia, typhlitis, CrD, mesenteric adenitis) + NA |
35 ASA: 16 PLA: 3 GA: 7 PAA: 9 |
15 (12 with US-appendiceal identification) NSAP: 14 NA: 1 |
Examiner: Radiologist DUM: PD, CEPD USP: 5-10 MHz (multifrequency linear) Parameters: B-mode, parameter optimization (NS) |
RI: ASA: 0.663 PLA: 0.713 GA: 0.923 PAA: 0.793 PD: TP:26 TN:14 FP:1 FN:9 CEPD: TP:35 TN:14 FP:1 FN:0 |
PD: Se:74.3% Sp:93.3% CEPD: Se:100% Sp:93.3% |
All RI comparisons between groups were reported as statistically significant. |
| Baldisserotto et al. (2006) [27] | Brazil | Prospective (consecutive recruitment) | Pediatric | 7.6(2-12)y2 | 31/19 | 50 (47 with US-appendiceal identification) |
IC: Patients with suspected AA AA: Histopathological confirmation CG: NSAP + NA |
24 (24 with US-appendiceal identification) NCAA: 18 CAA (GA, PAA): 6 |
26 (23 with US-appendiceal identification) NSAP: 25 NA: 1 |
Examiner: Experienced pediatric radiologists DUM: CD USP: 4-7 MHz (curved) / 5-12 MHz (linear). Parameters: adjusted to optimize detection of low velocity flows. CD Scale: Number of color doppler pixels within the appendiceal wall: absent (0), low (1-2), moderate (3-4), or abundant (>4) |
If 3-4 pixels and >4 pixels are considered diagnostic: TP:15b TN:19b FP:4b FN:9b If any pixel present is considered diagnostic: TP:22b TN:14b FP:9b FN:2b |
If 3-4 pixels and >4 pixels are considered diagnostic: Se: 62.5%b Sp: 82.6%b If any pixel present is considered diagnostic: Se: 91.7%b Sp: 60.9%b |
The reported diagnostic performance includes only the subgroup of patients in whom the cecal appendix was identified (47/50), which may have introduced selection bias. Since these authors use a multicategorical scale to classify Doppler flow, diagnostic performance varies depending on the categories considered. Two possible scenarios were created: 1) considering 3–4 pixels and >4 pixels as pathological, or 2) considering any number of pixels as pathological. When any pixel is considered pathological, sensitivity is high (91.7%), whereas restricting the diagnosis to 3–4 and >4 pixels yields better specificity (82.6%). Overall, the Youden index (J) was higher when the presence of any pixel was considered pathological (J = 0.526), compared to using only 3–4 pixels or >4 pixels as diagnostic criteria (J = 0.451) |
| Gaitini et al. (2007) [28] | Israel | Retrospective (consecutive inclusion) | Adult | 28.4(18-73)y2 | 149/271 | 420 (401 with US-appendiceal identification) |
IC: Patients with suspected AA AA: Histopathological confirmation CG: NSAP + Other surgical etiologies + NA |
95 PLA: 84 GA (necrotic): 7 PAA: 4 |
323 NSAP, other medical diagnoses: 316 Other surgical etiologies: 5 NA: 2 |
Examiner: Sonography technician vs radiology resident + confirmation from a senior radiologist DUM: CD USP: 3-5 MHz (convex) / 5-12 vs. 4-8 MHz (linear) Parameters: adjusted to optimize detection of low velocity flows CD Scale: Number of color doppler signals within the appendiceal wall: absent (0), sparse (1-2), moderate (3-4), or abundant (>4) |
CD: TP:66b TN:303b FP:9b FN:23b |
CD: Se: 74.2% Sp: 97.1% |
The reported diagnostic performance study includes only the subgroup of patients in whom the cecal appendix was clearly identified through US (401/420). Seventeen indeterminate cases and two patients with lost reports were excluded from the final analyses. A selection bias (spectrum bias) may have been introduced |
| Xu et al. (2016) [29] | USA | Retrospective | Mixed | 16(2-62)y2 (Data concerning the 94 patients included in the analyses) |
46/48 (Data concerning the 94 patients included in the analyses) |
103 (94 with US-appendiceal identification)e |
IC: Patients with suspected AA whose US showed non-compressible appendices with 6-8 outer diameters. AA: Histopathological confirmation. CG: NSAP (6 weeks follow-up period) + NA |
35 | 59 NSAP: 54 NA: 5 |
Examiner: Experienced sonographers (US performance) + 2 blinded abdominal radiologists (image review) DUM: CD +/- SD (no RI/PI calculation) +/- PD USP: 9-15 MHz Parameters: adjusted to optimize detection of low volume flows. CD Scale: Color Doppler Flow pattern: absent signal (1), type 1 flow (punctate and dispersed signal foci (2), type 2 flow (continuous linear or curvilinear signal extending at least 3 mm in long or short axis view) (3) |
If type 2 flow is considered diagnostic for AA: TP:20 TN:56 FP:3 FN:15 If absent flow is considered diagnostic for not having AA: TP:28 TN:25 FP:10 FN:31 |
If type 2 flow is considered diagnostic for AA: Se: 57.1% Sp: 94.9% If absent flow is considered diagnostic for not having AA: Se: 47.5% Sp: 71.4% |
The reported diagnostic performance study includes only the subgroup of patients in whom the cecal appendix was clearly identified (94/103). A selection bias (spectrum bias) may have been introduced Since US is a dynamic examination, retrospective evaluation through static images may constitute a bias. Discrepancies in CD scale categories were resolved by consensus. The authors limited their sample to patients with an appendix identified on ultrasound and showing borderline characteristics (6–8 mm, non-compressible), which may constitute a selection bias (spectrum bias). The authors report an interobserver agreement kappa value of 0.59 (moderate). This may have been influenced by the study’s methodology (retrospective review of static Doppler images). The Youden index was higher when type 2 flow was considered diagnostic for AA (J = 0.52), compared to absent flow used to rule out AA (J = 0.18), indicating better overall diagnostic performance in the former approach |
| Daga et al. (2017) [30] | India | NS | Mixed | 8-62y1 | NS | 100 (91 with US-appendiceal identification)f |
IC: Patients with a strong suspicion of AA and US criteria for diagnosing AA AA: Histopathological confirmation CG: NSAP (6 weeks follow-up period) + NA |
AA: 85 |
15 NSAP: 5 NA: 4 Interval appendectomy (appendicular mass): 4 (inferentially classified in CG group) Drainage of abscess: 2 (inferentially classified in CG group) |
Examiner: NS DUM: CD USP: 3.5-5 MHz (curvilinear) / 7.5-10 MHz (linear) Parameters: NS |
If increased CD flow (hyperemia) is considered diagnostic for AA: TP:64b,f TN:0b,f FP:0b,f FN:21b,f If any CD flow is considered diagnostic for AA: TP:79b,f TN:0b,f FP:0b,f FN:6b,f |
If increased CD flow (hyperemia) is considered diagnostic for AA: Se:NCf Sp:NCf If any CD flow is considered diagnostic for AA: Se:NC%f Sp: NC%f |
Of the 100 patients, the cecal appendix was identified by ultrasound in 90. Among these, 85 had a US AA diagnosis. Since the CD diagnostic performance assessment was limited to this last subgroup of patients, only TP and FP could be calculated. A selection bias (spectrum bias) may have been introduced. The Youden index, Se, and Sp were NC due to insufficient data. |
| Xu et al. (2017) [31] | USA | Retrospective | Mixed | 16.5(3-57)y2 | 64/55 Adults:17/22 Children: 47/33 |
119 |
IC: Patients operated on for AA with histopathologically-proven AA |
119 NCAA: 87 CAA: 32 (GA:11, PAA:21) |
- |
Examiner: Experienced sonographer (retrospective revision by abdominal radiologist) DUM: CD USP: 8-15 MHz (linear) Parameters: NS CD scale: Mural hyperemia was defined as at least 3 mm of contiguous color Doppler flow identified (long or short axis). |
NCAA vs. CAA (Mural hyperemia: 3 mm of contiguous color Doppler flow identified): TP:8 TN:63 FP:24 FN:24 |
NCAA vs. CAA (Mural hyperemia: 3 mm of contiguous color Doppler flow identified): Se: 25%b Sp: 72.4%b |
Since US is a dynamic examination, retrospective evaluation through static images may constitute a bias. The poor diagnostic performance is likely due to the use of mural hyperemia as the diagnostic criterion for complicated acute appendicitis (CAA). Based on biological plausibility and previous literature, this marker should have been applied to non-complicated acute appendicitis (NCAA). The absence of Doppler flow in the appendiceal wall would have been a more appropriate indicator for CAA. |
| Uzunosmanoğlu et al. (2017) [32] | Turkey | Prospective (non-consecutive)g | Adult | 30.3(19-61)y2 | 33/27 | 60h |
IC: Patients operated on for AA AA: Histopathological confirmation CG: NA |
AA: 46 NCAA: 25 CAA (PAA): 21 |
NA: 14 |
Examiner: Radiologist DUM: CD + SD USP: 5 MHz (Color and pulse) / 3-9 MHz (electronic phased array) Parameters: NS |
RI (NCAA): 0.783 RI (CAA): 0.813 PI (NCAA): 1.23 PI (CAA): 13 Doppler US: TP:43b TN:12b FP:2b FN:3b |
Doppler US: Se: 93% Sp: 85% |
Since US is a dynamic examination, retrospective evaluation through static images may constitute a bias. The authors state that although they had 21 cases of PAA, they had no cases of GA or necrotic AA |
| Shin et al. (2017) [33] | USA | Retrospective (consecutive) | Mixed | 14.5(1-56)y2 | 53/40 | 337 (93 with US-appendiceal identification and CD on appendiceal wall) |
IC: Patients with suspected AA AA: Histopathological confirmation CG: NSAP |
36 | 57 |
Examiner: Experienced radiologist DUM: CD + SD USP: 8-15 MHz (linear) Parameters: adjusted to optimize detection of low volume flows (lowest wall filter value, lowest pulse repetition frequency) |
PSV (cm/s): AA: 19.7(2-33)2 18.6(7.33)5 CG:7.1(4-21)2 9.8(3.71)5 RI AA: 0.69(0.33-1)2 0.68(0.16)5 CG: 0.5(0.24-0.82)2 0.52(0.12)5 PSV TP:32b TN:54b FP:3b FN:4b RI: TP:23b TN:55b FP:2b FN:13b |
PSV ≥ 10 (cm/s) Se:88.9% Sp:94.7% RI ≥ 0.65 Se:63.9% Sp:96.5% |
The authors limited their sample to patients with an appendix identified on ultrasound and a CD signal within the appendiceal wall (93/337), which may constitute a selection bias (spectrum bias). PSV and RI comparisons between groups were statistically significant (p<0.001) |
| Aydin et al. (2019) [34] | Turkey | Retrospective | Mixed | 26(4-78)y2 | 131/128 | 280 (259 with sufficient sonographic information) |
IC: patients who have undergone an appendectomy AA: histopathological confirmation CG: NA (lymphoid hyperplasia) |
142 | NA (lymphoid hyperplasia): 117 |
Examiner: Radiologist DUM: CD + PD USP: 7 MHz (linear) Parameters: NS |
AA (Mural hyperemia: any flow within the appendiceal wall): TP:90b, n TN:107b, n FP:10b, n FN:52b, n |
AA (Mural hyperemia: any flow within the appendiceal wall): Se:63.4% Sp:91.5% |
The retrospective analysis of static images in a dynamic test such as US may introduce bias. The authors limited their sample to patients with adequate sonographic data (259/280), which may lead to spectrum bias. Mural hyperemia was defined as the presence of wall flow on CD or PD. The use of a CG with lymphoid hyperplasia rather than NSAP may also limit the interpretability of the results—particularly given that the reported Se and Sp for grayscale US (appendix >7 mm) were low (63.4% and 77.8%) compared to previous literature. |
| Bakhshandeh et al. (2022) [35] | Iran | Cross sectional | Mixed | 24(12.6)y4 | 82/70 | 152k |
IC: Patients with suspected AA and borderline US AA criteria AA: Histopathological confirmation CG: NSAP + NA |
95k | 57k NSAP:?k NA: 57k |
Examiner: Radiologist DUM: CD + SD USP: 7 MHz (linear) Parameters: pulse repetition frequency 1- 1.3 kHz, reduced wall filter |
PSVm: TP:90 TN:54 FP:3 FN:5 RIm: TP:86 TN:49 FP:8 FN:9 |
PSV ≥ 9.6 (cm/s) Se:94.7% Sp:94.7% RI ≥ 0.495 Se:90.5% Sp:86% |
The authors limited their sample to patients with an appendix identified on ultrasound and showing borderline characteristics (6–8 mm), which may constitute a selection bias (spectrum bias). Patients with definite AA on US were also excluded from the study, which may also constitute a selection bias. The numerical values for PSV and RI reported in the manuscript correspond to the entire cohort and are not specific to any subgroups |
| El-Aleem et al. (2024) [36] | Egypt | Prospective | Mixed |
AA: 22.95 (6-43)y2 CG: 17.92 (4-62)y2 |
AA: 36/24 CG: 14/10 |
100 (84 with US-appendiceal identification and with appendiceal CD flow present)i |
IC: Patients with suspected AA and with a visible appendix in grayscale US AA: Histopathological confirmation CG: NSAP (6 weeks follow-up period) + NA |
60 | 24 |
Examiner: Senior resident (4y experience) and Abdominal radiology consultant (12y experience) DUM: CD + SD USP: 5 MHz (Curvilinear) / 6-12 MHz (multifrequency linear) Parameters: Lowest wall filter value and pulse repetition frequency |
PSV (cm/s) AA: 14.33(4.34)4 CG: 8.5(2.6)4 RI AA: 0.65(0.09)4 CG:0.48(0.08)4 PSV TP:59b TN:18b FP:6b FN:1b RI: TP:50b TN:19b FP:5b FN:10b |
PSV ≥ 8.6 (cm/s) Se:98.3% Sp:75% RI ≥ 0.58 Se:83.3% Sp:79.2% |
The exclusive inclusion of patients with AA whose appendix was visible on grayscale US and who had CD flow on appendiceal US (84/100) may constitute selection bias (spectrum bias). PSV and RI comparisons between groups were statistically significant (p<0.001) |
| Saini et al. (2024) [37] | India | Prospective | Mixed | 2-50y1 | NS | 40 |
IC: Patients with suspected AA AA: Histopathological confirmation CG: NSAP + NA |
18 |
22 NA:3 |
Examiner: Postgraduate radiology resident + Senior radiologist supervision DUM: CD + SD USP: 12 MHz (Linear) Parameters: NS |
PSV (cm/s) AA: 19.21(5.95)4 CG: 14.15(7.02)4 RI AA: 0.63(0.1)4 CG: 0.56 (0.12)4 PSV TP:17b TN:12b FP:10b FN:1b RI: TP:15b TN:13b FP:9b FN:3b |
PSV ≥ 11.8 (cm/s) Se:93.8% Sp:54.2% RI ≥ 0.56 Se: 81.2% 83.3%b Sp: 58.3% 59.1%b |
Patients with complicated AA (PAA, abscess) were excluded from the study, which may represent a selection bias. PSV comparison between groups was statistically significant (p=0.009) RI comparison between groups reached marginal significance (p=0.056) A small difference was found between the sensitivity and specificity reported by the authors and those calculated inferentially based on TP, FP, TN, and FN |
| Anuj et al.(2025) [38] | India | Prospective (consecutive recruitment) | Mixed |
AA: 35(10-60)y2 CG: 34(12-58)y2 |
AA: 15/10 CG: 20/16 |
180 (64 with US-appendiceal identification and with appendiceal doppler data. Finally, the authors included 61 patients)l |
IC: Patients with suspected AA AA: Histopathological confirmation CG: NSAP |
25 | 36 |
Examiner: Experienced radiologists DUM: SD USP: NS Parameters: NS |
PSV (cm/s) AA: 18.9(3-32.5)2 18.33(7.5)5 CG: 6.8(2.5-19)2 8.77(3.9)5 RI AA: 0.68(0.35-0.98)2 0.67(0.16)5 CG: 0.51 (0.22-0.79)2 0.51(0.13)5 PSV TP:21 TN:33 FP:3 FN:4 RI: TP:16 TN:34 FP:2 FN:9 |
PSV ≥ 10 (cm/s) Se:85.3% Sp:92.5% RI ≥ 0.65 Se:64% Sp:95% |
The exclusive inclusion of patients with AA whose appendix was visible on grayscale US and who had CD flow and spectral Doppler waveforms on appendiceal US (61/180) may constitute selection bias (spectrum bias)l PSV and RI comparisons between groups were statistically significant (p<0.001) |
IC: Inclusion criteria; NS: Not specified; y: Years. AA: Acute appendicitis group; CG: Control group; NSAP: Non-surgical abdominal pain; HC: Healthy controls; CAA: Complicated acute appendicitis; NCAA: Non-complicated acute appendicitis; PAA: Perforated acute appendicitis; NPAA: Non-perforated acute appendicitis; NA: Negative appendectomy; ASA: Acute suppurative appendicitis; PLA: Phlegmonous appendicitis; GA: Gangrenous appendicitis; CA: Chronic appendicitis; IBS: Irritable bowel syndrome; CrD: Crohn's disease. TP: True positives; TN: True negatives; FP: False positives; FN: False negatives; Se: Sensitivity; Sp: Specificity; NC: Not-calculable PR: Pediatric Radiologist; PS: Pediatric sonographer (It is inferentially understood that they are referring to a clinical pediatrician with ultrasound skills); US: Ultrasound; DUM: Doppler ultrasound mode; USP: Ultrasound probe; CD: Color Doppler; PD: Power Doppler, SD: Spectral Doppler; DD: Duplex Doppler; CEPD: Contrast-enhanced power Doppler; RI: Resistive/resistance index; PSV: Peak systolic velocity; PI: Pulsatility index; SML: submucosal layer. 1: Range; 2: Mean (range); 3: Mean; 4: Mean (standard deviation); 5: Mean (standard deviation) estimated from mean (range). a: Calculation based on the contingency table generated with the values of TP, TN, FP, and FN; b: Inferential calculation (i.e., based on the % of patients with the sonographic Doppler finding in each group); c: Lim et al. included one publication with two patient samples, one prospective and one retrospective. Both are included and analyzed as separate studies in the present review.; d: The sum of the reported TP, TN, FP, and FN values from Kessler et al. (Table 2) yields 103, whereas they report 104 patients with the cecal appendix identified on ultrasound.; e: Xu et al. report that they included all patients who underwent US due to suspected appendicitis (AA) during the study period and identified 94 patients with borderline appendices. They mention that 9 cases with non-visualized appendices were excluded, but later state that their institution's appendix non-visualization rate is 50%. Also, they do not mention which percentage of patients with a normal appendix (not borderline) were identified and excluded from the study; f: Daga et al.'s work presents numerical inconsistencies (i.e., in the main text, the authors report: “overall, out of 100 patients, 90 patients were diagnosed appendicitis on US examination,” but in Table 1, they report that the US was positive for AA in 85 cases and a normal cecal appendix was identified in 6 cases). Given that all percentage values are calculated over 85 patients in the rest of the main text, we have opted to keep this data. Their CD diagnostic performance results are reported only for the AA group, so only TP and FP could be estimated. This should be considered a significant limitation and a potential high risk of bias.
Disclaimer/Publisher’s Note: The statements, opinions and data contained in all publications are solely those of the individual author(s) and contributor(s) and not of MDPI and/or the editor(s). MDPI and/or the editor(s) disclaim responsibility for any injury to people or property resulting from any ideas, methods, instructions or products referred to in the content. |
© 2025 by the authors. Licensee MDPI, Basel, Switzerland. This article is an open access article distributed under the terms and conditions of the Creative Commons Attribution (CC BY) license (http://creativecommons.org/licenses/by/4.0/).
Copyright: This open access article is published under a Creative Commons CC BY 4.0 license, which permit the free download, distribution, and reuse, provided that the author and preprint are cited in any reuse.


