
Submitted:
02 May 2025
Posted:
06 May 2025
You are already at the latest version
Abstract
Background: Hepatocellular carcinoma (HCC) is an important cause of cancer-related mortality, often arising in cirrhotic livers. Current surveillance methods, including ultrasound and serum α-fetoprotein (AFP), have limited sensitivity and specificity. Circulating microRNAs (miRNAs) have shown promise as non-invasive biomarkers, but tissue-based miRNA profiles in HCC versus cirrhosis remain underexplored. This study investigates differentially expressed miRNAs in liver biopsies to identify potential diagnostic biomarkers for HCC.Methods: miRNA expression data from liver biopsies (333 samples, including 25 HCC and 30 cirrhosis samples) were obtained from the Gene Expression Omnibus dataset GSE51429. Data preprocessing, and quality control were performed using DESeq2 and limma in R. Differential expression analysis identified HCC-associated miRNAs, followed by feature selection using LASSO and Random Forest. Diagnostic performance was evaluated via ROC curve analysis.Results: Limma analysis identified 15 differentially expressed miRNAs (FDR < 0.05), including miR-625, miR-208b, and miR-138. PCA and heatmaps confirmed distinct clustering between HCC and non-HCC samples. Twenty-four miRNAs were differentially expressed, with miR-196b, miR-138, and miR-187 showing significant fold changes. ROC analysis revealed high discriminative power for miR-215-5p (AUC = 0.947), miR-373-3p (AUC = 0.902), and miR-200b (AUC = 0.873).Conclusion: This study identifies distinct tissue miRNA signatures differentiating HCC from cirrhosis, with several miRNAs demonstrating high diagnostic accuracy. These findings support the potential of tissue miRNAs as complementary biomarkers for HCC detection in high-risk cirrhotic patients. Further validation in larger cohorts is warranted for clinical translation.
Keywords:
gene expression profiling
; biomarkers
; liver neoplasms
; non‐coding RNA
; precision medicine
; machine learning
; disease progression
Background
Hepatocellular carcinoma (HCC) is a leading cause of cancer mortality worldwide, ranking among the top cancers by incidence and death rate. Most HCC cases (>80–90%) arise in the setting of chronic liver disease and cirrhosis. Prognosis is poor when HCC is detected late, even with curative therapy, 5-year survival is high only for very early-stage tumors, whereas advanced-stage 5-year survival is typically <5%. Consequently, surveillance of patients with cirrhosis (who are at high risk for HCC) is critical for early detection. Current surveillance relies on imaging (ultrasound, CT/MRI) and serum biomarkers, but these methods have important limitations. In practice, ultrasound combined with α-fetoprotein (AFP) measurement is used, yet AFP sensitivity is low (around 40–60%) and specificity is variable [1]. AFP may be elevated by cirrhosis or inflammation even without tumor, and small HCCs often fail to raise AFP [2]. Imaging in cirrhosis can also miss or mischaracterize small nodules [1]. These shortcomings leave a diagnostic gap for earlier and more accurate HCC detection, highlighting the need for novel non-invasive biomarkers.
MicroRNAs (miRNAs) have emerged as promising biomarker candidates. MiRNAs are endogenous, single-stranded non-coding RNAs (~19–24 nucleotides) that regulate gene expression by binding target mRNAs and causing degradation or translational repression [2]. Numerous studies have shown that miRNA expression is profoundly altered in cancer, including HCC, where oncogenic or tumor-suppressor miRNAs can drive carcinogenesis [2]. Importantly, miRNAs released from cells can be detected in blood. Circulating miRNAs are found stably in serum or plasma despite ubiquitous RNases. This stability arises because miRNAs in blood are often bound to proteins or enclosed within extracellular vesicles (such as exosomes), protecting them from degradation [3]. In fact, exosome-encapsulated miRNAs are highly resistant to RNase digestion, making them a rich and stable source of biomarkers in biofluids [4]. Because of these properties, circulating miRNAs remain detectable in patient blood even under harsh conditions [1,3], enabling non-invasive “liquid biopsy” assays. Several reviews and meta-analyses have highlighted the clinical relevance of cell-free miRNAs in cancer, including HCC [1,2].
Given this rationale, recent studies have evaluated specific serum or exosomal miRNAs for distinguishing HCC from cirrhosis. For example, Wang et al. (2020) identified an exosomal miRNA panel, comprising miR-21 and miR-96 (upregulated) and miR-122 (downregulated) in HCC, that discriminated HCC from cirrhotic controls with an area under the receiver operating characteristic (ROC) curve (AUC) of 0.924 (sensitivity 82%, specificity 92%) [5]. Yang et al. (2022) also used exosomal miRNAs and found that a panel of miR-26a, miR-29c, and miR-199a achieved AUC = 0.965 (sensitivity 92%, specificity 90%) for HCC vs. cirrhosis [6]. In another recent example, Farag et al. (2025) studied HCV-related HCC in Egyptian patients and showed that serum miR-101 levels were significantly higher in HCC than in cirrhosis, yielding an AUC of 0.956 (sensitivity 92.5%, specificity 97.5%) [7]. Additional miRNAs (such as miR-155-5p, miR-192-5p, miR-199a-5p, and others) have been tested, often in combination with AFP, with similar improvements in HCC detection sensitivity [8]. In one study, combining each of miR-21-5p, miR-155-5p or miR-199a-5p with AFP increased sensitivity from 69% (AFP alone) to 82–87% [8]. Taken together, these findings illustrate that specific circulating miRNA signatures can robustly distinguish HCC patients from cirrhotic controls across diverse cohorts.
Meta-analyses further support the diagnostic potential of miRNAs. A 2024 systematic review and meta-analysis covering 15 studies (involving ~787 HCC and 784 cirrhosis patients) found pooled sensitivity ~84%, specificity ~79%, and AUC ≈0.88 for circulating miRNAs discriminating HCC vs. cirrhosis [2]. These pooled accuracy measures are notably better than those of traditional markers. For instance, AFP showed a combined AUC of only ~0.79 in that analysis. The authors concluded that especially upregulated miRNAs are promising as non-invasive biomarkers for distinguishing HCC from cirrhosis [2]. Nonetheless, heterogeneity between studies was observed, underscoring the need for rigorous validation and standardization.
Circulating miRNAs combine strong biological rationale (reflecting tumor biology while being stable in blood [1,3]) with accumulating evidence of high diagnostic accuracy. Recent work has identified specific miRNAs and multi-marker panels that outperform AFP alone and achieve high sensitivity and specificity for HCC in cirrhotic patients [6,7,8]. These non-invasive biomarkers could potentially complement existing surveillance methods to improve early HCC detection, though prospective studies in large cohorts are needed to confirm their clinical utility.
HCC is a molecularly heterogeneous malignancy with limited therapeutic options in advanced stages, underscoring the need for novel biomarkers and targeted therapies. Emerging evidence highlights the critical role of non-coding RNAs (ncRNAs), particularly miRNAs (miRs) and long non-coding RNAs (lncRNAs), in HCC pathogenesis. Dysregulated miRNAs, such as miR-21, miR-10b, and miR-221, modulate oncogenic pathways, including proliferation, apoptosis, and metastasis, by targeting key genes like PTEN, EZH2, and KLF4. Similarly, lncRNAs contribute to HCC progression by competitively binding miRNAs or mRNAs, thereby influencing epithelial-mesenchymal transition (EMT), angiogenesis, and drug resistance [9]. Some microRNAs have been shown to promote angiogenesis, which is a key process in tumor development [10]. The dynamic interplay between lncRNAs and miRNAs forms intricate regulatory networks that drive tumorigenesis, offering potential diagnostic and prognostic utility. Given their tissue-specific expression and functional versatility, ncRNAs represent promising candidates for improving HCC detection, stratification, and therapy, particularly in cases resistant to conventional treatments [9].
However the role of circulating miRNA is well-established, there are gaps regarding tissue miRNAs in discriminating pathologies. This study aims to evaluate the miRNAs expression in liver biopsy-driven data.
Materials and Methods
Data Acquisition
The dataset used in this study was obtained from the Gene Expression Omnibus (GEO) database, a public resource maintained by the National Center for Biotechnology Information (NCBI). The dataset in question is GSE51429 [11], which is publicly available and was accessed on May 1, 2025, from the GEO website (https://www.ncbi.nlm.nih.gov/geo/). This dataset, titled "A microRNA-based primary tumor site classification of liver core biopsies," contains gene expression profiles of microRNAs measured using RT-PCR for tissue samples (liver core biopsies) from 333 patients. Among these, 25 samples correspond to HCC and 30 samples to cirrhosis. The samples were collected from the archives of the pathology department at the Copenhagen University Hospital, Rigshospitalet, Denmark. The study also includes liver core biopsies tissue samples from other cancer types (lung cancer, breast cancer, gastric/cardia cancer, colorectal cancer, bladder cancer, pancreatic cancer, cholangiocarcinoma, squamous cell cancers of different origin) as well as normal liver tissue. The microRNA expression data was obtained using the Applied Biosystems Human MicroRNA Array A v2.0 (GPL17391) platform.
Preprocessing
The raw data was imported into R for further analysis. The samples were categorized into two groups based on their diagnosis; HCC and cirrhosis. Data normalization was performed using the DESeq2 package in R, a standard approach for RNA-seq data normalization. The normalization procedure ensures that the differences observed between the samples are biologically meaningful, accounting for biases such as sequencing depth.
Quality Control and Data Visualization
Initial quality control (QC) of the microRNA expression data was performed using Principal Component Analysis (PCA) to visualize the overall structure of the data. The PCA plots were generated using the prcomp function in R, which allowed for the identification of potential outliers and grouping patterns based on sample type (HCC vs. other samples and HCC vs. cirrhosis). Additionally, a heatmap was generated to highlight the top 20 most variable miRNAs across the samples, enabling the identification of sample outliers and potential batch effects.
Differential Expression Analysis
Differential expression analysis was conducted to identify miRNAs that were significantly differentially expressed between the two groups (HCC vs. other samples and HCC vs. cirrhosis). The limma package in R was used for this analysis, which involves fitting linear models to the data and applying empirical Bayes methods to compute moderated t-statistics. The results were adjusted for multiple comparisons using the Benjamini-Hochberg False Discovery Rate (FDR) method.
Selection of Top miRNAs
To identify the most significant miRNAs for further investigation, the results of the differential expression analysis were filtered based on the lowest adjusted p-values (FDR < 0.05). The top five miRNAs with the highest significance were selected for downstream analysis. Additionally, to further refine biomarker selection, regularized regression methods, such as LASSO (Least Absolute Shrinkage and Selection Operator), were applied. This technique allowed for the selection of relevant features while minimizing overfitting.
Biological Function Analysis
Although the enrichment analysis for the biological functions of the differentially expressed miRNAs could not be performed due to computational challenges, the plan was to use the clusterProfiler package in R for Gene Ontology (GO) analysis. This would allow the identification of enriched biological processes, cellular components, and molecular functions associated with the target genes of the miRNAs. Unfortunately, this step could not be successfully executed in this study due to issues with the R implementation.
Statistical Analysis
To evaluate the predictive power of the differentially expressed miRNAs, ROC curves were generated using the pROC package in R. The area under the curve (AUC) was computed for each miRNA, and the performance of miRNAs in distinguishing between HCC and cirrhosis was assessed. Statistical significance was evaluated using the Wilcoxon rank-sum test. Furthermore, feature selection was performed using both LASSO regression and Random Forest modeling. These methods provided an additional layer of validation, helping to identify top miRNAs that could serve as robust biomarkers for HCC. The results from these analyses, including boxplots and heatmaps for visual representation, were saved and provided additional insights into the expression patterns of these miRNAs.
The statistical analyses were conducted using IBM SPSS Statistics version 16.0 (IBM Corporation, Armonk, NY, USA), R version 4.5.0 (R Foundation for Statistical Computing, Vienna, Austria; https://www.r-project.org/), and GraphPad Prism version 8 (GraphPad Software, San Diego, CA, USA; https://www.graphpad.com/). The differential expression analysis of miRNAs between the HCC and cirrhosis groups was performed using the limma package in R, and statistical significance was determined using a moderated t-test. Multiple comparisons were corrected for using the Benjamini-Hochberg FDR method, and adjusted p-values were reported. A p-value less than 0.05 was considered statistically significant.
Results
Differential miRNA Expression Between HCC and Other Biopsies
Limma Analysis
A total of 15 microRNAs were found to be differentially expressed between HCC and other samples based on limma analysis (FDR-adjusted p-value < 0.05). Among these, the most significantly altered miRNAs included hsa-miR-625, hsa-miR-208b, hsa-miR-138, hsa-miR-122, and hsa-miR-548b-3p, with log2 fold changes ranging from –0.71 to +0.64 and adjusted p-values <0.001 (Table 1). PCA demonstrated clear separation between HCC and other samples groups, confirming distinct expression profiles (Figure 1 and Figure 2).
Heatmap Analysis
Two heatmaps were generated to assess expression patterns across samples. The first heatmap, which included all profiled miRNAs, revealed distinct clustering between HCC and other samples, suggesting a clear miRNA signature that discriminates between the two conditions (Figure 3). This global overview further validated the robustness of the dataset and the normalization approach.
The second heatmap, focusing on the top five differentially expressed miRNAs (hsa-miR-625, hsa-miR-208b, hsa-miR-138, hsa-miR-122, and hsa-miR-548b-3p), showed sharp contrast in expression levels between HCC and other samples (Figure 4). HCC samples consistently exhibited upregulated or downregulated expression of these miRNAs relative to other tissues, reinforcing their diagnostic potential.
Volcano Plot Interpretation
A volcano plot was generated to visualize the distribution of miRNA expression changes between HCC and other samples. This plot displayed the log2 fold changes on the x-axis against the –log10 adjusted p-values on the y-axis. Several miRNAs exhibited both statistically significant differential expression and substantial fold changes, including hsa-miR-369-3p, hsa-miR-122, hsa-miR-208b, and hsa-miR-548b-3p, which appeared in the top right quadrant of the plot, indicating strong upregulation in HCC relative to cirrhosis. Conversely, hsa-miR-200c, hsa-miR-187, hsa-miR-138 and hsa-miR-198 showed prominent downregulation (Figure 5). These findings underscore key candidate miRNAs for further exploration as HCC-specific biomarkers.
Feature Selection and Biomarker Identification
LASSO regression identified a subset of miRNAs with the highest discriminative power (Figure 6), including hsa-miR-548b-3p, overlapping with the top DE miRNAs (Table 2). Random Forest analysis further confirmed these selections, assigning high feature importance scores to hsa-miR-141, hsa-miR-200c, hsa-miR-199a-3p, hsa-miR-214, hsa-miR-200a, hsa-miR-200b, hsa-miR-138, hsa-miR-429, hsa-miR-27a, hsa-miR-122, hsa-miR-208b, hsa-miR-187, hsa-miR-885-5p, hsa-miR-576-3p, hsa-miR-223, hsa-miR-10a, hsa-miR-130b, hsa-miR-199a-5p, hsa-miR-146a, and hsa-miR-373.
Diagnostic Performance of Candidate miRNAs
ROC curve analysis (Figure 7) revealed that hsa-miR-215-5p had the highest AUC (= 0.947), followed by miR-373-3p (AUC = 0.902), miR-19b-3p (AUC = 0.875), and miR-200b (AUC = 0.873). These findings suggest high sensitivity and specificity in distinguishing HCC from other liver pathologies (Table 3). The Wilcoxon rank-sum test confirmed the statistical significance of expression differences for miR-373-3p and miR-200b (p < 0.01).
Differential miRNA Expression between HCC and Cirrhosis
Limma Analysis
A total of 24 microRNAs were found to be differentially expressed between HCC and cirrhotic samples based on limma analysis (FDR-adjusted p-value < 0.05). Among these, the most significantly altered miRNAs included hsa-miR-196b, hsa-miR-138, hsa-miR-570, hsa-miR-187, hsa-miR-492, etc., with log2 fold changes ranging from –1.31 to +0.82 and adjusted p-values ranging from 0.0001 to 0.044 (Table 4). PCA demonstrated clear separation between HCC and cirrhosis groups, confirming distinct expression profiles (Figure 8 and Figure 9).
Heatmap Analysis
Two heatmaps were generated to assess expression patterns across samples. The first heatmap (Figure 10), which included all profiled miRNAs, revealed distinct clustering between HCC and cirrhosis, suggesting a clear miRNA signature that discriminates between the two conditions. This global overview further validated the robustness of the dataset and the normalization approach.
The second heatmap, focusing on the top five differentially expressed miRNAs (hsa-miR-625, hsa-miR-208b, hsa-miR-138, hsa-miR-122, and hsa-miR-548b-3p), showed sharp contrast in expression levels between HCC and cirrhosis (Figure 11). HCC samples consistently exhibited upregulated or downregulated expression of these miRNAs relative to other tissues, reinforcing their diagnostic potential.
Volcano Plot Interpretation
A volcano plot was generated to visualize the distribution of miRNA expression changes between HCC and cirrhosis. This plot displayed the log2 fold changes on the x-axis against the –log10 adjusted p-values on the y-axis. Several miRNAs exhibited both statistically significant differential expression and substantial fold changes, including hsa-miR-138, hsa-miR-187, hsa-miR-625, and hsa-miR-450a, which appeared in the top right quadrant of the plot, indicating strong upregulation in HCC relative to cirrhosis. Conversely, hsa-miR-133b, hsa-miR-183, hsa-miR-570, and hsa-miR-196b showed prominent downregulation. These findings underscore key candidate miRNAs for further exploration as HCC-specific biomarkers when comparing with cirrhosis (Figure 12).
Discussion
Our analysis revealed a clear miRNA expression signature that distinguishes HCC tissues from other liver lesions and liver core biopsies of non-hepatic cancers. Principal component analysis and hierarchical clustering showed that HCC biopsies form a distinct cluster, separate from cirrhosis, normal liver, and liver core biopsies from all other tumor types (lung, breast, gastric, colorectal, bladder, pancreatic, cholangiocarcinoma, squamous cell carcinoma). In total, 15 miRNAs were significantly dysregulated in HCC versus the mixed “other” biopsy group (FDR<0.05), and 24 miRNAs differed between HCC and cirrhosis. These results suggest that HCC has a unique miRNA profile, reflecting its specific biology. Importantly, several of the top miRNAs we identified have well-characterized roles in HCC or liver biology, lending biological plausibility to our findings. For example, miR-625 was among the most significant hits. Previous work showed that miR-625 is frequently downregulated in HCC, and its loss correlates with lymph node metastasis, portal invasion and poor survival. Re-expression of miR-625 in HCC cells suppresses migration and invasion via targeting IGF2BP1 [12]. Similarly, miR-138 and miR-548b-3p emerged as key markers. Both are reported to act as tumor-suppressors in HCC; miR-138 is downregulated in tumors and inhibits proliferation/migration by targeting the transcription factor SP1 [13], while miR-548b-3p is expressed at low levels in HCC and its overexpression curtails growth and invasion (by also targeting SP1) [14]. MiR-122, the liver-specific miRNA, was another top hit. miR-122 loss is a hallmark of hepatocarcinogenesis [15], and its alteration is associated with HCC development and treatment resistance. While miR-122 is widely recognized as a liver-specific miRNA whose downregulation is characteristic of HCC (as noted in the Introduction), our results showed only moderate differential expression of this miRNA. This apparent discrepancy may be attributed to variations in HCC etiology (e.g., viral versus metabolic origins) across study populations, or potentially to differences in the sensitivity of detection methods employed in various studies. Furthermore, the diagnostic utility of miR-122 may vary depending on the stage of HCC progression, as early-stage tumors might retain higher miR-122 expression compared to advanced cases. This highlights the importance of considering clinical context when evaluating miRNA biomarkers. Our up- and down-regulated miRNAs overlap substantially with known HCC-related miRNAs [12,13,14,15], validating the relevance of our results.
Our study identified a robust miRNA signature distinguishing HCC from non-HCC biopsies and cirrhosis, with miR-215-5p and miR-373-3p exhibiting good diagnostic performance. Notably, miR-138 and miR-122 emerged as consistently dysregulated across comparisons, aligning with prior reports of their roles in HCC progression [9]. However, while our LASSO and Random Forest models prioritized miRNAs like miR-200b and miR-141, linked to EMT and metastasis, their fold changes were modest compared to lesser-studied candidates such as miR-548b-3p, which showed pronounced upregulation. This discrepancy challenges the conventional focus on well-characterized miRNAs (e.g., miR-21 or miR-221) and suggests that underrepresented miRNAs may hold untapped diagnostic value. Surprisingly, miR-208b was significantly elevated in HCC, implying potential tissue-specific re-wiring of miRNA networks in hepatocarcinogenesis. Despite clear PCA clustering, overlap between groups underscores HCC’s molecular heterogeneity, possibly diluting biomarker efficacy in borderline cases. Furthermore, the downregulation of miR-187 in HCC versus cirrhosis contradicts its oncogenic role in other cancers, highlighting context-dependent miRNA functionality. These findings advocate for validation in independent cohorts to reconcile inconsistencies with existing literature and explore mechanistic links to HCC pathogenesis [14].
Our LASSO and Random Forest models prioritized miR-200 family members, which regulate EMT and metastasis. This aligns with the reviewed literature [9] but contrasts with studies emphasizing miR-221 or miR-21 as primary biomarkers [16,17]. These differences may stem from our focus on HCC vs. cirrhosis comparisons, whereas prior studies often compared HCC to normal liver. Additionally, the lncRNA-miRNA networks described in the a review article could explain unexpected findings like miR-208b upregulation, as lncRNAs may "sponge" miRNAs, altering their availability [9].
Not all HCC-associated miRNAs were tumor suppressors, however. We also identified oncogenic miRNAs that are upregulated in HCC. For instance, members of the miR-208 family were prominent. Although less studied in HCC, related miR-208-3p has been reported to be highly expressed in HCC tissue and to promote proliferation and invasion by repressing the tumor suppressor ARID2 [18]. Likewise, miR-19b-3p, one of our top diagnostic markers, has an oncogenic role in HCC. Recent work shows that miR-19b-3p inhibits ferroptosis and thus enhances HCC cell proliferation through the circIDE/miR-19b-3p/RBMS1/GPX4 axis [19]. The inclusion of both tumor-suppressive and oncogenic miRNAs in our signature highlights the complex dysregulation of gene regulation in HCC. In particular, miR-625, miR-122, miR-138 and miR-548b-3p (down in HCC) are known anti-metastatic factors [12,13,14,15], whereas miR-208b and miR-19b-3p (up in HCC) likely drive tumor progression [18,19].
An intriguing pattern emerged when comparing HCC vs. cirrhosis to HCC vs. other cancers. A subset of miRNAs showed opposite trends in these comparisons, suggesting distinct biology. For example, a miRNA that is elevated in HCC relative to non-liver tumors might be reduced in HCC compared to cirrhotic liver tissue, or vice versa. This can be understood in light of the hepatic context. Some liver-enriched miRNAs (like miR-122) are higher in any liver tissue (normal or cirrhotic) than in non-hepatic tumors, but within liver pathology they decline as disease progresses to malignancy [3,15]. Indeed, prior studies of circulating miR-122 show a stepwise increase from healthy to cirrhosis to HCC [3] (likely reflecting liver cell damage), even though miR-122 is lowest in tumor tissue [15]. In line with this, our direct tissue comparison identified 24 miRNAs that separate HCC from cirrhosis. These differ partly from the set that distinguish HCC from other cancers, indicating that some markers are HCC-specific (versus non-hepatic) while others are cirrhosis-specific. For diagnostic purposes, this underscores a key challenge. Many miRNA changes accompany liver injury or cirrhosis as well as malignant transformation. Therefore, markers that distinguish HCC from non-liver cancers are not always ideal for distinguishing HCC within the liver disease spectrum. Our findings highlight the need to evaluate miRNAs in the precise clinical context (e.g. cirrhosis surveillance) where they will be applied.
Our study identified miR-215-5p, miR-373-3p, and miR-138 as good diagnostic miRNAs for HCC, with miR-215-5p exhibiting high discriminative power. These findings align with prior reports (e.g., The Cancer Genome Atlas data [20]) linking miR-215-5p to poor prognosis in HCC, though our results contrast with its reported downregulation in tumor tissues [9]. This discrepancy may reflect cohort-specific heterogeneity or differences in comparator tissues (cirrhosis vs. healthy liver). Notably, miR-138, which we found downregulated in HCC, has been associated with tumor suppression via Cyclin D3/SP1 inhibition [13], supporting its potential as a therapeutic target. However, our observation that miR-122, a well-established HCC diagnostic marker [21,22,23], showed only moderate differential expression challenges its universal utility, suggesting that its diagnostic value may depend on disease etiology (e.g., viral vs. nonalcoholic steatohepatitis-driven HCC).
Interestingly, miR-208b, typically linked to cardiac disease, emerged as significantly upregulated in our HCC cohort, a finding not previously reported in HCC. This highlights the potential for tissue-agnostic miRNA dysregulation in carcinogenesis, possibly through lncRNA-mediated sponging [9]. For instance, miR-21, a known oncogenic miRNA [24], was less prominent in our feature selection despite its established role in proliferation and apoptosis, implying that its utility may be context-dependent (e.g., advanced vs. early-stage HCC).
The potential clinical utility of our miRNA signature is further supported by multivariate analysis. We applied LASSO logistic regression and Random Forest classification to identify the most predictive markers. Notably, these machine-learning methods converged on several miRNAs that also appeared in the univariate analysis. For example, miR-373-3p, miR-429, miR-141, miR-199a and miR-200b were selected as top discriminators by LASSO or random forest and all showed good ROC performance for distinguishing HCC from non-HCC biopsies. These miRNAs also have documented biological relevance to HCC.
MiR-215-5p, which was underexpressed in our HCC samples, has been reported to inversely correlate with vascular invasion in HCC tissues [25]; restoring miR-215-5p expression inhibits vasculogenic mimicry and tumor progression [25]. MiR-373-3p was also down in HCC in our data; others have shown that overexpression of miR-373-3p induces apoptosis, suppresses migration, and slows tumor growth in HCC [26]. MiR-200b, another candidate, is part of the well-known miR-200 family that inhibits EMT and metastasis in HCC [27]. In contrast, miR-19b-3p is oncogenic (as above) but nonetheless accurately separates HCC from benign tissue. The high AUCs observed (often >0.75–0.9) suggest that these miRNAs could serve as robust biomarkers. In practice, a panel combining multiple miRNAs like these could complement existing markers. For instance, AFP (the conventional serum marker) has suboptimal sensitivity, especially for early-stage HCC. Our results imply that adding miRNAs might improve detection. Indeed, multivariate models yielded better classification than any single miRNA alone, indicating that an ensemble could capture the heterogeneity of HCC.
We also compared our findings with published miRNA studies in liver cancer. Many previously reported HCC miRNAs were seen in our data, reflecting future study demands and novelty. The loss of miR-122 and other liver-enriched miRNAs in HCC is well established [15]. However, some “canonical” HCC miRNAs (e.g. miR-21, miR-221) did not emerge as top hits in our comparison. This discrepancy may arise from differences in tissue versus blood analyses, patient cohorts, or statistical thresholds. Notably, a recent comprehensive study found that miRNAs alone (or with AFP) sometimes failed to outperform protein markers in HCC diagnosis [28]. By contrast, our analysis, which focused on tissue biopsies and included diverse cancer types, highlights miRNAs that specifically segregate HCC. For example, the tumor suppressors we identified (miR-625, miR-138, miR-548b) have been less emphasized in earlier biomarker studies, suggesting that our approach uncovered underappreciated regulators. Overall, the dissimilarity between our results and the literature (such as miR-122 and miR-215 findings [15,25]) needs future studies, and novel hits may reflect the larger, pan-cancer comparison we performed.
Several limitations of this study should be noted. Our analysis is observational and cross-sectional without external validation. We do not have patient follow-up or survival data. Thus we cannot assess whether these miRNAs predict prognosis, recurrence, or response to therapy. We also lacked detailed treatment or etiology information; for instance, it is unknown if the HCC samples arose from HBV, HCV, alcoholic, or nonalcoholic steatohepatitis etiologies, each of which can influence miRNA patterns. Moreover, all data derive from biopsy specimens. While tissue profiling reveals tumor-intrinsic changes, it remains to be determined whether the same miRNA signals are detectable and predictive in easily accessible fluids (serum or urine) for non-invasive testing. Technical factors could also limit generalizability; batch effects, RNA quality, and differences in sequencing platforms might affect miRNA calls. We applied rigorous statistical correction (FDR) and cross-validation to mitigate false positives, but validation in independent cohorts is essential. Finally, our comparisons were limited to the selected biopsy types; other relevant controls (e.g. chronic hepatitis without cirrhosis) were not included. These caveats temper our conclusions about diagnostic utility.
Based on these findings, future work should proceed in several directions. First, independent validation in larger and multi-center cohorts is needed to confirm the HCC-specific miRNA signature. Ideally, this would include early-stage HCC and high-risk patients under surveillance to assess performance in a screening context. Second, it will be crucial to test whether these miRNAs can be measured in blood or other biofluids with similar discriminatory power. Combining the top miRNAs into a quantitative assay (qPCR or digital PCR) and comparing with AFP/PIVKA-II levels could demonstrate incremental value. Third, mechanistic studies on novel hits (such as miR-208b or miR-548b in HCC) may uncover new therapeutic targets; for example, if miR-208b truly drives HCC aggressiveness, inhibiting it might have benefit. Fourth, integration with other omics (mRNA, methylation, proteomics) and clinical data through machine learning could refine a multi-modal biomarker panel. In particular, predictive modeling that incorporates miRNA expression along with imaging or serum markers may yield more robust algorithms for early HCC detection.
In conclusion, our study identifies a set of miRNAs that distinguish HCC from cirrhosis and from other tumor types. The distinct expression profiles suggest a true HCC-specific signature. The individual miRNAs we highlight largely align with known liver cancer biology, yet also introduce new candidates. Diagnostic modeling indicates that a handful of miRNAs (miR-215-5p, miR-373-3p, miR-19b-3p, miR-200b, etc.) have high potential as biomarkers. Future studies should validate these findings in clinical settings and explore their mechanistic roles. Ultimately, such miRNA panels could improve our ability to detect HCC early in at-risk patients (e.g. those with cirrhosis), thereby facilitating timely intervention and better outcomes.
Funding
None.
Conflict of Interest
The author declare that they have no conflict of interest.
Data Availability
The datasets used and analysed during the current study are available from public database Gene Expression Omnibus repository. Accession numbers of the datasets used in current study is GSE51429 in Gene Expression Omnibus (https://www.ncbi.nlm.nih.gov/geo).
Animal Studies
Not applicable.
Acknowledgments
Special Thanks to NIH team who provided Gene expression Omnibus database. Special thanks to Dr. Arman Karimi.
Authors’ Contributions
MS: Reviewing the literature, Methodology, Investigation, Conceptualization, Formal analysis, Writing – the original draft, review & and editing.
References
- D’Abundo L, Bassi C, Callegari E, Moshiri F, Guerriero P, Michilli A, et al. Circulating microRNAs as biomarkers for stratifying different phases of liver cancer progression and response to therapy. Scientific Reports. 2024;14:18551. [CrossRef]
- Alemayehu E, Belete MA, Walle M, Getu F, Mulatie Z, Teshome M, et al. Diagnostic accuracy of circulating miRNAs to discriminate hepatocellular carcinoma from liver cirrhosis: a systematic review and meta-analysis. Frontiers in Medicine. 2024;11:1359414. [CrossRef]
- Colaianni F, Zelli V, Compagnoni C, Miscione MS, Rossi M, Vecchiotti D, et al. Role of Circulating microRNAs in Liver Disease and HCC: Focus on miR-122. Genes. 2024;15:1313. [CrossRef]
- Jang JW, Kim JM, Kim HS, Kim JS, Han JW, Lee SK, et al. Diagnostic performance of serum exosomal miRNA-720 in hepatocellular carcinoma. Journal of liver cancer. 2022;22:30-9. [CrossRef]
- Wang S, Yang Y, Sun L, Qiao G, Song Y, Liu B. Exosomal microRNAs as liquid biopsy biomarkers in hepatocellular carcinoma. OncoTargets and therapy. 2020:2021-30. [CrossRef]
- Yang J, Dong W, Zhang H, Zhao H, Zeng Z, Zhang F, et al. Exosomal microRNA panel as a diagnostic biomarker in patients with hepatocellular carcinoma. Frontiers in Cell and Developmental Biology. 2022;10:927251. [CrossRef]
- Sharafeldin MA, Suef RA, Mousa AA, Ziada DH, Farag MM. Serum miRNA-101 expression signature as non-invasive diagnostic biomarker for Hepatitis C virus—associated hepatocellular carcinoma in Egyptian patients. Scientific Reports. 2025;15:645. [CrossRef]
- Eldosoky MA, Hammad R, Elmadbouly AA, Aglan RB, AbdelHamid SG, Alboraie M, et al. Diagnostic significance of hsa-miR-21-5p, hsa-miR-192-5p, hsa-miR-155-5p, hsa-miR-199a-5p panel and ratios in hepatocellular carcinoma on top of liver cirrhosis in HCV-infected patients. International journal of molecular sciences. 2023;24:3157. [CrossRef]
- Mallela VR, Rajtmajerová M, Trailin A, Liška V, Hemminki K, Ambrozkiewicz F. miRNA and lncRNA as potential tissue biomarkers in hepatocellular carcinoma. Non-coding RNA research. 2024;9:24-32. [CrossRef]
- Lv Y, Sun X. Role of miRNA in pathogenesis, diagnosis, and prognosis in hepatocellular carcinoma. Chemical Biology & Drug Design. 2024;103:e14352.
- Vincent M, Perell K, Nielsen FC, Daugaard G, Hansen NR. Modeling tissue contamination to improve molecular identification of the primary tumor site of metastases. Bioinformatics. 2014;30:1417-23. [CrossRef]
- Zhou X, Zhang C, Lu S, Chen G, Li L, Liu L, et al. miR-625 suppresses tumour migration and invasion by targeting IGF2BP1 in hepatocellular carcinoma. Oncogene. 2015;34:965-77. [CrossRef]
- Liu C, Zhu J, Liu F, Wang Y, Zhu M. MicroRNA-138 targets SP1 to inhibit the proliferation, migration and invasion of hepatocellular carcinoma cells. Oncology Letters. 2018;15:1279-86.
- Qiu H, Zhang G, Song B, Jia J. MicroRNA-548b inhibits proliferation and invasion of hepatocellular carcinoma cells by directly targeting specificity protein 1. Experimental and therapeutic medicine. 2019;18:2332-40. [CrossRef]
- Fu X, Calin GA. miR-122 and hepatocellular carcinoma: from molecular biology to therapeutics. EBioMedicine. 2018;37:17-8. [CrossRef]
- Guo X, Lv X, Lv X, Ma Y, Chen L, Chen Y. Circulating miR-21 serves as a serum biomarker for hepatocellular carcinoma and correlated with distant metastasis. Oncotarget. 2017;8:44050. [CrossRef]
- Koustas E, Trifylli E-M, Sarantis P, Papadopoulos N, Papanikolopoulos K, Aloizos G, et al. An insight into the arising role of MicroRNAs in hepatocellular carcinoma: future diagnostic and therapeutic approaches. International Journal of Molecular Sciences. 2023;24:7168. [CrossRef]
- Yu P, Wu D, You Y, Sun J, Lu L, Tan J, et al. miR-208-3p promotes hepatocellular carcinoma cell proliferation and invasion through regulating ARID2 expression. Experimental cell research. 2015;336:232-41. [CrossRef]
- Zhai H, Zhong S, Wu R, Mo Z, Zheng S, Xue J, et al. Suppressing circIDE/miR-19b-3p/RBMS1 axis exhibits promoting-tumour activity through upregulating GPX4 to diminish ferroptosis in hepatocellular carcinoma. Epigenetics. 2023;18:2192438. [CrossRef]
- Cho HJ, Eun JW, Baek GO, Seo CW, Ahn HR, Kim SS, et al. Serum exosomal microRNA, miR-10b-5p, as a potential diagnostic biomarker for early-stage hepatocellular carcinoma. Journal of Clinical Medicine. 2020;9:281. [CrossRef]
- Zhao X-F, Li N, Lin D-D, Sun L-B. Circulating MicroRNA-122 for the Diagnosis of Hepatocellular Carcinoma: A Meta-Analysis. BioMed research international. 2020;2020:5353695.
- Bharali D, Banerjee BD, Bharadwaj M, Husain SA, Kar P. Expression analysis of MicroRNA-21 and MicroRNA-122 in hepatocellular carcinoma. Journal of clinical and experimental hepatology. 2019;9:294-301.
- Shi T, Morishita A, Kobara H, Masaki T. The role of long non-coding RNA and microRNA networks in hepatocellular carcinoma and its tumor microenvironment. International journal of molecular sciences. 2021;22:10630. [CrossRef]
- Mjelle R, Dima SO, Bacalbasa N, Chawla K, Sorop A, Cucu D, et al. Comprehensive transcriptomic analyses of tissue, serum, and serum exosomes from hepatocellular carcinoma patients. BMC cancer. 2019;19:1-13. [CrossRef]
- Zhang H, Lan X, Cai L, Gao X, Gao F, Yu D, et al. miR-215-5p plays a key role in suppressing vascular invasion and recurrence in hepatocellular carcinoma by blocking vasculogenic mimicry. Frontiers in Bioscience-Elite. 2024;16:6. [CrossRef]
- Li H, Wang N, Xu Y, Chang X, Ke J, Yin J. Upregulating microRNA-373-3p promotes apoptosis and inhibits metastasis of hepatocellular carcinoma cells. Bioengineered. 2022;13:1304-19. [CrossRef]
- Mao Y, Chen W, Wu H, Liu C, Zhang J, Chen S. Mechanisms and functions of MiR-200 family in hepatocellular carcinoma. OncoTargets and therapy. 2021:13479-90. [CrossRef]
- Malik J, Klammer M, Rolny V, Chan HL-Y, Piratvisuth T, Tanwandee T, et al. Comprehensive evaluation of microRNA as a biomarker for the diagnosis of hepatocellular carcinoma. World journal of gastroenterology. 2022;28:3917. [CrossRef]
Figure 1.
Principal Component Analysis (PCA) of miRNA Expression Profiles. Scores plot of the first two principal components (PC1 and PC2) derived from normalized expression values of 333 tissue biopsies. Red circles represent hepatocellular carcinoma (HCC) samples (n = 25) and blue squares represent all other biopsy types (n = 308). While some clustering tendency is observed, there is noticeable overlap between the HCC and non-HCC groups, suggesting partial but not complete separation in global miRNA expression profiles.
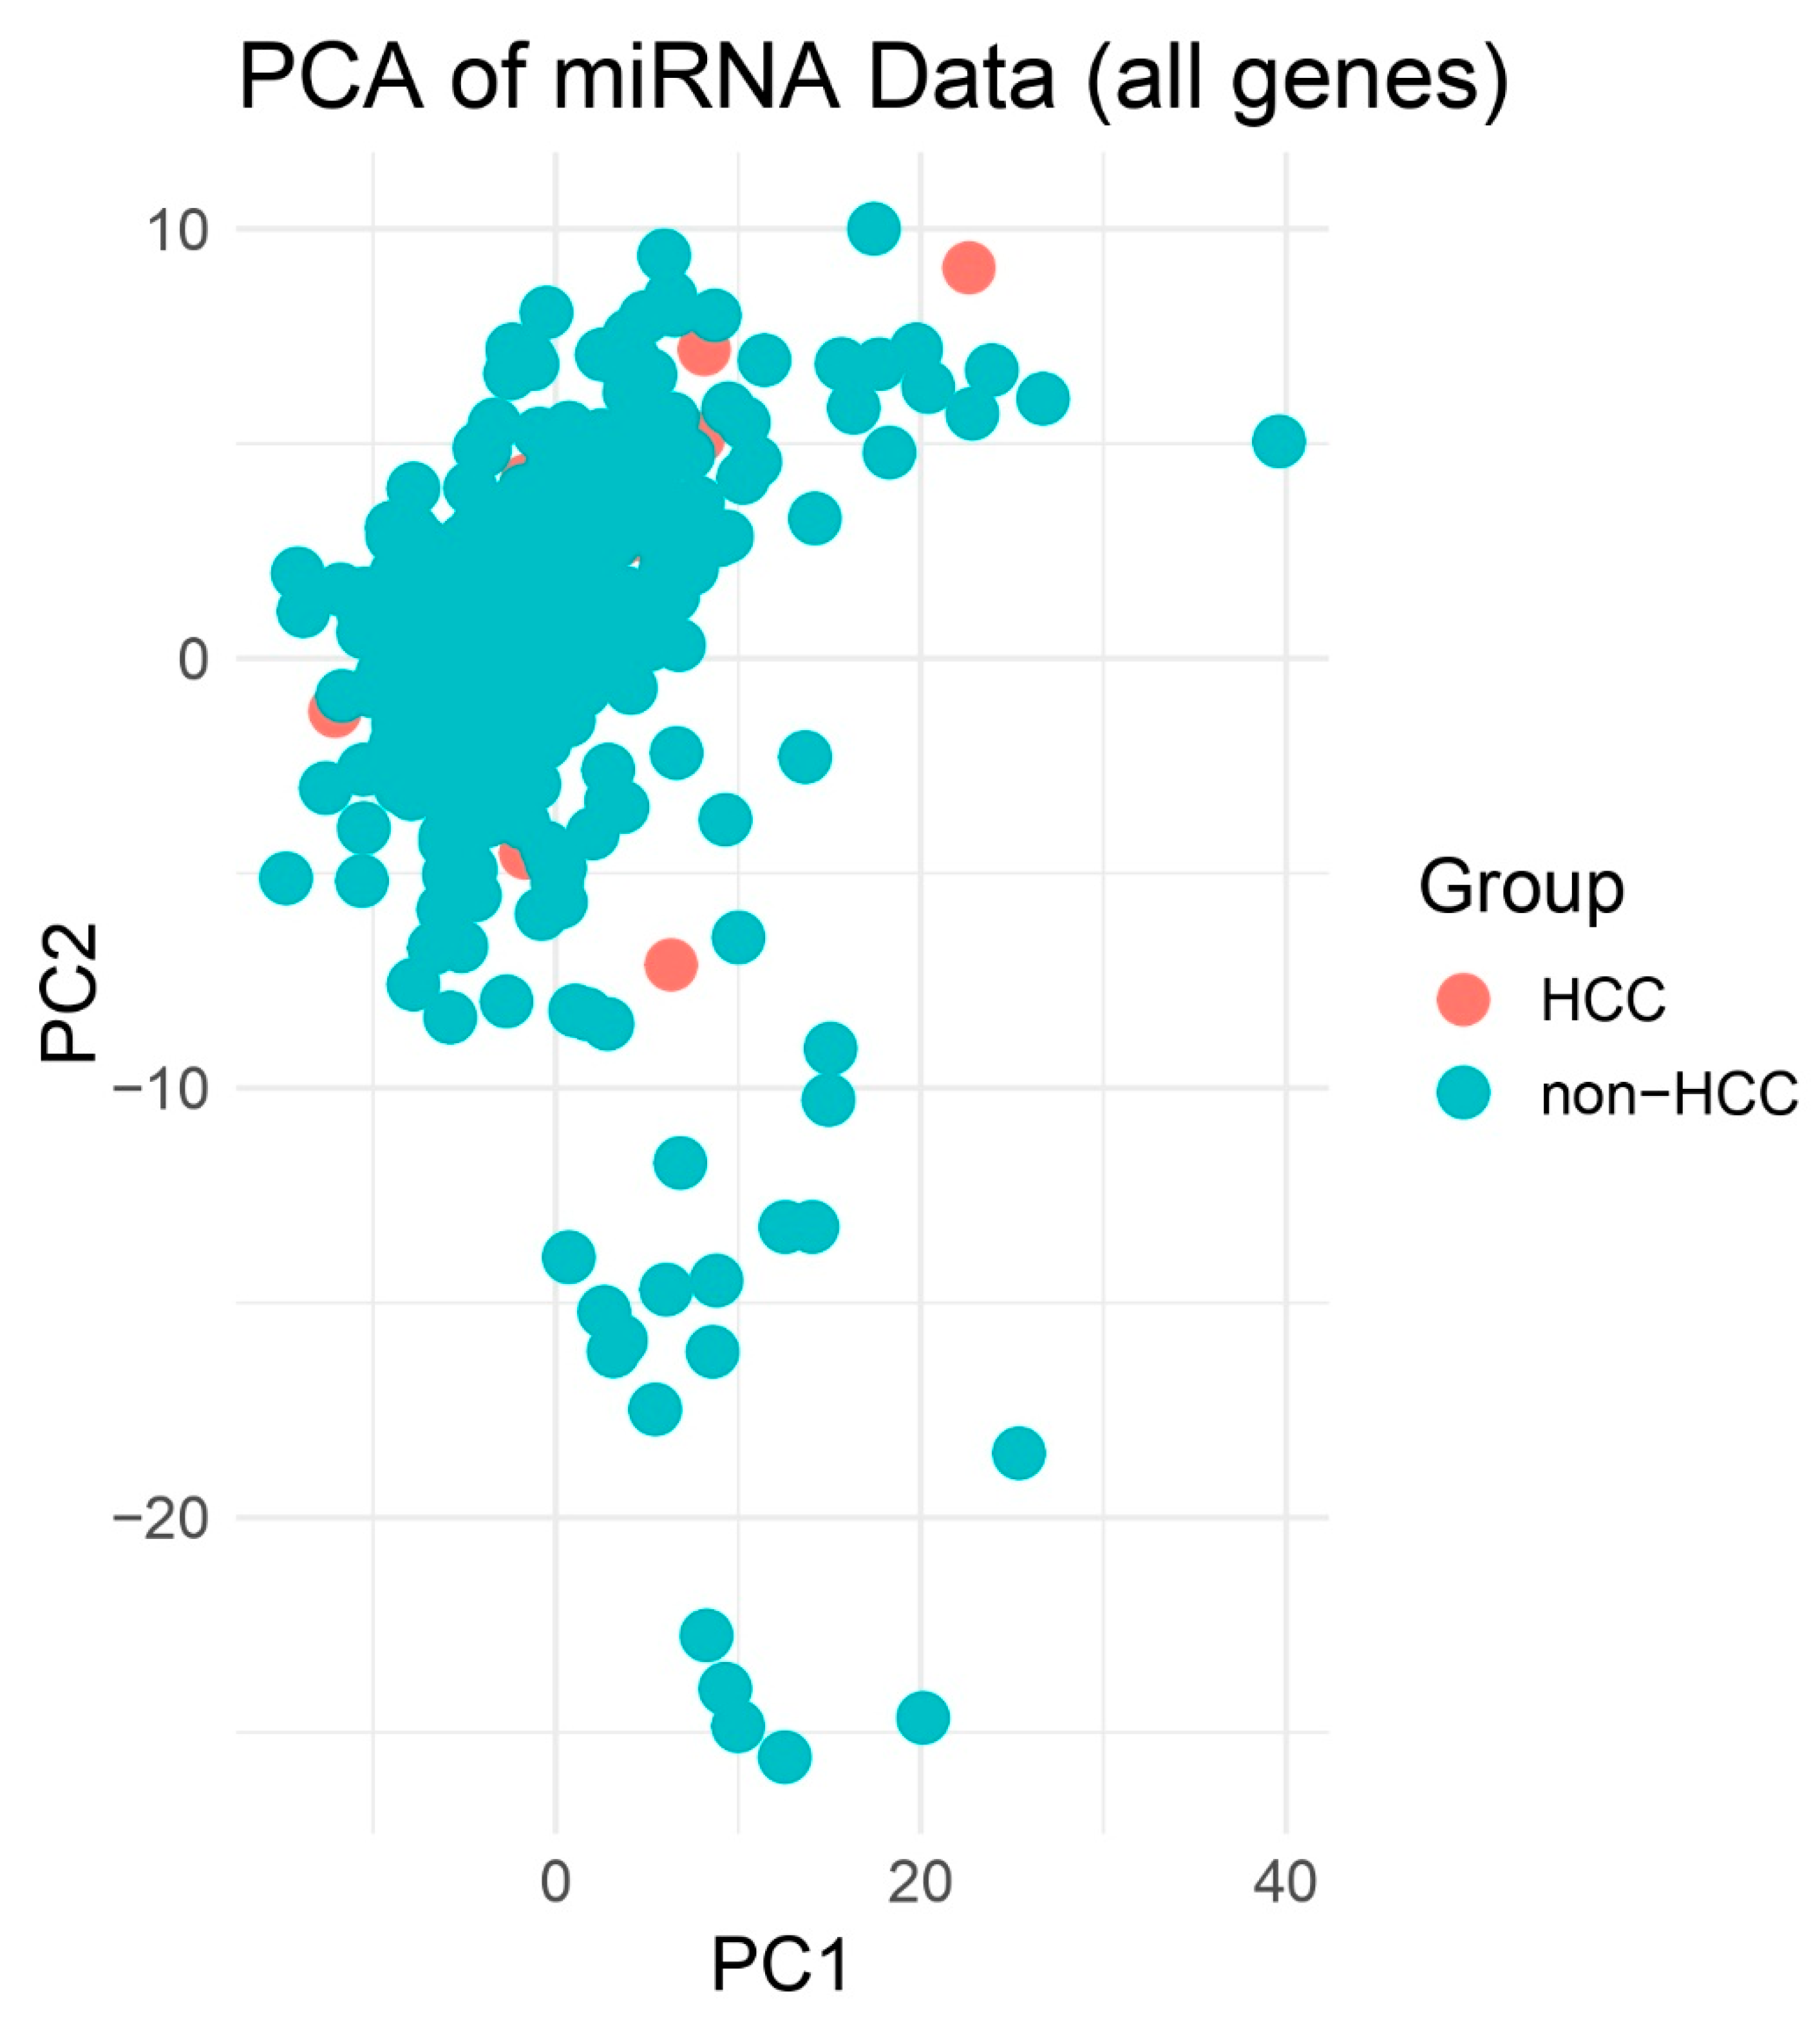
Figure 2.
PCA Highlighting Group Separation. PCA plot of PCs 1–2 illustrating clustering of HCC (red) apart from other biopsies (blue). Although no decision boundary is plotted, spatial separation is more apparent between HCC and non-HCC samples compared to the 2D PCA. This enhanced dimensionality highlights clearer group-level differences in miRNA expression profiles.
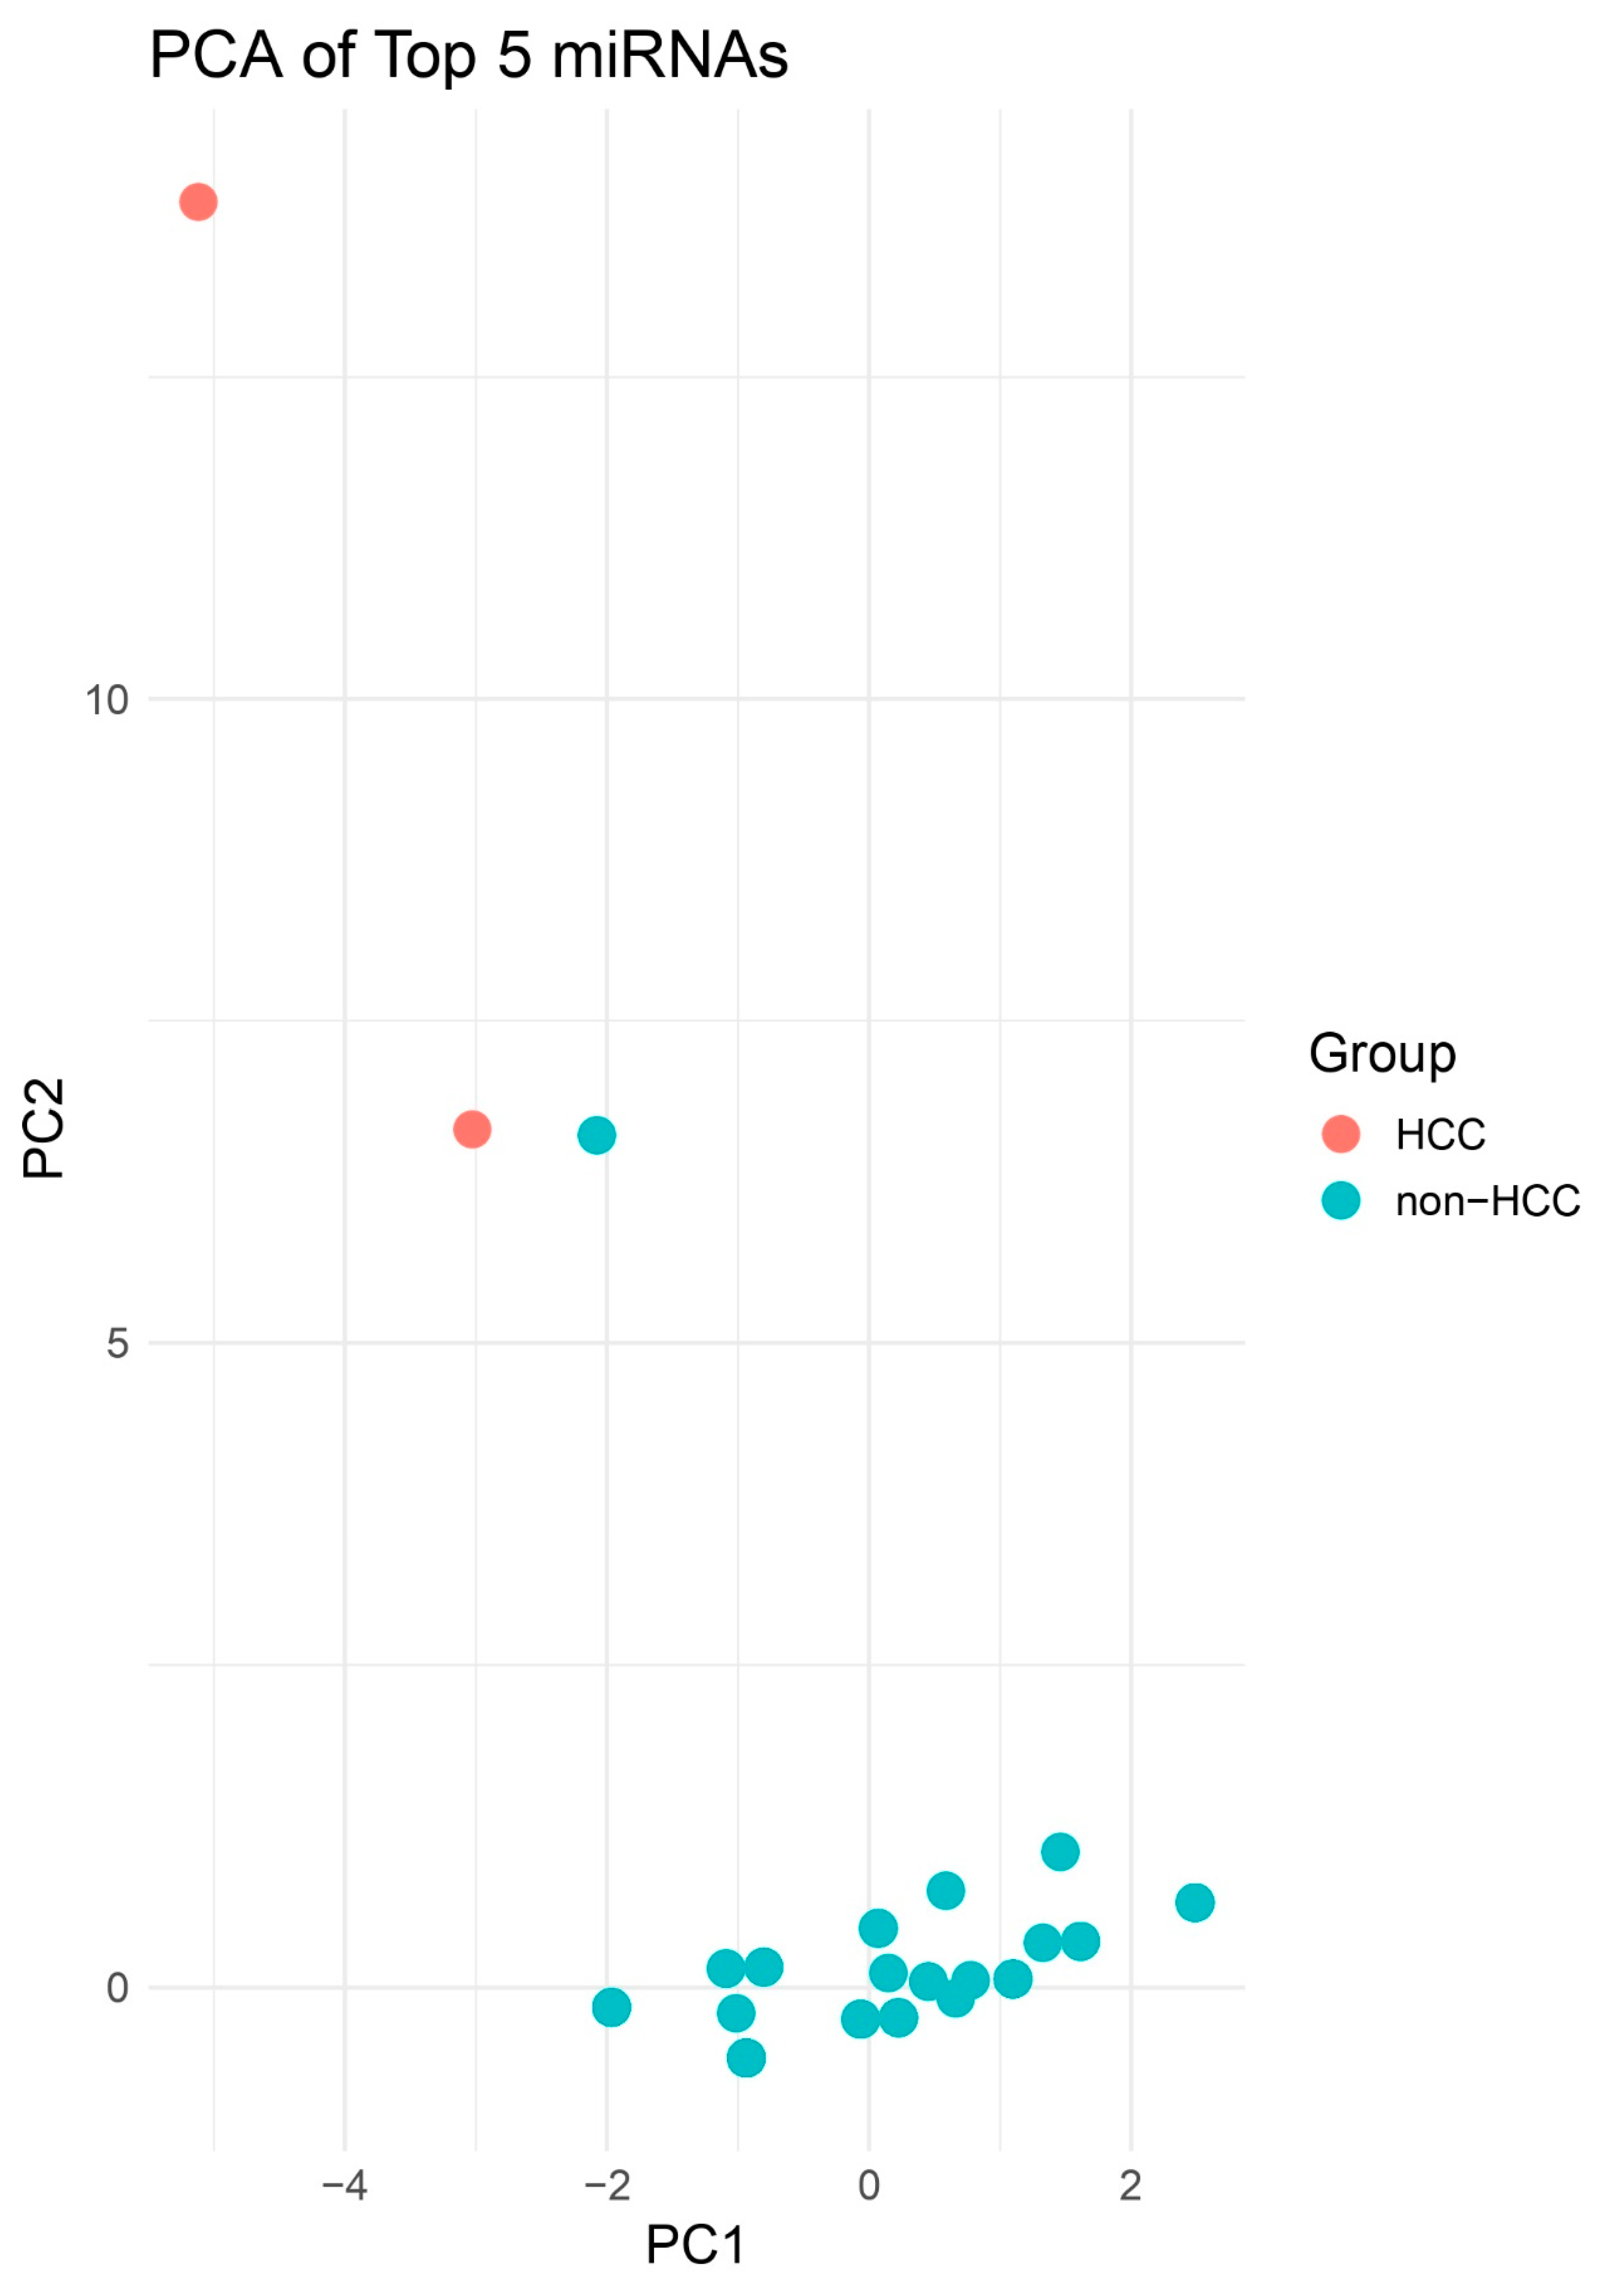
Figure 3.
Heatmap of All miRNAs Across HCC and Other Biopsies. Unsupervised hierarchical clustering heatmap displaying scaled expression (Z-score) of all profiled miRNAs in HCC versus non-HCC biopsies. Distinct clustering of sample groups underscores a global miRNA signature that discriminates HCC from other liver and other pathologies.
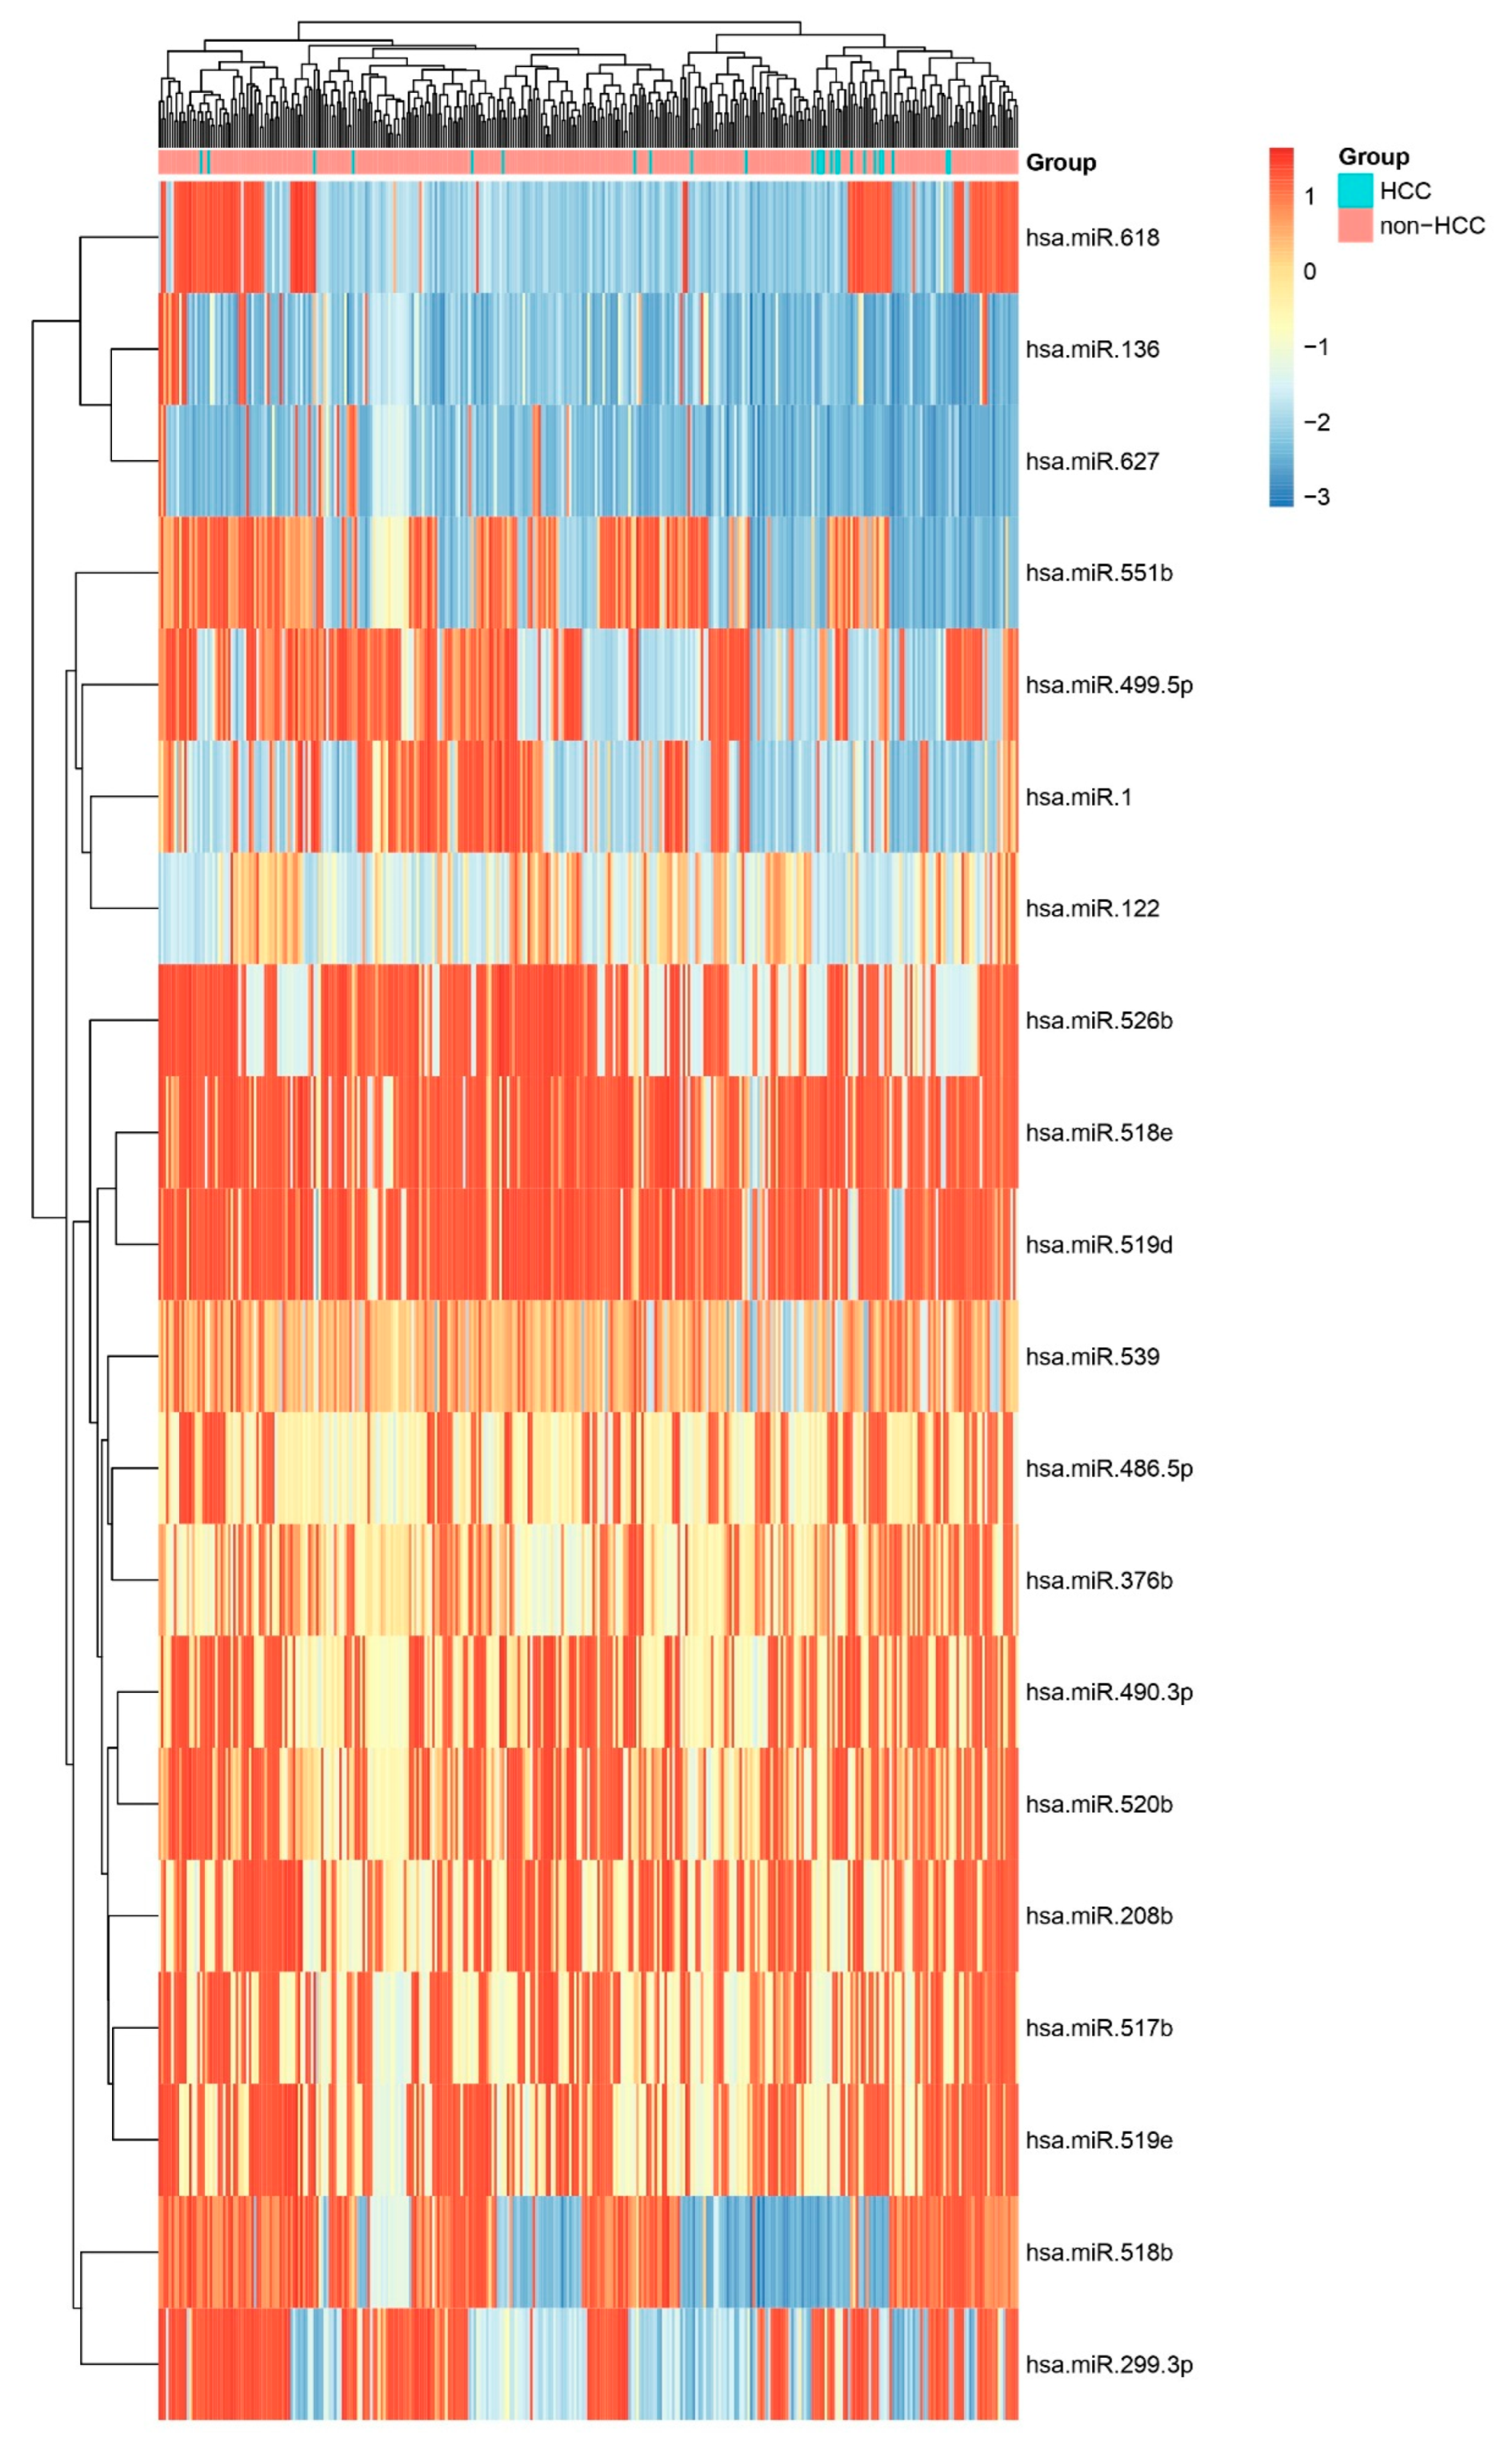
Figure 4.
Heatmap of Top Five Differentially Expressed miRNAs. Heatmap showing relative expression of the five most significant miRNAs (hsa-miR-625, hsa-miR-208b, hsa-miR-138, hsa-miR-122, hsa-miR-548b-3p) across HCC and non-HCC samples. Consistent up- or down-regulation in HCC confirms their potential as diagnostic biomarkers.
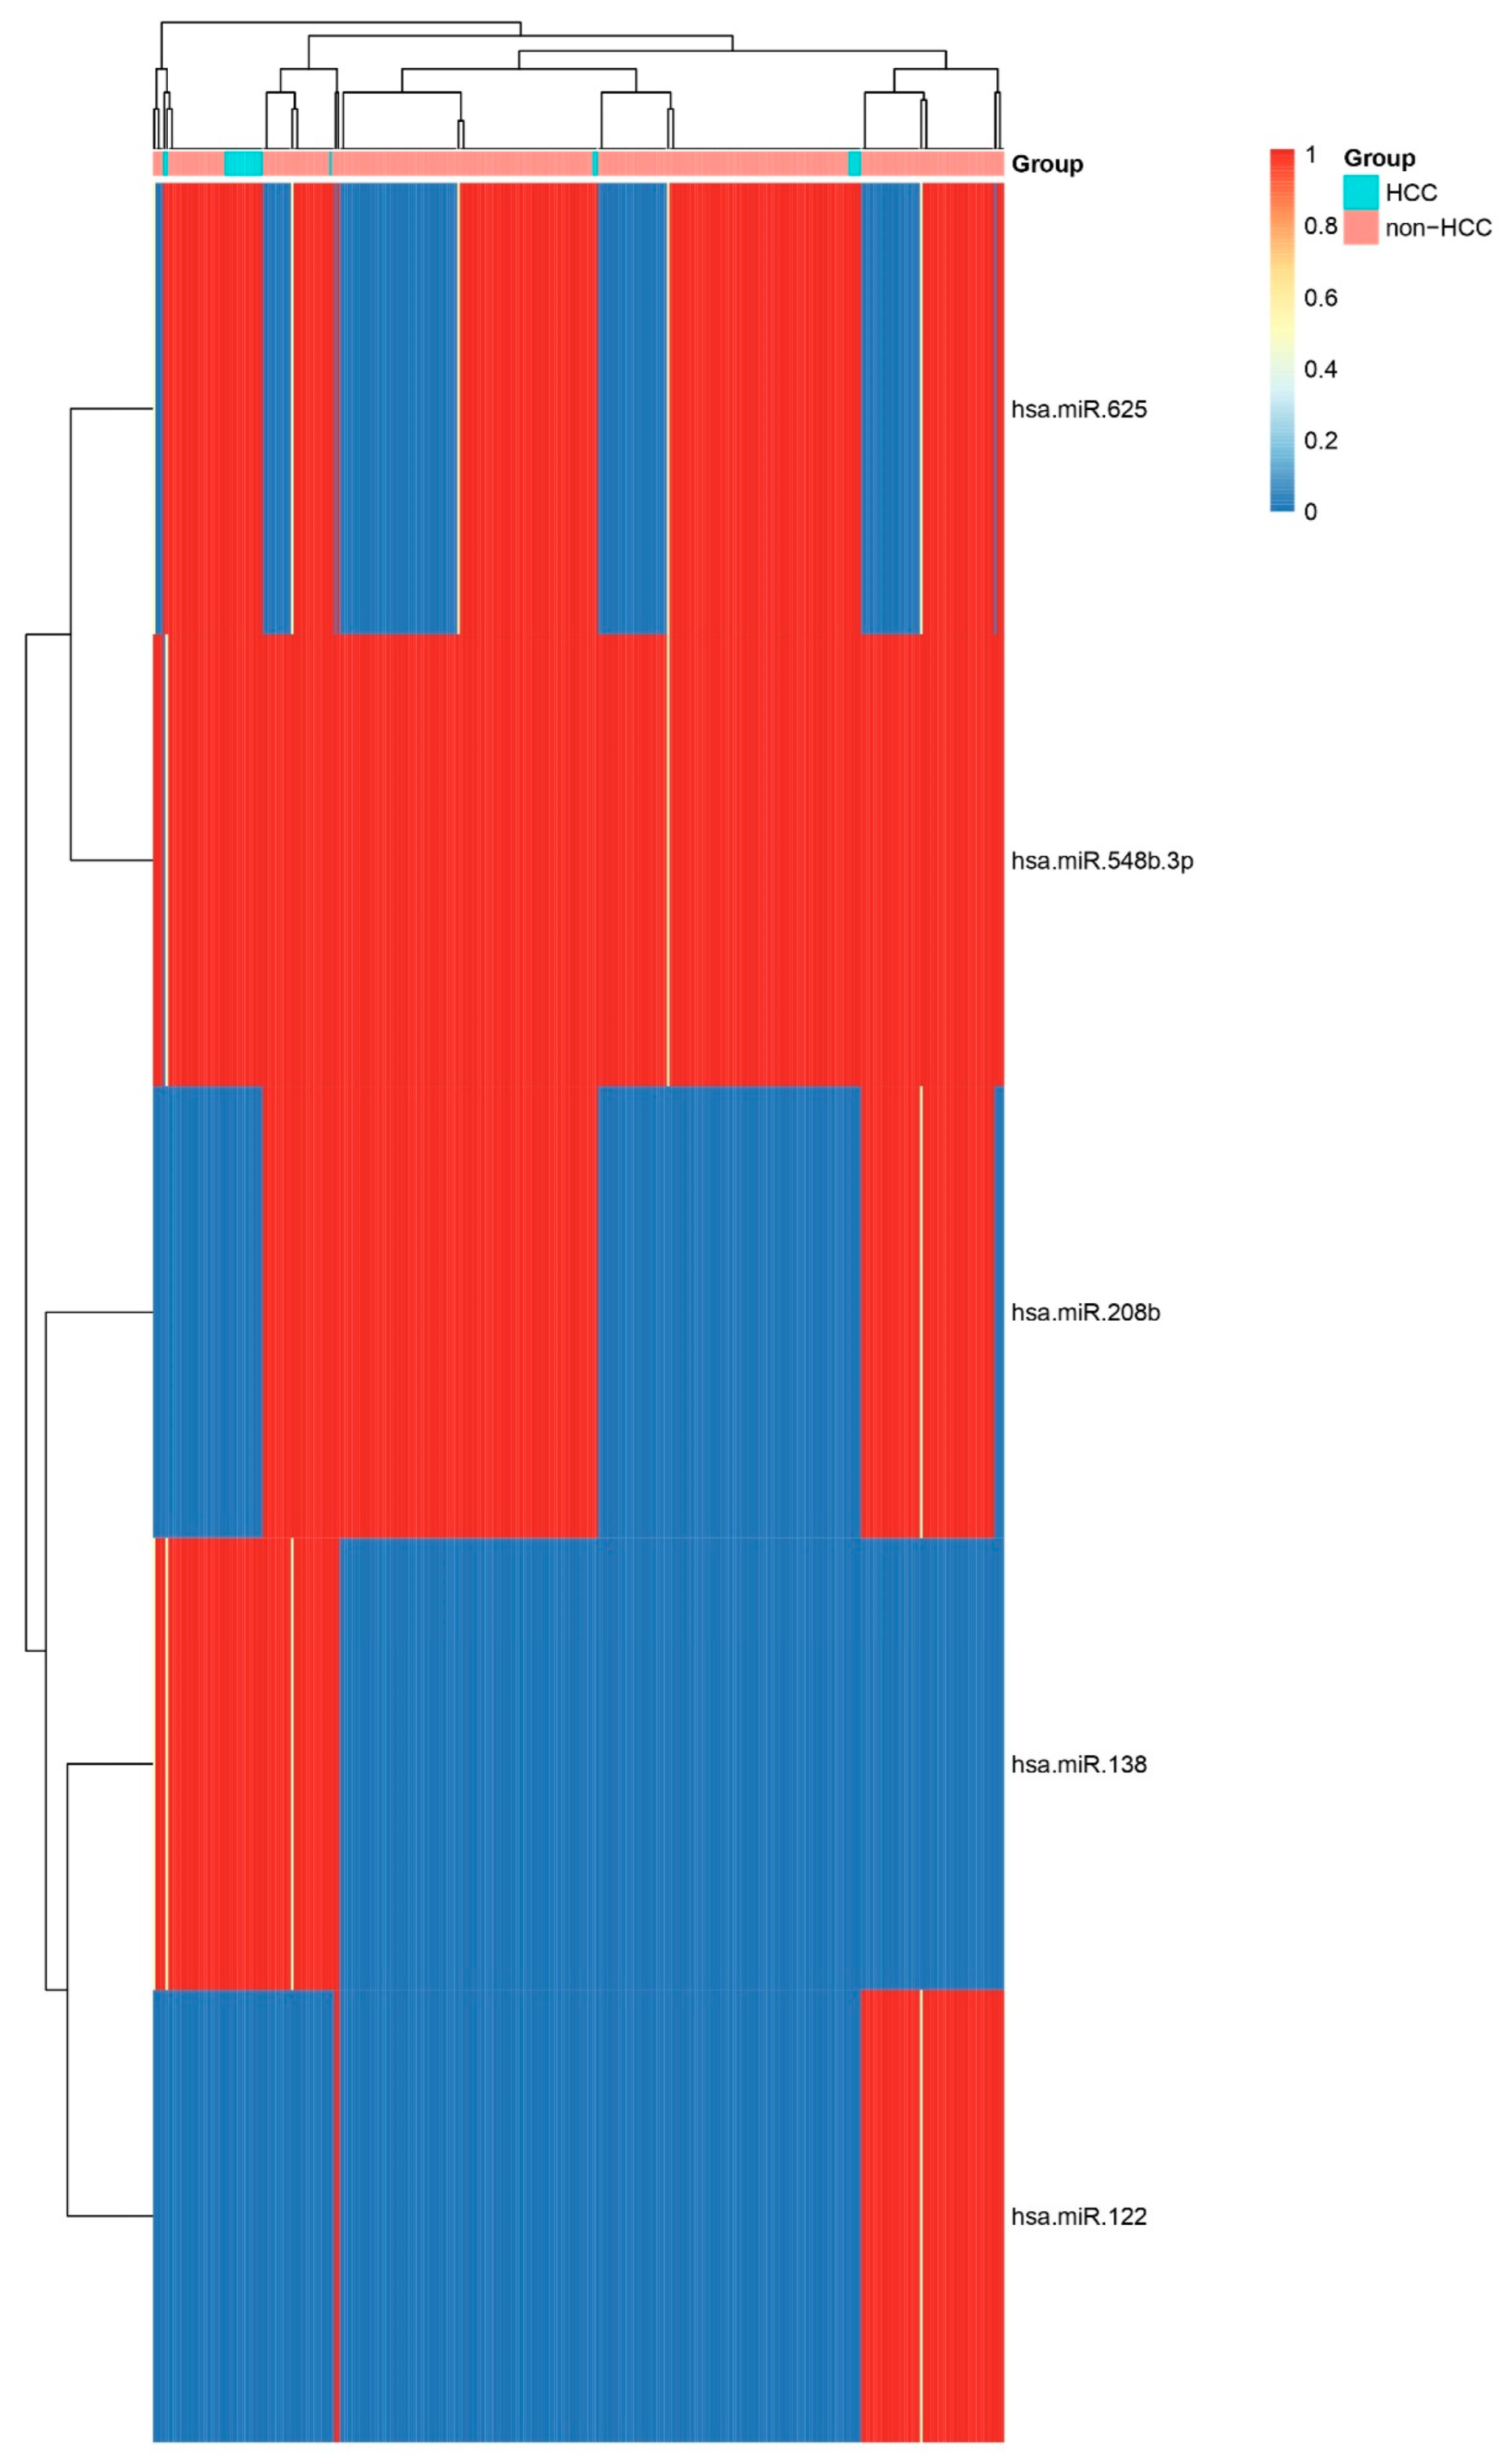
Figure 5.
Volcano Plot of Differential miRNA Expression. Volcano plot of log2 fold change versus –log10 FDR-adjusted p-value for miRNAs comparing HCC to other biopsies. Key upregulated miRNAs (e.g., hsa-miR-369-3p, hsa-miR-122, hsa-miR-208b, and hsa-miR-548b-3p) and downregulated miRNAs (e.g., hsa-miR-200c, hsa-miR-187, hsa-miR-138, and hsa-miR-198) are labelled.
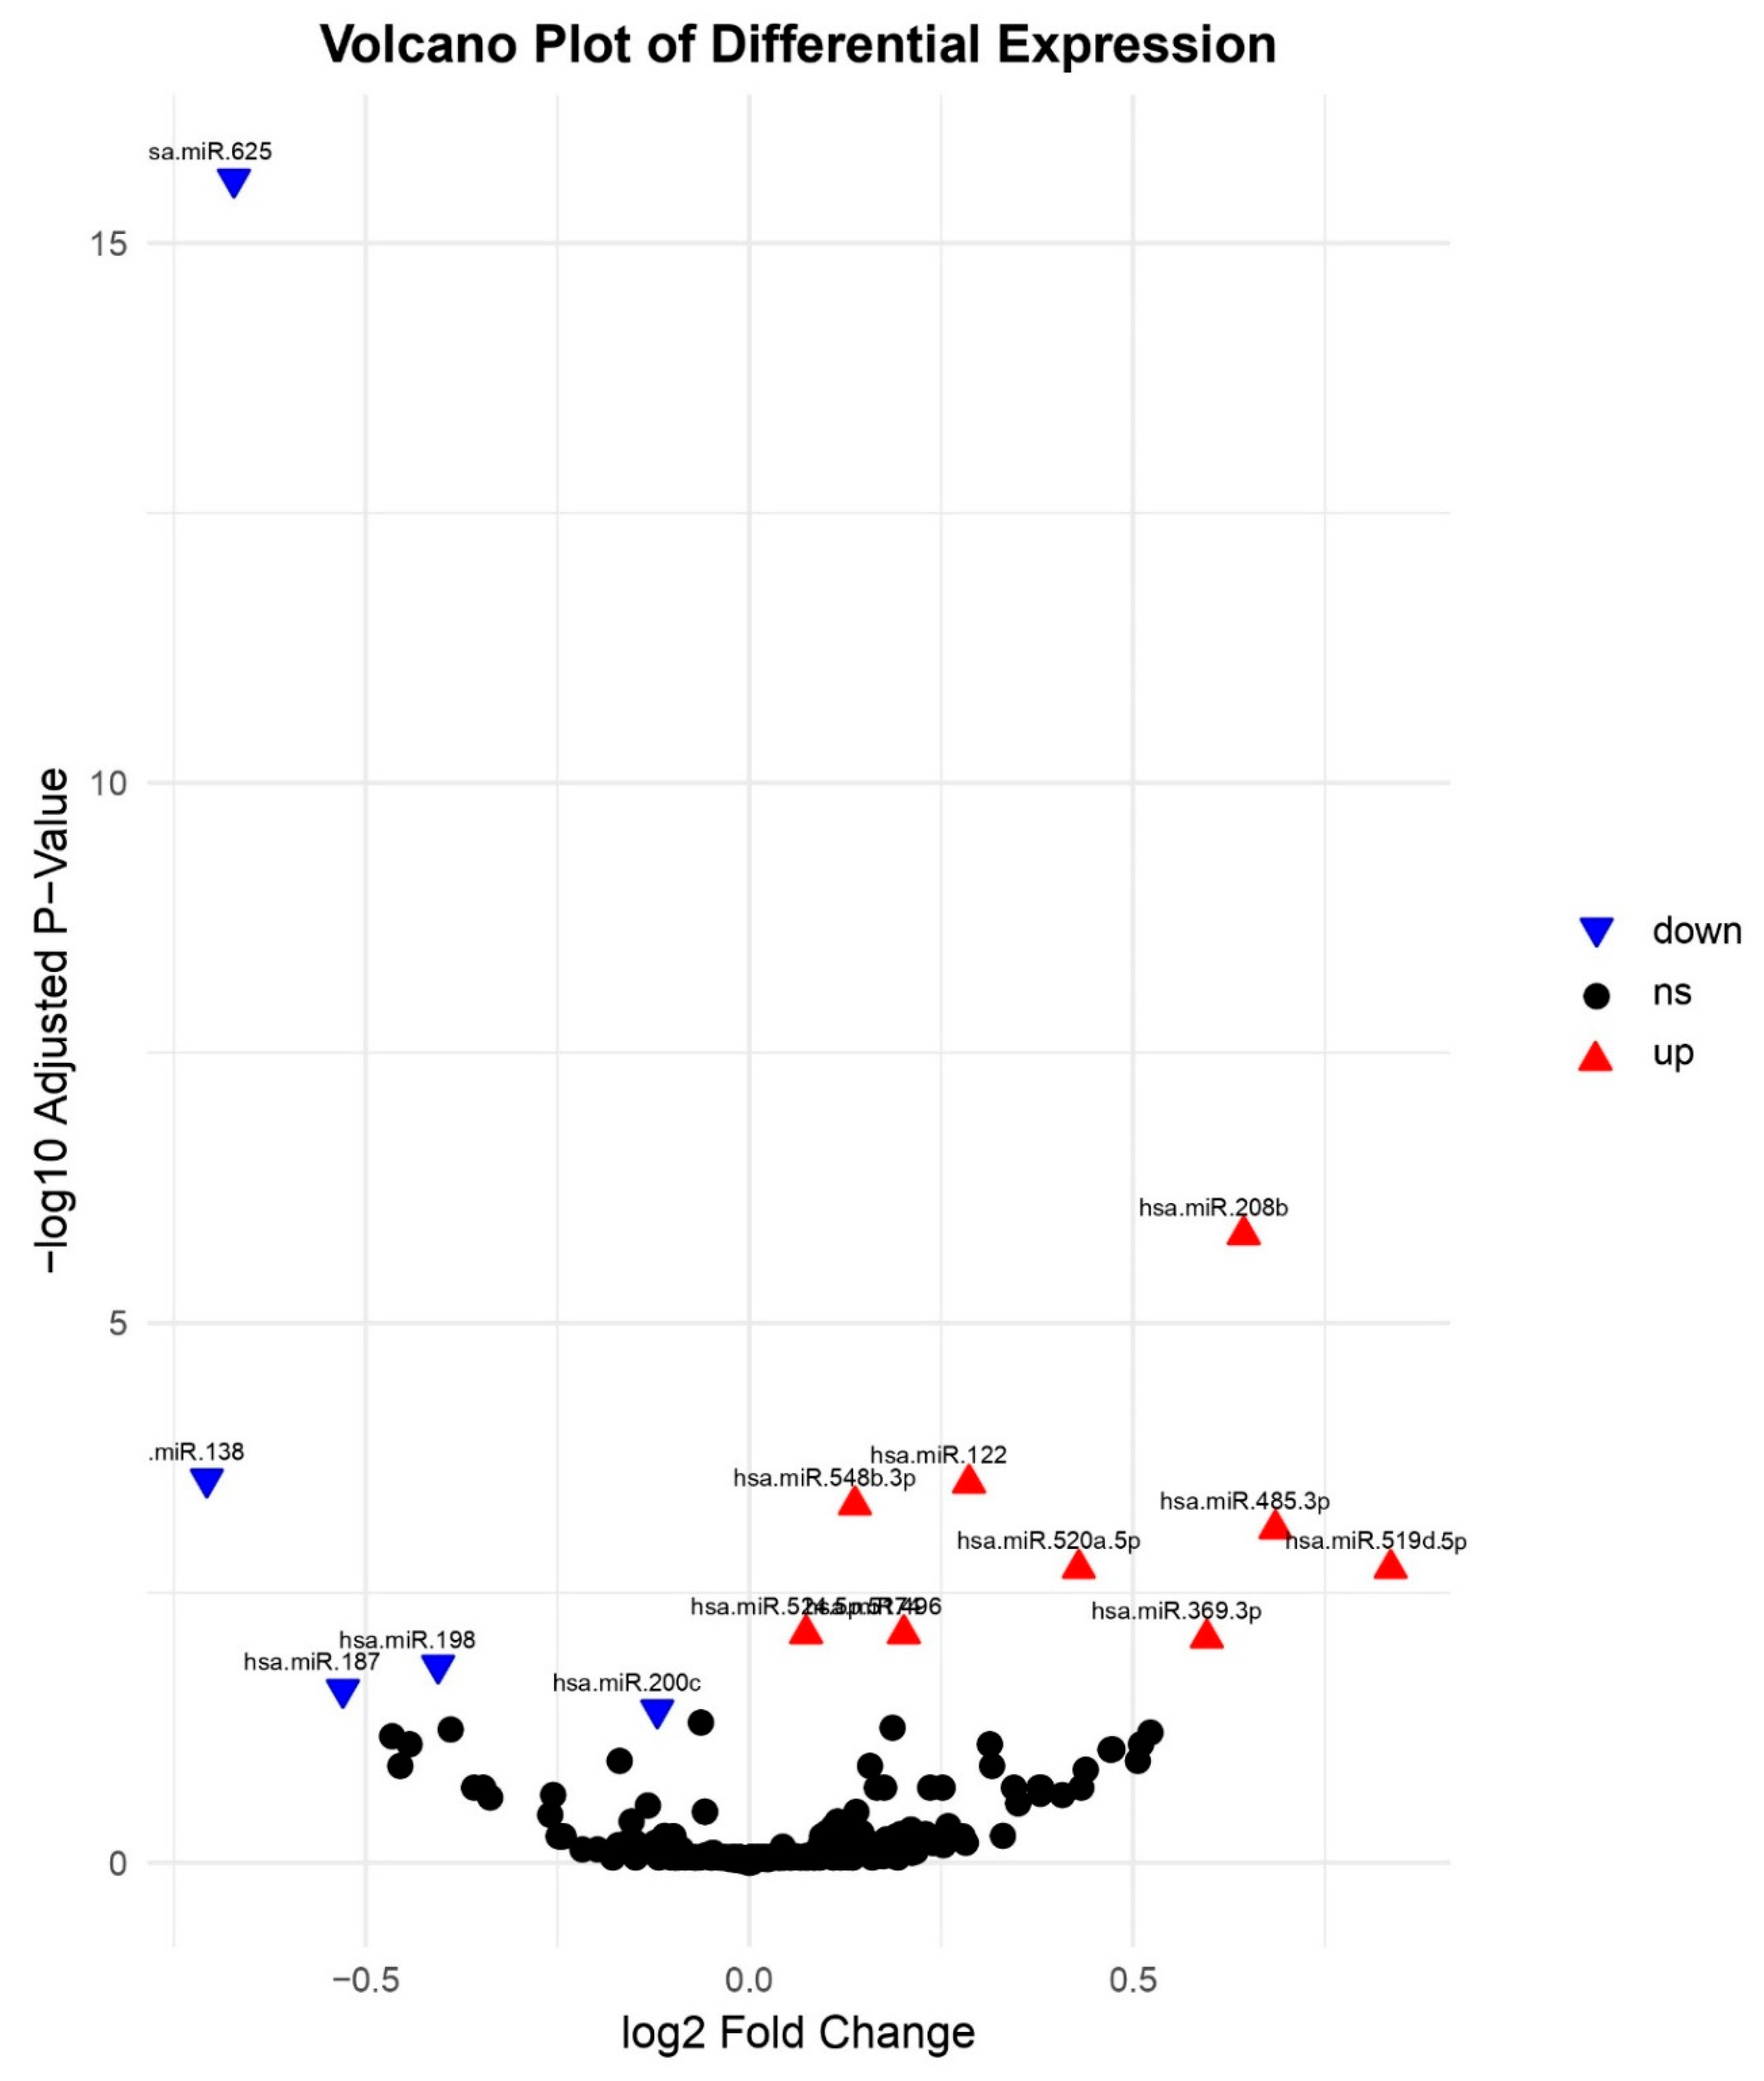
Figure 6.
LASSO Coefficient Profiles for miRNA Feature Selection. LASSO path showing coefficient shrinkage as a function of the penalty parameter (λ). Vertical dashed line indicates the optimal λ (via 10-fold cross-validation) selecting non-zero miRNA coefficients (see Table 2).
Figure 6.
LASSO Coefficient Profiles for miRNA Feature Selection. LASSO path showing coefficient shrinkage as a function of the penalty parameter (λ). Vertical dashed line indicates the optimal λ (via 10-fold cross-validation) selecting non-zero miRNA coefficients (see Table 2).
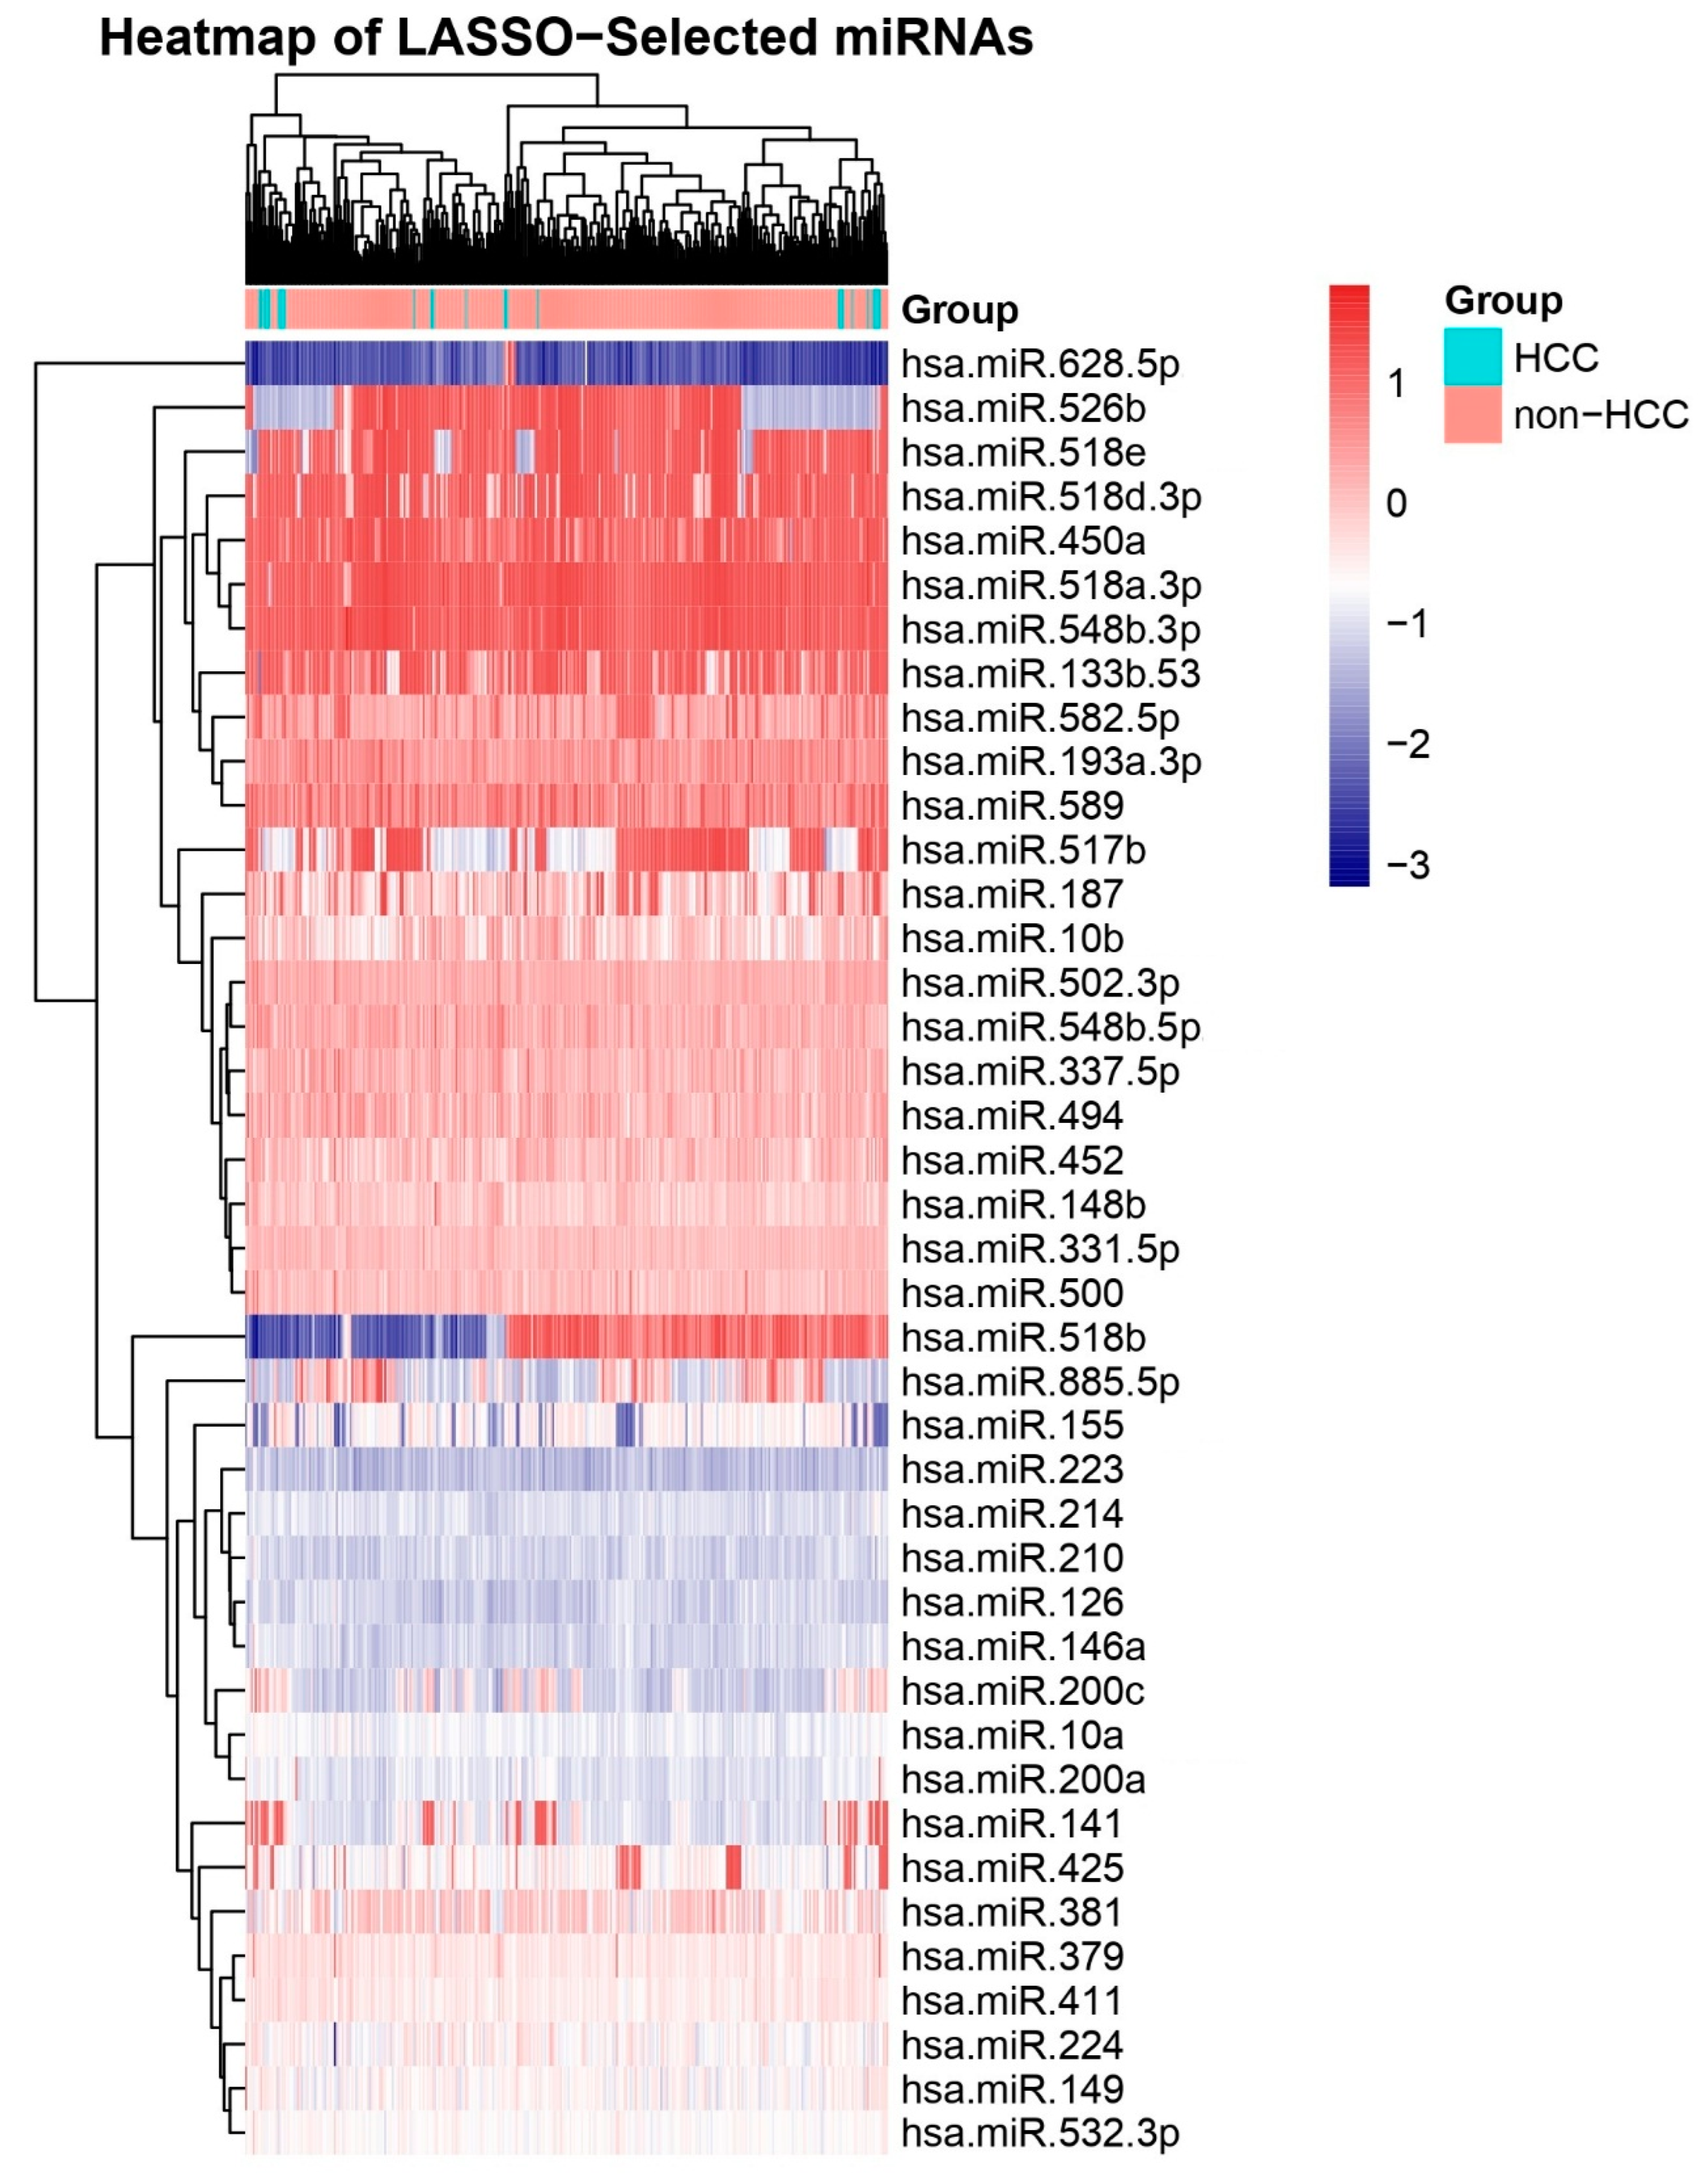
Figure 7.
Receiver Operating Characteristic (ROC) Curves for Top Candidate miRNAs. ROC curves for four miRNAs with highest diagnostic performance: hsa-miR-215-5p (AUC = 0.947), hsa-miR-373-3p (AUC = 0.902), hsa-miR-19b-3p (AUC = 0.875), and hsa-miR-200b-3p (AUC = 0.873). Diagonal line represents no-discrimination reference. Other ROCs represent the utility of miRNAs were found by Limma analysis.
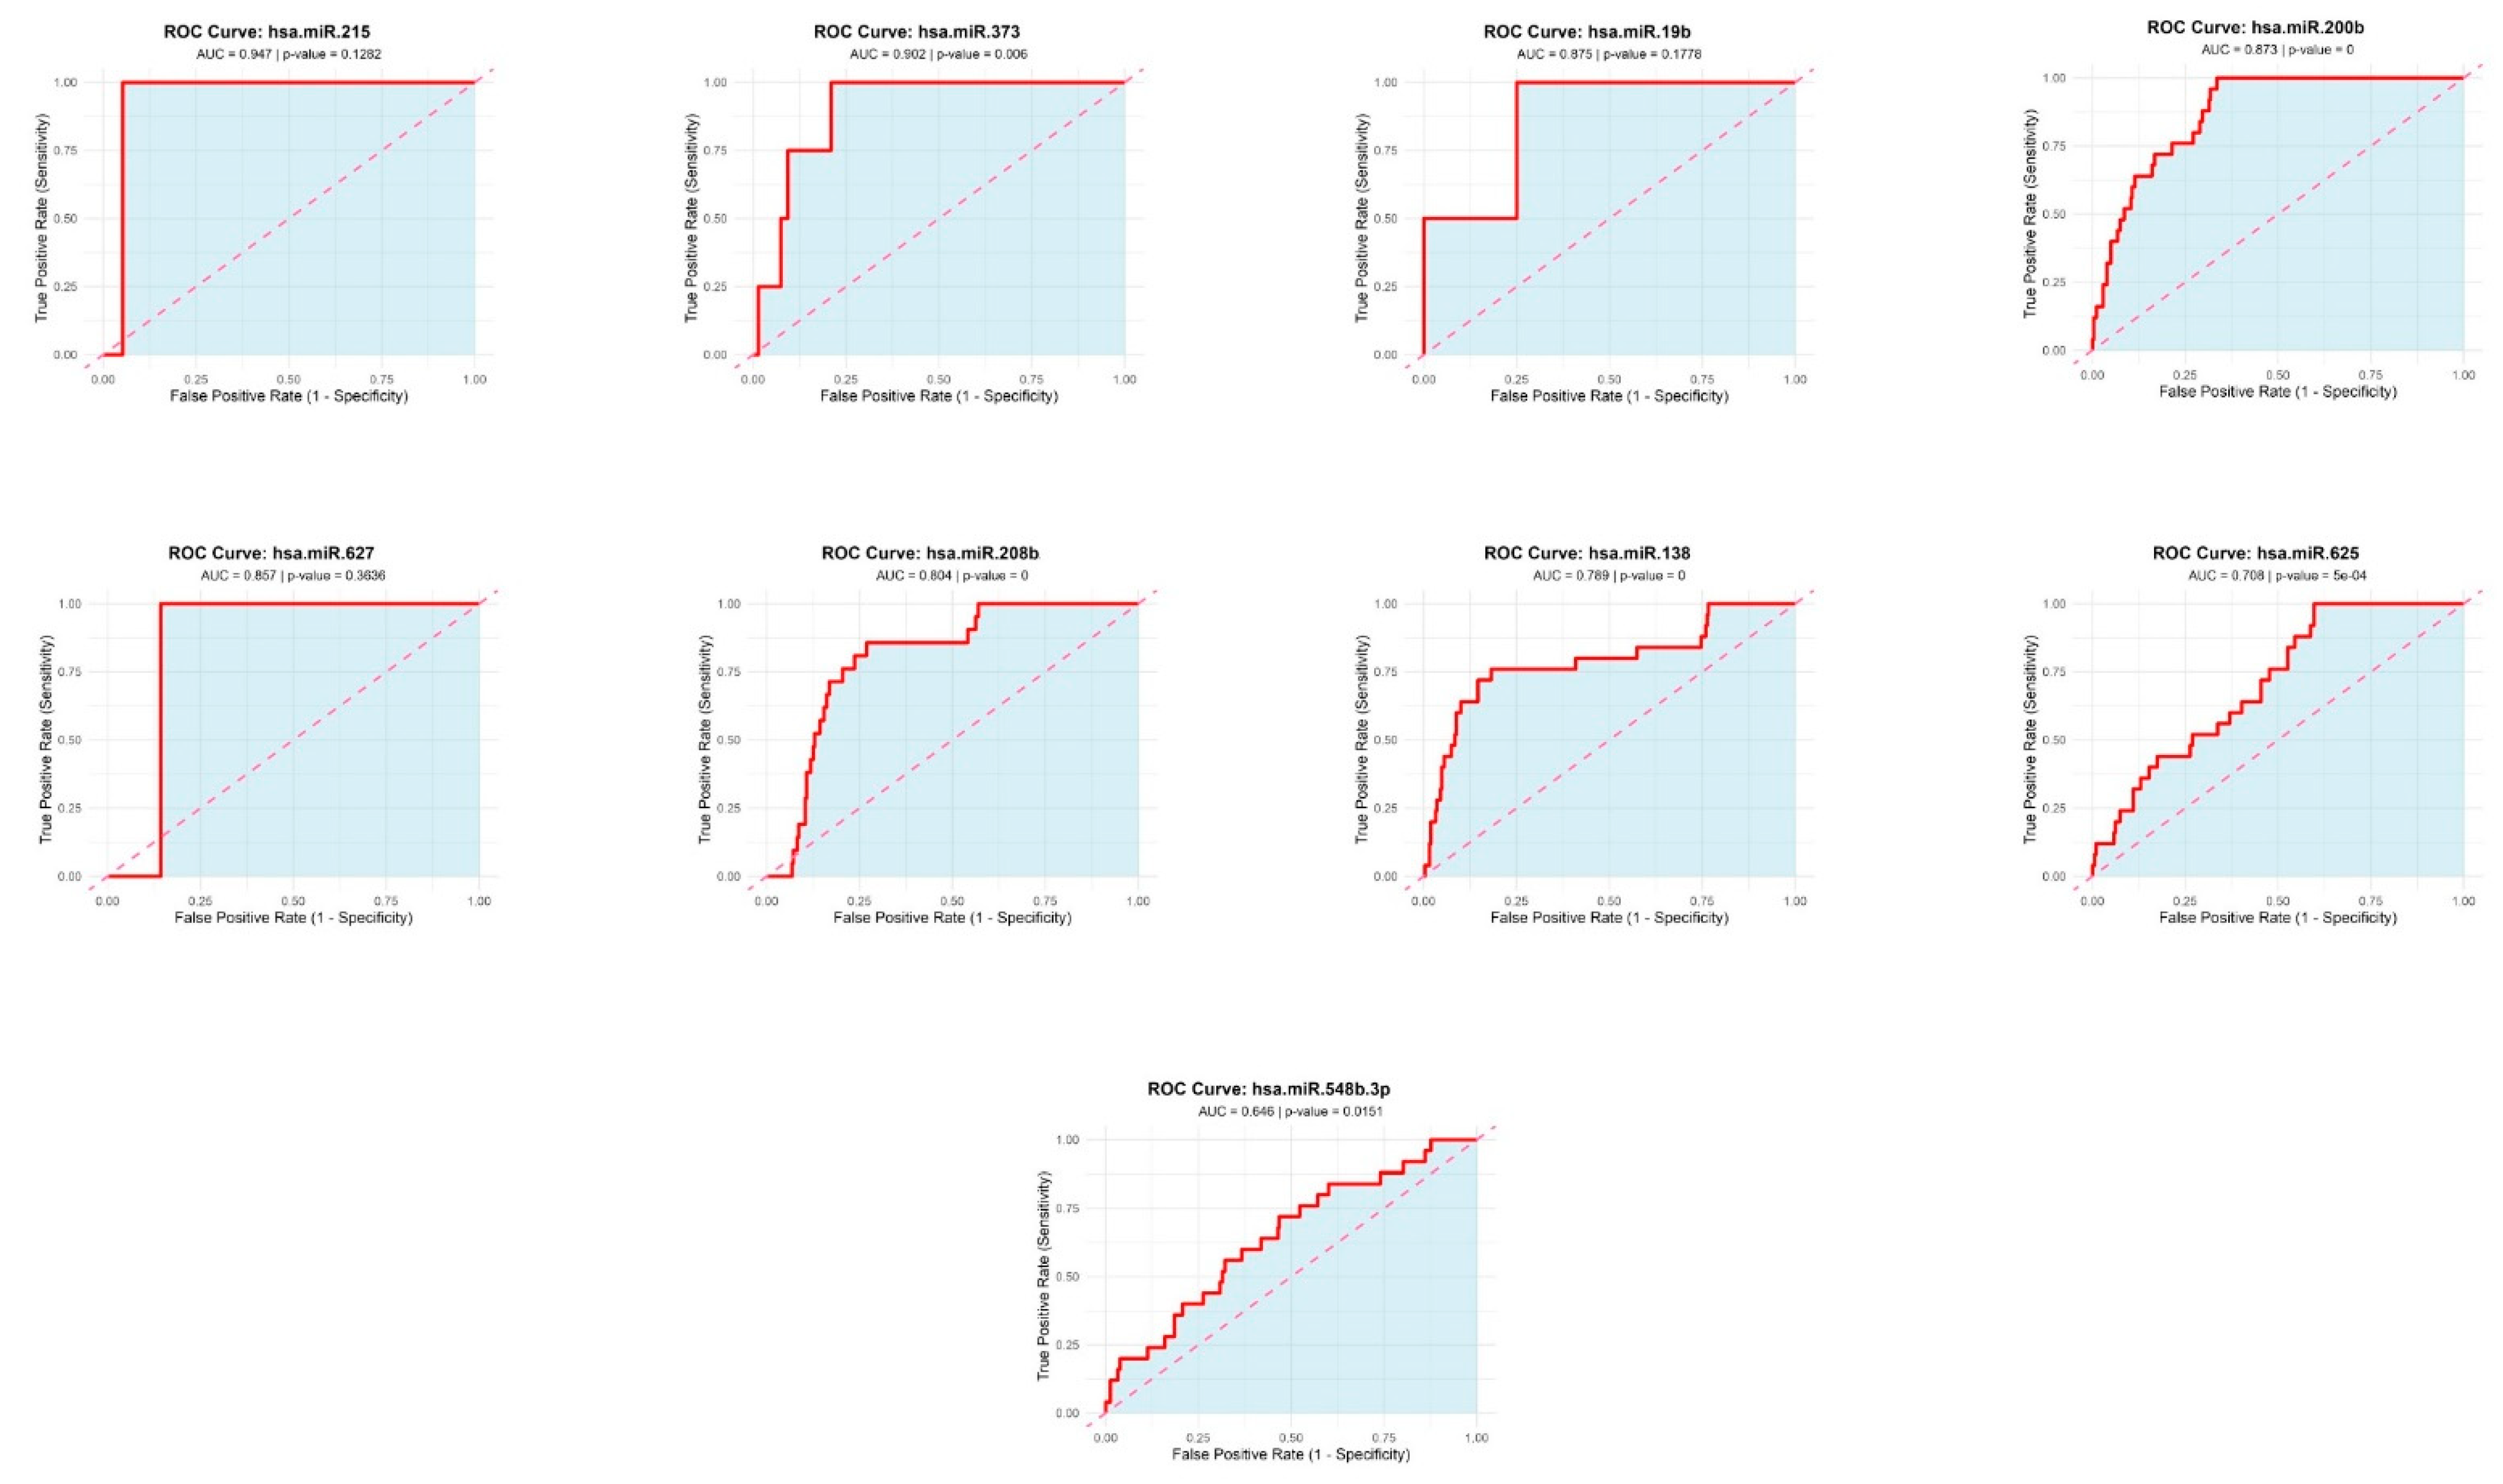
Figure 8.
PCA of miRNA Expression Profiles. Scores plot of the first two principal components (PC1 and PC2) derived from normalized expression values of 333 tissue biopsies. Blue circles represent HCC samples (n = 25) and red squares represent cirrhosis (n = 30). PCA demonstrates clear separation of HCC versus cirrhosis groups, indicating distinct global miRNA expression patterns.
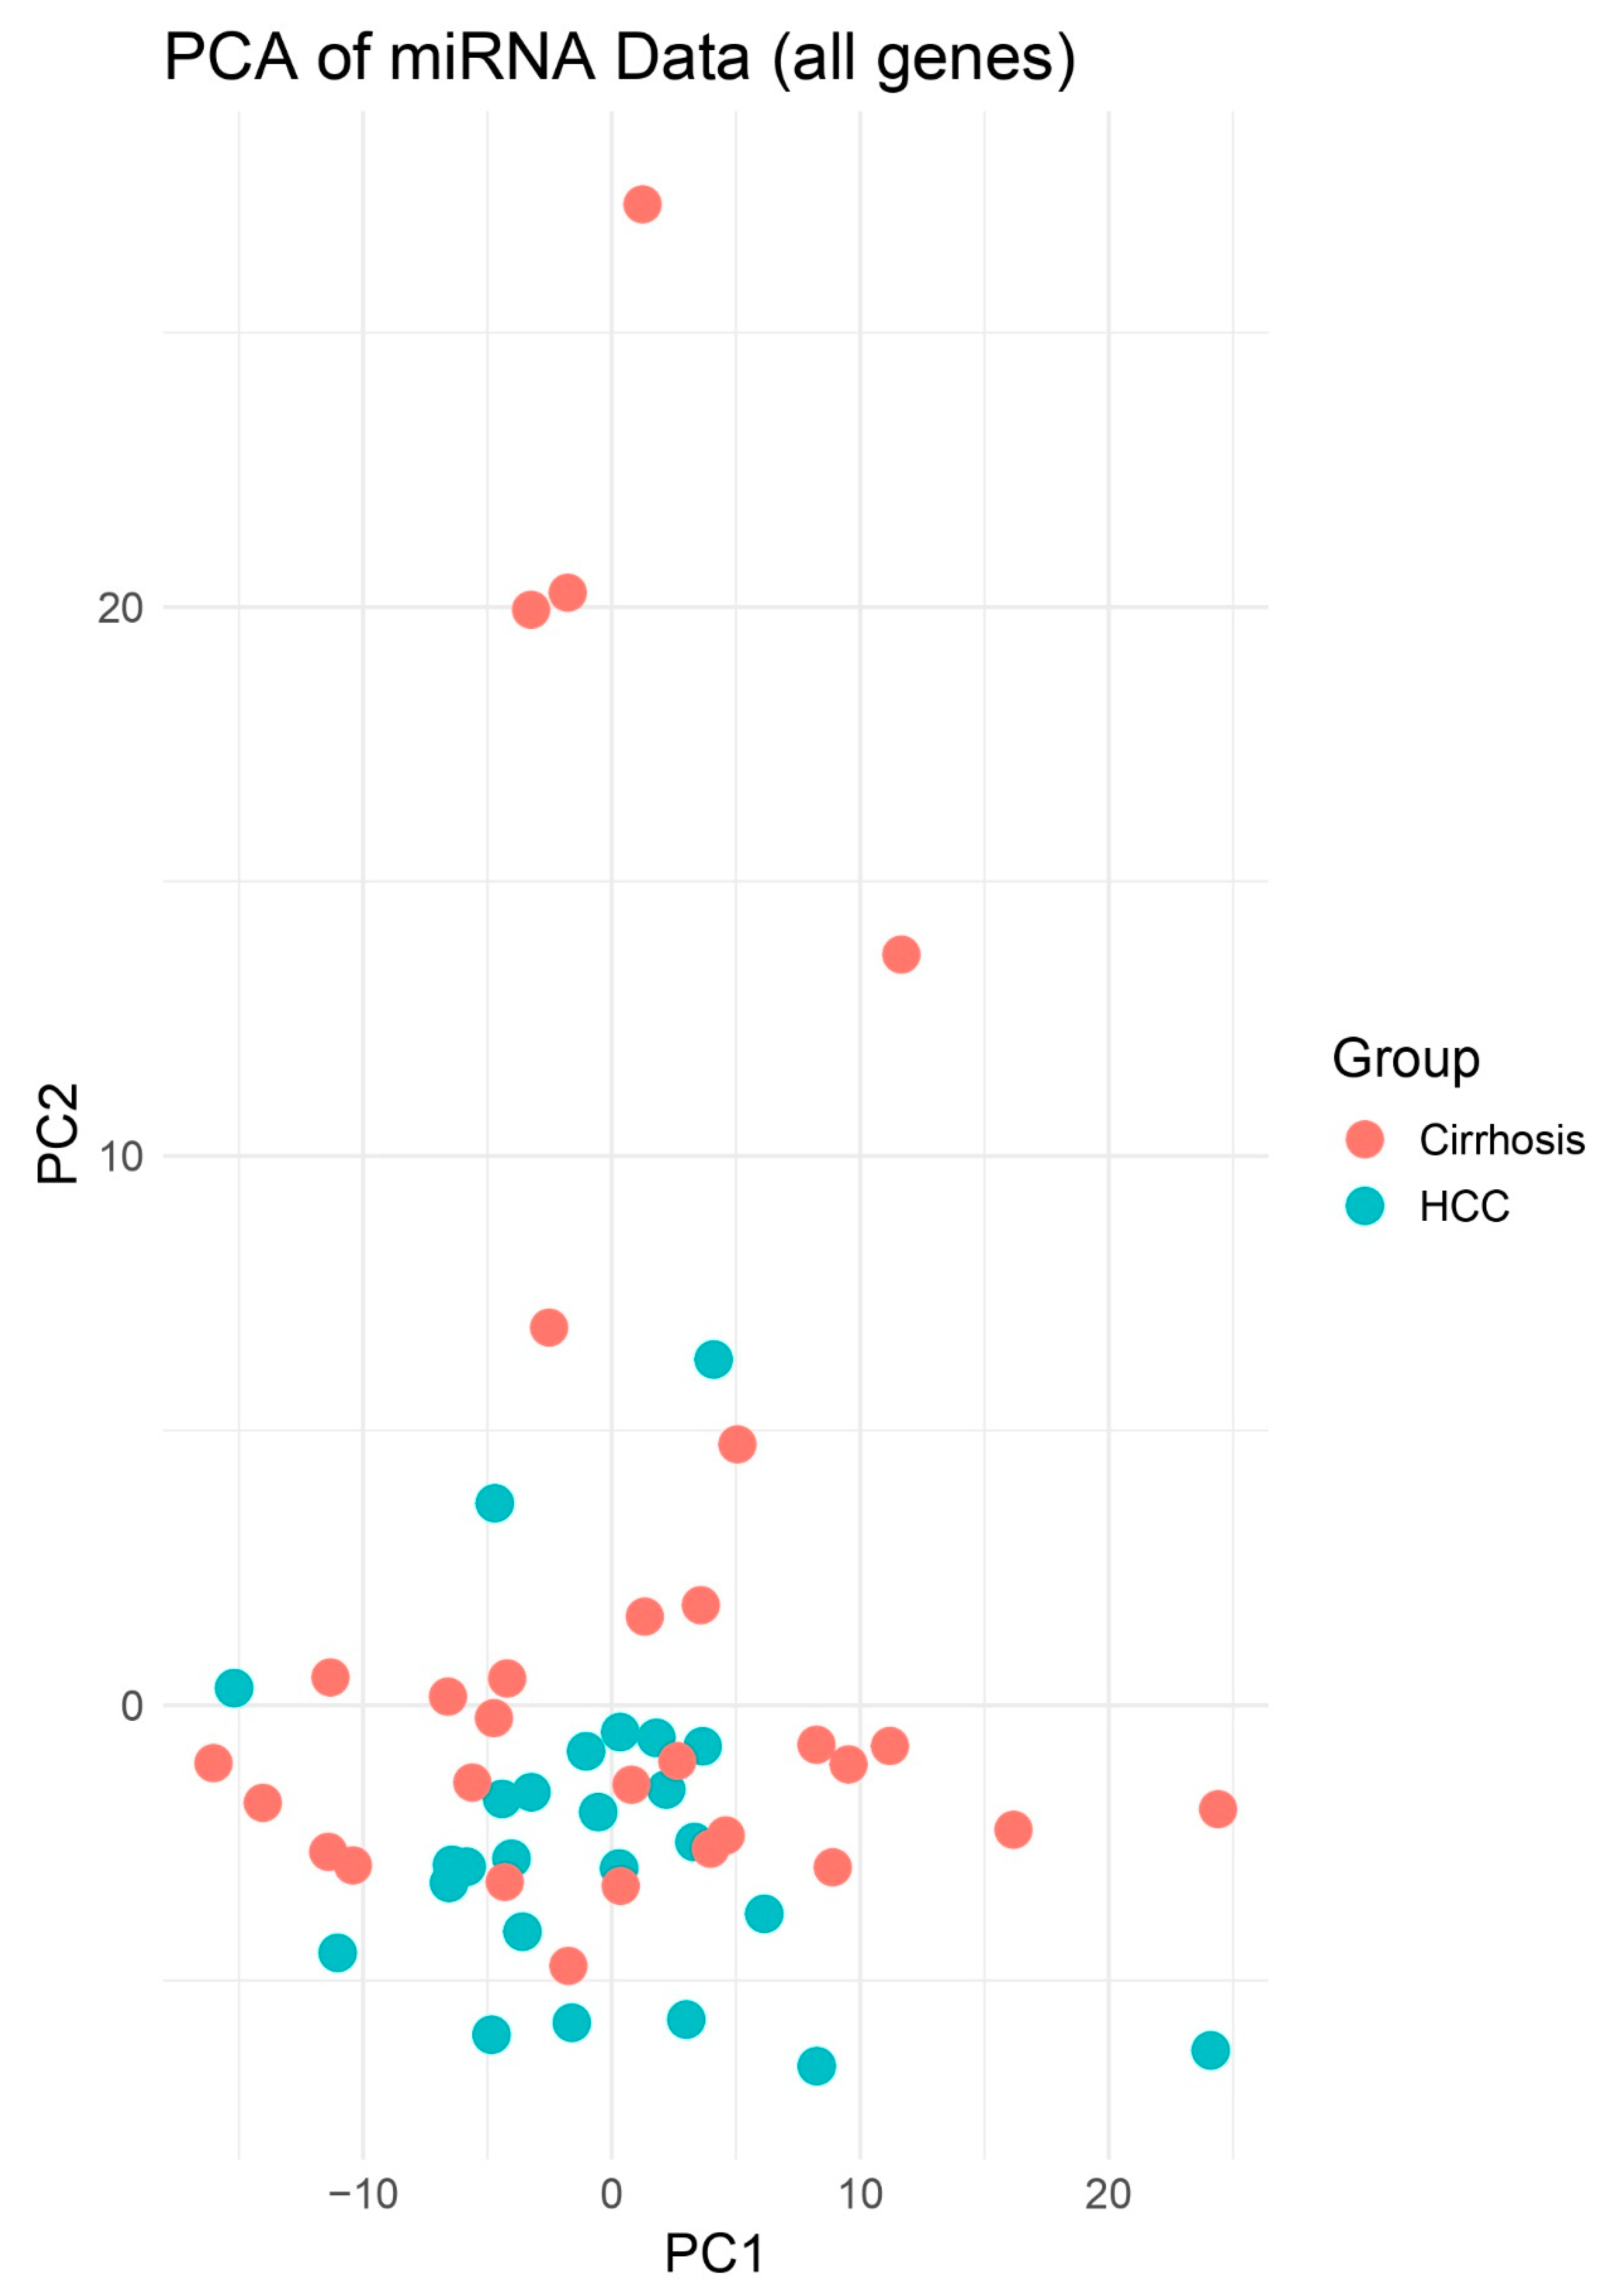
Figure 9.
PCA Highlighting Group Separation. PCA plot of PCs 1–2 illustrating clustering of HCC (blue) apart from Cirrhosis (red). Although no decision boundary is plotted, spatial separation is more apparent between HCC and non-HCC samples compared to the 2D PCA. This enhanced dimensionality highlights clearer group-level differences in miRNA expression profiles.
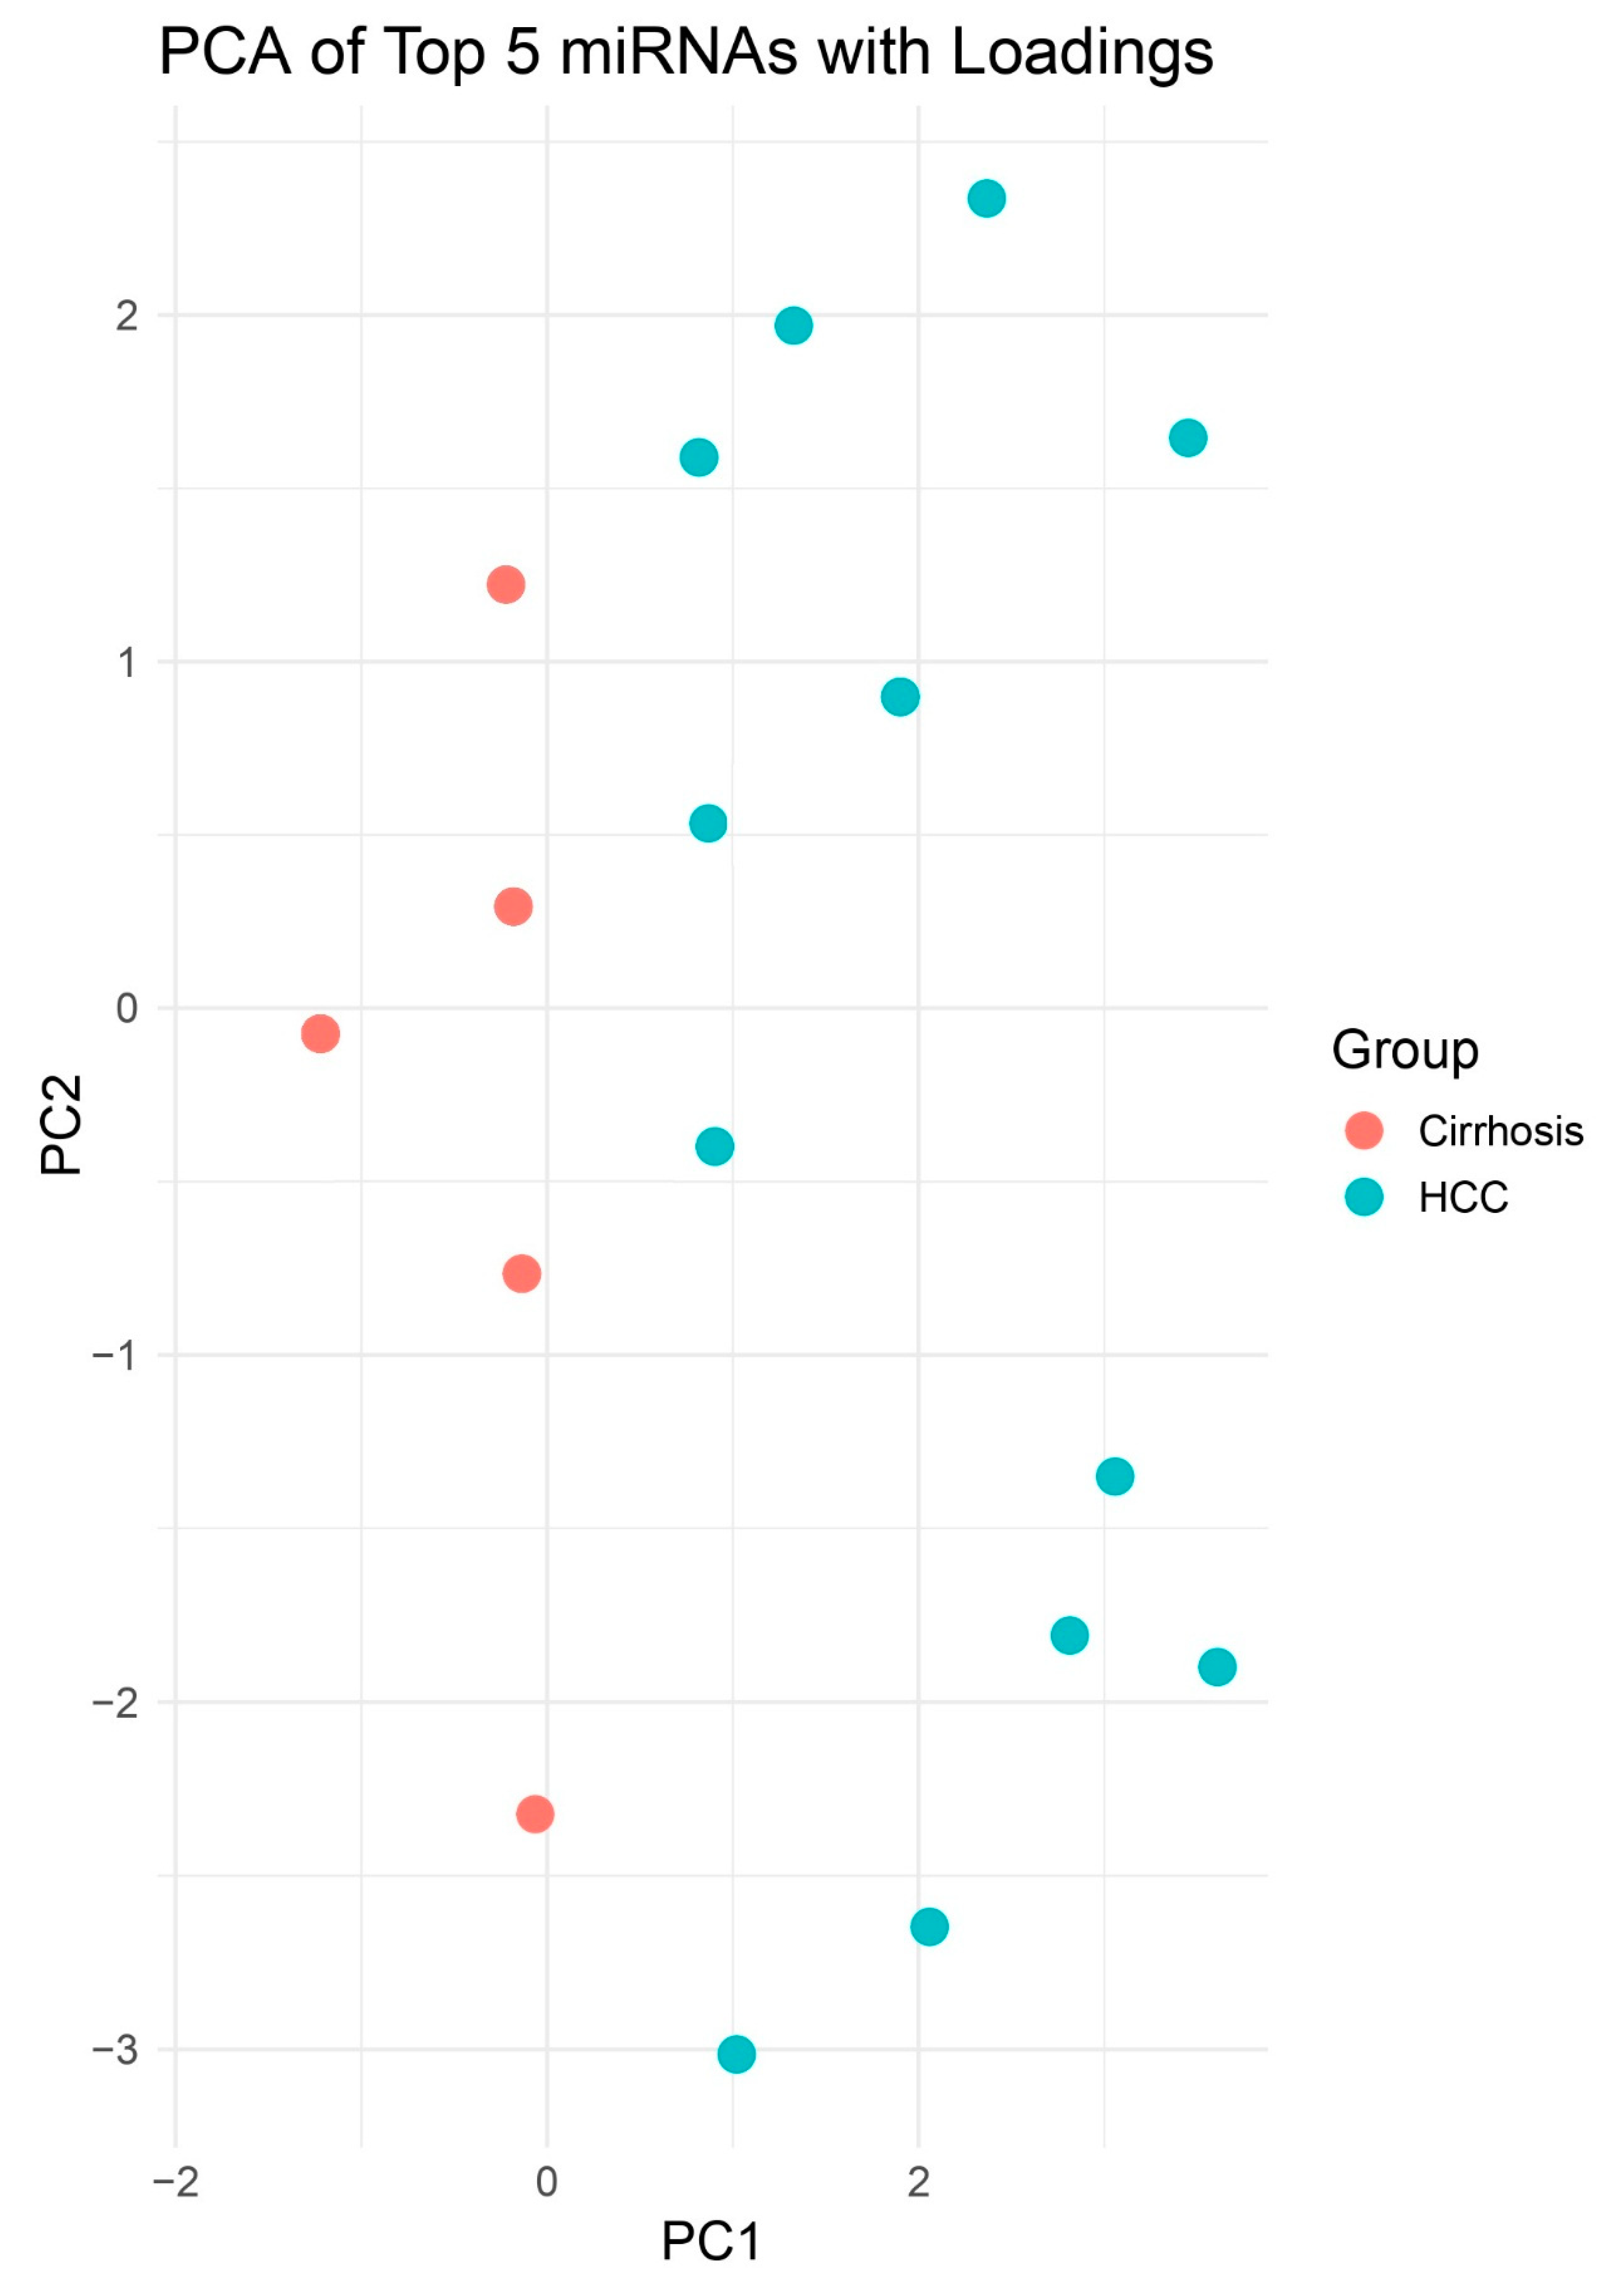
Figure 10.
Heatmap of All miRNAs Across HCC and Other Biopsies. Unsupervised hierarchical clustering heatmap displaying scaled expression (Z-score) of all profiled miRNAs in HCC versus cirrhosis biopsies. Distinct clustering of sample groups underscores a global miRNA signature that discriminates HCC from other liver and other pathologies.
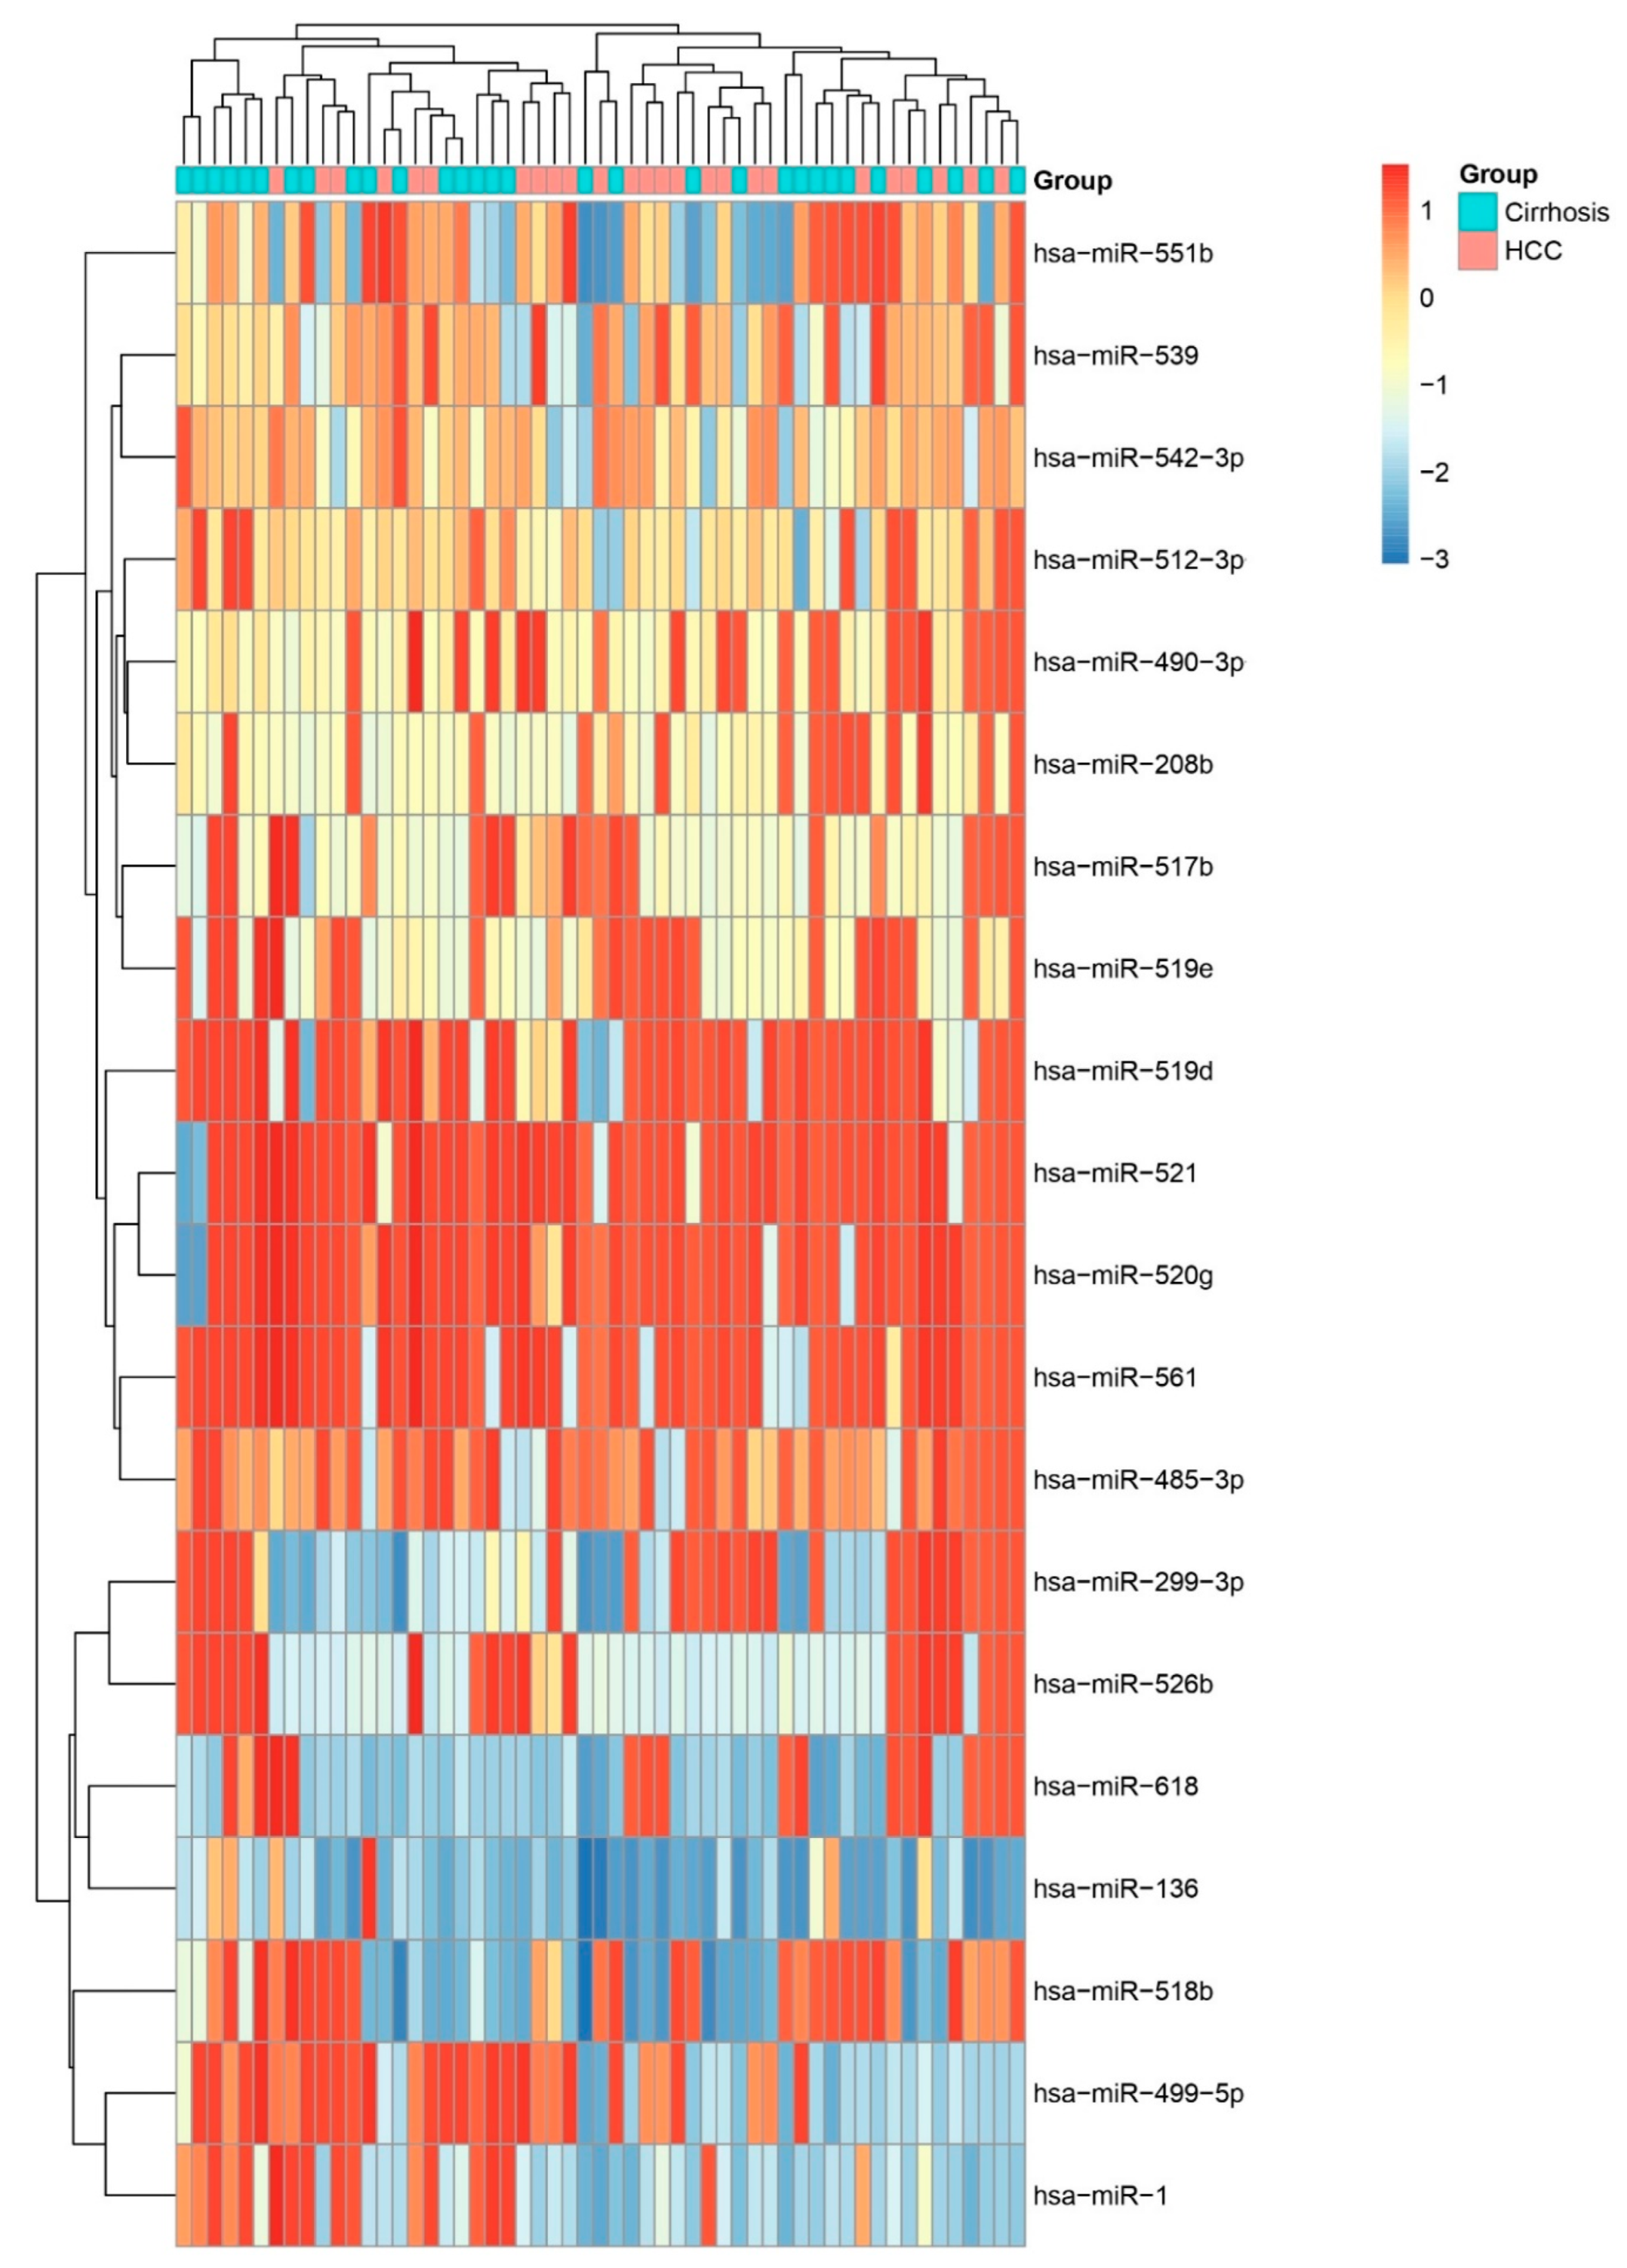
Figure 11.
Heatmap of Top Five Differentially Expressed miRNAs. Heatmap showing relative expression of the five most significant miRNAs (hsa-miR-196b, hsa-miR-138, hsa-miR-570, hsa-miR-187, and hsa-miR-492) across HCC and cirrhosis samples. Consistent up- or down-regulation in HCC confirms their potential as diagnostic biomarkers.
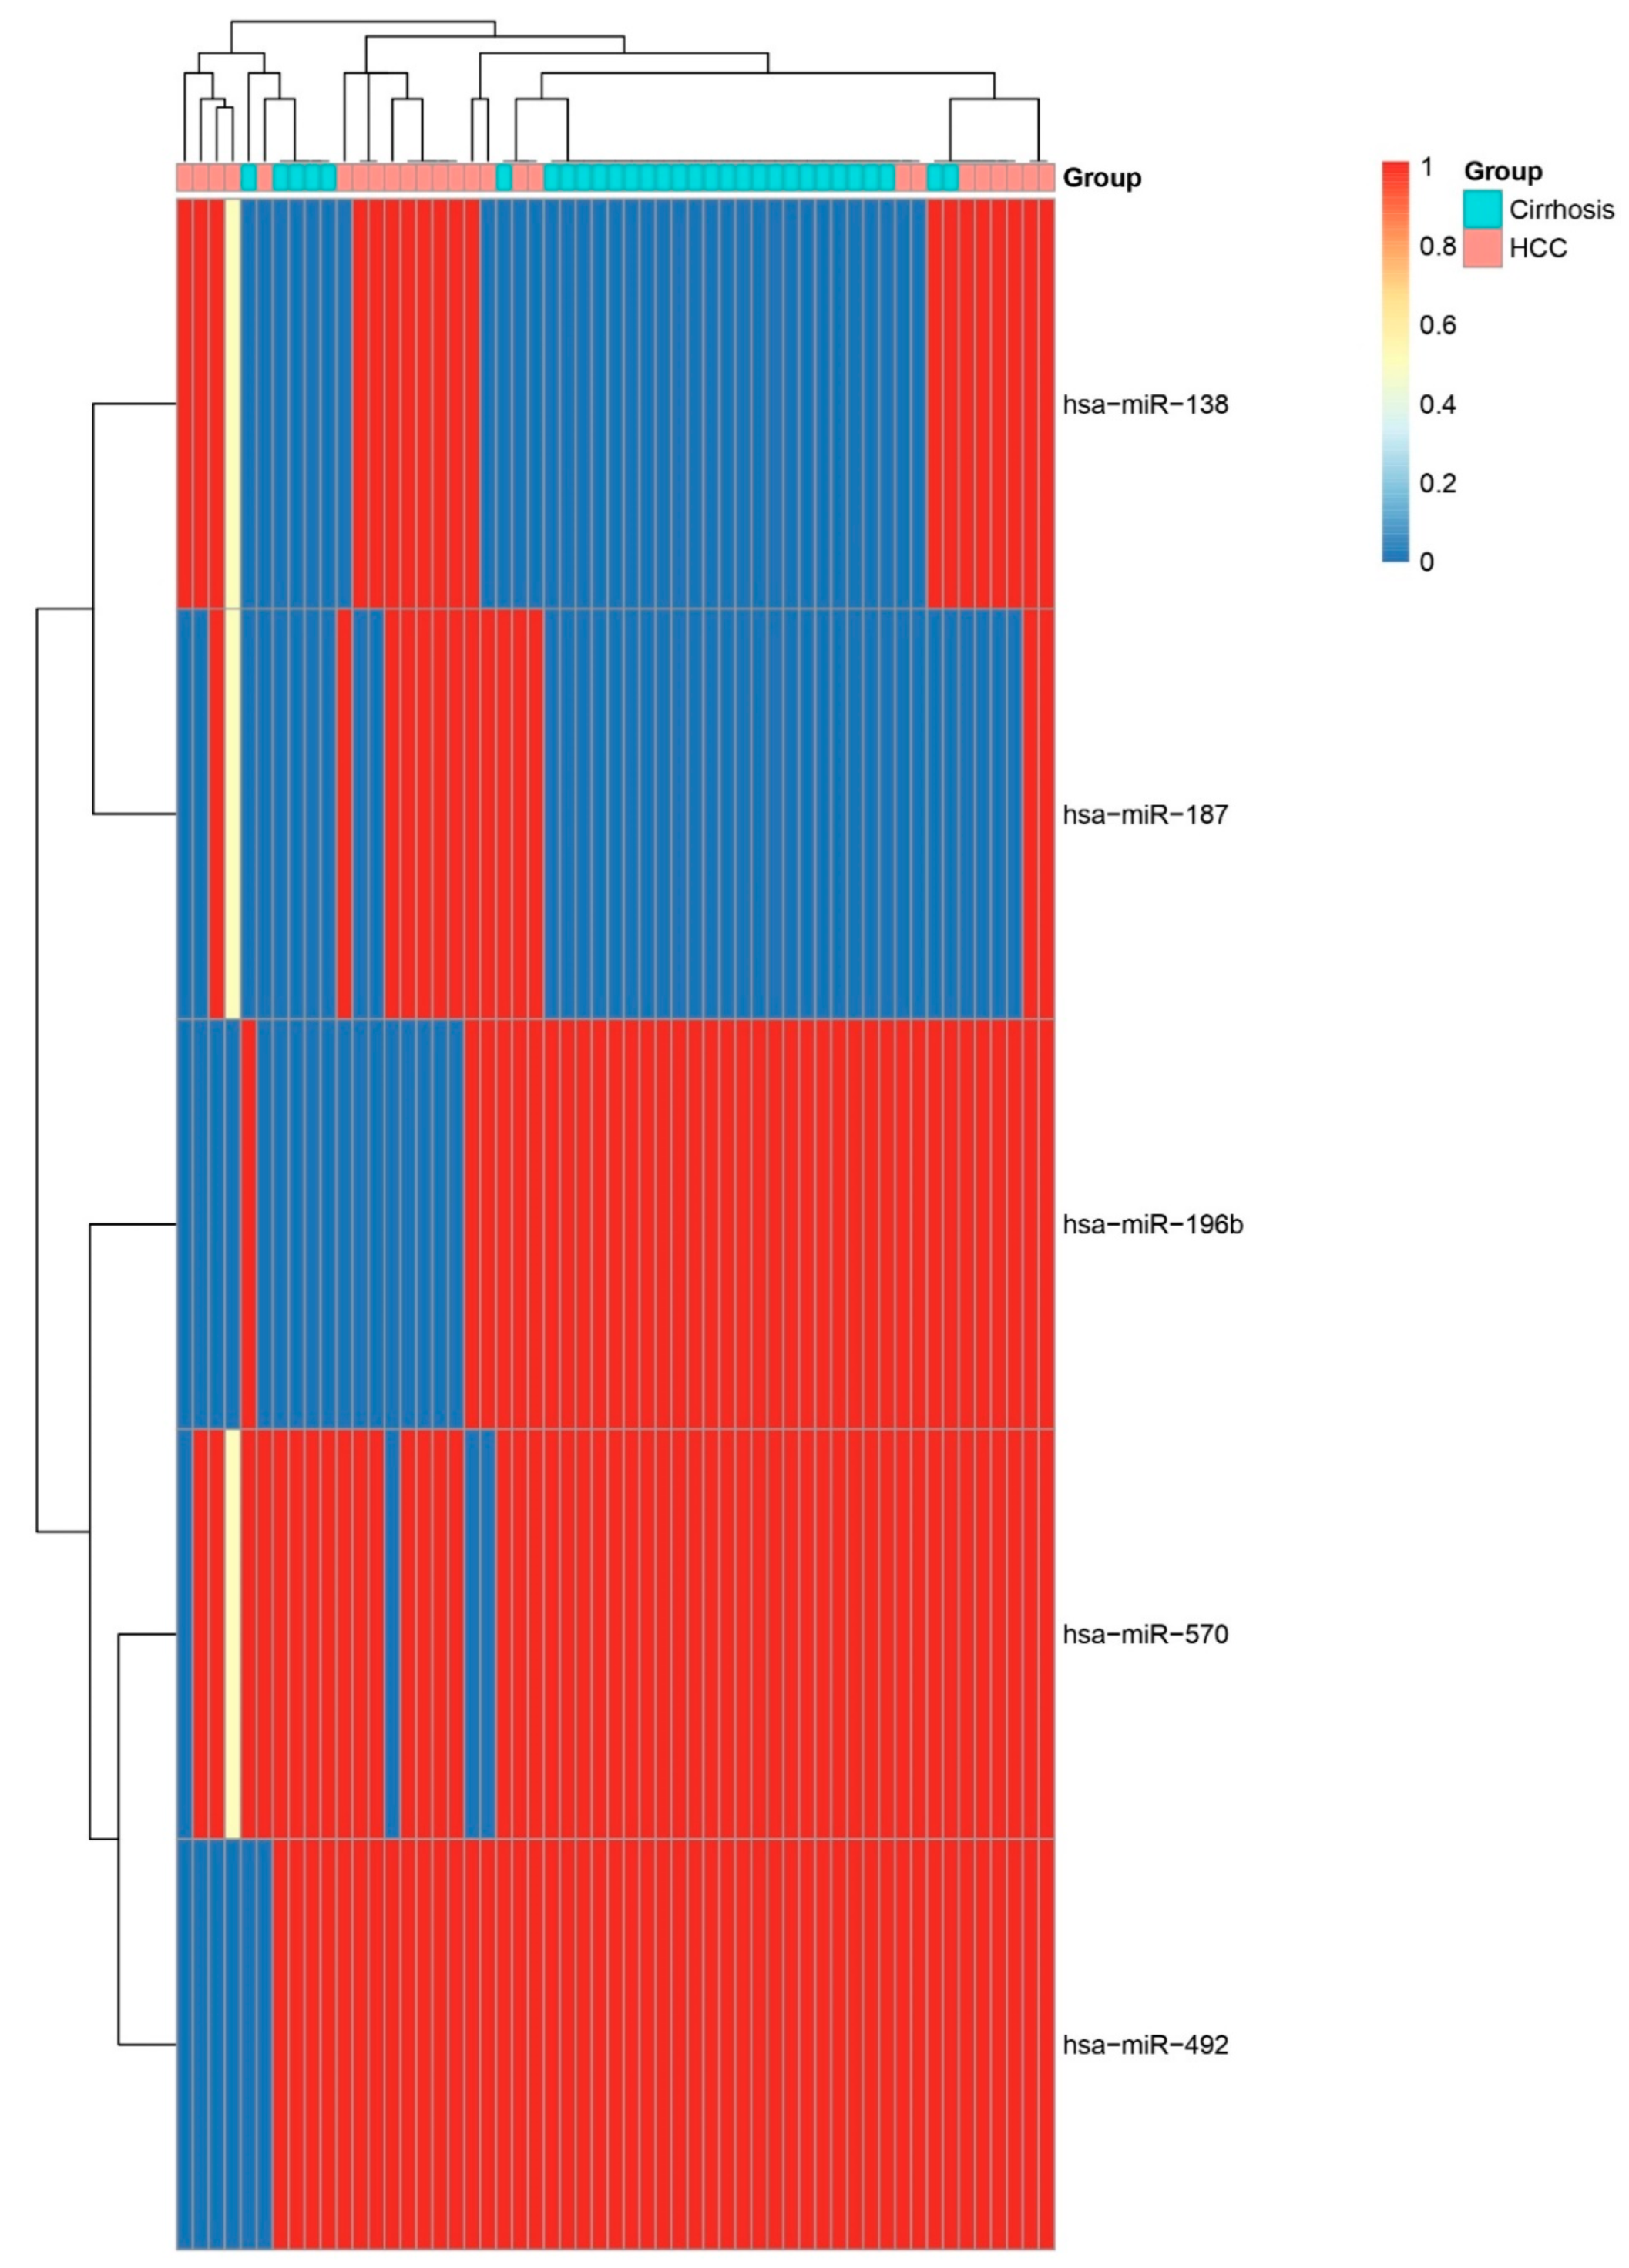
Figure 12.
Volcano Plot of Differential miRNA Expression. Volcano plot of log2 fold change versus –log10 FDR-adjusted p-value for miRNAs comparing HCC to cirrhosis biopsies. Key upregulated miRNAs (e.g., hsa-miR-138, hsa-miR-187, hsa-miR-625, and hsa-miR-450a) and downregulated miRNAs (e.g., hsa-miR-133b, hsa-miR-183, hsa-miR-570, and hsa-miR-196b) are labelled.
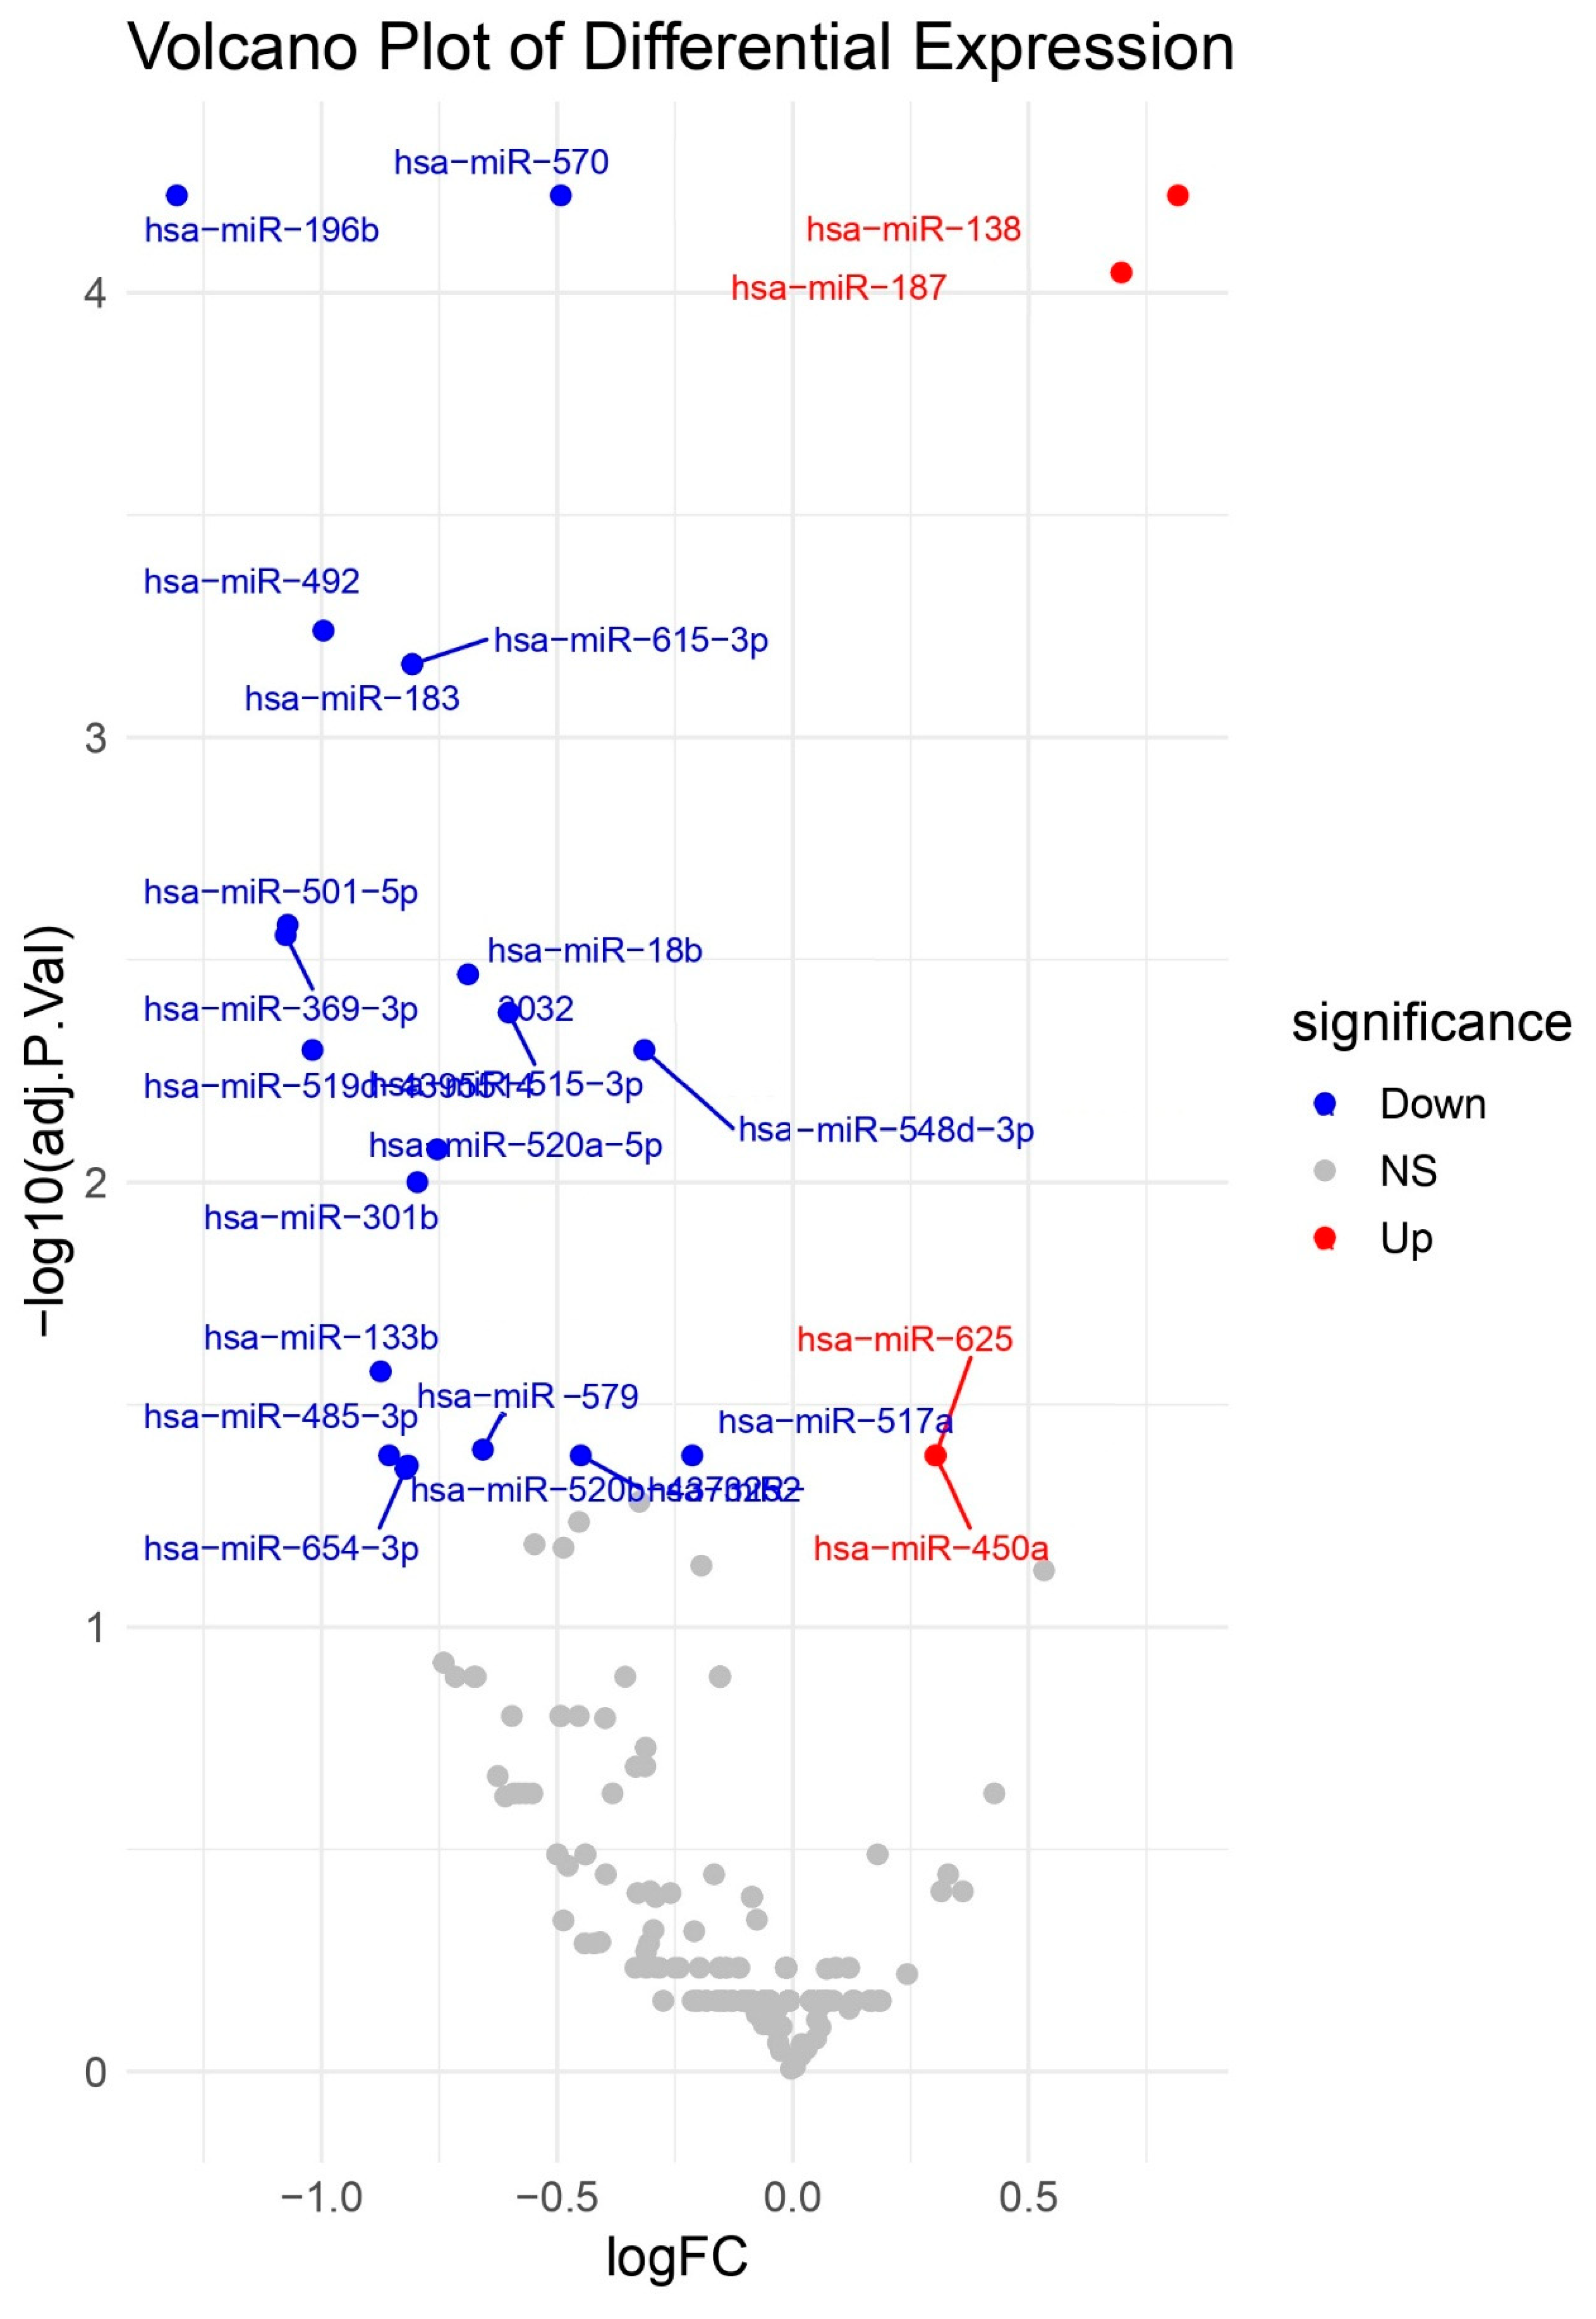

Table 1.
Differentially Expressed miRNAs in all subjects (HCC and non-HCC) Identified by Limma Analysis. Note. log2 FC: log2 fold change (HCC vs. other); B-statistic: log-odds of differential expression.
Table 1.
Differentially Expressed miRNAs in all subjects (HCC and non-HCC) Identified by Limma Analysis. Note. log2 FC: log2 fold change (HCC vs. other); B-statistic: log-odds of differential expression.
| miRNA | t | P-Value | Adjusted P-Value | B | logFC |
| hsa-miR-625 | -9.44 | <0.0001 | <0.0001 | 32.22 | -0.67 |
| hsa-miR-208b | 5.92 | <0.0001 | <0.0001 | 9.84 | 0.64 |
| hsa-miR-138 | -4.82 | <0.0001 | 0.0003 | 4.56 | -0.71 |
| hsa-miR-122 | 4.74 | <0.0001 | 0.0003 | 3.94 | 0.29 |
| hsa-miR-548b-3p | 4.59 | <0.0001 | 0.0005 | 3.44 | 0.14 |
Table 2.
miRNAs Selected by LASSO Regression. List of miRNAs with non-zero coefficients at the optimal penalty (λ) identified by LASSO.
Table 2.
miRNAs Selected by LASSO Regression. List of miRNAs with non-zero coefficients at the optimal penalty (λ) identified by LASSO.
| LASSO | |
| hsa-miR-381 | |
| hsa-miR-10a | hsa-miR-411 |
| hsa-miR-10b | hsa-miR-425 |
| hsa-miR-126 | hsa-miR-450a |
| hsa-miR-133b | hsa-miR-452 |
| hsa-miR-141 | hsa-miR-494 |
| hsa-miR-146a | hsa-miR-500 |
| hsa-miR-148b | hsa-miR-502-3p |
| hsa-miR-149 | hsa-miR-517b |
| hsa-miR-155 | hsa-miR-518a-3p |
| hsa-miR-187 | hsa-miR-518b |
| hsa-miR-193a-3p | hsa-miR-518d-3p |
| hsa-miR-200a | hsa-miR-518e |
| hsa-miR-200c | hsa-miR-526b |
| hsa-miR-210 | hsa-miR-532-3p |
| hsa-miR-214 | hsa-miR-548b-3p |
| hsa-miR-223 | hsa-miR-548b-5p |
| hsa-miR-224 | hsa-miR-582-5p |
| hsa-miR-331-5p | hsa-miR-589 |
| hsa-miR-337-5p | hsa-miR-628-5p |
| hsa-miR-379 | hsa-miR-885-5p |
Table 3.
miRNAs with best performance in ROC to discriminate HCC from other pathology biopsies.
| ROC-AUC | |||||
| AUC | P-value | miRNA | AUC | P | miRNA |
| 0.947 | 0.1282 | hsa-miR-215 | 0.769 | 0.2593 | hsa-miR-145 |
| 0.902 | 0.0060 | hsa-miR-373 | 0.767 | <0.0001 | hsa-miR-10a |
| 0.875 | 0.1778 | hsa-miR-19b | 0.752 | <0.0001 | hsa-miR-885-3p |
| 0.873 | <0.0001 | hsa-miR-200b | 0.750 | 0.8000 | hsa-miR-191 |
| 0.857 | 0.3636 | hsa-miR-627 | 0.748 | 0.0002 | hsa-miR-148a |
| 0.846 | 0.4286 | hsa-miR-17 | 0.745 | 0.0001 | hsa-miR-31 |
| 0.840 | <0.0001 | hsa-miR-429 | 0.737 | 0.0407 | hsa-miR-222 |
| 0.835 | 0.1093 | hsa-miR-194 | 0.734 | 0.0001 | hsa-miR-199b-5p |
| 0.833 | <0.0001 | hsa-miR-141 | 0.730 | 0.0001 | hsa-miR-455-3p |
| 0.820 | <0.0001 | hsa-miR-199a-3p | 0.725 | 0.0002 | hsa-miR-642 |
| 0.814 | <0.0001 | hsa-miR-135b | 0.725 | 0.0688 | hsa-miR-875-3p |
| 0.814 | <0.0001 | hsa-miR-708 | 0.724 | 0.0379 | hsa-miR-618 |
| 0.811 | <0.0001 | hsa-miR-214 | 0.723 | 0.0002 | hsa-miR-147b |
| 0.804 | <0.0001 | hsa-miR-208b | 0.722 | 0.0002 | hsa-miR-187 |
| 0.797 | <0.0001 | hsa-miR-27a | 0.715 | 0.0004 | hsa-miR-148b |
| 0.793 | <0.0001 | hsa-miR-200a | 0.714 | 0.0005 | hsa-miR-216b |
| 0.793 | 0.3178 | hsa-miR-885-5p | 0.714 | 0.0029 | hsa-miR-551b |
| 0.790 | <0.0001 | hsa-miR-107 | 0.708 | 0.0005 | hsa-miR-625 |
| 0.789 | <0.0001 | hsa-miR-138 | 0.708 | 0.0007 | hsa-miR-346 |
| 0.781 | <0.0001 | hsa-miR-149 | 0.706 | 0.0006 | hsa-miR-492 |
| 0.770 | <0.0001 | hsa-miR-365 | 0.700 | 0.5714 | hsa-miR-628-5p |
Table 4.
Differentially Expressed miRNAs in subjects with HCC and Cirrhotic Subjects Identified by Limma Analysis. Note. log2 FC: log2 fold change (HCC vs. Cirrhosis); B-statistic: log-odds of differential expression.
Table 4.
Differentially Expressed miRNAs in subjects with HCC and Cirrhotic Subjects Identified by Limma Analysis. Note. log2 FC: log2 fold change (HCC vs. Cirrhosis); B-statistic: log-odds of differential expression.
| miRNA | logFC | t | P-Value | Adjusted P-Value | B |
| hsa-miR-196b | -1.31 | -5.91 | <0.0001 | 0.0001 | 6.83 |
| hsa-miR-570 | -0.49 | -5.72 | <0.0001 | 0.0001 | 6.15 |
| hsa-miR-138 | 0.82 | 5.72 | <0.0001 | 0.0001 | 6.21 |
| hsa-miR-187 | 0.70 | 5.53 | <0.0001 | 0.0001 | 5.54 |
| hsa-miR-492 | -1.00 | -4.95 | <0.0001 | 0.0006 | 3.55 |
| hsa-miR-183 | -0.81 | -4.81 | <0.0001 | 0.0007 | 3.00 |
| hsa-miR-615-3p | -0.81 | -4.81 | <0.0001 | 0.0007 | 3.00 |
| hsa-miR-501-5p | -1.07 | -4.37 | 0.0001 | 0.0026 | 1.76 |
| hsa-miR-369-3p | -1.08 | -4.32 | 0.0001 | 0.0028 | 1.61 |
| hsa-miR-18b | -0.69 | -4.23 | 0.0001 | 0.0034 | 1.33 |
| hsa-miR-515-3p | -0.60 | -4.14 | 0.0001 | 0.0042 | 1.00 |
| hsa-miR-519d | -1.02 | -4.03 | 0.0002 | 0.0050 | 0.73 |
| hsa-miR-548d | -0.31 | -4.04 | 0.0002 | 0.0050 | 0.47 |
| hsa-miR-520a | -0.75 | -3.85 | 0.0003 | 0.0084 | 0.00 |
| hsa-miR-301b | -0.80 | -3.78 | 0.0004 | 0.0100 | 0.01 |
| hsa-miR-133b | -0.87 | -3.44 | 0.0011 | 0.0266 | -0.98 |
| hsa-miR-579 | -0.66 | -3.29 | 0.0018 | 0.0399 | -1.35 |
| hsa-miR-485 | -0.86 | -3.19 | 0.0024 | 0.0411 | -1.60 |
| hsa-miR-589 | -0.45 | -3.19 | 0.0024 | 0.0411 | -1.78 |
| hsa-miR-625 | 0.30 | 3.19 | 0.0023 | 0.0411 | -1.79 |
| hsa-miR-450a | 0.30 | 3.19 | 0.0023 | 0.0411 | -1.79 |
| hsa-miR-517a | -0.21 | -3.20 | 0.0023 | 0.0411 | -1.93 |
| hsa-miR-520b | -0.82 | -3.15 | 0.0026 | 0.0433 | -1.67 |
| hsa-miR-654-3p | -0.82 | -3.13 | 0.0028 | 0.0441 | -1.78 |
Disclaimer/Publisher’s Note: The statements, opinions and data contained in all publications are solely those of the individual author(s) and contributor(s) and not of MDPI and/or the editor(s). MDPI and/or the editor(s) disclaim responsibility for any injury to people or property resulting from any ideas, methods, instructions or products referred to in the content. |
© 2025 by the author. Licensee MDPI, Basel, Switzerland. This article is an open access article distributed under the terms and conditions of the Creative Commons Attribution (CC BY) license (https://creativecommons.org/licenses/by/4.0/).
Copyright: This open access article is published under a Creative Commons CC BY 4.0 license, which permit the free download, distribution, and reuse, provided that the author and preprint are cited in any reuse.


