Preprint
Article

This version is not peer-reviewed.

miRNAs-set of Plasmatic Extracellular Vesicles as Novel Biomarkers for Hepatocellular Carcinoma Diagnosis

A peer-reviewed article of this preprint also exists.

Submitted:

03 December 2024

Posted:

04 December 2024

You are already at the latest version

Abstract

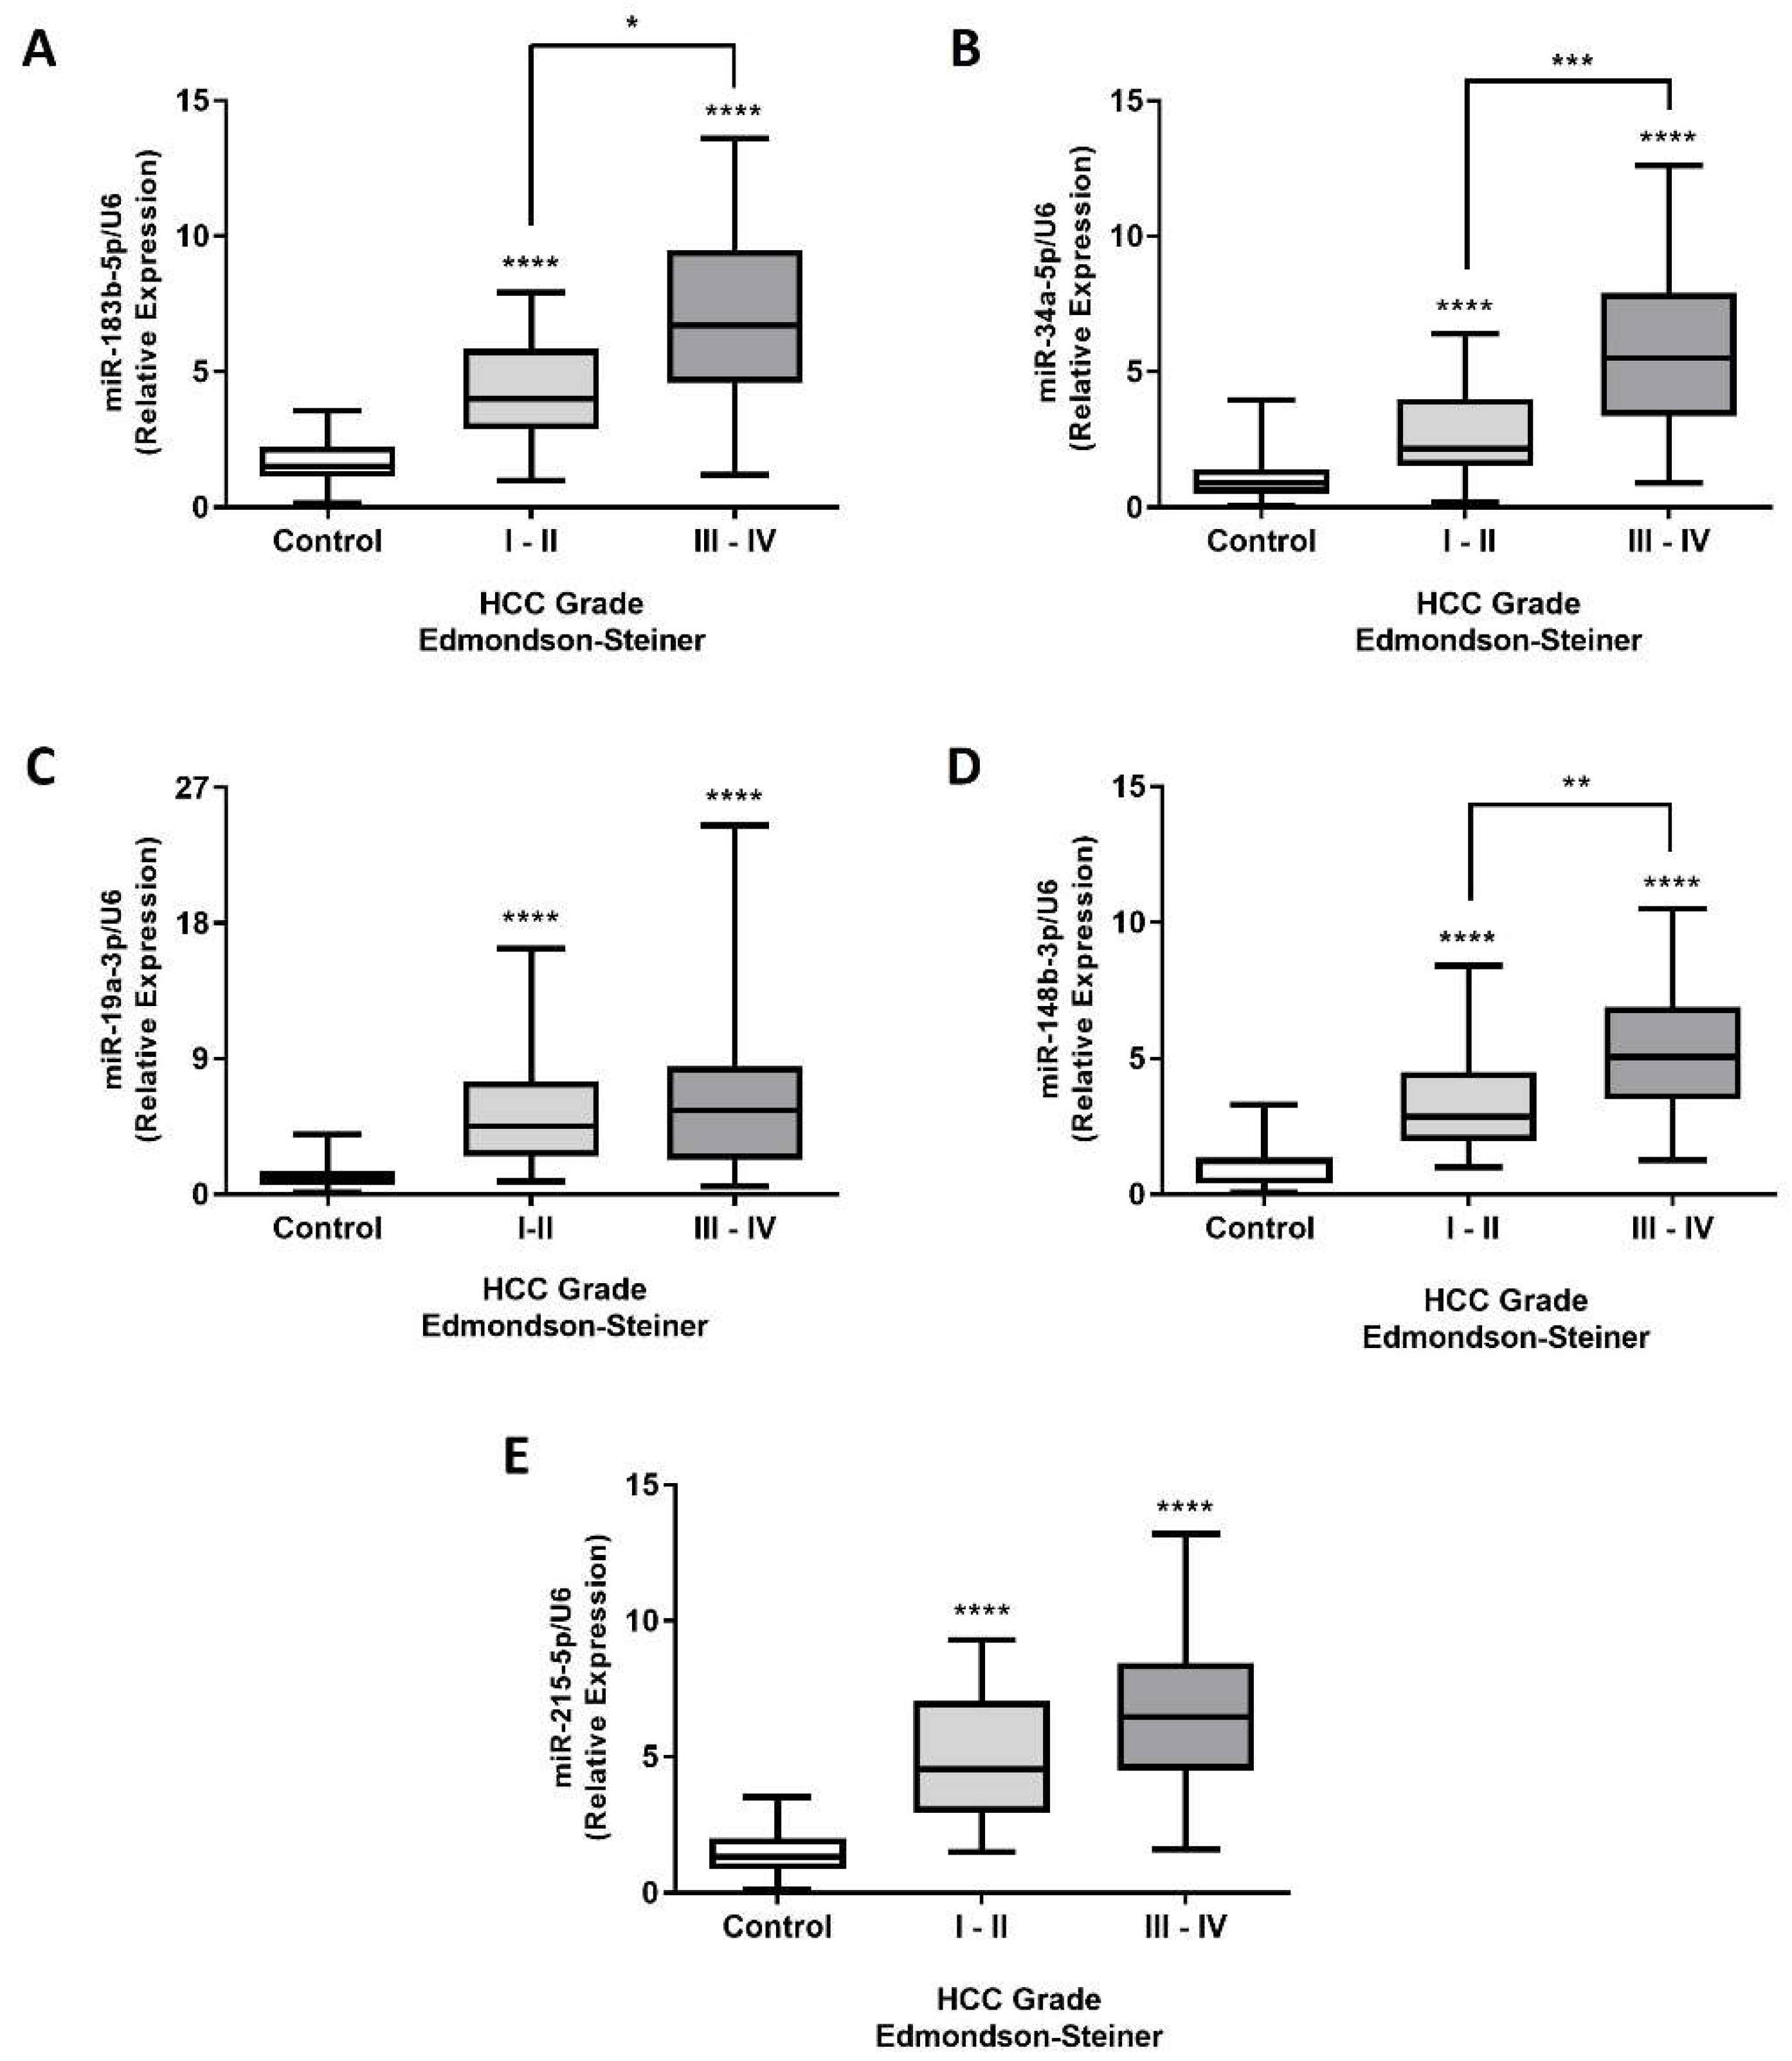
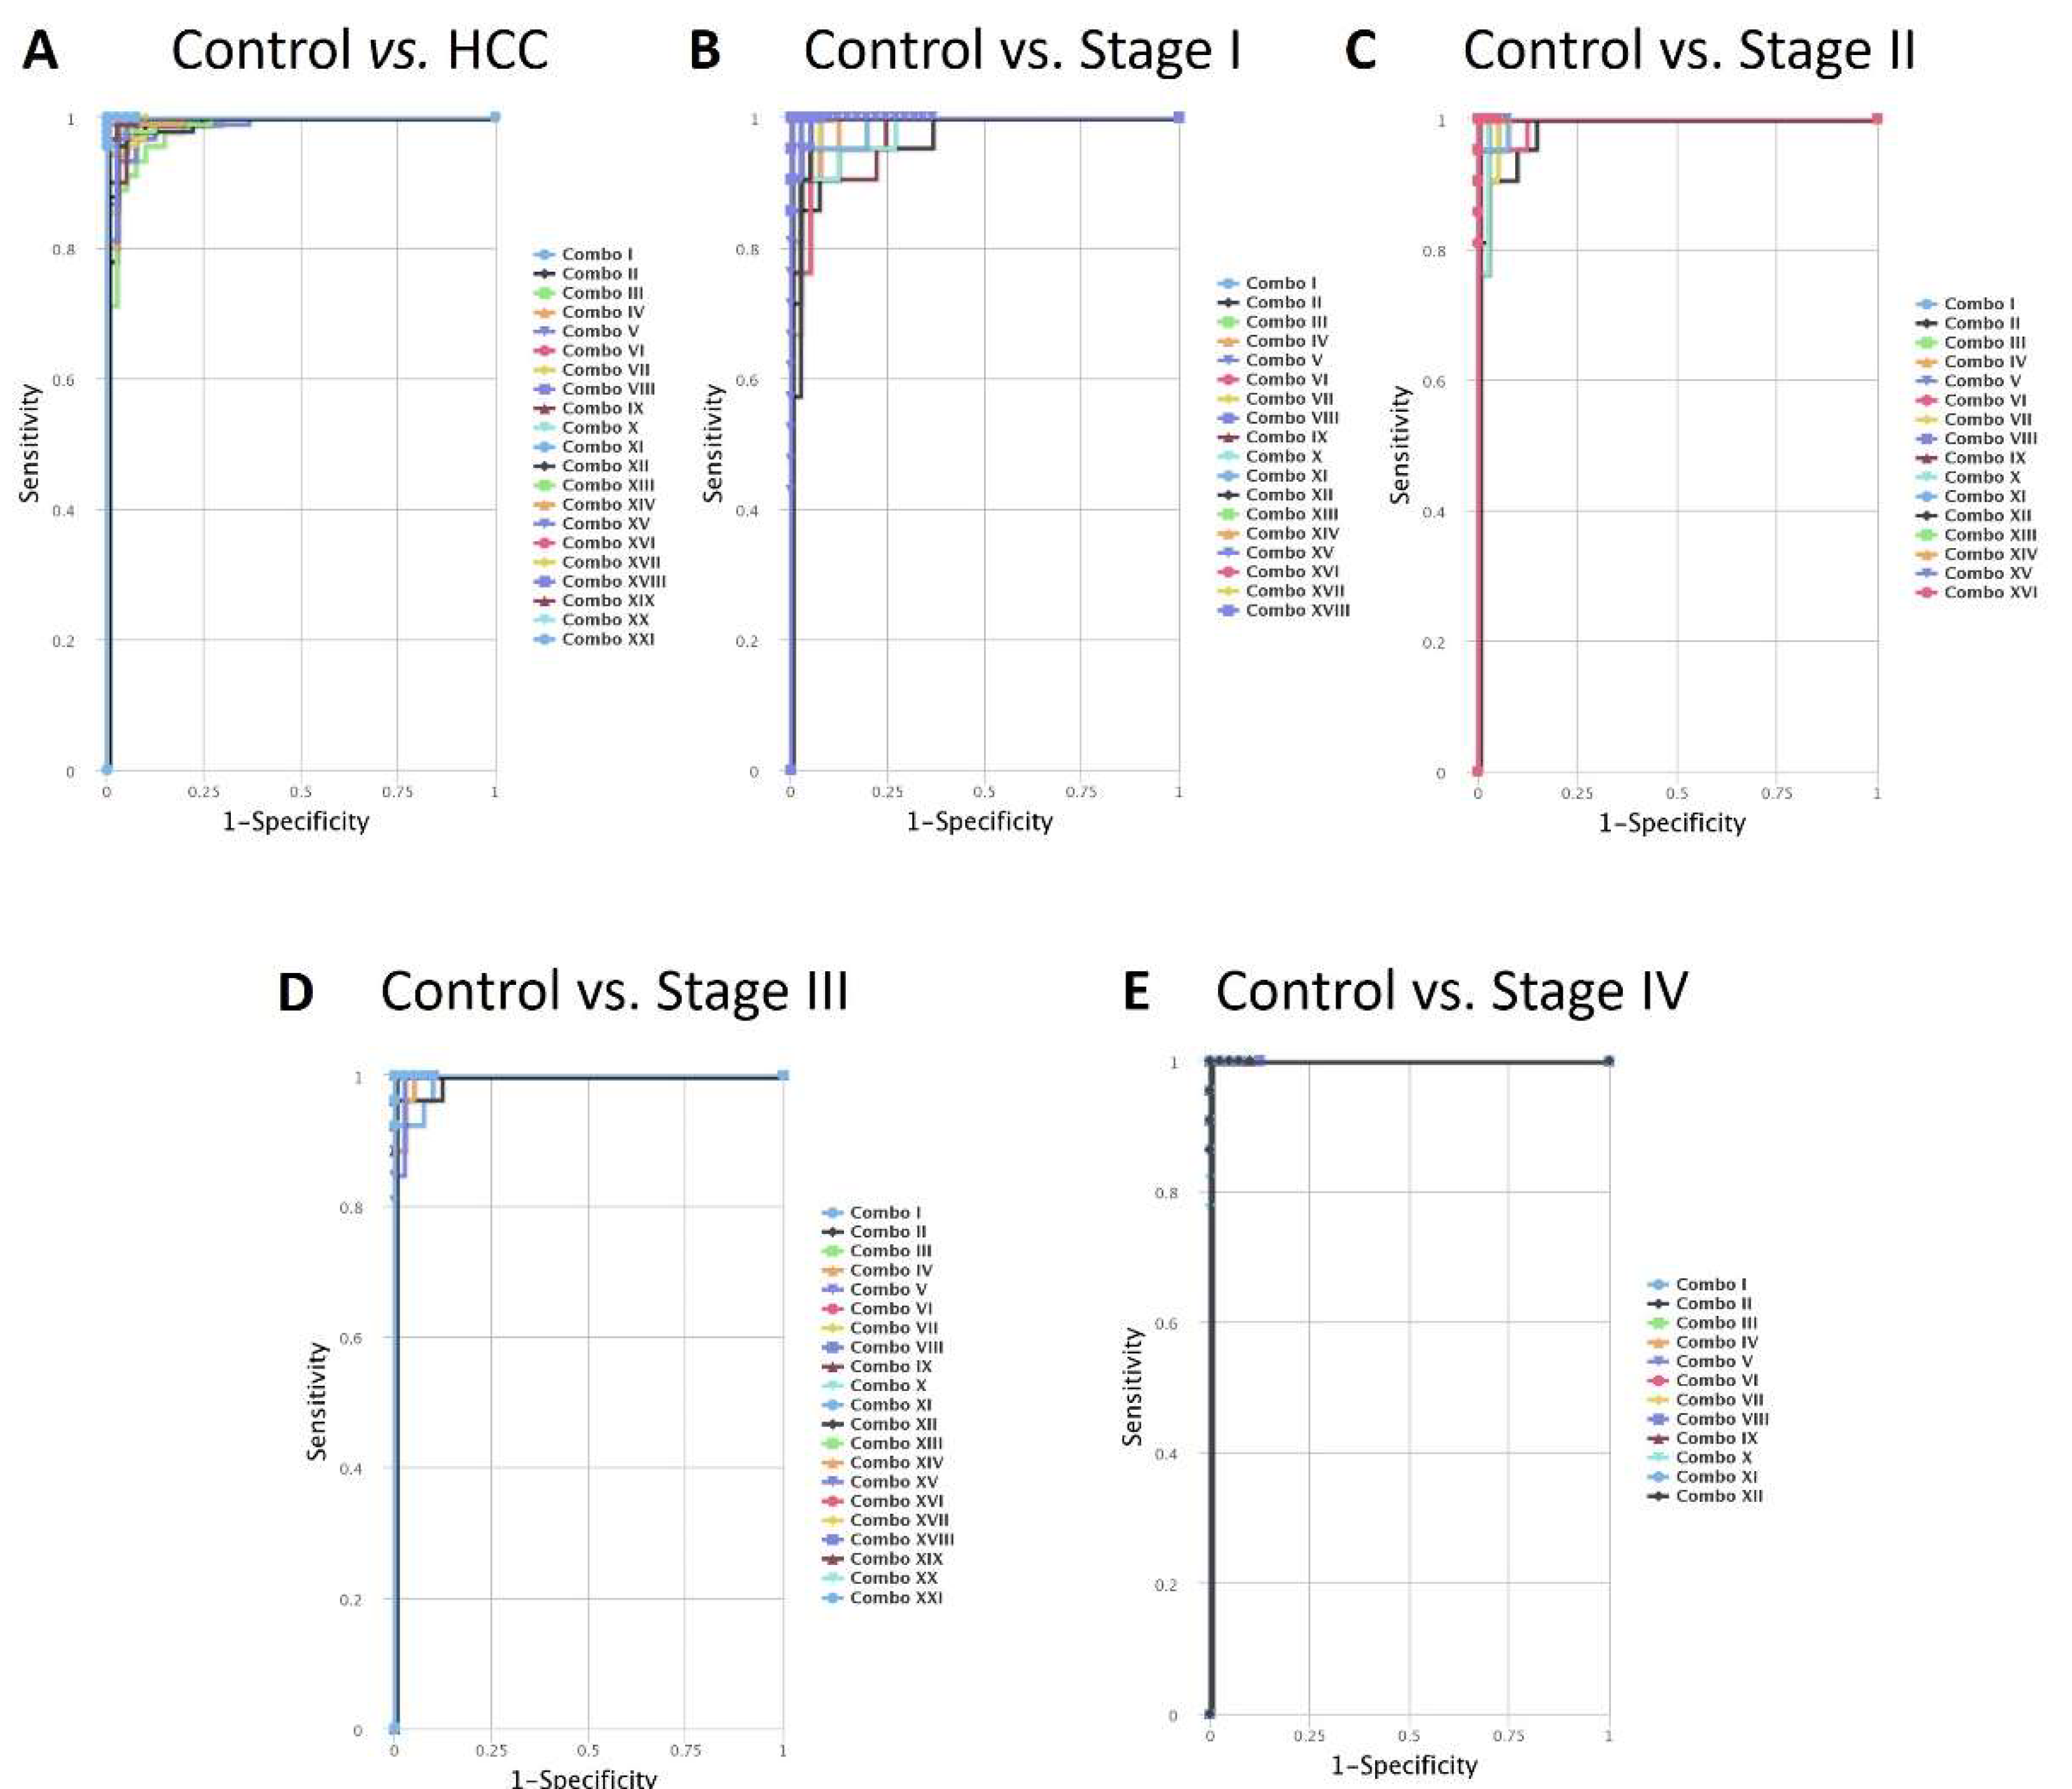
Hepatocellular carcinoma (HCC) is the most common liver cancer, often diagnosed at advanced stages due to inadequate early diagnostic methods. MicroRNAs (miRNAs) play crucial roles in gene expression regulation and are possible biomarkers for molecular diagnosis in several diseases, including cancer. This study aimed to investigate the diagnostic potential of miRNAs contained in Extracellular Vesicles (EVs) from HCC. The miRNA expression contained in EVs was analyzed in HCC cell lines, circulating EVs in a Diethylnitrosamine (DEN)-induced HCC rat model, and plasma samples of HCC patients. Receiver Operating Characteristics (ROC) were applied to circulating EV-miRNAs from human patients to evaluate their diagnostic accuracy. The miRNA expression analysis identified five miRNAs (miR-183-5p, miR-19a-3p, miR-148b-3p, miR-34a-5p, and miR-215-5p) consistently up-regulated in EVs from in vitro and in vivo HCC models. These five EVs-derived miRNAs showed statistically significant differences in HCC patients stratified by TNM staging and Edmondson-Steiner grading compared to healthy controls. Individually and in combination, they demonstrated high sensitivity, specificity, and accuracy in distinguishing HCC patients from healthy subjects. The consistent upregulation of the five miRNAs across different experimental models and clinical samples suggests their robustness as biomarkers for HCC diagnosis, and it underscores their clinical potential in early disease management and prognosis.

Keywords: 
;  ;  ;  ;  

1. Introduction

Liver cancer comprises several hepatic neoplasms [1], and hepatocellular carcinoma (HCC) is the most common type, accounting for approximately 80% of cases [2] and is considered the third leading cause of cancer-related mortality [3].
Poor diagnosis is a significant factor contributing to high mortality rates, considering the low detection sensitivity of current techniques in addition to the rapid progression of the tumor stage. Imaging techniques combined with serum markers, such as ultrasound testing with serum alpha-fetoprotein determination [4], constitute a standard diagnostic panel for HCC; however, their sensitivity and specificity are low in early progression stages, significantly delaying timely diagnosis [5]. Detection of abnormal liver mass by computed tomography and magnetic resonance imaging is commonly used for monitoring cirrhotic patients, but these methods are insufficient to confirm HCC [6]. In cases where imaging is inconclusive, a liver biopsy and histological analysis have been recommended for confirmation [7] and sometimes, up to three biopsies are necessary to make a conclusive HCC diagnosis [8].
The HCC prognosis is known to be unfavorable due to rapid tumor growth, although an early detection increases life expectancy [9], However, the HCC diagnosis is mainly made at the advanced stage, which reduces treatment options and estimated survival of patients [10]. Therefore, HCC patients urgently need novel diagnostic methods that are sensitive, specific, and relatively easy to use.
Accordingly, previous studies have proposed serum/plasma biomarkers as a new diagnostic strategy, including circulating levels of tumor proteins and epigenetic markers such as noncoding RNAs [11,12]. In addition to soluble factors, cells in the tumor microenvironment secrete vesicle-enclosed signals in a nonclassical mechanism to regulate intercellular communication. Extracellular Vesicles (EVs) are cell-derived secretory vesicles originated from multivesicular endosomal bodies or the plasma membrane [13]. EVs cargo in cancer cells has been reported to include oncogenes, signaling and extracellular matrix proteins, RNA transcripts, and microRNAs (miRNAs), suggesting that they may influence the tumor microenvironment [14].
miRNAs are a class of short noncoding RNAs that alter posttranscriptional and translational mRNA targets to regulate various functions such as cell proliferation, differentiation, migration, and apoptosis, as well as pathological processes, including cancer [15,16,17]. Previously, impaired expression of miRNAs has been associated with tumorigenesis, invasion, and metastasis of HCC [18,19,20], and several miRNAs have been proposed as biomarkers for HCC. Moreover, EVs released by cancer cells change their content depending on cancer development, cell origin, and tumor microenvironment [21], they could be a potentially sensitive diagnostic tool. This study aimed to analyze the expression of miRNAs associated with EVs in different HCC cell lines and DEN-induced HCC rat model, to characterize their differential expression according to cancer progression stages and validate their sensitivity and specificity as potential biomarkers in HCC patients. We identified a five-panel of circulating miRNAs with > 99% sensitivity and specificity for a novel diagnostic test for HCC patients.

2. Results

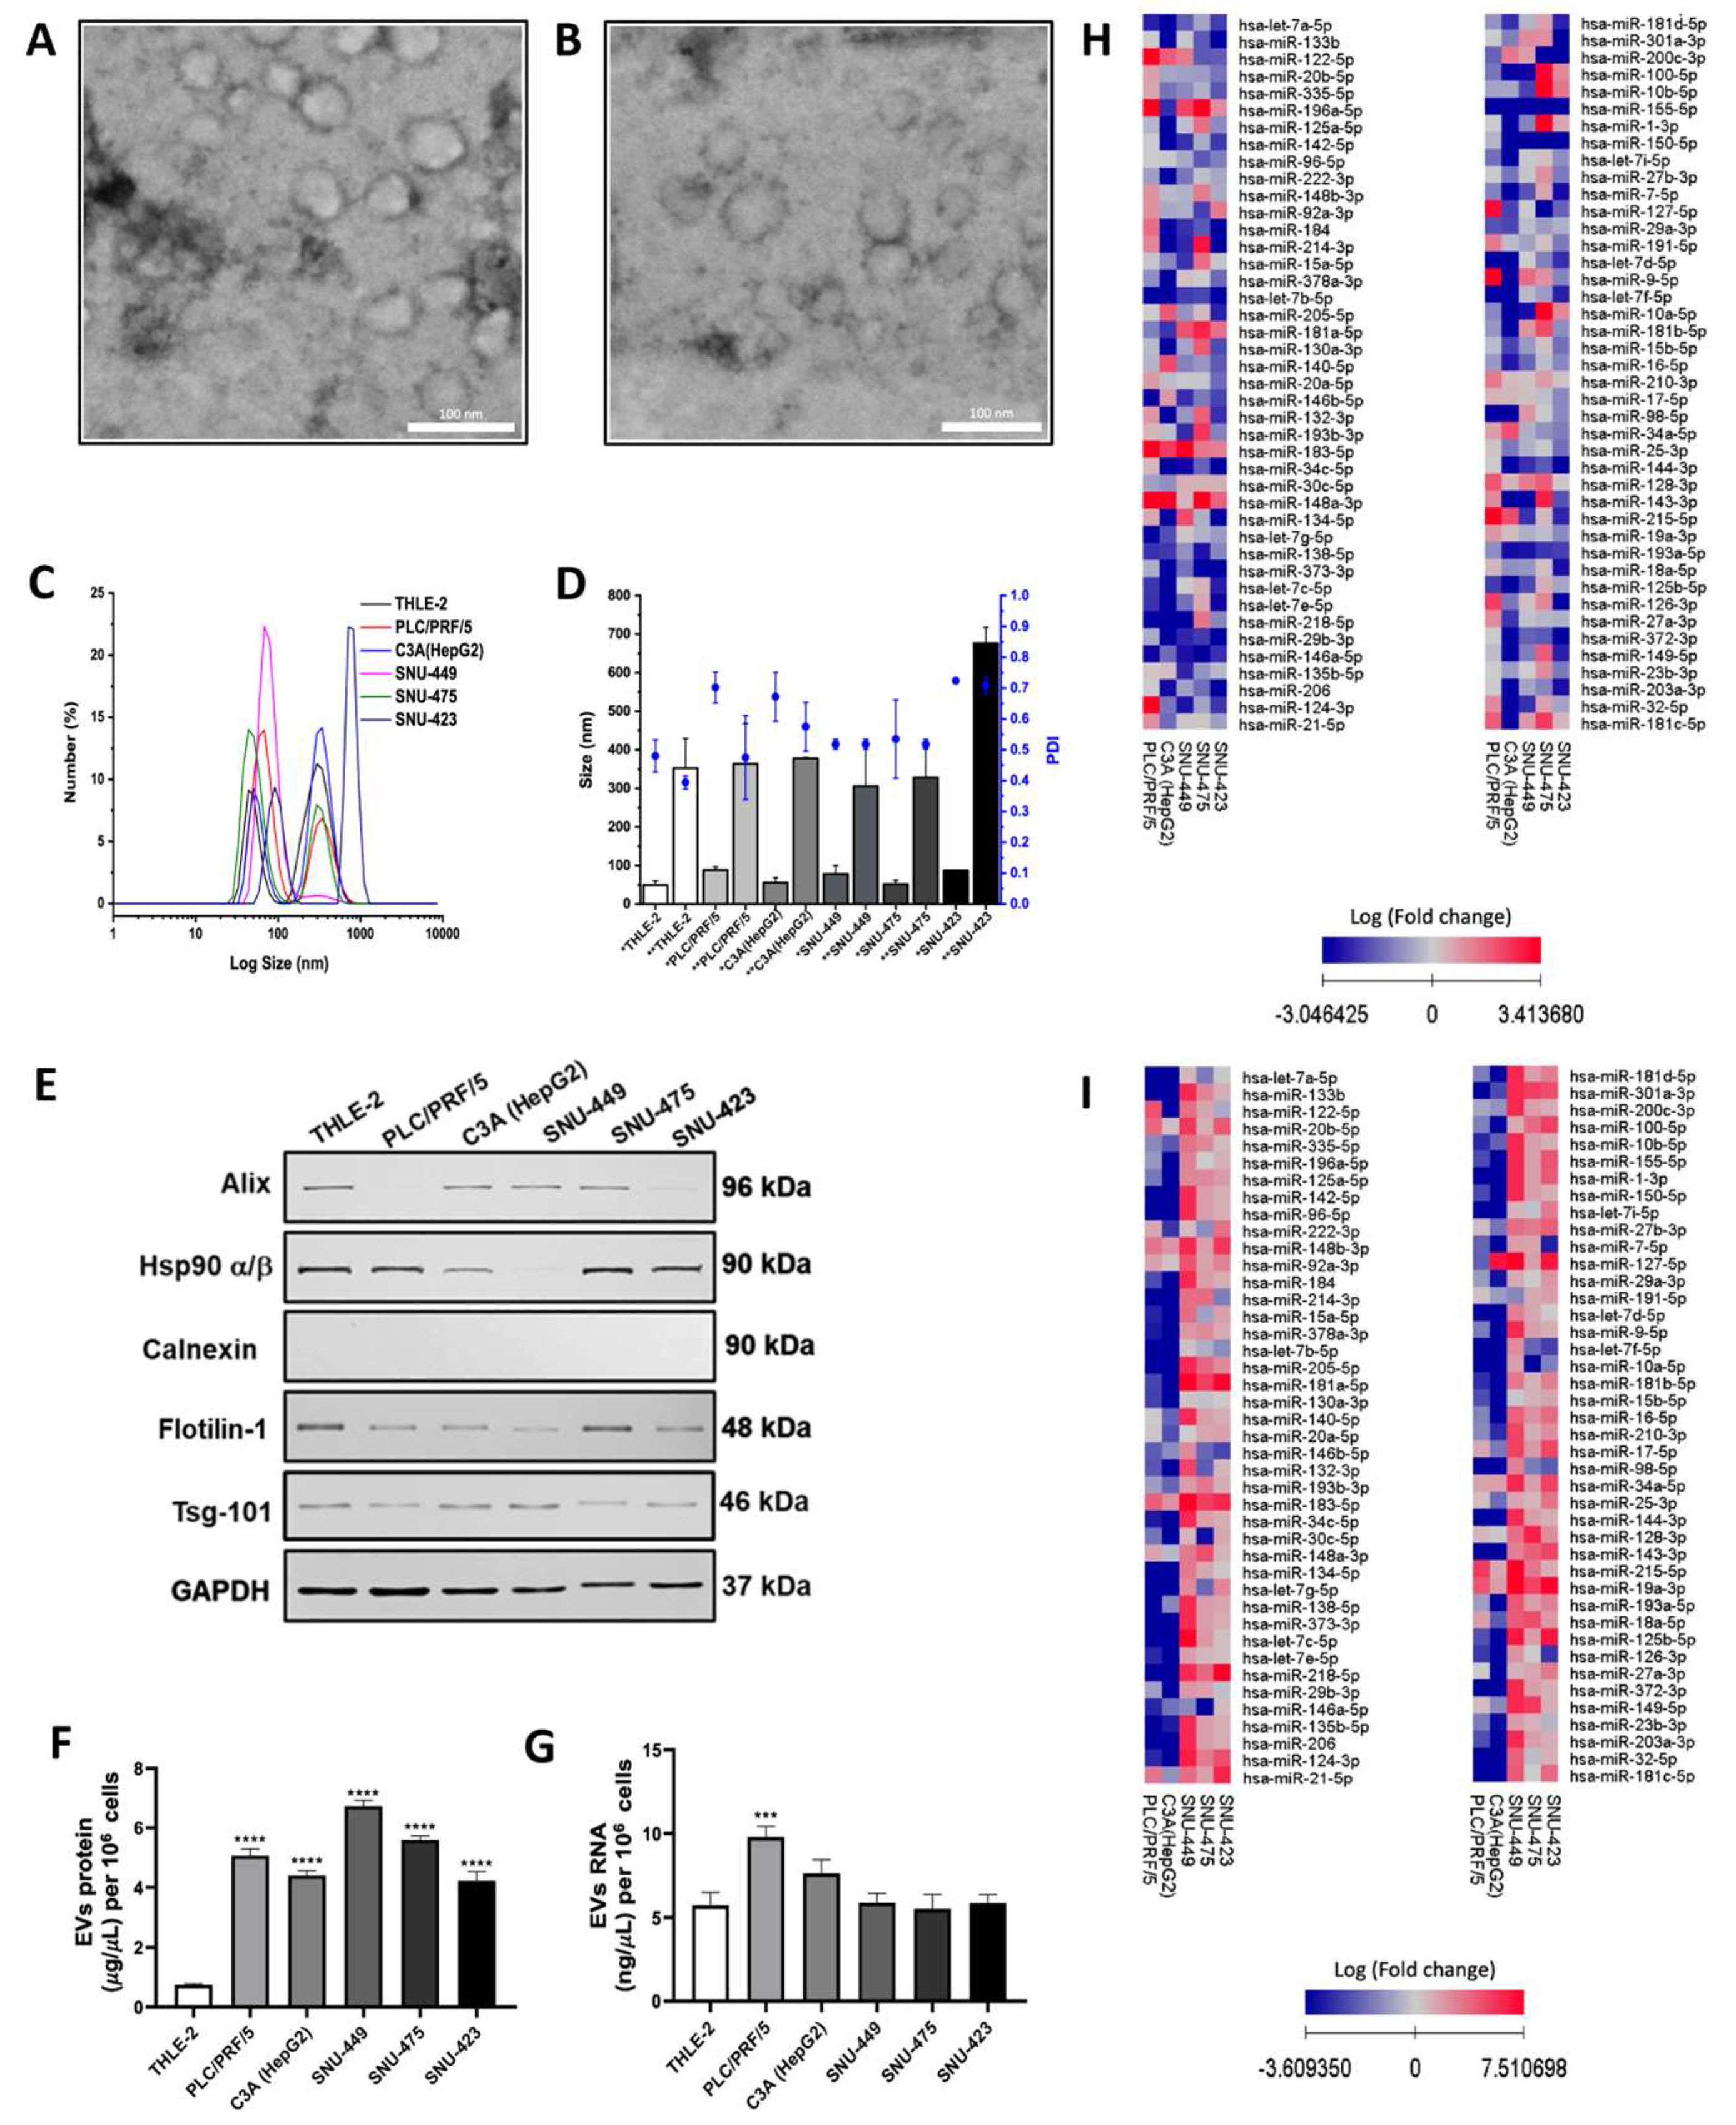
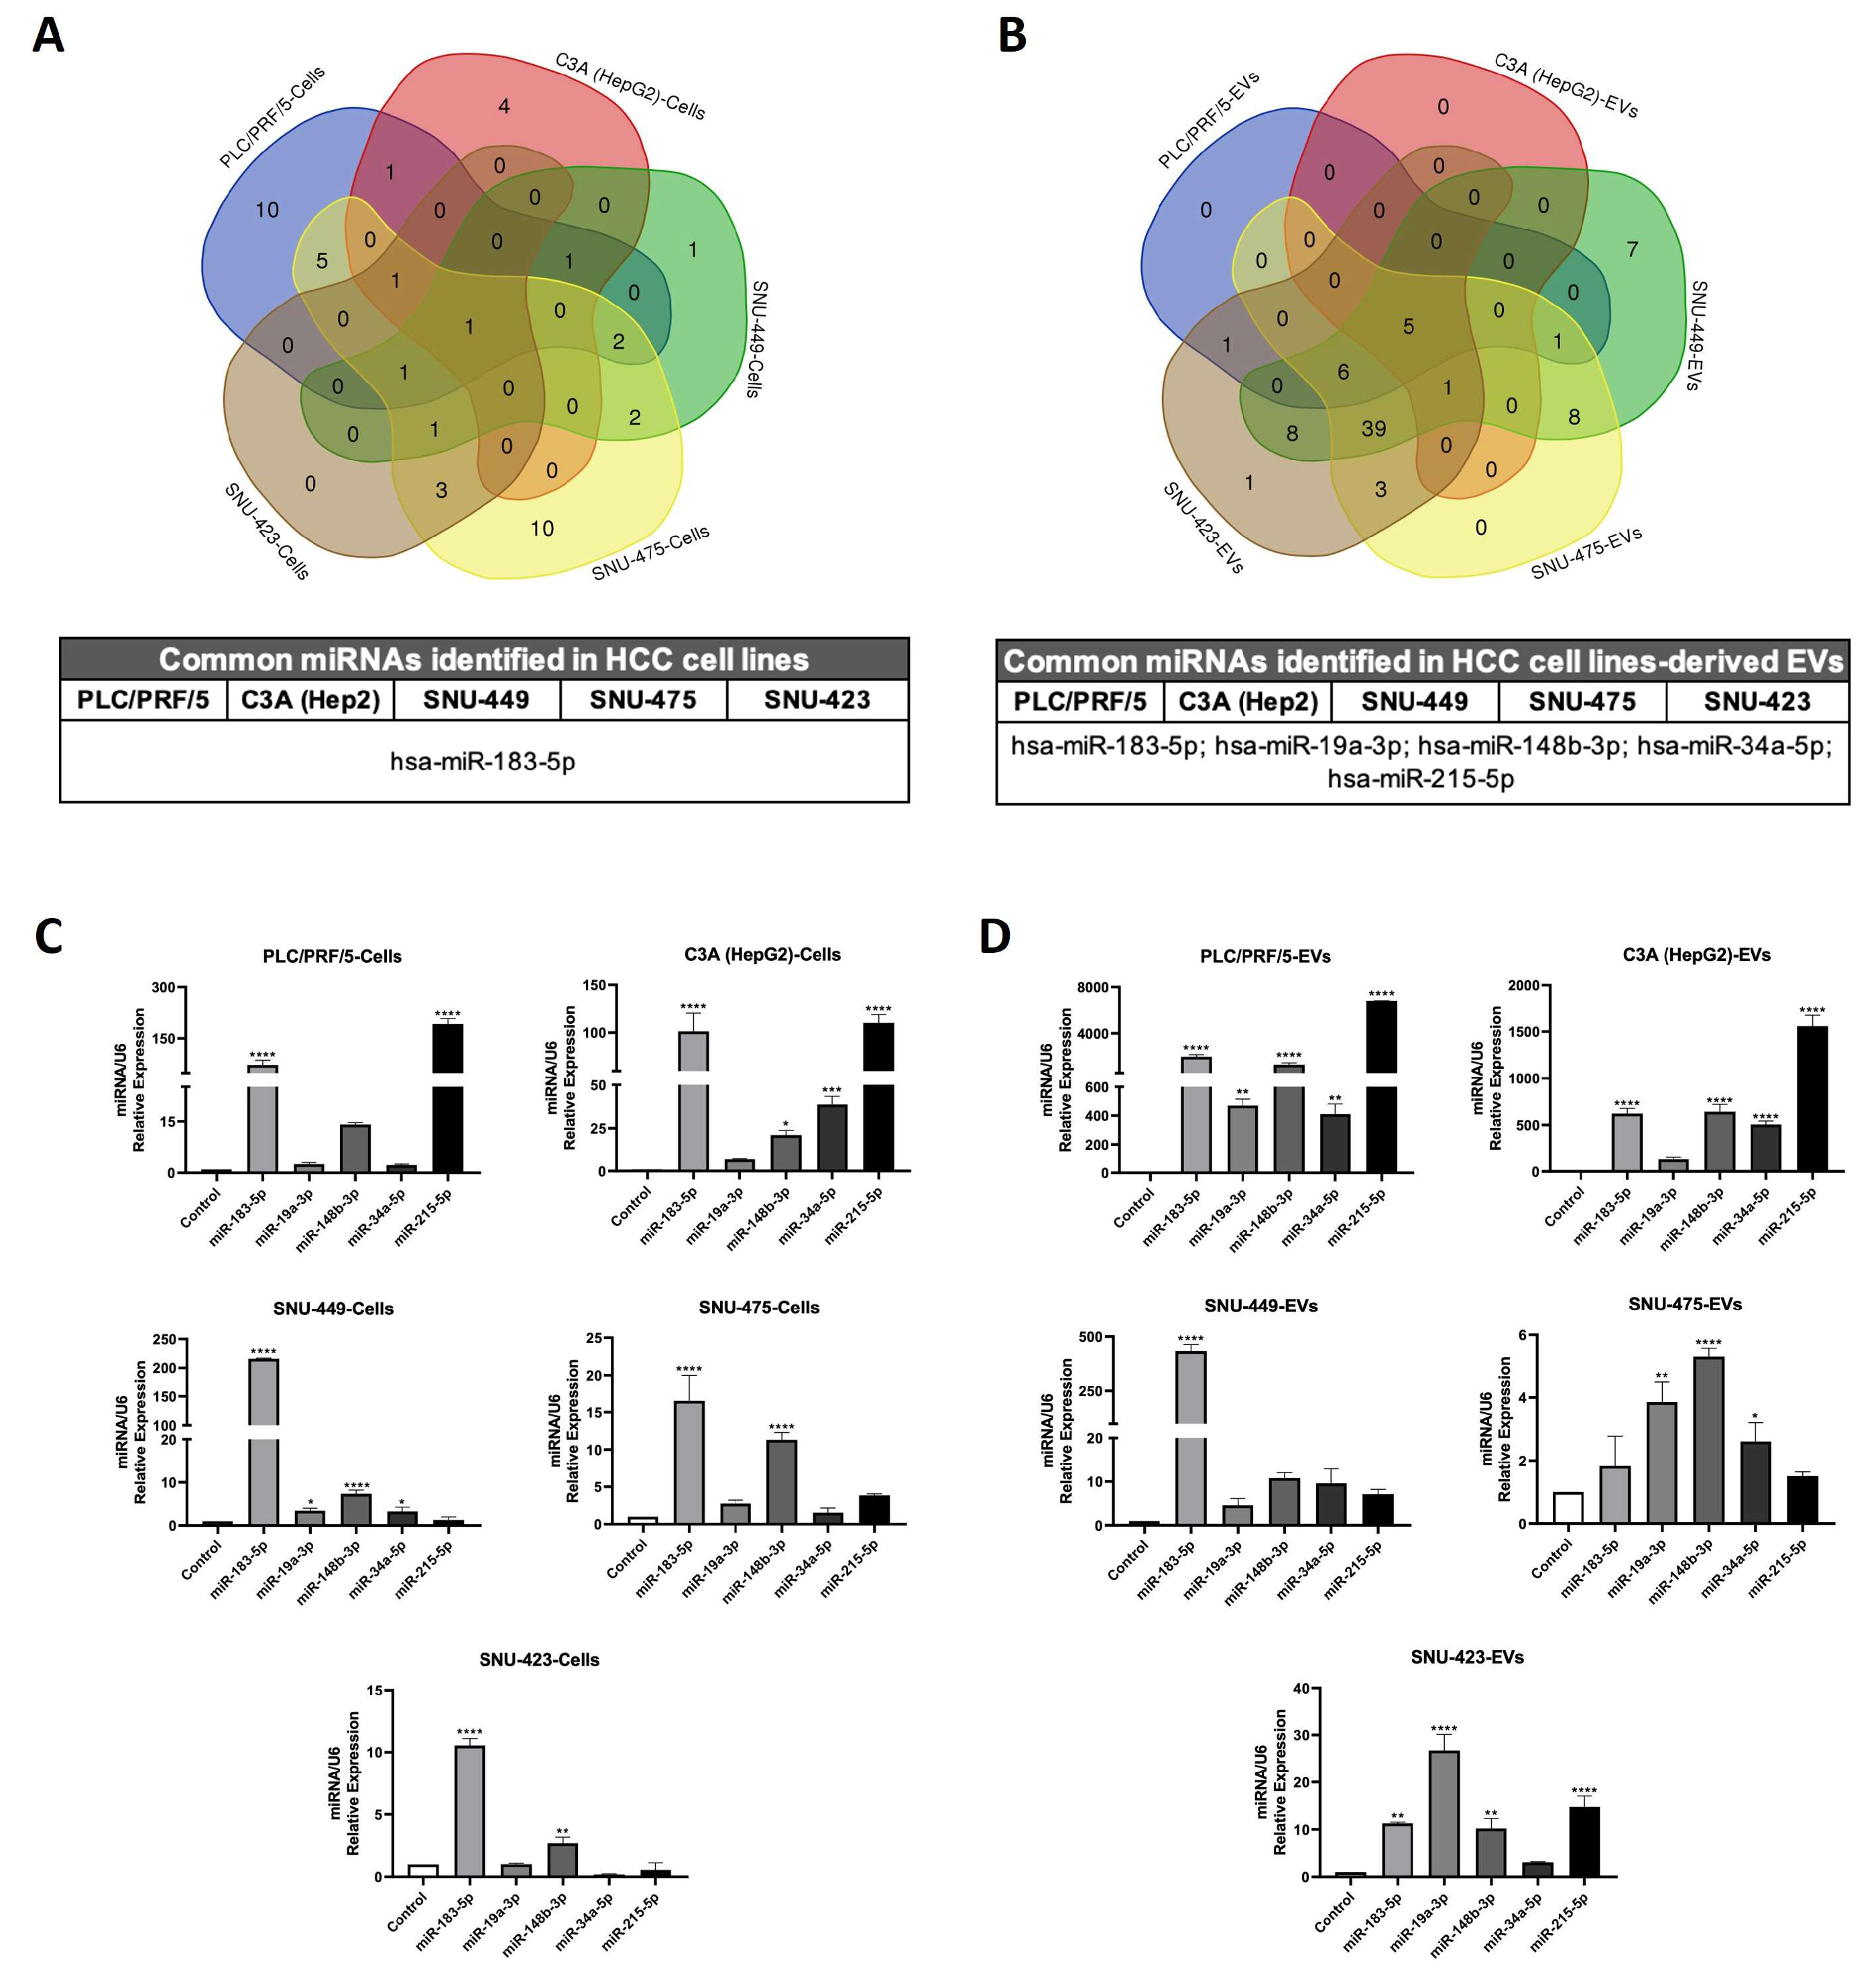
2.1. Isolation and Characterization of EVs Secreted by HCC Cell Lines

Non-tumoral liver cell line (THLE-2) and five hepatoma cell lines subclassified by differentiation stages, two well-differentiated (PLC/PRF/5 and C3A-HepG2) and three poorly differentiated (SNU-449, SNU-475, and SNU-423) were cultured. EVs from cultured cell lines were isolated through sequential ultracentrifugation and characterized by their physical and molecular properties. The EVs morphology analyzed by TEM exhibited a quasi-spherical shape for EVs derived from non-tumoral and tumoral cells (Fig. 1A and B, respectively). Also, the DLS analysis showed the presence of two EVs subpopulations size-distributed, with a range from 30 ηm to 700 ηm and a peak at the size of 40-100 ηm (Polydispersity Index (PDI), 0.428 to 0.709) in the first subpopulation and 200-700 ηm (PDI, 0.415 to 0.724) in the second subpopulation (Fig. 1C and D, Supplementary Table 2). According to the International Society of Extracellular Vesicles (ISEV) guidelines, these two subpopulations can be referred to as small (first peak) and medium/large EVs (second peak). Furthermore, EVs produced by hepatic cell lines showed the presence of EV markers Alix, Hsp90 a/b, Flotilin-1, and Tsg101 and the absence of the negative marker calnexin (Fig. 1E). Additionally, the average protein content in EVs enriched fractions from tumoral cells (5.23 ± 1.16 mg/ml) exhibited an increase beyond four-fold compared to non-tumoral THLE-2-EVs (Fig. 1F). In addition, the RNA concentration in EVs secreted specifically by PLC/PRF/5 exhibited two-fold more RNA (9.80 ± 0.624 ng/ml) than non-tumoral EVs. Interestingly, the RNA content in EVs from the other tumoral cell lines evaluated was similar (6.94 ± 1.79 ng/ml) to non-tumoral THLE-2-derived EVs (Fig. 1G). Therefore, these findings suggest that changes in RNA expression profile, rather than RNA concentrations, may play a role in EVs-derived signaling from cancer cell lines.
Figure 1. Physical and molecular characterization of HCC cells-derived EVs. The EVs purified by ultracentrifugation of culture supernatants of non-tumoral and HCC cell lines were evaluated by TEM and DLS. The representative microphotographs (line scale = 100 ղm) show the morphology of EVs secreted by THLE-2 (A) and PLC/PRF/5 (B) cell lines. DLS analysis for EVs subpopulations size-distributed (C) and PDI (D). The PDI values are represented in blue points over each bar (*peak 1 and **peak 2) with the scale on the right axis of the graph. Total RNAs and protein extracts were obtained from liver cells-derived EVs. The EVs markers (50 mg protein/lane) were analyzed by Western blot (E). A representative image of the Western blot is shown. The protein (F) and RNA (G) of EVs secreted per 1×10⁶ cells were measured by Bradford assay and fluorometry, respectively. Real-time qPCR miRNA microarrays were performed using 300 ng of RNA of cells and EVs. The heat maps reveal the miRNA expression for cells (H) and their secreted EVs (I). The miRNA amounts were normalized with U6 levels (DCt). The miRNAs expressions were calculated as relative expressions (2-DDCt). The values in the heat maps for tumoral cells or EVs represent the fold change (logarithmic scale) to non-tumoral THLE-2 cells- and -EVs. The up-regulated and down-regulated miRNAs are indicated with red and blue scales of square colors, respectively. Data are means ± SD in DLS analysis or protein and RNA quantification of at least three independent experiments. ***p<0.001 and ****p<0.0001 vs. THLE-2 cells- or -EVs.
Preprints 141771 g001
2.2. miRNA Expression Profiles of EVs Derived from Hepatoma Cell Lines
To analyze the cell- and EVs-miRNA profile, we performed a microarray to detect 84 cancer-related miRNAs. The heat maps showed several up-regulated and down-regulated miRNAs in hepatoma cell lines and their EVs produced compared to non-tumoral THLE-2 cells- and -EVs, respectively (Fig. 1H and I). Although miRNA expression patterns in HCC cell lines were not related to their differentiation stage (Fig. 1H), the miRNAs contained by EVs from poorly differentiated HCC cell lines showed an upregulation compared to THLE-2, suggesting a relationship with the differentiation stage (Fig. 1I). Also, we examined the miRNAs expression profiles exclusively found in HCC cell lines and their EVs by Venn diagrams (Fig. 2A and B, respectively). 10 miRNAs were uniquely expressed in PLC/PRF/5, 4 in C3A (HepG2), 1 in SNU-449, and 10 in SNU-475. Moreover, miR-183-5p was the only common miRNA expressed in all HCC cell lines (Fig. 2A and Supplementary Table 3). Only SNU-449 and SNU-423 from EVs displayed 7 and 1 uniquely expressed miRNAs, respectively (Fig. 2B and Supplementary Table 4). The miR-183-5p, miR-19a-3p, miR-148b-3p, miR-34a-5p, and miR-215-5p were common miRNAs expressed in EVs secreted from hepatoma cell lines (Fig. 2B). To confirm these results, we evaluated the miRNA expression by RT-qPCR (Fig. 2C and D). From the five miRNAs commonly expressed in EVs, miR-183-5p is the only expressed in all HCC cells. In contrast, miR-19a-3p, miR-148b-3p, miR-34a-5p, and miR-215-5p are differentially expressed in some tumoral cell lines (Fig. 2C). Interestingly, these five miRNAs showed higher expression in EVs derived from HCC cell lines (Fig. 2D), suggesting a significant modulation by these miRNAs when they are contained in EVs.
Figure 2. Microarray validation by RT-qPCR of shared miRNAs identified in HCC cell lines and their secreted EVs. The up-regulated miRNAs (≥ 2-fold change vs. THLE-2) of the HCC cells (A) and their secreted EVs (B) obtained from microarray data analysis were evaluated by Venn diagrams. The expression of common miRNAs in hepatoma cells (C) and EVs (D) was determined by RT-qPCR. The miRNA amounts were normalized with U6 levels (DCt). The miRNAs expression was calculated as relative expression (2-DDCt) to non-tumoral THLE-2 cells or their EVs. Data are means ± SD of at least three independent experiments. *p<0.05, **p<0.01, ***p<0.001 and ****p<0.0001 vs. THLE-2 cells- or -EVs.
Preprints 141771 g002
2.3. miRNA Expression Profiles in Circulating Plasma EVs of DEN-Induced Rat Model of HCC
To determine the expression levels of miR-183-5p, miR-19a-3p, miR-148b-3p, miR-34a-5p, and miR-215-5p in circulating plasma EVs, we developed a DEN-induced HCC rat model. First, we evaluated liver injury markers in plasma (ALT and GGT) and hepatic tissue (lipid peroxidation), HCC markers in liver biopsies (Afp and Gpc3 expression), and morphometric analysis in both groups (Fig. 3A-B and Supplementary Table 5). Liver injury markers revealed a twofold increase in plasmatic ALT concentrations and no changes in GGT levels; however, we found a fivefold increase in hepatic lipid peroxidation in DEN-treated rats compared with control rats (Supplementary Table 5). Morphometric analysis showed the presence of nodules and tumors in the liver tissue of DEN-treated rats (Fig. 3A). Also, the Afp and Gpc3 expression levels in hepatic tissue increased more than two-fold and four-fold, respectively, and the histopathological analysis of liver biopsies confirmed the development of HCC in DEN-treated rats (Fig. 3A-B and Supplementary Table 6). Once the HCC model was validated, we purified plasmatic EVs by sequential ultracentrifugation and examined the EVs markers by Western blot and particle size and distribution by TEM and DLS. Protein levels of Alix, Hsp90 a/b, Flotilin-1, and Tsg101 in circulating EVs were similar between control and DEN-treated rats (Fig. 3C). TEM analysis exhibited a quasi-spherical shape for EVs derived from plasma of control and DEN-treated rats (Fig. 3D). The DLS analysis revealed three distinct subpopulations of EVs in DEN-treated rats, which had different sizes ranging from 16 ηm to 338 ηm. The size distribution of these three EVs peaks at 16-24 ηm, 36-67 ηm, and 208-338 ηm, while the control rats exhibited a unique population of EVs ranging from 629-762 ηm (Fig. 3E-F and Supplementary Table 7). These subpopulations of EVs can be classified as small (first peak) and medium/large EVs (second and third peak) in DEN-treated rats and only medium/large EVs in control rats. In addition, the protein and RNA levels in plasma circulating EVs did not significantly differ in both groups (p=0.488 and p=0.068, respectively) (Fig. 3G and H). Next, we studied the expression levels of miRNAs by RT-qPCR in liver tissue and plasma circulating EVs (Supplementary Table 6). The relative expression of these five miRNAs did not display differences in hepatic miRNA expression in DEN-treated rats compared to control rats (p=0.49, p=0.07, p=0.59, p=0.59, and p=0.17, respectively) (Supplementary Fig. 1). Interestingly, their expression levels were higher in plasma circulating EVs obtained from DEN-treated rats compared with control rats (p=0.005, p=0.0014, p=0.003, p=0.036, and p=0.0016, respectively) (Fig. 3I). Furthermore, the most significant change in expression was for miR-183-5p, miR-19a-3p, and miR-148b-3p (Fig. 3I). These results suggest a potential application of these five miRNAs as HCC biomarkers.
Figure 3. miRNA expression measurement in plasma EVs of DEN-induced rat model of HCC. To induce HCC in rats, they were injected i.p. with DEN (50 mg/kg) once a week for 16 weeks (n=10). The rats were euthanized at 22 weeks post the first DEN injection, and the liver and plasma were obtained for further analysis (n=5, death percentage=50%). Hepatic tissue of control and DEN-treated rats (A, upper left and right panels) and histological analysis of H&E (line scale = 40x) stained slices from liver biopsies (A, lower left and right panels). Total RNAs were obtained from liver tissue in both analyzed groups, Afp and Gpc3 mRNA expression levels in hepatic tissue by RT-qPCR (B). The mRNA amounts were normalized with Gapdh levels (DCt). The mRNA expressions of DEN-treated rats were calculated as relative expression (2-DDCt) to control rats. EVs were purified by ultracentrifugation of the plasma DEN-induced HCC rat model; The EVs markers (50 mg protein/lane) were evaluated by Western blot (C), and representative micrographs of the EVs are shown (D). DLS analysis for plasmatic EVs subpopulations size-distributed (E) and PDI (F). The PDI values are represented in blue points over each bar (*peak 1, **peak 2, ***peak3) with the scale on the right side of the graph. Total RNA and protein extracts were obtained from plasmatic EVs for control (n=3) and DEN-treated rats (n=5). The circulating EVs RNA (G) and protein (H) were measured using Bradford assay and fluorometry. The miRNA expressions in control and DEN-treated rats were determined by RT-qPCR (I). Both groups calculated miRNA expressions as relative expressions and normalized U6 levels. Data are means ± SD for mRNA expression, DLS analysis, RNA, and protein quantification in at least three independent experiments. The box plot graphs represent the median and interquartile ranges for miRNA data expression. *p<0.05 and **p<0.01 vs. control group.
Preprints 141771 g003
2.4. miRNA Expression Assessment in Plasma EVs Obtained from HCC Patients
We recruited 90 HCC patients with different clinicopathological features and 41 healthy volunteers without liver pathologies. First, we confirmed liver injury (AST and ALT) and HCC markers (AFP) in plasma of both groups and reported the clinical pathological features of HCC patients (Supplementary Table 1). Next, we purified plasma circulating EVs and analyzed the expression levels of the five candidate miRNAs by RT-qPCR to confirm our previous results (Fig. 4A). Our results demonstrated that RNA concentration in plasma EVs was significantly higher in HCC patients compared to healthy subjects (p<0.0001) (Supplementary Fig. 2). In addition, the five miRNAs evaluated showed a higher expression in circulating plasma EVs from HCC patients compared to control subjects (p<0.0001). Additionally, we analyzed the miRNAs expression levels in plasmatic EVs across different TNM stages (I to IV) and Edmondson-Steiner grades (I-II to III-IV) of HCC. The five candidate miRNAs showed significant upregulation in all TNM stages (Fig. 5) and Edmondson-Steiner grades (Fig. 6) compared to healthy subjects (p<0.0001). Interestingly, the expression levels of all analyzed miRNAs can effectively discriminate HCC patients of any tumoral stage and grade from healthy subjects (Fig. 5A-E and Fig. 6A-E). Moreover, the expression levels of miR-183-5p, miR-34a-5p, miR-148b-3p and miR-215-5p in EVs from patients stratified by TNM staging and Edmondson-Steiner grading exhibited an overall upward trend as tumor stage or grade progressed. However, in most TNM classification stages (Fig. 5) they did not present a statistically significant (p>0.05). In contrast, Edmondson-Steiner grading system, the expression levels of miR-183-5p, miR-34a-5p and miR-148b-3p displayed a statically significant difference across grades (p<0.0001). Finally, miR-34a-5p showed a statistically significant increase in TNM stage III and IV compared to stage I of HCC (p=0.049 and p=0.027, respectively), and miR-148b-3p in TNM stage IV compared to stage I (p=0.008) (Fig. 5A, B, and D). Overall, the results suggest a possible clinical application of these five candidate miRNAs contained in EVs (miR-183-5p, miR-34a-5p, miR-148b-3p, miR-19a-3p, and miR-215-5p).
Figure 4. Evaluation of miRNAs expression in plasma circulating EVs of HCC patients and efficacy validation as diagnostic biomarkers. EVs were purified by ultracentrifugation of the plasma of HCC patients within different clinicopathological features (n=90) and healthy subjects without hepatic pathologies (n=41). Total RNAs were obtained from circulating EVs of plasma patients. The miRNA expressions in control subjects and HCC patients were determined by RT-qPCR (A). The miRNAs expressions were calculated as relative expressions and normalized U6 levels in both patient groups. miRNAs data expressions are represented in box plot graphs indicating the median and interquartile ranges. ROC curves analysis from miRNA expression data of HCC patients compared to the control group (B). ****p<0.0001 vs. healthy subjects.
Preprints 141771 g004
Figure 5. Expressions assessments of miRNA-contained in circulating EVs of HCC patients stratified by TNM staging. EVs were purified by the plasma of HCC patients with different tumoral stages I (n=21), II (n=21), III (n=26), IV(n=22), and control subjects (n=41). Total RNAs were obtained from circulating EVs of plasma patients. miRNAs expression levels of plasmatic EVs of HCC patients and healthy subjects were obtained by RT-PCR: miR-183-5p (A), miR-34a-5p (B), miR-148b-3p (C), miR-19a-3p (D), and miR-215-5p (E). The miRNA expressions were calculated as relative expressions and normalized U6 levels in both patient groups. miRNAs data expressions are represented in box plot graphs indicating the median and interquartile ranges. **p<0.01, ***p<0.001 and ****p<0.0001 vs. control subjects.
Preprints 141771 g005

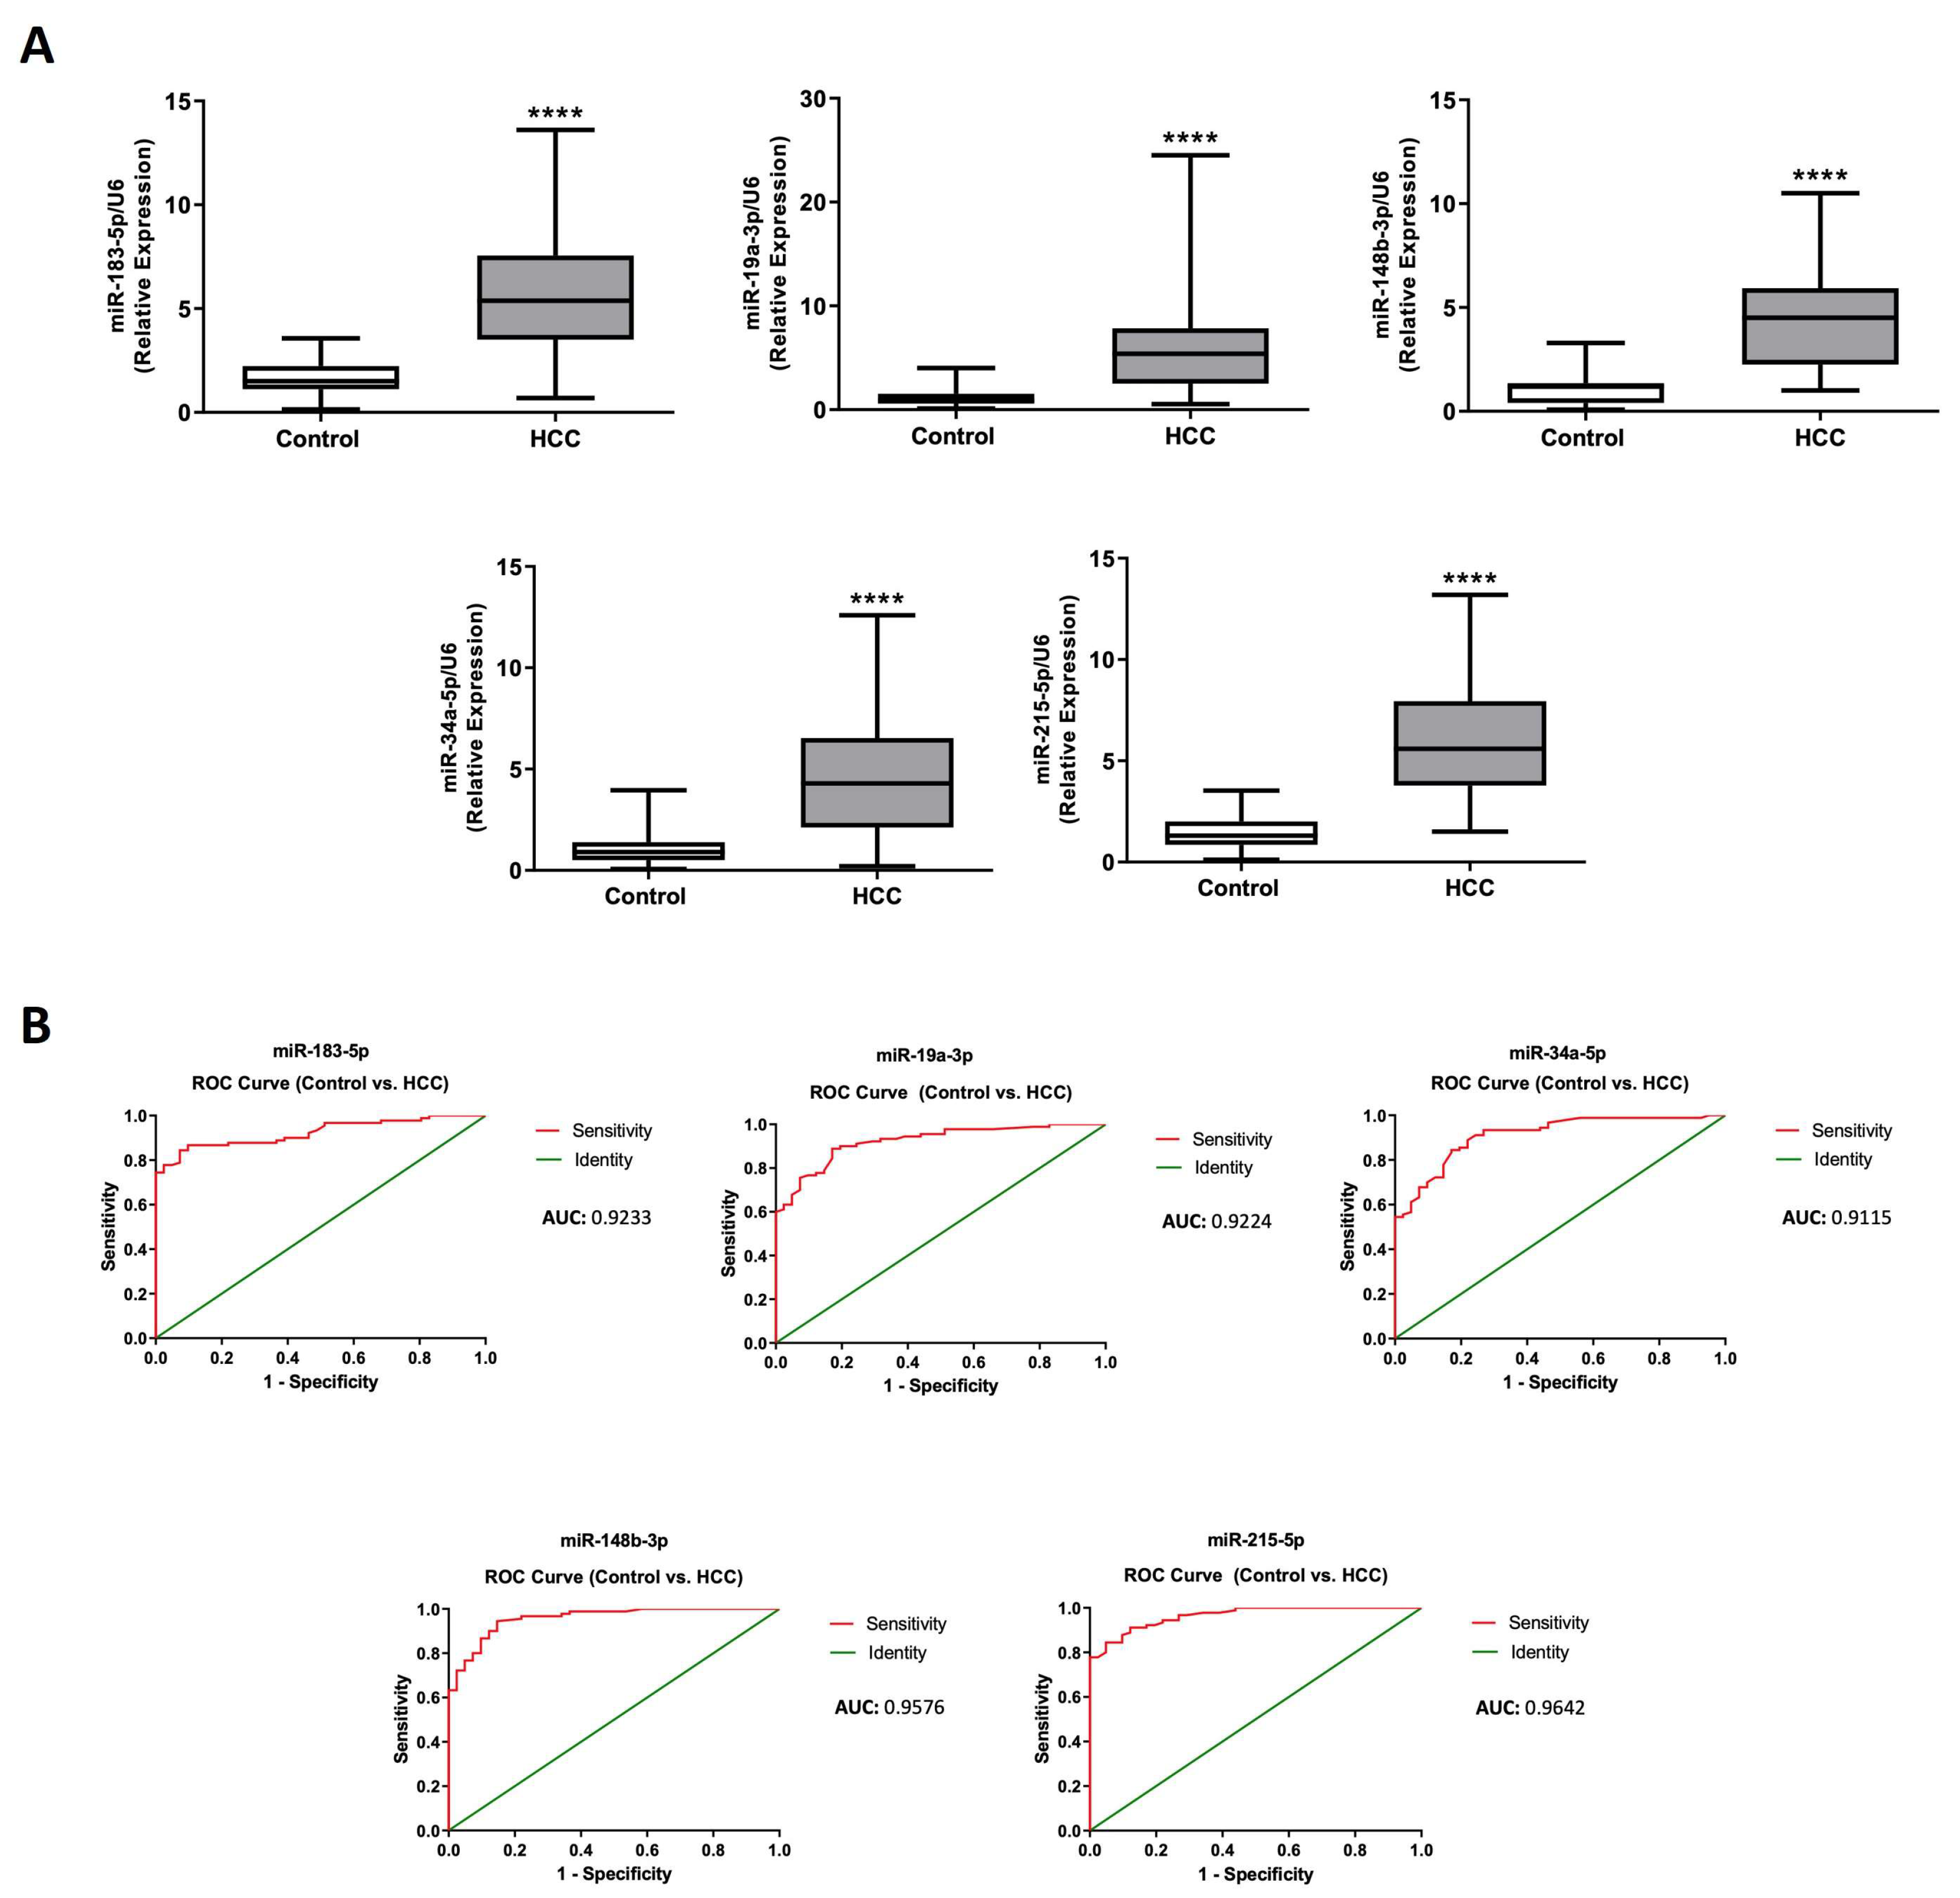
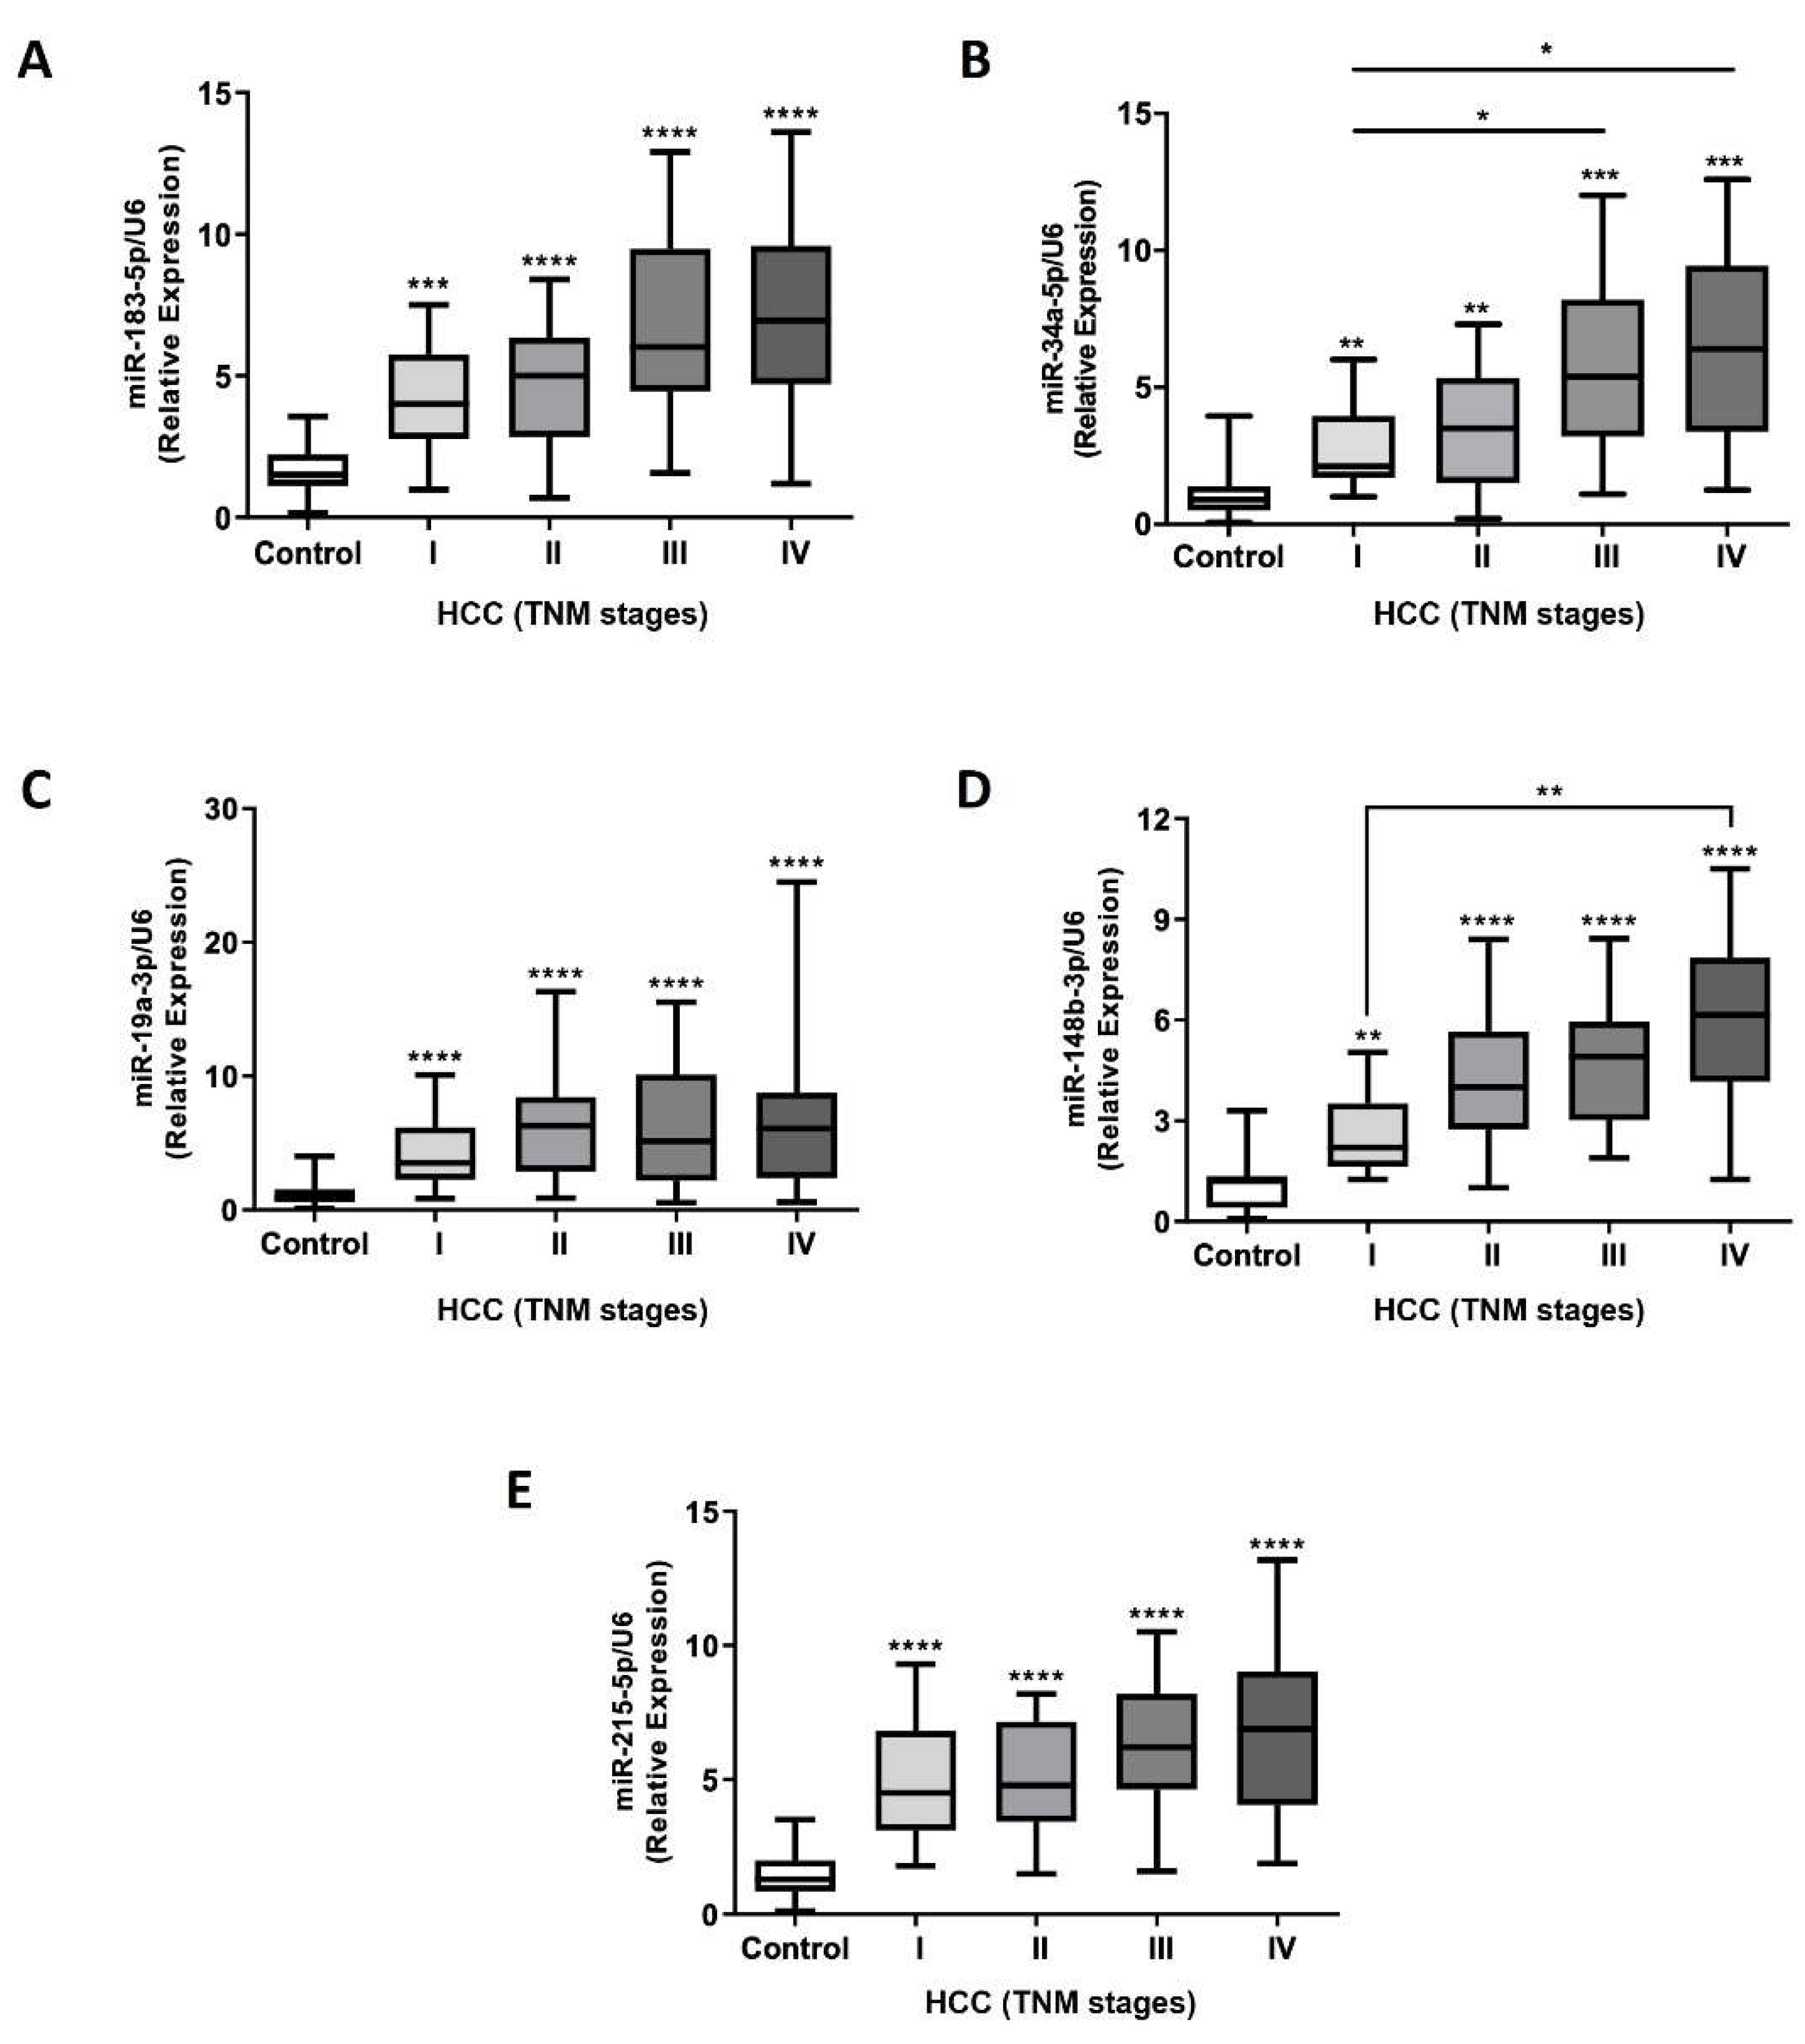
2.5. Efficacy Validation of miRNA-Contained in Plasma Circulating EVs as Diagnostic Biomarkers of HCC

To validate the diagnostic accuracy of miR-183-5p, miR-34a-5p, miR-148b-3p, miR-19a-3p, and miR-215-5p as HCC biomarkers, we evaluated the ROC curves for each miRNA in HCC patients compared to a control group (Fig. 4B and Appendix A, Tables 1 and 2). ROC analysis revealed that the AUC for each miRNA was the following: 0.9233 for miR-183-5p (95% CI, 0.879-0.967, p<0.0001); 0.9224 for miR-19a-3p (95% CI, 0.877-0.967, p<0.0001); 0.9576 for miR-183-5p (95% CI, 0.926-0.989, p<0.0001), and 0.9115 for miR-34a-5p (95% CI, 0.861-0.961, p<0.0001) (Appendix A, Tables 1 and 2). Furthermore, the miRNAs analyzed had a sensitivity of 84.44% to 94.44%, a specificity of 82.93% to 95.12%, accuracy of 83.68% to 88.56%, Youden’s Index of 0.6737 to 0.7981, a positive likelihood ratio (LR+) in an interval between 5 to 17, and negative likelihood ratio (LR-) close to zero. Furthermore, miR-148b-3p showed the highest sensitivity (94.44%) and accuracy (89.90 %), while miR-215-5p presented the maximum LR+ (17.303) and specificity (95.12%) (Appendix A, Tables 1 and 2). These results suggested that the five candidate miRNAs provided promising metrics for discriminating HCC patients from healthy subjects. In addition, we performed the ROC analysis for every miRNA in HCC patients stratified by TNM staging and Edmondson-Steiner grading compared with the control group (Fig. 5 and 6, Appendix A, Tables 1, 2, 3 and 4, and Supplementary Fig. 3 and 4). The results showed that the five candidate miRNAs had an interval of sensitivity 80.65% to 95.45%, specificity 75.61% to 97.56%, accuracy of 78.28% to 94.21%, Youden’s Index of 0.5656 to 0.8743, and LR+ 3.318 to 35.393, and LR- close to zero in HCC patients classified by TNM system. Moreover, the evaluation of diagnostic accuracy parameters of EV-derived miRNAs in HCC patients stratified by Edmondson-Steiner grades revealed sensitivity ranging from 79.41% to 92.86%, specificity 73.17% to 95.12%, accuracy of 80.00% to 93.26%, Youden’s Index of 0.6141 to 0.875, LR+ 3.29 to 87.50 while LR- was close to zero. Also, these results indicated that among the five miRNAs analyzed, miR-148b-3p and miR-215-5p had the most influential parameters in HCC patients by TNM staging, while miR-183-5p and miR-215-5p exhibited the best parameters in HCC patients by Edmondson-Steiner grading. However, we were unable to discriminate between specific stages or grades of HCC. Despite this limitation, the five candidate miRNAs successfully distinguished HCC patients stratified by TNM staging and Edmondson-Steiner grading from healthy subjects.
Figure 6. Expressions assessments of miRNA-contained in circulating EVs of HCC patients stratified by Edmondson-Steiner grading. EVs were purified by the plasma of HCC patients with different tumoral grades I-II (n=34), III-IV (n=56), and control subjects (n=41). Total RNAs were obtained from circulating EVs of plasma patients. miRNAs expression levels of plasmatic EVs of HCC patients and healthy subjects were obtained by RT-PCR: miR-183-5p (A), miR-34a-5p (B), miR-19a-3p (C), miR-148b-3p (D), and miR-215-5p (E). The miRNA expressions were calculated as relative expressions and normalized U6 levels in both patient groups. miRNAs data expressions are represented in box plot graphs indicating the median and interquartile ranges. **p<0.01, ***p<0.001 and ****p<0.0001 vs. control subjects.
Preprints 141771 g006
Figure 7. miRNA combinations analysis as a diagnostic panel for HCC detection. The miRNA data expression of all analyzed miRNAs was evaluated by the combiROC tool to obtain the optimal combinations for diagnostic accuracy. combiROC analysis: control vs. HCC (A), stage I (B), stage II (C), stage III (D), and stage IV (E).
Preprints 141771 g007
2.6. miRNA-Contained in Plasma Circulating EVs as a Diagnostic Panel for HCC Detection
To increase the diagnostic accuracy of the analyzed miRNAs, we determined the optimal correlation between miRNAs expression by combiROC (Fig. 7). The analysis exhibited several miRNAs arrangements to obtain the best diagnostic panel for categorizing HCC patients of all TNM stages from healthy subjects (Fig. 7 and Supplementary Table 8). These results displayed that increasing the number of miRNAs (2 to 5) included in each combination improves the accuracy in AUC, sensitivity, and specificity metrics (Appendix A, Tables 1 and 2, and Supplementary Table 9, 10, 11, 12, and 13). Thus, combining the five candidate miRNAs was the most suitable for a diagnostic panel to discriminate HCC patients in all tumoral stages with AUC=1 and sensitivity, specificity, and accuracy of 100% (Supplementary Table 8). Moreover, for HCC stages III and IV, the optimal number of miRNAs combined in a diagnostic panel is reduced to 3 with similar results (Fig. 7, Supplementary Table 8, 9, 10, 11, 12, and 13). The findings suggest that the five candidates miRNAs analyzed provided a novel diagnostic panel for detecting HCC.

3. Discussion

In this study, we analyzed the expression of miRNAs contained in EVs derived from tumoral liver cell lines, plasma samples of DEN-induced HCC model in rats, and plasma samples from HCC patients, observing consistent patterns of miRNA expression and properties of EVs, which can be helpful in the diagnosis and prognosis of HCC.
The physical and molecular properties of EVs were similar between hepatoma tumoral cell lines; we found small and medium-sized populations of EVs according to
previously published classification criteria [22], suggesting no effect related to differentiation stage. Even EVs from tumoral cell lines compared to non-tumoral cells had similar properties. This result is consistent with previous studies that reported the size of EVs is similar between different tumoral liver cells [23]. Also, EVs from tumoral and non-tumoral cell lines were positive for specific markers of EVs [22], such as Flotilin-1 and Hsp90 α/β in all cell lines. Differences in Alix and Tsg-101 expression could be related to the heterogeneity in the exosome biogenesis process [24].
Interestingly, we found differences in total protein content but not RNA content in all hepatoma cell lines compared to non-tumoral line THLE-2. Several studies have described differences in proteomic or RNA profiles from carcinoma cells [25,26,27], although there is no evidence to be related to total concentrations. Total RNA content is similar only by observing differences in RNA expression profiles, confirmed by differential expression in miRNAs contained in EVs between cell lines. According to this, there was no clear pattern of miRNA expression in the total cell samples. In contrast, there was a clear differential expression between well-differentiated and poorly differentiated tumoral cells, which shifted to up-regulating several miRNAs in poorly differentiated tumoral cells. The process of active miRNAs sorting into EVs is related to cancer progression and metastasis [28]. The literature has described 167 differentially expressed EV miRNAs between four hepatoma cell lines whose shared target genes are related to cancer pathways including proliferation, angiogenesis, and metastasis [23]. In our results, more than fifty miRNAs contained in EVs were deregulated and are involved in several biological processes. Therefore, to obtain a more precise relationship of miRNA expression in HCC, we searched for deregulated miRNAs expressed in all tumoral cell lines. We only found miR-183-5p commonly expressed in total cell samples from all HCC cell lines.
In contrast, five miRNAs, including miR-183-5p, were commonly expressed in EVs from all HCC cell lines and differentially expressed compared to non-tumoral cell line. Previous studies report in normal cells the transfer of miRNAs from cells to exosomes as a mechanism of intercellular communication [29,30] and in cancer cells as a modulator of tumor microenvironment [31]. Our study is one of the first to describe differences in the same miRNAs between total cell and EVs derived from hepatoma cell lines, identifying five common miRNAs in EVs.
Therefore, we developed a DEN-induced HCC rat model to confirm their expression in circulating EVs. We purified circulating EVs from plasma, observing three subpopulations based on size. However, the sizes were similar in EVs from all tumoral cell lines. The number of EVs subpopulations could be explained by the heterogeneity of EVs found in a living system compared to cell lines [32]. In addition, the heterogeneous subpopulations of EV size identified in HCC rats can be related to the pleiotropic effects of tumor cell-derived EVs [33,34,35].
We confirm the expression of the five miRNAs commonly expressed in HCC hepatoma cell lines in a DEN-induced HCC model. Interestingly, their expression levels were similar to total hepatic tissue, only increased in purified EVs compared to healthy rats. These results are consistent with the expression of the five miRNAs in EVs from hepatoma-derived cell lines, even between different stages of differentiation. Previous studies suggest cancer progression and metastasis could be related to signals shared by EVs in hepatocellular carcinoma [27,36]. Several miRNAs are identified exclusively or differentially expressed in HEpG2 and PLC/PRF/5 hepatoma cell-derived EVs to modulate cell growth and viability [25], which had also been identified in cell proliferation [37] and metastasis [38]. In addition, miRNAs can modulate the tumoral microenvironment or over other tissues through circulating EVs (31, 41–43). Accordingly, miRNAs in circulating EVs have been proposed as more accurate biomarkers in cancer [42].
In this regard, we confirmed increased expression of the same five EV-contained miRNAs in samples from HCC patients stratified by TNM stage and Edmondson-Steiner grade compared to healthy patients. Also, clustering HCC patients by tumoral stage or grade, we found increased expression and significant differences between tumoral TNM stages in two miRNAs (miR-34a-5p and miR-148b-3p). In contrast, the miR-183b-5p, miR-34a-5p and miR-148b-3p exhibit statistical differences across Edmondson-Steiner grades. These results suggest potential biomarkers based on miRNAs contained in plasma circulating EVs. Previously, increased miR-92b expression has been reported in circulating EVs in the plasma of HCC patients, which correlates with premature HCC recurrence after transplantation [43]. Moreover, EV-contained miR-665, miR-224, and miR-638 correlate with tumor size or stages in HCC patients [44,45,46]. In addition, circulating miR-122 expression contained in EVs in HCC patients decreased after TACE intervention, which correlates with before and after Child-Pugh score for cirrhosis mortality [47]. In support of our results, miR-215-5p was increased in circulating EVs from HCC patients [48]; in contrast, serum exosomal miR-34a is significantly down-regulated in HCC patients [49], nevertheless, the authors do not identify the specific expression of 3p or 5p arm.
Our study identified five miRNAs up-regulated in all hepatoma cell lines and HCC patients independent of differentiation or tumoral stage, respectively. We then obtained several parameters from ROC analysis to confirm the diagnostic potential of these five miRNAs. Each of the five EV-derived miRNAs demonstrated sensitivity greater than 80.65%, specificity above 75.61%, accuracy greater than 78.28%, a Youden’s index higher than 0.56, a LR+ above 3.3, a LR close to zero, and an AUC greater than 0.9. These results indicate that the diagnostic accuracy parameters effectively discriminate HCC patients stratified by TNM staging or Edmondson-Steiner grading from healthy individuals. Previous studies identified candidate EV-miRNAs with relatively higher diagnostic performance to discriminate HCC from healthy patients. The highest AUC associated with EV-miRNAs expression was 0.932 for miR-10b-5p in a sample of 90 HCC patients compared to 28 healthy individuals [48].
In addition, a study conducted with 72 HCC patients showed higher diagnostic performance of serum EV-miRNAs compared to the same miRNAs freely in plasma to discriminate from HBV or cirrhotic patients [50]. Also, a study conducted with 80 patients reported an AUC of 0.850 from miR-17-5p in serum-collected EV-miRNAs and a higher miR-106a expression strongly associated with poor survival [51]. However, some of these studies did not consider differences between tumoral stages or include the diagnostic performance to discriminate from a healthy patient. In our study, most miRNAs performed better in discriminating the disease even when patients were clustered by tumoral stage.
Finally, the literature proposed to evaluate a panel of miRNAs differentially expressed in pathological conditions, such as cancer, as diagnostic and prognostic biomarkers [42]. Previously, the accuracy in discriminating chronic hepatitis C (CHC) patients from healthy patients was increased by combining three free miRNAs differentially expressed in serum [52]. Similar results were reported with a panel of two free circulating miRNAs in combination with AFP levels to discriminate HCC from cirrhotic patients [53]. Also, a study conducted a computational screening from differentially expressed liver miRNAs, considering three large HCC datasets, reported an increased diagnostic performance using two miRNAs in a combiROC analysis [54]. Moreover, combined miRNAs contained in circulating EVs could increase their accuracy, and according to the American Joint Committee on Cancer (AJCC) and the International Union Against Cancer (UICC), the TNM staging system is widely recognized as an authoritative classification method and has been reported by some authors to outperform other staging systems [55,56]. Given the lack of significant differences in diagnostic accuracy parameters between TNM staging and Edmondson-Steiner grading, we conducted a combiROC analysis using the TNM stage to identify the optimal combination of EV-derived miRNAs for improving diagnostic accuracy.
In comparison to a single miRNA with the highest AUC to discriminate HCC from healthy patients (miR-215-5p; AUC 0.9642), a combiROC of two miRNAs increases the AUC to 0.992 (miR-215-5p / miR-19a-3p) and complete AUC with a five-panel of miRNAs contained in EVs. Previously, two studies reported an increase in diagnostic performance from EV-miRNAs in a ratio of two miRNAs in combination. Two serum EV-miRNAs combiROC increased AUC (0.780) to discriminate HCC in 24 patients compared to 17 healthy patients [57]. Also, two plasma EV-miRNAs combiROC increased AUC (0.85) to discriminate HCC in 48 patients compared with 20 healthy patients [58]. It is important to note that the statistical analysis of combining ROC parameters of more than one marker does not per se guarantee an increase in the diagnostic performance of individual markers, so these results may seem obvious but show a high accuracy with the right combination of diagnostic markers. A study of 40 patients with HCC and liver cirrhosis evaluated the diagnostic performance of plasma-free circulating miRNAs. The combiROC analysis of miR-199a with miR-21-5p had a lower AUC for discriminating HCC from liver cirrhosis compared to combined AUC of AFP and miR-21-5p levels. In contrast, miR199a/miR-155-5p combiROC had the same AUC as miR-155-5p alone [59].
In addition, overall combiROC parameters increased with the five-panel miRNAs clustering the patients by tumoral stage, which highlights their relevant role in HCC diagnosis. Also, as miRNAs are contained in EVs, they can be discriminated from free miRNAs that may be involved in other processes. According to this, EV-miR-215-5p was increased in serum from HCC patients associated with poor disease-free survival [48]. Interestingly, miR-215 was previously reported as a tumor suppressor in colorectal cancer [60,61,62]. Also, miR-34a in tumoral liver tissue has tumor-suppressing effects by inhibiting cell growth in non-metastatic HCC patients, and their expression was increased compared to normal liver tissue [63]. Low levels of miR148b-3p positively regulate the overexpression of deoxythymidilate kinase (DTYMK) oncogene, which is related to poor prognosis and metastasis in HCC patients [64]. In contrast, EV-miR183-5p was increased in our results. Although the removal of tumor-suppressive miRNAs by EVs has been a mechanism previously discussed [31], there is no clear relationship between their function in circulating EVs. On the other hand, EV-miR-34a-5p was up-regulated in T-cell acute lymphoblastic leukemia and reduced bone formation through Wnt1 negative regulation [65]. Also, circulating EV-miR-19a-3p promoted osteosarcoma progression and metastasis through PI3K/Akt signaling in a mice model (Luo et al., 2021), and EV-miR183-5p was enriched in the serum of metastatic melanoma patients [67]. These results suggest a functional role in cancer of the five panel miRNAs identified in EVs derived from hepatoma cell lines and circulating EVs in a DEN-induced HCC model and different tumoral stages of HCC patients. Finally, we understand as a limitation of our study that the miRNAs set only discriminates healthy individuals to HCC patients; therefore, in future studies will be considered to evaluate the miRNAs set in different liver pathologies.

4. Materials and Methods

4.1. Cell Culture

The cell lines used were classified as the control human liver cell line THLE-2, and the tumoral HCC cell lines were subclassified as well-differentiated (PLC/PRF/5 and C3A-HepG2) and poorly differentiated (SNU-449, SNU-475, and SNU-423), these cell lines were obtained from the American Type Culture Collection (ATCC, Manassas, VA., USA). THLE-2 cells were grown in DMEM/F12 (Gibco, Thermo Fisher Scientific), while well-differentiated HCC tumor cell lines in MEM (11095080, Gibco, Thermo Fisher Scientific) and poorly differentiated in RPMI-1640 (11875093, Gibco, Thermo Fisher Scientific). For all conditions, cells were supplemented with 10% FBS (26140079, Gibco, Thermo Fisher Scientific) and antibiotics (100 µg/mL penicillin and streptomycin and 10 µg/mL gentamicin). Culture conditions were performed in 10 cm culture plates in a humidified incubator (37 °C) and 5% CO2.

4.2. Isolation of Extracellular Vesicles

EVs were obtained from the culture supernatant of liver non-tumoral and tumoral HCC cell lines, plasma samples of DEN-induced rat HCC model, and plasma samples from healthy volunteers and HCC patients. Cells were grown (2×10⁶) on a 10 cm plate in 10% FBS-supplemented culture medium (26140079, Gibco, Thermo Fisher Scientific) to 80% confluence and subsequently placed in Exo-Depleted serum (A2720801, Gibco, Thermo Fisher Scientific) incubated for 48h to avoid FBS exosome contamination. The culture supernatants and 1 mL of plasma samples were collected immediately and centrifuged at 2,000 × g (30 min) and subsequently at 12,000 × g (30 min) to remove cell detritus. EVs were isolated by ultracentrifugation (Acceleration rate from 0 to 500 rpm in 1 min and deceleration rate from 500 to 0 in 6 min) at 100,000 × g for 3 h. All centrifugation cycles were performed at 4 °C. Purified EVs were processed for the intended specific analysis (Supplementary material and methods).

4.3. Hepatocellular Carcinoma-induced Rat Model

Male adult Wistar rats (Crl:WI) weighing 250 to 300 g were acquired (Charls River, NC, USA) and housed at the Animal Facility of the Universidad Nacional Autónoma de México. All animal experiments were conducted following the Mexican federal regulations NOM-ZOO-1999-062 regarding the protection of animals used for scientific purposes and received approval by the Ethics Committee for the Care and Handling of Laboratory Animals of the Universidad Nacional Autónoma de México with national authorization SAGARPA-SENASICA AUT-B-C-1216-030 (permission number of institutional protocol approval CICUAL-VCHH156-19). All procedures were approved and supervised, and this study is reported following the ARRIVE guidelines. The animals were fed ad libitum and housed under controlled conditions (22 ± 2 °C, 50–60% relative humidity, and 12 h light-dark cycles). To induce HCC, rats selected by simple randomization and housed at separated room, were injected intraperitoneally with DEN (50 mg/kg) once a week for 16 weeks (n = 10) and maintained without DEN injection for an additional six weeks as recovery time. Rats were sacrificed 22 weeks after the first DEN injection (n = 5, death percentage 50%), and liver injury and HCC markers in serum and hepatic tissue were evaluated. Alanine aminotransferase (ALT) levels were determined by an ALT activity assay (MAK052, Merck, Darmstadt, Germany), and gamma-glutamyl transferase (GGT) was evaluated by a fluorometric GGT activity assay kit (MAK089, Merck, Darmstadt, Germany), according to the manufacturer’s specifications. Lipid peroxidation (mmol MDA/mg protein) was determined by measuring malondialdehyde (MDA) formation using the thiobarbituric acid method previously described by Ohkawa et al. [68].
As described in the previous sections, Afp and Gpc3 expression in hepatic rat tissue was determined by RT-qPCR. Morphometric analysis determined body, liver, and spleen weight and the liver/body weight ratio. Finally, liver tissue samples were processed for histological analysis using the hematoxylin and eosin technique.

4.4. Human Patients Sample Collection

This case-control study comprised 90 patients with clinical and histopathological diagnosis of hepatocellular carcinoma at different tumor stages or grades, who underwent percutaneous liver biopsy and had not received antiviral or antitumoral treatment or undergone liver surgery, and 41 healthy control subjects, as described in Supplementary Table 1. All HCC patients were included based on tumor stage (TNM classification) or grade (Edmondson-Steiner system) and the presence of steatosis, necroinflammation, and fibrosis, and then biopsy results were classified. The healthy volunteers were subjected to various biochemical studies to verify that they did not present metabolic or liver function alterations; the control subjects were not infected by hepatitis B or C virus and were not alcohol consumers (Supplementary Table 1). Patients included were individuals with at least three generations of residence in Mexico, aged between 30 and 70 years, and diagnosed with HCC that have undergone liver tissue biopsy, along with clinical and imaging studies to determine tumoral stage and have a record of full medical history. Exclusion criteria considered patients with antiviral or antitumoral treatment, renal or cardiac disease, lipid and/or carbohydrate metabolism disorders, pregnancy, immunological diseases, or mental disabilities preventing informed consent. Also, patients were eliminated from the study when primary tumours were confirmed outside the liver by biopsy or cannot complete all required research procedures. Peripheral venous blood samples were collected in a sodium citrate Vacutainer tube (BD, Franklin Lakes, NJ, USA) and centrifugated at 1,500 × g by 15 min to separate plasma from the globular package. This study was conducted in accordance with the Declaration of Helsinki and all human samples were obtained after informed consent, and all procedures were approved and supervised by the local ethics committees of Juarez Hospital of Mexico (approval no. CEI-HJM-P/014/2015) and Ixtapaluca High Specialty Regional Hospital (approval no. NR-014-2022). This study was reported following the STARD guidelines for reporting diagnostic accuracy studies [69].

4.5. Data Analysis

According to the normal distribution, data are expressed as the mean ± standard deviation (SD) or median ± interquartile range (IQR). One-way analysis of variance (ANOVA) with Dunnett's post hoc test was employed for multiple comparisons. Two-tailed Student’s t-tests were used for two unpaired sample comparisons. For relative miRNA expression in human patients, a two-tailed Mann-Whitney U test for two unpaired sample comparisons and Kruskal-Wallis with Dunn's post hoc test for multiple comparisons were applied. Statistical significance was set at 95% (p <0.05). Prism software v.9.5.1 (GraphPad, San Diego, California, USA) and Origin Pro v.9.95 (OriginLab Corporation) were used for statistical analysis.
Receiver operating characteristics (ROC) were applied to miRNA expression of human patients to differentiate HCC patients from control non-tumoral patients. The ROC parameters considered were the area under the curve (AUC), sensitivity, specificity, and accuracy. In addition, a combiROC analysis was conducted by combining the cut-off values of each candidate miRNA.

5. Conclusions

Our findings suggest that five miRNAs (miR-19a-3p, miR-34a-5p, miR-148b-3p, miR-183-5p, and miR-215-5p) contained in EVs differentially expressed in hepatoma cell lines compared which non-tumor liver cells are potential biomarkers for HCC. We confirmed their expression in circulating EVs in a DEN-induced HCC rat model and the plasma of HCC patients with different tumoral stages. Each of the five EV-miRNAs showed a high diagnostic performance in discriminating HCC, increasing their potential as biomarkers in a five-combined analysis.

Supplementary Materials

The following supporting information can be downloaded at: Preprints.org, Supplementary materials, and methods, Figure S1: miRNA expression in hepatic tissue of DEN-induced rat model of HCC; Figure S2: RNA quantification in EVs purified from HCC patients, Figure S3: Efficacy validation as diagnostic biomarkers for tumoral stages of HCC, Table S1: Clinicopathological features of the patients, Table S2: Average sizes and PDI of different HCC cells-secreted EVs, Table S3: Common miRNAs identified in HCC cell lines, Table S4: Common miRNAs identified in HCC cell lines-derived EVs, Table S5: DEN rat model features, Table S6: Oligonucleotide sequences employed for validation, Table S7: Average sizes and PDI of different EVs of plasma from DEN-induced rat model of HCC, Table S8: CombiROC analysis of the five miRNAs proposed as biomarkers, Table S9: Markers in healthy group vs. HCC patients, Table S10: Markers in healthy group vs Stage I, Table S11: Markers in healthy group vs Stage II, Table S12: Markers in healthy group vs Stage III and Table S13: Markers in healthy group vs Stage IV.

Author Contributions

F.M.P., D.Z.L., R.G.C., M.S.M., E.C., L.C.S., and V.C.S. contributed to the conception and design of the study. F.M.P., D.Z.L., R.G.C., C.R.B., R.I.P., A.S.G., G.V.L., M.S.M., E.C., and L.C.S. developed the methodology and analyzed the data. F.M.P., D.Z.L., R.G.C., C.R.B., R.I.P., A.S.G., G.V.L., M.S.M., V.C.S and L.C.S. performed the interpretation of data. F.M.P., D.Z.L., R.G.C., C.R.B., A.D.A., J.A., E.C. and L.C.S. wrote the first draft of the manuscript. F.M.P., D.Z.L., R.G.C, R.I.P., A.S.G., A.V.O., E.S.P., R.B.H., A.D.A., E.C. and L.C.S contributed to writing, reviewing, and editing. E.C., V.C.S and L.C.S. funding acquisition. All authors contributed to the manuscript revision and read and approved the submitted version.

Funding

This research was funded by Consejo Nacional de Humanidades, Ciencias y Tecnologías (CONAHCyT), Grant/Award Numbers: FOSISS-261460, Ciencia básica-254674, Ciencia de Frontera-501204, FOP02-2022-02-321696, fellowships 811380 and 811555.

Institutional Review Board Statement

This study was conducted involving human participants in accordance with the Declaration of Helsinki and ethical supervision and approval of local ethics committees of Juarez Hospital of Mexico (no. CEI-HJM-P/014/2015 on April 30th, 2015) and Ixtapaluca High Specialty Regional Hospital (no. NR-014-2022 on June 8th, 2022). All human samples were obtained after informed consent and this research was reported following the STARD guidelines for reporting diagnostic accuracy studies. The animal experiments were conducted following the Mexican federal regulations NOM-ZOO-1999-062 and received approval by the Ethics Committee for the Care and Handling of Laboratory Animals of the Universidad Nacional Autónoma de México (No. CICUAL-VCHH156-19 on November 4th, 2019). All procedures were approved and supervised, and this study is reported following the ARRIVE guidelines.

Informed Consent Statement

Informed consent was obtained from all subjects involved in the study.

Data Availability Statement

All relevant data are included in the manuscript or supplementary material. Any additional request can be directed to the corresponding authors.

Acknowledgments

F.M.P. and R.G.C. were supported by the predoctoral fellowship 811380 and 811555 from Consejo Nacional de Humanidades, Ciencias y Tecnologías (CONAHCyT), respectively. In addition, CONAHCYT grants supported this work under FOSISS project 261460, Ciencia básica project 254674, Ciencia de Frontera-2019 project 501204, and FOP02-2022-02 project 321696. We would also like to thank Dr. Rodolfo Paredes Díaz for his support of the imaging unit of the Institute and Ms. Sandra Moncada for her specialized advice on the selection of bibliographic collections.

Conflicts of Interest

The authors declare no conflicts of interest.

Appendix A

Table A1. ROC analysis of miRNAs (ΔCt) in HCC patients (TNM stage) vs. healthy (Part 1).
Group miRNA Cut-off value Sensitivity (%) Specificity (%) Accuracy(%) Youden´s index (J)
Control vs. HCC miR-183-5p 2.614 84.44 92.68 88.56 0.7712
miR-19a-3p 1.801 88.89 82.93 85.91 0.7182
miR-148b-3p 1.515 94.44 85.37 89.90 0.7981
miR-34a-5p 1.810 84.44 82.93 83.68 0.6737
miR-215-5p 3.163 84.44 95.12 89.78 0.7956
Control vs. Stage I miR-183-5p 2.495 80.95 90.24 85.59 0.7119
miR-19a-3p 1.801 90.48 82.93 86.70 0.7341
miR-148b-3p 1.515 90.48 85.37 87.92 0.7585
miR-34a-5p 1.510 90.48 78.05 84.24 0.6853
miR-215-5p 2.833 85.71 90.24 87.97 0.7595
Control vs. Stage II miR-183-5p 2.480 85.71 90.24 87.97 0.7595
miR-19a-3p 2.700 80.95 92.68 86.81 0.7363
miR-148b-3p 1.982 95.24 90.24 92.74 0.8548
miR-34a-5p 1.400 80.95 75.61 78.28 0.5656
miR-215-5p 3.213 80.95 95.12 88.03 0.7607
Control vs. Stage III miR-183-5p 3.457 88.46 97.56 93.01 0.8602
miR-19a-3p 1.635 88.46 80.49 84.47 0.6895
miR-148b-3p 1.982 96.15 90.24 93.19 0.8639
miR-34a-5p 2.582 88.46 92.68 90.57 0.8114
miR-215-5p 3.163 92.31 95.12 94.21 0.8743
Control vs. Stage IV miR-183-5p 3.457 86.36 97.56 91.96 0.8392
miR-19a-3p 1.873 90.91 82.93 86.92 0.7384
miR-148b-3p 3.010 86.36 97.56 91.96 0.8392
miR-34a-5p 2.582 86.36 92.68 89.52 0.7904
miR-215-5p 2.669 95.45 87.80 91.62 0.8325
Table A2. ROC analysis of miRNAs (ΔCt) in HCC patients (TNM stage) vs. healthy group (Part 2).
Group miRNA LR+ LR- AUC SE 95% CI p-value
Control vs. HCC miR-183-5p 11.535 0.167 0.9233 0.02232 0.879-0.967 <0.0001
miR-19a-3p 5.207 0.133 0.9224 0.02281 0.877-0.967 <0.0001
miR-148b-3p 6.455 0.065 0.9576 0.01604 0.926-0.989 <0.0001
miR-34a-5p 4.946 0.187 0.9115 0.02537 0.861-0.961 <0.0001
miR-215-5p 17.303 0.163 0.9642 0.01328 0.938-0.990 <0.0001
Control vs. Stage I miR-183-5p 8.294 0.211 0.8827 0.05029 0.784-0.981 <0.0001
miR-19a-3p 5.300 0.114 0.9199 0.03475 0.851-0.988 <0.0001
miR-148b-3p 6.184 0.111 0.9181 0.03396 0.851-0.984 <0.0001
miR-34a-5p 4.122 0.121 0.8705 0.04410 0.784-0.957 <0.0001
miR-215-5p 8.781 0.158 0.9506 0.02526 0.901-1.000 <0.0001
Control vs. Stage II miR-183-5p 8.781 0.158 0.8995 0.04988 0.801-0.997 <0.0001
miR-19a-3p 11.058 0.205 0.9274 0.03496 0.858-0.995 <0.0001
miR-148b-3p 9.758 0.052 0.9559 0.02877 0.899-1.000 <0.0001
miR-34a-5p 3.318 0.251 0.8339 0.05851 0.719-0.948 <0.0001
miR-215-5p 16.588 0.200 0.9547 0.02591 0.903-1.000 <0.0001
Control vs. Stage III miR-183-5p 36.254 0.118 0.9587 0.02505 0.909-1.000 <0.0001
miR-19a-3p 4.534 0.143 0.9203 0.03738 0.847-0.993 <0.0001
miR-148b-3p 9.851 0.042 0.9822 0.01154 0.959-1.000 <0.0001
miR-34a-5p 12.084 0.124 0.9601 0.02177 0.917-1.000 <0.0001
miR-215-5p 18.915 0.080 0.9737 0.01801 0.938-1.000 <0.0001
Control vs. Stage IV miR-183-5p 35.393 0.139 0.9429 0.03764 0.869-1.000 <0.0001
miR-19a-3p 5.325 0.109 0.9224 0.03873 0.846-0.998 <0.0001
miR-148b-3p 35.393 0.139 0.9678 0.02057 0.927-1.000 <0.0001
miR-34a-5p 11.797 0.147 0.9673 0.01856 0.930-1.000 <0.0001
miR-215-5p 7.823 0.051 0.9751 0.01619 0.943-1.000 <0.0001
Table A3. ROC analysis of miRNAs (ΔCt) in HCC patients (Edmondson-Steiner grade) vs. healthy group (Part 1).
Group miRNA Cut-off value Sensitivity (%) Specificity (%) Accuracy (%) Youden's index (J)
Control vs I - II miR-183-5p 2.48 82.35 90.24 86.67 0.7259
miR-19a-3p 2.515 79.41 92.68 86.67 0.7209
miR-148b-3p 1.515 91.18 85.37 88.00 0.7655
miR-34a-5p 1.24 88.24 73.17 80.00 0.6141
miR-215-5p 2.833 82.35 90.24 86.67 0.7259
Control vs III- IV miR-183-5p 3.582 87.5 100 93.26 0.875
miR-19a-3p 1.801 89.29 82.93 86.60 0.7222
miR-148b-3p 1.982 92.86 90.24 91.75 0.831
miR-34a-5p 2.582 85.96 92.68 88.78 0.7864
miR-215-5p 3.163 89.58 95.12 92.13 0.847
Table A4. ROC analysis of miRNAs (ΔCt) in HCC patients (Edmondson-Steiner grade) vs. healthy group (Part 2).
Group miRNA LR + LR - AUC SE 95% CI p-value
Control vs I - II miR-183-5p 8.44 0.12 0.892 0.03877 0.8161 - 0.9680 <0.0001
miR-19a-3p 10.85 0.09 0.9186 0.03082 0.8582 - 0.9790 <0.0001
miR-148b-3p 6.23 0.16 0.9258 0.02952 0.8679 - 0.9836 <0.0001
miR-34a-5p 3.29 0.30 0.8375 0.04707 0.7453 - 0.9298 <0.0001
miR-215-5p 8.44 0.12 0.9426 0.02386 0.8958 - 0.9894 <0.0001
Control vs III- IV miR-183-5p 87.50 0.00 0.9515 0.02246 0.9074 - 0.9955 <0.0001
miR-19a-3p 5.23 0.19 0.9247 0.02624 0.8732 - 0.9761 <0.0001
miR-148b-3p 9.51 0.11 0.9769 0.01139 0.9546 - 0.9992 <0.0001
miR-34a-5p 11.74 0.09 0.9572 0.01746 0.9230 - 0.9914 <0.0001
miR-215-5p 18.36 0.05 0.9743 0.01323 0.9484 - 1.000 <0.0001

References

  1. Farazi, P.A.; DePinho, R.A. Hepatocellular Carcinoma Pathogenesis: From Genes to Environment. Nat Rev Cancer 2006, 6, 674–687. [Google Scholar] [CrossRef] [PubMed]
  2. Forner, A.; Reig, M.; Bruix, J. Hepatocellular Carcinoma. The Lancet 2018, 391, 1301–1314. [Google Scholar] [CrossRef] [PubMed]
  3. Bray, F.; Laversanne, M.; Sung, H.; Ferlay, J.; Siegel, R.L.; Soerjomataram, I.; Jemal, A. Global Cancer Statistics 2022: GLOBOCAN Estimates of Incidence and Mortality Worldwide for 36 Cancers in 185 Countries. CA Cancer J Clin 2024. [Google Scholar] [CrossRef]
  4. Wang, W.; Wei, C. Advances in the Early Diagnosis of Hepatocellular Carcinoma. Genes Dis 2020, 7, 308–319. [Google Scholar] [CrossRef]
  5. Rao, A.; Rich, N.E.; Marrero, J.A.; Yopp, A.C.; Singal, A.G. Diagnostic and Therapeutic Delays in Patients with Hepatocellular Carcinoma. JNCCN Journal of the National Comprehensive Cancer Network 2021, 19, 1063–1071. [Google Scholar] [CrossRef]
  6. Bruix, J.; Sherman, M. Management of Hepatocellular Carcinoma: An Update. Hepatology 2011, 53, 1020–1022. [Google Scholar] [CrossRef]
  7. Di Tommaso, L.; Spadaccini, M.; Donadon, M.; Personeni, N.; Elamin, A.; Aghemo, A.; Lleo, A. Role of Liver Biopsy in Hepatocellular Carcinoma. World J Gastroenterol 2019, 25, 6041–6052. [Google Scholar] [CrossRef]
  8. Forner, A.; Vilana, R.; Ayuso, C.; Bianchi, L.; Solé, M.; Ayuso, J.R.; Boix, L.; Sala, M.; Varela, M.; Llovet, J.M.; et al. Diagnosis of Hepatic Nodules 20 Mm or Smaller in Cirrhosis: Prospective Validation of the Noninvasive Diagnostic Criteria for Hepatocellular Carcinoma. Hepatology 2008, 47, 97–104. [Google Scholar] [CrossRef]
  9. Dimitroulis, D.; Damaskos, C.; Valsami, S.; Davakis, S.; Garmpis, N.; Spartalis, E.; Athanasiou, A.; Moris, D.; Sakellariou, S.; Kykalos, S.; et al. From Diagnosis to Treatment of Hepatocellular Carcinoma: An Epidemic Problem for Both Developed and Developing World. World J Gastroenterol 2017, 23, 5282–5294. [Google Scholar] [CrossRef]
  10. Villanueva, A. Hepatocellular Carcinoma. New England Journal of Medicine 2019, 380, 1450–1462. [Google Scholar] [CrossRef]
  11. Debes, J.D.; Romagnoli, P.A.; Prieto, J.; Arrese, M.; Mattos, A.Z.; Boonstra, A. Serum Biomarkers for the Prediction of Hepatocellular Carcinoma. Cancers (Basel) 2021, 13. [Google Scholar] [CrossRef] [PubMed]
  12. Beudeker, B.J.B.; Boonstra, A. Circulating Biomarkers for Early Detection of Hepatocellular Carcinoma. Therap Adv Gastroenterol 2020, 13. [Google Scholar] [CrossRef] [PubMed]
  13. Van Niel, G.; D’Angelo, G.; Raposo, G. Shedding Light on the Cell Biology of Extracellular Vesicles. Nat Rev Mol Cell Biol 2018, 19, 213–228. [Google Scholar] [CrossRef]
  14. Latifkar, A.; Cerione, R.A.; Antonyak, M.A. Probing the Mechanisms of Extracellular Vesicle Biogenesis and Function in Cancer. Biochem Soc Trans 2018, 46, 1137–1146. [Google Scholar] [CrossRef]
  15. Lin, S.; Gregory, R.I. MicroRNA Biogenesis Pathways in Cancer. Nat Rev Cancer 2015, 15, 321–333. [Google Scholar] [CrossRef]
  16. Bronte, F.; Bronte, G.; Fanale, D.; Caruso, S.; Bronte, E.; Bavetta, M.G.; Fiorentino, E.; Rolfo, C.; Bazan, V.; Marco, V. Di; et al. HepatomiRNoma: The Proposal of a New Network of Targets for Diagnosis, Prognosis and Therapy in Hepatocellular Carcinoma. Crit Rev Oncol Hematol 2016, 97, 312–321. [Google Scholar] [CrossRef]
  17. Corsini, L.R.; Bronte, G.; Terrasi, M.; Amodeo, V.; Fanale, D.; Fiorentino, E.; Cicero, G.; Bazan, V.; Russo, A. The Role of MicroRNAs in Cancer: Diagnostic and Prognostic Biomarkers and Targets of Therapies. Expert Opin Ther Targets 2012, 16. [Google Scholar] [CrossRef]
  18. Yang, N.; Ekanem, N.R.; Sakyi, C.A.; Ray, S.D. Hepatocellular Carcinoma and MicroRNA: New Perspectives on Therapeutics and Diagnostics. Adv Drug Deliv Rev 2015, 81, 62–74. [Google Scholar] [CrossRef]
  19. Jansson, M.D.; Lund, A.H. MicroRNA and Cancer. Mol Oncol 2012, 6, 590–610. [Google Scholar] [CrossRef]
  20. Thurnherr, T.; Mah, W.C.; Lei, Z.; Jin, Y.; Rozen, S.G.; Lee, C.G. Differentially Expressed MiRNAs in Hepatocellular Carcinoma Target Genes in the Genetic Information Processing and Metabolism Pathways. Sci Rep 2016, 6. [Google Scholar] [CrossRef]
  21. Chang, W.H.; Cerione, R.A.; Antonyak, M.A. Extracellular Vesicles and Their Roles in Cancer Progression. Methods in Molecular Biology 2021, 2174, 143–170. [Google Scholar] [CrossRef] [PubMed]
  22. Théry, C.; Witwer, K.W.; Aikawa, E.; Alcaraz, M.J.; Anderson, J.D.; Andriantsitohaina, R.; Antoniou, A.; Arab, T.; Archer, F.; Atkin-Smith, G.K.; et al. Minimal Information for Studies of Extracellular Vesicles 2018 (MISEV2018): A Position Statement of the International Society for Extracellular Vesicles and Update of the MISEV2014 Guidelines. J Extracell Vesicles 2018, 7. [Google Scholar] [CrossRef] [PubMed]
  23. Berardocco, M.; Radeghieri, A.; Busatto, S.; Gallorini, M.; Raggi, C.; Gissi, C.; D’Agnano, I.; Bergese, P.; Felsani, A.; Berardi, A.C. RNA-Seq Reveals Distinctive RNA Profiles of Small Extracellular Vesicles from Different Human Liver Cancer Cell Lines. Oncotarget 2017, 8, 82920–82939. [Google Scholar] [CrossRef] [PubMed]
  24. Colombo, M.; Moita, C.; Van Niel, G.; Kowal, J.; Vigneron, J.; Benaroch, P.; Manel, N.; Moita, L.F.; Théry, C.; Raposo, G. Analysis of ESCRT Functions in Exosome Biogenesis, Composition and Secretion Highlights the Heterogeneity of Extracellular Vesicles. J Cell Sci 2013, 126, 5553–5565. [Google Scholar] [CrossRef]
  25. Kogure, T.; Lin, W.L.; Yan, I.K.; Braconi, C.; Patel, T. Intercellular Nanovesicle-Mediated MicroRNA Transfer: A Mechanism of Environmental Modulation of Hepatocellular Cancer Cell Growth. Hepatology 2011, 54, 1237–1248. [Google Scholar] [CrossRef]
  26. Hurwitz, S.N.; Rider, M.A.; Bundy, J.L.; Liu, X.; Singh, R.K.; Meckes, D.G. Proteomic Profiling of NCI-60 Extracellular Vesicles Uncovers Common Protein Cargo and Cancer Type-Specific Biomarkers; 2016; Vol. 7;
  27. Wu, Z.; Zeng, Q.; Cao, K.; Sun, Y. Exosomes: Small Vesicles with Big Roles in Hepatocellular Carcinoma. Oncotarget 2016, 7, 60687–60697. [Google Scholar] [CrossRef]
  28. Zhang, J.; Li, S.; Li, L.; Li, M.; Guo, C.; Yao, J.; Mi, S. Exosome and Exosomal MicroRNA: Trafficking, Sorting, and Function. Genomics Proteomics Bioinformatics 2015, 13, 17–24. [Google Scholar] [CrossRef]
  29. Valadi, H.; Ekström, K.; Bossios, A.; Sjöstrand, M.; Lee, J.J.; Lötvall, J.O. Exosome-Mediated Transfer of MRNAs and MicroRNAs Is a Novel Mechanism of Genetic Exchange between Cells. Nat Cell Biol 2007, 9, 654–659. [Google Scholar] [CrossRef]
  30. Zhou, J.; Flores-Bellver, M.; Pan, J.; Benito-Martin, A.; Shi, C.; Onwumere, O.; Mighty, J.; Qian, J.; Zhong, X.; Hogue, T.; et al. Human Retinal Organoids Release Extracellular Vesicles That Regulate Gene Expression in Target Human Retinal Progenitor Cells. Sci Rep 2021, 11. [Google Scholar] [CrossRef]
  31. Mills, J.; Capece, M.; Cocucci, E.; Tessari, A.; Palmieri, D. Cancer-Derived Extracellular Vesicle-Associated MicroRNAs in Intercellular Communication: One Cell’s Trash Is Another Cell’s Treasure. Int J Mol Sci 2019, 20. [Google Scholar] [CrossRef]
  32. Colombo, M.; Raposo, G.; Théry, C. Biogenesis, Secretion, and Intercellular Interactions of Exosomes and Other Extracellular Vesicles. Annu Rev Cell Dev Biol 2014, 30, 255–289. [Google Scholar] [CrossRef] [PubMed]
  33. Kim, D.; Woo, H.K.; Lee, C.; Min, Y.; Kumar, S.; Sunkara, V.; Jo, H.G.; Lee, Y.J.; Kim, J.; Ha, H.K.; et al. EV-Ident: Identifying Tumor-Specific Extracellular Vesicles by Size Fractionation and Single-Vesicle Analysis. Anal Chem 2020, 92, 6010–6018. [Google Scholar] [CrossRef] [PubMed]
  34. Berezin, A.E.; Berezin, A.A. Endothelial Cell-Derived Extracellular Vesicles in Atherosclerosis: The Emerging Value for Diagnosis, Risk Stratification and Prognostication. Vessel Plus 2020, 4. [Google Scholar] [CrossRef]
  35. Xu, R.; Greening, D.W.; Rai, A.; Ji, H.; Simpson, R.J. Highly-Purified Exosomes and Shed Microvesicles Isolated from the Human Colon Cancer Cell Line LIM1863 by Sequential Centrifugal Ultrafiltration Are Biochemically and Functionally Distinct. Methods 2015, 87, 11–25. [Google Scholar] [CrossRef]
  36. Soltész, B.; Buglyó, G.; Németh, N.; Szilágyi, M.; Pös, O.; Szemes, T.; Balogh, I.; Nagy, B. The Role of Exosomes in Cancer Progression. Int J Mol Sci 2022, 23. [Google Scholar] [CrossRef]
  37. Basu, S.; Bhattacharyya, S.N. Insulin-like Growth Factor-1 Prevents MiR-122 Production in Neighbouring Cells to Curtail Its Intercellular Transfer to Ensure Proliferation of Human Hepatoma Cells. Nucleic Acids Res 2014, 42, 7170–7185. [Google Scholar] [CrossRef]
  38. Liu, Y.; Lu, L.L.; Wen, D.; Liu, D.L.; Dong, L.L.; Gao, D.M.; Bian, X.Y.; Zhou, J.; Fan, J.; Wu, W.Z. MiR-612 Regulates Invadopodia of Hepatocellular Carcinoma by HADHA-Mediated Lipid Reprogramming. J Hematol Oncol 2020, 13. [Google Scholar] [CrossRef]
  39. Chiba, M.; Kimura, M.; Asari, S. Exosomes Secreted from Human Colorectal Cancer Cell Lines Contain MRNAs, MicroRNAs and Natural Antisense RNAs, That Can Transfer into the Human Hepatoma HepG2 and Lung Cancer A549 Cell Lines. Oncol Rep 2012, 28, 1551–1558. [Google Scholar] [CrossRef]
  40. Pan, Q.; Ramakrishnaiah, V.; Henry, S.; Fouraschen, S.; De Ruiter, P.E.; Kwekkeboom, J.; Tilanus, H.W.; Janssen, H.L.A.; Van Der Laan, L.J.W. Hepatic Cell-to-Cell Transmission of Small Silencing RNA Can Extend the Therapeutic Reach of RNA Interference (RNAi). Gut 2012, 61, 1330–1339. [Google Scholar] [CrossRef]
  41. Okoye, I.S.; Coomes, S.M.; Pelly, V.S.; Czieso, S.; Papayannopoulos, V.; Tolmachova, T.; Seabra, M.C.; Wilson, M.S. MicroRNA-Containing T-Regulatory-Cell-Derived Exosomes Suppress Pathogenic T Helper 1 Cells. Immunity 2014, 41, 89–103. [Google Scholar] [CrossRef]
  42. Sorop, A.; Constantinescu, D.; Cojocaru, F.; Dinischiotu, A.; Cucu, D.; Dima, S.O. Exosomal MicroRNAs as Biomarkers and Therapeutic Targets for Hepatocellular Carcinoma. Int J Mol Sci 2021, 22, 4997. [Google Scholar] [CrossRef] [PubMed]
  43. Nakano, T.; Chen, I.H.; Wang, C.C.; Chen, P.J.; Tseng, H.P.; Huang, K.T.; Hu, T.H.; Li, L.C.; Goto, S.; Cheng, Y.F.; et al. Circulating Exosomal MiR-92b: Its Role for Cancer Immunoediting and Clinical Value for Prediction of Posttransplant Hepatocellular Carcinoma Recurrence. American Journal of Transplantation 2019, 19, 3250–3262. [Google Scholar] [CrossRef] [PubMed]
  44. Cui, Y.; Xu, H.F.; Liu, M.Y.; Xu, Y.J.; He, J.C.; Zhou, Y.; Cang, S.D. Mechanism of Exosomal MicroRNA-224 in Development of Hepatocellular Carcinoma and Its Diagnostic and Prognostic Value. World J Gastroenterol 2019, 25, 1890–1898. [Google Scholar] [CrossRef]
  45. Qu, Z.; Wu, J.; Wu, J.; Ji, A.; Qiang, G.; Jiang, Y.; Jiang, C.; Ding, Y. Exosomal MiR-665 as a Novel Minimally Invasive Biomarker for Hepatocellular Carcinoma Diagnosis and Prognosis; 2017; Vol. 8;
  46. Shi, M.; Jiang, Y.; Yang, L.; Yan, S.; Wang, Y.G.; Lu, X.J. Decreased Levels of Serum Exosomal MiR-638 Predict Poor Prognosis in Hepatocellular Carcinoma. J Cell Biochem 2018, 119, 4711–4716. [Google Scholar] [CrossRef]
  47. Suehiro, T.; Miyaaki, H.; Kanda, Y.; Shibata, H.; Honda, T.; Ozawa, E.; Miuma, S.; Taura, N.; Nakao, K. Serum Exosomal MicroRNA-122 and MicroRNA-21 as Predictive Biomarkers in Transarterial Chemoembolization-Treatedhepatocellular Carcinoma Patients. Oncol Lett 2018, 16, 3267–3273. [Google Scholar] [CrossRef]
  48. Cho, H.J.; Eun, J.W.; Baek, G.O.; Seo, C.W.; Ahn, H.R.; Kim, S.S.; Cho, S.W.; Cheong, J.Y. Serum Exosomal MicroRNA, MiR-10b-5p, as a Potential Diagnostic Biomarker for Early-Stage Hepatocellular Carcinoma. J Clin Med 2020, 9. [Google Scholar] [CrossRef]
  49. Chen, S.; Mao, Y.; Chen, W.; Liu, C.; Wu, H.; Zhang, J.; Wang, S.; Wang, C.; Lin, Y.; Lv, Y. Serum Exosomal MiR-34a as a Potential Biomarker for the Diagnosis and Prognostic of Hepatocellular Carcinoma. J Cancer 2022, 13, 1410–1417. [Google Scholar] [CrossRef]
  50. Lin, H.; Zhang, Z. Diagnostic Value of a MicroRNA Signature Panel in Exosomes for Patients with Hepatocellular Carcinoma; 2019; Vol. 12;
  51. Xue, X.; Zhao, Y.; Wang, X.; Qin, L.; Hu, R. Development and Validation of Serum Exosomal MicroRNAs as Diagnostic and Prognostic Biomarkers for Hepatocellular Carcinoma. J Cell Biochem 2019, 120, 135–142. [Google Scholar] [CrossRef]
  52. Ning, S.; Liu, H.; Gao, B.; Wei, W.; Yang, A.; Li, J.; Zhang, L. MiR-155, MiR-96 and MiR-99a as Potential Diagnostic and Prognostic Tools for the Clinical Management of Hepatocellular Carcinoma. Oncol Lett 2019, 18, 3381–3387. [Google Scholar] [CrossRef]
  53. Gharib, A.F.; Eed, E.M.; Khalifa, A.S.; Raafat, N.; Shehab-Eldeen, S.; Alwakeel, H.R.; Darwiesh, E.; Essa, A. Value of Serum MiRNA-96-5p and MiRNA-99a-5p as Diagnostic Biomarkers for Hepatocellular Carcinoma. Int J Gen Med 2022, 15, 2427–2436. [Google Scholar] [CrossRef]
  54. Qian, F.; Wang, J.; Wang, Y.; Gao, Q.; Yan, W.; Lin, Y.; Shen, L.; Xie, Y.; Jiang, X.; Shen, B. MiR-378a-3p as a Putative Biomarker for Hepatocellular Carcinoma Diagnosis and Prognosis: Computational Screening with Experimental Validation. Clin Transl Med 2021, 11. [Google Scholar] [CrossRef] [PubMed]
  55. Edge, S.B. . AJCC Cancer Staging Manual; Springer, 2010; ISBN 9780387884400.
  56. Wu, J.-C.; Huang, Y.; Chen, C.; Chang, T.; Chen, S.; Wang, S.; Lee, H.; Lin, P.; Huang, G.; Sheu, J.; et al. Evaluation of Predictive Value of CLIP, Okuda, TNM and JIS Staging Systems for Hepatocellular Carcinoma Patients Undergoing Surgery. J Gastroenterol Hepatol 2005, 20, 765–771. [Google Scholar] [CrossRef]
  57. Pu, C.; Huang, H.; Wang, Z.; Zou, W.; Lv, Y.; Zhou, Z.; Zhang, Q.; Qiao, L.; Wu, F.; Shao, S. Extracellular Vesicle-Associated Mir-21 and Mir-144 Are Markedly Elevated in Serum of Patients with Hepatocellular Carcinoma. Front Physiol 2018, 9. [Google Scholar] [CrossRef]
  58. Sorop, A.; Iacob, R.; Iacob, S.; Constantinescu, D.; Chitoiu, L.; Fertig, T.E.; Dinischiotu, A.; Chivu-Economescu, M.; Bacalbasa, N.; Savu, L.; et al. Plasma Small Extracellular Vesicles Derived MiR-21-5p and MiR-92a-3p as Potential Biomarkers for Hepatocellular Carcinoma Screening. Front Genet 2020, 11. [Google Scholar] [CrossRef]
  59. Eldosoky, M.A.; Hammad, R.; Elmadbouly, A.A.; Aglan, R.B.; Abdel-Hamid, S.G.; Alboraie, M.; Hassan, D.A.; Shaheen, M.A.; Rushdi, A.; Ahmed, R.M.; et al. Diagnostic Significance of Hsa-MiR-21-5p, Hsa-MiR-192-5p, Hsa-MiR-155-5p, Hsa-MiR-199a-5p Panel and Ratios in Hepatocellular Carcinoma on Top of Liver Cirrhosis in HCV-Infected Patients. Int J Mol Sci 2023, 24. [Google Scholar] [CrossRef]
  60. Ullmann, P.; Nurmik, M.; Schmitz, M.; Rodriguez, F.; Weiler, J.; Qureshi-Baig, K.; Felten, P.; Nazarov, P.V.; Nicot, N.; Zuegel, N.; et al. Tumor Suppressor MiR-215 Counteracts Hypoxia-Induced Colon Cancer Stem Cell Activity. Cancer Lett 2019, 450, 32–41. [Google Scholar] [CrossRef]
  61. Vychytilova-Faltejskova, P.; Merhautova, J.; Machackova, T.; Gutierrez-Garcia, I.; Garcia-Solano, J.; Radova, L.; Brchnelova, D.; Slaba, K.; Svoboda, M.; Halamkova, J.; et al. MiR-215-5p Is a Tumor Suppressor in Colorectal Cancer Targeting EGFR Ligand Epiregulin and Its Transcriptional Inducer HOXB9. Oncogenesis 2017, 6. [Google Scholar] [CrossRef]
  62. White, N.M.A.; Khella, H.W.Z.; Grigull, J.; Adzovic, S.; Youssef, Y.M.; Honey, R.J.; Stewart, R.; Pace, K.T.; Bjarnason, G.A.; Jewett, M.A.S.; et al. MiRNA Profiling in Metastatic Renal Cell Carcinoma Reveals a Tumour-Suppressor Effect for MiR-215. Br J Cancer 2011, 105, 1741–1749. [Google Scholar] [CrossRef]
  63. Yacoub, R.A.; Fawzy, I.O.; Assal, R.A.; Hosny, K.A.; Zekri, A.R.N.; Esmat, G.; El Tayebi, H.M.; Abdelaziz, A.I. MiR-34a: Multiple Opposing Targets and One Destiny in Hepatocellular Carcinoma. J Clin Transl Hepatol 2016, 4, 300–305. [Google Scholar] [CrossRef]
  64. He, G.; Qiu, J.; Liu, C.; Tian, B.; Cai, D.; Liu, S. MiR-148b-3p Regulates the Expression of DTYMK to Drive Hepatocellular Carcinoma Cell Proliferation and Metastasis. Front Oncol 2021, 11. [Google Scholar] [CrossRef]
  65. Yuan, T.; Shi, C.; Xu, W.; Yang, H.-L.; Xia, B.; Tian, C. Extracellular Vesicles Derived from T-Cell Acute Lymphoblastic Leukemia Inhibit Osteogenic Differentiation of Bone Marrow Mesenchymal Stem Cells via MiR-34a-5p. Endocr J 2021, 68, 1197–1208. [Google Scholar] [CrossRef] [PubMed]
  66. Luo, T.; Zhou, X.; Jiang, E.; Wang, L.; Ji, Y.; Shang, Z. Osteosarcoma Cell-Derived Small Extracellular Vesicles Enhance Osteoclastogenesis and Bone Resorption Through Transferring MicroRNA-19a-3p. Front Oncol 2021, 11. [Google Scholar] [CrossRef] [PubMed]
  67. Gerloff, D.; Kewitz-Hempel, S.; Hause, G.; Ehrenreich, J.; Golle, L.; Kingreen, T.; Sunderkötter, C. Comprehensive Analyses of MiRNAs Revealed MiR-92b-3p, MiR-182-5p and MiR-183-5p as Potential Novel Biomarkers in Melanoma-Derived Extracellular Vesicles. Front Oncol 2022, 12. [Google Scholar] [CrossRef] [PubMed]
  68. Ohkawa, H.; Ohishi, N.; Yagi, K. Assay for Lipid Peroxides in Animal Tissues by Thiobarbituric Acid Reaction. Anal Biochem 1979, 95, 351–358. [Google Scholar] [CrossRef]
  69. Cohen, J.F.; Korevaar, D.A.; Altman, D.G.; Bruns, D.E.; Gatsonis, C.A.; Hooft, L.; Irwig, L.; Levine, D.; Reitsma, J.B.; de Vet, H.C.W.; et al. STARD 2015 Guidelines for Reporting Diagnostic Accuracy Studies: Explanation and Elaboration. BMJ Open 2016, 6, e012799. [Google Scholar] [CrossRef]
Disclaimer/Publisher’s Note: The statements, opinions and data contained in all publications are solely those of the individual author(s) and contributor(s) and not of MDPI and/or the editor(s). MDPI and/or the editor(s) disclaim responsibility for any injury to people or property resulting from any ideas, methods, instructions or products referred to in the content.
Copyright: This open access article is published under a Creative Commons CC BY 4.0 license, which permit the free download, distribution, and reuse, provided that the author and preprint are cited in any reuse.
Prerpints.org logo

Preprints.org is a free preprint server supported by MDPI in Basel, Switzerland.

Subscribe

Disclaimer

Terms of Use

Privacy Policy

Privacy Settings

© 2025 MDPI (Basel, Switzerland) unless otherwise stated