
Submitted:
02 May 2025
Posted:
07 May 2025
You are already at the latest version
Abstract
Anion exchange membranes are utilized in cutting-edge energy technologies including electrolysers and fuel cells. Recently, these membranes have also emerged as a promising tool in CO2 capture techniques, such as moisture-driven direct air capture and the separation of CO2 from other gases, leveraging the moisture-induced sorption/desorption and diffusion of CO2 in its ionic forms. In this study, we examine the absorption and permeation of CO2 and CH4 in two commercially available anion exchange membranes, Fumasep® and Sustainion®, under dry conditions. With the exception of CO2 sorption in Fumasep®, these measurements have not been previously reported. These new data points are crucial for evaluating the fundamental separation capabilities of these materials and for devising innovative CO2 capture strategies, as well as for the simulation of novel combined processes. In a dry state, both materials demonstrate similar CO2 absorption levels, with a higher value for Sustainion®. However, Fumasep® exhibits higher CO2/CH4 ideal solubility-selectivity and higher diffusivity. CO2 diffusion coefficient increases with CO2 concentration in both membranes, due to swelling of the matrix, while the solubility coefficient of CO2 shows the typical behavior of glassy polymers. CO2 permeability vs. pressure curves exhibit a minimum at a pressure of approximately 2-3 bar. The CO2 permeability in the dry state is higher in Fumasep® than in Sustainion®, and for both polymers has similar order of magnitude to the value measured in fluorinated ion exchange membranes such as Nafion®.
Keywords:
CO2 capture
; anion exchange membranes
; CO2 separation
; diffusion
; sorption
1. Introduction
Escalating CO2 emissions from a broad range of industrial sectors have disrupted Earth's natural carbon cycle, exacerbated the greenhouse effect and led to climate change. In response to this pressing environmental challenge, CO2 capture and utilisation strategies have garnered significant interest due to their potential to mitigate anthropogenic greenhouse gas emissions and convert CO2 into high-value products. Within the spectrum of carbon capture and conversion technologies, ion exchange materials have emerged as crucial components. Such membranes are used in devices such as electrolysers and fuel cells, which will be important players in the energy transition in place in the industrial and energy sectors. Furthermore, they have been evaluated in recent years also as materials to assist CO2 capture processes. Their high perm-selectivity is particularly beneficial in striving toward net-zero greenhouse gas emission goals. Such membranes have been evaluated mostly to support electrochemical CO2 abatement processes such as electrodialysis (ED) and CO2 electrochemical reduction, which are instrumental in the capture and utilization of CO2 [1]. In these applications, the ion exchange membrane, characterized by a high charge density and high ion perm-selectivity, facilitates the directional migration, separation, and categorization of ionic substances under a direct current field. In CO2 reduction it has been observed that anion exchange membranes (AEM) may perform better than proton exchange membranes [1].
More recently, the use of anion exchange membranes or resin beads has been proposed in a non-electrochemical process, i.e. the moisture-driven carbon capture from air or other sources. In such a process the presence of humidity gradients allows for the flow or adsorption/desorption cycle of carbon in the forms of carbonate and bicarbonate ions through the material [2,3]. These processes exploit the fact that the CO2 uptake in the AEM material changes as a function of hydration degree: it is maximum in dry conditions and decreases with increasing humidity. Therefore, if an appropriate difference of humidity is provided, via a switch or a gradient, a cyclic or continuous CO2 removal process can be sustained. This process is a cost-effective approach for CO2 capture, leveraging water as the driving force: the energy required to concentrate CO2 is provided by the evaporation of water. The design of appropriate direct air capture schemes within a membrane or cyclic adsorption/desorption layout requires for the knowledge of a number of parameters including the CO2 sorption and diffusion levels inside the membranes, at different humidity levels. In this paper we provide a direct estimation of the CO2 uptake in the dry state at 30°C. In order to assess the usability of such membranes for a wide range of CO2 capture processes, e.g., in the removal of CO2 from natural gas and biogas, we have tested the behavior of the membrane as a function of pressure in the range between 0 and 8 bar. Furthermore, we have interpolated the experimental data using a correlative model, the Dual Sorption Model, which allows us to extrapolate the CO2 uptake outside the region experimentally probed. In addition, we have assessed the sorption of CH4 under the same pressure conditions. The results allow us to evaluate the gas sorption and sorption-based selectivity values in a range of pressures of industrial interest in processes such as biogas upgrading and natural gas refinement.
2. Materials and Methods
2.1. Materials
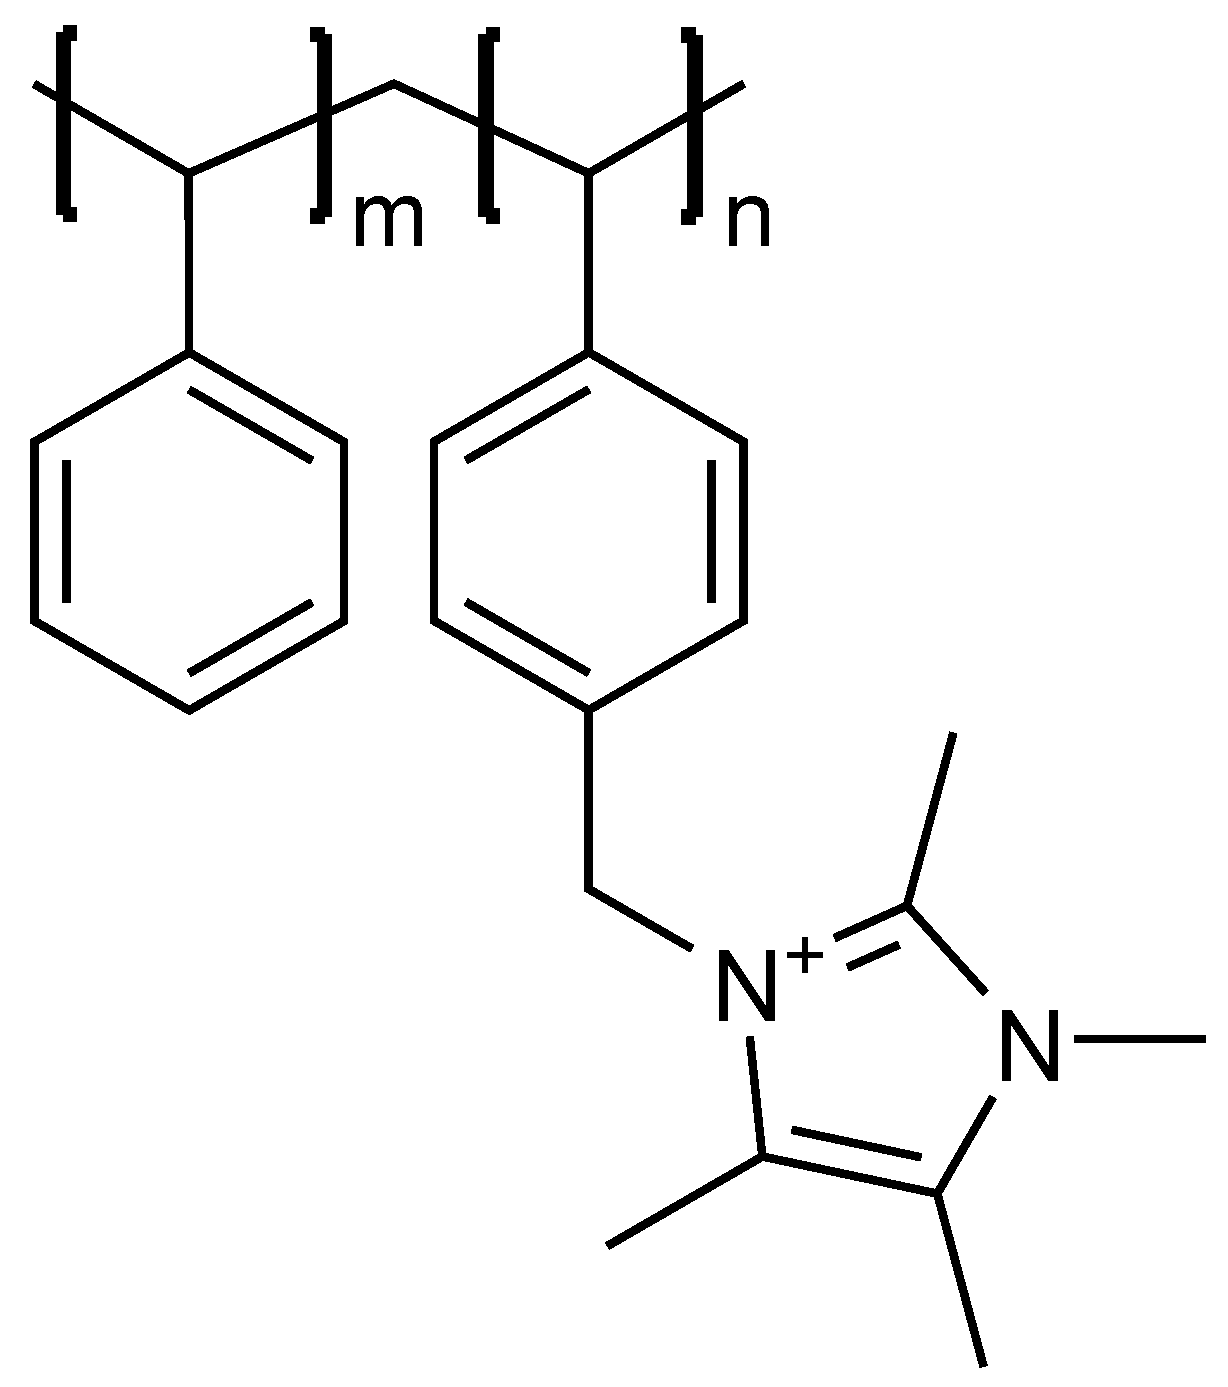
Two common anion exchange membrane materials with covalently bonded quaternary ammonium functional groups were analysed in the present work. Fumasep® FAA-3-50 was purchased from the Fuel Cell Store, Bryan, Tx, USA; Sustainion® X37-50 Grade RT was purchased from Dioxide Materials, Boca Raton, FL, USA. The chemical structure of Sustainion® is shown in Figure 1: it contains the imidazolium group as the cation instead of the usual quaternary ammonium group. Fumasep® is based on a proprietary polymer backbone with covalently bonded quaternary ammonium functionality.
Both membranes were ion-exchanged into OH-form by soaking in 1 M KOH solution for 24 h at room temperature. The membranes were then rinsed with deionized water and dried overnight at 105 °C under vacuum for the complete removal of water prior to further characterisation.
The thickness was measured to be 50.5 ± 1.4 µm for Fumasep® and 50.0 ± 1.5 µm for Sustainion®, consistent with the declared commercial value of 50 μm of the dry membranes. The density values of the dry membranes were, according to the literature, 1.3 g/cm3 for Fumasep® [3,6] and 0.9 g/cm3 for Sustainion® [4,7]. Different literature sources show rather different density values for these materials, depending on the humidity conditions in which they were measured, and on the counterion. The density value does not affect the estimate of diffusivity performed in this work, and affects the solubility value, expressed per unit mass of polymer, only to a limited extent, estimated to be to within 5% using the range of densities reported in the literature.
CO2 and CH4, used for gas sorption tests, were purchased from BOC UK as specialty grade gas cylinders (Research Grade) with guaranteed minimum purities ≥ 99.995%.
2.2. Gas Sorption
The solubility of CO2 and CH4 in two anion exchange membranes in the dry state was determined at 30 °C at pressures up to 8 bar in a manometric apparatus, built in-house according to ASTM D1434 [8]. The measurements were repeated at least twice for each gas.
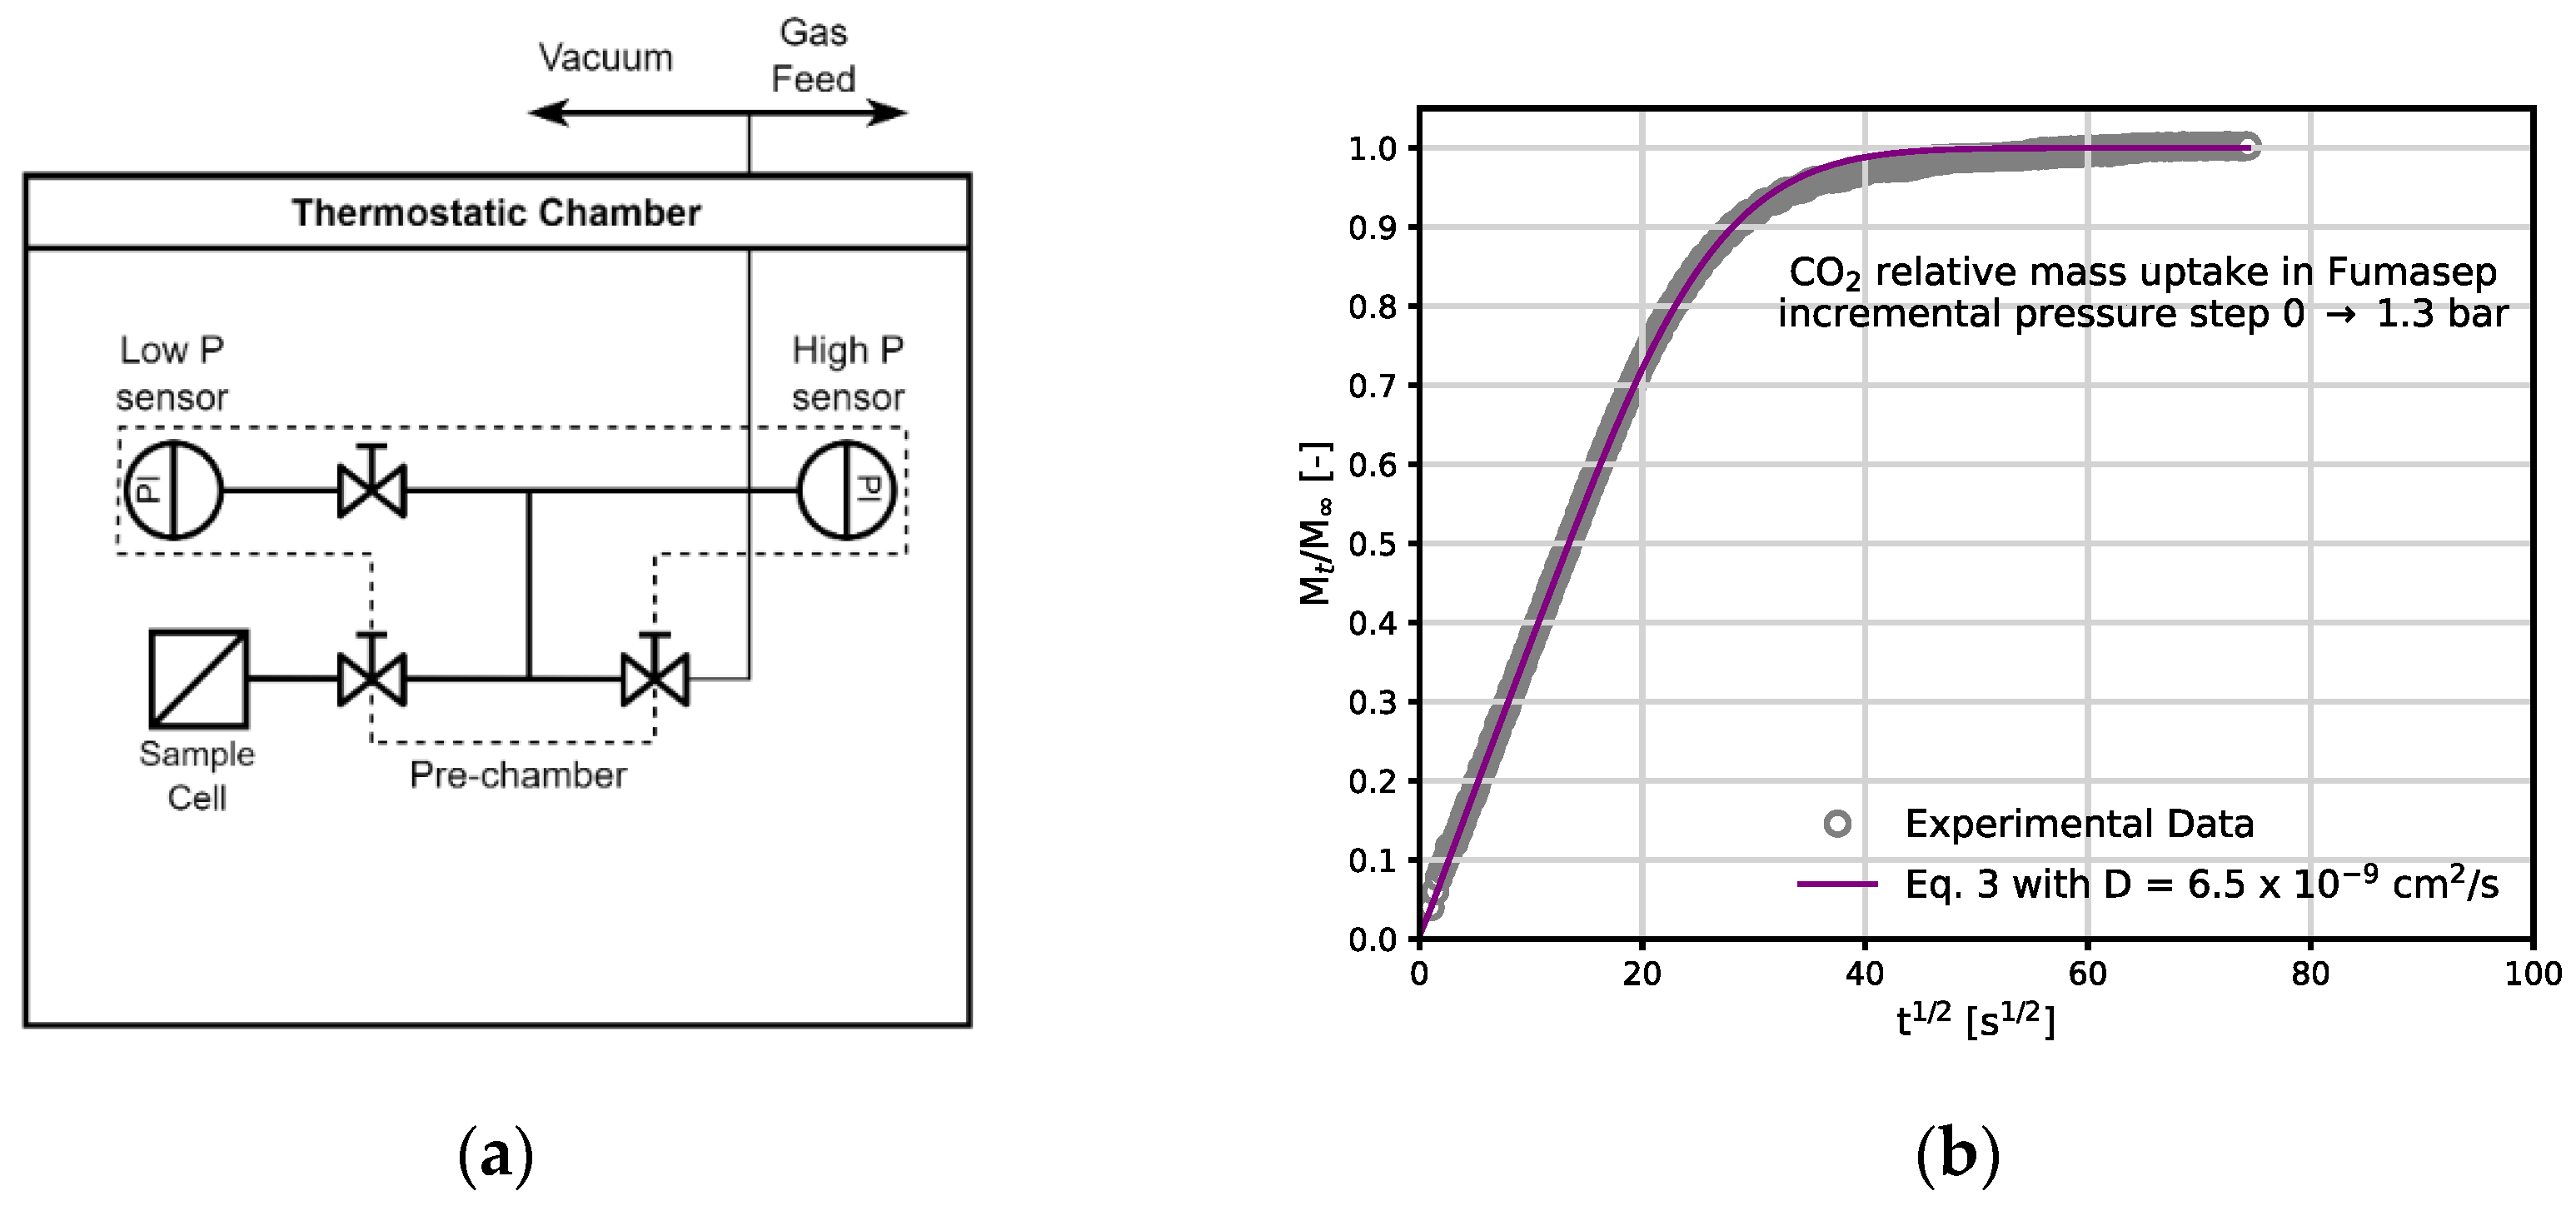
The full equipment set up is reported in Figure 2a. A known mass of polymer sample is placed into a sample cell and the sample is conditioned at the test temperature under dynamic vacuum overnight prior to the experiment. The sample chamber is then isolated, by closing the interconnecting valve, and the pre-chamber is filled with the desired amount of gas and left until equilibration. The gas is then left to expand into the sample cell, and the mass uptake by the sample is evaluated by measuring the pressure decrease in a closed and calibrated volume over time until a constant value of pressure is reached. The amount of gas absorbed inside the polymer at such pressure is calculated through a mass balance, given the knowledge of the amount of gas in the sample cell prior to expansion, the amount of gas loaded into the pre-chamber, and the residual amount of gas in the gaseous phase in the sample cell after reaching equilibrium. To perform the next incremental step of the isotherm, the cell is once again isolated, the pre-chamber is filled with a higher amount of gas, the gas is left to expand into the sample cell. The procedure is repeated in such stepwise manner until the desired equilibrium pressure is reached, and the whole sorption isotherm is obtained. The system is placed in a thermostatic chamber with forced air convection (Binder KT series), where the temperature is fixed to within ±0.1 °C. The pressure is monitored by two pressure sensors (Druck UNIK 5000) with full scale of 11 and 36 bar, and an accuracy of ±0.04% of the full-scale value. The two sensors can be connected separately to the sample cell, to allow for an accurate reading and good level sensitivity in different pressure intervals. Pressure data are collected using the Eurotherm Nanodac™ recorder, controlled via Eurotherm iTools proprietary software (version 9.87).
Figure 2.
(a) Schematics of the pressure-decay apparatus for gas sorption. (b) Sorption kinetics of CO2 in Fumasep® at 30 °C and fitting of D with Eq. (3). The step initial pressure was 0 and the final pressure was 1.3 bar.
Figure 2.
(a) Schematics of the pressure-decay apparatus for gas sorption. (b) Sorption kinetics of CO2 in Fumasep® at 30 °C and fitting of D with Eq. (3). The step initial pressure was 0 and the final pressure was 1.3 bar.
The solubility coefficient, S, at each equilibrium pressure, p, is determined as the ratio between the concentration of the gas in the sample, c, and the equilibrium pressure, as follows:
Gas concentration dependence on pressure can then be described by several models, based on the nature of the penetrant and the state of the polymer [9].
Sorption isotherms which are concave to the pressure axis, typical for more condensable gases absorbed in glassy polymers, can be described by applying the Dual-Mode Sorption (DMS) model. The DMS model assumes two populations of gas in equilibrium with one another absorbed in the polymer: one absorbed into the dense equilibrium matrix and described by the Henry’s law, and one absorbed into the non-equilibrium excess volume associated with the glassy state and described by the Langmuir curve. The gas concentration variation with pressure is then described as sum of these two contributions:
where is the Henry’s law constant, is the Langmuir capacity constant, and b is the Langmuir affinity parameter. For light gases, linear sorption isotherms, typical of Henry’s law valid in dilute conditions is retrieved as .
The penetrant diffusivity in the film, D, can be evaluated from the sorption kinetics at each sorption step in the isothermal run, by assuming Fickian diffusion and accounting for the variation of penetrant concentration at the film interface [10].
The expression for the mass uptake as a function of time, , for the mass sorption in a limited volume, where the variation of the interfacial concentration is due to mass sorption in the membrane, is given by [10]:
where and are the initial and final mass uptake, respectively, and α is the ratio between the volume of solution and that of the membrane, corrected for the partition coefficient of vapor between the gaseous phase and the polymer, l is the semithickness of the membrane, while variables are the positive, nonzero, solutions of the equation: . By fitting the experimental data of mass uptake versus time to the aforementioned equation, one obtains the average diffusivity value within the concentration interval inspected in the differential sorption step. An example of the data output from a sorption step and the relative fitting of data to Eq. (4) to obtain D is reported in Figure 2b.
When swelling is associated with the sorption of penetrant into the polymer, the diffusion coefficient can increase with concentration. Oftentimes, such dependence can be described through an exponential correlation:
where is the pre-exponential coefficient, β the exponential factor, while is the average concentration of the penetrant in the membrane during the sorption step.
The CO2 diffusion coefficients were determined for the anion exchange membranes in the present work and correlated to the CO2 concentration. Due to the low sorption levels, it was not possible to determine diffusivity values for CH4 with a reasonable accuracy.
Given the dense and homogeneous nature of the investigated materials, the CO2 permeability coefficient, P, was estimated as a product of its average solubility coefficient and diffusivity coefficient in each step, under the solution–diffusion framework [11,12]:
The ideal permselectivity, αij, between gas i and j is, under negligible downstream pressure conditions, the ratio between pure–gas permeabilities, and can be seen as the product of solubility–selectivity, and diffusivity–selectivity, :
The ideal permselectivity is generally used as a first estimate of the separation performance of new materials and its comparison with existing literature data. In the present work, we were able to determine CO2/CH4 solubility-selectivity for the two anion exchange membranes as function of pressure, which gives an initial indication on the separation capability of these materials.
3. Results
3.1. CO2 and CH4 Sorption Isotherms
The amount of CO2 and CH4 absorbed at the end of an isothermal pressure step is reported in Figure 3a, in terms of mmol/kg of dry polymer.
Figure 3.
Sorption isotherms in Fumasep® at 30 °C: (a) CO2 and CH4 sorption isotherms; (b) CO2 sorption in comparison with the literature [3]. The continuous lines are obtained by fitting the DMS (Eq. 2) or linear Henry’s law model.
Figure 3.
Sorption isotherms in Fumasep® at 30 °C: (a) CO2 and CH4 sorption isotherms; (b) CO2 sorption in comparison with the literature [3]. The continuous lines are obtained by fitting the DMS (Eq. 2) or linear Henry’s law model.
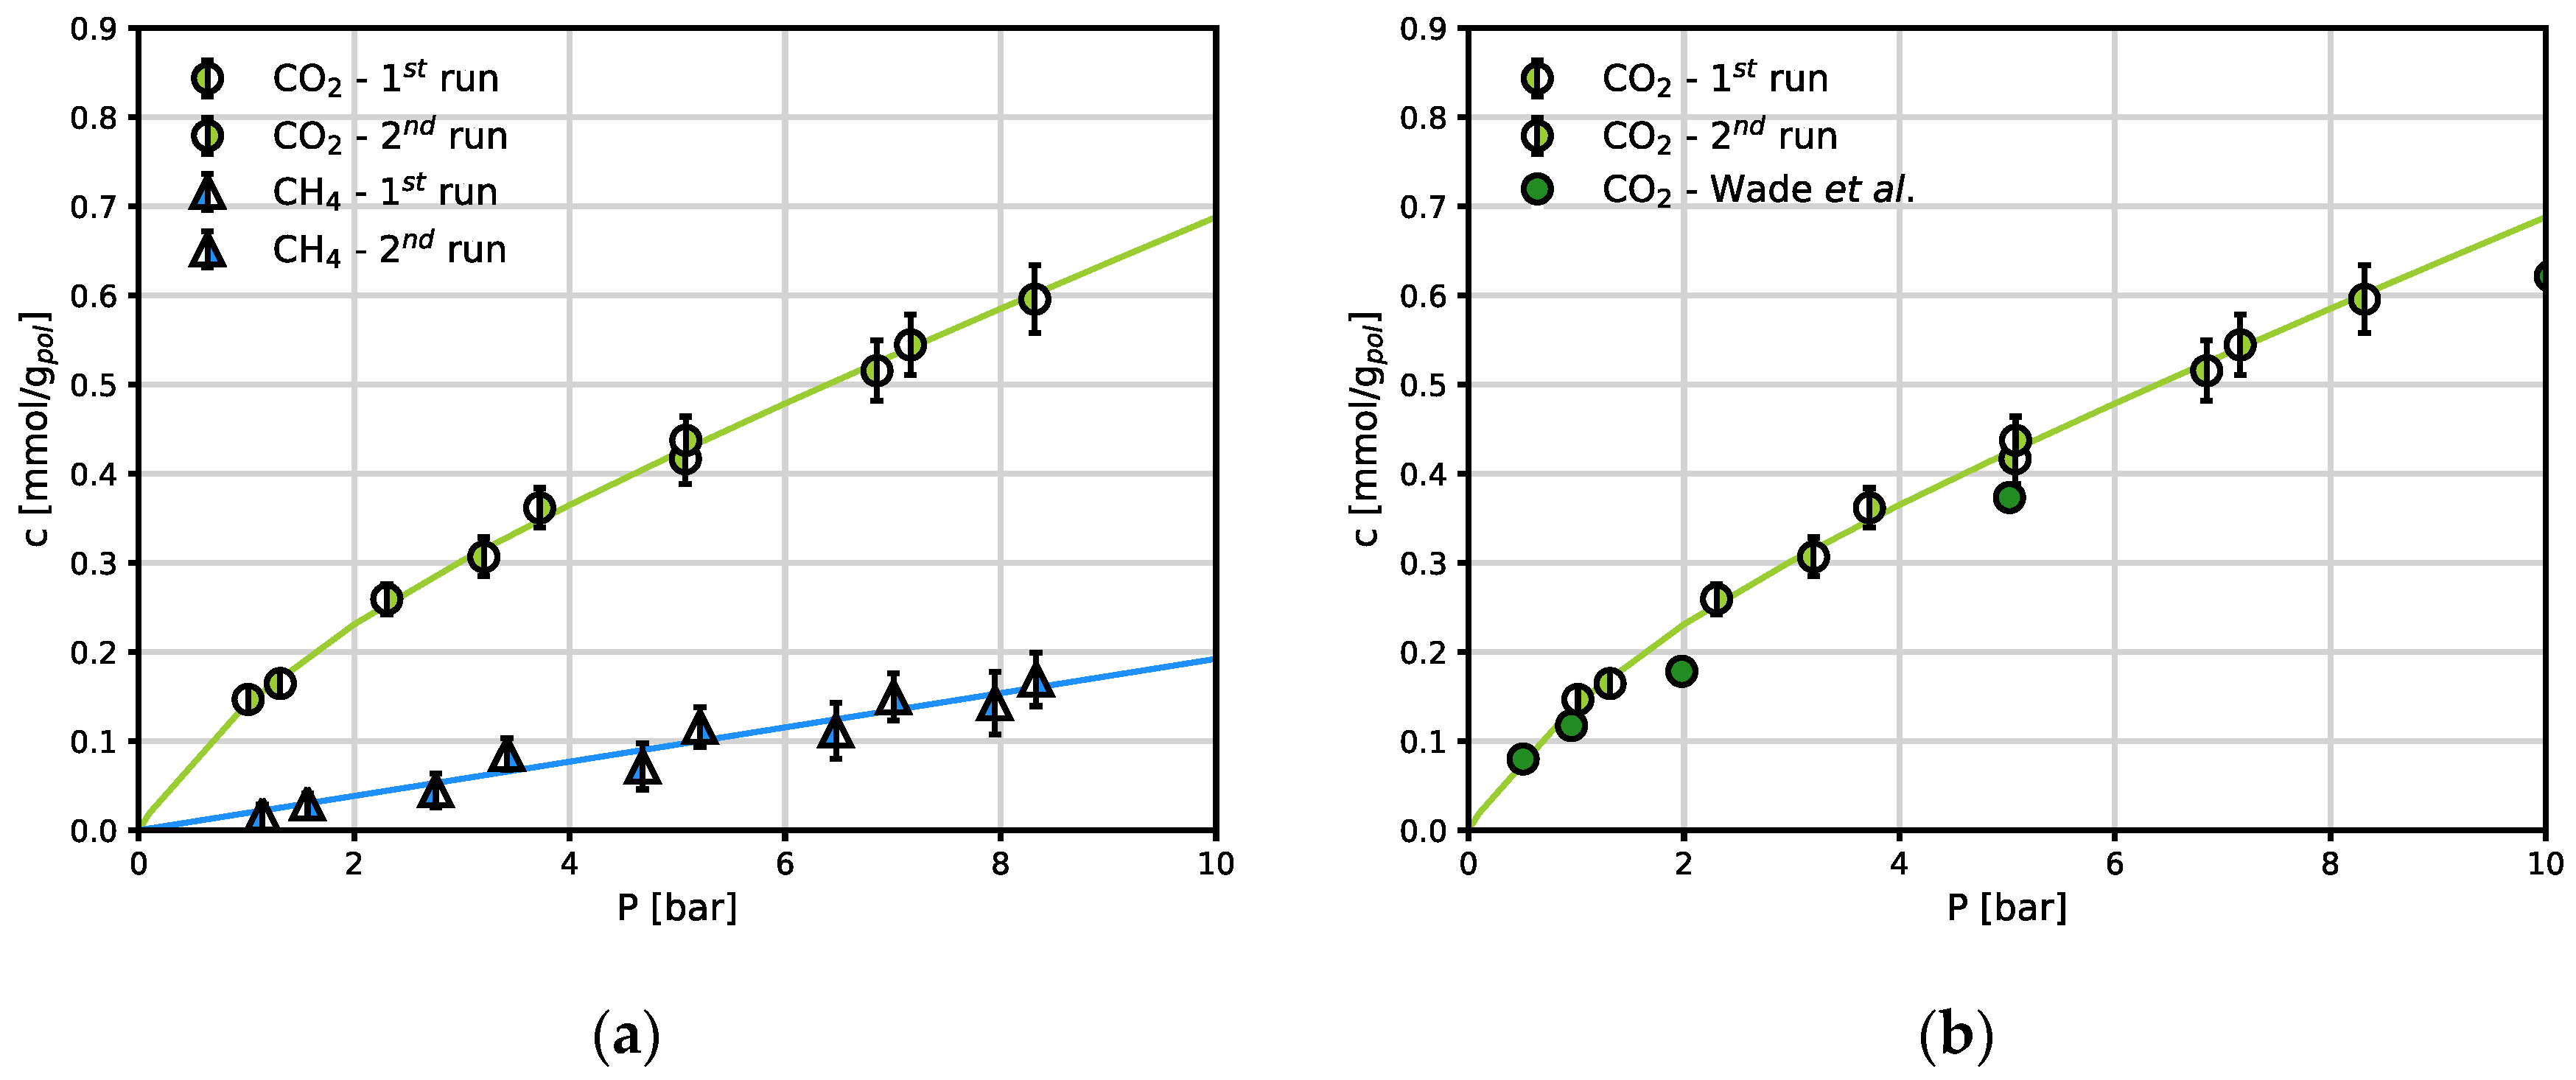
CH4 sorption follows Henry’s law linear behaviour in the Fumasep® membrane, while CO2 sorption in the same material follows a convex shape, (Figure 3a). For the case of CO2 sorption in dry Fumasep® , experimental data are available at the same conditions used here, and are shown in Figure 3b for comparison. It is clear that the data obtained in this work are in excellent agreement with those obtained by independent researchers who reported CO2 sorption in Fumasep® [3].
CO2 and CH4 sorption isotherms measured under the same conditions in Sustainion® are reported in Figure 4. For this polymer, these are the first experimental data of this kind, and there are no literature data to use as benchmark. Sustainion® is characterized by larger CO2 sorption levels than Fumasep® (Figure 5a), and the same qualitative behavior is followed. CH4 sorption follows a linear trend, as for the case of Fumasep®. The DMS parameters for both gases in both polymers are reported in Table 1: linear isotherms are represented simply by a Henry’s law term and the coefficient . CH4 uptake is slightly lower in Fumasep® than in Sustainion®.
Figure 4.
CO2 and CH4 sorption isotherms in Sustainion® at 30 °C in the dry state. The solid lines are obtained by fitting the DMS (Eq. 2) or a linear model.
Figure 4.
CO2 and CH4 sorption isotherms in Sustainion® at 30 °C in the dry state. The solid lines are obtained by fitting the DMS (Eq. 2) or a linear model.
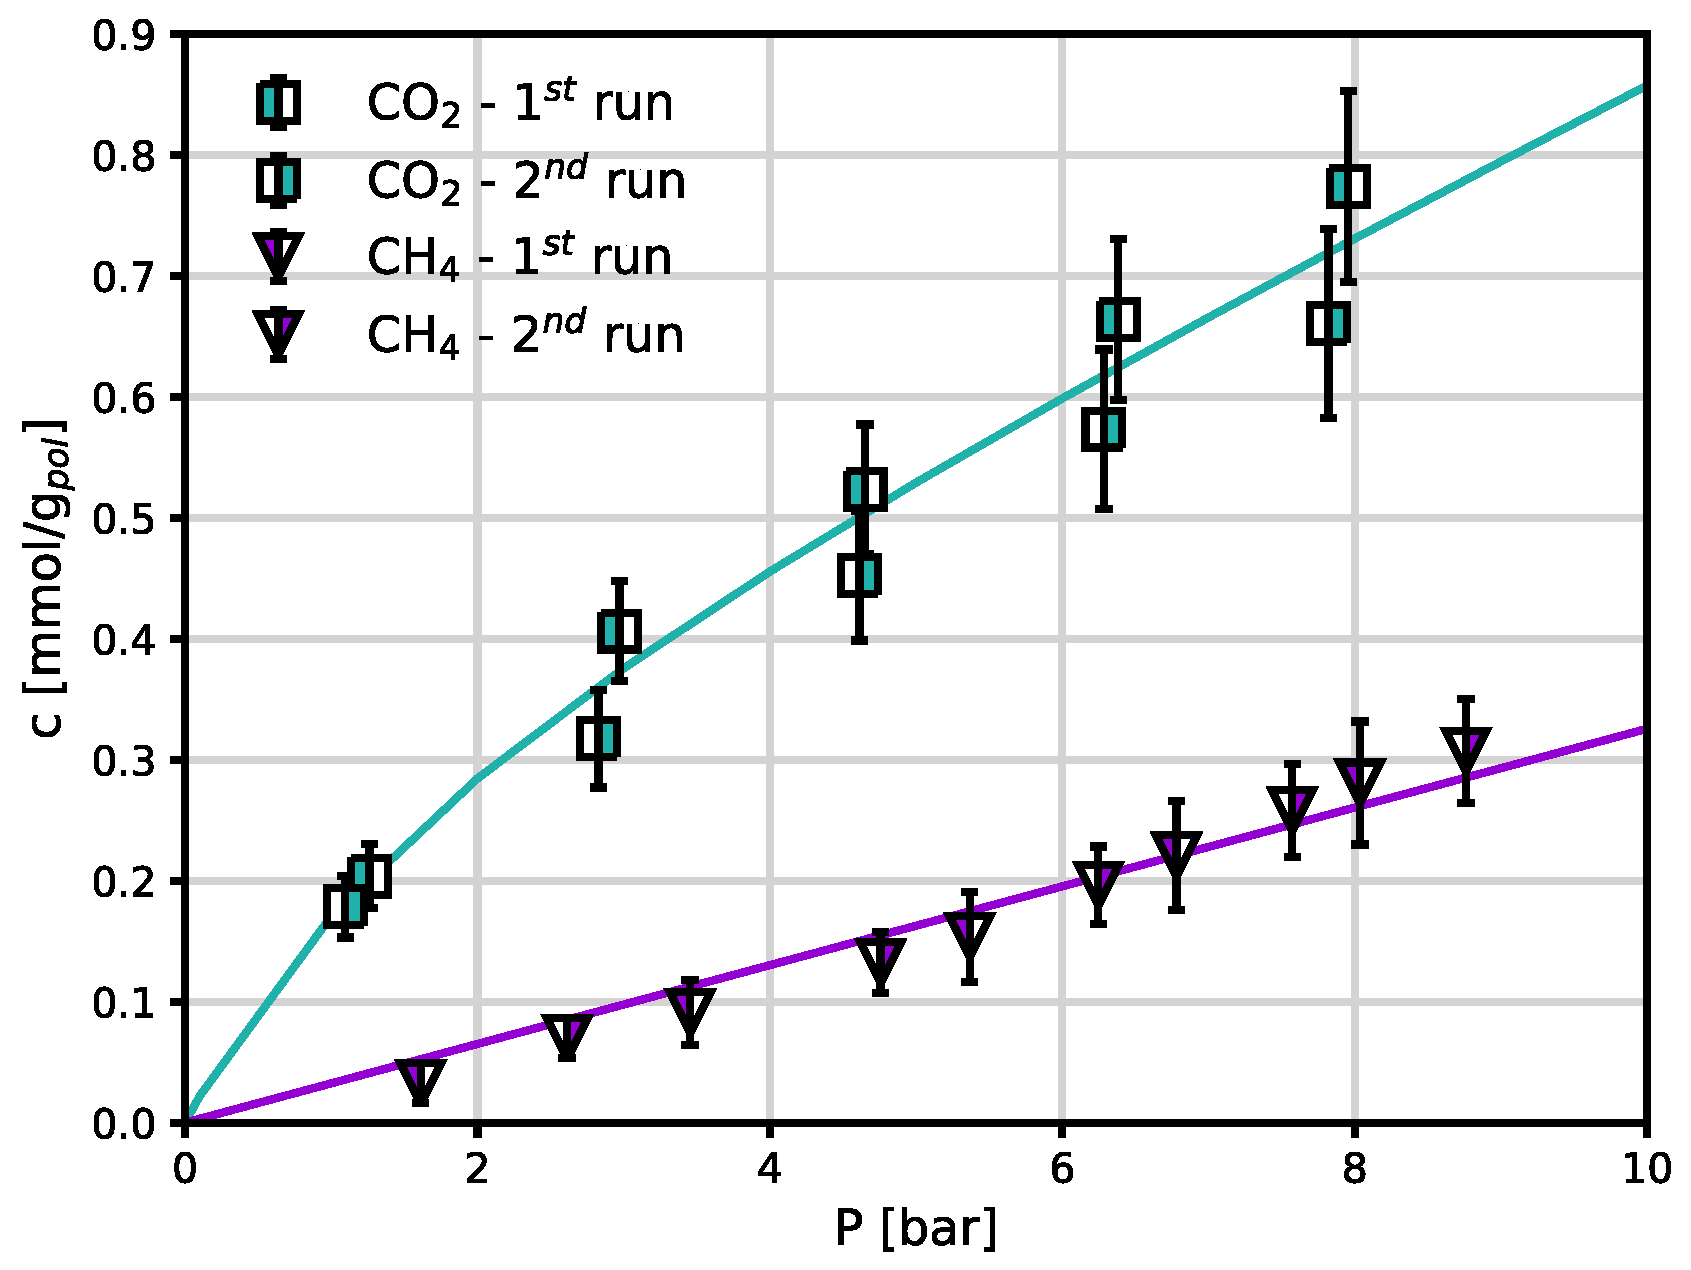
Figure 5.
Comparison of CO2 and CH4 sorption in Fumasep® and Sustainion®: (a) CO2 and CH4 sorption isotherms as determined by the DMS (Eq. 2) and linear models; (b) CO2/CH4 solubility-selectivity as function of pressure, evaluated using DSM models for each gas.
Figure 5.
Comparison of CO2 and CH4 sorption in Fumasep® and Sustainion®: (a) CO2 and CH4 sorption isotherms as determined by the DMS (Eq. 2) and linear models; (b) CO2/CH4 solubility-selectivity as function of pressure, evaluated using DSM models for each gas.
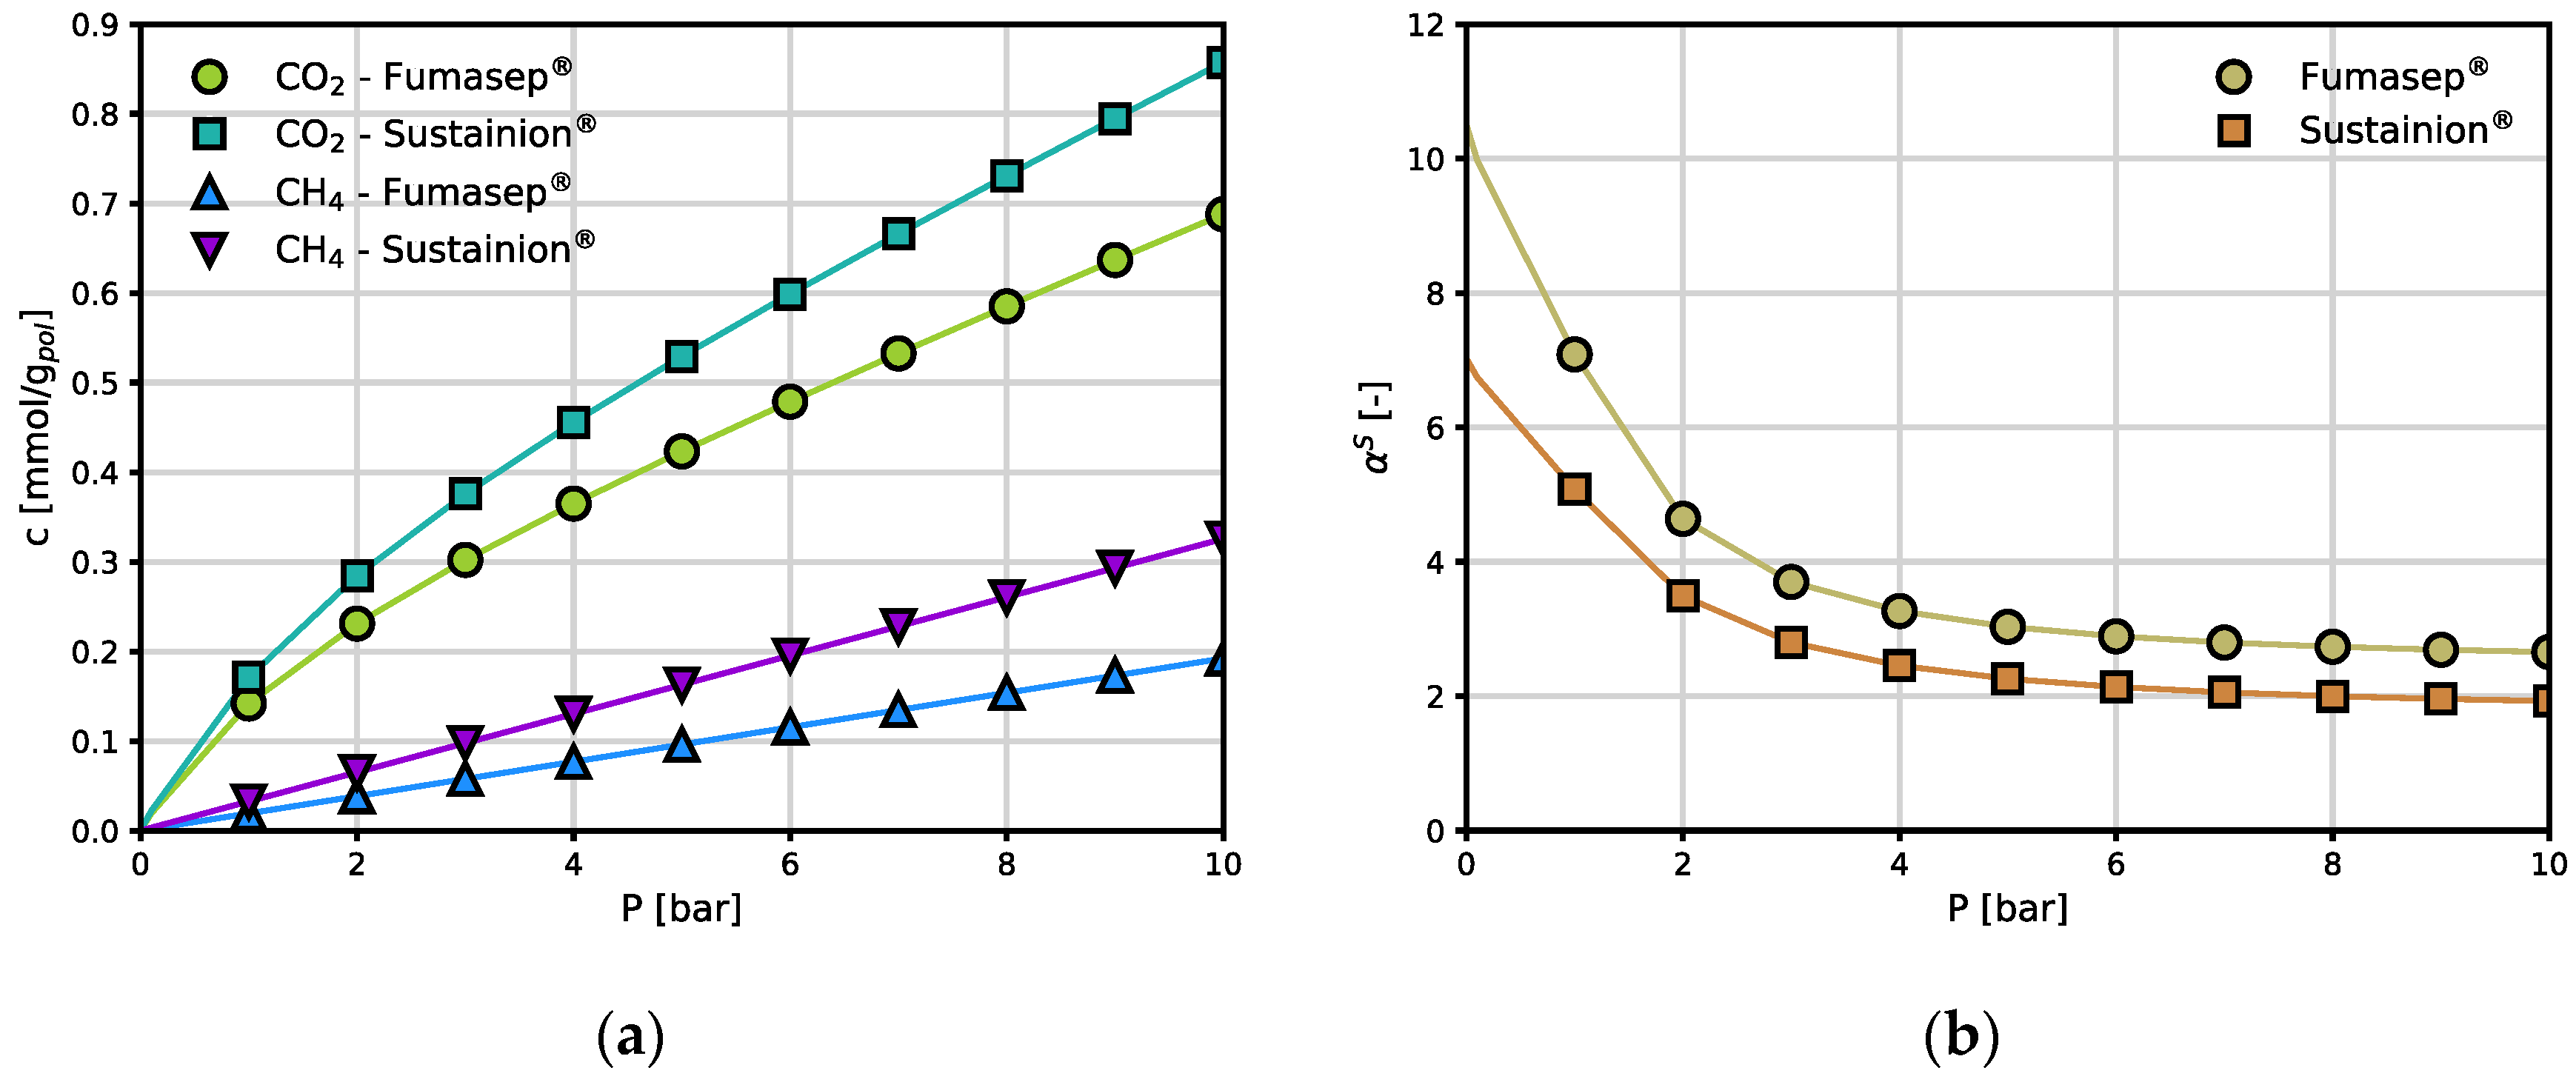

Table 1.
The DMS model (Eq. 2) correlation parameters for the CO2 and CH4 sorption isotherms in the anion exchange membranes investigated, together with the coefficient of determination.
Table 1.
The DMS model (Eq. 2) correlation parameters for the CO2 and CH4 sorption isotherms in the anion exchange membranes investigated, together with the coefficient of determination.
| Material | ||||||
|---|---|---|---|---|---|---|
|
× 102 mmol g-1 bar-1 |
× 101 mmol g-1 |
bar-1 |
mmol g-1 bar-1 |
|||
| Fumasep® | 4.80 ± 0.15 | 2.41 ± 0.24 | 0.64 ± 0.01 | 0.997 | 1.92 ± 0.21 | 0.934 |
| Sustainion® | 5.78 ± 0.02 | 3.34 ± 0.75 | 0.51 ± 0.12 | 0.959 | 3.26 ± 0.04 | 0.961 |
a CO2 diffusion.
Due to the shape of the solubility isotherm, the solubility coefficient (of CO2 in both materials decreases rapidly with pressure and thus the ideal solubility-selectivity reported in Figure 5b, decreases from values of approximately 10 to above 2. Interestingly, the best separation performance is exhibited at low pressure, that is the one of interest for several CO2 capture processes.
Overall, the differences between the two materials are limited and quantitative, rather than qualitative: Fumasep® sorbs slightly less CO2 but is more selective with respect to CH4 than Sustainion®, in pure gas conditions.
The diffusion coefficients of CO2 were estimated from the transient mass uptake in the polymers, as described in the methods section. These are the first experimentally obtained CO2 diffusion values in these polymers: a value was given in the literature for Fumasep® (cm2/s [3]) but it was estimated as the ratio between independent permeability and solubility data. In our case the diffusion coefficient was obtained directly by fitting the transient sorption data with Eq. 3. The same procedure was also attempted with CH4 but, due to the small level of sorption in this polymer and the low amount of sample available, it did not yield reliable results. Interestingly, CO2 diffusion coefficients in both materials follow an exponential dependence on concentration. The CO2 diffusivity in Sustainion® increases from 1.6 to 9.0·10-9 cm2/s within the range examined, while Fumasep® is significantly higher and goes from 0.7 to 2.2·10-8 cm2/s. These differences could be due to a smaller initial free volume of Sustainion® compared to Fumasep®. However, as it is typical of membranes characterised by smaller initial free volume, the dependence on concentration represented by the parameter is higher for the Sustainion® membrane than for Fumasep®. The slope is significant and allows the diffusion coefficients to increase by one order of magnitude by increasing the CO2 pressure from 0 to 8 bar, indicating an appreciable effect of CO2-induced swelling on the transport behavior, which should be taken into account when designing the separation process.
Figure 6.
CO2 diffusion coefficients in Fumasep® and Sustainion®, determined from sorption transient at 30 °C in the dry state, as function of average CO2 concentration. The continuous lines are obtained from a best fit to the exponential correlation (Eq. 4).
Figure 6.
CO2 diffusion coefficients in Fumasep® and Sustainion®, determined from sorption transient at 30 °C in the dry state, as function of average CO2 concentration. The continuous lines are obtained from a best fit to the exponential correlation (Eq. 4).
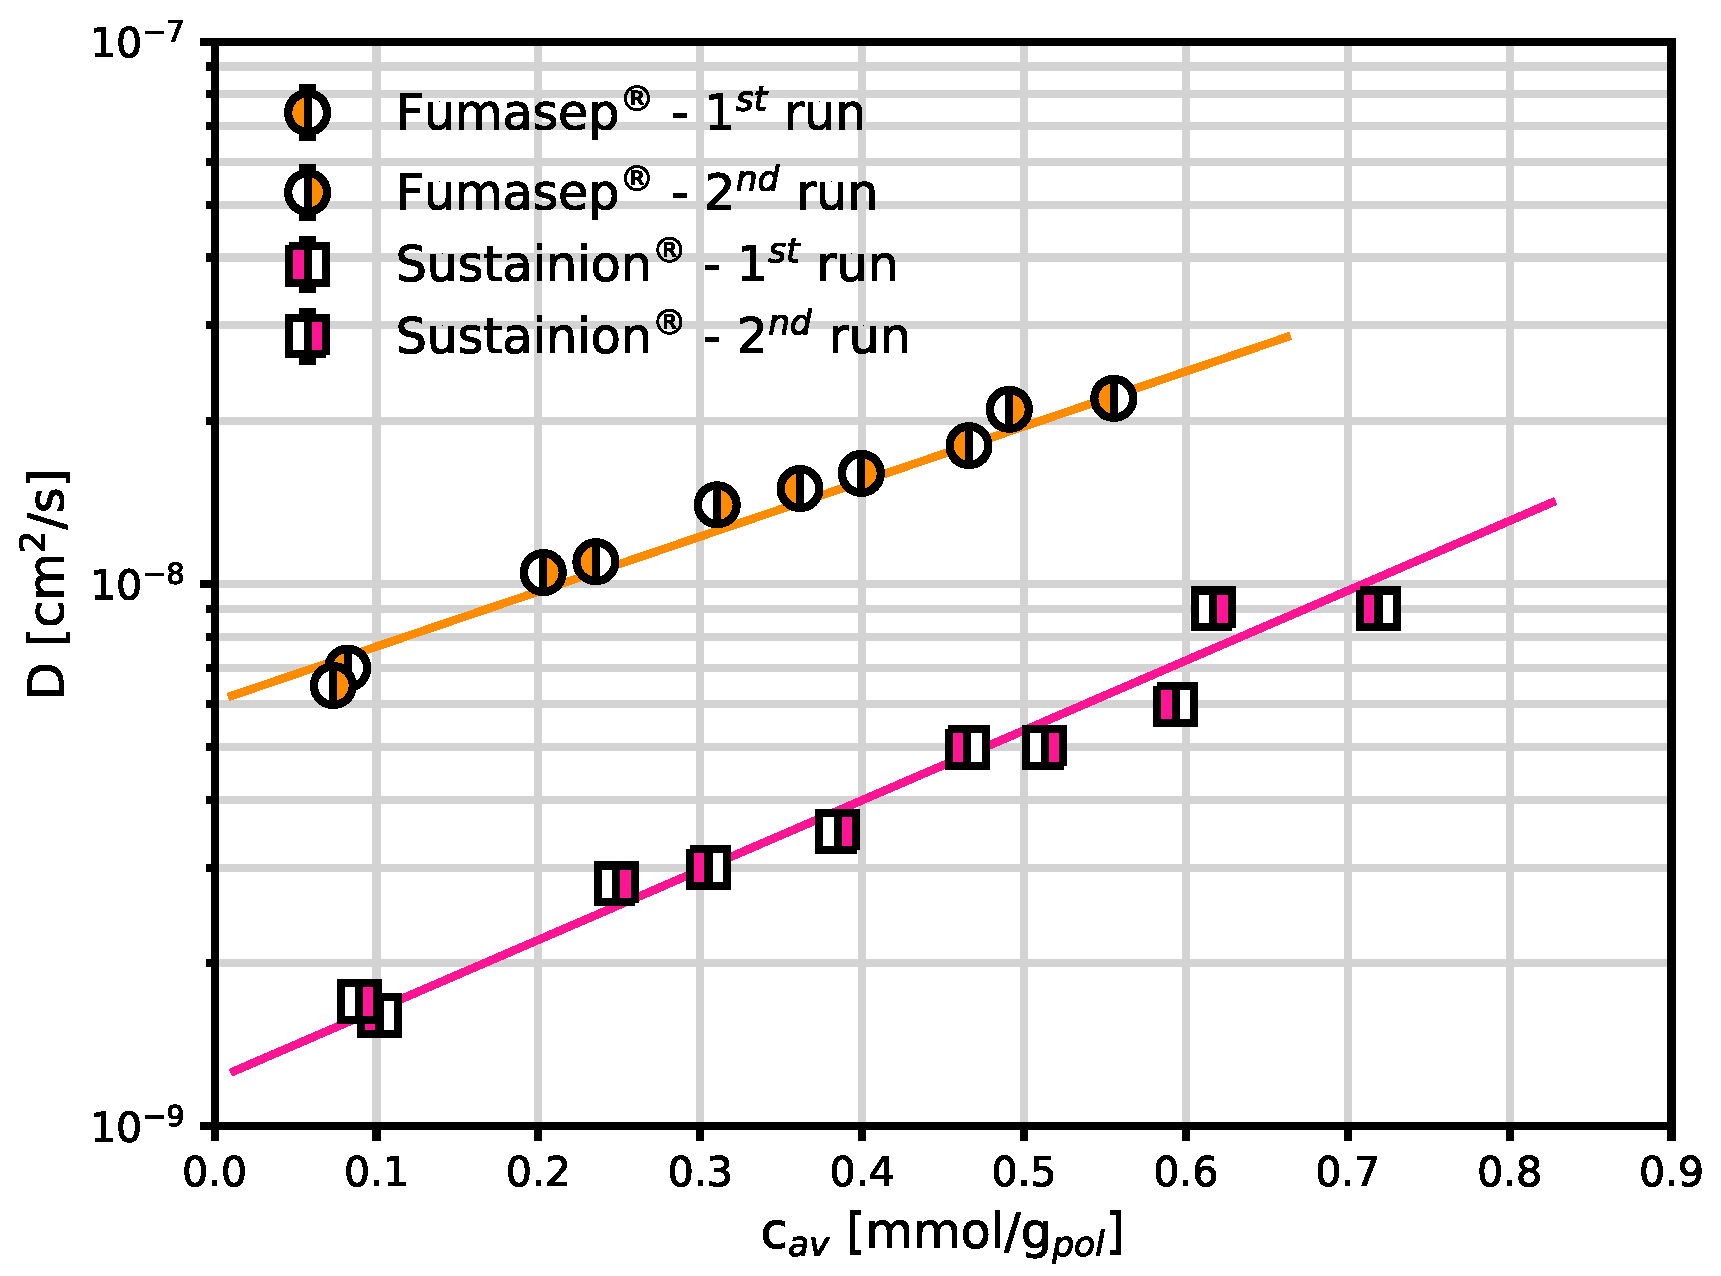
Table 2.
The exponential fitting (Eq. 4) correlation parameters for CO2 diffusion at 30 °C in the AEM investigated, together with the coefficient of determination.
Table 2.
The exponential fitting (Eq. 4) correlation parameters for CO2 diffusion at 30 °C in the AEM investigated, together with the coefficient of determination.
| Material |
× 109 cm2 s-1 |
mmol g-1 |
|
| Fumasep® | 6.07 ± 0.19 | 2.34 ± 0.15 | 0.977 |
| Sustainion® | 1.22 ± 0.11 | 2.96 ± 0.31 | 0.921 |
a CO2 permeation.
Finally, the permeability coefficients were evaluated as the product between diffusivity and solubility for CO2, in the two materials (Eq. 5) and reported in Figure 7. Due to the combination of solubility and diffusivity effects, Fumasep® shows a higher CO2 permeability than Sustainion®. Permeability varies from 3.4 to 4.7 Barrer and from 0.7 to 1.7 for Sustainion. Also, as S decreases sharply in the low-pressure range while D continues to increase exponentially as S flattens out at medium pressures, the permeability shows a minimum (3.2 Barrer for Fumasep® at about 3 bar, 0.6 Barrer for Sustainion® at 2.8 bar). This threshold is sometimes indicated as the plasticization pressure in the membrane literature and is typically observed in the CO2 permeation through glassy polymers.
Figure 7.
CO2 permeability coefficients in Fumasep® and Sustainion® at 30°C in the dry state, evaluated as the product of solubility and diffusivity coefficients. The continuous lines are reported as guide to the eye. CO2 permeability in Aquivion® [13] and Nafion® [14] at 35 °C at 2 bar transmembrane pressure is reported for comparison.
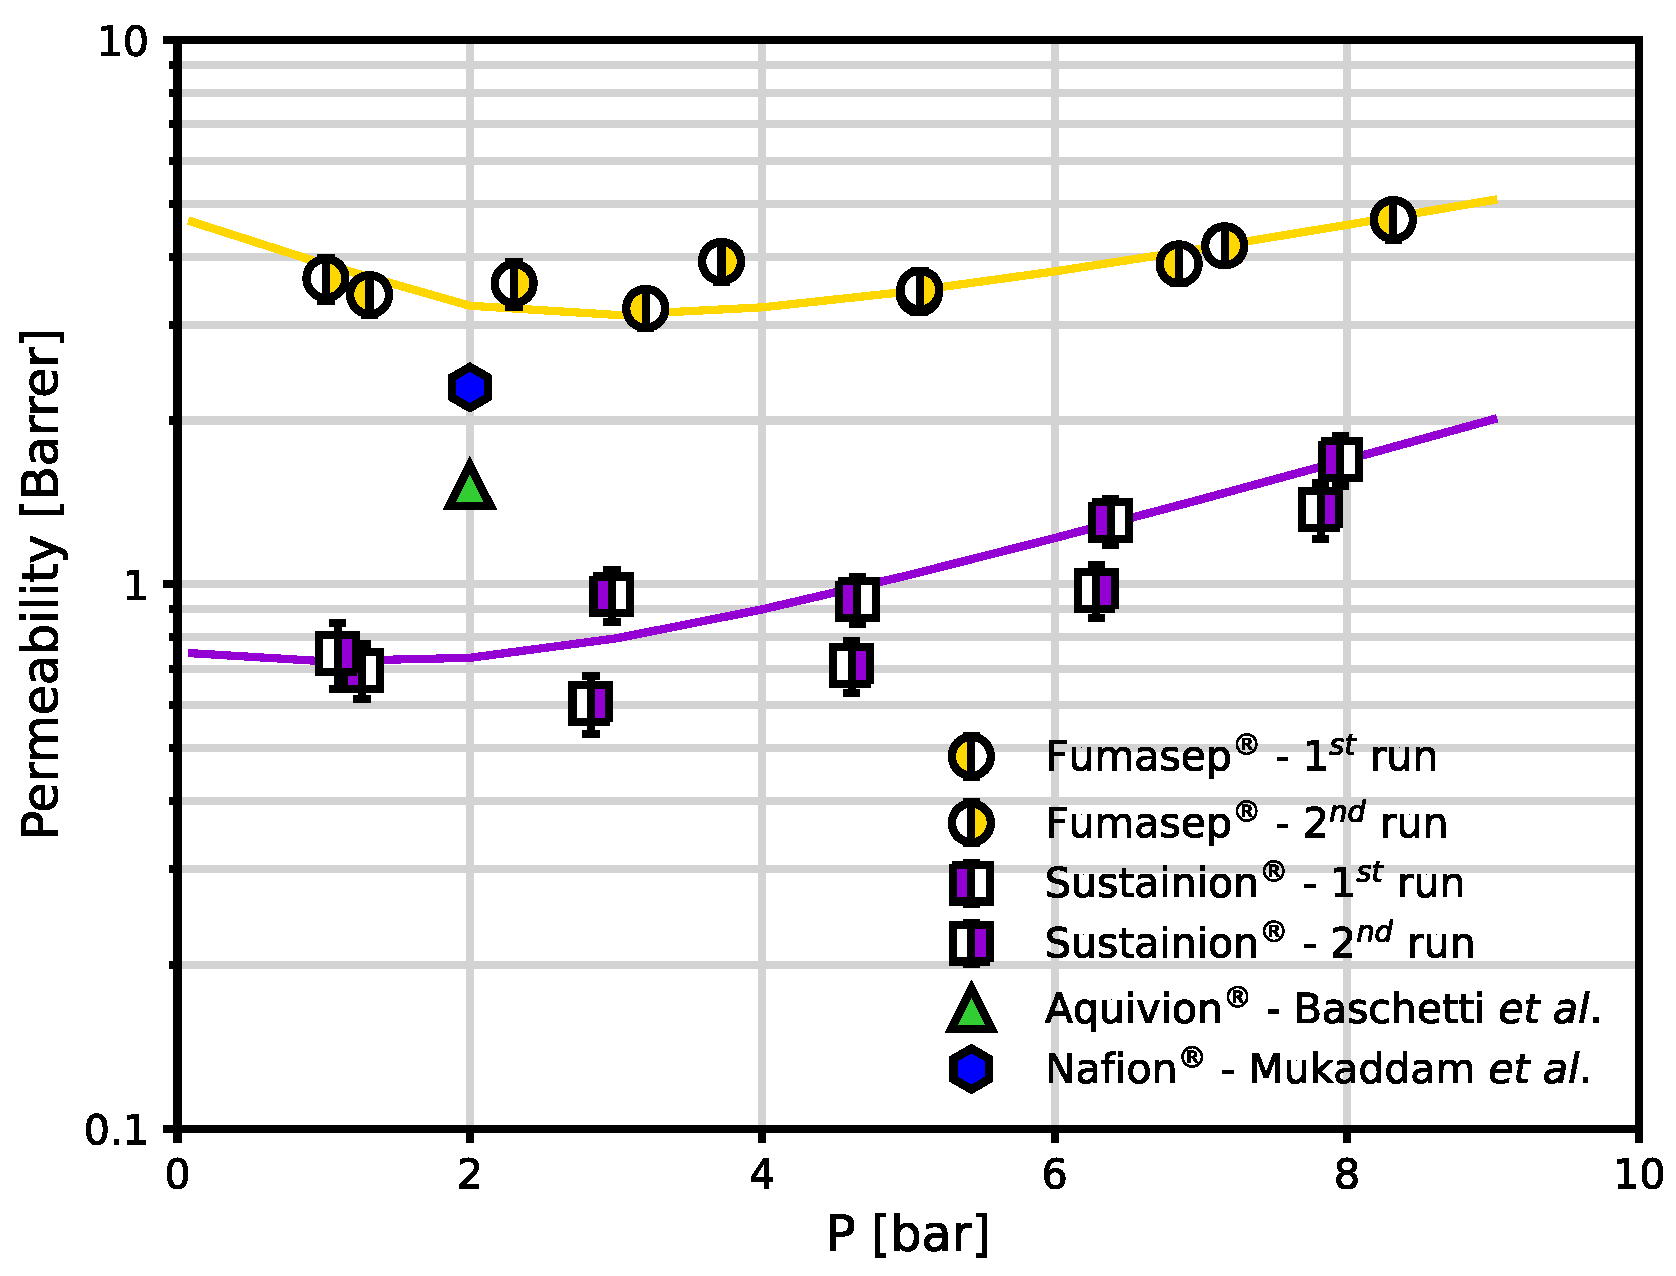
Finally, we report CO2 dry permeability values obtained in the literature for other ion exchange membranes, namely two fluorinated matrices which go under the trade name of Aquivion® [13] and Nafion® [14]. In particular, Nafion® was tested after being dried at 80°C for 48 h [14], at 35 °C and 2 bar upstream pressure, while Aquivion® was pre-dried at 100°C for 24 h, tested at 35 °C and 2 bar [13]. The permeability of these two materials lies in between the values obtained in this work for Sustainion® and Fumasep®, respectively.
4. Conclusions
In this study, we conducted a detailed analysis of the dry gas transport properties of two commercially available anion exchange membranes, Fumasep® and Sustainion®. Both membranes feature covalently attached quaternary ammonium groups and show potential for use in various clean energy and carbon-neutral applications. Their increasing application in fuel cells, electrolysis, and notably in CO2 capture and utilization processes makes understanding their basic transport properties such as sorption and diffusion coefficients vital for process design and simulation.
We carried out dry CO2 and CH4 sorption tests at 30 °C and pressures up to 8 bar. These tests revealed that CO2 exhibits a convex-shaped sorption isotherm in both types of membrane, with Sustainion® displaying a marginally higher sorption capacity than Fumasep®. The sorption isotherms for CO2 can be described using the DSM model. In contrast, CH4 displayed a linear sorption isotherm, consistent with Henry's law, and showed a lesser mass uptake compared to CO2. From these findings, we calculated the ideal solubility selectivity for CO2 over CH4 in each membrane. Fumasep® demonstrated a higher selectivity, which decreased with increasing pressure from 10 to 3 over the pressure range examined.
The diffusion coefficients for CO2 were determined from the transient phase of the sorption tests at varying concentrations. In both membranes, CO2 diffusivity followed an exponential relationship with its concentration, suggesting significant swelling effects within the membrane structure induced by CO2. Notably, Fumasep® exhibited considerably higher CO2 diffusivity compared to Sustainion®, likely due to a greater free volume.
Permeability curves, calculated as a function of pressure using the solution-diffusion model, showed that dry CO2 permeabilities of both membranes had a comparable order of magnitude to that observed in fluorinated ion exchange polymers like Nafion® and Aquivion®. The permeability decreased initially with increasing pressure, reaching a minimum at around 2-3 bar, and then increased exponentially. This pattern is typical for glassy polymers, highlighting the complex interplay of solubility and diffusivity under varying pressures.
In conclusion, the results of this study establish a solid groundwork for the development of advanced CO2 capture and utilization technologies utilizing the selective properties and high charge density of anion exchange membranes. This includes promising applications such as moisture-driven direct air capture and other innovative processes.
Author Contributions
Conceptualization, M.G.D.A.; Methodology, S.K. and K.P.; Software, K.P.; Investigation, K.P.; Data Curation, K.P.; Writing – Original Draft Preparation, M.G.D.A.; Writing – Review & Editing, M.G.D.A. and S.K.; Supervision, M.G.D.A.
Funding
Prof Sandra Kentish would like to acknowledge the Australian Research Council Discovery Project DP240101405 for financial support.
Institutional Review Board Statement
Not applicable.
Data Availability Statement
Data will be made available by the authors upon request.
Conflicts of Interest
The authors declare no conflicts of interest.
References
- Wang, H.; Yan, J.; Song, W.; Jiang, C.; Wang, Y.; Xu, T. Ion Exchange Membrane Related Processes towards Carbon Capture, Utilization and Storage: Current Trends and Perspectives. Separation and Purification Technology 2022, 296, 121390. [CrossRef]
- Liu, S.; Hu, J.; Zhang, F.; Zhu, J.; Shi, X.; Wang, L. Robust Enhancement of Direct Air Capture of CO2 Efficiency Using Micro-Sized Anion Exchange Resin Particles. Sustainability 2024, 16, 3601. [CrossRef]
- Wade, J.L.; Lopez Marques, H.; Wang, W.; Flory, J.; Freeman, B. Moisture-Driven CO2 Pump for Direct Air Capture. Journal of Membrane Science 2023, 685, 121954. [CrossRef]
- Chakraborti, T.; Sharma, R.; Krishnamoorthy, A.N.; Chaudhari, H.; Mamtani, K.; Singh, J.K. Unravelling the Effect of Molecular Interactions on Macroscale Properties in Sustainion Anion Exchange Membrane (AEM) under Hydrated Conditions Using MD Simulations. Journal of Membrane Science 2024, 705, 122887. [CrossRef]
- Liu, Z.; Yang, H.; Kutz, R.; Masel, R.I. CO2 Electrolysis to CO and O2 at High Selectivity, Stability and Efficiency Using Sustainion Membranes. J. Electrochem. Soc. 2018, 165, J3371–J3377. [CrossRef]
- Jang, E.-S.; Kamcev, J.; Kobayashi, K.; Yan, N.; Sujanani, R.; Talley, S.J.; Moore, R.B.; Paul, D.R.; Freeman, B.D. Effect of Water Content on Sodium Chloride Sorption in Cross-Linked Cation Exchange Membranes. Macromolecules 2019, 52, 2569–2579. [CrossRef]
- Kubannek, F.; Zhegur-Khais, A.; Li, S.; Dekel, D.R.; Krewer, U. Model-Based Insights into the Decarbonation Dynamics of Anion-Exchange Membranes. Chemical Engineering Journal 2023, 459, 141534. [CrossRef]
- F02 Committee ASTM International. Test Method for Determining Gas Permeability Characteristics of Plastic Film and Sheeting; [CrossRef]
- Ricci, E.; Minelli, M.; De Angelis, M.G. Modelling Sorption and Transport of Gases in Polymeric Membranes across Different Scales: A Review. Membranes 2022, 12, 857. [CrossRef]
- Crank, J. The Mathematics of Diffusion; Oxford science publications; 2nd ed.; Clarendon press Oxford university press: Oxford Oxford New York, 1975; ISBN 978-0-19-853411-2.
- Wijmans, J.G.; Baker, R.W. The Solution-Diffusion Model: A Review. Journal of Membrane Science 1995, 107, 1–21. [CrossRef]
- Wijmans, J.G. (Hans); Baker, R.W. The Solution–Diffusion Model: A Unified Approach to Membrane Permeation. In Materials Science of Membranes for Gas and Vapor Separation; Yampolskii, Y., Pinnau, I., Freeman, B., Eds.; Wiley, 2006; pp. 159–189 ISBN 978-0-470-85345-0.
- Giacinti Baschetti, M.; Minelli, M.; Catalano, J.; Sarti, G.C. Gas Permeation in Perflurosulfonated Membranes: Influence of Temperature and Relative Humidity. International Journal of Hydrogen Energy 2013, 38, 11973–11982. [CrossRef]
- Mukaddam, M.; Litwiller, E.; Pinnau, I. Gas Sorption, Diffusion, and Permeation in Nafion. Macromolecules 2016, 49, 280–286. [CrossRef]
Disclaimer/Publisher’s Note: The statements, opinions and data contained in all publications are solely those of the individual author(s) and contributor(s) and not of MDPI and/or the editor(s). MDPI and/or the editor(s) disclaim responsibility for any injury to people or property resulting from any ideas, methods, instructions or products referred to in the content. |
© 2025 by the authors. Licensee MDPI, Basel, Switzerland. This article is an open access article distributed under the terms and conditions of the Creative Commons Attribution (CC BY) license (http://creativecommons.org/licenses/by/4.0/).
Copyright: This open access article is published under a Creative Commons CC BY 4.0 license, which permit the free download, distribution, and reuse, provided that the author and preprint are cited in any reuse.


