
Submitted:
05 May 2025
Posted:
06 May 2025
You are already at the latest version
Abstract
Field-based diagnostic technologies which aid in the early detection of bovine respiratory disease (BRD) are of great need, given the rising attention related to animal welfare and antimicrobial stewardship. This induced BRD study followed 12 Holstein calves through pre-challenge (day 1-3) and post-challenge (day 6-13) periods with daily sampling of na-sal secretions with nasal swabs and expired air with air collection bags for determination of BRD status by use of an electronic nose (eNose). Animals were challenged with bovine herpes virus-1 (BHV-1) on day 3 following sample collection and Mannheimia haemolytica on day 5. Results demonstrated a high degree of accuracy for the eNose in correctly classifying pre-challenge samples for nasal swabs (93.5%) and expired air (96.8%). Post-challenge correct classification by the eNose was 97.8% for nasal swabs and 72.5% for expired air samples. Logistical regression was used to determine the probability of agreement between eNose classification and actual animal BRD status by study day. The largest discrepancy between nasal swab and expired air samples fell on days 6 and 7, immediately following the bacterial challenge. The eNose demonstrated potential as a field-based diagnostic tool for the detection of BRD with nasal swabs as the optimal sample type.
Keywords:
bovine respiratory disease
; cattle
; diagnostic test
; electronic nose
; volatile organic compounds
1. Introduction
Bovine respiratory disease (BRD) is the most significant health challenge facing United States commercial cattle feeding operations and consequently results in substantial economic losses for the industry each year [1]. Costs commonly associated with BRD include prevention, treatment of sick cattle, decreased productivity in the form of lower average daily gains, death loss, and labor. The development of field-based diagnostics for the early detection of BRD is gaining increasing attention, driven by growing concerns over animal welfare and the rising threat of antibiotic resistance in the livestock industry [2]. The ability to provide rapid, accurate, and easy to interpret results, which can be implemented shortly after diagnosis to guide timely treatment, has shown to be a definitive need for the cattle industry. However, validation of field-based diagnostic tools is complicated by the lack of an affordable and practical gold standard diagnostic test [3].
Currently, antemortem diagnosis of BRD in commercial cattle feeding operations is primarily accomplished by animal caretakers based on visual observation of clinical signs. Clinical illness scoring systems, such as the Wisconsin [4] and California scoring systems [5] for pre-weaned dairy calves, and the less structured DART (depression, appetite loss, respiratory character, and temperature) system [6] for feedlot cattle, have been used to provide more objective criteria for BRD diagnosis and treatment. Unfortunately, these systems rely on proper training of the animal caretaker to determine a final diagnosis. Reported sensitivity and specificity of these scoring systems range widely with varying cutoffs analyzed and the accuracy, which is rarely better than 90%, is largely based on the individual scorer’s ability to detect clinical signs [7,8]. Due to a consistent lack of accuracy in diagnosing BRD from clinical signs alone, ancillary tests are occasionally implemented to help in the diagnosis. Body temperature measurement, while not specific to BRD, can be an objective measurement to aid the diagnosis of BRD. The diagnostic accuracy of rectal temperature with clinical signs has been demonstrated to be suboptimal for BRD-specific diagnosis [9]. Other veterinary tools such as a stethoscope, used for thoracic auscultation of the lungs, and an ultrasound, used for advanced imaging of the pleura and superficial lung lobes, have been accompanied by a variety of scoring systems to bring objectivity in making a BRD diagnosis [10-13]. Regrettably, these tools and associated scoring systems also require training of the animal caretaker before implementation and still vary widely based on the animal caretaker’s skill in operating such modalities [14].
Field-based diagnostic tests which provide objective results pertaining to a BRD-specific diagnosis and depend only minimally on the skill of an individual in operating and accurately interpreting the test are limited. Computer-aided lung auscultation (CALA) is one of the only validated field-based technologies for feedlot cattle in the diagnosis of BRD [15]. The CALA output is in the form of a score of 1-5, which is assigned independent of the auscultation skill of the animal caretaker, allowing the results to be consistent from test operator to operator [16]. Although not validated or widely used in a field setting, an on-farm colorimetric detection assay utilizing loop-mediated isothermal amplification (LAMP) has been tested for the detection of common BRD bacterial pathogens, including Pasteurella multocida, Mannheimia haemolytica, and Histophilus somni [17]. It detects the presence of these specific BRD bacteria in respiratory samples based on a color change detected by computer software. The downside of the LAMP assay pertains to the requirement of multiple primers. Additionally, designing primers that can match and detect the majority of strains in the field is somewhat challenging. A limitation inherent to diagnosing BRD with LAMP pertains to its sensitivity in detecting BRD pathogens which are commensals of the bovine respiratory tract. A positive test result provided by LAMP may not mean an animal truly has respiratory disease.
Another field-based diagnostic technology which is not validated or widely used in a field setting for the diagnosis of BRD is the electronic nose (eNose). This device detects volatile organic compounds (VOCs) emitted from a biological sample via an internal bank of chemical sensors [18]. VOCs found within the respiratory tract are products of viral, bacterial, and inflammatory origin [19-21]. eNoses analyze sample VOCs profile and output categorical results based on pre-training of the device for specific disease processes or pathogens, thus allowing the animal caretaker to implement the device on-farm with ease. An eNose has been previously used to test secretions obtained via nasal swabs of calves naturally infected with BRD (Mycoplasma bovis and bovine adenovirus-3). The eNose was able to correctly classify 10 calves as either “sick” or “healthy” with 100% accuracy [22]. Other studies have utilized an eNose for the detection of bovine tuberculosis in cattle. Cho et al. [23] demonstrated differentiation of 11 bovine tuberculosis-infected serum samples from 10 bovine tuberculosis-free serum samples using principal component analysis. Additionally, Fend et al. [24] were able to correctly classify 16 unknown sera samples from calves as either infected or uninfected with Mycobacterium bovis using a discriminant function analysis model. A single study assessed the ability of an eNose to characterize blood serum samples from cattle experimentally infected with Mannheimia haemolytica and non-infected cattle [25]. Results of this study compared eNose sensor responses to acute phase protein concentrations with differentiation between infected and uninfected animals. The existing literature is deficient in studies demonstrating the use of a commercially available eNose for detecting BRD due to pathogens commonly found in United States cattle feeding operations.
This study utilizes the commercially available Cyranose® 320 eNose in calves experimentally induced with BRD pathogens (bovine herpes virus-1 [BHV-1] and Mannheimia haemolytica) to determine its capability for accurate BRD status classification. The objectives of this study are to determine the ability of the eNose to correctly differentiate calves pre-BRD challenge from the same calves post-BRD challenge and to optimize the sample type for use on the eNose to diagnosis BRD.
2. Materials and Methods
2.1. Experimental Design and Enrollment Criteria
This study was conducted over a two-week period in July and August of 2022 at the Kansas State University College of Veterinary Medicine. The study population consisted of twelve, 150 kg (range: 143 – 172 kg) intact male Holstein calves sourced from a commercial dairy. Calves included in the study were not previously treated for respiratory disease at the source location and were determined to be clinically healthy by a large animal veterinarian on arrival to the study location. Prior to study initiation, calves (n=12) were individually identified with a single ear tag and then were randomly assigned to two equal groups (n=6). Each group of calves was housed in separate pens with open-front sheds and 9.2 x 18.4 m concrete pads. Study calves were fed a ration containing corn, oats, and soybean meal with monensin and ad libitum access to prairie hay and water. Calves were acclimated overnight (acclimation – study day 0) before the study commenced.
During the study period, 264 respiratory samples, consisting of 132 expired air and 132 nasal swab samples, were collected from the 12 study animals. Throughout the study each calf was observed at least twice daily for signs of clinical illness. On study days 1 and 2, each calf had respiratory samples collected once per day. Half of the study population (n=6) had expired air and nasal swabs collected in the morning while the other half had respiratory samples collected in the evening. After respiratory sample collection, samples were transported to a laboratory at the Kansas State University College of Veterinary Medicine for analysis by the Cyranose® 320 eNose. Calves alternated between morning and evening sample collection on each consecutive day throughout the study period except for day 3. On study day 3, samples were collected from all calves in the morning and then all animals were challenged with BHV-1 immediately after. On study day 4, calves were only observed for clinical illness with no respiratory samples collected. On the morning of study day 5, calves were challenged with Mannheimia haemolytica and then followed with clinical observation every six hours for a 24-hour period. Twice daily respiratory sample collection along with clinical observation resumed for all calves on study day 6 and continued through study day 13, following the same format as detailed on study day 1 and 2. The study timeline (Table 1) illustrates a simplified sampling scheme with associated viral and bacterial challenge timepoints for the live animal portion of the study. On study day 14, all calves were euthanized and necropsied for assessment of lung pathology. Calves were sedated with xylazine (IM, 0.15 mg/kg) and euthanized by captive bolt and intravenous infusion of supersaturated magnesium sulfate. Gross necropsy was conducted on all study animals and lung lesions were scored by a single investigator (BVL) as described by Fajt et al. [26].
2.2. Viral Challenge Preparation and Inoculation
BHV-1 (Colorado strain) was propagated at 37°C in a 5% CO2 incubator on a bovine nasal turbinate (BT) cell line. After 70-80% cytopathic effect (CPE) development in the 75 cm2 cell culture flask, the material was exposed to two freeze/thaw cycles. The cell debris was centrifuged at low speed (1500 x g) for 10 minutes. The supernatant was titrated in the vials and placed on the BT cells for 48 hours to determine 105 Tissue Culture Infectious Dose 50 (TCID50)/ml of the challenge inoculum. Individual challenge doses (4 mL) were aliquoted and stored at -80°C. Viral challenge aliquots were thawed in a household refrigerator (~4°C) 24 hours prior to inoculation. On study day 3, all animals were restrained in a squeeze chute with a rope halter and inoculated with 4x10⁵ TCID50 BHV-1 by fully inserting a 5 cm plastic nasal cannula into the left nostril.
2.3. Bacterial Challenge Preparation and Inoculation
A field strain of Mannheimia haemolytica serotype A1 was grown from a characterized clinical isolate on sheep blood agar in 5%-7% CO2 for 18-24 hours. A single isolated bacterial colony was inoculated into brain-heart infusion (BHI) broth and incubated for 16-18 hours at 37°C. The bacterial inoculum was centrifuged at 3,000 g for 15 minutes at 4°C and washed twice with phosphate buffered saline (PBS). After the second wash, the bacterial pellet was suspended in PBS to reach an optical density equivalent to 1.0-1.2×10⁹ CFU/10 ml. The bacterial challenge preparation was completed the morning of inoculation (study day 5). After preparation, the inoculum was placed on ice in a light-protected cooler and transported to the study site. At the study site all calves were restrained in a squeeze chute with a rope halter and inoculated with 10 mL of the M. haemolytica suspension via endoscopy into the tracheal bronchus. Following instillation of the inoculum, the endoscope was flushed with 60 mL of sterile PBS solution to achieve a total volume of 70 mL.
2.4. Expired Air and Nasal Swab Collection
Expired air and nasal swab samples were collected for eNose analysis. Samples were collected from all study animals on an alternating morning/evening schedule (n=6 at each daily timepoint) on study days 1, 2, and 6-13. To illustrate, a study animal that was sampled at the morning timepoint on day 1, was then sampled at the evening timepoint on day 2 and so forth. Exceptions to this alternating daily sample scheme include: all samples were collected on the morning of study day 3 prior to the viral challenge, no respiratory samples were collected on day 4, and no respiratory samples were collected on day 5 (M. haemolytica challenge day).
2.4.1. Expired Air
Expired air samples were collected using the apparatus depicted in Figure 1. A large canine anesthetic induction mask was connected on one end to a disposable non-rebreathing T-piece. On the outflow port of the T-piece, a sealed 3.79 L mylar food storage bag attached via a 22 mm internal diameter (ID) tubing adapter. The anesthesia mask provided an air-tight seal around the calf’s mouth and nostrils and was held on the calf for the entire collection cycle. As the calf exhaled, expired air was diverted through the non-rebreathing T-piece into the mylar bag. As the calf inhaled the valve on the non-rebreathing T-piece connected to the mylar bag closed and the valve opposite opened which allowed fresh air into the mask. Calves would breathe into the air collection apparatus until the mylar bag was full (approximately 5-10 breaths). Once collection was complete the 22 mm ID tubing adapter connected to the mylar bag was removed from the non-rebreathing T-piece and sealed with a 22 mm ID rubber tapered plug. Expired air bags were held at environmental temperature (~20-38°C) after collecting until transport into the laboratory where they were held at room temperature (20°C) to be analyzed by the eNose.
2.4.2. Nasal Swab
After removing dirt and debris from the external nares with a paper towel, a 15 cm sterile rayon swab with polystyrene handle was inserted approximately 7.5 cm into the nasal cavity and rotated across the nasal mucosa for approximately 5 seconds. The swab was then removed from the nares and placed in a 6 mL preservative-free blood collection tube and capped. The swab was held at environmental temperature (~20-38°C) after collecting until transport into the laboratory where it was held at room temperature (20°C) to be analyzed by the eNose. Calf nostril sampling was alternated (left/right) each consecutive day of the study.
2.5. eNose Procedure
Respiratory samples were analyzed by Cyranose 320® eNose according to the manufacturer’s general recommendation and previous work done by Schelkopf et al. [27]. The Cyranose® 320 eNose is a portable, handheld device composed of 32 carbon-based sensors with potential to differentiate a wide array of VOC profiles. The Cyranose 320® eNose instrument settings for analysis of expired air and nasal swab samples are outlined in Table 2 and Table 3. For expired air samples, a 16 G x 1.5” aluminum hub needle was penetrated through the mylar bag. The needle was attached to a 76 cm intravenous extension set connected to the eNose sample inlet. Prior to running the expired air samples, the eNose underwent a conditioning phase, consisting of a six-minute purge cycle followed by three pre-sniffs using expired air samples from the previous collection timepoint. Expired air samples were analyzed between one to four hours post-collection.
For nasal swab samples, a 16 G x 1.5” aluminum hub needle was penetrated through the rubber cap of the preservative-free blood collection tube. The needle was attached to the eNose by the same set-up outlined for the expired air sample. An additional 18 G x 3.5” spinal needle was penetrated through the rubber cap of the blood collection tube next to the previous needle (Figure 2) to eliminate negative pressure generated from the eNose inlet pump. Prior to running the nasal swab samples, the eNose underwent a conditioning phase with three pre-sniffs using nasal swab samples from the previous collection timepoint as described for expired air samples. Nasal swab samples were analyzed between one to four hours post-collection.
2.6. eNose Training and Data Processing
All samples collected during the study were analyzed by the Cyranose® 320 eNose. Raw data generated from a single sample run on the eNose was streamed into the PCnose™ software, provided with the Cyranose® 320 eNose, on an external computer and stored as a comma-separated values (CSV) file. CSV files were then loaded into the Chemometric Data Analysis (CDAnalysis™) software, provided with the Cyranose® 320 eNose, on the external computer to create a training set. A separate training set was created for expired air and nasal swab samples. “Post-Challenge” training set classes for both expired air and nasal swabs were created by selecting 5 sample runs on study day 13 from calves with the greatest amount of lung consolidation on necropsy (Day 14). “Pre-Challenge” classes used in the training sets differed between expired air and nasal swabs and were created by selecting 5 sample runs randomly without replacement from the first 3 days of the study excluding calves used in the “Post-Challenge” class of the training set. Training sets were evaluated on the PCnose™ and CDAnalysis™ software for quality assurance and quality control, as recommended by the eNose manufacturer. The two parameters evaluated were cross validation and Mahalanobis distance, both of which provide objective measurements pertaining to how well the 2 classes in the training set are separated. Once the training sets were established, the remaining individual sample data (CSV files) from previous sample runs collected on the eNose were ran as “unknown samples” in the CDAnalysis™ software to get a binary outcome (“Pre-Challenge” or “Post-Challenge”). Data analysis configuration settings used for the training sets are included in Table 2 and Table 3.
2.7. Statistical Analysis
All expired air and nasal swab samples not used in the creation of training sets were run through their associated training set on the CDAnalysis™ software as “unknown samples” and assigned either a “Pre-Challenge” or “Post-Challenge” classification as described above. Nasal swab samples were exclusively run on the single nasal swab training set and expired air samples were exclusively run on the single expired air training set. Descriptive statistics were used to determine the count and associated percentage of correctly identified pre- and post-challenge samples on the eNose for expired air and nasal swabs.
Data were also analyzed by a logistic regression model using the “glm” function in the ‘stats’ package of R Studio® (R Studio®, version 2024.9.0.375; R Core Team) to determine the probability of agreement between the eNose/CDAnalysis™ software and the animal’s actual status. The model’s outcome variable was the comparison of the classification of eNose/CDAnalysis™ (“Pre-Challenge” or “Post-Challenge”) to the actual animal status (pre-challenge vs. post-challenge). Comparison was binomial with agreement (1) or disagreement (0). The model included fixed effects for sample type, day, and the interaction of sample type by day with an associated significance level of p < 0.05. Animal identification was included as a random intercept in the model to account for repeated measures. The “emmeans” function in the ‘emmeans’ package of R Studio® was used to calculate the probability of agreement between the eNose/CDAnalysis™ software to the actual animal status for each sample type by study day.
3. Results
3.1. Descriptive Statistics
Calf lung consolidation scores collected at necropsy (day 14) are individually reported in Table 4. Mean lung consolidation among all 12 calves was 13.17% (median: 11.85%). Cross validation of expired air training set performed on the PCnose™ and CDAnalysis™ software from the Canonical Discriminant Analysis algorithm (CDA) model was 70% with a Mahalanobis distance between the two classes (“Pre-Challenge” and “Post-Challenge”) of 14.3. Nasal swab cross validation was 70% as well with a Mahalanobis distance between the two classes of 5.018.
In total 132 expired air and 132 nasal swab samples were collected during the study period. Ten expired air and 10 nasal swab samples were used to create the respective training sets leaving 122 nasal swabs and 122 expired air samples for analysis by the eNose/CDAnalysis™ software. In the pre-challenge period (Day 1-3) the eNose correctly identified 30/31 expired air samples as pre-challenge, compared to 29/31 nasal swab samples (Table 5). In the post-challenge period (Day 6-13), the eNose correctly identified 66/91 expired air samples as post-challenge, far fewer than the 89/91 correctly identified nasal swab samples (Table 5). Individual animal eNose classification by day of the study is displayed for both expired air and nasal swabs in Figure 3 and Figure 4, along with identification of samples used in creation of the training set.
3.2. Logsitic Regression
Figure 5 displays the model estimated mean probability of agreement between the Cyranose® 320 eNose and the actual animal status by sample type and study day. When the logistic regression model was performed to predict probability of agreement as described in the methods, the model failed to converge with animal identification accounting for repeated measures. Animal identification was subsequently removed from the model. In the final model the interaction of sample type by day was significant (p = 0.0493), so main effects were not reported. In the pre-challenge period, expired air had a mean probability of agreement of 1.0 (standard error [SE] <0.01) for study day 1 and a mean probability of agreement of 1.0 (SE <0.01) for study day 2. On study day 3, expired air had a mean probability of agreement of 0.91 (SE = 0.09). Pre-challenge results were similar for nasal swabs with a mean probability of agreement of 0.91 (SE = 0.09) on day 1, 0.90 (SE = 0.09) on day 2, and perfect agreement (probability [P] = 1.0, SE <0.01) on day 3. Post-challenge mean probability of agreement differed the most between expired air and nasal swab on study days 6 and 7 (day 1 and 2 post-M. haemolytica challenge [expired air- day 6: P <0.01 +/- <0.01 SE, day 7: P= 0.42 +/- 0.14 SE; nasal swab- day 6 & 7: P= 0.92 +/- 0.08 SE]). On days 8 through 13 nasal swabs had perfect mean probability of agreement (P= 1.0 +/- <0.01 SE) between the eNose and the actual animal status. Expired air mean probability of agreement increased from day 6 to perfect agreement (P = 1.0 +/- <0.01 SE) by day 10 and 11. The mean probability for expired air samples decreased after day 11 to 0.92 (SE = 0.08) on day 12 and 0.86 (SE = 0.13) on day 13.
4. Discussion
No published study has used the Cyranose® 320 eNose in the detection of BRD in cattle from respiratory samples in an induced disease model. The focus of the current study was to provide proof of concept that the Cyranose® 320 eNose has potential as a BRD diagnostic tool and to assess its ease of use for potential field-based application. The methods utilized to operate the Cyranose® 320 eNose were based on prior research to detect ketosis in dairy cattle by our research group and the general recommendations for basic operation provided by the manufacturer of the device [27]. Operation of the device was carried out in a manner that could be practically applied in a commercial livestock operation for the diagnosis of BRD.
In the absence of a practical and affordable gold standard test for diagnosing naturally occurring BRD, the authors elected to use a challenge model with two commonly isolated BRD pathogens (BHV-1 and M. haemolytica) to test the utility of the eNose for BRD diagnosis. The challenge model provided the advantage of knowing when animals became exposed to the pathogens and allowed for daily sampling throughout the early period of known infection. Daily sampling after the BRD challenge was included in the study design to determine how early in the disease process the eNose could reliably make a diagnosis, if feasible at all. To minimize the impact of prior respiratory disease on study results, animals used in this study were selected based on no previous history of BRD treatment and the absence of BRD signs (labored breathing, nasal and/ocular discharge, cough, and lethargy) throughout the pre-challenge period. The inoculation of BHV-1 and M. haemolytica served as the gold standard methods for classifying animals with BRD. The presence of BRD was confirmed on the final day of the study by evidence of lung consolidation. Due to the variety of proposed methods for classifying an animal as a true BRD-positive or negative, such as presence or absence of organisms on culture [28], clinical illness scoring systems [29], and percent of lung consolidation [30], samples collected from animals prior to the BRD challenge are referred to as “Pre-Challenge” and samples collected from animals after the BRD challenge as “Post-Challenge” to avoid any confusion in true disease status.
Overall, the Cyranose® 320 eNose was able to correctly identify pre- and post-challenge samples with a high degree of accuracy (Table 5). Specifically, in the pre-challenge period, expired air and nasal swab sample types both provided a high probability of agreement between eNose classification and actual animal status regardless of the day (Figure 5). In Figure 5, when evaluating the post-challenge period for both sample types, in general, the agreement increased as the challenge period progressed. This isn’t unexpected as the eNose was trained with day 13 samples, when study animals likely would have had more developed respiratory disease. The post-challenge period provided the greatest divergence between the two sample types. While both expired air and nasal swabs had the lowest probability of agreement in the post-challenge period on day 6 and 7, the nasal swab provided results that were still comparable to the high probability found in the pre-challenge and middle to late post-challenge periods.
The results in this study closely match the only other published research which used an eNose to provide a binary diagnosis for BRD [22]. Kuchmenko et al. [22] were able to correctly classify 5/5 calves as “healthy” and 5/5 calves as “sick” with an 8 sensor eNose trained on 20 healthy and 20 sick cattle from the same cohort. While it is common among studies using an eNose in the diagnosis of respiratory disease to analyze individual sensors responses [22,25], the current study uses the combined response of all 32 sensors present in the device to provide a singular categorical output. Individual sensor data were not explored in this study due to the high degree of accuracy already acquired from the combination of all sensors. However, the Cyranose®320 eNose can turn on and off any of its 32 sensors, so further optimization of the device is possible through this method. Additionally, the Cyranose® 320 eNose comes equipped with other algorithms for data analysis. Only one algorithm (CDA) was applied for data analysis throughout this study due to the high degree of accuracy achieved. While the model cross validation using the CDA algorithm achieved for both training sets would be considered suboptimum (70%), previous work by Schelkopf et al. [27] determined that model cross validation on the Cyranose 320® eNose did not reliably translate to diagnostic accuracy.
It's important to note that the eNose used throughout this study was trained on raw respiratory samples collected from live cattle enrolled in the study. The eNose was not specifically trained to detect certain bacteria, viruses, or specific inflammatory responses present in respiratory disease cases. Additionally, the eNose was optimized by sample selection to differentiate live animals with no clinical BRD signs to live animals which had the lung consolidation on necropsy ranging from 12.30% to 24.65%. It was no surprise to the researchers that samples representing animals immediately post-BRD challenge, which likely have minimal amount of lung consolidation and lower bacterial load, had lower agreement than those samples later in the post-challenge phase of the study.
In terms of field application, this study differs primarily due to the collection of all samples and associated data files prior to creating a training set and running unknown sample files on the designated training set through the CDAnalysis™ software after the study completion. Ideally, samples could be analyzed in real-time after collection on an eNose that is already trained to detect BRD and provide results within minutes. Sample type selection in this study was also based on ease of on-farm application consisting of a hand-made expired air collection bag and a nasal swab with associated collection system. Aside from the nasal swab providing better statistical results, it was also much easier to store, transport, and collect from cattle. The use of a blood collection tube with a pierceable rubber cap to store and analyze the nasal swab with the eNose ensures sample headspace stability. The nasal swab and blood tube system also provided better biosecurity, as collection tools were not shared between cattle, and collected samples were protected from human exposure after collection. These results and observations suggest that the nasal swab is the ideal sample in this study and warrants its use in future similar studies.
The limitations of this study surround its applicability to naturally occurring BRD in commercial cattle feeding operations. Currently, it is undetermined how applicable the specific training set used in this study is on other cohorts of cattle or other pathogens of the BRD complex. Published studies diagnosing respiratory disease in cattle with an eNose have only trained an eNose on the same cohort it used for detection [22,25]. It is unknown if one universal training set can be created and applied to accurately detect BRD in other diverse cattle cohorts and if training sets created in challenge studies are applicable to naturally occurring disease. Sample stability after collection is also unknown. In the current study, samples were collected and then transported to a lab for analysis on the eNose in a span of one to four hours. It is undetermined if results from samples run on the eNose immediately after collection or samples run many hours to days later could still provide reliable results. While work has been done to characterize specific VOCs present in respiratory secretions from cattle with BRD [31,32], this was not attempted in the current study. It is unknown what exact VOCs produced by specific biological processes or organisms are used by the Cyranose® 320 eNose to differentiate animals pre- and post-BRD challenge.
5. Conclusions
The Cyranose® 320 eNose correctly identified pre- and post-challenge respiratory samples with a high degree of accuracy. The majority of incorrect post-challenge classifications occurred immediately following BRD challenge. Given both accuracy and logistics of sample collection, nasal swabs were the optimum sample for detection of BRD using the eNose. This study demonstrates the potential use of the Cyranose® 320 eNose as an on-farm BRD diagnostic tool. Future research to confirm these findings in naturally occurring BRD cases is warranted.
Author Contributions
Conceptualization, Conrad Schelkopf and Brian Lubbers; Data curation, Conrad Schelkopf; Formal analysis, Conrad Schelkopf; Funding acquisition, Brian Lubbers; Investigation, Conrad Schelkopf, Leslie Weaver, Michael Apley and Brian Lubbers; Methodology, Conrad Schelkopf, Leslie Weaver, Michael Apley, Roman Pogranichniy, Lance Noll, Jianfa Bai, Raghavendra Amachawadi and Brian Lubbers; Project administration, Conrad Schelkopf; Resources, Roman Pogranichniy and Raghavendra Amachawadi; Supervision, Brian Lubbers; Validation, Conrad Schelkopf, Leslie Weaver, Michael Apley, Roman Pogranichniy, Lance Noll, Jianfa Bai, Raghavendra Amachawadi and Brian Lubbers; Visualization, Conrad Schelkopf; Writing – original draft, Conrad Schelkopf; Writing – review & editing, Conrad Schelkopf, Leslie Weaver, Michael Apley, Roman Pogranichniy, Lance Noll, Jianfa Bai, Raghavendra Amachawadi and Brian Lubbers.
Funding
This research was funded by the Dr. John and Mildred Gish Large Animal Research Fund at Kansas State University College of Veterinary Medicine.
Institutional Review Board Statement
The animal study protocol was approved by the Institutional Animal Care and Use Committee of Kansas State University (protocol #4574 approved 06.08.2022).
Data Availability Statement
The original contributions presented in this study are included in the article. Further inquiries can be directed to the corresponding author.
Acknowledgments
We would like to acknowledge Kansas State Veterinary Diagnostic Laboratory staff for their help with this study.
Conflicts of Interest
The authors declare no conflicts of interest.
Abbreviations
The following abbreviations are used in this manuscript:
| BRD | Bovine respiratory disease |
| CALA | Computer-aided lung auscultation |
| eNose | Electronic nose |
| VOCs | Volatile organic compounds |
| LAMP | Loop-mediated isothermal amplification |
| BHV-1 | Bovine herpes virus-1 |
| BT | Bovine nasal turbinate |
| CPE | Cytopathic effect |
| TCID50 | 50% Tissue culture infectious dose |
| BHI | Brain-heart infusion |
| PBS | Phosphate buffered saline |
| ID | Internal diameter |
| CSV | Comma-separated values |
| CDA | Canonical discriminant analysis algorithm |
| CDAnalysis™ | Chemometric data analysis software |
| P | Probability |
| SE | Standard error |
References
- Blakebrough-Hall, C.; McMeniman, J.P.; González, L.A. An evaluation of the economic effects of bovine respiratory disease on animal performance, carcass traits, and economic outcomes in feedlot cattle defined using four BRD diagnosis methods. J. Anim. Sci. 2020, 98, 1–11. [Google Scholar] [CrossRef]
- Puig, A.; Ruiz, M.; Bassols, M.; Fraile, L.; Armengol, R. Technological Tools for the Early Detection of Bovine Respiratory Disease in Farms. Animals 2022, 12, 2623. [Google Scholar] [CrossRef]
- Buczinski, S.; Pardon, B. Bovine Respiratory Disease Diagnosis: What Progress Has Been Made in Clinical Diagnosis? Vet. Clin N. Am. Food Anim. Pract. 2020, 36, 399–423. [Google Scholar] [CrossRef] [PubMed]
- McGuirk, S.M.; Peek, S.F. Timely diagnosis of dairy calf respiratory disease using a standardized scoring system. Anim. Health Res. Rev. 2014, 15, 145–147. [Google Scholar] [CrossRef]
- Maier, G.U.; Rowe, J.D.; Lehenbauer, T.W.; Karle, B.M.; Williams, D.R.; Champagne, J.D.; Aly, S.S. Development of a clinical scoring system for bovine respiratory disease in weaned dairy calves. J. Dairy Sci. 2019, 102, 7329–7344. [Google Scholar] [CrossRef] [PubMed]
- Griffin, D.; Chengappa, M.M.; Kuszak, J.; McVey, D.S. Bacterial Pathogens of the Bovine Respiratory Disease Complex. Vet. Clin N. Am. Food Anim. Pract. 2010, 26, 381–394. [Google Scholar] [CrossRef]
- Buczinski, S.; Fecteau, G.; Dubuc, J.; Francoz, D. Validation of a clinical scoring system for bovine respiratory disease complex diagnosis in preweaned dairy calves using a Bayesian framework. Prev. Vet. Med. 2018, 156, 102–112. [Google Scholar] [CrossRef] [PubMed]
- Love, W.J.; Lehenbauer, T.W.; Van Eenennaam, A.L.; Drake, C.M.; Kass, P.H.; Farver, T.B.; Aly, S.S. Sensitivity and specificity of on-farm scoring systems and nasal culture to detect bovine respiratory disease complex in preweaned dairy calves. J. Vet. Diagn. Invest. 2016, 28, 119–128. [Google Scholar] [CrossRef]
- Timsit, E.; Dendukuri, N.; Schiller, I.; Buczinski, S. Diagnostic accuracy of clinical illness for bovine respiratory disease (BRD) diagnosis in beef cattle placed in feedlots: A systematic literature review and hierarchical Bayesian latent-class meta-analysis. Prev. Vet. Med. 2016, 135, 67–73. [Google Scholar] [CrossRef]
- Buczinski, S.; Forté, G.; Francoz, D.; Bélanger, A.M. Comparison of Thoracic Auscultation, Clinical Score, and Ultrasonography as Indicators of Bovine Respiratory Disease in Preweaned Dairy Calves. J. Vet. Intern. Med. 2014, 28, 234–242. [Google Scholar] [CrossRef]
- Boccardo, A.; Ferraro, S.; Sala, G.; Ferrulli, V.; Pravettoni, D.; Buczinski, S. Bayesian evaluation of the accuracy of a thoracic auscultation scoring system in dairy calves with bronchopneumonia using a standard lung sound nomenclature. J. Vet. Intern. Med. 2023, 37, 1603–1613. [Google Scholar] [CrossRef]
- Feitoza, L.F.B.B.; White, B.J.; Larson, R.L. Thoracic Ultrasound in Cattle: Methods, Diagnostics, and Prognostics. Vet. Sci. 2025, 12, 16. [Google Scholar] [CrossRef] [PubMed]
- Ollivett, T.L.; Buczinski, S. On-Farm Use of Ultrasonography for Bovine Respiratory Disease. Vet. Clin N. Am. Food Anim. Pract. 2016, 32, 19–35. [Google Scholar] [CrossRef]
- Buczinski, S.; Buathier, C.; Bélanger, A.M.; Michaux, H.; Tison, N.; Timsit, E. Inter-rater agreement and reliability of thoracic ultrasonographic findings in feedlot calves, with or without naturally occurring bronchopneumonia. J. Vet. Intern. Med. 2018, 32, 1787–1792. [Google Scholar] [CrossRef] [PubMed]
- Noffsinger, T.; Brattain, K.; Quakenbush, G.; Taylor, G. Field results from Whisper® stethoscope studies. Anim. Health Res. Rev. 2014, 15, 142–144. [Google Scholar] [CrossRef] [PubMed]
- Mang, A.V.; Buczinski, S.; Booker, C.W.; Timsit, E. Evaluation of a Computer-aided Lung Auscultation System for Diagnosis of Bovine Respiratory Disease in Feedlot Cattle. J. Vet. Intern. Med. 2015, 29, 1112–1116. [Google Scholar] [CrossRef]
- Pascual-Garrigos, A.; Maruthamuthu, M.K.; Ault, A.; Davidson, J.L.; Rudakov, G.; Pillai, D.; Koziol, J.; Schoonmaker, J.P.; Johnson, T.; Verma, M.S. On-farm colorimetric detection of Pasteurella multocida, Mannheimia haemolytica, and Histophilus somni in crude bovine nasal samples. Vet. Res. 2021, 52, 126–126. [Google Scholar] [CrossRef]
- Wilson, A.D. Developments of Recent Applications for Early Diagnosis of Diseases Using Electronic-Nose and Other VOC-Detection Devices. Sensors 2023, 23, 7885. [Google Scholar] [CrossRef]
- Kamal, F.; Kumar, S.; Edwards, M.R.; Veselkov, K.; Belluomo, I.; Kebadze, T.; Romano, A.; Trujillo-Torralbo, M.-B.; Shahridan Faiez, T.; Walton, R.; et al. Virus-induced Volatile Organic Compounds Are Detectable in Exhaled Breath during Pulmonary Infection. Am. J. Respir. Crit. Care Med. 2021, 204, 1075–1085. [Google Scholar] [CrossRef]
- Hurd, H.S.; Doores, S.; Hayes, D.; Mathew, A.; Maurer, J.; Silley, P.; Singer, R.S.; Jones, R.N. Public health consequences of macrolide use in food animals: a deterministic risk assessment. J. Food Prot. 2004, 67, 980–992. [Google Scholar] [CrossRef]
- Magnano, M.C.; Ahmed, W.; Wang, R.; Bergant Marušič, M.; Fowler, S.J.; White, I.R. Exhaled volatile organic compounds and respiratory disease: Recent progress and future outlook. TrAC, Trends Anal. Chem. 2024, 176, 117739. [Google Scholar] [CrossRef]
- Kuchmenko, T.; Shuba, A.; Umarkhanov, R.; Chernitskiy, A. Portable Electronic Nose for Analyzing the Smell of Nasal Secretions in Calves: Toward Noninvasive Diagnosis of Infectious Bronchopneumonia. Vet. Sci. 2021, 8, 74. [Google Scholar] [CrossRef]
- Cho, Y.S.; Jung, S.C.; Oh, S. Diagnosis of bovine tuberculosis using a metal oxide-based electronic nose. Lett. Appl. Microbiol. 2015, 60, 513–516. [Google Scholar] [CrossRef] [PubMed]
- Fend, R.; Geddes, R.; Lesellier, S.; Vordermeier, H.M.; Corner, L.A.L.; Gormley, E.; Costello, E.; Hewinson, R.G.; Marlin, D.J.; Woodman, A.C.; et al. Use of an Electronic Nose To Diagnose Mycobacterium bovis Infection in Badgers and Cattle. J. Clin. Microbiol. 2005, 43, 1745–1751. [Google Scholar] [CrossRef] [PubMed]
- Knobloch, H.; Schroedl, W.; Turner, C.; Chambers, M.; Reinhold, P. Electronic nose responses and acute phase proteins correlate in blood using a bovine model of respiratory infection. Sens. Actuators. B, Chem. 2010, 144, 81–87. [Google Scholar] [CrossRef]
- Fajt, V.R.; Apley, M.D.; Roth, J.A.; Frank, D.E.; Brogden, K.A.; Skogerboe, T.L.; Shostrom, V.K.; Chin, Y.L. The effects of danofloxacin and tilmicosin on neutrophil function and lung consolidation in beef heifer calves with induced Pasteurella (Mannheimia) haemolytica pneumonia. J. Vet. Pharmacol. Ther. 2003, 26, 173–179. [Google Scholar] [CrossRef]
- Schelkopf, C.S.; Apley, M.D.; Lubbers, B.V. Comparison of electronic nose and conventional cow-side diagnostic tools for detection of ketosis in early lactation dairy cows. Bovine Pract. 2023, 57, 5–15. [Google Scholar] [CrossRef]
- Kamel, M.S.; Davidson, J.L.; Verma, M.S. Strategies for Bovine Respiratory Disease (BRD) Diagnosis and Prognosis: A Comprehensive Overview. Animals 2024, 14, 627. [Google Scholar] [CrossRef]
- Bell, D.J.; Duthie, C.A.; Mason, C.S.; Hancock, A.; Penny, C.; Odeyemi, I.; Bartram, D.J.; Haskell, M.J. Developing a tool to assess the health-related quality of life in calves with respiratory disease: tool refinement and construct validity testing. Animal 2024, 18, 101215. [Google Scholar] [CrossRef]
- Martin, M.; Kleinhenz, Michael D. ; Montgomery, Shawnee R.; Blasi, Dale A.; Almes, Kelli M.; Baysinger, A.K.; Coetzee, Johann F. Assessment of diagnostic accuracy of biomarkers to assess lung consolidation in calves with induced bacterial pneumonia using receiver operating characteristic curves. J. Anim. Sci. 2022, 100. [Google Scholar] [CrossRef]
- Haddadi, S.; Koziel, J.A.; Engelken, T.J. Analytical approaches for detection of breath VOC biomarkers of cattle diseases -A review. Anal. Chim. Acta 2022, 1206, 339565–339565. [Google Scholar] [CrossRef] [PubMed]
- Maurer, D.; Koziel, J.; Engelken, T.; Cooper, V.; Funk, J. Detection of Volatile Compounds Emitted from Nasal Secretions and Serum: Towards Non-Invasive Identification of Diseased Cattle Biomarkers. Separations 2018, 5, 18. [Google Scholar] [CrossRef]
Figure 1.
Expired air collection apparatus consisting of a non-rebreathing T-piece connected to a large canine anesthetic induction mask and a 3.79 L mylar food storage bag.
Figure 1.
Expired air collection apparatus consisting of a non-rebreathing T-piece connected to a large canine anesthetic induction mask and a 3.79 L mylar food storage bag.
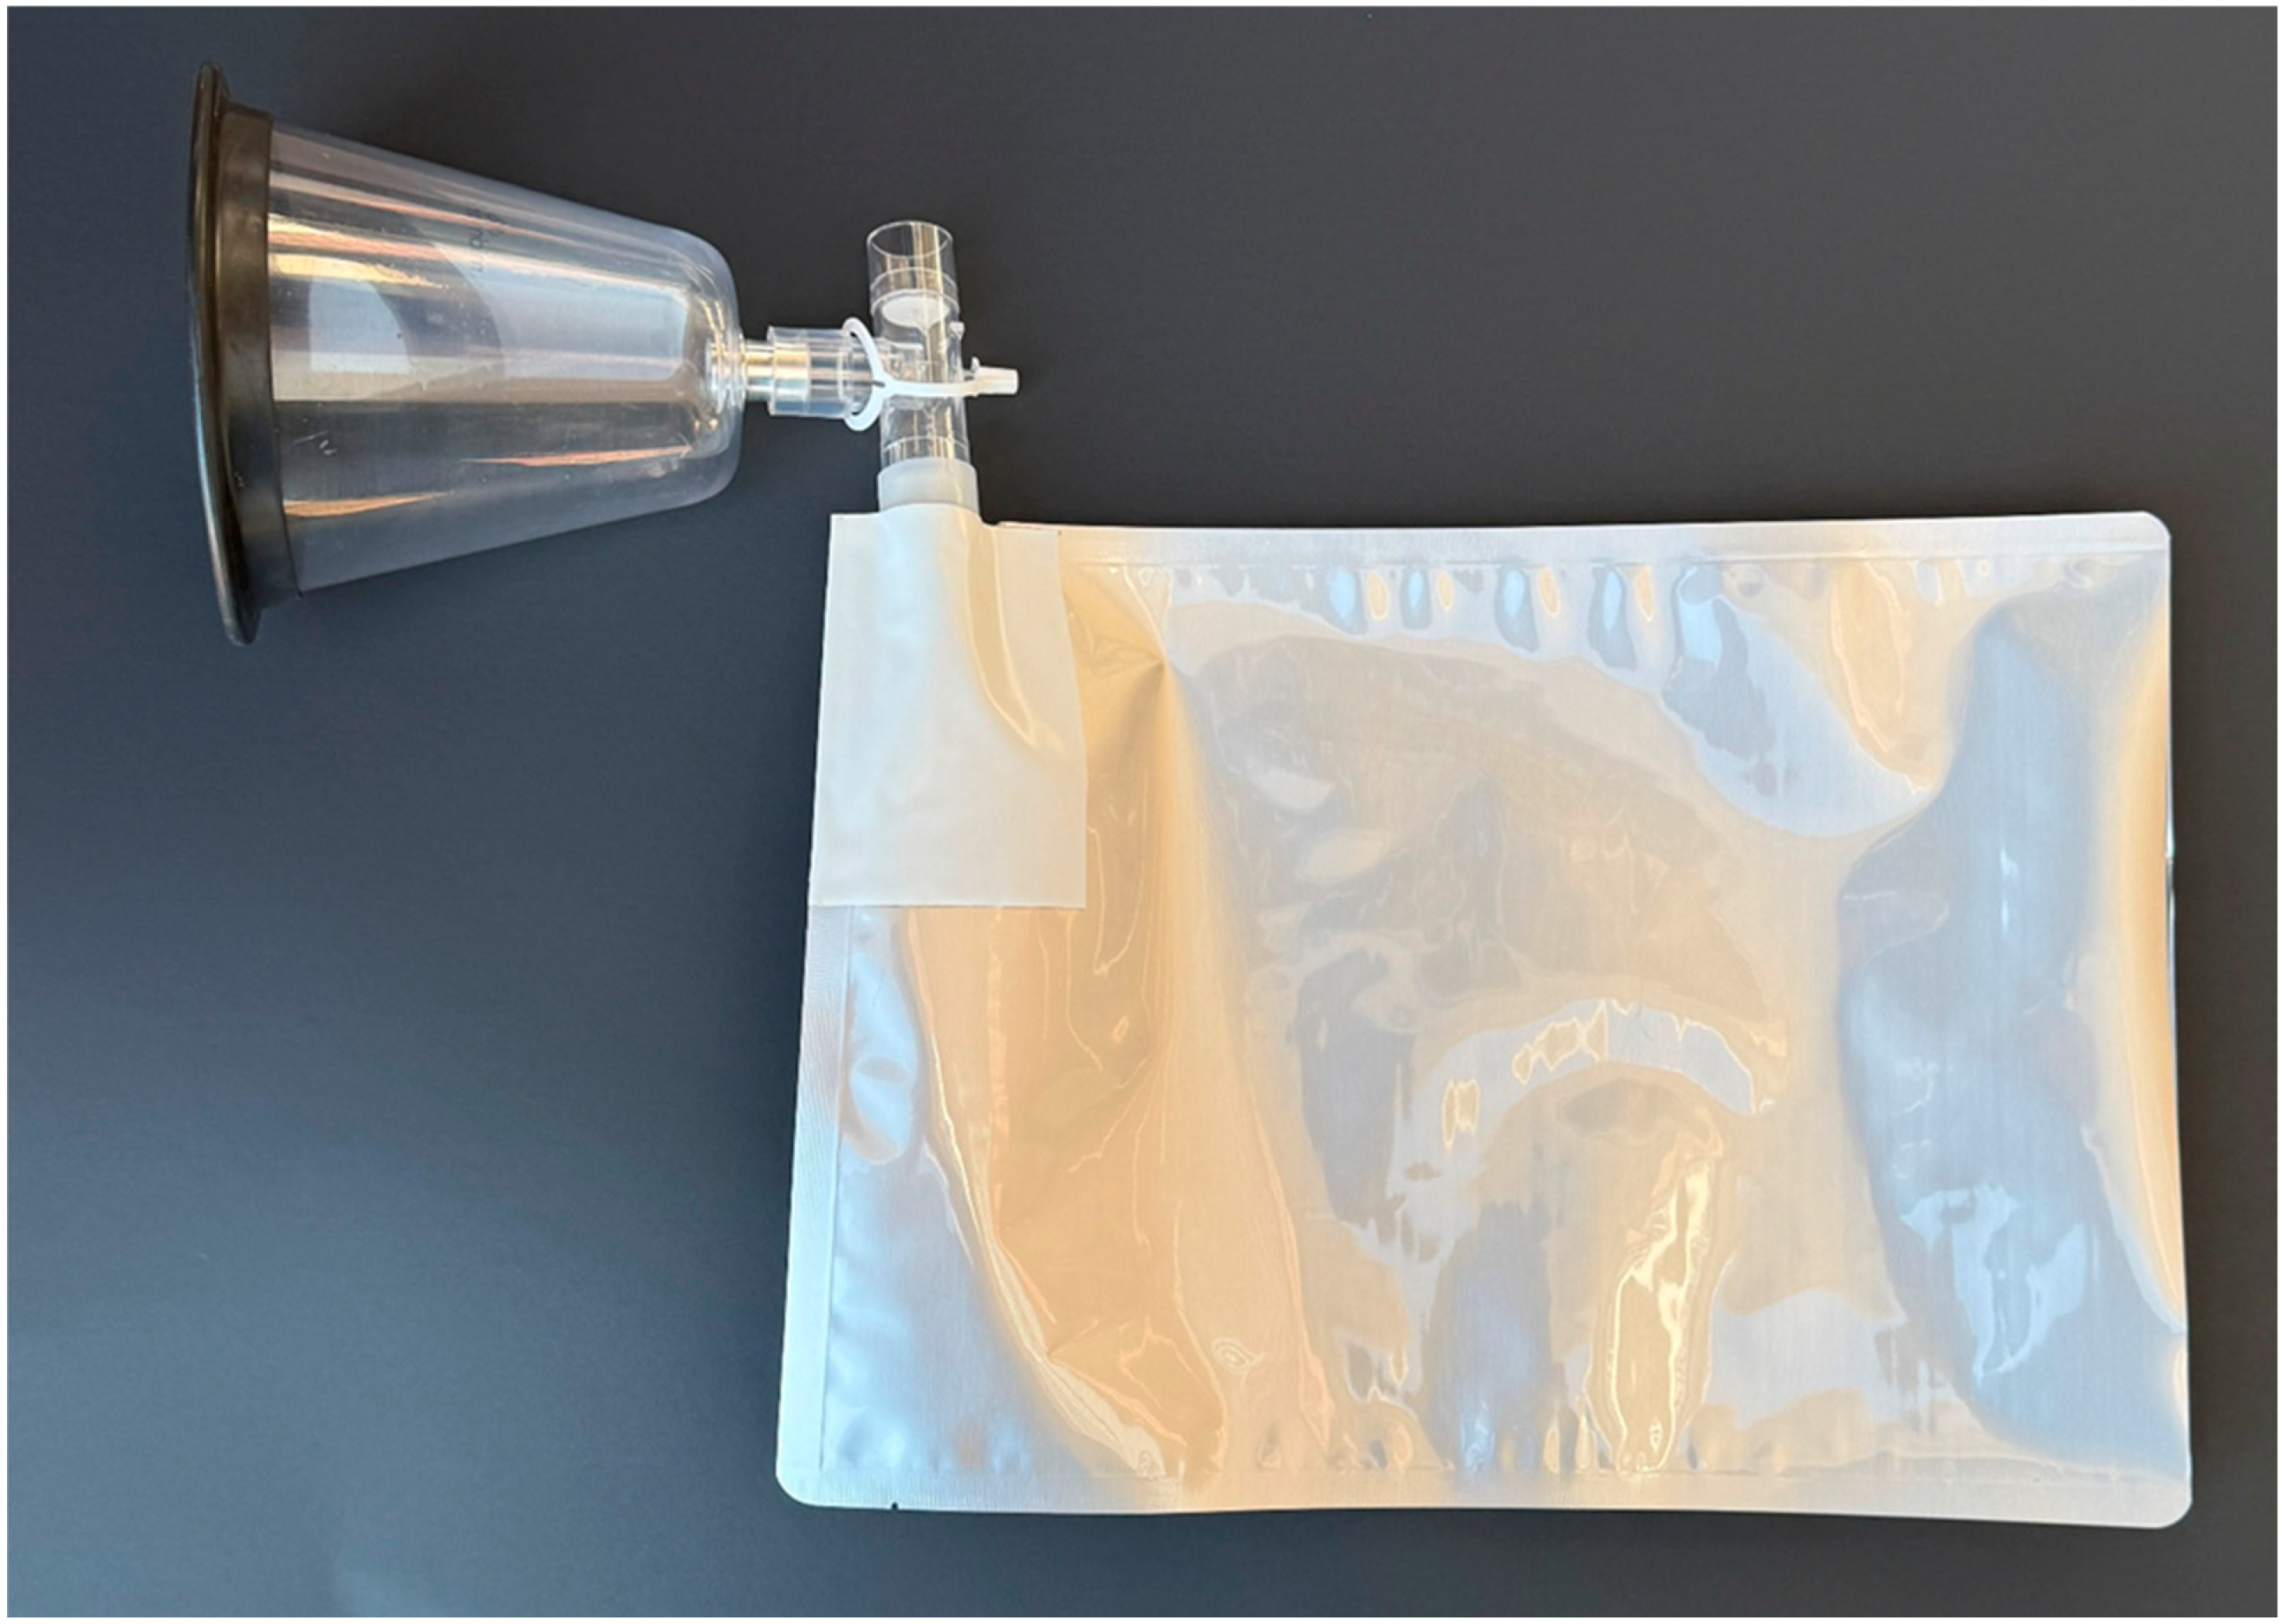
Figure 2.
Nasal swab collection system with lid uncapped from blood collection tube storing a nasal swab. A 16 G x 1.5” aluminum hub needle attached to an IV extension set and an 18 G x 3.5” spinal needle are penetrated through the rubber cap of the tube.
Figure 2.
Nasal swab collection system with lid uncapped from blood collection tube storing a nasal swab. A 16 G x 1.5” aluminum hub needle attached to an IV extension set and an 18 G x 3.5” spinal needle are penetrated through the rubber cap of the tube.
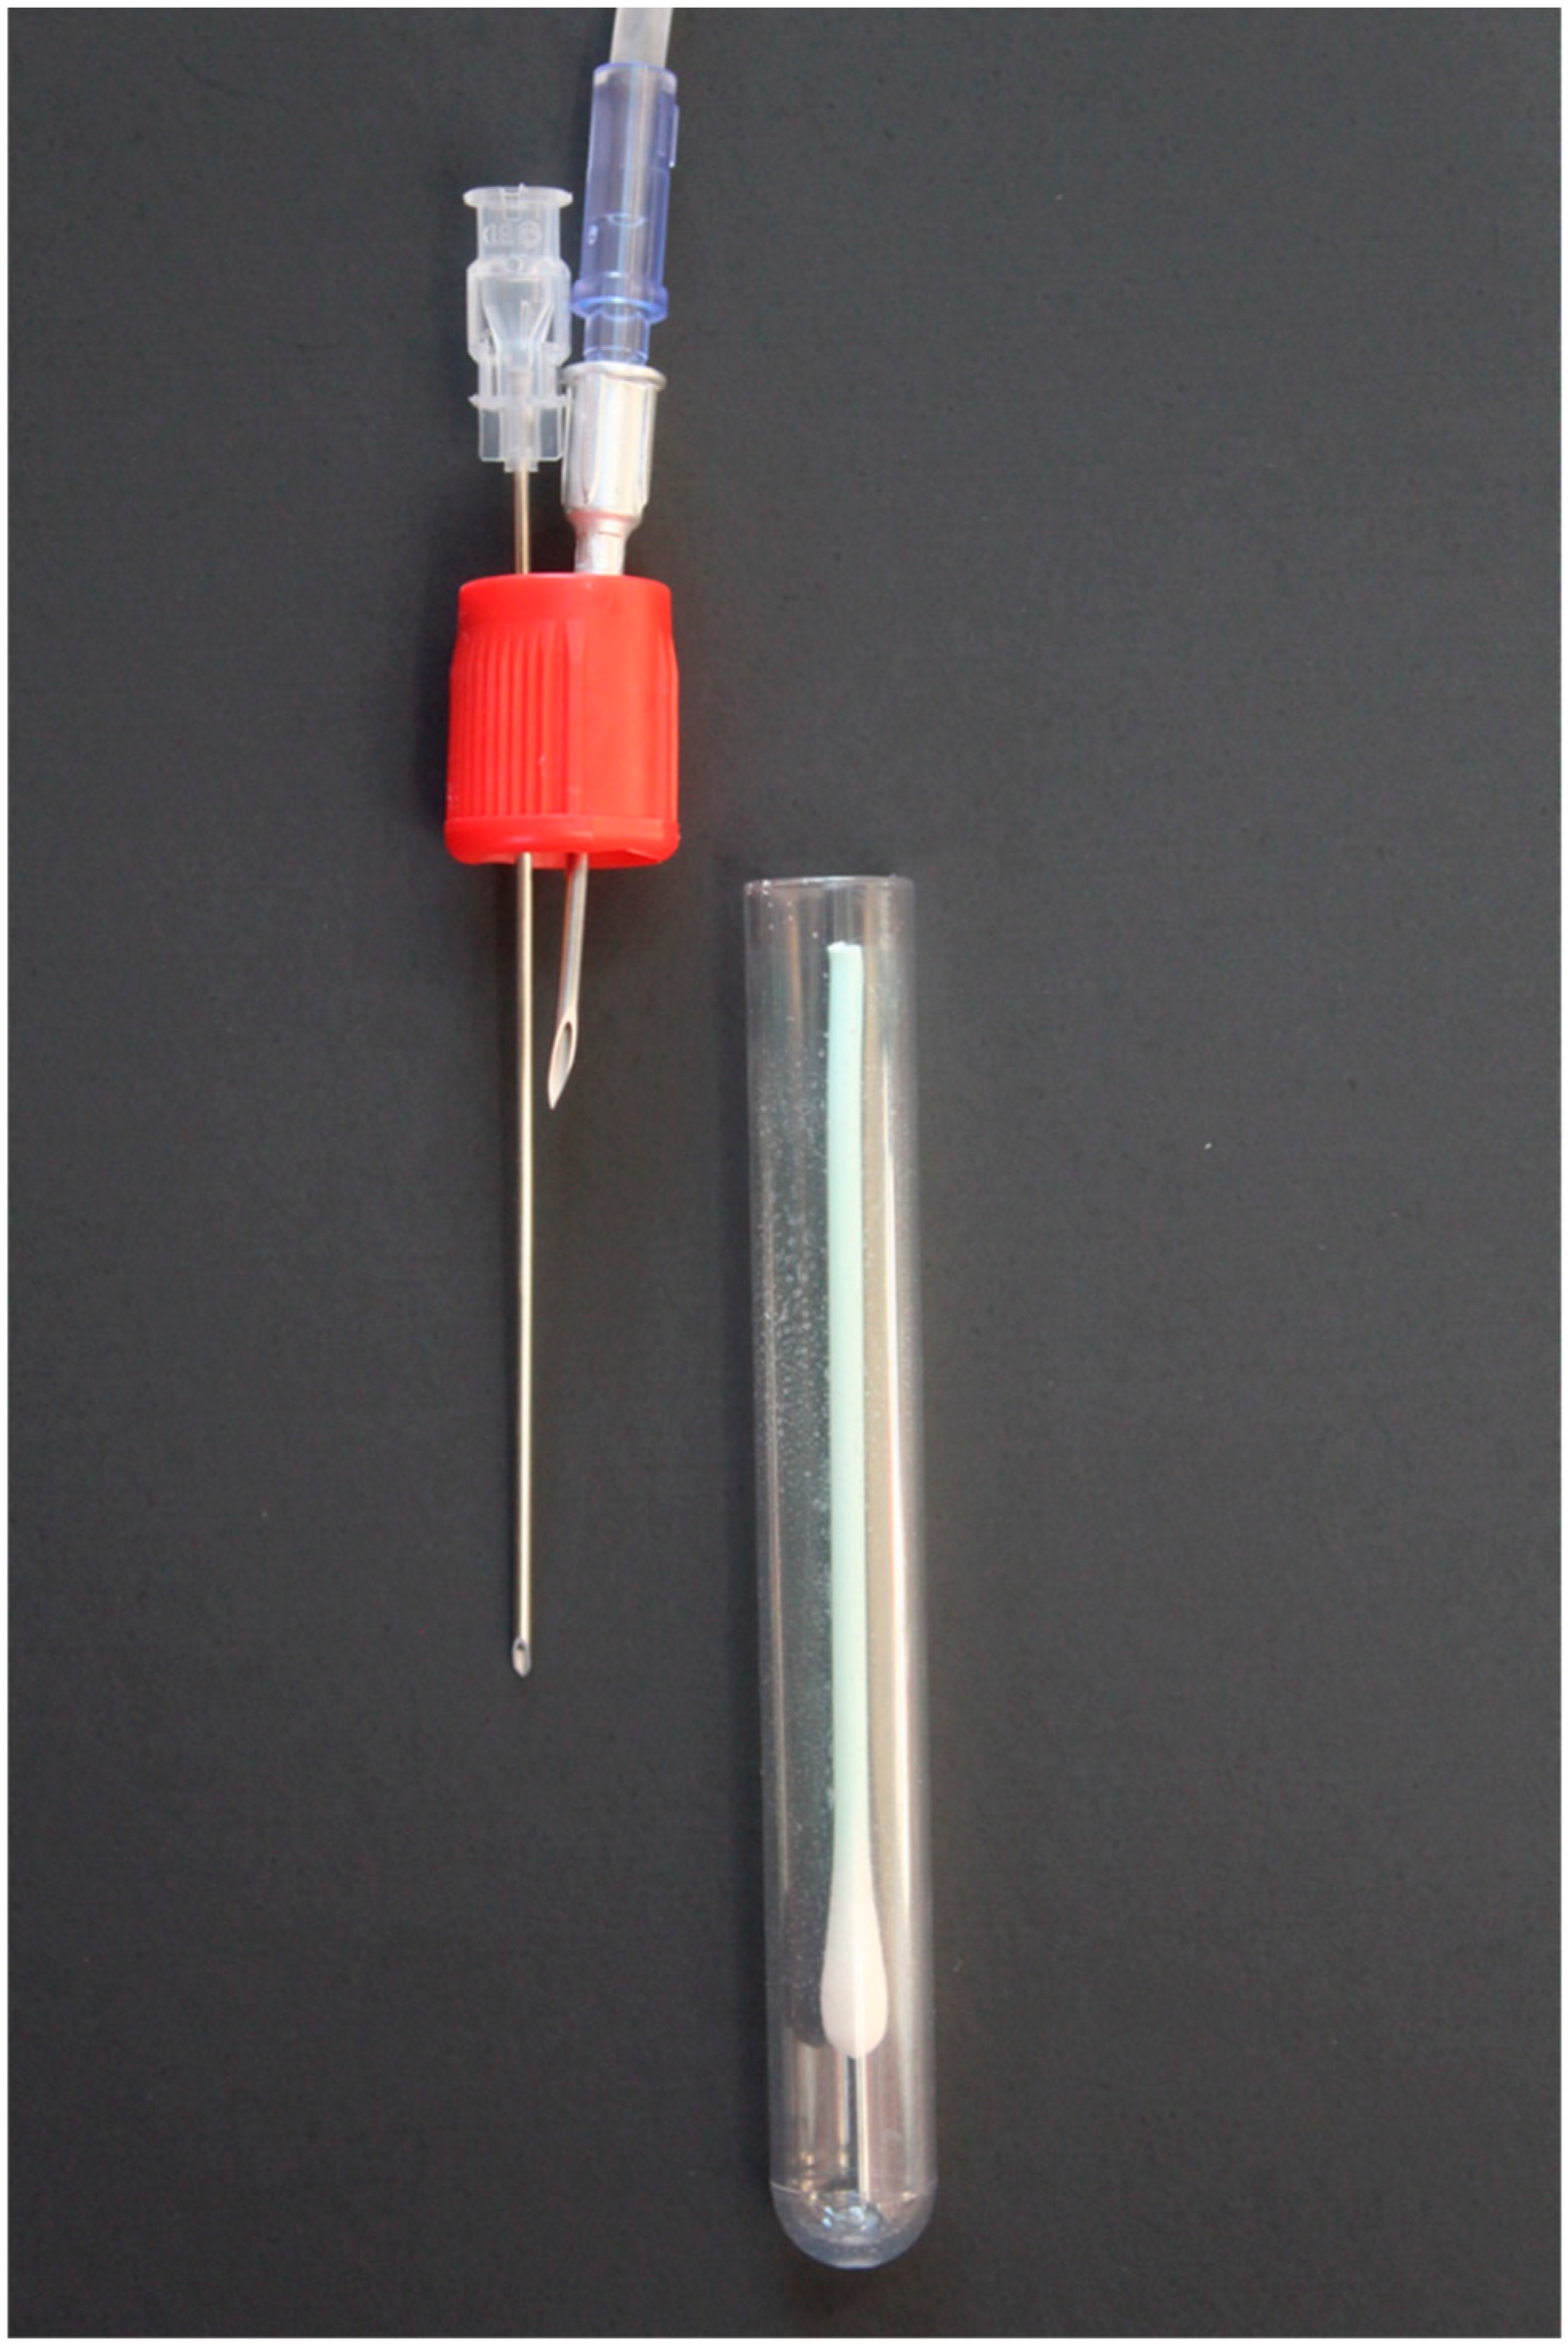
Figure 3.
Tile map identifying individual animal expired air sample classification by the Cyranose® 320 eNose and identification of samples used in the training set by study day.
Figure 3.
Tile map identifying individual animal expired air sample classification by the Cyranose® 320 eNose and identification of samples used in the training set by study day.
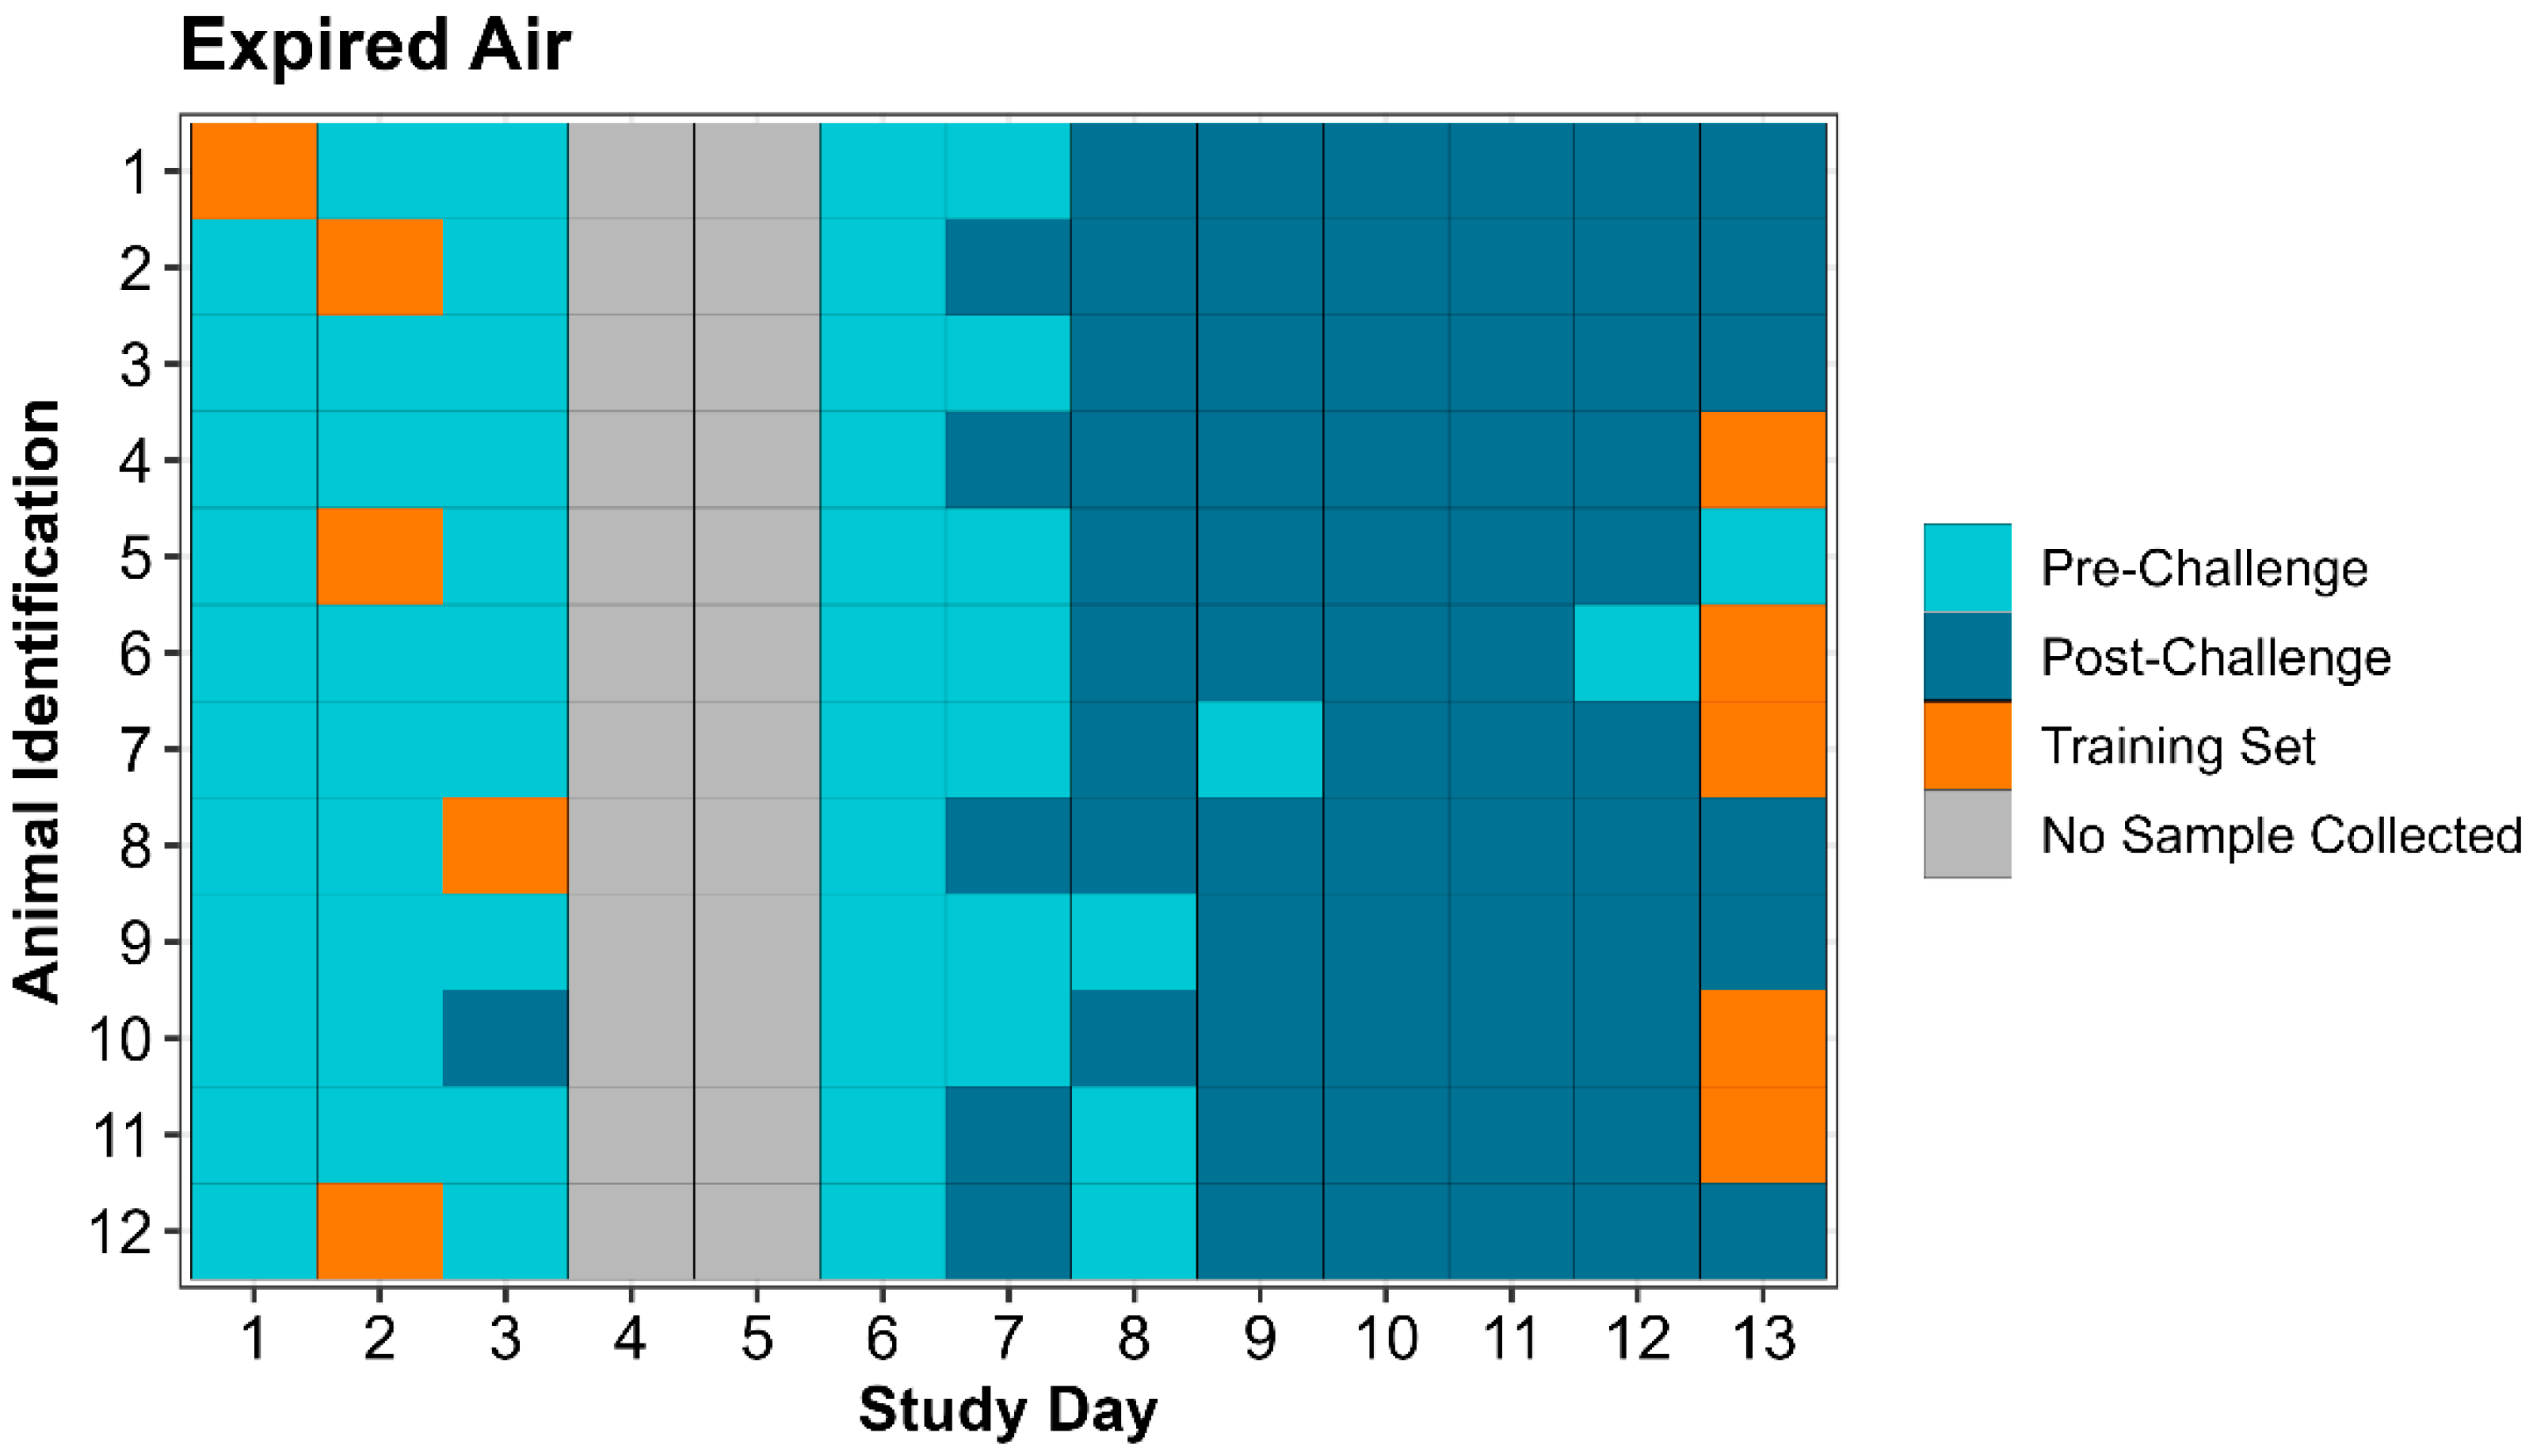
Figure 4.
Tile map identifying individual animal nasal swab sample classification by the Cyranose® 320 eNose and identification of samples used in the training set by study day.
Figure 4.
Tile map identifying individual animal nasal swab sample classification by the Cyranose® 320 eNose and identification of samples used in the training set by study day.
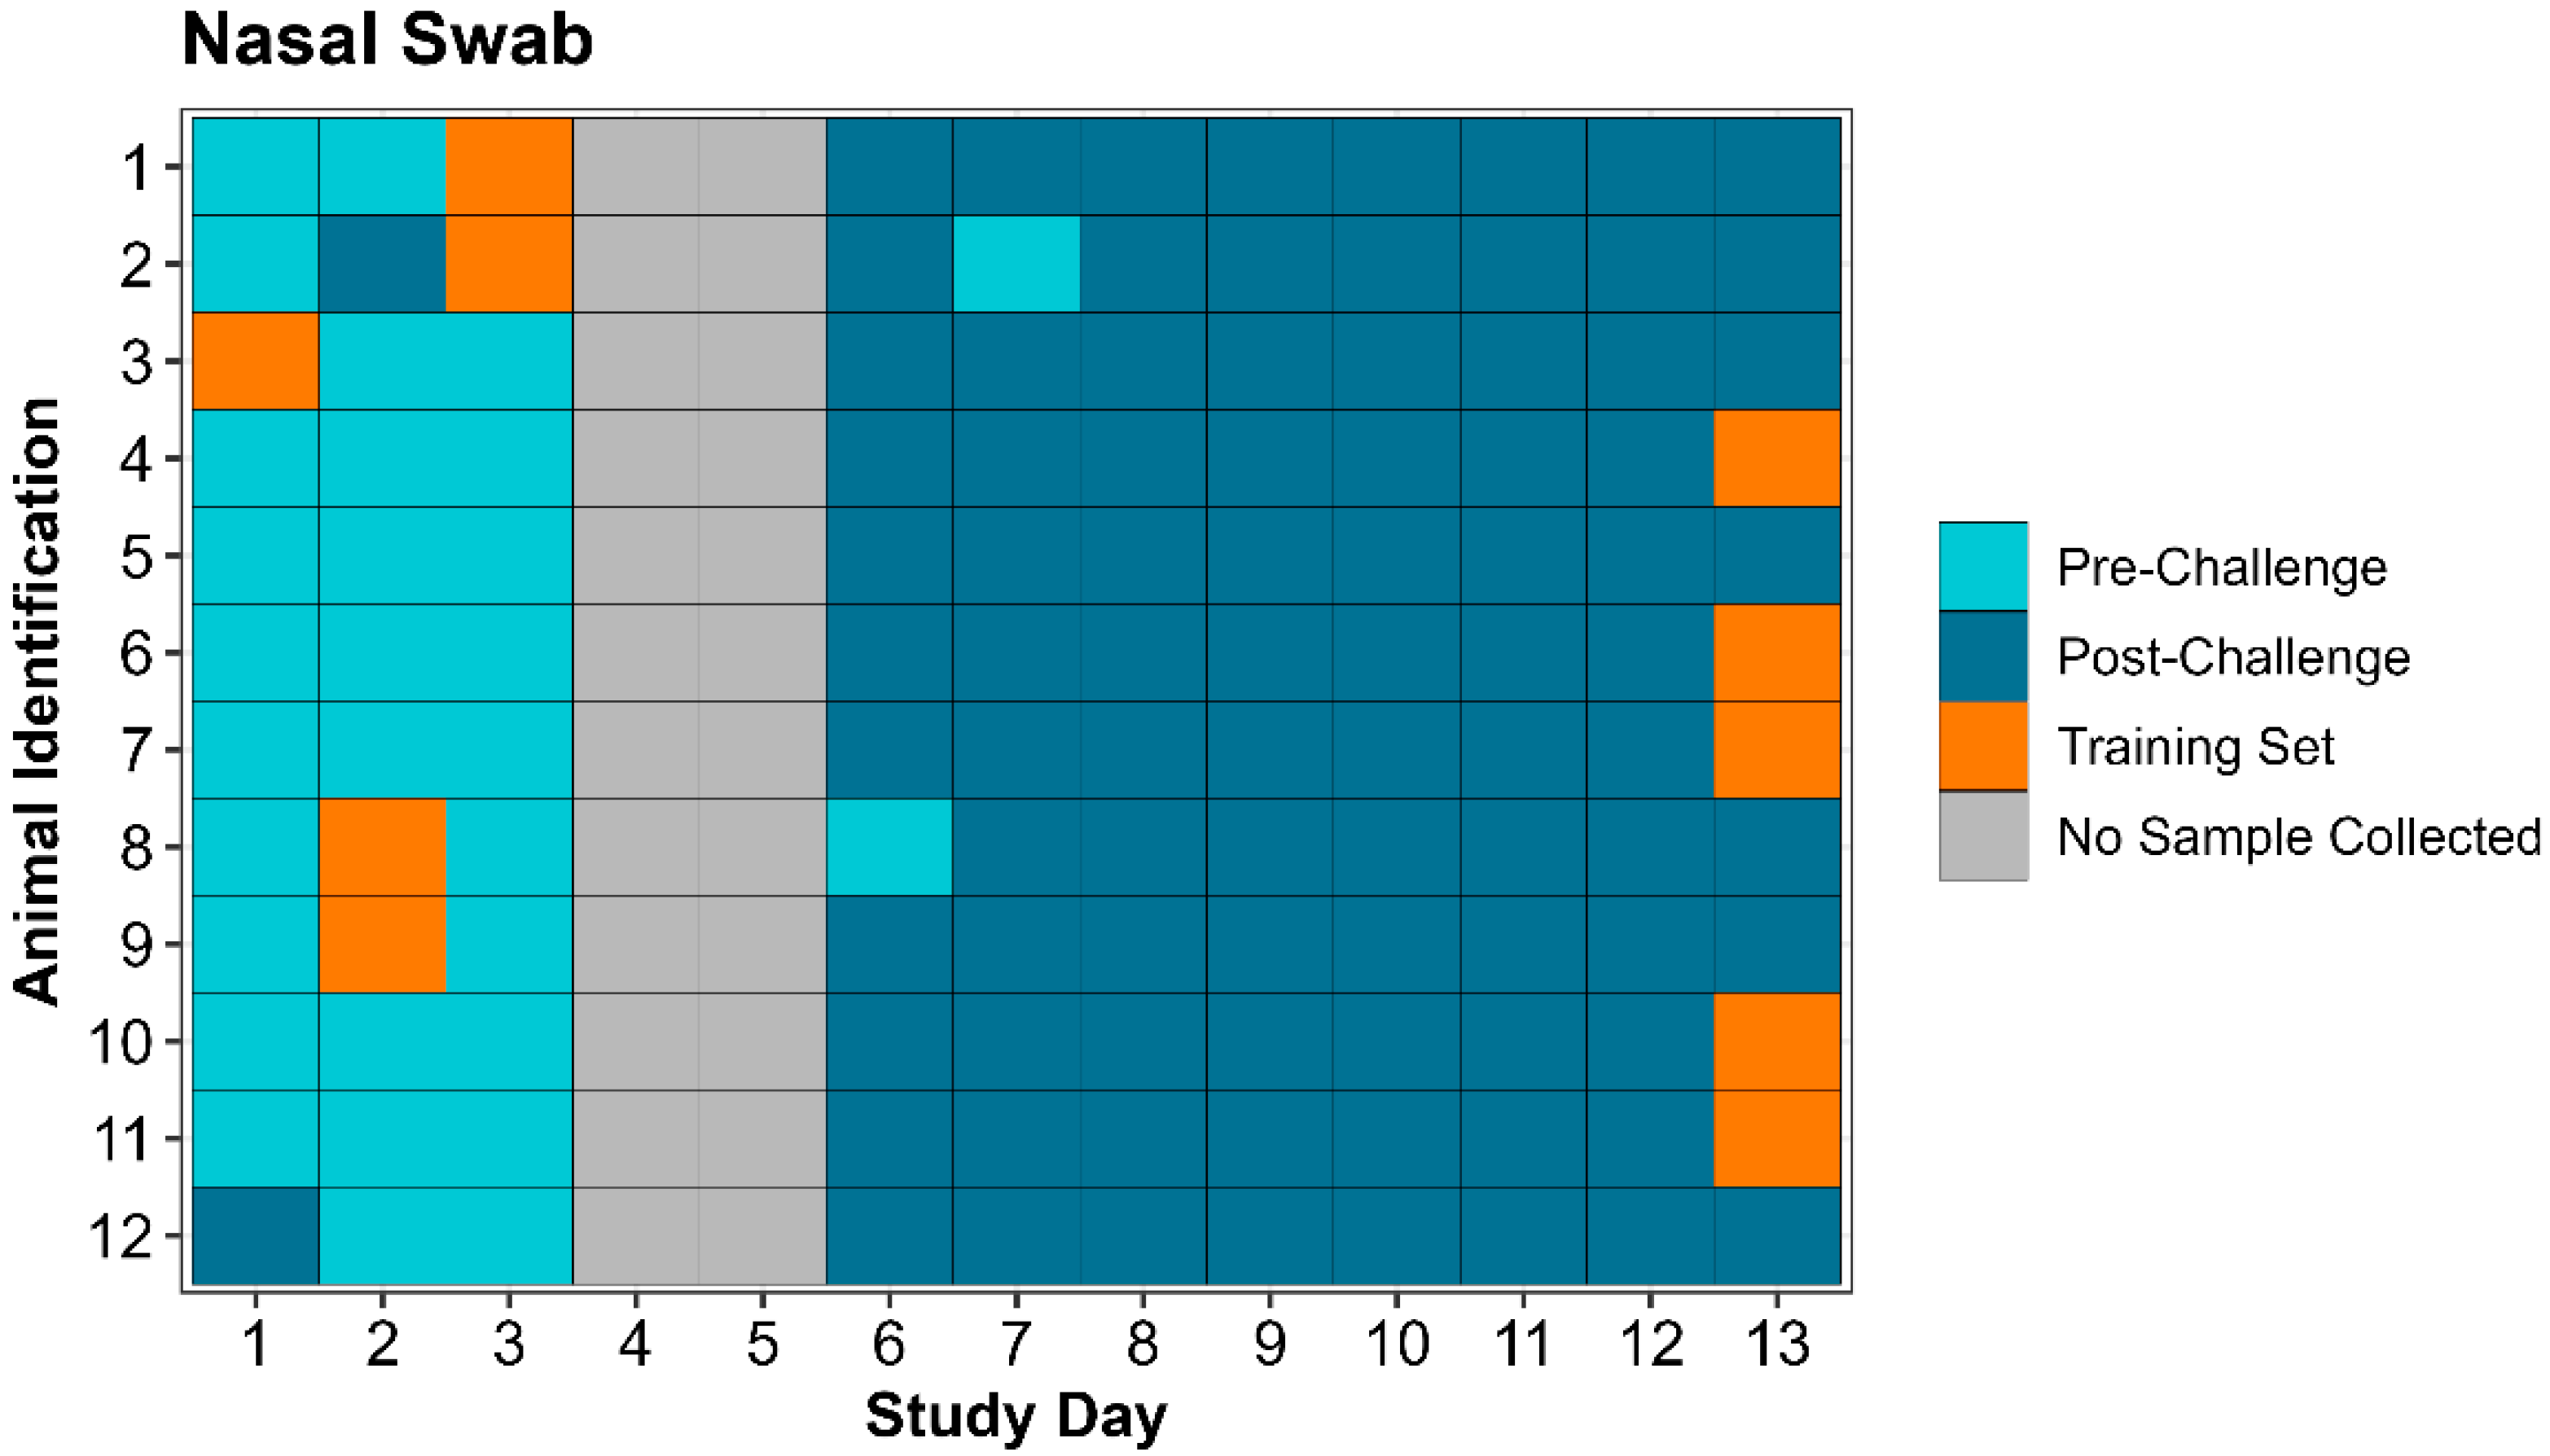
Figure 5.
Model estimated mean probability of agreement between Cyranose® 320 eNose and actual animal status by sample type and study day. Error bars represent standard error (SE) of probability of agreement.
Figure 5.
Model estimated mean probability of agreement between Cyranose® 320 eNose and actual animal status by sample type and study day. Error bars represent standard error (SE) of probability of agreement.
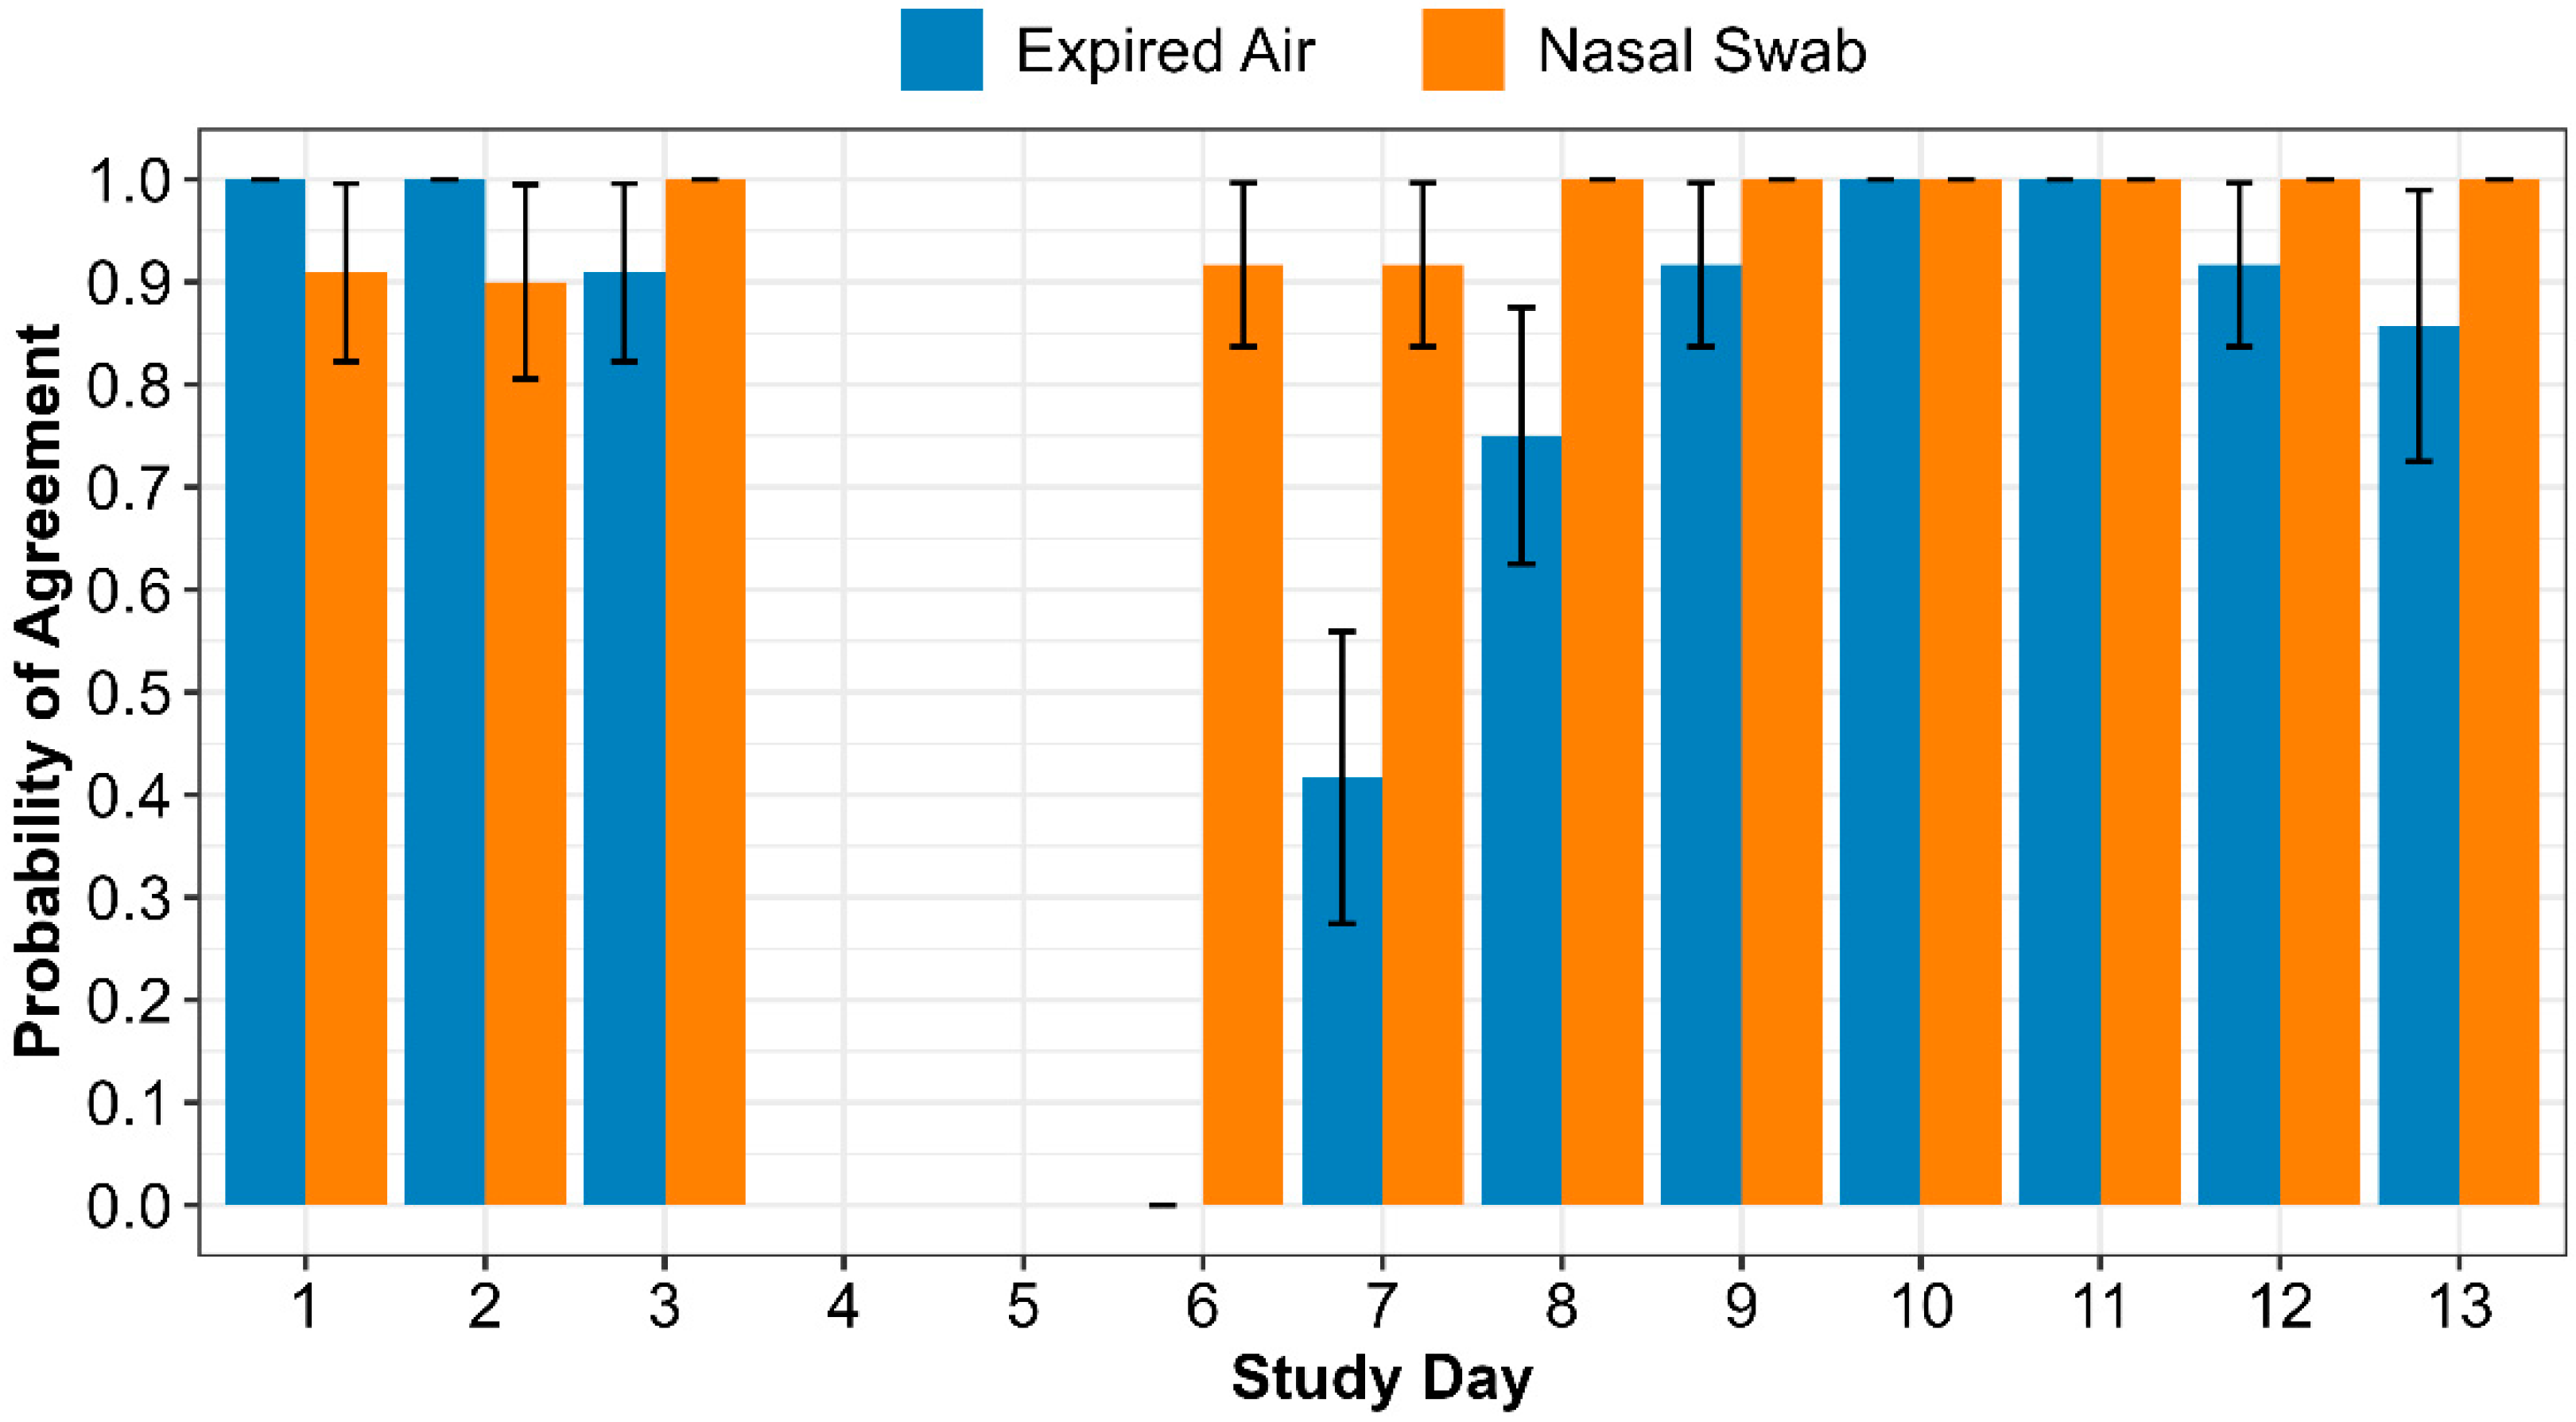

Table 1.
Study timeline of respiratory sample collection and bovine respiratory disease (BRD) challenge by study day. “X” represents all 12 animals enrolled in the study underwent the associated activity on the designated study day.
Table 1.
Study timeline of respiratory sample collection and bovine respiratory disease (BRD) challenge by study day. “X” represents all 12 animals enrolled in the study underwent the associated activity on the designated study day.
| Expired Air Collection | X | X | X | X | X | X | X | X | X | X | X | ||
| Nasal Swab Collection | X | X | X | X | X | X | X | X | X | X | X | ||
| Bovine herpes virus 1 (BHV-1) Challenge | X 1 | ||||||||||||
| Mannheimmia haemolytica Challenge | X | ||||||||||||
| 1 | 2 | 3 | 4 | 5 | 6 | 7 | 8 | 9 | 10 | 11 | 12 | 13 | |
| Study Day | |||||||||||||
1 BHV-1 challenge was administered following respiratory sample collection on study day 3.
Table 2.
Cyranose 320® eNose instrument settings for analysis of expired air samples as displayed in the PCnose™ software provided with the device.
Table 2.
Cyranose 320® eNose instrument settings for analysis of expired air samples as displayed in the PCnose™ software provided with the device.
| Class assignment | Class name | Training samples |
|---|---|---|
| Class 1 | Pre-Challenge | 5 |
| Class 2 | Post-Challenge | 5 |
| Flow operations | Time (seconds) | Pump speed (cm3/minute) |
| Baseline purge | 10 | High (180) |
| Sample draw 1 | 60 | High (180) |
| 1st air intake purge | 10 | High (180) |
| 2nd sample gas purge | 180 | High (180) |
| Data analysis configuration settings | ||
| Algorithm: | Canonical Discriminant Analysis (CDA) | |
| Preprocessing: | Auto-scaling | |
| Normalization: | Normalization 1 | |
| Identification quality: | Always choose | |
Table 3.
Cyranose 320® eNose instrument settings for analysis of nasal swab samples as displayed in the PCnose™ software provided with the device.
Table 3.
Cyranose 320® eNose instrument settings for analysis of nasal swab samples as displayed in the PCnose™ software provided with the device.
| Class assignment | Class name | Training samples |
|---|---|---|
| Class 1 | Pre-Challenge | 5 |
| Class 2 | Post-Challenge | 5 |
| Flow operations | Time (seconds) | Pump speed (cm3/minute) |
| Baseline purge | 10 | Medium (120) |
| Sample draw 1 | 30 | Medium (120) |
| 1st air intake purge | 10 | High (180) |
| 2nd sample gas purge | 90 | High (180) |
| Data analysis configuration settings | ||
| Algorithm: | Canonical Discriminant Analysis (CDA) | |
| Preprocessing: | Auto-scaling | |
| Normalization: | Normalization 1 | |
| Identification quality: | Always choose | |
Table 4.
Individual calf lung consolidation score at necropsy.
| Animal ID | Total Lung Consolidation |
|---|---|
| 1 | 11.61% |
| 2 | 2.39% |
| 3 | 12.09% |
| 4 1 | 22.50% |
| 5 | 9.18% |
| 6 1 | 24.65% |
| 7 1 | 17.85% |
| 8 | 11.10% |
| 9 | 8.85% |
| 10 1 | 12.30% |
| 11 1 | 14.79% |
| 12 | 10.72% |
1 Day 13 respiratory samples collected from these animals were used to create the “Post-Challenge” training set class for expired air and nasal swab on the eNose.
Table 5.
Correctly identified expired air and nasal swab samples by the Cyranose® 320 eNose pre- and post-induced BRD challenge.
Table 5.
Correctly identified expired air and nasal swab samples by the Cyranose® 320 eNose pre- and post-induced BRD challenge.
| Sample Type | Pre-Challenge (Day 1-3) No. Correct/No. Tested (%) |
Post-Challenge (Day 6-13) No. Correct/No. Tested (%) |
|---|---|---|
| Expired Air | 30/31 (96.8%) | 66/91 (72.5%) |
| Nasal Swab | 29/31 (93.5%) | 89/91 (97.8%) |
Disclaimer/Publisher’s Note: The statements, opinions and data contained in all publications are solely those of the individual author(s) and contributor(s) and not of MDPI and/or the editor(s). MDPI and/or the editor(s) disclaim responsibility for any injury to people or property resulting from any ideas, methods, instructions or products referred to in the content. |
© 2025 by the authors. Licensee MDPI, Basel, Switzerland. This article is an open access article distributed under the terms and conditions of the Creative Commons Attribution (CC BY) license (http://creativecommons.org/licenses/by/4.0/).
Copyright: This open access article is published under a Creative Commons CC BY 4.0 license, which permit the free download, distribution, and reuse, provided that the author and preprint are cited in any reuse.


