
Submitted:
01 November 2025
Posted:
03 November 2025
You are already at the latest version
Abstract
A key insight of evolutionary genetics is that the evolvability of a population depends crucially on the amount and distribution of heritable phenotypic variation across traits. Because this insight focuses on segregating variation, the traits that don't vary among individuals but differ among higher taxa are ignored. Slowly evolving traits, like body plan organization and homologa, are nevertheless essential, because they set the boundary conditions within which variation segregates. Therefore, understanding long-term evolutionary change requires understanding the principles that control variation in varying AND conserved traits, in addition to understanding how drift and selection influence population variation. In this perspective, I propose that this understanding is attainable if we acknowledge that different processes mapping sequence variation to phenotypic variation have different capacities to produce variation and evolve. I suggest decomposing the GP map according to types of processes with different variational properties. For vertebrates, these are: morphogenesis, growth and maintenance. This perspective allows us to focus on how these processes interact under the influence of natural selection and delineate the conditions leading to different patterns of evolutionary change.
Keywords:
evolvability
; pattern of variation
; variability
; growth
1. Introduction
“Quantitative-genetic models may become more informative and predictive if variation in their parameters can be explained by developmental and other biological processes that have been shaped by the previous history of the population.” Bruce Riska, 1989, Evolution
Evolutionary biology aims at explaining the origins of biological diversity across the living world. The biology of differences within and between closely related species are well accounted for by our population genetic understanding. In contrast, explaining how fixed traits that differ only among higher taxa had been established by the same population genetic principles, and how they are maintained over long time spans, appears out of reach of current theory. In this perspective, I will show that considering the variational basis of these evolved, but not presently varying traits, is not only relevant but in fact illuminating, because they crucially influence the variation that is segregating in populations.
Differing rates of evolutionary change between traits have not gone unnoticed (Simpson 1944, Riedl 1978, Alberch 1986). The proposed explanations can be grouped into those prioritizing stabilizing selection and those prioritizing variational constraints, i.e., the potential for variation determined by developmental factors. For example, differences in the strength of selection were invoked to explain observed differences in heritability between morphological and life-history traits (Roff and Mousseau1987, Roff 1997). In contrast, Steve Stearns prioritized different degrees of canalization, so that mutational effects on the life history traits are more canalized than those on morphological traits (Stearns 1994). Absence of population variation, such as is typical of body plan traits, is excluded from consideration in population genetic theory. However, it may also be seen as an extreme case on a continuum of degrees of variation. Variational explanations, rather than constraints, have been proposed for such traits, based on the idea of canalization (Waddington 1942, see Loison 2025) or internal selection (Wagner and Schwenk 2000, Galis 2006).
Substantial efforts have been invested in understanding the consequences of both the patterns of selection as well as the patterns of variation and variability (Wagner and Altenberg 1996; Wagner et al. 1997, Hallgrímsson and Hall 2005; Hendrikse et al. 2007; Hansen et al. 2023). In particular, using models of genotype-phenotype maps in the context of univariate or multivariate selection response (Lande 1979) led to explicit ideas about how, in principle, the structure of GP map can affect the variational and therefore evolutionary outcomes (Wagner 1989, Schuster 1994,Wagner and Altenberg 1996, Hansen 2006). The organismal concepts of pleiotropic constraint and canalization could thus be intersected with population-genetic theory. This led to many insights about the potential effects of development and physiology on evolutionary outcomes- for example, that modular pleiotropy may underpin the variational decoupling of traits thus reducing the variational constraints between them, while preserving their function (Wagner and Altenberg 1996, Orr 2000, Pavlicev and Hansen 2011). Another example is that specific patterns of interdependency between gene effects (epistasis) can substantially diminish or increase the additive genetic variance available for selection response (Cheverud and Routman 1995, 1996; Carter et al. 2005).These patterns of pleiotropy and epistasis have indeed been found in a wide range of organisms and traits suggesting their potential role in selection response (Le Rouzic et al. 2024, Bourg et al. 2024).
The broad agreement that patterns of variation can be substantially influenced by the organization of developmental and physiological processes prompted several investigators to ask what kinds of variation patterns are expected to arise from specific processes (Gjuvsland et al. 2007; Gjuvsland et al. 2013; Green 2017; Milocco and Salazar-Ciudad 2020; Pavlicev et al. 2023). An overall observation of these studies is a high degree of nonlinearity, implying that relying on additive genetic variation as a first approximation in inferring evolutionary change, as is common in population genetic models, may lead to inaccurate predictions, even already in the short term (Milocco and Salzaar 2020).
However, recent large-scale studies show that patterns of genetic variation persist over substantial time spans and even predict phenotypic divergence among populations and species. Moreover, the patterns are consistent across mutational, environmental, and segregating variation (e.g., Holstad et al. 2025). This stability is contrary to what would be expected based on the ample nonlinearities apparent in most developmental and physiological processes, as argued above.
In this perspective, I argue that to understand long-term evolutionary change, the processes of development and physiology in which mutational variance arises should be seen in their populational context. While the nonlinearity of early developmental and physiological processes appears a given, we also need to ask what portion of segregating variation is indeed due to these processes. We must ask, i) which processes really are involved in generating most of the observed heritable variation, ii) how these specific processes are structured, and iii) is there interdependency between variable and less variable processes?
I propose that such an understanding of the logic of evolution is attainable at an appropriate level of abstraction. Central to my argument are two observations. First is that different types of processes that constitute the GP map have inherently different capabilities to generate variation. The second is that the processes that generate most of the population variation do so in a direction that is determined by the process that generates the least, if any, population variation, namely the embryonic development of the body plan. The latter processes are invisible in the common population genetic approach but set the boundary conditions and account for the stability of the variational pattern in mutational, phenotypic, and environmental variation. I thus suggest decomposing the GP map by the type of processes with different structural logic and variational properties. For vertebrates, I propose that these are morphogenesis, growth, and the core maintenance metabolism (Figure 1).
My emphasis on vertebrates stems from my familiarity with this group, but it should not detract from exploring similar principles across other areas of the tree of life. For other groups, experts in specific taxa must refine the details. Given differing physiology and development, the dominant processes are likely to be of a different nature. However, I believe the overarching concept of their existence and their ability to provide an appropriate level of abstraction to explain broad variation patterns beyond individual species will be transferable.
I use GP map here to refer to the entirety of developmental and physiological processes involved in translating genetic sequence into the phenotype, regardless of whether variation is segregating.
- Not a Unitary Map: Decomposing the GP Map by the Process Type
Trait variation arises through mapping sequence changes via developmental and physiological processes, where early stages set patterns that later stages may strengthen or modify (Hallgrímsson et al. 2009). The inherent complexity of this map across spatial organization and developmental time can seem overwhelming. While systems biology has enabled detailed exploration of these processes, it is uncertain whether this level of granularity is essential for this question or is instead distracting. I suggest that what matters more is understanding the structural logic of these processes, which then can be tied to the well-founded population-level principles of evolutionary theory.
When relying on abstract summary statistics such as the variance-covariance matrix of traits to represent the variational and thus also organismal structure, we implicitly assume that the underlying mapping of variation follows some unitary structural logic, with all underlying processes contributing to the outcome. Yet this assumption is inconsistent with what we know about the logic of different developmental and physiological processes. Rather, the underlying processes can be categorized in a small number of GP sub-map types, which generate very distinct variational patterns, and can therefore be expected to have distinct evolutionary consequences. The variability of traits arises from combining the variabilities contributed by these processes. Given that these GP maps also draw on, at least in part, non-overlapping genomic regions, it is therefore useful to address them separately. In the following, I argue for three such distinct process types: morphogenetic patterning, growth, and the core maintenance metabolism. In the following, I explain their propensities to generate variation, and how they may consequently respond to selection.
- a. GP Maps of Morphogenetic Patterning Processes
Early developmental morphogenetic processes lay out the overall as well as local animal body plan and are thus of consequence in determining the dimensionality of an organism’s variability, i.e., how many parts in a body can vary. For successful mutual inductions of developmental regions during the morphogenetic patterning process, a precise spatio-temporal arrangement of cell populations is crucially important. This process thus involves a high degree of interactivity between developing cell populations. The genotype-phenotype mapping of this process can thus be characterized as non-modular (or a unimodular), with a very high degree of integration and non-linearity. High integration means that mutations in any gene (or gene-regulatory region) that is active at this time have a high likelihood to affect many topological regions of the embryo and thus manifest a high degree of pleiotropy (as proposed previously: Sander 1983; Raff 1996; Galis 2023). Epistasis is likely also involved, but less is known about its pattern. Nevertheless, the interdependencies in setting up the body plan during morphogenesis result in effects in many of the dimensions that arise during this process. It is unlikely that such broad pleiotropic changes are advantageous or even viable, as exemplified by the high morbidity of fetuses when mutations affect the so-called phylotypic period of embryonic development. This is because the appropriate inductions between cell populations are the necessary preconditions for their downstream developmental transformations to occur in the first place, rather than serving to modify established organismal processes. In more technical terms, the effects of mutations at this stage do not just modify multiple established dimensions; they set up the dimensionality of the organism in the first place, and their disruption preempts the establishment of the organismal architecture.
The consequence of such GP map structure is that the advantageous, or even viable, mutational effects are unlikely, as the effects are high-dimensional, due to the overall structure of this process. The logic may be likened to Fisher’s geometric model, predicting ever-decreasing mutational sizes with increasing dimensionality of the mutational effects (Fisher 1930). This implies strong stabilizing selection, sufficient to explain a high level of conservation of these stages across large phylogenetic distances, and consequently also conservation of the genomic regions involved in these stages. A particularly well-supported example here is the conservation of cervical vertebrae in mammals (reviewed together with further examples in Galis 2023). The mutations affecting the number or shape (e.g., presence of ribs) of the cervical vertebrae in humans do arise in the phylotypic stage of development. However, from the human studies, we know that they are nearly invariably associated with abnormalities in a broad array of organ systems beyond the axial skeleton: cardiovascular, urogenital, or neural systems, and have a lethality of approximately 90% (Schut et al. 2016; Schut et al. 2020). Similar patterns are known in other well-studied species (for a review, see: Galis 2023). This work demonstrates that the system is not robust to mutational effects, but rather that the mutations have a high pleiotropy and a high lethality, resulting in high evolutionary conservation of the morphogenetic system.
Evolvability of the patterning process during morphogenesis is thus low due to the preponderance of deleterious mutational effects. Note, however, that the selection acting in this process stems primarily from the internal factors: the main cause of deleteriousness of mutations is that their effects are incompatible with the internal developmental context, not because they are incompatible with survival in a particular external environment. Deleteriousness of these unconditionally deleterious mutations will thus persist regardless of the environment, contributing to the strength of conservation. This phenomenon has been referred to as internal selection (Arthur 1997; Wagner and Schwenk 2000; Schwenk and Wagner 2001, overlapping with the notion of burden sensu Riedl 1978).
The predicted consequence at the genomic level of a GP map with the preponderance of deleterious effects is a very low evolutionary rate and high conservation of genes or regulatory regions involved in the morphogenetic patterning. In vertebrates, such genomic conservation has indeed been found for the mid-embryonic phylotypic stage (Irie and Sehara-Fujisawa 2007; Piasecka et al. 2013; Hu et al. 2017). For example, Piasecka (2013) found that gene duplication and gene birth are very rare among genes of the early developmental stage, and that the regulatory regions of genes expressed at the phylotypic stage are the most conserved regulatory regions.
It is important to note that while the phylotypic stage offers an excellent example, the proposed GP map structure requires only a bout of cross-induction, which is undoubtedly occurring, and while the earliest bout has global effects, such patterning is not limited to the mid-embryonal stage. When affecting the fate of most of the organismal parts in early development, it will be most consequential. But patterning repeats, with less widespread consequences, in the development of peripheral parts, such as the limb bud, or the zeugopodium specifically, for example. Interestingly, some of the mechanisms involved in global patterning appear to be active in later, more local patternings again, adding to the high conservation of patterning processes (Hu et al, 2017).
- b. GP Maps of Growth Processes
The significance of growth in shaping evolutionary patterns has long been acknowledged by morphometricians and evolutionary biologists (e.g., D’Arcy Thompson, 1942; Julian Huxley, 1932). In quantitative genetics, Lande’s multivariate model for the response to selection (1979) facilitated deeper exploration of the multivariate phenotype in evolution (Cheverud 1982a, b; Cheverud et al. 1983; Riska et al. 1984; Riska and Atchley 1985; Riska 1986; Cheverud et al. 1996). It also introduced the ability to analyze how genetic correlations between traits, established through growth, influence the outcomes of natural selection. While this remarkable body of work would require a separate review, it is worth noting that the emphasis on the growth process itself (Riska and Atchley 1985; Riska 1986, 1989)—progressively shifted away toward genetic bases of trait correlations (shape). I would like to turn the attention here to size variation.
A significant portion of the observed morphological variation is size-related, suggesting that growth processes may have the greatest potential to generate heritable phenotypic variation. Although the evidence supporting this idea is abundant, it is often addressed indirectly. Size variation within species is often enormous and heritable – humans and dogs are two very obvious examples. Accordingly, morphometric studies of population variation typically identify size as the primary contributor, represented by the first principal component. While these observations pertain to overall phenotypic variance, there is compelling evidence that the distribution of heritable variance aligns with overall phenotypic variance (Cheverud 1984, Sodini et al. 2018, Holstad et al. 2025). Morphological traits are generally considered to have high heritability, with most studies focusing on quantitative, i.e., size-related traits (Falconer 1960, Roff 1997, Lynch and Walsh 1998). Size is also a common dimension along which lineages with the same body plan tend to diverge (the line of least resistance: e.g., Schluter 1996, Roff 1981, Bonner 1988, Marroig and Cheverud 2005, 2010, Begin and Roff 2003, 2004, Al-Mosleh et al. 2021, Mosleh et al 2023, Rhoda et al. 2023).
Univariate measurements of traits’ heritable size variance available for selection are harder to interpret, as the correlatedness among traits will feature strongly into the measurement. This makes comparison between traits difficult (whether using variance-scaled heritability or mean-scaled evolvability (Hansen et al. 2011)).
Abundant size variation within populations and common size divergence among lineages are thus a common pattern, suggesting growth-related genotype-phenotype maps may hold the greatest potential for evolutionary change. In order to understand how the GP map of growth is structured, whether the high potential to generate evolvability can be grounded in its structure, I would like to draw attention back to the processes regulating growth and generating size variance in populations. However, curiously, the mechanistic studies on variance architecture of growth remain scarce.
Recent work by Wagner (2023) is a rare exception. Wagner addressed this problem using a simple model of exponential growth of a univariate trait, predicting that the variance will increase with the mean. This translates into population variation as positive directionality of epistasis for size increase, meaning that additive genetic variance is larger than expected due to direct additive effects alone as the size increases, and smaller as the trait size decreases (Hansen and Wagner 2001). Certainly, few growth processes in multicellular organisms can be expected to be exponential for any substantial range of size change, or apply to independent characters, so the inherently large potential of growth to generate variation must be contextualized.
Interestingly, analyses of epistatic directionality in segregating variation on a broad set of quantitative size-related traits show the opposite, namely negative directional epistasis for size increase (Pavlicev et al. 2010; Bourg et al. 2024, Le Rouzic et al 2024). In other words, epistasis decreases the effect of mutations with increasing size. A task for future research will be to address this conundrum. Here again, the bottom-up approach using the likely developmental structure of the process of growth would be the avenue to take, asking what kind of variation will arise from the known logic of regulation.
Despite of the current lack of understanding of the structure and logic of growth processes and in mapping variation, the abundance of variation due to growth processes is well supported. I suggest that mutations affecting growth along the dimensions established during morphogenesis account for most of the morphological variation segregating in populations.
- c. GP Maps of Core Maintenance Metabolism
While early development and growth have traditionally had a strong presence in evolutionary thinking, the role of physiology, in general, and metabolism, specifically, has been lagging. In part, this may be due to the seeming conservation of the main metabolic pathways. But why, and how, are they conserved?
The core maintenance processes maintain organismal physiological parameters within a functional range despite highly variable external conditions, such as temperature, osmotic pressure, pH, or intake of energy or electrolytes. The core maintenance mechanisms enable organisms to persist across spatially or temporally heterogeneous conditions. These processes act at the level of the organism, but also at levels of cells, tissues, and organs, thus maintaining bodily integrity. Because mutations perturb the same physiological pathways as do the changes of external conditions, one can expect that a great part of the deviations in physiological parameters due to mutations will become screened off in this GP map structure in the same way that the environmental perturbations are (as shown theoretically by Wagner et al. 1997; Meiklejohn and Hartl 2002). It is important to note here that this does not mean that mutations cannot affect core metabolism, but rather that the mutational effects will be buffered over a broad range (akin to the problems addressed already by Kacer and Burns in 1981).
Given high robustness of core metabolic networks, large effort in their modeling aims at understanding the structure that enables robustness against perturbations (Jeong et al. 2000; Grimbs et al. 2007; Shinar & Feinberg 2010). To put this thought into an evolutionary context, we will focus on the seminal work of Nijhout, Reed and colleagues (Nijhout et al. 2004; Reed et al. 2008; Ulrich et al. 2008a, 2008b; Reed et al. 2017) on the exceptionally well-parametrized metabolic network of one-carbon metabolism in human. Introducing variation in single components of this network, such as changing the availability of single enzymes, shows that a very large perturbation is required (relative to the value observed in the population) to substantially affect the outputs of the network. Mapping of the natural variants into this explicit GP map demonstrates that, despite local effects on single substrates in the network, these variants have little or no effect on the overall functioning of the metabolic network and its outputs. Reed et al furthermore show that this robustness rests on the topology of the interaction network. The presence of allosteric interactions, in particular, is an essential aspect of this stability. Computationally removing the allosteric regulation destabilizes the metabolic network and releases previously hidden sequence variation, affecting the output.
The genotype-phenotype map of the core maintenance metabolism is thus also highly interactive and nonlinear, yet different than morphogenesis, it is also highly robust. An inherent buffering of environmental perturbations within organismal maintenance processes at the same time prevents these processes from generating large amounts of heritable phenotypic variation, in spite of the presence of genomic variation, and even local effects on substrate or enzyme levels. High robustness is associated with little heritable phenotypic variation in the short term.
The ability to maintain some level of physiological stability across various internal and external conditions is one of the most essential properties of organisms. Consequently, maintenance processes make up the largest part of the overall genotype-phenotype map. In fact, the genes involved in metabolic processes form one of the largest categories within the genome. Although not all physiological processes are highly robust, this suggests that genetic variation within this major category of genes is mostly shielded from selection under normal conditions by the organism’s structure. As long as this GP map remains unchanged, it likely evolves mainly through nearly neutral processes. Furthermore, any changes that do occur serve to maintain the stability of core processes despite changes elsewhere. The importance of this large physiological category has probably been underestimated by evolutionary biologists because of its apparent stability and lack of association with phenotypic change. It deserves a more prominent role in future research.
- d. Developmental Interdependence of the Processes
It may appear that the three genotype-phenotype (sub)maps follow in a sequence of lifetime ontogenetic stages from early morphogenesis to growth and to maintenance of adult physiology. This view is not entirely correct even in vertebrates, but it does reveal an important aspect of vertebrate biology.
Vertebrate morphogenetic patterning is restricted to the early phase of life, except for regeneration. Growth may also be restricted but invariably extends beyond the patterning phase. As ontogenetically later processes depend mechanistically on the ontogenetically earlier ones, the growth necessarily occurs along the dimensions that had been set up during the morphogenetic patterning, and the maintenance stabilizes the dimensions set in the development (Figure 2). For example, the tetrapod limbs may vary in size and other details, but the number is determined early on and is fixed across tetrapods. This mechanistic separation of evolution of structure and size is supported by the comparative data on repeated limb reduction and loss across various tetrapod lineages (Lande 1978). Lande observed that, repeatedly during limb reduction in evolution, the limbs first become smaller without structural change, whereas the change in morphogenetic patterning leading to structural rearrangements, such as reducing the digits, occurs only after some minimal size threshold is reached. This pattern of change suggests that in the course of size reduction, the early morphogenetic developmental process is not tinkered with but stays preserved as long as any element dependent on it is built. The size decreases independently along the morphological directions set up at the morphogenetic patterning stage. Digit (hand) development is also a morphogenetic patterning process, drawing on Hox genes, Shh, and Fgf signaling with high pleiotropy (Tickle 2002a, b; Tickle and Towers 2017) and similarly appears to be very resistant to change. Loss of digits does not evolve by suppressing the action of these genes, but by either making the limb bud too small to produce digits, or by inducing cell death early (Lande 1978) - an otherwise late developmental process invoked to remove the interdigital tissue, which sets in earlier in the development in the taxa with advanced digit loss. The point here is specifically about size reduction. That the digit patterning too evolves is known from, for example, hoofed animals or birds (de Bakker et al. 2013; Cooper et al. 2014).
Although vertebrate morphogenetic patterning is limited to early development, a closer look shows that it is also intercalated with growth phases. For instance, the global morphogenetic patterning, during which the axial body plan is established in the phylotypic stage of vertebrate embryonic development, is followed by growth, then again by local morphogenetic patterning of limbs and the cranium, and then by more growth. Maintenance is certainly present throughout development. In fact, some suggest that the stages before the phylotypic stage may have a strong robustness component. In insects, for example, the segment polarity network appears to be canalized rather than sensitive to mutations (von Dassow et al. 2000; Von Dassow and Odell 2002). Similarly, computational analyses of the vertebrate segmentation clock network also indicate robust characteristics (Hammond et al. 2025).
Evolutionary divergence between species often involves heterochrony: shifts in the timing of developmental events relative to growth (Haeckel 1875; De Beer 1940; Gould 1977; Alberch et al 1979, McNamara 1986). Evolution of development by heterochrony is another instantiation of the high evolvability of growth and the relative mechanistic independence from less evolvable morphogenetic patterning. The frequency of this phenomenon means both that the (intercalating) growth is very evolvable, and that the single patterning modules during development become displaced in developmental time relative to others independently, without interrupting their structure.
Together, the above highlights the intriguing mechanistic interdependence between morphogenetic patterning and growth: although the direction of growth relies on the morphogenetic pattern, the underlying mechanisms appear to function with relative independence. This is not without limitation, though: significant size changes can create new metabolic or structural demands that must be met by adjustments in the morphogenetic or maintenance GP maps. Such limitations could also be responsible for the pattern of negative directional epistasis. As the size reaches the upper limit supported by the unchanged developmental patterning structure, the variation in size may decrease.
2. Tripartite GP Map and Microevolutionary Theory
From the above, it follows that the major classes of organismal processes inherently contribute very unevenly to the variation segregating in a population, and thus to the ability to evolve, whether by drift or selection. The most variation of the three types of GP maps is generated, so I argue, by mutations affecting growth processes. However, growth processes are developmentally contingent on morphogenetic patterns. This has important implications for evolution and evolutionary theory.
The most important implication is that the ample size variation is generated primarily along the phenotypic directions set by morphogenetic patterning. Because such patterning will affect all sources of size variation, whether genetic or not, we can also expect the alignment of the distributions of heritable phenotypic variation with mutational variation and non-heritable developmental variation- a pattern recently widely reported (Houle et al. 2017; Rohner and Berger 2023; Holstad et al. 2024; Saito et al. 2024; Tsuboi et al. 2024; Rohner and Berger 2025; Mallard et al 2023). The latter in particular suggests that the source of this common variational pattern is the underlying GP map, through which any newly arising variation, mutational or otherwise, percolates (point made also by Chevin et al. 2022). In addition, as long as morphogenetic processes remain the same (e.g., body plan), the divergence between populations and species in variational patterns can be expected to be aligned with the variation within populations or species. This appears surprising if we expect that this variational structure changes fast, but it is perhaps less surprising if we assume that it is dependent on the morphogenetic patterning which tends to evolve slowly.
Perhaps the best experimental example of the dependence of species variation on the fixed developmental parameters is the seminal work of Alberch and Gale (1985), in which they demonstrated that the same induced perturbations of growth in autopod development in frogs and salamanders (mimicking a mutational perturbation) lead to different phenotypic outcomes. These outcomes are not randomly different but can be directly explained by the fixed differences in development between these two groups.
In other words, although traits do not arise in development by growth alone, most of the population variation available to selection in adults may nevertheless be due to variation generated in growth and not the variation in early morphogenesis or physiology. Even if the mechanistic nonlinearity of developmental and physiological processes is undisputed, this nonlinearity may contribute less to segregating variation than is often proposed. This can be either due to the variation being deleterious or buffered, as explained above.
In addition to the variation-generating processes themselves, the time of selection must be considered when addressing the relevance of variation. Even when the early developmental processes do vary, the evolutionary impact of early variation depends on its contribution to the additive genetic variance at the specific stage at which selection acts. If selection acts in early development, such early variation is selectable. If the selection acts on the adult, the early variation is selectable only to the extent that it contributes to the additive genetic variance of the adult stage. Variation in the lengths of long bones in mice is a good example. Sanger et al. (2011) have shown that divergence in long bone lengths of adult inbred-strain mice, LG/J and SM/J (divergently selected for adult body size), is determined by the growth rate during late, postnatal growth. Similarly, selection on longer bones by Marchini and Rolian (2018) resulted in an accelerated postnatal growth rate. Although it is not known whether there is correlated variation with the size of condensations, such as was proposed by Atchley and Hall (1991), it is, however, likely that the potential early variation is overwhelmed by the variation arising later in growth. This is consistent with previous findings that the mouse adult body size correlates poorly with very early developmental body size (Cheverud et al. 1983).
Together, the three GP submaps generate a distribution of variation that, in adults, is dominated by size-related variation. This means that, while GP map as a whole isn’t unitary, the portion of it contributing to extant population variation is, in fact, relatively unitary after all. Therefore, the predictions based on this variation will tend to hold for appreciable periods of time, precisely because they are conditional on, or stabilized by, the less variable, albeit less additive GP maps of development and physiology.
3. Tripartite GP Map and Macroevolution
The above model thus puts the slow and the faster evolving processes that structure the organism into the common variational space, emphasizes their distinctiveness, and, most importantly, allows us to focus on their interdependencies and interactions. To address macroevolutionary change, the model proposes that we need to focus on the evolution of GP maps of morphogenetic patterning and core metabolism specifically.
The evolution of structure has been discussed in quantitative genetics as the evolution of trait correlations (such as body symmetry, segment divergence, and sex dimorphism) or the underlying pleiotropy (Pavlicev et al. 2008, Watson 2014), which lead to changes in patterns of variation. How do such changes relate to the evolvability of the processes proposed by this perspective? In morphogenetic patterning, one can imagine that strong internal selection caused by pleiotropic effects would prohibit such change. It may however relax if the growth processes which depend on the morphogenetic pattern, change. This could mean a reduction in the growth and development of parts depending on earlier patterning processes. For example, a reduction in growth must occur before the reduction of the limb patterning stage, explained above (Lande 1979). Another possibility for change in morphogenetic patterning may be when external selection for larger body size overwhelms the internal selection and favors a different patterning stage that supports longer growth.
In core metabolism, a GP structure causes canalized mutation effects. The long-term impact of canalization on evolvability has been thoroughly examined in theoretical models (Wagner 2008; Draghi et al. 2010; Mayer and Hansen 2017). Essentially, accumulated cryptic genetic variation can include beneficial variants when robustness breaks down under new external or internal conditions, enabling GP map structure to evolve through either external or internal selection. Exploring these relationships in well-known metabolic circuits (Holstad 2025) would be valuable. The potential for macroevolutionary change at the GP map process level is certainly understudied and represents an intriguing area for future research.
The decomposition also indicates that our focus on population variation has primarily led us to examine specific types of morphological processes, especially the evolution of size-related traits. Our understanding of evolutionary change is therefore based on the GP maps of growth, which have the greatest potential to generate variation and, consequently, are the most evolvable phenotypic traits. In fact, size data are among the most commonly studied in evolutionary biology. Generalizing the ideas from size evolution to other aspects of organisms, such as body plan organization, may have created inflated expectations about the explanatory power of these models and, as a result, an overestimation of the importance of selection. It’s easy to see how this might cause us to overlook the role of organismal system structures in processes that evolve at different rates. Importantly, this model allows us to reason—mainly within the existing conceptual framework—about why different traits or aspects of the phenotype evolve at different rates and in specific directions. Consequently, evolution produces a pattern of conserved phenotypic outcomes (either through constrained variation or strong internal selection), within the boundaries of which other aspects can vary and adapt significantly. This step helps bridge the perceived gap between the structuralist and functionalist views of evolution (Amundson 2005).
It is important to emphasize that this explanation does not lessen the importance of selection or drift in evolutionary processes. The outcome of evolution is neither solely due to variation nor selection, but results from the interaction between the variational distributions generated in the GP maps and selection and drift (while considering the population-level parameters that influence the effectiveness of selection, especially when body size is involved—see e.g., Lynch 2010). Consequently, a comprehensive explanation of evolutionary change, or its absence, requires integrating the entangled potential of the processes to produce variation with the external and population-level factors influencing it. This paper aims to systematically examine what we know about the patterns that variation can take. Exploring the effects of population dynamics, interacting with variation distributions, will be particularly interesting.
4. Conclusions and Outlook
In this manuscript, I proposed that instead of considering the GP map as a unitary process abstracting across all lifetime processes at different levels of organization, it is enlightening to break it down into the sub-maps of specific types of processes, which together constitute the mosaic of a living organism. Different from the full GP map, these process types can be shown to be inherently associated with a certain degree of variability inherent to the logic of their function, resulting in decoupling of their evolutionary rates.
It is plausible that these three basic types of GP maps - morphogenesis, growth, and core metabolism - might not capture all processes involved in the translation from genetic to phenotypic variation across all taxa. The current model stems from intuition derived from vertebrate morphology and will, beyond that, primarily address organismal processes and traits that strongly depend on morphology. Certain aspects of physiology (e.g., the immune system) or life history traits require further exploration. Also, the evolution of other groups of organisms, such as plants or taxa with metamorphosis, may require either different types of GP maps or alternative structuring of similar processes. For example, in plants, local morphogenetic phases (e.g., patterning of a new green leaf or the leaves of a flower) occur repeatedly throughout nearly every stage of life. Whatever the detailed GP map types may apply to other taxonomic groups, I believe that the approach of decomposition based on GP processes rather than traits presented here conveys an important general mechanistic concept. It views organisms as composed of processes with a distinct inherent variation-structuring nature and interesting structural interdependencies between these processes. Breaking down the black box of the GP map into groups of related mechanisms with specific GP structures and separate genetic foundations allows us to study these processes’ contributions to the evolvability of traits, while maintaining some level of heuristic abstraction.
Very little of the information presented here can be claimed to be entirely new. On the contrary, many of the ideas synthesized here have persisted for a long time. What is new is to think them in the same framework. It remains to be seen what this perspective enables us to do in the future, I hope to have indicated some directions. Individualizing the GP submaps based on the underlying process (rather than traits) allows us to make predictions about the molecular evolution of genes underlying the submaps on the one hand, and the expectations about the interactions between these submaps in forming the phenotype, on the other hand. With respect to the latter, one idea put forward in this perspective is that size evolution may be a key driver of the evolution of complex organismal structures, not because selection is strongest on size, but because other generative processes produce less variation. Because growth produces abundant variation, selection on size may push organisms to a point where they reach the limits of their structure or metabolic capacity. As a result, changes in structure and maintenance that were previously harmful may become advantageous for maintaining organismal stability. In recent work, we have suggested that an increase in metabolic demands on cells, potentially due to larger body size, may necessitate metabolic cooperation between cells, leading to the evolution of distinct tissues and organs—organizational innovations (Pavlicev et al. 2024). In such a scenario, increased complexity would follow from larger size—a pattern suggested earlier (Bonner 1988; Bell and Mooers 1997; Bonner 2004). Breaking other constraints and the related emergence of further innovations could also follow similar logic, driven either directly or indirectly by changes in organismal size, whether local or global.
There is much to do. On the one hand, specifically addressing the potential of the above GP map structures for generating variation, in particular that of growth, will be a challenge on its own. Including physiology as one of the central mechanisms mediating variation in the same way as development is currently featured in this place alone will be important. On the other hand, the origin of the specific GP map structures becomes a question, as well as their evolutionary change. The latter appears easier for some maps than for the others. For example, the origin of the genetically robust maintenance maps by selection for environmental robustness has been addressed (i.e., Wagner et al. 1997; Meiklejohn and Hartl 2002). The origin of the morphogenetic GP structure is harder to answer. The evolution of the GP maps may be strongly influenced by their interdependencies, which opens the door for a less considered factor of evolutionary change, namely internal selection.
As perspectives go, this one is opening more questions than it answers. One major hope is that answering them will lead to the long-sought conceptual continuity between branches of evolutionary biology (Amundson, 2005).
Acknowledgments
The author acknowledges numerous invigorating discussions throughout the conceptualization and also the feedback on the formulation of this manuscript, by Günter P. Wagner. I have also profited immensely from the workshop, Evolvability: a unified concept in evolutionary biology, funded 2019-2020 by the Center of Advanced Science of the Norwegian Academy of Science and Letters, Oslo, and led by Thomas F. Hansen and Christophe Pelabon. In this workshop, many of the key organizing ideas in this perspective started to form. To interconnect large topics of evolutionary biology, this perspective necessarily touches on many fields, where appreciable work has been accomplished, but which I do not review or cite. I am painfully aware of at least a part of this neglect, and I apologize to authors who may feel ignored. Any other approach would require either a much longer manuscript or a much narrower emphasis. For the latter, the topic is too complex.
References
- Al-Mosleh, S., G. P. T. Choi, A. Abzhanov and L. Mahadevan. 2021. Geometry and dynamics link form, function, and evolution of finch beaks. Proc Natl Acad Sci U S A 118(46). [CrossRef]
- Alberch, P. 1986. Rules of Invariance in Evolutionary Morphology: The Organization of the Vertebrate Skull. Evolution 40(4): 881-882.
- Alberch, P. and J. Alberch. 1981. Heterochronic mechanisms of morphological diversification and evolutionary change in the neotropical salamander, Bolitoglossa occidentalis (Amphibia: Plethodontidae). J Morphol 167(2): 249-264. [CrossRef]
- Alberch, P. and E. A. Gale. 1985. A Developmental Analysis of an Evolutionary Trend: Digital Reduction in Amphibians. Evolution 39(1): 8-23.
- Amundson, R. 2005. The changing role of the embryo in evolutionary thought : roots of evo-devo. Cambridge University Press, Cambridge; New York.
- Arthur, W. 1997. The origin of animal body plans : a study in evolutionary developmental biology. Cambridge University Press, Cambridge, U.K. ; New York, NY, USA. [CrossRef]
- Atchley, W. R. and B. K. Hall. 1991. A model for development and evolution of complex morphological structures. Biol Rev Camb Philos Soc 66:101-157. [CrossRef]
- Baatz, M. and G. P. Wagner. 1997. Adaptive inertia caused by hidden pleiotropic effects. Theoretical Population Biology 51(1): 49-66. [CrossRef]
- Bégin, M. and D. A. Roff. 2003. The constancy of the G matrix through species divergence and the effects of quantitative genetic constraints on phenotypic evolution: a case study in crickets. Evolution 57(5): 1107-1120.
- Bégin, M. and D. A. Roff. 2004. From micro- to macroevolution through quantitative genetic variation: positive evidence from field crickets. Evolution 58(10): 2287-2304.
- Bell, G. and A. Mooers. 1997. Size and complexity among multicellular organisms. Biological Journal of the Linnean Society 345–363.
- Bonner, J. T. 1988. The evolution of complexity by means of natural selection. Princeton University Press, Princeton, N.J.
- Bonner, J. T. 2004. Perspective: the size-complexity rule. Evolution 58:1883-1890.
- Bourg, S., G. H. Bolstad, D. V. Griffin, C. Pélabon, and T. F. Hansen. 2024. Directional epistasis is common in morphological divergence. Evolution 78:934-950. [CrossRef]
- Carter, A. J., J. Hermisson, and T. F. Hansen. 2005. The role of epistatic gene interactions in the response to selection and the evolution of evolvability. Theor Popul Biol 68:179-196. [CrossRef]
- Cheverud, J. M. 1982a. Phenotypic, Genetic, and Environmental Morphological Integration in the Cranium. Evolution 36:499-516.
- Cheverud, J. M. 1982b. Relationships among ontogenetic, static, and evolutionary allometry. Am J Phys Anthropol 59:139-149. [CrossRef]
- Cheverud, J. M. 1984. Quantitative genetics and developmental constraints on evolution by selection. J Theor Biol 110(2): 155-171. [CrossRef]
- Cheverud, J. M., T. H. Ehrich, T. T. Vaughn, S. F. Koreishi, R. B. Linsey, and L. S. Pletscher. 2004. Pleiotropic effects on mandibular morphology II: differential epistasis and genetic variation in morphological integration. J Exp Zool B Mol Dev Evol 302:424-435. [CrossRef]
- Cheverud, J. M. and E. J. Routman. 1995. Epistasis and its contribution to genetic variance components. Genetics 139:1455-1461. [CrossRef]
- Cheverud, J. M. and E. J. Routman. 1996. Epistasis as a Source of Increased Additive Genetic Variance at Population Bottlenecks. Evolution 50:1042-1051.
- Cheverud, J. M., E. J. Routman, F. A. Duarte, B. van Swinderen, K. Cothran, and C. Perel. 1996. Quantitative trait loci for murine growth. Genetics 142:1305-1319. [CrossRef]
- Cheverud, J. M., J. J. Rutledge, and W. R. Atchley. 1983. Quantitative Genetics of Development: Genetic Correlations among Age-Specific Trait Values and the Evolution of Ontogeny. Evolution 37:895-905. [CrossRef]
- Chevin, L. M., C. Leung, A. Le Rouzic and T. Uller (2022). Using phenotypic plasticity to understand the structure and evolution of the genotype-phenotype map. Genetica 150(3-4): 209-221. [CrossRef]
- Cooper, K. L., K. E. Sears, A. Uygur, J. Maier, K. S. Baczkowski, M. Brosnahan, D. Antczak, J. A. Skidmore, and C. J. Tabin. 2014. Patterning and post-patterning modes of evolutionary digit loss in mammals. Nature 511:41-45. [CrossRef]
- de Bakker, M. A., D. A. Fowler, K. den Oude, E. M. Dondorp, M. C. Navas, J. O. Horbanczuk, J. Y. Sire, D. Szczerbińska, and M. K. Richardson. 2013. Digit loss in archosaur evolution and the interplay between selection and constraints. Nature 500:445-448. [CrossRef]
- De Beer, G. 1940. Embryos and ancestors. The Clarendon Press, Oxford,.
- DiFrisco, J. and G. Wagner. 2023. Body plan identity: A mechanistic model. Evolutionary Biology 49:1-19. [CrossRef]
- Draghi, J. A., T. L. Parsons, G. P. Wagner, and J. B. Plotkin. 2010. Mutational robustness can facilitate adaptation. Nature 463:353-355. [CrossRef]
- Falconer, D. S. 1960. Introduction to quantitative genetics. New York,, Ronald Press Co.
- Galis, F., T. J. Van Dooren, J. D. Feuth, J. A. Metz, A. Witkam, S. Ruinard, M. J. Steigenga and L. C. Wijnaendts. 2006. Extreme selection in humans against homeotic transformations of cervical vertebrae. Evolution 60(12): 2643-2654. [CrossRef]
- Galis, F. 2023. Evolvability of Body Plans: On Phylotypic Stages, Developmental Modularity, and an Ancient Metazoan Constraint in T. Hansen, D. Houle, M. Pavlicev, and C. Pelabon, eds. Evolvability. A Unifying Concept in Evolutionary Biology? MIT Press.
- Gjuvsland, A. B., B. J. Hayes, S. W. Omholt, and O. Carlborg. 2007. Statistical epistasis is a generic feature of gene regulatory networks. Genetics 175:411-420. [CrossRef]
- Gjuvsland, A. B., J. O. Vik, D. A. Beard, P. J. Hunter, and S. W. Omholt. 2013. Bridging the genotype-phenotype gap: what does it take? J Physiol 591:2055-2066. [CrossRef]
- Gould, S. J. 1977. Ontogeny and phylogeny. Belknap Press of Harvard University Press, Cambridge, Mass.
- Green, R. M., J. L. Fish, N. M. Young, F. J. Smith, B. Roberts, K. Dolan, I. Choi, C. L. Leach, P. Gordon, J. M. Cheverud, C. C. Roseman, T. J. Williams, R. S. Marcucio and B. Hallgrimsson. 2017. Developmental nonlinearity drives phenotypic robustness. Nat Commun 8(1): 1970. [CrossRef]
- Grimbs, S., J. Selbig, S. Bulik, H. G. Holzhütter and R. Steuer. 2007. The stability and robustness of metabolic states: identifying stabilizing sites in metabolic networks. Mol Syst Biol 3: 146. [CrossRef]
- Haeckel, E. 1875. Die Gastrula und die Eifurchung der Thiere. Jena. Z. Naturwiss.:402–508.
- Hallgrímsson, B. and B. K. Hall. 2005. Variation. Elsevier Academic Press, Amsterdam.
- Hallgrímsson, B., H. Jamniczky, N. M. Young, C. Rolian, T. E. Parsons, J. C. Boughner, and R. S. Marcucio. 2009. Deciphering the Palimpsest: Studying the Relationship Between Morphological Integration and Phenotypic Covariation. Evol Biol 36:355-376. [CrossRef]
- Hammond, J. E., R. E. Baker, and B. Verd. 2025. Modularity of the segmentation clock and morphogenesis. Elife 14.
- Hansen, T. F. and G. P. Wagner. 2001. Modeling genetic architecture: a multilinear theory of gene interaction. Theor Popul Biol 59:61-86. [CrossRef]
- Hansen, T. F. 2006. The evolution of genetic architecture. Annu Rev Ecol Evol Syst 37: 123-157.
- Hansen, T. F. and D. Houle. 2008. Measuring and comparing evolvability and constraint in multivariate characters. J Evol Biol 21(5): 1201-1219. [CrossRef]
- Hansen, T. F., C. Pelabon and D. Houle. 2011. Heritability is not evolvability. Evolutionary Biology 38: 258-277.
- Hansen, T. F., T. M. Solvin and M. Pavlicev. 2019. Predicting evolutionary potential: A numerical test of evolvability measures. Evolution 73(4): 689-703. [CrossRef]
- Hansen, T. F., D. Houle, M. Pavlicev, and C. Pelabon, eds. Evolvability: A Unifying Concept in Evolutionary Biology? MIT Press.2023. Evolvability: a unifying concept in evolutionary biology? Cambridge, Massachusetts, The MIT Press.
- Hendrikse, J. L., T. E. Parsons, and B. Hallgrimsson. 2007. Evolvability as the proper focus of evolutionary developmental biology. Evol Dev 9:393-401. [CrossRef]
- Holstad, A., K. L. Voje, Ø. Opedal, G. H. Bolstad, S. Bourg, T. F. Hansen, and C. Pélabon. 2024. Evolvability predicts macroevolution under fluctuating selection. Science 384:688-693. [CrossRef]
- Holstad, A. 2025. Understanding evolvability and its implications for evolution. Doctoral Thesis at NTNU Trondheim, Institut for biologi. https://hdl.handle.net/11250/3177820.
- Houle, D., G. H. Bolstad, K. van der Linde, and T. F. Hansen. 2017. Mutation predicts 40 million years of fly wing evolution. Nature 548:447-450. [CrossRef]
- Hu, H., M. Uesaka, S. Guo, K. Shimai, T. M. Lu, F. Li, S. Fujimoto, M. Ishikawa, S. Liu, Y. Sasagawa, G. Zhang, S. Kuratani, J. K. Yu, T. G. Kusakabe, P. Khaitovich, N. Irie and E. Consortium. 2017. Constrained vertebrate evolution by pleiotropic genes. Nat Ecol Evol 1(11): 1722-1730. [CrossRef]
- Huxley, J. 1932. Problems of Relative Growth. Dial Press, New York.
- Irie, N. and A. Sehara-Fujisawa. 2007. The vertebrate phylotypic stage and an early bilaterian-related stage in mouse embryogenesis defined by genomic information. BMC Biol 5:1. [CrossRef]
- Jeong, H., B. Tombor, R. Albert, Z. N. Oltvai and A. L. Barabási. 2000. The large-scale organization of metabolic networks. Nature 407(6804): 651-654. [CrossRef]
- Kacser, H. and J. A. Burns. 1981. The molecular basis of dominance. Genetics 97(3-4): 639-666.
- Lande, R. 1978. Evolutionary mechanisms of limb loss in tetrapods. Evolution 32:73-92.
- Lande, R. 1979. Quantitative Genetic Analysis of Multivariate Evolution, Applied to Brain:Body Size Allometry. Evolution 33:402-416. [CrossRef]
- Le Rouzic, A., M. Roumet, A. Widmer and J. Clo. 2024. Detecting directional epistasis and dominance from cross-line analyses in alpine populations of Arabidopsis thaliana. J Evol Biol 37(7): 839-847. [CrossRef]
- Loison, L. 2025. Beyond Lamarckism : plasticity in Darwinian evolution, 1890-1970. History and philosophy of biology. London ; New York, Routledge, Taylor & Francis Group.
- Lynch, M. 2010. Evolution of the mutation rate. Trends Genet 26:345-352. [CrossRef]
- Lynch, M. and B. Walsh. 1998. Genetics and analysis of quantitative traits. Sunderland, Mass., Sinauer.
- Mallard, F., B. Afonso, H. Teotónio. 2023. Selection and the direction of phenotypic evolution. eLife 12: e80993. [CrossRef]
- Marchini, M. and C. Rolian. 2018. Artificial selection sheds light on developmental mechanisms of limb elongation. Evolution 72:825-837. [CrossRef]
- Marroig, G. and J. Cheverud (2010). Size as a line of least resistance II: direct selection on size or correlated response due to constraints? Evolution 64(5): 1470-1488. [CrossRef]
- Marroig, G. and J. M. Cheverud (2005). Size as a line of least evolutionary resistance: diet and adaptive morphological radiation in New World monkeys. Evolution 59(5): 1128-1142.
- Mayer, C. and T. F. Hansen. 2017. Evolvability and robustness: A paradox restored. J Theor Biol 430:78-85. [CrossRef]
- McNamara, K. I. 1988. Patterns of heterochrony in the fossil record. Trends Ecol Evol 3(7): 176-180. [CrossRef]
- Meiklejohn, C. D. and D. L. Hartl. 2002. A single mode of canalization. 17:468-473. [CrossRef]
- Meyer, R. D., M. Mohammadi, and N. Rahimi. 2006. A single amino acid substitution in the activation loop defines the decoy characteristic of VEGFR-1/FLT-1. J Biol Chem 281:867-875. [CrossRef]
- Milocco, L. and I. Salazar-Ciudad. 2020. Is evolution predictable? Quantitative genetics under complex genotype-phenotype maps. Evolution 74(2): 230-244. [CrossRef]
- Mosleh, S., G. P. T. Choi, G. M. Musser, H. F. James, A. Abzhanov and L. Mahadevan. 2023. Beak morphometry and morphogenesis across avian radiations. Proc Biol Sci 290(2007): 20230420. [CrossRef]
- Mousseau, T. A. and D. A. Roff. 1987. Natural selection and the heritability of fitness components. Heredity (Edinb) 59 ( Pt 2): 181-197.
- Nijhout, H. F., M. C. Reed, P. Budu, and C. M. Ulrich. 2004. A mathematical model of the folate cycle: new insights into folate homeostasis. J Biol Chem 279:55008-55016.
- Orr, H. A. 2000. Adaptation and the cost of complexity. Evolution 54(1): 13-20.
- Pavlicev, M., S. Bourg, and A. Le Rouzic. 2023. The Genotype-Phenotype Map Structure and its Role in Evolvability in T. Hansen, D. Houle, M. Pavlicev, and C. Pelabon, eds. Evolvability: A Unifying Concept in Evolutionary Biology? MIT Press.
- Pavlicev, M. and T. F. Hansen. 2011. Genotype-phenotype map maximizing evolvability: Modularity revisited. Evolutionary Biology 38(4): 371-389. [CrossRef]
- Pavlicev, M. and J. Cheverud. 2015. Constraints Evolve: Context Dependency of Gene Effects Allows Evolution of Pleiotropy. Annual Review of Ecology, Evolution and Systematics 46:413-434. [CrossRef]
- Pavlicev, M., J. M. Cheverud, and G. P. Wagner. 2011. Evolution of adaptive phenotypic variation patterns by direct selection for evolvability. Proc Biol Sci 278:1903-1912. [CrossRef]
- Pavlicev, M., J. DiFrisco, A. C. Love, and G. P. Wagner. 2024. Metabolic complementation between cells drives the evolution of tissues and organs. Biol Lett 20:20240490.
- Pavlicev, M., J. P. Kenney-Hunt, E. A. Norgard, C. C. Roseman, J. B. Wolf, and J. M. Cheverud. 2008. Genetic variation in pleiotropy: differential epistasis as a source of variation in the allometric relationship between long bone lengths and body weight. Evolution 62:199-213.
- Pavlicev, M., A. Le Rouzic, J. M. Cheverud, G. P. Wagner, and T. F. Hansen. 2010. Directionality of epistasis in a murine intercross population. Genetics 185:1489-1505. [CrossRef]
- Pavlicev, M., J. P. Kenney-Hunt, E. A. Norgard, C. C. Roseman, J. B. Wolf and J. M. Cheverud. 2008. Genetic variation in pleiotropy: differential epistasis as a source of variation in the allometric relationship between long bone lengths and body weight. Evolution 62(1): 199-213. [CrossRef]
- Piasecka, B., P. Lichocki, S. Moretti, S. Bergmann, and M. Robinson-Rechavi. 2013. The hourglass and the early conservation models--co-existing patterns of developmental constraints in vertebrates. PLoS Genet 9:e1003476. [CrossRef]
- Raff, R. A. 1996. The shape of life: genes, development, and the evolution of animal form. University of Chicago Press, Chicago.
- Reed, M., J. Best, M. Golubitsky, I. Stewart, and H. F. Nijhout. 2017. Analysis of Homeostatic Mechanisms in Biochemical Networks. Bull Math Biol 79:2534-2557.
- Reed, M. C., R. L. Thomas, J. Pavisic, S. J. James, C. M. Ulrich, and H. F. Nijhout. 2008. A mathematical model of glutathione metabolism. Theor Biol Med Model 5:8. [CrossRef]
- Rhoda, D. P., A. Haber and K. D. Angielczyk. 2023. Diversification of the ruminant skull along an evolutionary line of least resistance. Sci Adv 9(9): eade8929.
- Riedl, R. 1978. Order in living organisms : a systems analysis of evolution. Wiley, Chichester; New York.
- Riska, B. 1986. Some models for development, growth, and morphometric correlation. Evolution 40:1303-1311.
- Riska, B. 1989. Composite traits, selection response, and evolution. Evolution 43:1172-1191.
- Riska, B. and W. R. Atchley. 1985. Genetics of growth predict patterns of brain-size evolution. Science 229:668-671.
- Riska, B., W. R. Atchley, and J. J. Rutledge. 1984. A genetic analysis of targeted growth in mice. Genetics 107:79-101.
- Roff, D. A. 1997. Evolutionary Quantitative Genetics. Chapman & Hall, New York.
- Roff, D. A. and T. A. Mousseau. 1987. Quantitative genetics and fitness: lessons from Drosophila. Heredity (Edinb) 58 ( Pt 1): 103-118.
- Roff, D.1981. On Being the Right Size. Am. Nat. 118 (3).
- Rohner, P. T. and D. Berger. 2023. Developmental bias predicts 60 million years of wing shape evolution. Proc Natl Acad Sci U S A 120:e2211210120. [CrossRef]
- Rohner, P. T. and D. Berger. 2025. Macroevolution along developmental lines of least resistance in fly wings. Nat Ecol Evol 9:639-651. [CrossRef]
- Saito, K., M. Tsuboi, and Y. Takahashi. 2024. Developmental noise and phenotypic plasticity are correlated in. Evol Lett 8:397-405. [CrossRef]
- Sander, K. 1983. The evolution of patterning mechanisms: Gleanings from insect embryogenesis and spermatogenesis. Pp. 137-154 in B. Goodwin, N. Holder, and C. Wylie, eds. Development and Evolution. Cambridge University Press, Cambridge.
- Sanger, T. J., E. A. Norgard, L. S. Pletscher, M. Bevilacqua, V. R. Brooks, L. J. Sandell, and J. M. Cheverud. 2011. Developmental and genetic origins of murine long bone length variation. J Exp Zool B Mol Dev Evol 316B:146-161.
- Schluter, D. 1996. Adaptive radiation along genetic lines of least resistance. Evolution 50(5): 1766-1774.
- Schuster, P., W. Fontana, P. F. Stadler and I. L. Hofacker. 1994. From sequences to shapes and back: a case study in RNA secondary structures. Proc Biol Sci 255(1344): 279-284.
- Schut, P. C., T. E. Cohen-Overbeek, F. Galis, C. M. Ten Broek, E. A. Steegers, and A. J. Eggink. 2016. Adverse Fetal and Neonatal Outcome and an Abnormal Vertebral Pattern: A Systematic Review. Obstet Gynecol Surv 71:741-750.
- Schut, P. C., A. J. Eggink, T. E. Cohen-Overbeek, T. J. M. Van Dooren, G. J. de Borst, and F. Galis. 2020. Miscarriage is associated with cervical ribs in thoracic outlet syndrome patients. Early Hum Dev 144:105027.
- Schwenk, K. and P. G. Wagner. 2001. Function and the Evolution of Phenotypic Stability: Connecting Pattern to Process. American Zoologist 41:552-563.
- Shinar G., M. Feinberg. 2010. Structural Sources of Robustness in Biochemical Reaction Networks.Science 327:1389-1391.
- Simpson, G. G. 1944. Tempo and mode in evolution. New York, Columbia University Press.
- Sodini, S. M., K. E. Kemper, N. R. Wray and M. Trzaskowski. 2018. Comparison of Genotypic and Phenotypic Correlations: Cheverud’s Conjecture in Humans. Genetics 209(3): 941-948. [CrossRef]
- Stearns, S.C. 1994. The evolutionary links between fixed and variable traits. Acta Palaeontologica Polonica 38, 3/4, 215-232.
- Stelling, J., U. Sauer, Z. Szallasi, F. J. Doyle and J. Doyle. 2004. Robustness of cellular functions. Cell 118(6): 675-685.
- Thompson, D. A. W. 1942. On Growth and Form. Cambridge University Press, Cambridge.
- Tickle, C. 2002a. Molecular basis of vertebrate limb patterning. Am J Med Genet 112:250-255.
- Tickle, C. 2002b. Vertebrate limb development and possible clues to diversity in limb form. J Morphol 252:29-37.
- Tickle, C. and M. Towers. 2017. Sonic Hedgehog Signaling in Limb Development. Front Cell Dev Biol 5:14.
- Tsuboi, M., J. Sztepanacz, S. De Lisle, K. L. Voje, M. Grabowski, M. J. Hopkins, A. Porto, M. Balk, M. Pontarp, D. Rossoni, L. S. Hildesheim, Q. J. Horta-Lacueva, N. Hohmann, A. Holstad, M. Lürig, L. Milocco, S. Nilén, A. Passarotto, E. I. Svensson, Christina Villegas, Erica Winslott, Lee Hsiang Liow, Gene Hunt, Alan Love and D. Houle. 2024. The paradox of predictability provides a bridge between micro- and macroevolution. J Evol Biol 37:1413-1432.
- Ulrich, C. M., M. Neuhouser, A. Y. Liu, A. Boynton, J. F. Gregory, B. Shane, S. J. James, M. C. Reed, and H. F. Nijhout. 2008a. Mathematical modeling of folate metabolism: predicted effects of genetic polymorphisms on mechanisms and biomarkers relevant to carcinogenesis. Cancer Epidemiol Biomarkers Prev 17:1822-1831. [CrossRef]
- Ulrich, C. M., M. C. Reed, and H. F. Nijhout. 2008b. Modeling folate, one-carbon metabolism, and DNA methylation. Nutr Rev 66 Suppl 1:S27-30. [CrossRef]
- Uyeda, J. C., T. F. Hansen, S. J. Arnold and J. Pienaar (2011). The million-year wait for macroevolutionary bursts. Proc Natl Acad Sci U S A 108(38): 15908-15913. [CrossRef]
- von Dassow, G., E. Meir, E. M. Munro, and G. M. Odell. 2000. The segment polarity network is a robust developmental module. Nature 406:188-192.
- Von Dassow, G. and G. M. Odell. 2002. Design and constraints of the Drosophila segment polarity module: robust spatial patterning emerges from intertwined cell state switches. J Exp Zool 294:179-215.
- Waddington, C.H. 1942. Canalization of development and the inheritance of acquired characters. Nature 3811:563.
- Wagner, G. P. 1989. Multivariate mutation-selection balance with constrained pleiotropic effects. Genetics 122(1): 223-234. [CrossRef]
- Wagner, A. 2008. Robustness and evolvability: a paradox resolved. Proc Biol Sci 275:91-100. [CrossRef]
- Wagner, G. P. 2023. Models of Contingent Evolvability Suggest Dynamical Instabilities in Body Shape Evolution. In T. Hansen, D. Houle, M. Pavlicev, and C. Pelabon, eds. Evolvability: A Unifying Concept in Evolutionary Biology? MIT Press.
- Wagner, G. P. and L. Altenberg. 1996. Perspective: Complex Adaptations and the Evolution of Evolvability. Evolution 50:967-976.
- Wagner, G. P., G. Booth, and H. Bagheri-Chaichian. 1997. A Population Genetic Theory of Canalization. Evolution 51:329-347.
- Wagner, G. P. and K. Schwenk. 2000. Evolutionarily Stable Configurations: Functional Integration and the Evolution of Phenotypic Stability. Evolutionary Biology 31:155-217.
- Watson, R. A., G. P. Wagner, M. Pavlicev, D. M. Weinreich and R. Mills. 2014. The evolution of phenotypic correlations and developmental memory. Evolution 68(4): 1124-1138. [CrossRef]
- Wolf, J. B., L. J. Leamy, E. J. Routman, and J. M. Cheverud. 2005. Epistatic pleiotropy and the genetic architecture of covariation within early and late-developing skull trait complexes in mice. Genetics 171:683-694.
- Wolf, J. B., D. Pomp, E. J. Eisen, J. M. Cheverud, and L. J. Leamy. 2006. The contribution of epistatic pleiotropy to the genetic architecture of covariation among polygenic traits in mice. Evol Dev 8:468-476. [CrossRef]
Figure 1.
A scheme of a heterogeneous GP map, composed of processes that contribute different amounts of phenotypic heritable variation, and thus confer different degrees of evolvability.
Figure 1.
A scheme of a heterogeneous GP map, composed of processes that contribute different amounts of phenotypic heritable variation, and thus confer different degrees of evolvability.
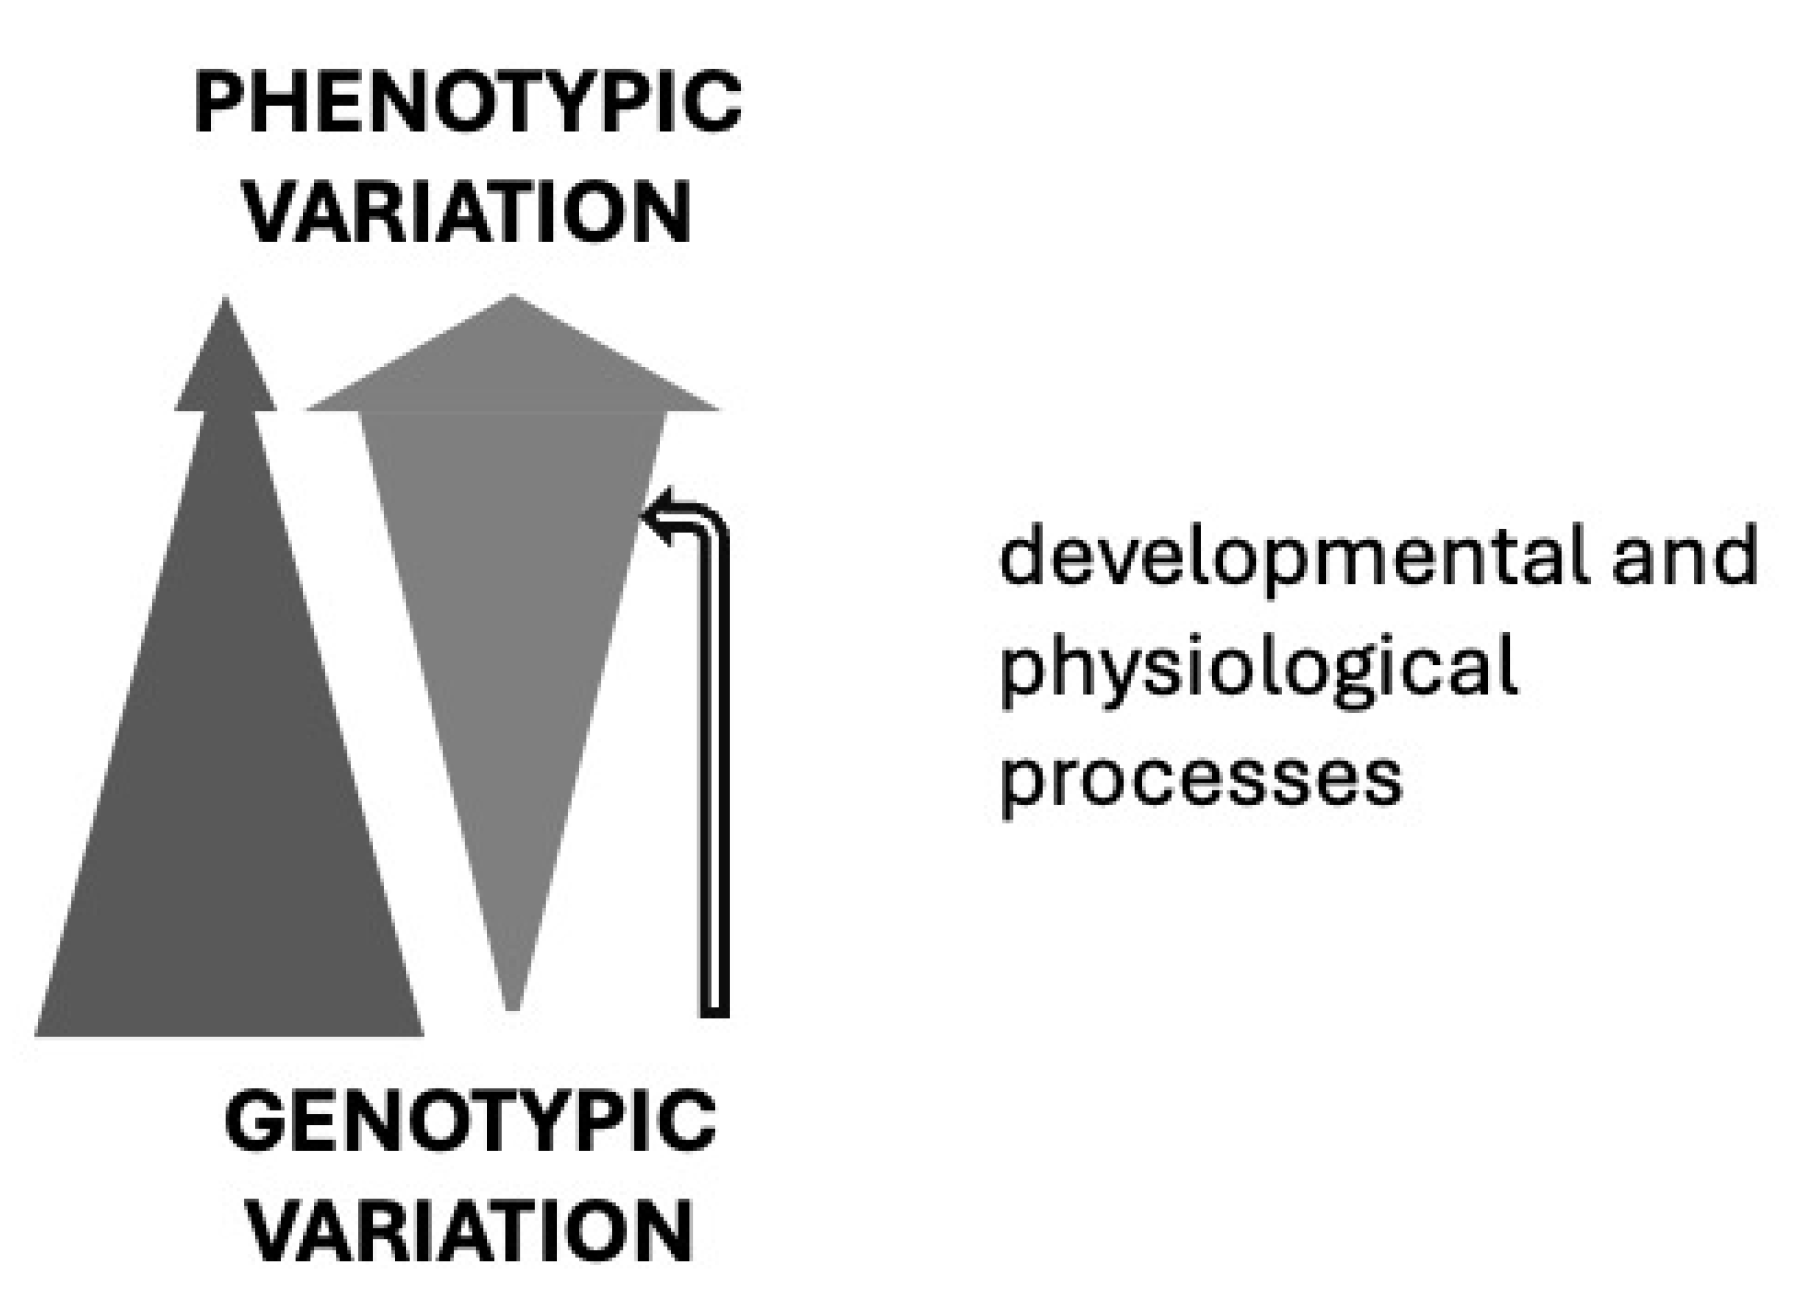
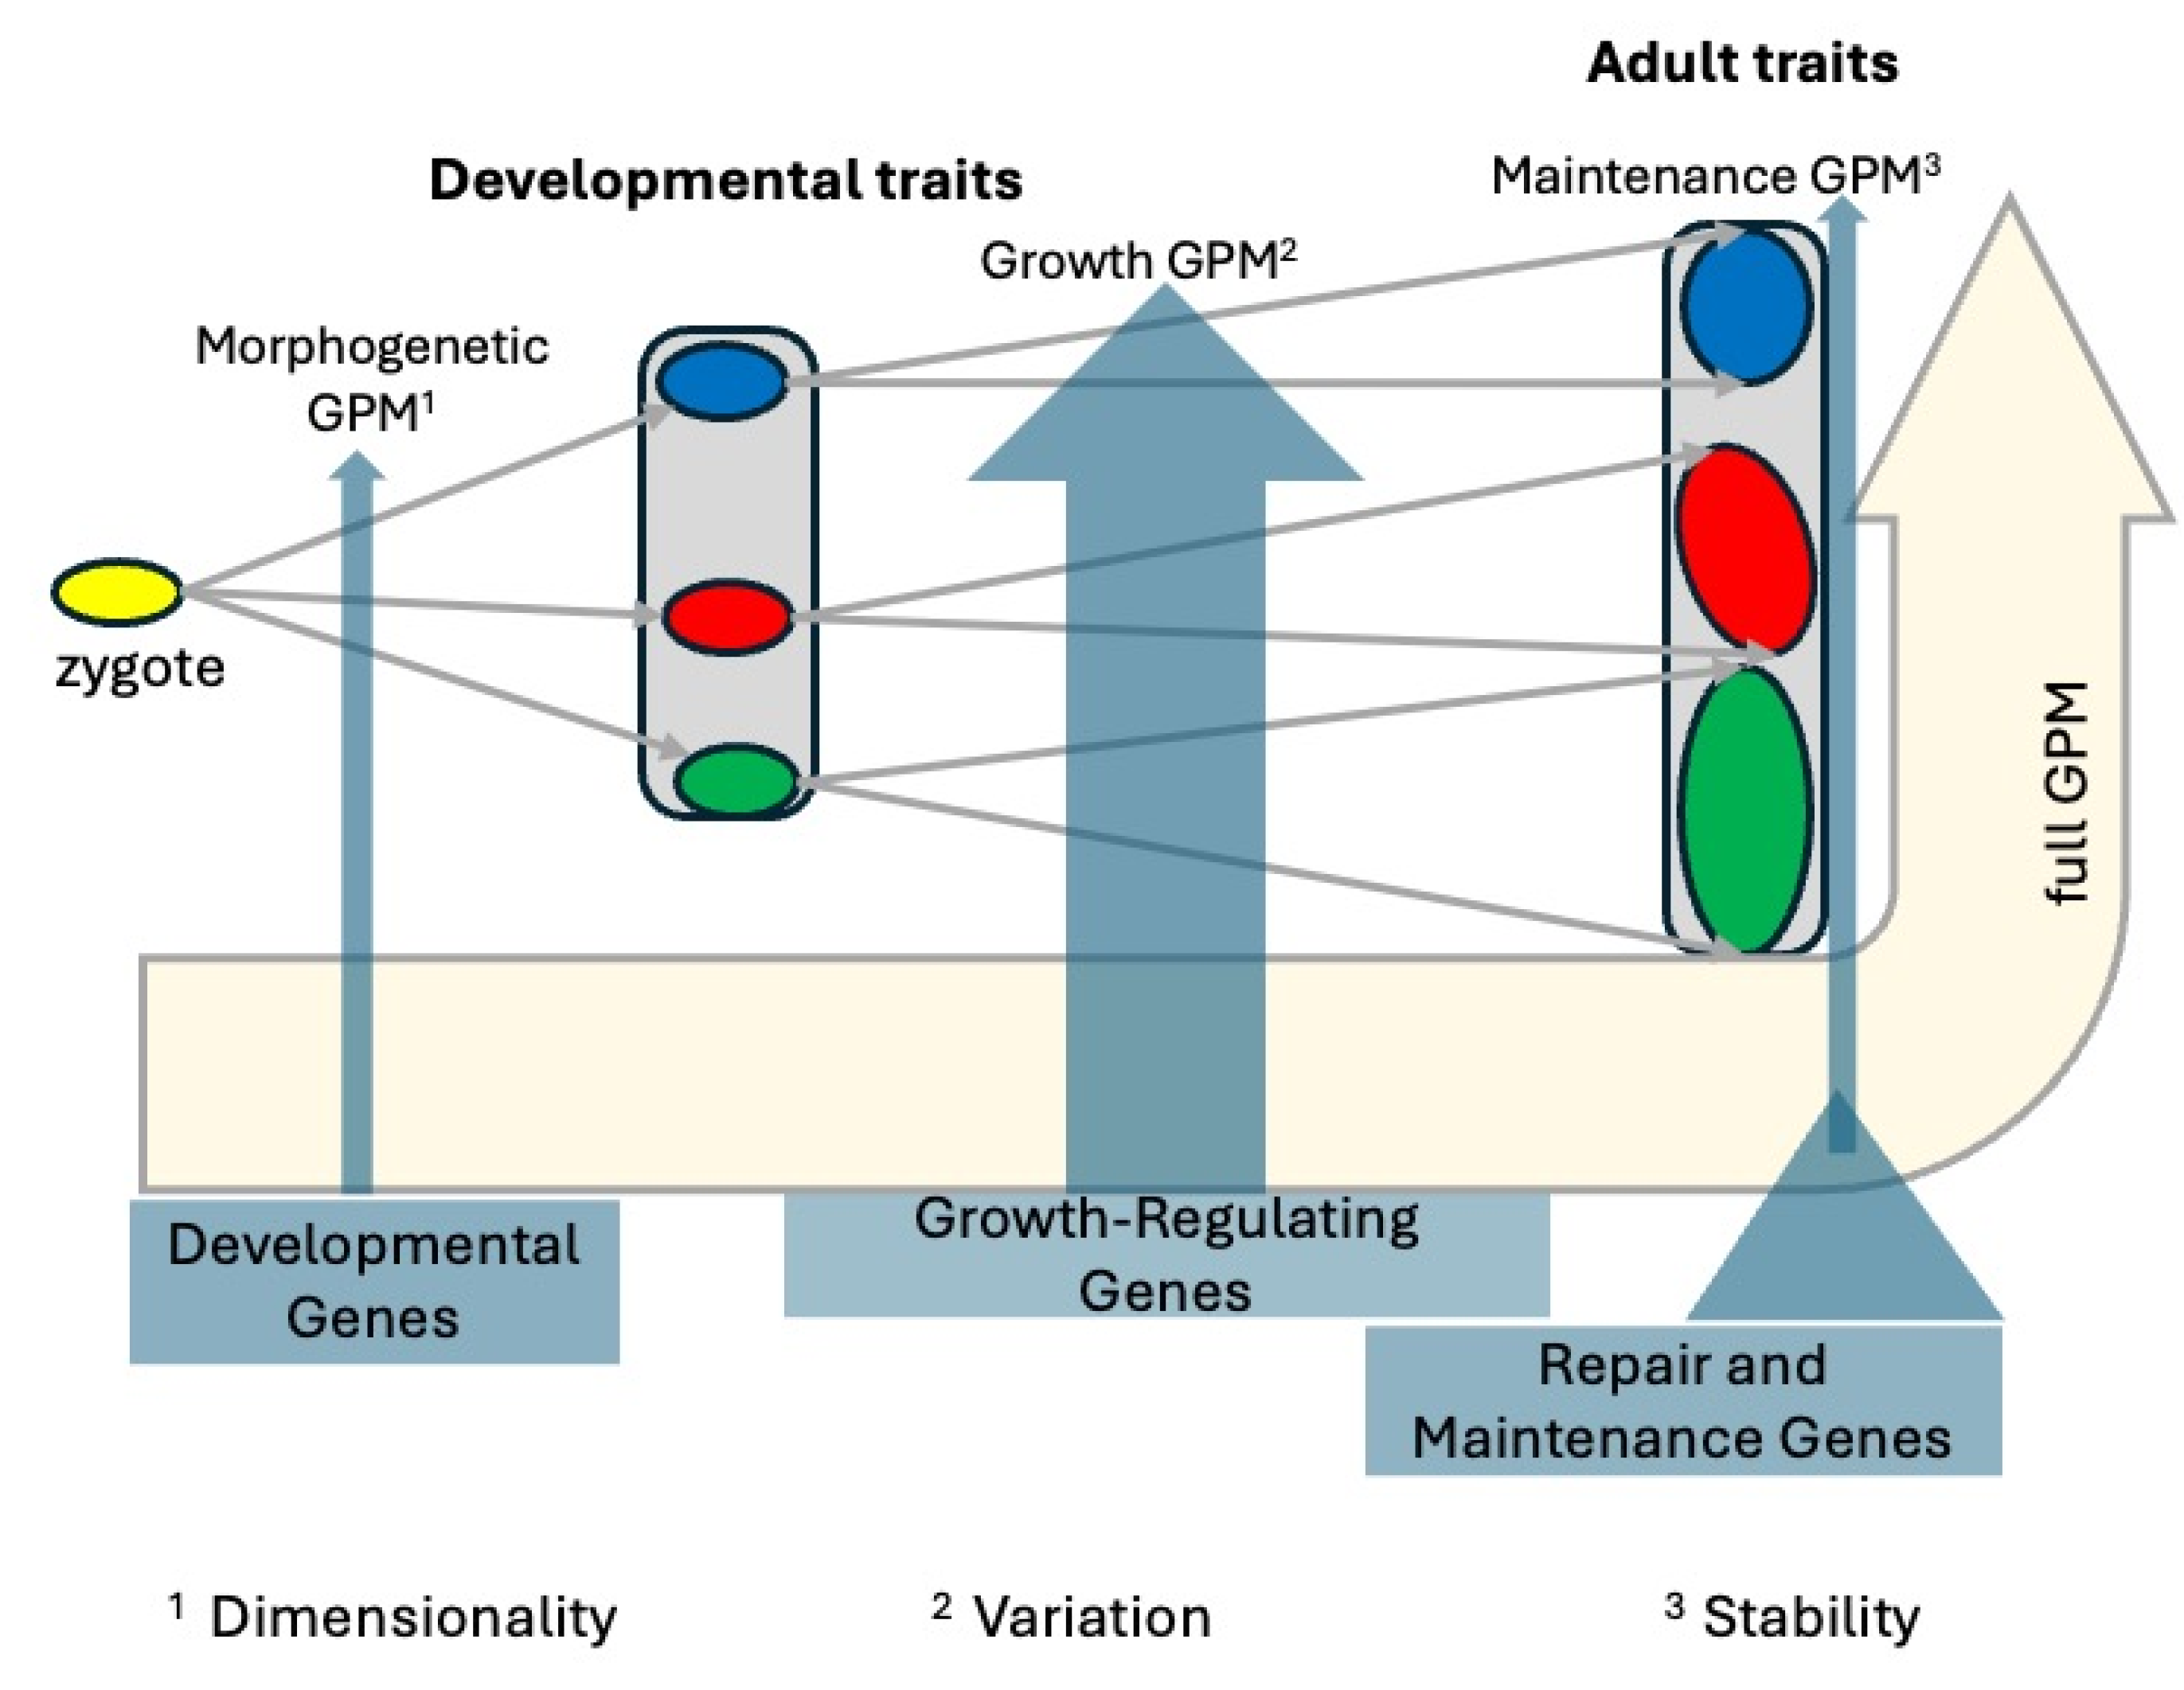
Figure 2.
A complete schematic presentation of the tripartite genotype-phenotype map, consisting of morphogenetic, growth, and maintenance submaps, contributing in part at different times of development, and also allowing different degrees of variation due to their inherent structuring principles.
Figure 2.
A complete schematic presentation of the tripartite genotype-phenotype map, consisting of morphogenetic, growth, and maintenance submaps, contributing in part at different times of development, and also allowing different degrees of variation due to their inherent structuring principles.
Disclaimer/Publisher’s Note: The statements, opinions and data contained in all publications are solely those of the individual author(s) and contributor(s) and not of MDPI and/or the editor(s). MDPI and/or the editor(s) disclaim responsibility for any injury to people or property resulting from any ideas, methods, instructions or products referred to in the content. |
© 2025 by the authors. Licensee MDPI, Basel, Switzerland. This article is an open access article distributed under the terms and conditions of the Creative Commons Attribution (CC BY) license (http://creativecommons.org/licenses/by/4.0/).
Copyright: This open access article is published under a Creative Commons CC BY 4.0 license, which permit the free download, distribution, and reuse, provided that the author and preprint are cited in any reuse.


