Submitted:
02 May 2025
Posted:
06 May 2025
Read the latest preprint version here
Abstract
A fundamental insight of evolutionary genetics is that the potential of a population to evolve depends crucially on the nature and pattern of its heritable phenotypic variation. Fundamental insights of organismal biology are the organizing principles of physiology and development, leading to the understanding what patterns of the heritable phenotypic variation can arise. Only together, the two insights form the basis for evolutionary explanation.
Keywords:
Evolvability
; pattern of variation
; variability
; growth
Introduction
Evolutionary biology aims to explain how the phenotypic differences between populations and higher taxa arise. While the changes leading to continuous quantitative differences within and between closely related populations and species are well accounted for through evolutionary quantitative genetics, describing how qualitative phenotypic differences between higher taxa are established and why some type of traits evolve at a slower rate than others, remain difficult questions.
The ability of a population to respond to selection depends on the amount and distribution of heritable variation across traits (Lande 1979). Substantial effort has therefore been invested in understanding both, the patterns of selection as well as the pattern of variation (Hallgrímsson and Hall 2005; Hendrikse et al. 2007). Combined with mechanistically explicit genotype-phenotype maps, these concepts led to a substantial understanding, how, in principle, the underlying genotype – phenotype mapping structure affects the variational and potentially evolutionary outcomes. For example, that the modularly arranged pleiotropy may lead to variational decoupling of modules and thus reduce the variational constraint between them, while maintaining their function (Wagner and Altenberg 1996), or that (directional) epistasis can substantially diminish or increase the genetic variance available for selection response (Cheverud and Routman 1995, 1996; Carter et al. 2005), to name just two insights. While these insights have been extremely valuable, the variation of any given trait arises via a developmental and physiological palimpsest (Hallgrímsson et al. 2009), with variational patterns due to later processes overwriting, enhancing or cancelling, the patterns arising in earlier processes. These processes have different properties and focusing on the overall variation or only on a single type of GP structure limits the understanding of genetic bases of traits, and their short- and long-term evolution.
Considerably less attention has been paid to the actual processes by which the variation arises, as mutations are translated into phenotypic differences (Gjuvsland et al. 2007; Gjuvsland et al. 2013; Pavlicev et al. 2023). This lack of attention is not surprising, as the sheer number of interacting processes at different levels of organization, from gene networks through cells, tissues and organs to an organism and population, appears intractable. However, it is not obvious what level of detail is really necessary, or what level of abstraction is sufficient to account for relevant features of a GP map. In the era of systems biology, the detailed structure, but also the overall logic of the developmental and physiological processes are becoming increasingly accessible, and this knowledge can be integrated with the well-established population-level framework of evolutionary theory. Here I will argue that by doing so even at a level of abstraction much higher than the available molecular detail, we may be able to explain broader evolutionary patterns of trait evolution and potentially close the explanatory gap between microevolutionary processes and macroevolutionary phenomena, such as body plans and homology.
Central to my argument is the observation that different processes have inherently different capabilities to generate variation. I thus suggest decomposing the GP map by the types of processes. I use the GP map here to refer to the entirety of developmental and physiological processes involved in translating genetic sequence into the phenotype, regardless of whether polymorphisms are segregating in the population.
In the first part, I propose to decompose the GP map into three process types (Figure 1). The architecture of these processes determines what kind of phenotypic variation the extant as well as future mutations will generate, and thus these architectures are associated with a persistent variational pattern (variability as dispositional property, sensu Wagner & Altenberg (1996)). In the second part, I will discuss the evidence, the insights gained when we approach GP maps this way and the wider ranging evolutionary and theoretical implications.
- 1.
- Not a unitary map: Decomposing the GP map by process type
When using abstract summary statistics such as variance-covariance matrix to represent the variational and thus also organismal structure, we implicitly assume that the underlying mapping of variation follows some unitary structural principles. For example, the mapping is thought to be either quasi modular, canalized, random, or to entail universal pleiotropy. While evidence exists for each of these mapping structures in specific traits, there are also counter examples where it does not apply. In fact, such shared GP map is inconsistent with what we know about different developmental and physiological processes, as will become clear below. Genotype-phenotype map thus does not reflect a unitary process, rather, its underlying processes can be categorized in a small number of GP map types with distinct organizations, which generate distinct variational patterns, and can therefore be expected to have distinct evolutionary consequences. As these processes also draw on- at least in large part- non-overlapping sets of genes, it is therefore useful to address them separately. The variability of traits can then be thought of as mosaics of the variabilities of these processes, as will become clear below. In the following, I first describe three such process types, explain their propensities to generate variation, and how they may consequently respond to selection (i.e., their evolvability). The choice of categories will be discussed later.
- a.
- GP maps of morphogenetic processes
Early developmental morphogenetic processes lay out the overall animal body plan and are thus of consequence in determining the overall dimensionality of an organism’s variability, i.e. how many things a body has to vary. Growth will take place along the dimensions set up during morphogenesis and the growth-related variation will arise in later development (see below).
For successful mutual inductions of developmental regions during the morphogenetic process, a precise spatio-temporal arrangement of cell populations is crucially important. This involves a high degree of interactivity between developing cell populations. The genotype-phenotype mapping of this process can thus be characterized as non-modular (can also be seen as a single module), with a very high degree of integration within the process. High integration means that mutations in any gene (or gene regulatory region) that is active at this time have a high likelihood to negatively affect many topological regions of the embryo and thus manifest a high degree of pleiotropy (as proposed previously: Sander 1983; Raff 1996; Galis 2023). Epistasis is likely also involved, but less is known about this part. It should be noted that the overall interactivity of organismal processes is not by itself sufficient to infer consequential and propagating pleiotropic effects, like we see in early morphogenesis. Interactivity can also underlie robustness, as we will see in the section on maintenance and metabolism. Nevertheless, the role of interdependencies in setting up the body plan during morphogenesis results in effects in many of the dimensions that are arising during this process as exemplified by the broad morbidity of fetuses affected during the so-called phylotypic period of embryonic development (see below). This is because the inductions between cell populations are the necessary preconditions for their downstream developmental transformations to occur in the first place, rather than serving to modify established organismal processes. In more technical terms, the effects do not just affect many dimensions, they set up the dimensionality of the organism in the first place and their disruption preempts the establishment of the organismal architecture.
The consequence of such GP map structure is that advantageous, or even viable, mutational effects are unlikely, due to the overall structure of this process. This implies strong stabilizing selection, sufficient to explain a high level of conservation of these stages across large phylogenetic distances, and consequently also conservation of the genomic regions involved in these stages. A particularly well-established example is the conservation of cervical vertebrae in mammals (reviewed together with further examples in Galis 2023). The mutational effects on the number or shape (e.g., presence of ribs) of the cervical vertebrae in humans do arise in the phylotypic stage of development. From studies in humans we know that they are nearly invariably associated with numerous abnormalities in a broad array of organ systems beyond the axial skeleton: cardiovascular, urogenital or neural systems, and have a lethality of approximately 90% (Schut et al. 2016; Schut et al. 2020). Similar patterns are known in other well studied species (for a review see: Galis 2023). This work demonstrates that the system is not robust to mutational effects, rather the mutations have a high pleiotropy, and a high lethality, resulting in high evolutionary conservation.
Evolvability of morphogenesis is thus low due to preponderance of deleterious mutation effects at this developmental stage. Interestingly, the selection acting here stems primarily from the internal factors: mutations are deleterious because their effects are incompatible with the developmental context, not because they are incompatible with a particular external environment. Such an effect will thus persist regardless of the environment, contributing to the strength of conservation. This phenomenon has been referred to as internal selection (Arthur 1997; Wagner and Schwenk 2000; Schwenk and Wagner 2001).
The predicted consequence at the genomic level of a GP map with the preponderance of deleterious effects is a very low evolutionary rate and high conservation of genes or regulatory regions involved in the morphogenetic stage. When addressed in vertebrates, this has indeed been found (Irie and Sehara-Fujisawa 2007; Piasecka et al. 2013). For example, Piasecka (2013) found that gene duplication and gene birth is very rare among genes of very early developmental stage, and that the regulatory regions of genes expressed at the phylotypic stage, are the most conserved regulatory regions.
- b.
- GP maps of growth processes
Quantitative or size variation is the most abundant heritable variation, which implies that the GP maps of growth may be the primary source of evolutionary change. But what structure of the GP map of growth enhances such variation, and what distribution among traits can we expect?
The role of growth in generating allometries and trait correlations and thus contributing to particular size relationships between quantitative traits, has been recognized early by morphometricians (e.g., D’Arcy Thompson, 1942) and evolutionary biologists alike (Julian Huxley, 1932).
Multivariate models for the response to selection (Lande 1979) clarified how strongly trait correlations feature in the process of natural selection, enhancing the study of growth in the context of quantitative genetics (Cheverud 1982a, b; Cheverud et al. 1983; Riska et al. 1984; Riska and Atchley 1985; Riska 1986; Cheverud et al. 1996). It is not my intension to review this remarkable body of work, except to say that the focus on the role of growth in how trait relationship is generated (Huxley 1932; Riska and Atchley 1985; Riska 1986, 1989) has gradually given way to statistical assessments of variances and covariances at different stages of growth. In order to understand how the GP map of growth is structured and what the potential for evolvability may be, I would like to draw attention back to the processes regulating growth and generating covariance in populations.
Recent work by Wagner (2023) shows that a simple exponential growth of a univariate trait is predicted to generate variance that increases with the mean. This translates into population variation as positive directionality of epistasis for size, an epistasis pattern that increases additive genetic variance relative to direct additive effects alone (Hansen and Wagner 2001; Carter et al. 2005). Certainly, few growth processes in multicellular organisms can be expected to be exponential for any substantial range of size increase, or apply to independent characters, so the inherently large potential of growth to generate variation must be contextualized. Indeed, large analyses of epistatic directionality in numerous quantitative traits show the opposite, namely negative directional epistasis (Pavlicev et al. 2010; Bourg et al. 2024). In other words, epistasis decreases the effect of mutations (concave GP map) with size. How can this conundrum be explained?
One major obstacle in the existing ideas regarding epistasis in general, as also specifically with respect to its directionality across loci, is that its effect is considered for one trait at a time (with rare exceptions: Cheverud et al. 2004; Wolf et al. 2005; Wolf et al. 2006; Pavlicev et al. 2008). This is understandable due to the sheer complexity of multivariate models of epistasis, which soon become intractable with increasing number of traits, and uninterpretable. However, the genetic effects on single traits may be more informative when thought in the context of other traits, as in early work on growth mentioned above (Riska and contemporaries). One way to make progress in this direction, in spite of its complexity, is to use the likely developmental structure of the process of growth and translate this structure into the expected variational distribution. I will outline here one very generalized, but plausible verbal model, which will be developed in greater technical detail elsewhere.
Large part of growth regulation occurs by means of growth factors (IGF, BMP, GH etc.); a set of highly pleiotropic, hormone-like proteins that are either widely expressed or transported throughout the organism. These spatially wide-ranging effects enable coordinated growth across distant parts of the organism. The species-specific shape of the organism in terms of relative size relationships arises in development by locally modulating overall growth. This can be done by either the local expression of growth factors themselves, or by the remarkably high number of ways to locally modulate signal availability or the downstream signal transduction of generally expressed pleiotropic growth factors. Apart from modulating local expression of receptor proteins or their cofactors, the receptors may be limited by a saturation point, or the growth factors may be bound by a locally expressed high-affinity decoy receptor or binding protein, to name a few (Baumann et al. 1989; Clemmons 1997; Meyer et al. 2006). All of these mechanisms can serve to locally modify the effects of broadly expressed growth signals and increase the independence of the growth control of the local traits. Note that modification in this model is primarily directional: general growth effects are negatively modulated locally. Assuming that different genetic loci underlie the expression of modulators than do those of growth signals, we are facing a situation involving multiple loci affecting growth in multiple traits. More specifically, the interaction between global and local inhibitory effects may underlie the decrease in pleiotropy of the global growth factor. When considered from the perspective of directional epistasis, we note that traits whose growth regulation has this property of global regulation and negative local modification will likely demonstrate negative directional epistasis, as the modification reduces the effects of the pleiotropic locus. A 2-locus population genetic model for such regulatory structure (2-locus epistasis affecting correlation of two traits; Pavlicev et al. 2011) has been presented previously in the context of evolution of pleiotropy and would need to be extended for exploring the effects of growth on additive and nonadditive variance in multiple traits, across multiple interactions.
Size-related variation is also where modularity is often found. From the above structure of regulation of the relative trait sizes (i.e. shapes) by interaction between the general GF and specific growth modulators, it follows that variational modularity arises by epistatically modifying the pleiotropic effects in a local context, rather than by the modular arrangement of direct effects (Figure 2, contrasted to (Wagner and Altenberg 1996).
Overall, growth along the dimensions (characters) established during morphogenesis generates most population variation, as the effects of sequence changes in genes acting during this stage are readily mapped to the quantitative phenotype. However, the different relative sizes of body parts reveal that the mechanisms of growth regulation likely also contribute to correlations and their modification. I suggest that the GP map of growth is based on interactions between highly pleiotropic general growth regulators, and locally acting (mostly) negative modifiers of general growth effects. Depending on the variation segregating in the population, the variation can appear specific to the part, be general, or appear epistatic (if both interactants are polymorphic). Crosses of lines divergent in size will likely manifest epistatic variation and the pattern will likely be negative (in direction of increased size).
- c.
- GP maps of maintenance metabolism
While early development and growth have traditionally had a strong presence in evolutionary theory, even if not in an integrated manner, the presence of metabolism and physiology in general, has been lacking, except in evolutionary ecology. In part, this is due to relative conservation of the main metabolic pathways. But why are they conserved?
Maintenance processes maintain organismal physiological parameters within a functional range in spite of highly variable external conditions, such as temperature, osmotic pressure, pH, energy, electrolytes; but these mechanisms also maintain tissue or organ integrity. Maintenance mechanisms enable organisms to persist under heterogeneous conditions- such as inhabiting a range of different environments, deal with high temporal variability in energy input or with toxicity. As the mutational effects percolates through the same processes as the effects of external conditions, one can expect that the deviations in physiological parameters due to mutations will be screened off in this GP map structure in the same extent that the environmental perturbations are (Wagner et al. 1997; Meiklejohn and Hartl 2002).
Correspondingly, modelling maintenance networks demonstrates a high degree of robustness against perturbations of their parameter values. The seminal work of Nijhout, Reed and colleagues (Nijhout et al. 2004; Reed et al. 2008; Ulrich et al. 2008a; Ulrich et al. 2008b; Reed et al. 2017) on the exceptionally well-parametrized metabolic network of human one-carbon metabolism will serve as an example here. Introducing variation in single components of this network, for example, changing the availability of single enzymes, shows that it requires a very large perturbation (relative to the value observed in the population), to affect the downstream processes and the output of the network. Mapping the natural variants into this GP map demonstrates that in spite of local effects on single substrates in the network, these variants have little or no effects on the functioning of the metabolic network, and its outputs. Reed et al furthermore show that this robustness rests on the topology of the interaction network. Presence of allosteric interactions in particular, is an essential aspect of this stability. Computationally removing the allosteric regulation destabilizes the metabolic network and releases previously hidden sequence variation, affecting the output.
The genotype-phenotype map of the maintenance metabolism is thus also highly interactive, yet highly robust. An inherent buffering of perturbations within organismal maintenance processes at the same time prevents these processes from generating large amounts of heritable phenotypic variation, in spite of the presence of mutations at the level of genomic sequence and even in amounts of substrates or enzymes. High robustness is associated with little heritable phenotypic variation, but potentially high longer-term evolvability due to accumulated cryptic genetic variation that may include advantageous variants when robustness breaks down under new conditions (Wagner 2008). Theory shows that the answer to the question, whether robustness increases or decreases evolvability in the long term, itself depends on the structure of the GP map (Draghi et al. 2010; Mayer and Hansen 2017). It would be interesting to explore this relationship on well-known metabolic pathway structures (Holstad et al., in prep).
Maintenance of physiological stability across a range of internal and external perturbations is one of the most fundamental properties of organisms, and correspondingly, maintenance processes constitute the largest component of the total genotype-phenotype map. Indeed, the genes constituting the genetic basis of these processes represent one of the largest categories of genes in the genome. It follows that the genetic variation in one of the largest categories of genes is screened off from selection under normal circumstances by the organismal structure, and as long as this GP map does not change, evolves by nearly neutral evolution. This physiological category has - likely for its evolutionary stability- been traditionally overlooked by evolutionary biologists and deserves a more central stage in the future.
- d.
- Developmental hierarchy and interdependence of the processes
It may appear that the three genotype-phenotype (sub)maps correspond to a sequence of lifetime ontogenetic stages from early morphogenesis to growth and to maintenance of adult physiology. This is true in a broad sense but is not the case in detail. Development is hierarchically structured, and thus subsequent morphogenetic patterning processes will be intercalated by growth and maintenance processes. For example, after the global morphogenetic phase in phylotypic stage of vertebrate embryonic development, during which the axial body plan is established, growth sets in, followed again by the local morphogenetic patterning of limbs and the cranium, which are again followed by growth and physiological maintenance. If the intercalating growth is the most evolvable of these mechanisms, it is plausible that the single patterning modules can be displaced in developmental time relative to others, while themselves remaining conserved. It appears that also the stages prior to the phylotypic stage may have a stronger robustness component - for example, segment polarity network across insects appears to be canalized rather than sensitive to mutations (von Dassow et al. 2000; Von Dassow and Odell 2002). Similarly, computational analyses of the vertebrate segmentation clock network also imply robust behavior (Hammond et al. 2025).
In most animals, morphogenetic patterning phases (and often growth), are restricted to the early phase of life, with exception of regeneration. Even if I focus here on animals, this may be one way how plants fit the picture, namely that in plants, the local morphogenetic phases (e.g. patterning of a new leaf, including the leaves of a flower) recur at almost any phase in a lifetime.
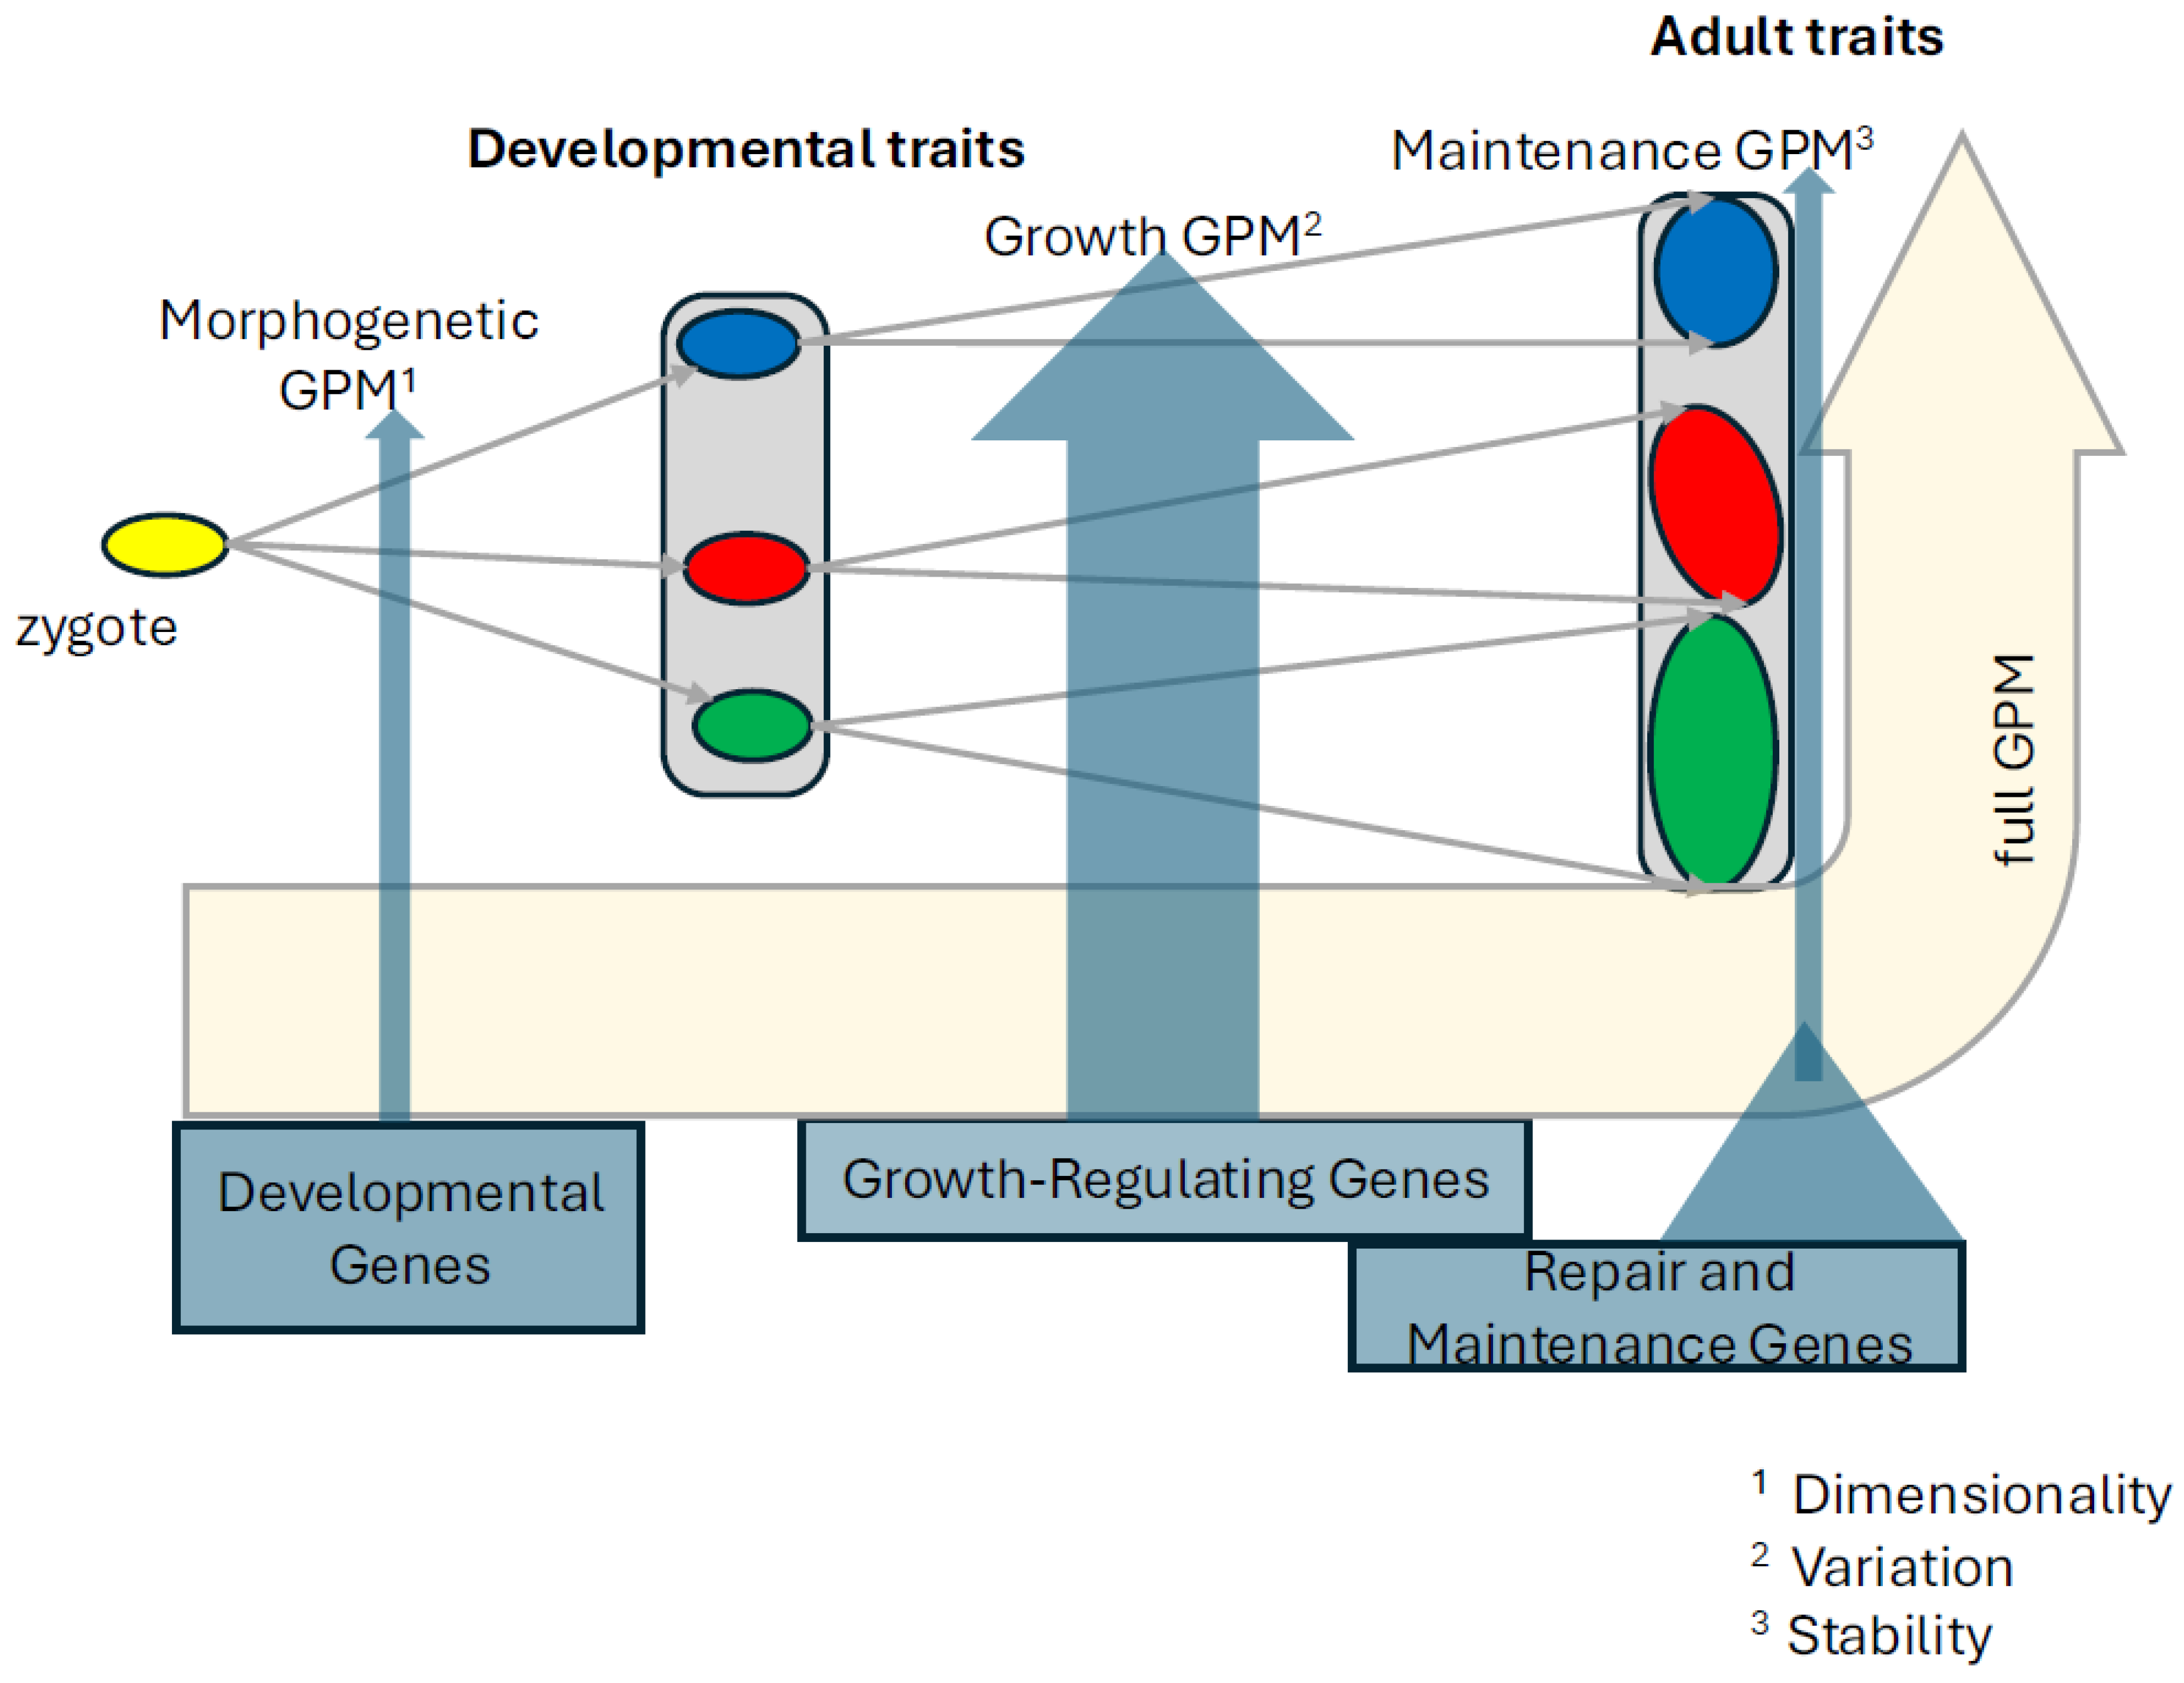
What is more, different types of processes are interdependent in that ontogenetically later processes depend on the ontogenetically earlier ones, such that growth occurs along the dimensions set up in the previous morphogenetic stage, and also maintenance stabilizes the dimensions set in the development (Figure 3). Despite the temporal contingency however, the types of processes seem to draw on partially non-overlapping genetic bases, given that size varies and evolves relatively independently from the organization of body plan. This can be demonstrated using the comparative data on repeated limb reduction and loss in various tetrapod lineages (Lande 1978). Lande observed that, during limb reduction in evolution, the limbs first become smaller without structural change, whereas structural change, such as reducing the digits, occurs after some minimal size threshold is reached. This demonstrates that in the course of size reduction, the early morphogenetic developmental process is not tinkered with but stays preserved as long as any element dependent on it, is built. The size decreases independently along the morphological directions set up at morphogenetic stage. Digit development also is a morphogenetic process, drawing on Hox genes and Shh and Fgf signaling with high pleiotropy (Tickle 2002a, b; Tickle and Towers 2017) and similarly appears to be very resistant to change. Loss of digits thus does not evolve by suppressing the action of these genes, but by either making the limb bud too small to produce digits, or by inducing cell death early (Lande 1978) - an otherwise late developmental process invoked to remove the interdigital tissue, which sets in earlier in the development in the taxa with advanced digit loss. (The point here is specifically about changes at size reduction, not that the digit patterning never changes- obvious examples see hoofed animals or birds (de Bakker et al. 2013; Cooper et al. 2014)).
An interesting aspect of this model may be that the relative growth changes may capture phenomena that are understood under the concept of heterochrony. The observation that evolutionary divergence between species often involves shifts in timing of developmental events has been introduced by Haeckel (1875), refined by De Beer (1940) and strongly popularized by Gould (1977). At least some of these shifts in relative timing are due to the changes in (relative) growth intercalating the developmental patterning events in question (relative to other parts, or to the ancestor). In the light of the current proposal these shifts may be explained by the stronger evolvability of periods of growth, relative to the evolvability of patterning periods.
It is only fair to note that the quasi-independent evolutionary change in size-related processes from generative processes does have limits at the macroevolutionary time scales. Interestingly, these limits may point us to interesting evolutionary interactions between the submaps: large changes in size may cause new metabolic demands that eventually need to be matched by changes in maintenance GP map. Similarly, the change in size may eventually require constructional changes that would be enabled by changes in the morphogenetic GP map (see below).
2. GP Maps, (Micro)Evolutionary Theory and the Long-Term Evolutionary Change
From the above, it follows that the major types of organismal processes inherently contribute very unevenly to the amount of segregating variation in a population, and thus to the ability to respond to selection. The most variation of the three types of GP maps is generated, so I argue, by mutations affecting growth processes. In other words, although traits do not arise by growth alone, most of their population variation will be due to variation in growth. This has several implications. First, it means that growth processes are the most accessible to selection and consequently the most likely to undergo adaptive evolutionary change and contribute to evolutionary divergence. Second, this uneven contributions to heritable variation by the three GP maps means that there is an inherent divide in evolvability of, broadly speaking, the size and the body plan (for a mechanistic model of the latter concept see (DiFrisco and Wagner 2023)). This is a plausible explanation for the macroevolutionary patterns of diversity, where some organismal aspects readily evolve while others persist and are recognizable as homologs or body plan organization across a wide range of taxa and evolutionary time, not because they are selected for, but because they do not contribute to the selectable variation (overlapping with “burden” sensu (Riedl 1978). This also answers the frequent argument that conservation of body plans is incompatible with the variational and population centered agenda of the New Synthetic Theory of evolution. Conservation in some respects does not imply lack of evolvability in other respects of an organismal body, the latter being the primary source of adaptation.
Note that the predictions of the tripartite GP model also lend specificity to the expectations of evolutionary developmental biology. While it is true that variation of adult traits must be generated in development, it is likely not the variation in early morphogenetic development that is responsible for the variation available to selection in adults. As most variation is in size, I will discuss this in the context of size variation. Theoretically, size variation can arise at any time during development, as not all heritable variation in size arising during the morphogenetic stage is lethal. The evolutionary impact of early variation depends on its contribution to the additive variance at the specific stage, at which selection acts. If selection acts at the morphogenetic stage, such early variation in size is selectable. If the selection acts on the adult, the early variation is selectable only to the extent of its contribution to the additive genetic variance of the adult stage. Variation in long bone lengths of mice is a good example. Sanger et al. (2011) have shown that divergence in long bone lengths of adult inbred-strain mice LG/J and SM/J (divergently selected for adult body size) is determined by the growth rate during late, postnatal growth. Similarly, selection on longer bones by Marchini and Rolian (2018) resulted in accelerated postnatal growth rate. Although it is not known whether there is correlated variation with the size of condensations, such as was proposed by Atchley and Hall (1991), it is however likely that potential early variation is overwhelmed by the variation arising later in growth. This is consistent with previous findings that the mouse adult body size correlates poorly to very early developmental body size (Cheverud et al. 1983).
Together the three GP submaps generate a distribution of variation that in adults is dominated by variation generated in growth. Advantageous morphogenetic and metabolic changes may be rare or small but still exist. These changes are predicted to be pleiotropic affecting multiple regions, and thus likely changing the directions of morphospace along which growth occurs and produces (co)variation. The changes such as breaking of symmetries (e.g. left – right symmetry), divergence of segments along the body axis or divergence between sexes must have arisen by such rare reorganizing changes and have been selected for. It has been difficult so far to model how covariances due to pleiotropy evolve, but there can be little doubt that they do, eventually aligning the mutational variation with lines of persistent selection (“imitatory epigenotype” sensu Riedl (1978), see also Pavlicev et al. (2011)).
Given that selection can change the alignment of the pattern of variation, selection should also be able to preserve the processes that structure the patterns of variation. A multitude of recent studies have demonstrated a long-term preservation of variational structure, lasting far beyond species divergence (Houle et al. 2017; Rohner and Berger 2023; Holstad et al. 2024; Saito et al. 2024; Tsuboi et al. 2024; Rohner and Berger 2025). In other words, the divergence between populations and species is aligned with the variation within populations or species. The variation aligned with divergence includes not only genetic, but also mutational and non-heritable developmental variation. The latter in particular hints that the source of this variational pattern is the underlying GP map, through which any newly arising variation, mutational or otherwise, percolates. This appears surprising if we expect that this structure changes fast, but is perhaps less surprising, if we assume that the morphogenetic underpinnings tend to be slow evolving accept that the structure of GP map is itself adaptive (under external or internal selection).
It is thus important to emphasize that this account is not intended to downplay the role of selection or drift in evolutionary processes. These factors importantly affect the amount of genetic variance in the population, by acting on the available variation. It is apparent that selection and drift can only work on variation that is produced by the organisms in the population at the particular time. In the much longer term, they also shape the pattern of variation that organisms are able to produce (Pavlicev and Cheverud 2015). The outcome is thus clearly a consequence of interaction between the variational distribution arising in the GP maps and selection (keeping in mind the population-level parameters that affect the efficiency of selection, in particular when body size is affected- see e.g., Lynch 2010). Therefore, the full explanation of evolutionary change, or the lack thereof, clearly requires us to integrate the potential for generating variation with the external and populational factors acting on it. This paper is an attempt to systematically bring into the equation the patterns that the variation may take. It will be interesting to explore the effects of population-level dynamics, given these distributions of variation.
Importantly, this model enables us to reason- essentially without leaving the existing conceptual framework- why different traits or aspects of the phenotype will evolve at different rates and directions, and thus in the course of evolution generate a pattern of conserved phenotypic outcomes (either by constrained variation or by strong selection), within which other aspects can vary and adapt a great deal. This step would enable us to overcome the perceived gap between the structuralist and the functionalist views of evolution (Amundson 2005).
3. Conclusion and Outlook
In this manuscript, I proposed that instead of considering the GP map as a unitary process abstracting across all lifetime processes at different levels of organization, it is enlightening to break it down into the sub-maps of specific process-types, which together constitute the mosaic of a living organism. Different from the full GP map, these process types can be shown to be inherently associated with a certain degree of variability inherent to the logic of their function, resulting in decoupling of their evolutionary rates.
Very plausibly, these three basic types of GP maps may not represent a complete set, capturing all processes involved in the mapping from genetic to phenotypic level in all taxa. It is obvious that the current rendering is derived from the intuition coming from animals, in particular vertebrates. Other structures may be better suited for, say, plants or cilliates. Parts of physiology in particular have been less studied in this context, such as metabolism of growth, or the immune system. These have not been thought through here but are certainly evolving fast. Taxa with metamorphosis may also require different categorization, or different structuring of similar processes. Nevertheless, I think that the approach of decomposition transports an important general mechanistic idea. It considers organisms as composites of processes with structural interdependency between them and distinct inherent variation-structuring nature, which also draw on quasi-distinct genomic regions. Breaking the black box of GP map into groups of related mechanisms with different GP structure and separate genetic underpinning, allows us to study the contribution of these processes to evolvability of traits, while at the same time keeping some degree of heuristic abstraction.
Very little of the information presented here with respect to each of the three GP submaps and their variability, can be claimed to be entirely novel. On the contrary, many of the ideas synthesized here have been around for a long time. What is novel, is to put this information into a specific, common, perspective, and to see what this outcome allows us to do in the future. Individualizing the GP submaps allows us to articulate expectations about the molecular evolution of genes underlying the submaps on the one hand, and the expectations about the interactions between the submaps on the other hand. With respect to the latter, one idea presented above is that the evolution of size may be an important driver of the evolution of complex organismal structure. Because growth generates abundant variation, response to selection on size may drive organisms into a situation, where they reach the limits of their structure and or metabolic capacity. Hence previously deleterious changes in structure and maintenance may become advantageous for maintaining the organismal stability. In recent work, we have proposed that increase in metabolic requirements on the cells, which may be due to the increase in body size, may drive the need for metabolic complementation between cells, leading to the evolution of distinct tissues and organs, i.e. organizational novelties (Pavlicev et al. 2024). In such a scenario, the increase in complexity would follow from the increase in size, a pattern that has been suggested earlier (Bonner 1988; Bell and Mooers 1997; Bonner 2004). Breaking of other constraints, and the associated origins of other novelties could potentially follow similar logic, driven directly or indirectly from the local or global changes in organismal size.
The decomposition also implies that our focus on population variation likely has resulted in us primarily studying specific types of processes, namely the evolution of size-related traits. Our intuitions about evolutionary change are thus based on the GP maps of growth, with the greatest inherent potential to generate variation, and thus the most evolvable phenotypic aspect. Indeed, morphological size data is by far the most commonly studied data in evolutionary biology. Projecting the intuitions from size evolution onto other organismal aspects, such as body plan organization, may have led to inflated expectations about the explanatory power of these models, and as a consequence, to an overestimate of the role of selection. It is easy to imagine how this may lead to the dismissal of the influence of organismal systems structure on processes inherently evolving at different rates.
There is much to do. Understanding the above variety of GP map structures, in particular that of growth, will be a challenge on its own, even if much has been done on growth already. Including physiology in our thinking about mechanisms mediating variation in much the same way as development is currently featuring in this place alone, will be a key change, as physiology has been neglected compared to development. It may well turn out that we need several different maps for physiology, as mentioned above. The origin of specific GP map structures is also an open question, as well as their evolutionary change. This appears easier for some submaps than for the others. For example, the origin of the robust maintenance maps may have already been explained: selection for environmental robustness is predicted to result also in genetic robustness (i.e., Wagner et al. 1997; Meiklejohn and Hartl 2002). The question of the origin of the GP structure is harder to answer for the evolution of the morphogenetic submap.
This perspective is naturally opening more questions than it answers. The major hope is that answering them will lead to the long-sought conceptual continuity between branches of evolutionary biology (Amundson, 2005).
Disclaimer: My aim in this manuscript was to interconnect large topics of evolutionary biology. To do that, this perspective necessarily touches on many fields, where appreciable work has been accomplished, but which I do not review or cite. I am painfully aware of at least a part of this neglect, and I apologize to authors who may feel ignored. Any other approach would require either a much longer manuscript, or a much narrower emphasis.
Acknowledgments
The author acknowledges numerous invigorating discussions throughout the conceptualization and also the feedback on the formulation of this manuscript, by Günter P. Wagner. I have also profited immensely from the workshop, Evolvability: a unified concept in evolutionary biology, funded 2019-2020 by the Center of Advanced Science of the Norwegian Academy of Science and Letters, Oslo, and led by Thomas F. Hansen and Christophe Pelabon. In this workshop, many of the key organizing ideas in this presepctive started to form.
References
- Amundson, R. 2005. The changing role of the embryo in evolutionary thought : roots of evo-devo. Cambridge University Press, Cambridge ; New York.
- Arthur, W. 1997. The origin of animal body plans : a study in evolutionary developmental biology. Cambridge University Press, Cambridge, U.K. ; New York, NY, USA.
- Atchley, W.R.; Hall, B.K. A model for development and evolution of complex morphological structures. Biol Rev Camb Philos Soc 1991, 66, 101–157. [Google Scholar] [CrossRef] [PubMed]
- Baumann, G.; Shaw, M.A.; Buchanan, T.A. In vivo kinetics of a covalent growth hormone-binding protein complex. Metabolism 1989, 38, 330–333. [Google Scholar] [CrossRef] [PubMed]
- Bell, G.; Mooers, A. Size and complexity among multicellular organisms. Biological Journal of the Linnean Society 1997, 345–363. [Google Scholar] [CrossRef]
- Bonner, J.T. 1988. The evolution of complexity by means of natural selection. Princeton University Press, Princeton, N.J.
- Bonner, J.T. Perspective: the size-complexity rule. Evolution 2004, 58, 1883–1890. [Google Scholar] [PubMed]
- Bourg, S.; Bolstad, G.H.; Griffin, D.V.; Pélabon, C.; Hansen, T.F. Directional epistasis is common in morphological divergence. Evolution 2024, 78, 934–950. [Google Scholar] [CrossRef]
- Carter, A.J.; Hermisson, J.; Hansen, T.F. The role of epistatic gene interactions in the response to selection and the evolution of evolvability. Theor Popul Biol 2005, 68, 179–196. [Google Scholar] [CrossRef]
- Cheverud, J.M. Phenotypic, Genetic, and Environmental Morphological Integration in the Cranium. Evolution 1982, 36, 499–516. [Google Scholar] [CrossRef]
- Cheverud, J.M. Relationships among ontogenetic, static, and evolutionary allometry. Am J Phys Anthropol 1982, 59, 139–149. [Google Scholar] [CrossRef]
- Cheverud, J.M.; Ehrich, T.H.; Vaughn, T.T.; Koreishi, S.F.; Linsey, R.B.; Pletscher, L.S. Pleiotropic effects on mandibular morphology II: differential epistasis and genetic variation in morphological integration. J Exp Zool B Mol Dev Evol 2004, 302, 424–435. [Google Scholar] [CrossRef]
- Cheverud, J.M.; Routman, E.J. Epistasis and its contribution to genetic variance components. Genetics 1995, 139, 1455–1461. [Google Scholar] [CrossRef]
- Cheverud, J.M.; Routman, E.J. Epistasis as a Source of Increased Additive Genetic Variance at Population Bottlenecks. Evolution 1996, 50, 1042–1051. [Google Scholar] [CrossRef]
- Cheverud, J.M.; Routman, E.J.; Duarte, F.A.; van Swinderen, B.; Cothran, K.; Perel, C. Quantitative trait loci for murine growth. Genetics 1996, 142, 1305–1319. [Google Scholar] [CrossRef] [PubMed]
- Cheverud, J.M.; Rutledge, J.J.; Atchley, W.R. Quantitative Genetics of Development: Genetic Correlations among Age-Specific Trait Values and the Evolution of Ontogeny. Evolution 1983, 37, 895–905. [Google Scholar]
- Clemmons, D.R. Insulin-like growth factor binding proteins and their role in controlling IGF actions. Cytokine Growth Factor Rev 1997, 8, 45–62. [Google Scholar] [CrossRef]
- Cooper, K.L.; Sears, K.E.; Uygur, A.; Maier, J.; Baczkowski, K.S.; Brosnahan, M.; Antczak, D.; Skidmore, J.A.; Tabin, C.J. Patterning and post-patterning modes of evolutionary digit loss in mammals. Nature 2014, 511, 41–45. [Google Scholar] [CrossRef] [PubMed]
- de Bakker, M.A.; Fowler, D.A.; den Oude, K.; Dondorp, E.M.; Navas, M.C.; Horbanczuk, J.O.; Sire, J.Y.; Szczerbińska, D.; Richardson, M.K. Digit loss in archosaur evolution and the interplay between selection and constraints. Nature 2013, 500, 445–448. [Google Scholar] [CrossRef] [PubMed]
- De Beer, G. 1940. Embryos and ancestors. The Clarendon Press, Oxford,.
- DiFrisco, J.; Wagner, G. Body plan identity: A mechanistic model. Evolutionary Biology 2023, 49, 1–19. [Google Scholar] [CrossRef]
- Draghi, J.A.; Parsons, T.L.; Wagner, G.P.; Plotkin, J.B. Mutational robustness can facilitate adaptation. Nature 2010, 463, 353–355. [Google Scholar] [CrossRef]
- Galis, F. 2023. Evolvability of Body Plans: On Phylotypic Stages, Developmental Modularity, and an Ancient Metazoan Constraint in T. Hansen, D. Houle, M. Pavlicev, and C. Pelabon, eds. Evolvability. A Unifying Concept in Evolutionary Biology? MIT Press.
- Gjuvsland, A.B.; Hayes, B.J.; Omholt, S.W.; Carlborg, O. Statistical epistasis is a generic feature of gene regulatory networks. Genetics 2007, 175, 411–420. [Google Scholar] [CrossRef]
- Gjuvsland, A.B.; Vik, J.O.; Beard, D.A.; Hunter, P.J.; Omholt, S.W. Bridgin? the genotype-phenotype gap: what does it take? J Physiol 2013, 591, 2055–2066. [Google Scholar]
- Gould, S.J. 1977. Ontogeny and phylogeny. Belknap Press of Harvard University Press, Cambridge, Mass.
- Haeckel, E. Die Gastrula und die Eifurchung der Thiere. Jena. Z. Naturwiss. 1875, 402–508. [Google Scholar]
- Hallgrímsson, B.; Hall, B.K. 2005. Variation. Elsevier Academic Press, Amsterdam ; Boston.
- Hallgrímsson, B.; Jamniczky, H.; Young, N.M.; Rolian, C.; Parsons, T.E.; Boughner, J.C.; Marcucio, R.S. Deciphering the Palimpsest: Studying the Relationship Between Morphological Integration and Phenotypic Covariation. Evol Biol 2009, 36, 355–376. [Google Scholar] [CrossRef] [PubMed]
- Hammond, J.E.; Baker, R.E.; Verd, B. Modularity of the segmentation clock and morphogenesis. Elife 2025, 14. [Google Scholar] [CrossRef] [PubMed]
- Hansen, T.F.; Wagner, G.P. Modeling genetic architecture: a multilinear theory of gene interaction. Theor Popul Biol 2001, 59, 61–86. [Google Scholar] [CrossRef]
- Hendrikse, J.L.; Parsons, T.E.; Hallgrimsson, B. Evolvability as the proper focus of evolutionary developmental biology. Evol Dev 2007, 9, 393–401. [Google Scholar] [CrossRef]
- Holstad, A.; Voje, K.L.; Opedal, Ø.; Bolstad, G.H.; Bourg, S.; Hansen, T.F.; Pélabon, C. Evolvability predicts macroevolution under fluctuating selection. Science 2024, 384, 688–693. [Google Scholar] [CrossRef]
- Houle, D.; Bolstad, G.H.; van der Linde, K.; Hansen, T.F. Mutation predicts 40 million years of fly wing evolution. Nature 2017, 548, 447–450. [Google Scholar] [CrossRef]
- Huxley, J. 1932. Problems of Relative Growth. Dial Press, New York.
- Irie, N.; Sehara-Fujisawa, A. The vertebrate phylotypic stage and an early bilaterian-related stage in mouse embryogenesis defined by genomic information. BMC Biol 2007, 5, 1. [Google Scholar] [CrossRef]
- Lande, R. EVOLUTIONARY MECHANISMS OF LIMB LOSS IN TETRAPODS. Evolution 1978, 32, 73–92. [Google Scholar] [CrossRef]
- Lande, R. Quantitative Genetic Analysis of Multivariate Evolution, Applied to Brain:Body Size Allometry. Evolution 1979, 33, 402–416. [Google Scholar] [CrossRef]
- Lynch, M. Evolution of the mutation rate. Trends Genet 2010, 26, 345–352. [Google Scholar] [CrossRef] [PubMed]
- Marchini, M.; Rolian, C. Artificial selection sheds light on developmental mechanisms of limb elongation. Evolution 2018, 72, 825–837. [Google Scholar] [CrossRef] [PubMed]
- Mayer, C.; Hansen, T.F. Evolvability and robustness: A paradox restored. J Theor Biol 2017, 430, 78–85. [Google Scholar] [CrossRef]
- Meiklejohn, C.D.; Hartl, D.L. A single mode of canalization. 2002, 17, 468–473. [Google Scholar] [CrossRef]
- Meyer, R.D.; Mohammadi, M.; Rahimi, N. A single amino acid substitution in the activation loop defines the decoy characteristic of VEGFR-1/FLT-1. J Biol Chem 2006, 281, 867–875. [Google Scholar] [CrossRef] [PubMed]
- Nijhout, H.F.; Reed, M.C.; Budu, P.; Ulrich, C.M. A mathematical model of the folate cycle: new insights into folate homeostasis. J Biol Chem 2004, 279, 55008–55016. [Google Scholar] [CrossRef] [PubMed]
- Pavlicev, M.; Bourg, S.; Le Rouzic, A. 2023. The Genotype-Phenotype Map Structure and its Role in Evolvability in T. Hansen, D. Houle, M. Pavlicev, and C. Pelabon, eds. Evolvability: A Unifying Concept in Evolutionary Biology? MIT Press.
- Pavlicev, M.; Cheverud, J. Constraints Evolve: Context Dependency of Gene Effects Allows Evolution of Pleiotropy. Annual Review of Ecology, Evolution and Systematics 2015, 46, 413–434. [Google Scholar] [CrossRef]
- Pavlicev, M.; Cheverud, J.M.; Wagner, G.P. Evolution of adaptive phenotypic variation patterns by direct selection for evolvability. Proc Biol Sci 2011, 278, 1903–1912. [Google Scholar] [CrossRef]
- Pavlicev, M.; DiFrisco, J.; Love, A.C.; Wagner, G.P. Metabolic complementation between cells drives the evolution of tissues and organs. Biol Lett 2024, 20, 20240490. [Google Scholar] [CrossRef]
- Pavlicev, M.; Kenney-Hunt, J.P.; Norgard, E.A.; Roseman, C.C.; Wolf, J.B.; Cheverud, J.M. Genetic variation in pleiotropy: differential epistasis as a source of variation in the allometric relationship between long bone lengths and body weight. Evolution 2008, 62, 199–213. [Google Scholar] [CrossRef]
- Pavlicev, M.; Le Rouzic, A.; Cheverud, J.M.; Wagner, G.P.; Hansen, T.F. Directionality of epistasis in a murine intercross population. Genetics 2010, 185, 1489–1505. [Google Scholar] [CrossRef]
- Piasecka, B.; Lichocki, P.; Moretti, S.; Bergmann, S.; Robinson-Rechavi, M. The hourglass and the early conservation models--co-existing patterns of developmental constraints in vertebrates. PLoS Genet 2013, 9, e1003476. [Google Scholar] [CrossRef] [PubMed]
- Raff, R.A. 1996. The shape of life : genes, development, and the evolution of animal form. University of Chicago Press, Chicago.
- Reed, M.; Best, J.; Golubitsky, M.; Stewart, I.; Nijhout, H.F. Analysis of Homeostatic Mechanisms in Biochemical Networks. Bull Math Biol 2017, 79, 2534–2557. [Google Scholar] [CrossRef] [PubMed]
- Reed, M.C.; Thomas, R.L.; Pavisic, J.; James, S.J.; Ulrich, C.M.; Nijhout, H.F. A mathematical model of glutathione metabolism. Theor Biol Med Model 2008, 5, 8. [Google Scholar] [CrossRef] [PubMed]
- Riedl, R. 1978. Order in living organisms : a systems analysis of evolution. Wiley, Chichester ; New York.
- Riska, B. SOME MODELS FOR DEVELOPMENT, GROWTH, AND MORPHOMETRIC CORRELATION. Evolution 1986, 40, 1303–1311. [Google Scholar] [CrossRef]
- Riska, B. COMPOSITE TRAITS, SELECTION RESPONSE, AND EVOLUTION. Evolution 1989, 43, 1172–1191. [Google Scholar] [CrossRef]
- Riska, B.; Atchley, W.R. Genetics of growth predict patterns of brain-size evolution. Science 1985, 229, 668–671. [Google Scholar] [CrossRef]
- Riska, B.; Atchley, W.R.; Rutledge, J.J. A genetic analysis of targeted growth in mice. Genetics 1984, 107, 79–101. [Google Scholar] [CrossRef]
- Rohner, P.T.; Berger, D. Developmental bias predicts 60 million years of wing shape evolution. Proc Natl Acad Sci U S A 2023, 120, e2211210120. [Google Scholar] [CrossRef]
- Rohner, P.T.; Berger, D. Macroevolution along developmental lines of least resistance in fly wings. Nat Ecol Evol 2025, 9, 639–651. [Google Scholar] [CrossRef]
- Saito, K.; Tsuboi, M.; Takahashi, Y. Developmental noise and phenotypic plasticity are correlated in. Evol Lett 2024, 8, 397–405. [Google Scholar] [CrossRef] [PubMed]
- Sander, K. 1983. The evolution of patterning mechanisms: Gleanings from insect embryogenesis and spermatogenesis. Pp. 137-154 in B. Goodwin, N. Holder, and C. Wylie, eds. Development and Evolution. Cambridge University Press, Cambridge.
- Sanger, T.J.; Norgard, E.A.; Pletscher, L.S.; Bevilacqua, M.; Brooks, V.R.; Sandell, L.J.; Cheverud, J.M. Developmental and genetic origins of murine long bone length variation. J Exp Zool B Mol Dev Evol 2011, 316, 146–161. [Google Scholar] [CrossRef] [PubMed]
- Schut, P.C.; Cohen-Overbeek, T.E.; Galis, F.; Broek, C.M.T.; Steegers, E.A.; Eggink, A.J. Adverse Fetal and Neonatal Outcome and an Abnormal Vertebral Pattern: A Systematic Review. Obstet Gynecol Surv 2016, 71, 741–750. [Google Scholar] [CrossRef]
- Schut, P.C.; Eggink, A.J.; Cohen-Overbeek, T.E.; Van Dooren, T.J.M.; de Borst, G.J.; Galis, F. Miscarriage is associated with cervical ribs in thoracic outlet syndrome patients. Early Hum Dev 2020, 144, 105027. [Google Scholar] [CrossRef]
- Schwenk, K.; Wagner, P.G. Function and the Evolution of Phenotypic Stability: Connecting Pattern to Process. American Zoologist 2001, 41, 552–563. [Google Scholar] [CrossRef]
- Thompson, D.A.W. 1942. On Growth and Form. Cambridge University Press, Cambridge.
- Tickle, C. Molecular basis of vertebrate limb patterning. Am J Med Genet 2002, 112, 250–255. [Google Scholar] [CrossRef]
- Tickle, C. Vertebrate limb development and possible clues to diversity in limb form. J Morphol 2002, 252, 29–37. [Google Scholar] [CrossRef] [PubMed]
- Tickle, C.; Towers, M. Sonic Hedgehog Signaling in Limb Development. Front Cell Dev Biol 2017, 5, 14. [Google Scholar]
- Tsuboi, M.; Sztepanacz, J.; De Lisle, S.; Voje, K.L.; Grabowski, M.; Hopkins, M.J.; Porto, A.; Balk, M.; Pontarp, M.; Rossoni, D.; Hildesheim, L.S.; Horta-Lacueva, Q.J.; Hohmann, N.; Holstad, A.; Lürig, M.; Milocco, L.; Nilén, S.; Passarotto, A.; Svensson, E.I.; Houle, D.; et al. The paradox of predictability provides a bridge between micro- and macroevolution. J Evol Biol 2024, 37, 1413–1432. [Google Scholar] [CrossRef]
- Ulrich, C.M.; Neuhouser, M.; Liu, A.Y.; Boynton, A.; Gregory, J.F.; Shane, B.; James, S.J.; Reed, M.C.; Nijhout, H.F. Mathematical modeling of folate metabolism: predicted effects of genetic polymorphisms on mechanisms and biomarkers relevant to carcinogenesis. Cancer Epidemiol Biomarkers Prev 2008, 17, 1822–1831. [Google Scholar] [CrossRef]
- Ulrich, C.M.; Reed, M.C.; Nijhout, H.F. Modeling folate, one-carbon metabolism, and DNA methylation. Nutr Rev 2008, 66 (Suppl 1), S27–S30. [Google Scholar] [CrossRef] [PubMed]
- von Dassow, G.; Meir, E.; Munro, E.M.; Odell, G.M. The segment polarity network is a robust developmental module. Nature 2000, 406, 188–192. [Google Scholar] [CrossRef] [PubMed]
- Von Dassow, G.; Odell, G.M. Design and constraints of the Drosophila segment polarity module: robust spatial patterning emerges from intertwined cell state switches. J Exp Zool 2002, 294, 179–215. [Google Scholar] [CrossRef]
- Wagner, A. Robustness and evolvability: a paradox resolved. Proc Biol Sci 2008, 275, 91–100. [Google Scholar] [CrossRef]
- Wagner, G.P.; Altenberg, L. Perspective: Complex Adaptations and the Evolution of Evolvability. Evolution 1996, 50, 967–976. [Google Scholar] [CrossRef] [PubMed]
- Wagner, G.P.; Booth, G.; Bagheri-Chaichian, H. A Population Genetic Theory of Canalization. Evolution 1997, 51, 329–347. [Google Scholar] [CrossRef]
- Wagner, G.P.; Schwenk, K. Evolutionarily Stable Configurations: Functional Integration and the Evolution of Phenotypic Stability. Evolutionary Biology 2000, 31, 155–217. [Google Scholar]
- Wolf, J.B.; Leamy, L.J.; Routman, E.J.; Cheverud, J.M. Epistatic pleiotropy and the genetic architecture of covariation within early and late-developing skull trait complexes in mice. Genetics 2005, 171, 683–694. [Google Scholar] [CrossRef]
- Wolf, J.B.; Pomp, D.; Eisen, E.J.; Cheverud, J.M.; Leamy, L.J. The contribution of epistatic pleiotropy to the genetic architecture of covariation among polygenic traits in mice. Evol Dev 2006, 8, 468–476. [Google Scholar] [CrossRef]
Figure 1.
A scheme of heterogeneous GP map, composed of processes that contribute different amounts of phenotypic heritable variation, and thus confer different degrees of evolvability.
Figure 1.
A scheme of heterogeneous GP map, composed of processes that contribute different amounts of phenotypic heritable variation, and thus confer different degrees of evolvability.
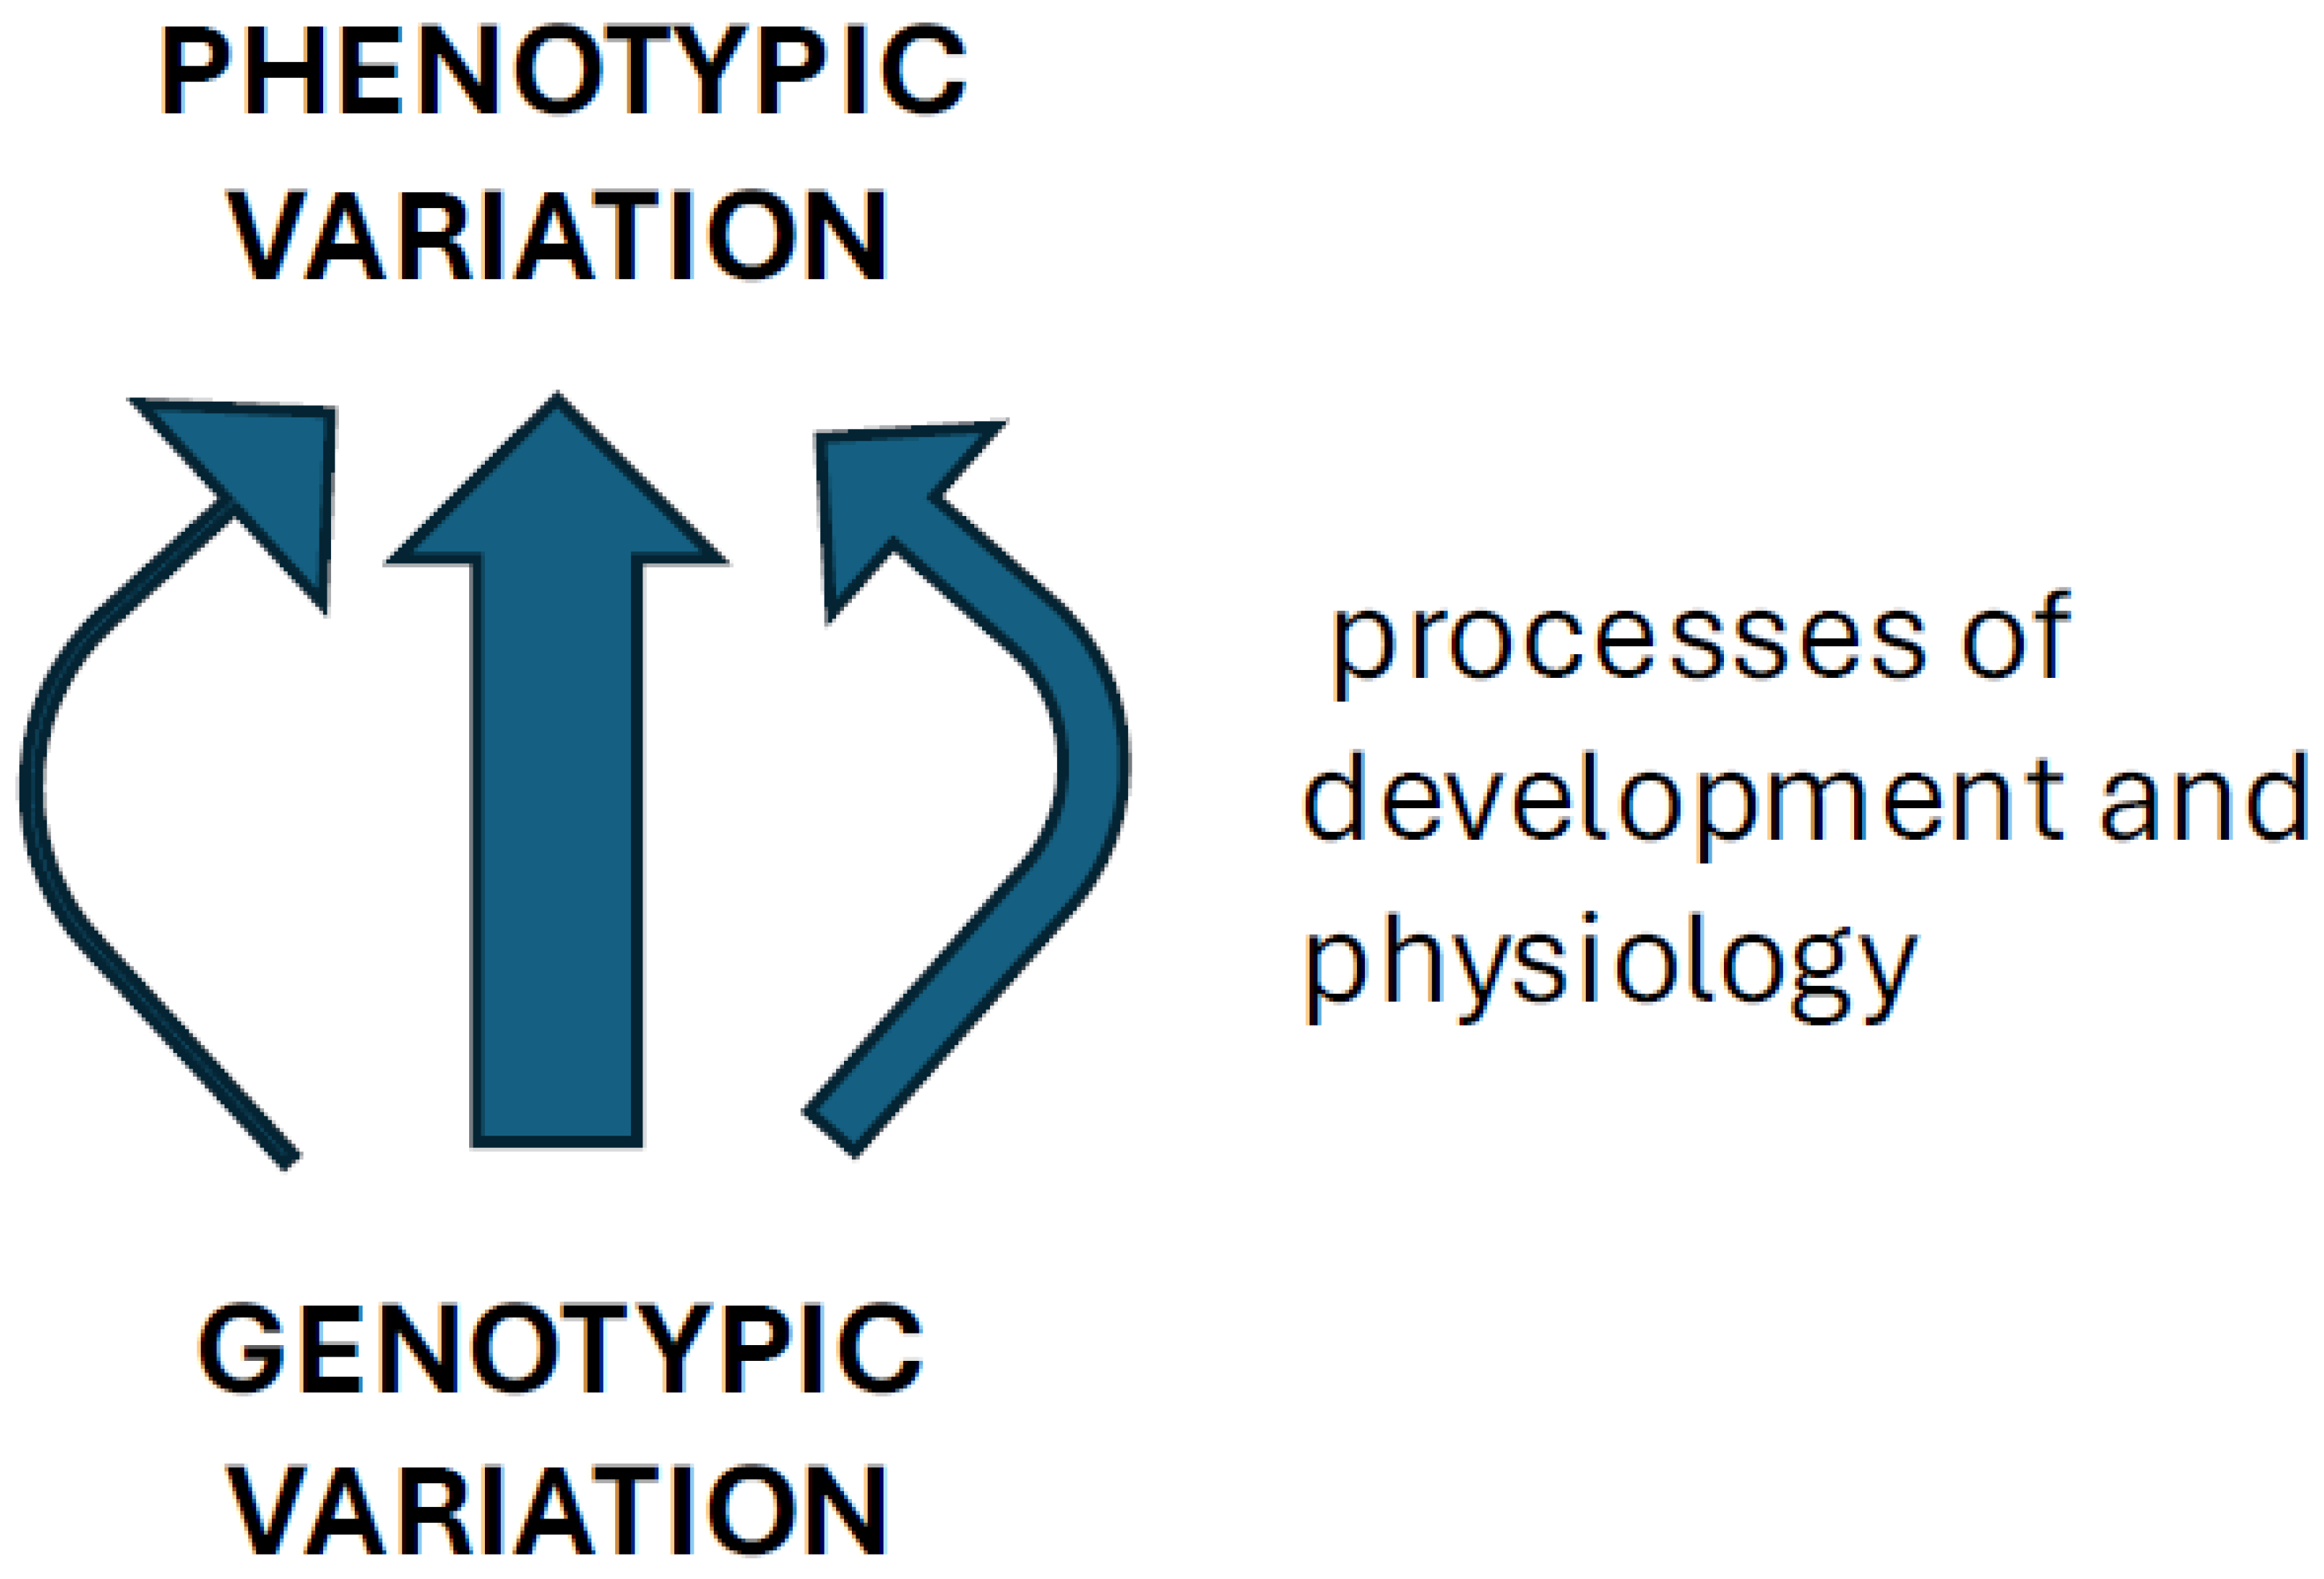
Figure 2.
A comparison of modular GP maps: on the left, the modular structure arises due to interactions between genes, on the right, it is due to the additive effects (as in Wagner and Altenberg 1996).
Figure 2.
A comparison of modular GP maps: on the left, the modular structure arises due to interactions between genes, on the right, it is due to the additive effects (as in Wagner and Altenberg 1996).
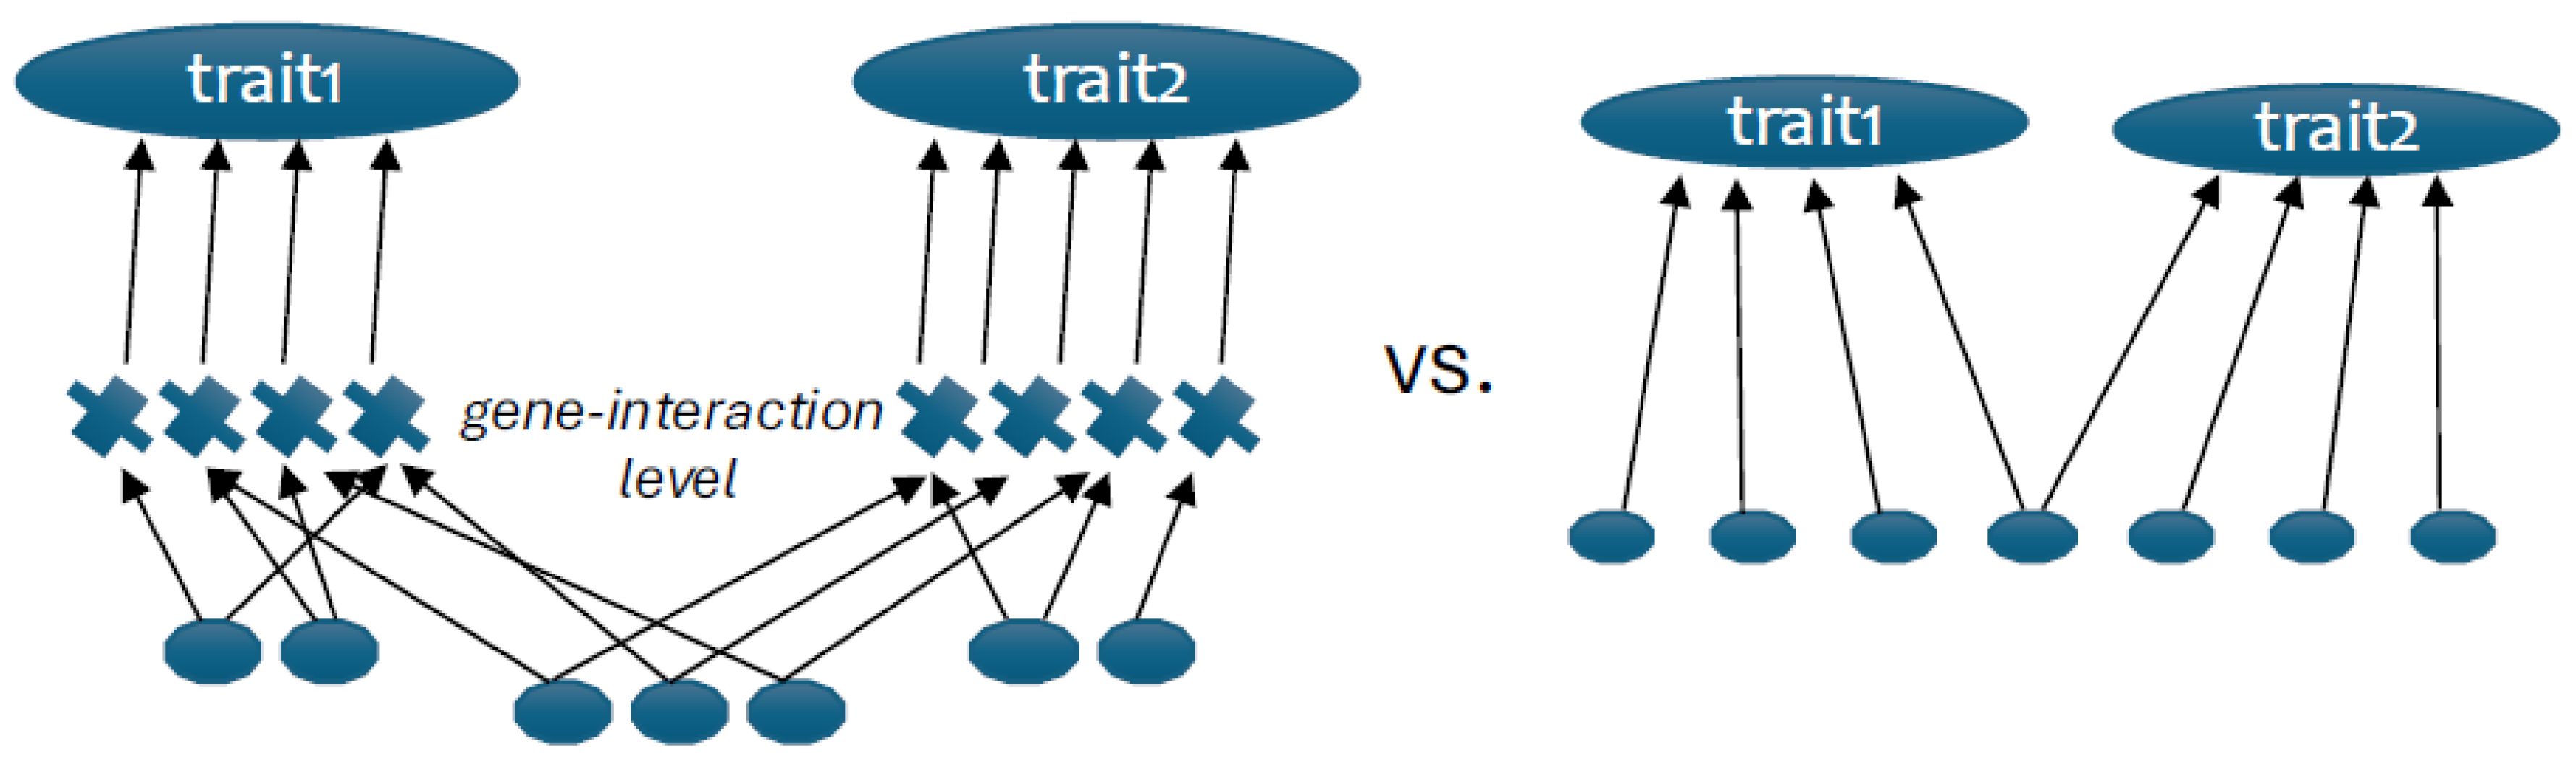
Figure 3.
A complete schematic presentation of the tripartite genotype-phenotype map, consisting of morphogenetic, growth and maintenance submaps, contributing in part at different times of development, and also allowing different degrees of variation due to their inherent structuring principles.
Figure 3.
A complete schematic presentation of the tripartite genotype-phenotype map, consisting of morphogenetic, growth and maintenance submaps, contributing in part at different times of development, and also allowing different degrees of variation due to their inherent structuring principles.
Disclaimer/Publisher’s Note: The statements, opinions and data contained in all publications are solely those of the individual author(s) and contributor(s) and not of MDPI and/or the editor(s). MDPI and/or the editor(s) disclaim responsibility for any injury to people or property resulting from any ideas, methods, instructions or products referred to in the content. |
© 2025 by the author. Licensee MDPI, Basel, Switzerland. This article is an open access article distributed under the terms and conditions of the Creative Commons Attribution (CC BY) license (http://creativecommons.org/licenses/by/4.0/).
Copyright: This open access article is published under a Creative Commons CC BY 4.0 license, which permit the free download, distribution, and reuse, provided that the author and preprint are cited in any reuse.


