
Submitted:
04 May 2025
Posted:
06 May 2025
You are already at the latest version
Abstract
Background/Objectives:Dobutamine stress echocardiography (DSE) is a non-invasive diagnostic method frequently used in daily practice to detect coronary artery disease. New echocardiographic techniques such as strain and strain rate quantify changes in myocardial contractility and can increase the accuracy of DSE. The primary objective of this study was to examine the correlation between visual assessment and longitudinal strain during dobutamine stress echocardiography. Methods: Our study was observa-tional and was conducted at the Cardiology Clinic of the University Clinical Center of the Republic of Srpska. It included 70 patients who underwent dobutamine stress echocar-diography.The patients were divided into two groups (diagnostic nd viable study). A visual assessment of segmental contractility of the left ventricle was performed, as well as an assessment of contractility with longitudinal strain (LS) during the test. Results:The median baseline LS of segments without impaired contractility in the diagnostic study was -20% (-21 to -18), and at the peak of the test -22% (-23 to -21). That was statistically significant (p< 0,05). The median baseline LS in the segments with impaired contractility was -17% (-18 to -16), and at the peak of the test, it was -13% (-15 to -12). That was statis-tically significant (p < 0,05). In the viability study, the average baseline LS in the segments with improved contractility was -8% (-11 to -7) and the peak of the test was -14% (-17 to -13). That was statistically significant (p < 0,05). The average baseline LS in the segments without improved contractility was -6% (-5 to -7), and at the peak of the test, it was -2% (-3-0). That was statistically significant (p < 0,05). Conclusion: Our study indicates a good correlation between a visual assessment of left ventricular segment contractility and lon-gitudinal strain during dobutamine stress echocardiography.
Keywords:
Dobutamine stress echocardiography
; diagnostic study
; longitudinal strain
; viability study
; visual assessment
1. Introduction
Dobutamine stress echocardiography (DSE) is a non-invasive diagnostic method frequently used in daily practice to detect coronary artery disease and assess the functional importance of angiographically proven coronary lesions [1].Visual assessment of regional left ventricular (LV) systolic function during DSE, although subjective, remains the clinical standard for interpreting echocardiography findings at rest and during stress. Visual assessment becomes particularly challenging during induced tachycardia atpeakstress [2,3,4,5,6]. Ischemia induced by DSE results in worsened regional wall motion abnormalities indicating significant coronary artery stenosis [7]. In addition, DSE has prognostic significance in chronic coronary disease, after myocardial infarction, and in the evaluation of patients before major non-cardiac surgery [8,9]. Numerous studies have proven the high sensitivity and specificity of DSE in detecting ischemic disease. In their study, Edgardo Beck et al.reported a sensitivity of 90% and a specificity of 84% in the diagnosis of ischemic disease [10]. To reduce subjectivity and accurately describe changes in regional myocardial performance during DSE, there was a need to introduce methods to better describe local myocardial deformation [11].
Strain and strain rate (SR) are new regional echocardiographic clinical indexes of myocardial deformations in the circumferential, longitudinal and radial directions based on SR imaging. They allow additional evaluation of rotation, i.e., twisting of the left ventricle, its shortening and thickening of its walls. Strain is a measure of the deformation or stress of a segment of the myocardium and is defined as the difference between the reached length and the initial length of the myocardium divided by the initial length, i.e., by the change in muscle length during myocardial contraction and relaxation expressed in percentages. It is analogous to the ejection fraction (if it is represented as a volume change relative to the initial volume) with the advantage that spatial and temporal determinants are included. Strain rate, or myocardial strain per unit of time, is the rate of changes in the length of the myocardium compared to the initial length based on the difference in velocity between two samples determined by speckle tracking echocardiography and divided by the distance between them [12].
Newer echocardiographic strain and strain rate techniques have provided quantitative data describing the contractile function of each ventricular segment [13,14]. Ischemia results in alonger time to the onset of systolic shortening, (t-S) known as tardokinesis;reduced systolic strain and strain rate(s); and post-systolic shortening, further shortening during isovolumic relaxation [15].The automated function imaging (AFI) technique can be performed during DSE, allowinga correct and nearly complete analysis of myocardial deformation at every stage of the stress protocol. AFI applied to DSE showed a feasibility of 77 to 100% [16].
The wider application of strain imaging (STI) in clinical practice has been limited by technical issues such as image quality, frame rate, and signal-to-noise ratio. In fact, this limitation may be particularly problematic at peak dobutamine doses [17].
The subendocardium is the most vulnerable part of the left ventricle (LV) to the effects of hypoperfusion and ischemia. In patients with coronary artery disease,the longitudinal LV mechanics at rest maybe impaired.
Liang et al.discovered that the peak longitudinal strain rate of 0.83 s⁻¹ and an early diastolic strain rate of 0.96 s⁻¹, measured using resting echocardiography, can predict over 70% coronary stenosis, achieving a sensitivity of 85% and a specificity of 64%. Additionally, speckle tracking-derived longitudinal strain is valuable in assessing the extent of coronary artery disease. Choi et al.found that a segmental mid and basal peak longitudinal strain cutoff value of 17.9% effectively differentiates severe 3-vessel or left main coronary artery disease from less severe conditions, achieving a sensitivity of 78.9% and a specificity of 79.3% [18,19,20].
Correlations between visual WMS (wall-motion score) and longitudinal global and regional strain have been reported in patients with myocardial infarction, non-coronary chest pain and dilated cardiomyopathy [21].
Strain imaging can predict myocardial viability. During DSE, viability is determined based on the improvementsin contractility orbiphasic response (22). The application of stress increases the sensitivity of viability assessment when differentiatingpassive movement. In the future, fast and accessible techniques may have an advantage over expensive methods such as cardiovascular magnetic resonanceand positron-emission tomography [23].
Normal GLS values are derived from 8 to 25 publications, which include 2,396 patients with a mean age of 42 years and a body surface area of 1.7 ± 0.2 m². The GLS values are -21 ± 2.6%.This range is similar to the vendor’s normal values (General Electric – 20±2,4%, Philips -20,1±2,4%, Siemens -20,0±2,7%). The global longitudinal strain reference values may vary in patients older than 60 years, gender, weight and blood pressure.The absolute GLS difference between men and women is >1% [24].
The objectives of this study were: 1. to examine the correlation between visual assessment and longitudinal strain during the DSE 2. to compare the longitudinal strain (LS) valuesofthe normokinetic, hypokinetic and akinetic segments of the left ventricle at rest and the peak of DSE in diagnostic study 3. to compare the longitudinal strain (LS) values of the normokinetic, hypokinetic and akinetic segments of the left ventricle at rest and the peak of DSE in viability study. 4. to examine changes in the longitudinal strain of the left ventricular segments during the diagnostic and viability studies.
2. Materials and Methods
Our study was observationaland included 70 patients who underwent Dobutamine stress echocardiography at the Cardiology Clinic of the University Clinical Center of the Republic of Srpska. The study was conductedfrom 1 January 2023 to 1 January 2024.
Ethical approval was obtained from the Ethics Committee of the University Clinical Center of the Republic of Srpska to ensure compliance withthe ethical standards and research protocols. The study adhered to the ethical principles outlined in the Declaration of Helsinki, focusing on the protection of patients’ rights, privacy and confidentiality throughout the study period.
One group of patients underwent DSE for ischemic disease (38 patients), and the other group for a viability test (32 patients) with a previous coronary event.
The study inclusion criteria for the diagnostic studywere as follows: suspected coronary heart disease, typical anginal pain,atypical anginal pain, risk factors for cardiovascular diseases, left bundle branch block and chest pain, previous coronary event and recurrent chest pain, and inconclusive ergometric test.
The indication for the viability test was the assessment of myocardial viability after a coronary event to perform revascularization.
The exclusion criteria were chest pain of unstable angina type or myocardial infarction, arrhythmic instability of the patient, cardiac decompensation, severe valvular heart diseases, and poor acoustic window.
All patients underwent DSE using a standard protocol with an incremental dobutamine infusion rate of 5, 10, 20, 30, and 40µ/kg/min every 3 minutes, and up to 1mg of atropine if the target heart rate (85% of the age-predicted maximum heart rate) was not achieved. Heart rate, blood pressure, 12-lead electrocardiography, and symptoms during DSE were recorded at each DSE stage. Beta-blockers and calcium channel blockers (non-dihydropyridines) were discontinued at least two days before the test.The criteria for terminating the test for ischemia were the completion of the protocol, development of new wall motion abnormality (WMA), severe chest pain, systolic blood pressure (SBP) >220 mmHg or diastolic blood pressure (DBP) >120mmHg, symptomatic hypotension and serious ventricular or supraventricular arrhythmias. The examinations were performed in the left supine position with a Vivid E9 scanner (GE Ultrasound). Complete 2-dimensional, color, pulsed, and continuous wave Doppler echocardiography was performed at rest according to standard techniques (11). Two cine loops from apical 4-, 3-, and 2-chamber views were recorded. All images were digitally stored on hard discs for offline analysis and the wall motion was evaluated using the 17–segment model. Incremental low-dose dobutamine infusion at a maximal rate of 20µg /kg/min was used in the assessment of the viability. Segmental wall motion at rest was scored on a four-point scale: (1) normokinetic (normal kinetics); (2) hypokinetic (decreased endocardial excursion and systolic wall thickening); (3) akinetic (absence of endocardial excursion and systolic wall thickening); and (4) dyskinetic or aneurysmal (paradoxical outward movement in systole) [25].Contrast agents were not used in this case.
The calculation of the LS parameters was done using the EchoPAC (Vivid 9) work station with the automated function imaging method.
We assessed the contractility of the left ventricular segment visually and by applying longitudinal strain before the test and at the peak of the test in diagnostic and viability stady. The DSE was performed by an experienced echocardiographer.
Statistics
Results were presented as frequency (percent), median (IQR) and mean ± standard deviation (SD). Statistical hypotheses were tested using the Mann-Whitney test, Wilcoxon test, and Kruskal-Wallis test. All p-values less than 0.05 were considered significant. Statistical data analysis was performed using IBM SPSS Statistics 22 (IBM Corporation, Armonk, NY, USA).
3. Results
Our study included 70 patients who were divided into two groups. 38 patients were referred for the diagnostic study and 32 patients for the viability study. The average age of the patients was 65.46±7.58 years. The study included 32% diabetics, 92% patients with arterial hypertension, 74% with hyperlipidemia and 18% smokers. The average BMI was 24.78 kgm2.The average EF was 51.68%,and the average LS value was -15.23%. A total of 1190 left ventricular segments at rest and peak of DSE were analyzed visually and using longitudinal strain. Table 1. presents a comprehensive demographic summary of the study population.
The mediana value of LS in normokinetic segments was -20% (-21 to -18), in hypokinetic segments -14% (-15 to -12), and -6% (-7 to -5) in akinetic segments.The median value of the longitudinal strain at the peak of the test was -22% (-23 to -21) in normokinetic segments, -13% (-14 to -12) in hypokinetic segments, and -4% (-5 to -3) in akinetic segments. These results are present in Figure 1.
The diagnostic study analyzed the value of the longitudinal strain of the segments visually assessed as segments with impaired and without impaired contractility.The average baseline LS of segments without impaired contractility in the diagnostic study was -20% (-21 to -18), and at the peak of the test -22% (-23 to -21). This difference was statistically significant (p<0,05).The average baseline LS in the segments with impaired segments was-17% (-15 to -12), and at the peak of the test, it was -13% (-15 to -12). This difference was statistically significant (p<0,05).At the peak of the test, the segments with impaired contractility had a smaller median longitudinal strain than those without impaired contractility. During the test, segments with impaired contractility showed a greater change of -5% (-6 to -4) in the median longitudinal strain than segments without impaired contractility, which showed -2 % (-1 to -3). Table 2. summarizes the results of the diagnostic stady.
The viability study analyzed segments with and without improved contractility. The average baseline LS in the segments with improved contractility was -8% (-11 to -7), and at the peak of the test it was -14% (-15 to -3) . This difference was statistically significant (p<0,05).The average baseline LS in the segments without improved contractility was -6% (-8 to -5), and at the peak of the test,it was -4% (-5 to -3).The change in the median longitudinal strain was significantly higher [-6% (-5 to -7)] than that inthe segments without improved contractility [-2% (-3 to 0)(p<5)]. Table 3. presents these results.
4. Discussion
A small number of studies have examined the relationship between the visual assessment of the contractility of the left ventricular wall segments and the longitudinal strain during Dobutamine stress echocardiography.
In our study, we recorded a decrease in the values of the longitudinal strain parameters of the left ventricular segments, which were described as normokinetic and hypokinetic during DSE.
Left ventricular segments that were visually described as hypokinetic and akinetic had lower longitudinal strain values both at rest and peak during dobutamine stress echocardiography.
Similar results were described by Karolina et al., who compared visual assessment and longitudinal strain during DSE. In this study, the longitudinal strain of normokinetic segments at rest was -16.33%±6.26, while at peak -15.37%±6.89. For hypokinetic the longitudinal strain at rest -13.05%±6.89, and at peak -11.37%±5.11, In akinetic segments the longitudinal strain at rest was -8.46%±5.69, and at peak -7.37%±3.92 [26].
In our study in DSE on ischemia, at the peak of the test in segments with impaired contractility, there was a decrease in longitudinal strain compared with baseline. The median LS at the peak of the test was lower in the segments with impaired contractility than in those with preserved contractility. Similar findings have beenreported by Karolina et al. The baseline longitudinal strain in segments with impaired contractility was-16% (-14 to -18),and -17% (-14 to -20), p=0.323 in segments without impaired contractility. Peak longitudinal strain insegments with impaired contractilitywas -9 % (-16- to -13), and in segments without impaired contractility, it was −16%(-11 to -21),p<0.001 [26].
Wierbowska-Drabik et al.demonstrated a significant drop in the longitudinal strain in the DSE peak. LS reduction was greater in the segments with impaired kinetics. Peak systolic longitudinal strain, measured by standard speckle tracking echocardiography (STE) andautomated function imagin gmethod, along with strain rate, varied between normokinetic and hypokinetic/akinetic leftventricularsegments. This was evident not only at rest but also during the peak stage of DSE, with normokinetic segments exhibiting the highest absolute values of systolic longitudinal strain (SLS) and systolic longitudinal strain rate (SLSR).The reduction in absolute SLS value during the stress test (calculated as the difference between peak stage and baseline) is more pronounced in segments with impaired contractility compared to those with a normal stress response. Baseline SLS in normokinetic segments was -16.5±5.9% and-15.9±7.5% at the peak of test. Baseline SLS in hypokinetic segments was -15±5.7%, and in akinetic segments -12.7±6.7%. SLS in hypokinetic segments at the peak of the test was -14.4±7.4%, and -13.7±8.9 in akinetic segments.In segments with contractility impairment during DSE, asignificant decrease in absolute SLS value was detected (from -16.6% to -14.1%, p<0.0011 for SLS-AFI) [27].
Voigt et al. examined the strain rate imaging (SRI) markers of stress-induced ischemia and analyzed their applicability in a clinical setting.The study included 44 patients with known or suspected coronary artery disease. Simultaneous perfusion scintigraphy served as a “gold standard” to define regional ischemia. All patients underwent coronary angiography. Segmental strain and strain rate were analyzed at all stress levels by measuring the amplitude and timing of deformation and visual curved M-mode analysis. Peak systolic strain rate increased significantly with dobutamine stress (-1.6±0.6s versus -3.4±1.4s, p<0.01) in nonischemic segments, while it was reduced in ischemic segments (-16%± 7% versus -10% ±8%, p< 0.05) [28].
Similar results were published by Ilardi et al., who investigated the accuracy of a global and regional longitudinal strain of left ventricular segments to detect significant coronary stenosis. In this study at the peak of stress, LS (p=0.037) and WMSI worsened (p=0.04) and showed a significant connection with coronary angiography in the diagnosis of coronary disease. When a single lesion was considered, peak stress LS and the left anterior descendeding artery (LAD) regional longitudinal strain (RLS) were lower in the obstructed LAD regions than in normoperfused territories (17.4±5.5 vs. 20.5±4.4%, p=0.03; 17.1±7.6 vs. 21.6±5.5%). The addition of RLS to regional WMSI was able to improve the accuracy of LAD significant coronary stenosis (SCS) prediction (AUC 0.68, p = 0.037). DSE strain analysis is feasible and may improve the prediction of LAD SCS, whereas regional WMSI assessment performs better in the presence of SCS of the circumflex artery (LCX) and the right coronary artery (RCA) [29].
In the group of patients who underwent DSE for viability, there was an increase in the longitudinal strain in the segments in which there was an improvement in the contractility of the left ventricular segments. Ismail et al. investigated myocardial viability in patients with ST-segment-elevation myocardial infarction after fibrinolytic therapy with low-dose DSE. The dobutamine-induced strain and strain rate were significantly higher in viable segments than innon-viable ones (10 out of 16 for S and 11 out of 16 for SR). A cutoff value ranging from -8.5 to -9.6% for the S identified viability in apical and mid-segments, whereas a cutoff value ranging from -11. 5 to -21.5% identified viability in basal segments [30]. In our study, LS was also higher in left ventricular segments with preserved viability.
The results of the study by Sharma et al. confirm that strain and strain rate values increase in viable segments during dobutamine stress echocardiography. Research has shown that peak longitudinal strain rate [AUC 0.83 (95% confidence interval (CI) 0.67-0.99], p = 0.001; optimal cutoff - 0.64 s-1 for sensitivity 0.87 and specificity 0.81), post-dobutamine peak longitudinal strain rate [AUC 0.94 (95% CI 0.87-1.00), p = 0.001; optimal cutoff - 0.85 s-1 for sensitivity 0.89 and specificity 0.77), change in peak longitudinal strain rate [AUC 0.93 (95% CI 0.86-1), p = 0.001; optimal cutoff - 0.2 s-1 for sensitivity 0.87 and specificity 0.87] predicted viability [31].
Hanafyet al. also confirmed in a study that included 60 subjects after myocardial infarction that dobutamine-induced peak longitudinal strain was greater in viable than in non-viable segments (< 0.001 for mid inferoseptum, p=0.001 for mid-inferolateral, and < 0.001 for all other segments) [32].
Hanekom and colleagues examined the significance of strain and strain rate in assessing myocardial viability with previous myocardial infarction. Viability was assessed by wall motion score index (WMSI) and by applying strain, end-systolic strain, and postsystolic strain. In this stady of 369 segments with abnormal resting function, 146 showed regional recovery. Non-viable segments had lower strain values strain, end-systolic strain and postsystolic strain values.
Application strain rate imaging parameters during DSE has impruved the sensitivity for prediction of functional recovery above WMS alone (82% versus 73%, P=0.015; area under the curve=0.88 versus 0.73, P<0.001), although specificities were comparable (80% versus 77%, P=0.2) [33].
Although speckle-tracking echocardiography provides quantitative data describing the contractile function of each ventricular segment and greater accuracy of segment assessment, visual assessment of contractility remains the gold standard. Speckle-tracking echocardiography improves the accuracy of dobutamine stress echocardiography [26].The novel AFI method appears faster, offering user-friendly polar maps of the left ventricle and thus a potential to become a useful clinical tool, outside the research setting [34].
5. Conclusions
Our study indicated a good correlation between a visual assessment of left ventricular segment contractility and longitudinal strain during dobutamine stress echocardiography. Longitudinal strain values were different in normokinetic, hypokinetic and akinetic segments at rest and the peak of the test. Changes in longitudinal strain values were greater in segments with impaired contractility in the diagnostic and viability studies. The application of longitudinal strain during dobutamine stress echocardiography increases the accuracy of these diagnostic methods. This imaging modality should be used in daily practice because it is available, reproducible, accurate, radiation and contrast-free and inexpensive.
6. Patents
This section is not mandatory but may be added if there are patents resulting from the work reported in this manuscript.
Supplementary Materials
The following supporting information can be downloaded at the website of this paper posted on Preprints.org.
Author Contributions
Conceptualization, D.T. and M.M.; methodology., J. J.; software, S. K.; validation, A.M.L., M.M. and D.T.; formal analysis, A.M.L.; investigation, J.J.; writing—original draft preparation, D.T.; writing—review and editing, D.T.; visualization, N. N.; supervision, S.P.P.; All authors have read and agreed to the published version of the manuscript.
Funding
This research received no external funding.
Institutional Review Board Statement
This study was conducted in compliance with ethical research standards and received Institutional Review Board (IRB) approval from the University Clinical Center of Republic of Srpska (IRB protocol: 01-19-333-2/24, approval date 18. September 2024).
Informed Consent Statement
Informed consent was obtained from all subjects involved in the study.
Data Availability Statement
The data presented in this study are available on request from the corresponding author.
Conflicts of Interest
The authors declare no conflicts of interest.
Abbreviations
The following abbreviations are used in this manuscript:
| DSE | Dobutamin Stress Echocardiography |
| SR | Strain rate |
| AFI | Automated function imaging |
| STI | Strain rate imaging |
| WMA | Wall motion ambnormality |
| SBP | Systolic blood pressure |
| DBP | Diastolyc blood pressure |
| LS | Longitudinal strain |
| EF | Ejection fraction |
| GLS | Global longitudinal strain |
| STE | Speckle tracking echocardiography |
| SLS | Systolic longitudinal strain |
| SLSR | Systolic longitudinal strain rate |
| WMSI | Wall motion score index |
| SCS | Significant coronary stenosis |
References
- Hoffmann R, Lethen H, Marwick T, Arnese M, Fioretti P, Pingitore A, et al. Analysis of interinstitutional observer agreement in interpretation of dobutamine stress echocardiograms. J Am Coll Cardiol. 1996;27(2):330-6. [CrossRef] [PubMed]
- Pellikka PA, Nagueh SF, Elhendy AA, Kuehl CA, Sawada SG. American Society of Echocardiography. American Society of Echocardiography recommendations for performance, interpretation, and application of stress echocardiography. J Am Soc Echocardiogr. 2007;20(9):1021-41. [CrossRef] [PubMed]
- Sicari R, Nihoyannopoulos P, Evangelista A, Kasprzak J, Lancellotti P, Poldermans D, et al. European Association of Echocardiography. Stress echocardiography expert consensus statement: European Association of Echocardiography (EAE) (a registered branch of the ESC). Eur J Echocardiogr. 2008;9(4):415-37. [CrossRef] [PubMed]
- Kasprzak JD, Paelinck B, Ten Cate FJ, Vletter WB, de Jong N, Poldermans D, et al. Comparison of native and contrast-enhanced harmonic echocardiography for visualization of left ventricular endocardial border. Am J Cardiol. 1999;83(2):211-7. [CrossRef] [PubMed]
- Hoffmann R, Marwick TH, Poldermans D, Lethen H, Ciani R, van der Meer P, et al. Refinements in stress echocardiographic techniques improve inter-institutional agreement in interpretation of dobutamine stress echocardiograms. Eur Heart J. 2002;23(10):821-9. [CrossRef]
- Sobkowicz B, Tomaszuk-Kazberuk A, Malyszko J, Kalinowski M, Hryszko T, Kralisz P, et al. Value of the real-time myocardial contrast echocardiography for risk stratification and for the detection of significant coronary stenosis in patients with end-stage renal disease. Nephrol Dial Transplant. 2007;22(2):668-9. [CrossRef] [PubMed]
- Lancellotti P, Pellikka PA, Budts W, Chaudhry FA, Donal E, Dulgheru R, et al. The clinical use of stress echocardiography in non-ischaemic heart disease: recommendations from the European Association of Cardiovascular Imaging and the American Society of Echocardiography. Eur Heart J Cardiovasc Imaging. 2016;17(11):1191-1229. [CrossRef] [PubMed]
- Vasey CG, Usedom JE, Woodard SM, Bhapkar M, Schwartz T, Koch GG. Prediction of cardiac mortality after myocardial infarction: the role of maximal treadmill stress echocardiography. J Am Soc Echocardiogr. 2001;14(1):38-43. [CrossRef] [PubMed]
- Picano E, Lattanzi F, Sicari R, Silvestri O, Polimeno S, Pingitore A, et al. Role of stress echocardiography in risk stratification early after an acute myocardial infarction. EPIC (Echo Persantin International Cooperative) and EDIC (Echo Dobutamine International Cooperative) Study Groups. Eur Heart J. 1997;18 Suppl D:D78-85. [CrossRef] [PubMed]
- Beck E, Santillán O, Cecconi G, De Cicco A, Krasnov C. Prueba de estrés con dobutamina. Especificidad y sensibilidad de la monitorización continua y entiempo real del segmento ST en 12 derivacionessimultáneas [Dobutamine stress test. Specificity and sensitivity of continuous ST-segment monitoring in 12 simultaneous standard ECG leads]. Rev EspCardiol. 2002;55(6):616-21. Spanish. [CrossRef] [PubMed]
- Heimdal A, Støylen A, Torp H, Skjaerpe T. Real-time strain rate imaging of the left ventricle by ultrasound. J Am Soc Echocardiogr. 1998;11(11):1013-9. [CrossRef] [PubMed]
- Marwick, TH. Measurement of strain and strain rate by echocardiography: ready for prime time? J Am Coll Cardiol. 2006 Apr 4;47(7):1313-27. [CrossRef] [PubMed]
- Urheim S, Edvardsen T, Torp H, Angelsen B, Smiseth OA. Myocardial strain by Doppler echocardiography. Validation of a new method to quantify regional myocardial function. Circulation. 2000;102(10):1158-64. [CrossRef] [PubMed]
- Geyer H, Caracciolo G, Abe H, Wilansky S, Carerj S, Gentile F, et al. Assessment of myocardial mechanics using speckle tracking echocardiography: fundamentals and clinical applications. J Am Soc Echocardiogr. 2010;23(4):351-69; quiz 453-5. [CrossRef] [PubMed]
- Pislaru C, Abraham TP, Belohlavek M. Strain and strain rate echocardiography. Curr Opin Cardiol. 2002 Sep;17(5):443-54. [CrossRef] [PubMed]
- Pellikka PA, Arruda-Olson A, Chaudhry FA, Chen MH, Marshall JE, Porter TR, Sawada SG. Guidelines for Performance, Interpretation, and Application of Stress Echocardiography in Ischemic Heart Disease: From the American Society of Echocardiography. J Am Soc Echocardiogr. 2020 Jan;33(1):1-41.e8. [CrossRef] [PubMed]
- Bansal M, Jeffriess L, Leano R, Mundy J, Marwick TH. Assessment of myocardial viability at dobutamine echocardiography by deformation analysis using tissue velocity and speckle-tracking. JACC Cardiovasc Imaging. 2010;3(2):121-31. [CrossRef] [PubMed]
- Reimer KA, Lowe JE, Rasmussen MM, Jennings RB. The wavefront phenomenon of ischemic cell death. 1. Myocardial infarct size vs duration of coronary occlusion in dogs. Circulation. 1977;56(5):786-94. [CrossRef] [PubMed]
- Liang HY, Cauduro S, Pellikka P, Wang J, Urheim S, Yang EH, et al. Usefulness of two-dimensional speckle strain for evaluation of left ventricular diastolic deformation in patients with coronary artery disease. Am J Cardiol. 2006;98(12):1581-6. [CrossRef] [PubMed]
- Choi JO, Cho SW, Song YB, Cho SJ, Song BG, Lee SC, et al. Longitudinal 2D strain at rest predicts the presence of left main and three-vessel coronary artery disease in patients without regional wall motion abnormality. Eur J Echocardiogr. 2009;10(5):695-701. [CrossRef] [PubMed]
- Liel-Cohen N, Tsadok Y, Beeri R, Lysyansky P, Agmon Y, Feinberg MS, et al. A new tool for automatic assessment of segmental wall motion based on longitudinal 2D strain: a multicenter study by the Israeli Echocardiography Research Group. Circ Cardiovasc Imaging. 2010;3(1):47-53. [CrossRef] [PubMed]
- Gorcsan J, Tanaka H. Echocardiographic assessment of myocardial strain. J Am Coll Cardiol. 2011;58:1401–13.
- Schinkel AF, Bax JJ, Geleijnse ML, Boersma E, Elhendy A, Roelandt JR, et al. Noninvasive evaluation of ischaemic heart disease: myocardial perfusion imaging or stress echocardiography? Eur Heart J. 2003;24(9):789-800.
- Marwick TH, Kosmala W, Strain Imaging Aplications and Techniques In ASE’s Comprehensive Strain Imaging, 1st ed. ; Marwick TH, Abraham TP, Eds.; Elsevier: Philadelphia, United States of America, 2022; Volume 1, pp. 4–5. [Google Scholar]
- Talib A, Cheese C, Elfgih I, et al. Assessment of myocardial viability: a review of current noninvasive imaging techniques. Int Cardiovascular Forum J. 2014;1:113–7.
- Karolina W, Soesanto AM, KuncoroBRMAS, Ariani R, Rudiktyo E, Sukmawan R. Comparison between Visual Assessment and Longitudinal Strain during Dobutamine Stress Echocardiography. J Cardiovasc Echogr. 2023;33(1):17-21. [CrossRef] [PubMed]
- Wierzbowska-Drabik K, Miśkowiec D, Kasprzak JD. Systolic longitudinal strain correlates with visual assessment of regional left ventricular function during dobutamine stress echocardiography and discriminates the segments with induced contractility impairment. Echocardiography. 2017;34(7):1020-1028. [CrossRef] [PubMed]
- Voigt JU, Exner B, Schmiedehausen K, Huchzermeyer C, Reulbach U, Nixdorff U, et al. Strain-rate imaging during dobutamine stress echocardiography provides objective evidence of inducible ischemia. Circulation. 2003;107(16):2120-6. [CrossRef] [PubMed]
- Ilardi F, Santoro C, Maréchal P, Dulgheru R, Postolache A, Esposito R, et al. Accuracy of global and regional longitudinal strain at peak of dobutamine stress echocardiography to detect significant coronary artery disease. Int J Cardiovasc Imaging. 2021;37(4):1321-1331. [CrossRef] [PubMed]
- Ismail M, Nammas W. Dobutamine-Induced Strain and Strain Rate Predict Viability Following Fibrinolytic Therapy in Patients with ST-Elevation Myocardial Infarction. Front Cardiovasc Med. 2015;2:12. [CrossRef] [PubMed]
- Sharma A, Sood A, Mittal BR, Vijayvergiya R. Assessment of myocardial viability using echocardiographic strain imaging in patients with ST-elevation myocardial infarction: comparison with cardiac PET imaging. J Echocardiogr. 2020 Dec;18(4):240-252. [CrossRef] [PubMed]
- Hanafy A,Soliman A, Elsaughier SM, Mansour HE, Salama MK, Gharib S. et al.Potential Prediction of Myocardial Viability Using Strain/Strain Rate at Low Dobutamine Stress Echocardiography on a Segment-by-segment Basis. The Egyptian Journal of Hospital Medicine. 2022; 88: 2503-2511.
- Hanekom L, Jenkins C, Jeffries L, Case C, Mundy J, Hawley C, Marwick TH. Incremental value of strain rate analysis as an adjunct to wall-motion scoring for assessment of myocardial viability by dobutamine echocardiography: a follow-up study after revascularization. Circulation. 2005 Dec 20;112(25):3892-900. [CrossRef] [PubMed]
- Wierzbowska-Drabik K, Hamala P, Roszczyk N, Lipiec P, Plewka M, Kręcki R, Kasprzak JD. Feasibility and correlation of standard 2D speckle tracking echocardiography and automated function imaging derived parameters of left ventricular function during dobutamine stress test. Int J Cardiovasc Imaging. 2014 Apr;30(4):729-37. [CrossRef] [PubMed]
Figure 1.
Longitudinalni strain and visual assessed contractilliy.
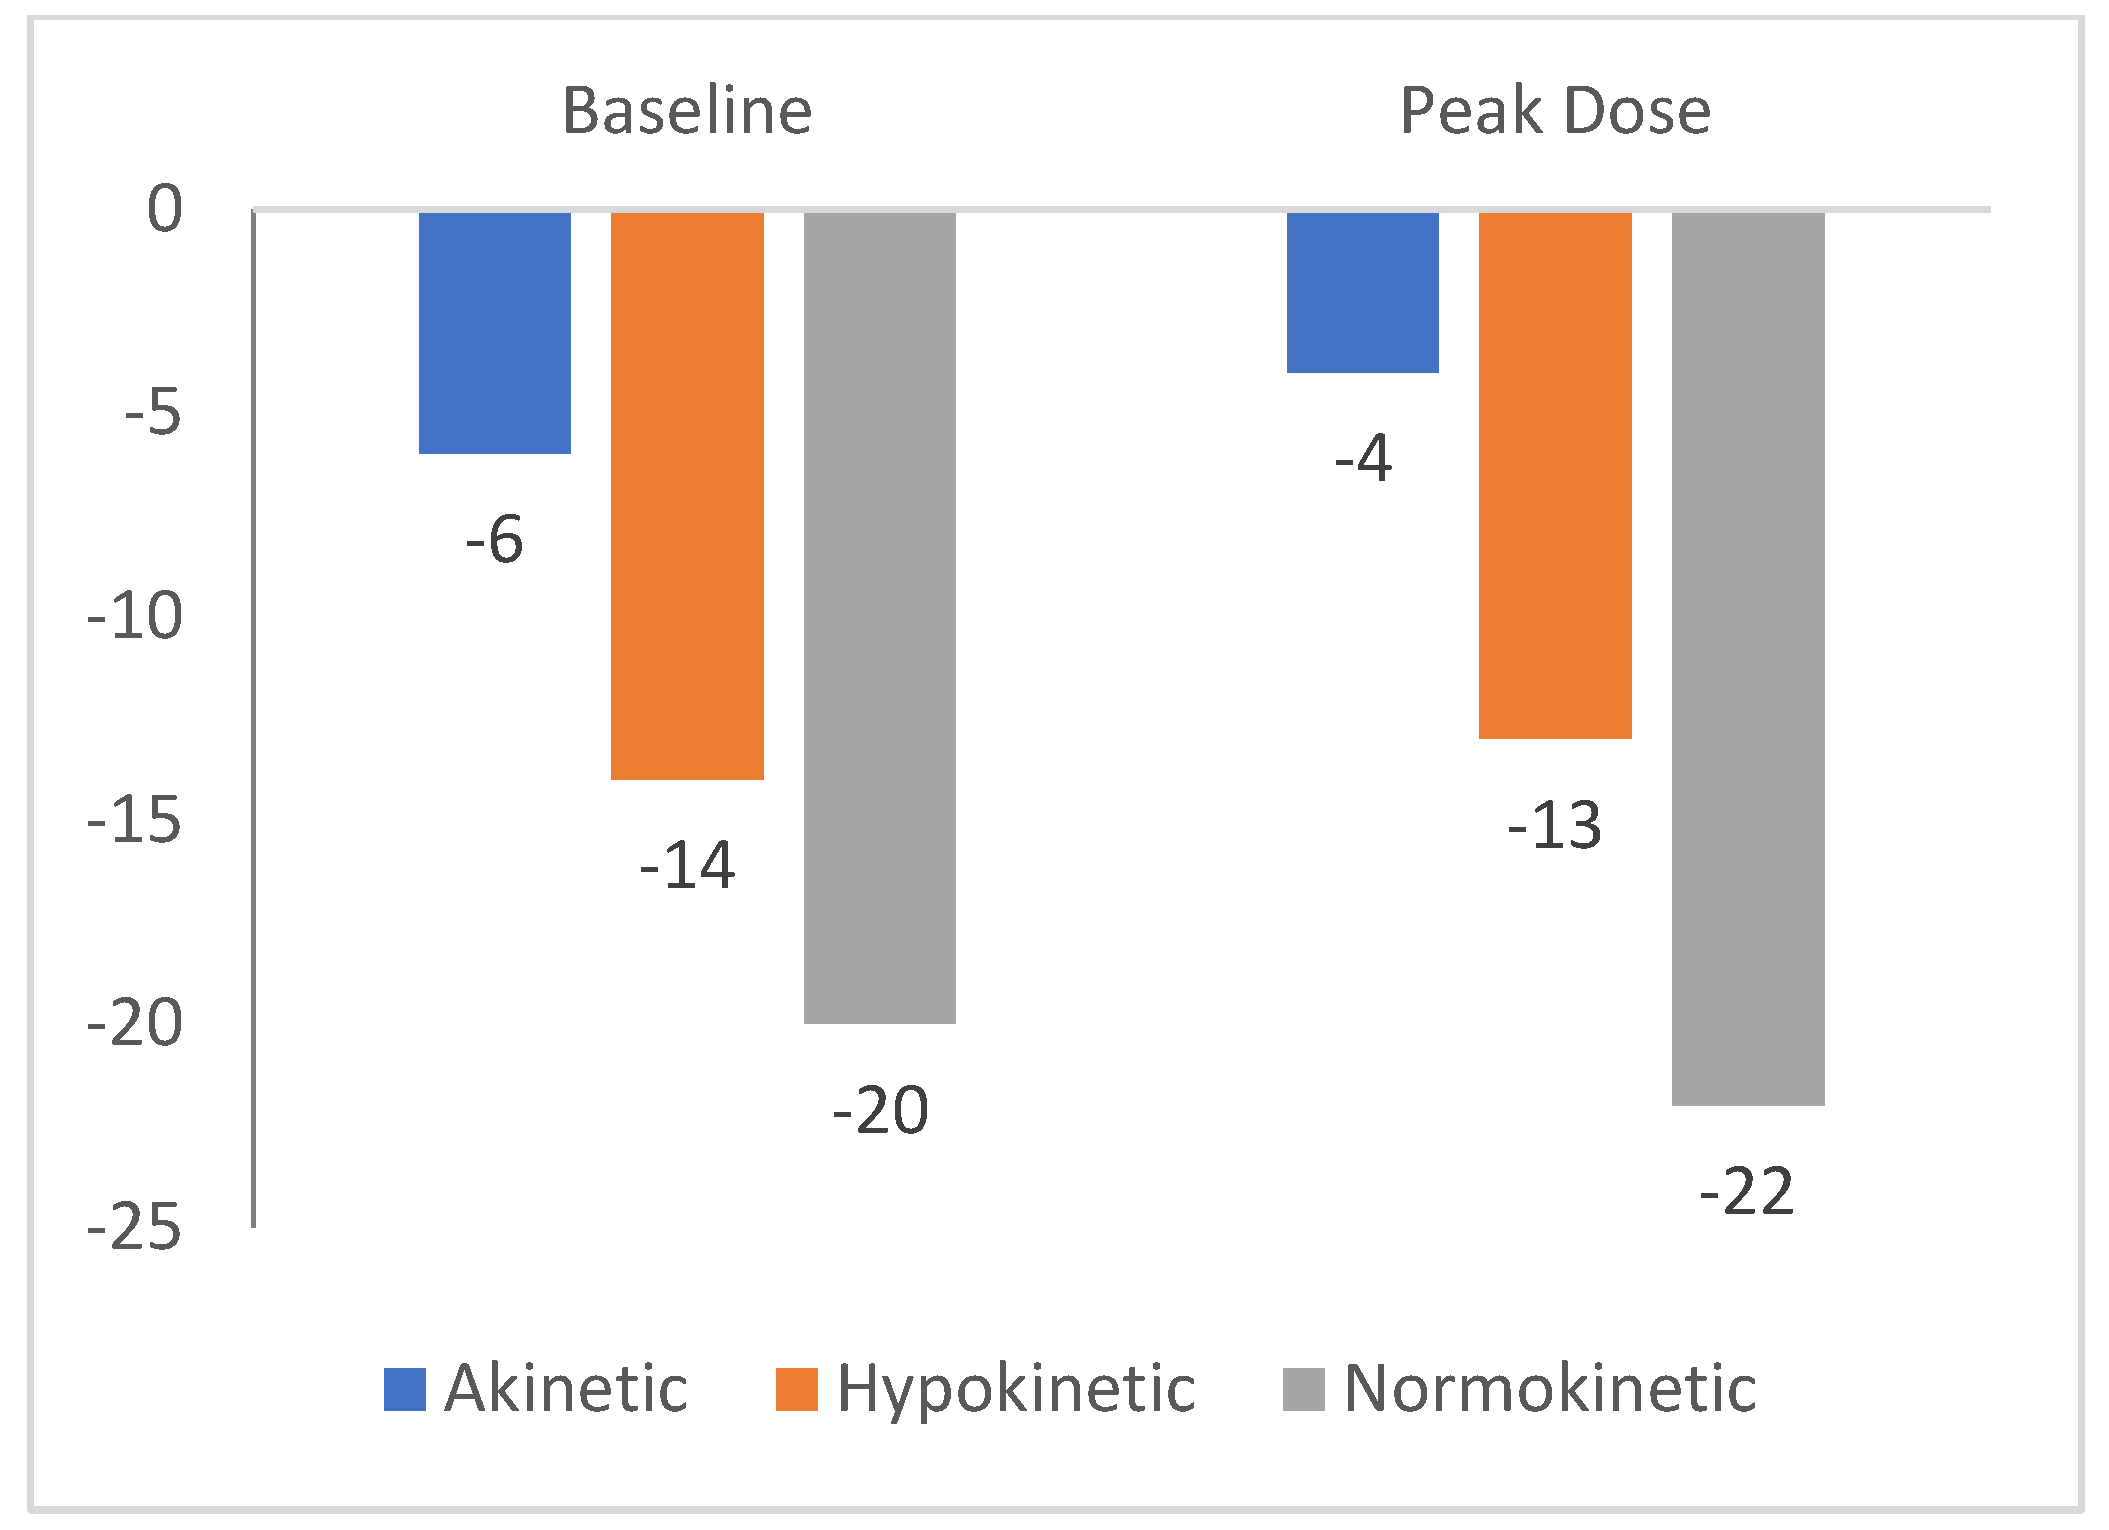

Table 1.
Clinical and echocardiography characteristics of the study population.
| Parameter | Value |
|---|---|
| Clinical characteristics | |
| Age(years) | 65.46 ± 7.58 |
| BMI (kg/m2) | 24.78 ± 1.93 |
| HTA, n (%) | 46(92%) |
| DM, n (%) | 16 (32%) |
| Smoking, n (%) | 9 (18%) |
| Dyslipidemia, n (%) | 12 (26) |
| Echocardiographicparameters | |
| LVEF baseline (%) | 51.68 ± 12.48 |
| GLS baseline (%) | -15.23 ± 9.95 |
Values are n(%) or mean±SD, SD=standard deviation, BMI=Body max index, HTA=Arterial hypertension, DM: Diabetes mellitus LVEF=Left ventricular ejection fraction, WMSI =Wall Motion Score Index, GLS= Global longitudinal strain.
Table 2.
Diagnostic study: comparison of longitudinal strain in baseline and peak dobutamin stress echocardiography.
Table 2.
Diagnostic study: comparison of longitudinal strain in baseline and peak dobutamin stress echocardiography.
| Parameter | Segments with impaired contractility (n=208) | Segments without impaired contractility (n=232) | p |
| Baseline longitudinal strain (%) | -17 (-18 to -17) | -20 (-21 to -18) | < 0.05 |
| Peak longitudinal strain (%) | -13 (-15 to -12) | -22 (-23 to -21) | < 0.05 |
| Changes longitudinal strain (%) | -5 (-6 to -4) | -2 (-1 to-3) | < 0.05 |
Values are median (IQR). IQR=interquartile range.
Table 3.
Viability study: comparison of longitudinal strain in baseline and peak dobutamine stress echocardiography.
Table 3.
Viability study: comparison of longitudinal strain in baseline and peak dobutamine stress echocardiography.
| Parameter | Segments with improved contractility (n=208) | Segments without improved contractility (n=232) | P |
| Baseline longitudinal strain (%) | -8 (-11 to -7) | -6 (-8 to -5) | < 0.05 |
| Peak longitudinal strain(%) | -14 (-17 to -13) | -4 (-5 to -3) | < 0.05 |
| Changes longitudinal strain (%) | -6 (-5 to -7) | -2 (-3 to 0) | < 0.05 |
Values are median (IQR). IQR=interquartile range.
Disclaimer/Publisher’s Note: The statements, opinions and data contained in all publications are solely those of the individual author(s) and contributor(s) and not of MDPI and/or the editor(s). MDPI and/or the editor(s) disclaim responsibility for any injury to people or property resulting from any ideas, methods, instructions or products referred to in the content. |
© 2025 by the authors. Licensee MDPI, Basel, Switzerland. This article is an open access article distributed under the terms and conditions of the Creative Commons Attribution (CC BY) license (http://creativecommons.org/licenses/by/4.0/).
Copyright: This open access article is published under a Creative Commons CC BY 4.0 license, which permit the free download, distribution, and reuse, provided that the author and preprint are cited in any reuse.


