
Submitted:
02 May 2025
Posted:
06 May 2025
You are already at the latest version
Abstract
Immunoglobulin A vasculitis (IgAV), previously known as Henoch-Schönlein purpura (HSP), is a type of nonthrombocytopenic small-vessel vasculitis. HSP is the most common systemic vasculitis in pediatric patients, and it is characterized by purpura, arthritis or arthralgia, gastrointestinal pain, and renal dysfunction. This study examines the clinical features of children diagnosed with HSP and investigates the association between infectious diseases, elevated IgE serum levels, and the development of HSP. This retrospective analysis also examines a range of demographic factors, such as sex, geographic and environmental influences, age, and medication, to evaluate their potential effects on the pediatric population impacted by HSP. The five-year hospitalbased retrospective analysis included 138 hospitalized children diagnosed with HSP during hospitalization. Blood sample analysis was conducted to assess various immunological parameters, including levels of immunoglobulins (IgA and IgE), complement components (C3 and C4), C-reactive protein, fibrinogen, the erythrocyte sedimentation rate (ESR), and allergen panels. Elevated IgE levels and normal IgA serum concentrations were found to be strongly associated with infectious diseases in pediatric HSP patients. Patients with recurrent infectious diseases exhibited consistently elevated IgE levels and normal IgA levels during treatment, with no allergens identified, alongside an increased risk of disease recurrence.
Keywords:
Henoch–Schönlein purpura
; IgA vasculitis
; allergic vasculitis
; infectious diseases
; hyper IgE
1. Introduction
Immunoglobulin E (IgE) antibodies are essential for defense against parasites and toxins and may also enhance anticancer immunity [1]. IgE is the primary mediator of allergic disease manifestations, including potentially fatal anaphylaxis [2,3,4]. Numerous pathological conditions can induce hyper-IgE. The function of IgE is mostly associated with the manifestation of allergy symptoms, which may subsequently lead to elevated serum levels. Elevated total IgE levels have been associated with hyper-IgE diseases, which are uncommon genetic immunological deficiencies [5]. Additional conditions, including infections, neoplasms, and autoimmune disorders, may also elevate IgE production [6].
1.1. The Role Consequences of Elevated Immunoglobulin E (IgE) Levels in the Pediatric Population
Atopic diseases represent the most prevalent syndromes of immunological dysregulation associated with increased serum IgE levels [7]. Numerous monogenic disorders have been identified over the past two decades, necessitating distinct clinical considerations and treatment strategies. Currently, various diseases are defined by specific genetic causes, with certain phenotypic similarities potentially arising from mutations in particular pathways [8]. Understanding the mechanisms behind increased IgE levels and infections in patients is essential. Given that the fundamental causes of increased total blood IgE levels in children remain inadequately comprehended, it is essential to elucidate the mechanisms and origins of elevated IgE levels and associated disorders [1].
In the pediatric population, the correlation between allergy symptoms and total serum IgE was found to be influenced by atopic status [9,10,11]. Additionally, individuals with occupational exposure to fine particles or gas exhibit elevated IgE levels compared to those without such exposure, leading to symptoms like rhinitis, wheezing, and persistent asthma [12]. According to recent research, total serum IgE concentrations decrease with age, with children and adolescents having the highest levels [1,7,11,13,14].
Hyper-IgE syndrome (HIES) encompasses a diverse array of congenital immune system abnormalities, characterized by heightened vulnerability to infections and eczema resulting from elevated serum IgE levels [15,16,17]. The pathophysiology of HIES is characterized by elevated IgE serum levels, leading to a varied cohort of individuals with uncommon primary immunodeficiency disorders (PIDDs) [18,19]. Patients may experience a range of disorders, including dermatitis, eczema, recurrent skin infections, and pulmonary infections. Additionally, they may face skeletal and connective tissue abnormalities like Henoch-Schönlein purpura (HSP), which are influenced by the predominant clinical symptoms associated with the various subtypes of HIES [13,20,21,22]. The prevalence and incidence of HIES are roughly 1:100,000 and 6–10 cases annually, respectively, with a balanced distribution between the sexes [23,24]. HIES has been associated with several distinct inborn genetic defects [18,25,26].
1.2. Incidence and Clinical Characteristics of Henoch-Schönlein Purpura (HSP)
Immunoglobulin A (IgA) vasculitis (IgAV), commonly referred to as HSP, represents a type of non-thrombocytopenic small-vessel vasculitis [27,28]. HSP represents the most prevalent type of systemic vasculitis observed in pediatric populations, marked by symptoms such as purpura, arthritis or arthralgia, gastrointestinal discomfort, and renal dysfunction [29,30,31]. Systemic IgAV can manifest at any age; however, it is most commonly observed in children between the ages of 3 and 15 years [31,32]. The data indicated that 90% of disorders beginning in childhood manifest prior to the age of ten [33,34]. Pathology is observed in 3–27 cases per 100,000 children, though it is relatively rare in infants [27,35].
While the precise mechanisms behind the development of Henoch-Schönlein Purpura (HSP) remain unclear, evidence from various tests and studies indicates a connection to the immune system. Observations such as the accumulation of IgA-dominant immune complexes in blood vessels, the presence of specific white blood cells in small blood vessels, and the degradation of these white blood cells point towards this disorder's immunological nature. Mucosal immunity is significantly dependent on IgA, a crucial class of immunoglobulin present in both serum and mucosal secretions [36]. IgA, characterized by its significant mucosal production and a brief half-life of 5-6 days, surpasses the total output of all other immunoglobulin classes combined [37]. As previously mentioned, the pathogenesis of HSP remains inadequately understood; however, numerous medical professionals recognize its frequent association with various viral infections, along with exposure to insect bites, vaccines, medications, or food allergies [38,39,40]. While the etiology of the disease remains elusive, it is evident that the IgA system is crucial in its progression. A variety of potential triggers have been identified, such as infections and medications [34,36,41].
The objective of this study is to assess clinical data from pediatric patients diagnosed with HSP and to explore the relationship between infectious diseases and increased IgE serum levels in the context of this condition. Furthermore, this longitudinal retrospective study investigates demographic factors such as sex, area/environment, age, and medication, and their influence on the pediatric HSP population. The study will highlight the essential clinical features of HSP associated with IgE serum levels and possible mechanisms of allergic reactions within the examined group.
2. Results
2.1. Descriptive Statistics
A retrospective hospital-based study was conducted over a five-year period, during which 138 patients were diagnosed with HSP. Out of the total cohort of 138 children, 81 were identified as males, constituting 58.69%, while 57 were identified as females, making up 41.30% of the sample. The male participants exhibited a mean age of 6.96 ± 0.411 years, which was slightly younger than the female participants, who had a mean age of 8.00 ± 0.536 years. The average age of the group was 7.39 ± 3.86 years. The results from the Kolmogorov–Smirnov and Shapiro–Wilk statistical tests indicate that the age distribution for both genders does not follow a normal distribution (p < 0.01 for both sexes). The median age of the entire cohort was 7 years, with females averaging 7 years and males averaging 6 years. The interquartile range (IQR) for the overall group was 6 years, with the IQR for females at 6 and for males at 5. The ratio of urban to rural patients was 1.46:1, with 82 urban patients and 56 rural patients.
Among the 138 patients included in the study, a significant proportion (65.21%) exhibited a moderate disease status, particularly within the urban patient group, while the smallest group of patients (7.97%) exhibited the mildest symptoms. Notably, severe manifestations were observed in 26.81% of patients, with a nearly equal distribution between urban and rural areas. Among patients diagnosed with severe HSP, 63.8% were male. Figure 1 illustrates the distribution of patients with varying severity levels of HSP alongside the environmental distribution.
The clinical study recorded the date of hospitalization to investigate the possible association between the occurrence of the pathology and seasonal allergens or infections, indicating that autumn had the highest patient count among all seasons, with 40 patients (28.98%). The number of hospitalized patients during the winter and spring showed a remarkable similarity, with 35 patients recorded in winter and 37 in spring. Notably, summer recorded the lowest hospitalization rate, with 26 patients representing 18.84%, and there were no patients displaying mild-severity symptoms during this season. Figure 2 presents the distribution of patients categorized by season and the severity of HSP.
2.2. Immunologic Panel Results
2.1.1. Principal Component Analysis Results
We investigated the potential correlations between serum levels of IgA and IgE within the patient cohort. Additionally, we incorporated inflammation markers into the Principal Component Analysis (PCA), including complement 3 (C3), complement 4 (C4), fibrinogen, erythrocyte sedimentation rate (ESR), and C-reactive protein (PCR). PCA was performed to investigate the relationships between IgE and IgA serum levels and the associated proinflammatory markers. The analysis indicated that the dataset was unsuitable for PCA, as evidenced by a Kaiser–Meyer–Olkin (KMO) measure of sampling adequacy of 0.432 while Bartlett’s test of sphericity produced a chi-square value of 612 with 28 degrees of freedom (p < 0.001). Further retesting concentrated on elements likely to exhibit correlation; in the end, we observed no significant correlation between IgE levels and C3, C4, fibrinogen, ESR, and PCA, despite substantial modifications to the parameters.
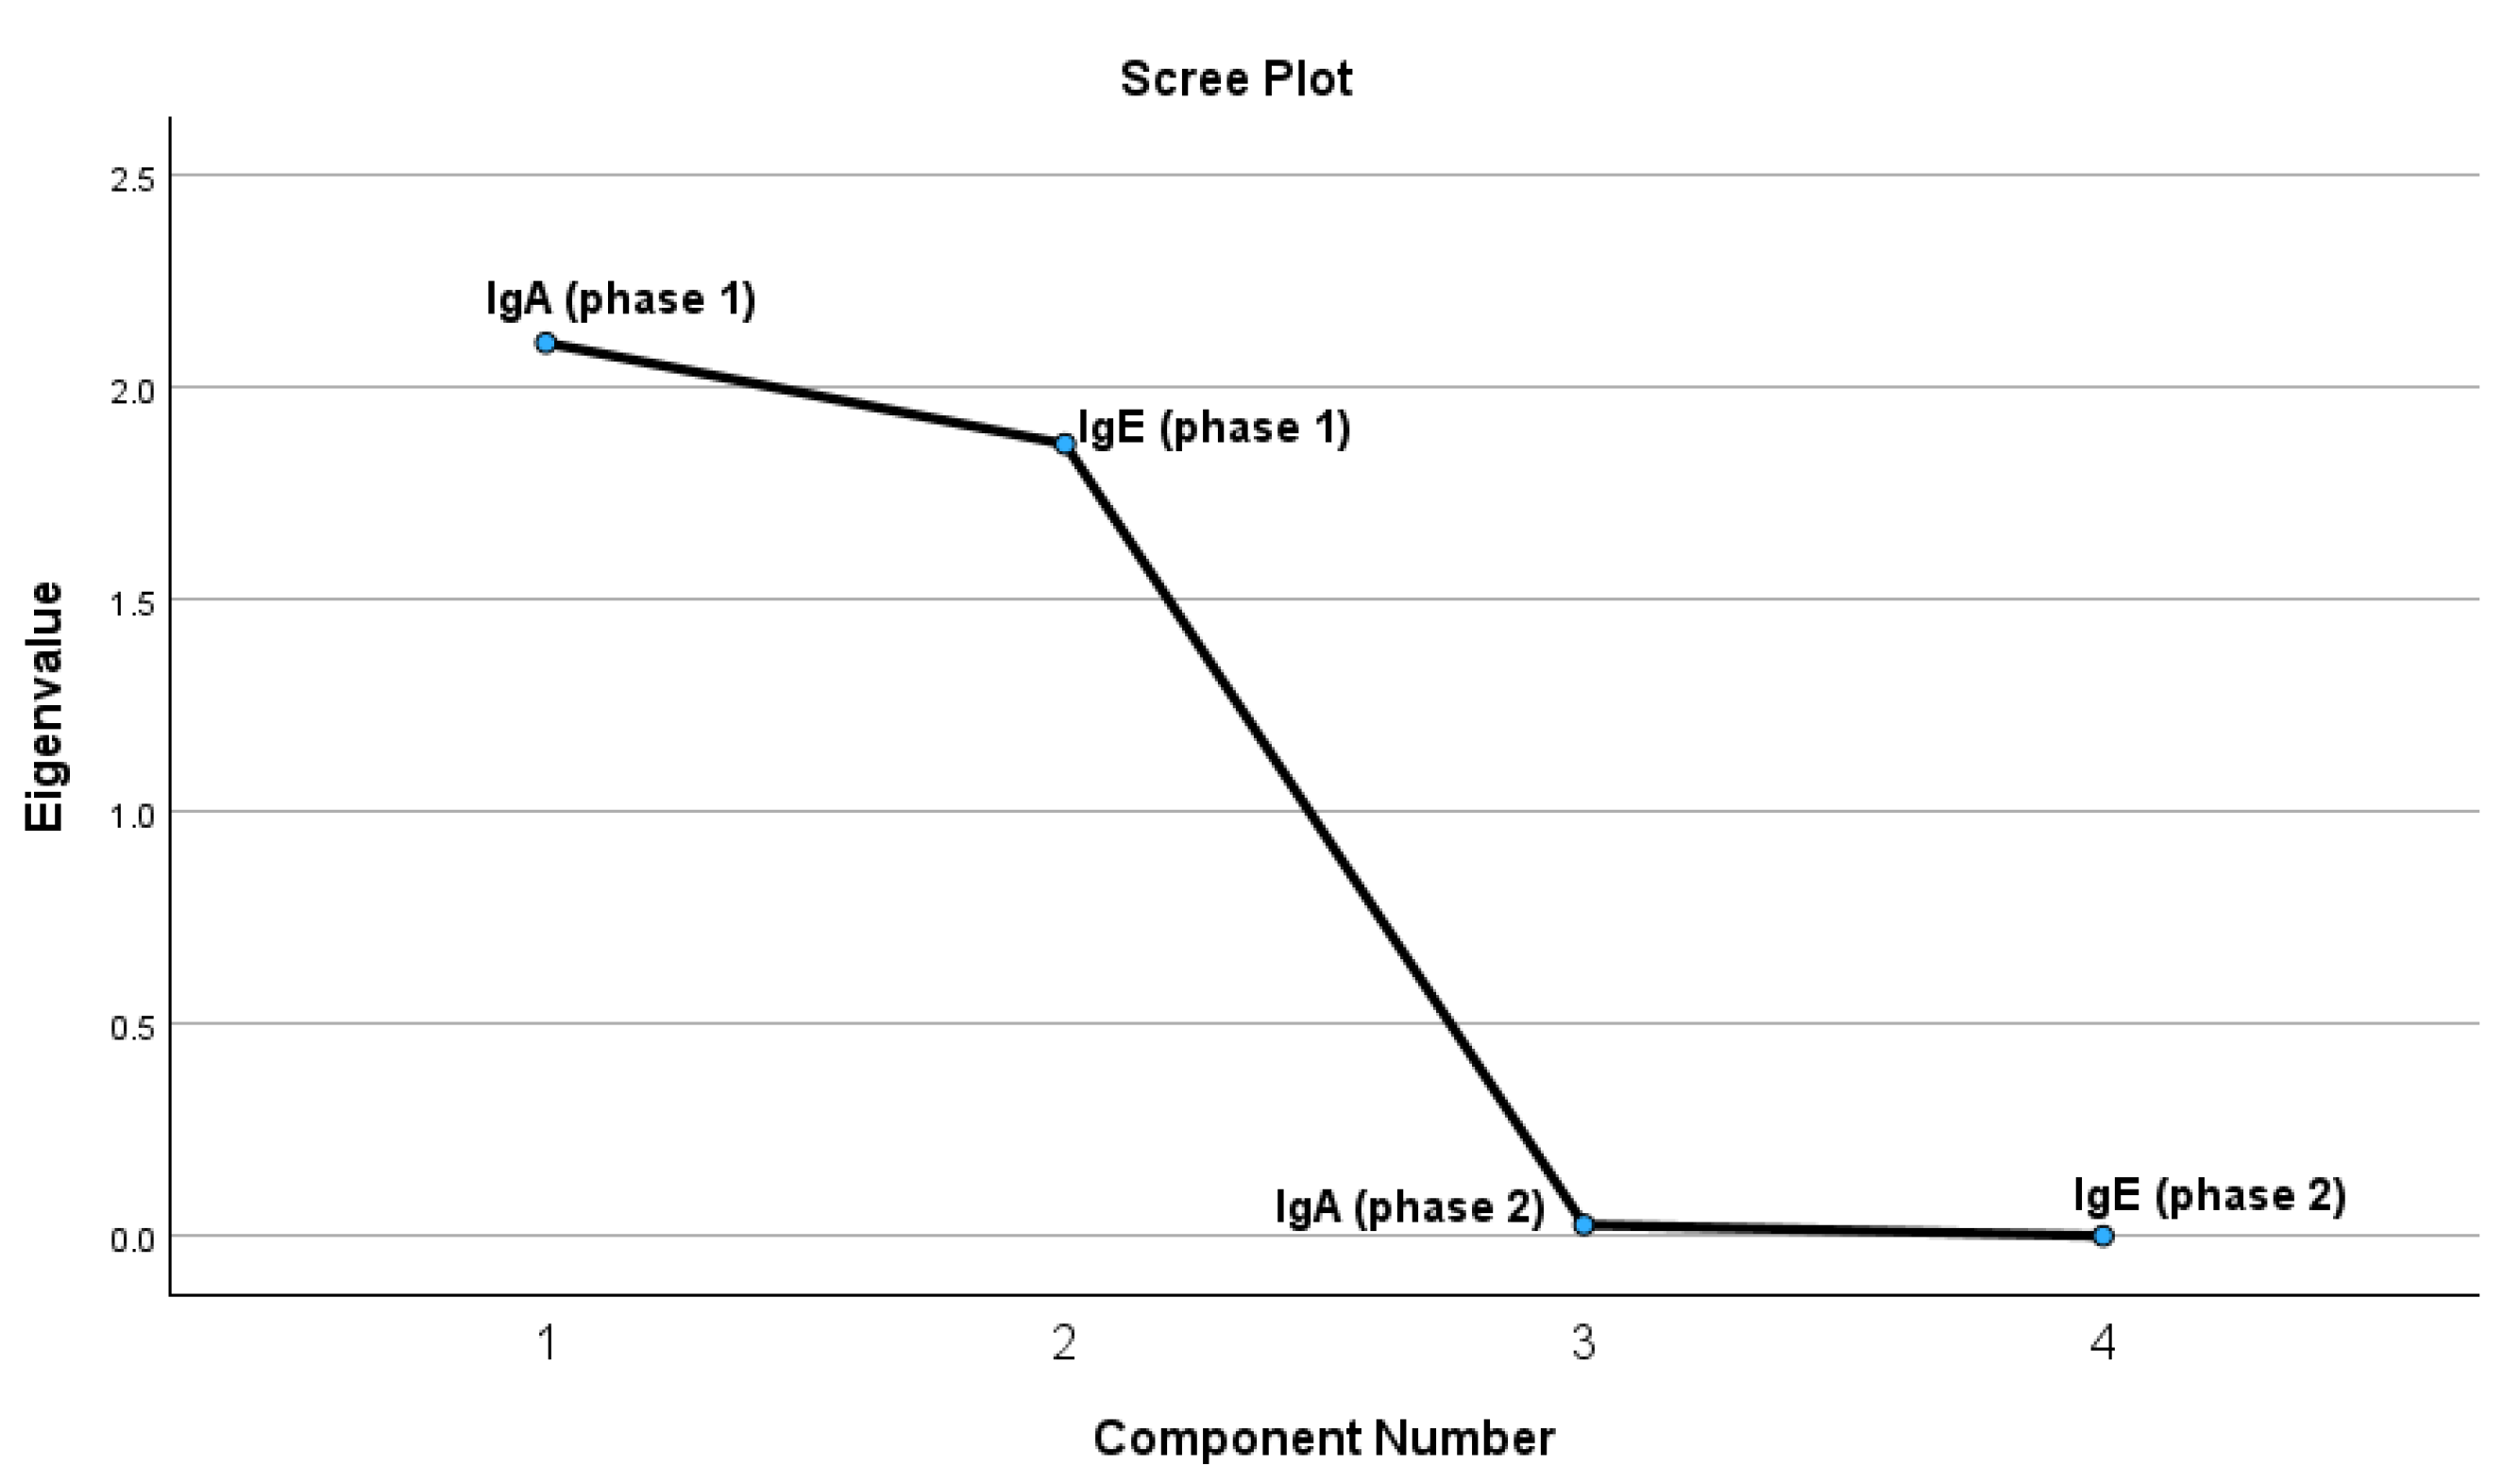
The test results indicate that four extracted components meet the criteria of having a correlation coefficient of 1 or higher. The PCA was conducted to investigate the relationships between IgA and IgE levels assessed during two distinct phases (Phase 1 and Phase 2). The Kaiser-Meyer-Olkin (KMO) measure of sampling adequacy was 0.491, suggesting a relatively low level of adequacy for conducting factor analysis. Nonetheless, the results of Bartlett’s Test of Sphericity were statistically significant (χ² = 1314.192, df = 6, p < 0.001), indicating the presence of correlations among the variables and validating the suitability of employing PCA. According to the Kaiser criterion (eigenvalues > 1) and the analysis of the scree plot, two components were identified that collectively explain a substantial portion of the total variance. The initial component exhibited elevated loadings for IgE variables across both phases (IgEph1 = 0.766; IgEph2 = 0.767), suggesting that it encapsulates a pattern predominantly associated with IgE. The initial component exhibited robust associations with IgE variables across both phases (IgEph1 = 0.766; IgEph2 = 0.767), suggesting that it predominantly embodies an IgE-centered pattern. The second component exhibited moderate to high loadings from IgA variables (IgAph1 = 0.737; IgAph2 = 0.707), suggesting a pattern that is more specific to IgA variation while still being affected by IgE. A robust and statistically significant positive correlation was identified between IgA levels in Phase 1 and Phase 2 (r = 0.972, p < 0.001), suggesting that individuals exhibiting elevated IgA levels in Phase 1 were likely to sustain comparable levels in Phase 2. Similarly, IgE levels in Phase 1 and Phase 2 showed an almost perfect positive correlation (r = 0.999, p < 0.001), indicating a significant stability of IgE concentrations across the phases.
Figure 3.
The graphic representation of the PCA test results for possible correlations.
2.1.2. The Statistical Analyses of IgA and IgE Serum Concentrations (g/L) for Both Patient Cohorts During Both Phases.
To explore possible immunological variations, two blood samples were obtained from each participant in the study (phase 1—the first sample was collected upon hospital admission; phase 2—the sample was taken 30 days after discharge). Additionally, the patients were categorized into two distinct groups: the first group included individuals diagnosed with an infectious disease as a secondary condition, whereas the second group consisted of those who did not present any infectious diagnoses at the time of admission. The examination of the immunological panel indicated that 54.34% of patients showed increased IgA levels, while 55.79% demonstrated elevated IgE levels. Furthermore, among the group with an infectious disease as a secondary diagnosis, 66.23% of patients exhibited increased IgE serum levels.
A paired sample t-test was used to ascertain if a statistically significant difference existed between the means of immunoglobulin serum levels recorded during the initial and subsequent periods of sample collection. The results demonstrated a substantial disparity between the means of each group. The results of the paired samples t-test indicate substantial differences in immunoglobulin serum levels between the initial and subsequent stages of sample collection. The average differences between the immunological markers IgA and IgE were substantial, with p-values under 0.05, signifying that the variations in immunoglobulin levels over time are statistically significant. The confidence intervals for these differences exclude 0, so reinforcing the relevance of these findings. Although all pairings achieved statistical significance, a notable discrepancy was present between the mean differences of pairs 1 and 2. Pair 1 consisted of the IgA serum levels in the group with a secondary diagnosis of an infectious condition, whereas Pair 2 encompassed the same parameter for patients without such a secondary diagnosis. The difference in means for Pair 1 was markedly low (0.04593), but Pair 2 demonstrated a substantially bigger difference in means (0.23983). Pair 3 and Pair 4 assess the serum IgE levels in patients with and without a future diagnosis of infectious diseases. The difference in means exhibited considerable disparities in both pairs. The mean difference for Pair 3 was -1.59322, whereas the mean difference for Pair 4 was -10.99458. These results are detailed in Figure 4 and Table A3.
Independent samples t-tests were performed to compare serum immunoglobulin levels (IgA and IgE) between two patient groups during the two phases. No statistically significant difference was detected between the groups for IgA at phase 1, t(136) = 1.413, p = 0.160, with a 95% confidence interval (CI) for the mean difference spanning from –0.119 to 0.713. At phase 2, a notable difference was seen, t(136) = 2.635, p = 0.009, revealing elevated IgA levels in one group, with a mean difference of 0.493 (95% CI: 0.123 to 0.862). Significant variations in IgE levels were seen at both time intervals. In phase 1, the assumption of homogeneity of variances was breached (F = 10.094, p = 0.002), and the modified t-test revealed a highly significant disparity, t(66.547) = 4.256, p < 0.001, with a mean difference of 166.76 (95% CI: 88.53 to 244.98). At phase 2, the assumption of unequal variance was upheld (F = 10.039, p = 0.002), and the group difference remained statistically significant, t(66.846) = 4.463, p < 0.001, with a mean difference of 176.02 (95% CI: 97.30 to 254.74). The findings demonstrate that although IgA levels distinctly distinguished the groups over time, IgE levels persistently exhibited significant differences, indicating a robust correlation with the existence of a secondary infectious disease. The results are presented in Figure 4 and Table A4.
3.3. Patients with Infectious Diseases as Secondary Diagnoses
This study employed the Receiver Operating Characteristic (ROC) curve to evaluate the diagnostic efficacy of serum IgE levels in differentiating between individuals with subsequent infection diagnoses after admission and those without. The ROC curve results revealed that IgA levels reached statistical significance, with an AUC of 0.817 and a standard error of 0.031, indicating an effective discriminative ability for diagnosing normal IgE levels in patients with infections, as outlined in Table 1 and illustrated in Figure 5. The Youden’s index is 0.556, with a ROC curve cutoff value of 88.615 g/L, indicating that the test possesses a satisfactory capacity to differentiate between positive and negative cases. Individuals exhibiting elevated IgE levels alongside infection as secondary clinical diagnoses were categorized as true positives (53 individuals), while those with elevated IgE levels without clinical infectious disease diagnoses were classified as false negatives (26 individuals). True negatives consisted of patients exhibiting normal IgE levels without any infections as secondary clinical diagnoses (53 patients), while false positives were made up of patients with normal IgE levels who had infections as secondary diagnoses (8 patients). The calculated sensitivity was 67.1%, while the specificity was determined to be 86.9%. The results suggest that the model serves effectively as a screening tool, successfully detecting around 67.1% of positive cases, while also demonstrating high reliability as a confirmatory test, accurately identifying about 86.9% of true negative cases. The positive predictive value (PPV) was 86.9%, indicating that over two-thirds of the patients who tested positive had normal IgA levels despite having an infectious disease. The negative predictive value (NPV) was 67.1%, suggesting that over two-thirds of patients exhibiting high IgA levels in their screening tests were not affected by infectious diseases.
3.4. Allergen Panel Results and Treatment Approaches
The study included an evaluation of potential digestive and respiratory allergens for each of the 138 participants who were enrolled. The Phadiatop test was utilized for screening, employing a multi-allergen allergosorbent to ensure dependable outcomes. Among the patients who tested negative (61), most exhibited negative results for all allergens in the panel. Nonetheless, two patients who were initially negative showed positive results for respiratory panel allergens, including pollen, epithelium, and hair. Furthermore, two individuals from the negative cohort indicated experiencing different types of allergic conditions, linked to non-specific atopic dermatitis and allergic urticaria. The remaining patients with negative outcomes exhibited negative test results across all panels for digestive and respiratory allergens. In contrast, patients with positive results exhibited favorable outcomes in the respiratory panels concerning hair, pollen, and epithelial cells. In relation to digestive allergens, individuals exhibiting elevated IgE levels were found to be positive for crab, shellfish, hazelnuts, cow’s milk, and peanuts. It is noteworthy that one patient exhibited a positive reaction to penicillin and xylin, while another tested positive for Isoprinosine, even though it was not specifically included in the allergen panel. A significant proportion of patients with positive food allergy tests exhibited a history of atopic dermatitis along with increased IgE levels. Figure 6 illustrates the allergen panel corresponding to the results of patients who tested positive.
Regarding treatment, nearly all patients (99.3%) were administered antihistamines, highlighting their crucial importance in managing symptoms. Approximately one-third of the patients (34.26%) received prescriptions for NSAIDs, presumably to manage pain and inflammation. In the cohort exhibiting moderate disease severity, corticosteroids were frequently administered, with 79.02% of individuals undergoing this therapeutic intervention. More than half of the patients (54.54%) received antibiotics, particularly in instances where bacterial infections were either confirmed or suspected. All individuals diagnosed with an infectious disease received antibiotic treatment, selected according to the antibiogram results. The antibiotics that were most commonly utilized comprised azithromycin (33.7%), ceftriaxone (32.6%), and cefuroxime (27.7%). The average duration of antibiotic courses was 7 days, with variations spanning from 3 to 21 days based on clinical requirements.
3. Discussion
3.1. Demographic Characteristics Correlated with HSP Manifestations
The prevalent etiopathogenic model for IgAV suggests that an abnormal immune response is triggered by various antigenic external stimuli in individuals with genetic susceptibility [36,42]. Our findings provide a more detailed understanding of the impact of IgA vasculitis (IgAV) on children, as well as the factors that may affect its onset and severity. This condition seems to stem from an atypical immune reaction, probably initiated by infections or allergens, particularly in children who possess a genetic predisposition [35,43,44]. Our findings indicate that more than 70% of the children diagnosed were under ten years old, with the majority of cases observed in the four to seven age range [28]. This developmental stage aligns with the period when numerous children begin their schooling or kindergarten experience, settings where they are inherently more susceptible to various infections [45,46]. Notably, a distinct seasonal pattern emerged. Most cases were observed in the autumn, coinciding with the start of the school year, indicating that heightened exposure to pathogens or allergens could be a contributing factor [42,47]. Conversely, summer exhibited the lowest number of cases, with all admissions in this period being relapses instead of new diagnoses. The reduced case numbers observed during the summer months may be attributed to the closure of schools, decreased exposure to infections, and overall, more favorable environmental conditions [42,48]. The children's residence also appeared to be important. A greater number of cases originated from urban areas, exhibiting a prevalence approximately 50% higher than that observed in rural regions. Urban children experienced higher rates of impact and were also more prone to moderate manifestations of the disease. This may be associated with increased population density, heightened exposure to pollutants or infections, or potentially improved access to healthcare services in urban areas [34,49]. Gender influenced the outcomes, with boys receiving diagnoses more frequently than girls and generally being somewhat younger at the time of diagnosis. It was observed that boys exhibited a higher propensity for developing severe symptoms [45]. These patterns could indicate variations in the responses of male and female immune systems to identical triggers; however, further investigation is essential for a comprehensive understanding [28].
3.2. Immune Response Profiles in Children with Henoch–Schönlein Purpura and Associated Infections
As previously stated, plasma cells in mucosa-associated lymphoid tissue (MALT) generate IgA, which is found in the nasopharynx, tonsils, and gastrointestinal mucosa [42]. Immune complexes which include IgA antibodies are generated as a reaction to antigenic exposure resulting from an infection or medication [27,50]. The investigation analyzed the immune response in the context of infectious diseases, contrasting individuals who were positive for different infections with those who were negative. The immunological response exhibited notable differences across the two phases, highlighting the influence of the time interval and infectious disorders on immunoglobulin levels [28,48,51]. This study investigated the potential relationships between IgA and IgE levels—two important proteins in the immune system—and prevalent inflammation markers in children diagnosed with HSP. This concentrated examination yielded more distinct insights. The PCA results revealed two primary patterns: the first was predominantly influenced by IgE levels at both time points, indicating that these levels exhibited a remarkably consistent trend throughout the phases [13]. The second pattern exhibited a stronger correlation with IgA levels, although there remained some overlap with IgE [52]. Our findings indicate that serum IgA levels are elevated in over half of the patients with HSP, especially among those exhibiting moderate to severe manifestations [16,38]. Additionally, these elevated levels are often observed in cohorts that do not have an infectious disease as a secondary diagnosis. The findings suggest that IgA serum levels generally stay within the normal range for patients admitted with an infectious disease as a secondary diagnosis. The findings suggest that IgA serum levels generally stay within the normal range for patients admitted with an infectious disease as a secondary diagnosis [42,47]. The most notable observation was the remarkable stability of both IgA and IgE levels throughout the duration of the study. Children exhibiting elevated levels in the initial phase generally sustained comparable levels in the subsequent phase, demonstrating near-perfect positive correlations. This indicates that both immunoglobulins remain relatively stable during the progression of the disease, which may be significant for tracking or forecasting disease dynamics [1,53,54]. Surprisingly, contrary to our expectations, we observed no significant associations between IgE and the conventional indicators of inflammation, even after exploring various combinations. This indicates that although IgE and IgA levels remain stable within individuals over time, they may not directly correlate with inflammation levels as indicated by markers such as CRP or ESR [28,42,55].
3.3. High IgE Levels Without Allergen Panel Positivity
The emergence of the mutation responsible for the excessive production of IgE in the body may also be affected by environmental factors [14,18]. Children in urban areas exhibit variations in their exposure to allergens and their sensitivity levels, influenced by geographical factors [5,23]. The prominence of this feature is underscored by the significant proportion of positive instances among patients from an urban environment (82 out of 138), as well as the contrast between the counts of positive and negative cases in urban compared to rural settings. A significant challenge currently confronting pediatricians, dermatologists, and infectious disease specialists is the issue of undiagnosed HIES [15,18,19]. To enhance the clinical panel, it is essential to keep total serum IgE levels within normal ranges from an early age. This approach has the potential to improve overall well-being and mitigate the risk of serious allergic responses [15,18]. An elevated IgE serum level (100 UI/mL ≥ IgE) typically suggests the presence of allergies, asthma, eczema, or chronic skin infections. However, most patients in this study with elevated IgE serum levels were found to have HSP associated with infections [13,23,50,52]. The findings of this study indicate that the connection between asthma, characterized by symptoms and bronchial responsiveness, and total IgE levels operates independently of specific IgE levels for prevalent respiratory allergens [56]. This study also investigated the potential of serum IgE levels as a valuable marker for detecting infections that arise following hospital admission in pediatric patients with HSP. Through ROC curve analysis, our findings indicate that IgE demonstrates significant potential in differentiating between patients who subsequently developed infections and those who did not. The findings indicate that IgE could be significant in the diagnostic process, providing essential assistance to clinical evaluation [7,52]. The test proved to be more effective in confirming the absence of infection. Instead of identifying every true case, its overall performance suggests that it can serve as a valuable resource in clinical environments [50]. Notably, increased IgE levels frequently correlated with the occurrence of infection, supporting the notion that variations in this immune marker may indicate an underlying infectious process. Conversely, certain patients exhibiting normal IgE levels subsequently developed infections, underscoring the necessity of not depending exclusively on IgE levels for diagnostic purposes [2,7,44]. IgE should be viewed as an integral component of a comprehensive diagnostic approach that encompasses clinical signs, patient history, and additional laboratory markers [48,56]. This study provides evidence that IgE plays a significant role in infection screening for children with HSP. Although it may not provide conclusive evidence by itself, it can significantly improve early detection and assist in directing timely and suitable management, especially in intricate situations where the clinical scenario is ambiguous [46].
It is noteworthy that within the cohort of patients who obtained negative results on allergen panels, a significant proportion exhibited consistently negative outcomes across both respiratory and digestive tests [16]. Nonetheless, a limited group revealed surprising results—two participants who initially tested negative exhibited sensitivity to respiratory allergens including pollen, animal epithelium, and hair. This indicates that, in certain instances, sensitization might not be readily observable, or that variations in exposure or immune response could impact the results of tests [14,57]. Furthermore, two patients with negative test results exhibited clinical symptoms of atopic conditions, such as non-specific atopic dermatitis and allergic urticaria, suggesting the potential for non-IgE mediated mechanisms or constraints in the sensitivity of allergen panels [9,57]. On the other hand, individuals with positive allergen panels exhibited reactivity primarily to respiratory allergens, particularly pollen, animal hair, and epithelial cells. Digestive allergens, specifically crab, shellfish, hazelnuts, cow's milk, and peanuts, were identified in a subset of cases exhibiting elevated IgE levels. A consistent observation among individuals with verified food allergies was a simultaneous history of atopic dermatitis and consistently high IgE levels, underscoring the recognized link between atopic disorders and food hypersensitivities [14,57].
3.4. High IgE Levels Without Allergen Panel Positivity
From a therapeutic perspective, antihistamines were almost universally prescribed, highlighting their pivotal role in managing symptoms [42]. The application of NSAIDs appeared to be more targeted, presumably focusing on alleviating pain and reducing inflammation [58]. Corticosteroids were mainly designated for individuals with moderate disease severity, highlighting their effectiveness in managing systemic inflammation and vascular involvement [46,59]. Over fifty percent of the group underwent antibiotic treatment, usually directed by clinical judgment or verification of a bacterial infection. In cases with confirmed infections, the selection of antibiotics was customized according to antibiogram findings, with azithromycin, ceftriaxone, and cefuroxime emerging as the predominant agents utilized. The results underscore the intricate nature of addressing HSP in children, especially in differentiating between IgE-mediated allergic reactions and various inflammatory stimuli [60,61,62]. Although a significant number of individuals in the cohort exhibited increased IgE levels, not every patient showed sensitization to allergens as indicated by standardized panels. This discrepancy highlights the necessity for thorough clinical assessment that goes beyond laboratory testing, particularly in the management of children presenting with overlapping allergic and infectious symptoms [28,48].
One significant limitation of this study is its retrospective nature, which resulted in IgA levels being assessed only once during hospital admission after the onset of clinical signs and again post-treatment during reevaluation. Consequently, elevated or standard IgA levels in patients exhibiting different manifestations of HSP could have been influenced by recurrent infections. To establish this association, IgA and IgE levels may be assessed before, during, and after infections, with ongoing monitoring over an extended timeframe. This investigation took place in a pediatric clinic and involved a thorough assessment of clinical observation sheets. The study did not include an analysis of IgA subcategories or socio-economic status, as this information had not been recorded beforehand.
4. Materials and Methods
4.1. Study Design
The clinical study was conducted as a hospital-based longitudinal retrospective study, involving 138 children aged 1 to 18 years, all of whom were admitted to the “Grigore Alexandrescu” Emergency Clinical Hospital for Children in Bucharest. Due to its status as both an emergency and university hospital, referrals came from various regions nationwide. An extensive search was conducted within the hospital's electronic medical database for pertinent records encompassing from January 1, 2018, to December 31, 2024. All children were previously referred for assessment due to HSP. The children diagnosed with HSP were categorized based on disease severity utilizing the classification criteria established by the European League Against Rheumatism (EULAR), the Pediatric Rheumatology International Trials Organization (PRINTO), and the Pediatric Rheumatology European Society (PRES) for HSP [32].
The samples were collected from venous blood to quantitatively measure the immunological panels, including IgA and IgE serum levels, as well as C3, C4, C-reactive protein, fibrinogen, ESR, and allergen panels for both respiratory and digestive allergens. A vacutainer, either anticoagulant-free or with separating gel, was used as the collection container. The measurement of immunological panel elements was conducted using an enzyme-linked immunosorbent assay (ELISA) [63,64,65,66]. The allergen panels were assessed through the Phadiatop test, utilizing a multi-allergen allergosorbent to ensure accurate outcomes [67,68]. Table A2 presents comprehensive information regarding the allergen panels associated with both digestive and respiratory allergens.
The collected patient files were entered into a database. The hospital database was used to collect information such as age, gender, environment, immunological panel (IgA and IgE), C3, C4, C-reactive protein, fibrinogen, and ESR clinical diagnosis and other associated diagnosis. The data were statistically evaluated, and the statistical tests applied are detailed in the ‘Descriptive Analysis of the Patients’ Series’ section (Section 4.2).
After the diagnosis of HSP, the assessment of disease severity (mild, moderate, or severe) was determined in accordance with the guidelines set forth by the EULARPRINTO/PRES. These organizations have delineated the current diagnostic criteria for systemic IgA vasculitis (IgAV) [30,32,69]. In a pediatric patient presenting with purpura, characterized as round or oval and retiform, predominantly on the lower limbs, the diagnosis is confirmed if at least one of the following four criteria is met: (1) abdominal pain, (2) histologically confirmed IgA deposits, (3) arthritis or arthralgia, or (4) renal impairment [30,32,69].
4.2. Descriptive Analysis of the Patients’ Series
4.2.1. Inclusion Criteria
The study included patients of both genders, aged between 1 and 18 years, who were admitted to the Pediatric Clinic of “Grigore Alexandrescu” Emergency Clinical Hospital for Children in Bucharest. The children had a prior diagnosis of HSP and underwent testing for their immunological panel, including IgA and IgE, as well as C3, C4, C-reactive protein, fibrinogen, and ESR. Every patient involved in the study exhibited an infectious disease within the six months leading up to their hospitalization. To maintain the integrity of the study, only patients with no prior history of COVID-19 infection were included, given the complex treatment protocols linked to the disease.
We classified “positive patients” as individuals exhibiting IgE serum levels exceeding the upper limit of the interval based on age-stratified reference values for IgE. We characterized “negative patients” as individuals exhibiting normal IgE serum levels in accordance with age-specific IgE reference values. The thresholds for IgE serum levels are established based on the ELISA Kit protocol and testing guidelines, as detailed in Table A1.
We characterized “mild” symptoms in children with HSP as the presence of rash/purpura (small, reddish-purple spots commonly found on the lower legs and gluteal area), joint pain (slight discomfort and swelling, typically affecting the knees and ankles), and digestive symptoms (intermittent mild abdominal pain that does not significantly impact appetite or daily activities).
We characterized “moderate” symptoms in children with HSP as those presenting with rash/purpura (more extensive purpura that may extend to the arms, face, and trunk, resulting in moderate discomfort), joint pain (more significant pain and swelling in multiple joints, potentially restricting mobility and daily activities), digestive symptoms (recurring abdominal pain, nausea, and occasional vomiting, which can affect appetite and daily routines), and kidney involvement (the presence of blood or protein in the urine, identifiable through urine tests, indicating moderate kidney involvement).
We classified “severe” symptoms in children with HSP as those characterized by rash/purpura (extensive and painful purpura covering large body areas), joint pain (intense pain and swelling in multiple joints, greatly affecting mobility and daily activities), digestive symptoms (acute abdominal pain, ongoing vomiting, and bloody stools, which may result in dehydration and necessitate medical attention), and kidney involvement (notable kidney damage, resulting in ongoing blood or protein in the urine, with the potential to advance to chronic kidney disease).
4.2.2. Exclusion Criteria
The following patients were excluded from the study: patients below 1 year of age, patients not previously diagnosed with HSP, and patients who had no immunological or allergen panel test performed.
4.2.3. Statistical Analysis of Data
The data were statistically analyzed using IBM’s Statistical Analysis Software Package (SPSS) version 29 (2022) and Microsoft Excel 2016 (Redmon, WA, USA). The investigation included descriptive statistics, tests to assess normal distribution (Kolmogorov–Smirnov and Shapiro–Wilks), tests to compare quantitative indicators in different groups (comparison of means), correlation analyses (Pearson correlation coefficient, PCC), ROC curves, positive predictive value (PPV), negative predictive value (NPV), and sensitivity and specificity. The chosen significance level was α = 0.05 and 0.01 for PCC. Thus, if the significance level is not reached for values of p < α, the null hypothesis is rejected.
5. Conclusions
Our comprehensive five-year review provides valuable insights into the manifestation of HSP in children, highlighting how factors like age, gender, season, and living environment can have an impact on the disease's progression. Identifying these patterns allows healthcare professionals to stay alert to the signs of HSP, promoting timely interventions and enabling more personalized care that considers each child's distinct background and risk factors. Our findings highlight the unique behaviors of IgA and IgE in HSP. Although inflammation is pivotal in the disease process, these immune markers appear to exhibit a distinct pattern of progression. The robust stability of IgE, specifically, may deserve increased focus in upcoming investigations, particularly in elucidating individual variations in immune response and disease advancement.
Author Contributions
Conceptualization, S.O.; methodology, G.V.N.; software, S.O.; validation, G.V.N. and D.B.; investigation, E.I.I., L.M.M., M.L., and A.N.; resources, M.G.; data curation, V.P.; writing—original draft preparation, S.O.; writing—review and editing, L.M.E.C., G.V.N.; supervision, E.M. All authors have read and agreed to the published version of the manuscript.
Funding
This research received no external funding.
Institutional Review Board Statement
This study was conducted in accordance with the Declaration of Helsinki and was approved by the Ethics Committee of ‘Grigore Alexandrescu’ Pediatric Emergency Hospital (the approval code is 19 from 28 May 2024).
Informed Consent Statement
Informed consent was obtained from all subjects involved in the study according to the ‘Grigore Alexandrescu’ Pediatric Emergency Hospital protocol.
Data Availability Statement
The data presented in this study are available on request from the corresponding author. The data are not publicly available due to restrictions such as privacy and ethics.
Acknowledgments
Publication of this paper was supported by the University of Medicine and Pharmacy Carol Davila, through the institutional program Publish not Perish.
Conflicts of Interest
The authors declare no conflicts of interest.
Abbreviations
The following abbreviations are used in this manuscript:
| IgE | Immunoglobulin E |
| IgA | Immunoglobulin A |
| HSP | Henoch-Schönlein purpura |
| IgAV | Immunoglobulin A vasculitis |
Appendix A

Table A1.
Reference values for IgE stratified by age.
| IgE Levels | |
| Age | Values (UI/mL) |
| <1 | <15 |
| 1 to 5 | <60 |
| 6 to 9 | <90 |
| 10 to 15 | <200 |
| >15 | <100 |
Table A2.
Respiratory and food allergen panels.
| Allergen Lists | |
| Respiratory | Food |
| Pollen Phleum pratense | Peanuts |
| Pollen graminee mix (gx6) | Hazelnut |
| Pollen Artemisia vulgaris | Carrot |
| Pollen Ambrosia elatior | Potato |
| Parietaria officinalis | Wheat |
| Pollen Betulla verrucosa | Gluten |
| Pollen Alnus incana | Rice |
| Dermatophagoides pteronyssinus | Soya |
| Dermatophagoides farinae | Egg white |
| fur and epithelium (cat) | Yolk |
| fur and epithelium (dog) | Cow’s milk |
| Blatella germanica | Alpha-lactalbumin |
| Penicillium chrysogenum, Cladosporium herbarum, Aspergillus fumigatus, Alternaria tenuis | Beta-lactoglobulin |
| Casein | |
| Crab | |
| Seafood | |
| Fish (code) | |
| Shrimps | |
Table A3.
Paired sample t-test results.
| Mean | Std. Deviation | Std. Error Mean | 95% Confidence Interval of the Difference | t | df | One-Sided p | Two-Sided p | |||
| Lower | Upper | |||||||||
| Pair 1 | IgAph1Ninf -IgAph2NInf | 0.23983 | 0.35063 | 0.04565 | 0.14846 | 0.33121 | 5.254 | 58 | <0.001 | <0.001 |
| Pair 2 | IgAph1Inf - IgAph2Inf | 0.04593 | 0.15397 | 0.02005 | 0.00581 | 0.08606 | 2.291 | 58 | 0.013 | 0.026 |
| Pair 3 | IgEph1NInf - IgEph2NInf | -1.59322 | 3.16292 | 0.41178 | -2.41748 | -0.76896 | -3.869 | 58 | <0.001 | <0.001 |
| Pair 4 | IgEph1Inf - IgEph2Inf | -10.99458 | 9.45152 | 1.23048 | -13.45766 | -8.53150 | -8.935 | 58 | <0.001 | <0.001 |
Table A4.
Independent sample t-test results.
| F | Sig. | t | df | Significance | Mean Difference | Std. Error Difference | 95% Confidence Interval of the Difference | ||||
| One-Sided p | Two-Sided p | Lower | Upper | ||||||||
| IgAph1 | Equal variances assumed | 0.029 | 0.866 | 1.413 | 136 | 0.080 | 0.160 | 0.29733 | 0.21037 | -0.11868 | 0.71334 |
| Equal variances not assumed | 1.353 | 101.803 | 0.090 | 0.179 | 0.29733 | 0.21979 | -0.13863 | 0.73329 | |||
| IgAph2 | Equal variances assumed | 0.068 | 0.795 | 2.635 | 136 | 0.005 | 0.009 | 0.49254 | 0.18695 | 0.12282 | 0.86225 |
| Equal variances not assumed | 2.474 | 91.638 | 0.008 | 0.015 | 0.49254 | 0.19909 | 0.09711 | 0.88796 | |||
| IgEph1 | Equal variances assumed | 10.094 | 0.002 | 4.801 | 136 | <0.001 | <0.001 | 166.75904 | 34.73431 | 98.06984 | 235.44824 |
| Equal variances not assumed | 4.256 | 66.547 | <0.001 | <0.001 | 166.75904 | 39.18586 | 88.53393 | 244.98414 | |||
| IgEph2 | Equal variances assumed | 10.039 | 0.002 | 5.031 | 136 | <0.001 | <0.001 | 176.01944 | 34.98582 | 106.83286 | 245.20602 |
| Equal variances not assumed | 4.463 | 66.846 | <0.001 | <0.001 | 176.01944 | 39.43635 | 97.30082 | 254.73805 | |||
References
- Bardana, E.J., Jr. Immunoglobulin E- (IgE) and non-IgE-mediated reactions in the pathogenesis of atopic eczema/dermatitis syndrome (AEDS). Allergy 2004, 59 Suppl 78, 25-29. [CrossRef]
- He, J.S.; Narayanan, S.; Subramaniam, S.; Ho, W.Q.; Lafaille, J.J.; Curotto de Lafaille, M.A. Biology of IgE production: IgE cell differentiation and the memory of IgE responses. Curr Top Microbiol Immunol 2015, 388, 1-19. [CrossRef]
- Devereux, G. The increase in the prevalence of asthma and allergy: food for thought. Nature Reviews Immunology 2006, 6, 869-874. [CrossRef]
- Belmesk, L.; Muntyanu, A.; Cantin, E.; AlHalees, Z.; Jack, C.S.; Le, M.; Sasseville, D.; Iannattone, L.; Ben-Shoshan, M.; Litvinov, I.V.; et al. Prominent Role of Type 2 Immunity in Skin Diseases: Beyond Atopic Dermatitis. J Cutan Med Surg 2022, 26, 33-49. [CrossRef]
- Devilliers, H.; Turcu, A.; Vernier, N.; Muller, G.; Bielefeld, P.; Bonniaud, P.; Besancenot, J.F. [Hyper-IgE in internal medicine]. Rev Med Interne 2018, 39, 332-338. [CrossRef]
- Freeman, A.F.; Kleiner, D.E.; Nadiminti, H.; Davis, J.; Quezado, M.; Anderson, V.; Puck, J.M.; Holland, S.M. Causes of death in hyper-IgE syndrome. J Allergy Clin Immunol 2007, 119, 1234-1240. [CrossRef]
- Freeman, A.F.; Milner, J.D. The Child with Elevated IgE and Infection Susceptibility. Curr Allergy Asthma Rep 2020, 20, 65. [CrossRef]
- Duréault, A.; Tcherakian, C.; Poiree, S.; Catherinot, E.; Danion, F.; Jouvion, G.; Bougnoux, M.E.; Mahlaoui, N.; Givel, C.; Castelle, M.; et al. Spectrum of Pulmonary Aspergillosis in Hyper-IgE Syndrome with Autosomal-Dominant STAT3 Deficiency. The Journal of Allergy and Clinical Immunology: In Practice 2019, 7, 1986-1995.e1983. [CrossRef]
- Sherrill, D.L.; Halonen, M.; Burrows, B. Relationships between total serum IgE, atopy, and smoking: a twenty-year follow-up analysis. J Allergy Clin Immunol 1994, 94, 954-962. [CrossRef]
- Zetterström, O.; Osterman, K.; Machado, L.; Johansson, S.G. Another smoking hazard: raised serum IgE concentration and increased risk of occupational allergy. Br Med J (Clin Res Ed) 1981, 283, 1215-1217. [CrossRef]
- Burrows, B.; Halonen, M.; Lebowitz, M.D.; Knudson, R.J.; Barbee, R.A. The relationship of serum immunoglobulin E, allergy skin tests, and smoking to respiratory disorders. J Allergy Clin Immunol 1982, 70, 199-204. [CrossRef]
- Omenaas, E.; Bakke, P.; Elsayed, S.; Hanoa, R.; Gulsvik, A. Total and specific serum IgE levels in adults: relationship to sex, age and environmental factors. Clin Exp Allergy 1994, 24, 530-539. [CrossRef]
- Bergerson, J.R.E.; Freeman, A.F. An Update on Syndromes with a Hyper-IgE Phenotype. Immunol Allergy Clin North Am 2019, 39, 49-61. [CrossRef]
- Eckl-Dorna, J.; Villazala-Merino, S.; Campion, N.J.; Byazrova, M.; Filatov, A.; Kudlay, D.; Karsonova, A.; Riabova, K.; Khaitov, M.; Karaulov, A.; et al. Tracing IgE-Producing Cells in Allergic Patients. Cells 2019, 8. [CrossRef]
- Tsilifis, C.; Freeman, A.F.; Gennery, A.R. STAT3 Hyper-IgE Syndrome-an Update and Unanswered Questions. J Clin Immunol 2021, 41, 864-880. [CrossRef]
- Oprițescu, S.; Nițescu, G.V.; Cîrnațu, D.; Trifunschi, S.; Munteanu, M.; Golumbeanu, M.; Boghițoiu, D.; Dărăban, A.M.; Ilie, E.I.; Moroșan, E. Elevated Immunoglobulin E Serum Levels: Possible Underlying Factors That Can Cause an Inborn Error of Immunity in the Pediatric Population with Recurrent Infections. Antibodies 2024, 13, 47.
- Hovanet M.V., A.R., Dinu M., Oprea E., Budura E.A., Negreṣ S., Velescu B., Duṭu L., Anghel I., Ancu I, Moroṣan E., Seremet O. „Toxicity and anti-inflammatory activity of Ziziphus jujuba Mill. Leaves”. Farmacia 2016, 64, 7.
- Hashemi, H.; Mohebbi, M.; Mehravaran, S.; Mazloumi, M.; Jahanbani-Ardakani, H.; Abtahi, S.H. Hyperimmunoglobulin E syndrome: Genetics, immunopathogenesis, clinical findings, and treatment modalities. J Res Med Sci 2017, 22, 53. [CrossRef]
- Wu, J.; Hong, L.; Chen, T.X. Clinical Manifestation of Hyper IgE Syndrome Including Otitis Media. Curr Allergy Asthma Rep 2018, 18, 51. [CrossRef]
- Lieberman, P.; Camargo, C.A., Jr.; Bohlke, K.; Jick, H.; Miller, R.L.; Sheikh, A.; Simons, F.E. Epidemiology of anaphylaxis: findings of the American College of Allergy, Asthma and Immunology Epidemiology of Anaphylaxis Working Group. Ann Allergy Asthma Immunol 2006, 97, 596-602. [CrossRef]
- Negreş S., C.C., Moroşan E., Arsene A.L. „Experimental Pharmacological Model Of Diabetes Induction With Aloxan In Rat”. Farmacia 2013, 6, 10.
- Cîrnaţu, D.; Szentesi, S.G.; Cuc, L.D.; Ciurariu, E.; Bran, L.R.; Bâtcă-Dumitru, G.-C.; Joldes, C.S.R.; Pantea, M.F.; Pârvu, S. Investigation and Modeling of the Variables of the Decision to Vaccinate as the Foundation of an Algorithm for Reducing Vaccination Reluctance. Systems 2023, 11, 220.
- Chandesris, M.O.; Melki, I.; Natividad, A.; Puel, A.; Fieschi, C.; Yun, L.; Thumerelle, C.; Oksenhendler, E.; Boutboul, D.; Thomas, C.; et al. Autosomal dominant STAT3 deficiency and hyper-IgE syndrome: molecular, cellular, and clinical features from a French national survey. Medicine (Baltimore) 2012, 91, e1-e19. [CrossRef]
- Barbee, R.A.; Halonen, M.; Lebowitz, M.; Burrows, B. Distribution of IgE in a community population sample: correlations with age, sex, and allergen skin test reactivity. J Allergy Clin Immunol 1981, 68, 106-111. [CrossRef]
- Joshi, A.Y.; Iyer, V.N.; Boyce, T.G.; Hagan, J.B.; Park, M.A.; Abraham, R.S. Elevated serum immunoglobulin E (IgE): when to suspect hyper-IgE syndrome-A 10-year pediatric tertiary care center experience. Allergy Asthma Proc 2009, 30, 23-27. [CrossRef]
- Sanders, S.L.; Agwan, S.; Hassan, M.; Bont, L.J.; Venekamp, R.P. Immunoglobulin treatment for hospitalised infants and young children with respiratory syncytial virus infection. Cochrane Database Syst Rev 2023, 10, Cd009417. [CrossRef]
- Gardner-Medwin, J.M.; Dolezalova, P.; Cummins, C.; Southwood, T.R. Incidence of Henoch-Schönlein purpura, Kawasaki disease, and rare vasculitides in children of different ethnic origins. Lancet 2002, 360, 1197-1202. [CrossRef]
- Leung, A.K.C.; Barankin, B.; Leong, K.F. Henoch-Schönlein Purpura in Children: An Updated Review. Curr Pediatr Rev 2020, 16, 265-276. [CrossRef]
- Goldstein, A.R.; White, R.H.; Akuse, R.; Chantler, C. Long-term follow-up of childhood Henoch-Schönlein nephritis. Lancet 1992, 339, 280-282. [CrossRef]
- Ozen, S.; Pistorio, A.; Iusan, S.M.; Bakkaloglu, A.; Herlin, T.; Brik, R.; Buoncompagni, A.; Lazar, C.; Bilge, I.; Uziel, Y.; et al. EULAR/PRINTO/PRES criteria for Henoch-Schönlein purpura, childhood polyarteritis nodosa, childhood Wegener granulomatosis and childhood Takayasu arteritis: Ankara 2008. Part II: Final classification criteria. Ann Rheum Dis 2010, 69, 798-806. [CrossRef]
- Piram, M.; Maldini, C.; Biscardi, S.; De Suremain, N.; Orzechowski, C.; Georget, E.; Regnard, D.; Koné-Paut, I.; Mahr, A. Incidence of IgA vasculitis in children estimated by four-source capture–recapture analysis: a population-based study. Rheumatology 2017, 56, 1358-1366. [CrossRef]
- Ruperto, N.; Ozen, S.; Pistorio, A.; Dolezalova, P.; Brogan, P.; Cabral, D.A.; Cuttica, R.; Khubchandani, R.; Lovell, D.J.; O'Neil, K.M.; et al. EULAR/PRINTO/PRES criteria for Henoch-Schönlein purpura, childhood polyarteritis nodosa, childhood Wegener granulomatosis and childhood Takayasu arteritis: Ankara 2008. Part I: Overall methodology and clinical characterisation. Ann Rheum Dis 2010, 69, 790-797. [CrossRef]
- Piram, M.; Mahr, A. Epidemiology of immunoglobulin A vasculitis (Henoch-Schönlein): current state of knowledge. Curr Opin Rheumatol 2013, 25, 171-178. [CrossRef]
- Ruan, J.W.; Fan, G.Z.; Niu, M.M.; Jiang, Q.; Li, R.X.; Qiu, Z.; Hu, P. Serum immunoglobulin profiles in Chinese children with Henoch-Schönlein purpura. Scand J Immunol 2022, 96, e13191. [CrossRef]
- He, X.; Yu, C.; Zhao, P.; Ding, Y.; Liang, X.; Zhao, Y.; Yue, X.; Wu, Y.; Yin, W. The genetics of Henoch-Schönlein purpura: a systematic review and meta-analysis. Rheumatol Int 2013, 33, 1387-1395. [CrossRef]
- Pillebout, E.; Sunderkötter, C. IgA vasculitis. Seminars in Immunopathology 2021, 43, 729-738. [CrossRef]
- Oruc, Z.; Oblet, C.; Boumediene, A.; Druilhe, A.; Pascal, V.; Le Rumeur, E.; Cuvillier, A.; El Hamel, C.; Lecardeur, S.; Leanderson, T.; et al. IgA Structure Variations Associate with Immune Stimulations and IgA Mesangial Deposition. J Am Soc Nephrol 2016, 27, 2748-2761. [CrossRef]
- Oprițescu, S.; Nițescu, G.V.; Golumbeanu, M.; Boghițoiu, D.; Ioniță, E.I.; Ușurelu, D.-A.; Lucaci, C.; Negoiță, A.; Moroșan, E. The Impact of Infectious Diseases on Clinical Characteristics and Immunological Correlations in Pediatric Henoch–Schönlein Purpura: A Five-Year Retrospective Study. Biomedicines 2025, 13, 113.
- Rigante, D.; Castellazzi, L.; Bosco, A.; Esposito, S. Is there a crossroad between infections, genetics, and Henoch–Schönlein purpura? Autoimmunity Reviews 2013, 12, 1016-1021. [CrossRef]
- Popescu, I.-M.; Margan, M.-M.; Anghel, M.; Mocanu, A.; Laitin, S.M.D.; Margan, R.; Capraru, I.D.; Tene, A.-A.; Gal-Nadasan, E.-G.; Cirnatu, D.; et al. Developing Prediction Models for COVID-19 Outcomes: A Valuable Tool for Resource-Limited Hospitals. International Journal of General Medicine 2023, Volume 16, 3053-3065. [CrossRef]
- Horgos, M.S.; Pop, O.L.; Sandor, M.; Borza, I.L.; Negrean, R.A.; Cote, A.; Neamtu, A.-A.; Grierosu, C.; Sachelarie, L.; Huniadi, A. Platelets Rich Plasma (PRP) Procedure in the Healing of Atonic Wounds. Journal of Clinical Medicine 2023, 12, 3890.
- Audemard-Verger, A.; Pillebout, E.; Guillevin, L.; Thervet, E.; Terrier, B. IgA vasculitis (Henoch-Shönlein purpura) in adults: Diagnostic and therapeutic aspects. Autoimmun Rev 2015, 14, 579-585. [CrossRef]
- Hamdan, J.M.; Barqawi, M.A. Henoch-Schonlein purpura in children. Influence of age on the incidence of nephritis and arthritis. Saudi Med J 2008, 29, 549-552.
- Jauhola, O.; Ronkainen, J.; Koskimies, O.; Ala-Houhala, M.; Arikoski, P.; Hölttä, T.; Jahnukainen, T.; Rajantie, J.; Ormälä, T.; Nuutinen, M. Clinical course of extrarenal symptoms in Henoch-Schonlein purpura: a 6-month prospective study. Arch Dis Child 2010, 95, 871-876. [CrossRef]
- Calviño, M.C.; Llorca, J.; García-Porrúa, C.; Fernández-Iglesias, J.L.; Rodriguez-Ledo, P.; González-Gay, M.A. Henoch-Schönlein purpura in children from northwestern Spain: a 20-year epidemiologic and clinical study. Medicine (Baltimore) 2001, 80, 279-290. [CrossRef]
- Chen, O.; Zhu, X.B.; Ren, P.; Wang, Y.B.; Sun, R.P.; Wei, D.E. Henoch Schonlein Purpura in children: clinical analysis of 120 cases. Afr Health Sci 2013, 13, 94-99. [CrossRef]
- Nikolaishvili, M.; Pazhava, A.; Di Lernia, V. Viral Infections May Be Associated with Henoch-Schönlein Purpura. J Clin Med 2023, 12. [CrossRef]
- Liu, C.; Luo, L.; Fu, M.; Li, Z.; Liu, J. Analysis of children with Henoch–Schonlein purpura secondary to infection. Clinical Rheumatology 2022, 41, 803-810. [CrossRef]
- Rigante, D.; Castellazzi, L.; Bosco, A.; Esposito, S. Is there a crossroad between infections, genetics, and Henoch-Schönlein purpura? Autoimmun Rev 2013, 12, 1016-1021. [CrossRef]
- Farooq, H.; Aemaz Ur Rehman, M.; Asmar, A.; Asif, S.; Mushtaq, A.; Qureshi, M.A. The pathogenesis of COVID-19-induced IgA nephropathy and IgA vasculitis: A systematic review. Journal of Taibah University Medical Sciences 2022, 17, 1-13. [CrossRef]
- Garzoni, L.; Vanoni, F.; Rizzi, M.; Simonetti, G.D.; Goeggel Simonetti, B.; Ramelli, G.P.; Bianchetti, M.G. Nervous system dysfunction in Henoch-Schonlein syndrome: systematic review of the literature. Rheumatology (Oxford) 2009, 48, 1524-1529. [CrossRef]
- Aleyd, E.; Heineke, M.H.; van Egmond, M. The era of the immunoglobulin A Fc receptor FcαRI; its function and potential as target in disease. Immunol Rev 2015, 268, 123-138. [CrossRef]
- Peru, H.; Soylemezoglu, O.; Bakkaloglu, S.A.; Elmas, S.; Bozkaya, D.; Elmaci, A.M.; Kara, F.; Buyan, N.; Hasanoglu, E. Henoch Schonlein purpura in childhood: clinical analysis of 254 cases over a 3-year period. Clin Rheumatol 2008, 27, 1087-1092. [CrossRef]
- Mao, Y.; Yin, L.; Huang, H.; Zhou, Z.; Chen, T.; Zhou, W. Henoch-Schönlein purpura in 535 Chinese children: clinical features and risk factors for renal involvement. J Int Med Res 2014, 42, 1043-1049. [CrossRef]
- Lawee, D. Atypical clinical course of Henoch-Schonlein purpura. Can Fam Physician 2008, 54, 1117-1120.
- Kostova, P.; Papochieva, V.; Miteva, D.; Georgieva, B.; Mileva, S.; Shahid, M.; Lukanov, T.; Petrova, G. Elevated IgE Levels-An Allergy or an Underlying Inborn Error of Immunity in Children with Recurrent Infections? Antibodies (Basel) 2023, 12. [CrossRef]
- Lin, I.H.; Tsai, M.-C.; Chen, J.-P.; Fu, L.-S. Allergic children with extremely high total IgE but no allergen identified in the initial screening panel. J Microbiol Immunol Infect 2021, 54, 474-481. [CrossRef]
- Boyd, J.K.; Barratt, J. Inherited IgA glycosylation pattern in IgA nephropathy and HSP nephritis: where do we go next? Kidney Int 2011, 80, 8-10. [CrossRef]
- Chen, P.; Yu, G.; Zhang, X.; Xie, X.; Wang, J.; Shi, S.; Liu, L.; Lv, J.; Zhang, H. Plasma Galactose-Deficient IgA1 and C3 and CKD Progression in IgA Nephropathy. Clin J Am Soc Nephrol 2019, 14, 1458-1465. [CrossRef]
- Davin, J.C.; Ten Berge, I.J.; Weening, J.J. What is the difference between IgA nephropathy and Henoch-Schönlein purpura nephritis? Kidney Int 2001, 59, 823-834. [CrossRef]
- de Sousa-Pereira, P.; Woof, J.M. IgA: Structure, Function, and Developability. Antibodies (Basel) 2019, 8. [CrossRef]
- Donadio, J.V.; Grande, J.P. IgA nephropathy. N Engl J Med 2002, 347, 738-748. [CrossRef]
- Invitrogen. Human IgE ELISA Kit. Available online: https://www.thermofisher.com/elisa/product/Human-IgE-ELISA-Kit/BMS2097 (accessed on 10.11.2024).
- Invitrogen. Human IgA ELISA Kit. Available online: https://www.thermofisher.com/elisa/product/Human-IgA-ELISA-Kit/BMS2096 (accessed on 10.11.2024).
- Invitrogen. Human Complement C3 ELISA Kit. Available online: https://www.thermofisher.com/elisa/product/Human-Complement-C3a-ELISA-Kit/BMS2089 (accessed on 10.11.2024).
- Invitrogen. Human Complement C4 ELISA Kit. Available online: https://www.thermofisher.com/elisa/product/Human-Complement-C4-ELISA-Kit/EEL075 (accessed on 10.11.2024).
- MERRETT, J.; MERRETT, T.G. Phadiatop—a novel IgE antibody screening test. Clinical & Experimental Allergy 1987, 17, 409-416. [CrossRef]
- Scientific, T. ImmunoCAP Phadiatop. Available online: https://www.thermofisher.com/phadia/us/en/product-catalog.html?articleNumber=14-4405-35®ion=RO (accessed on 07.04.2025).
- Ozen, S.; Ruperto, N.; Dillon, M.J.; Bagga, A.; Barron, K.; Davin, J.C.; Kawasaki, T.; Lindsley, C.; Petty, R.E.; Prieur, A.M.; et al. EULAR/PReS endorsed consensus criteria for the classification of childhood vasculitides. Ann Rheum Dis 2006, 65, 936-941. [CrossRef]
Figure 1.
The distribution of patients based on the severity level of HSP and their respective environments.
Figure 1.
The distribution of patients based on the severity level of HSP and their respective environments.
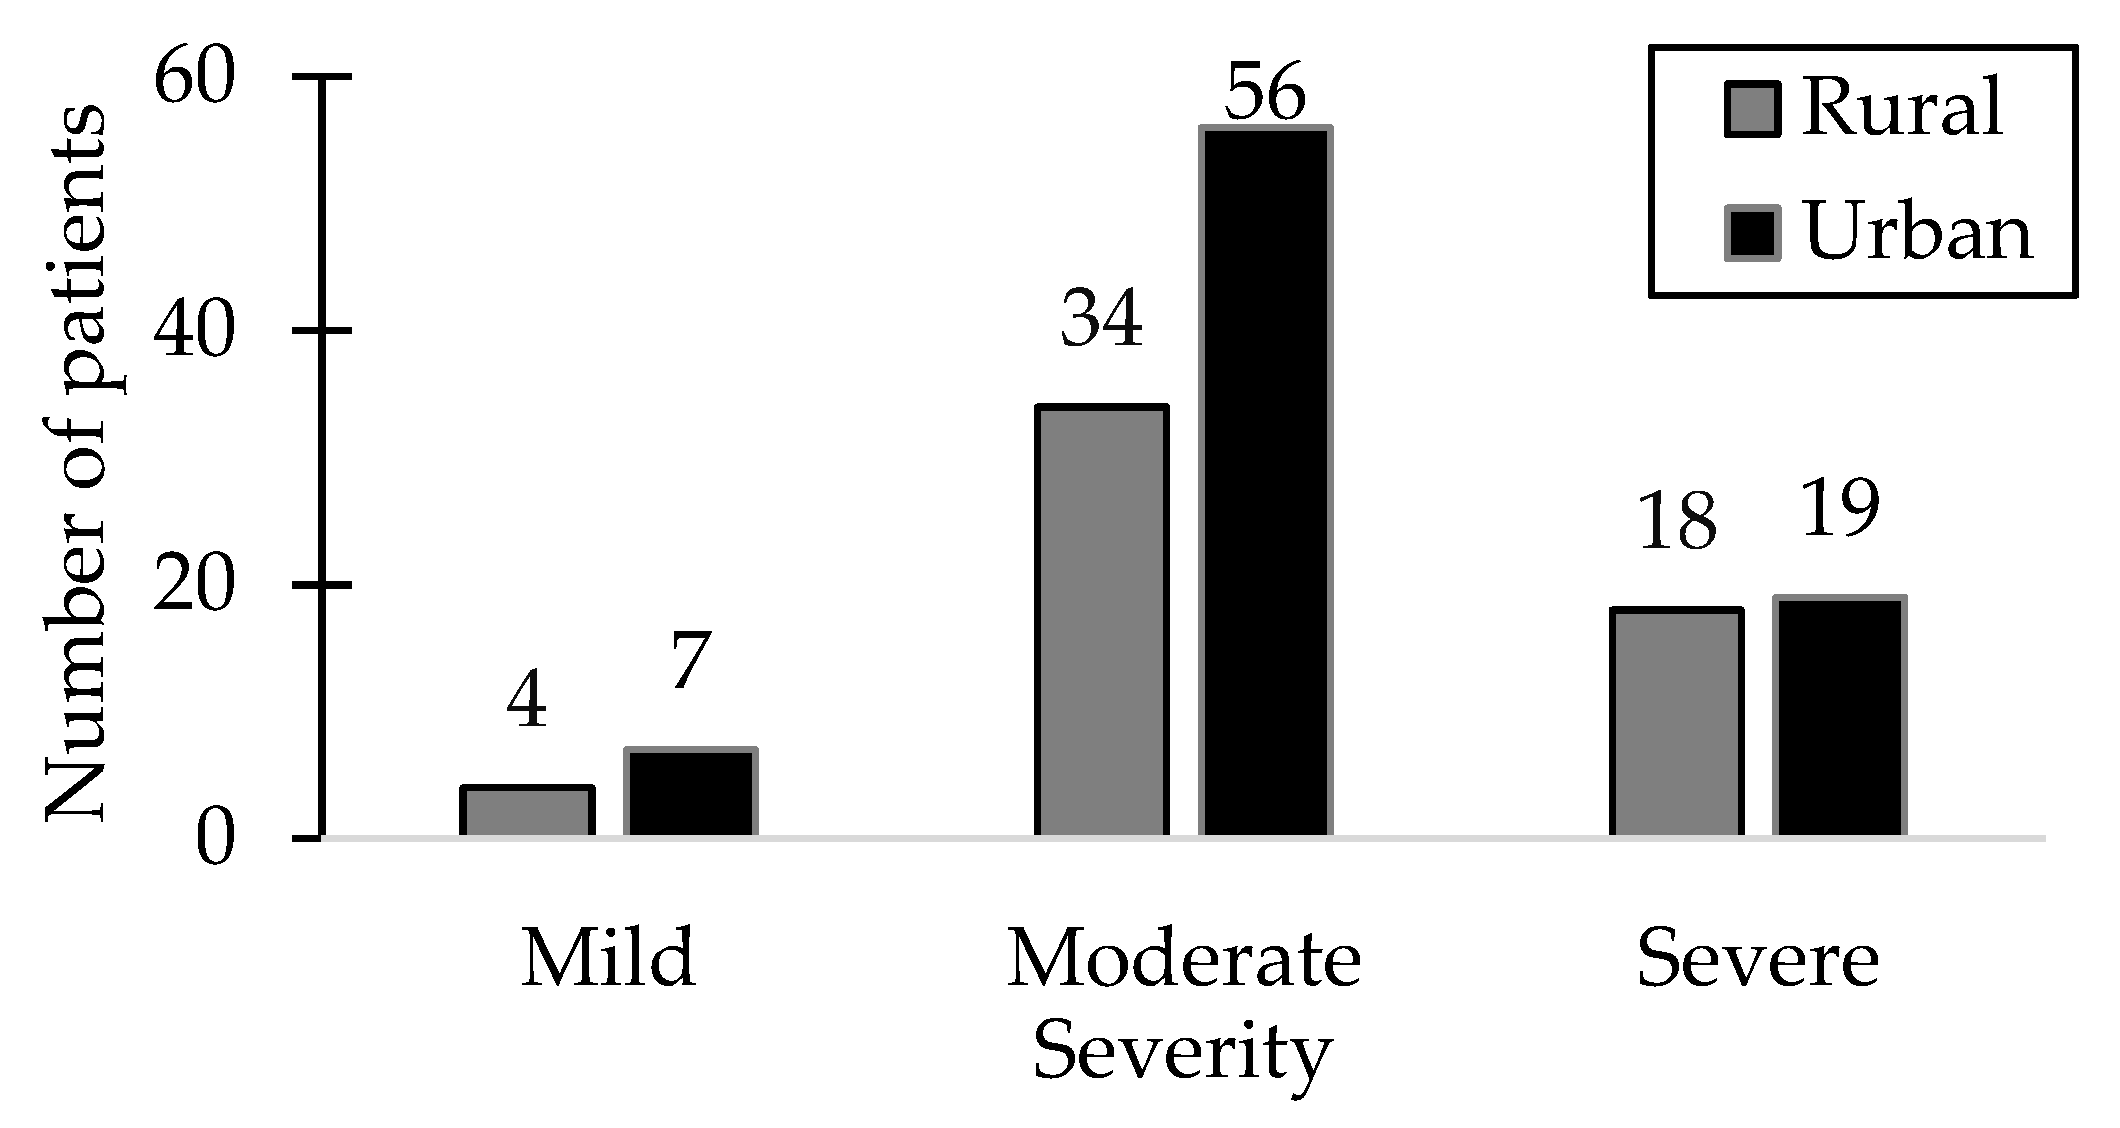
Figure 2.
The distribution of patients based on seasonal variations and the severity of HSP.
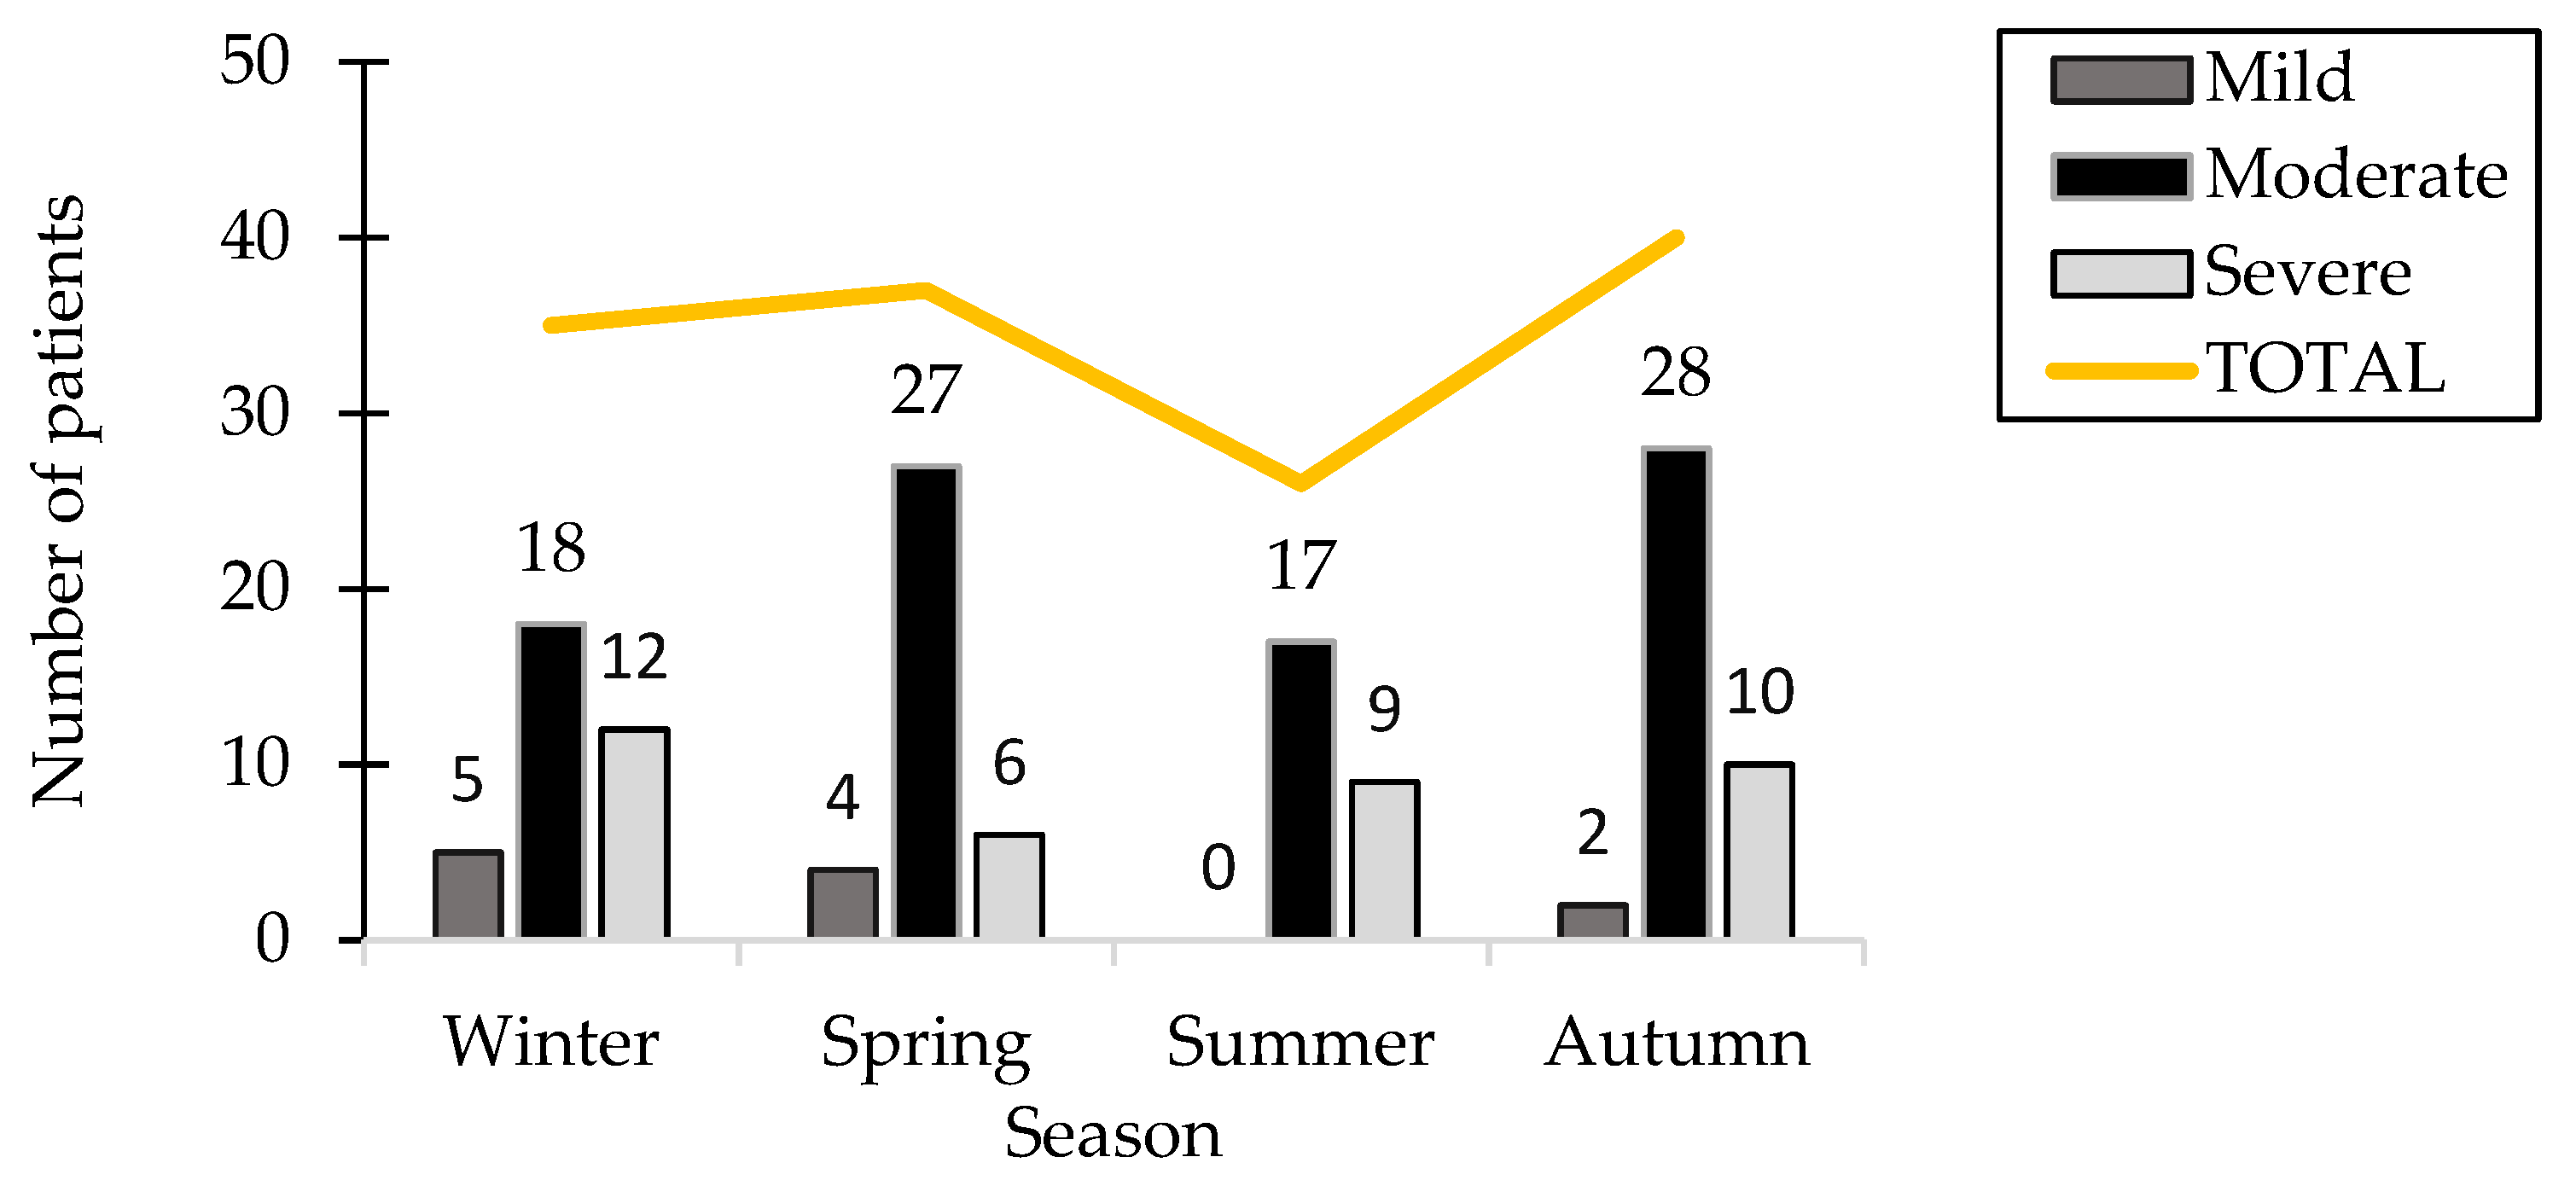
Figure 4.
The graphical representation of IgA and IgE serum levels (g/L) for both patient groups across both phases. The circles represent the outliers.
Figure 4.
The graphical representation of IgA and IgE serum levels (g/L) for both patient groups across both phases. The circles represent the outliers.
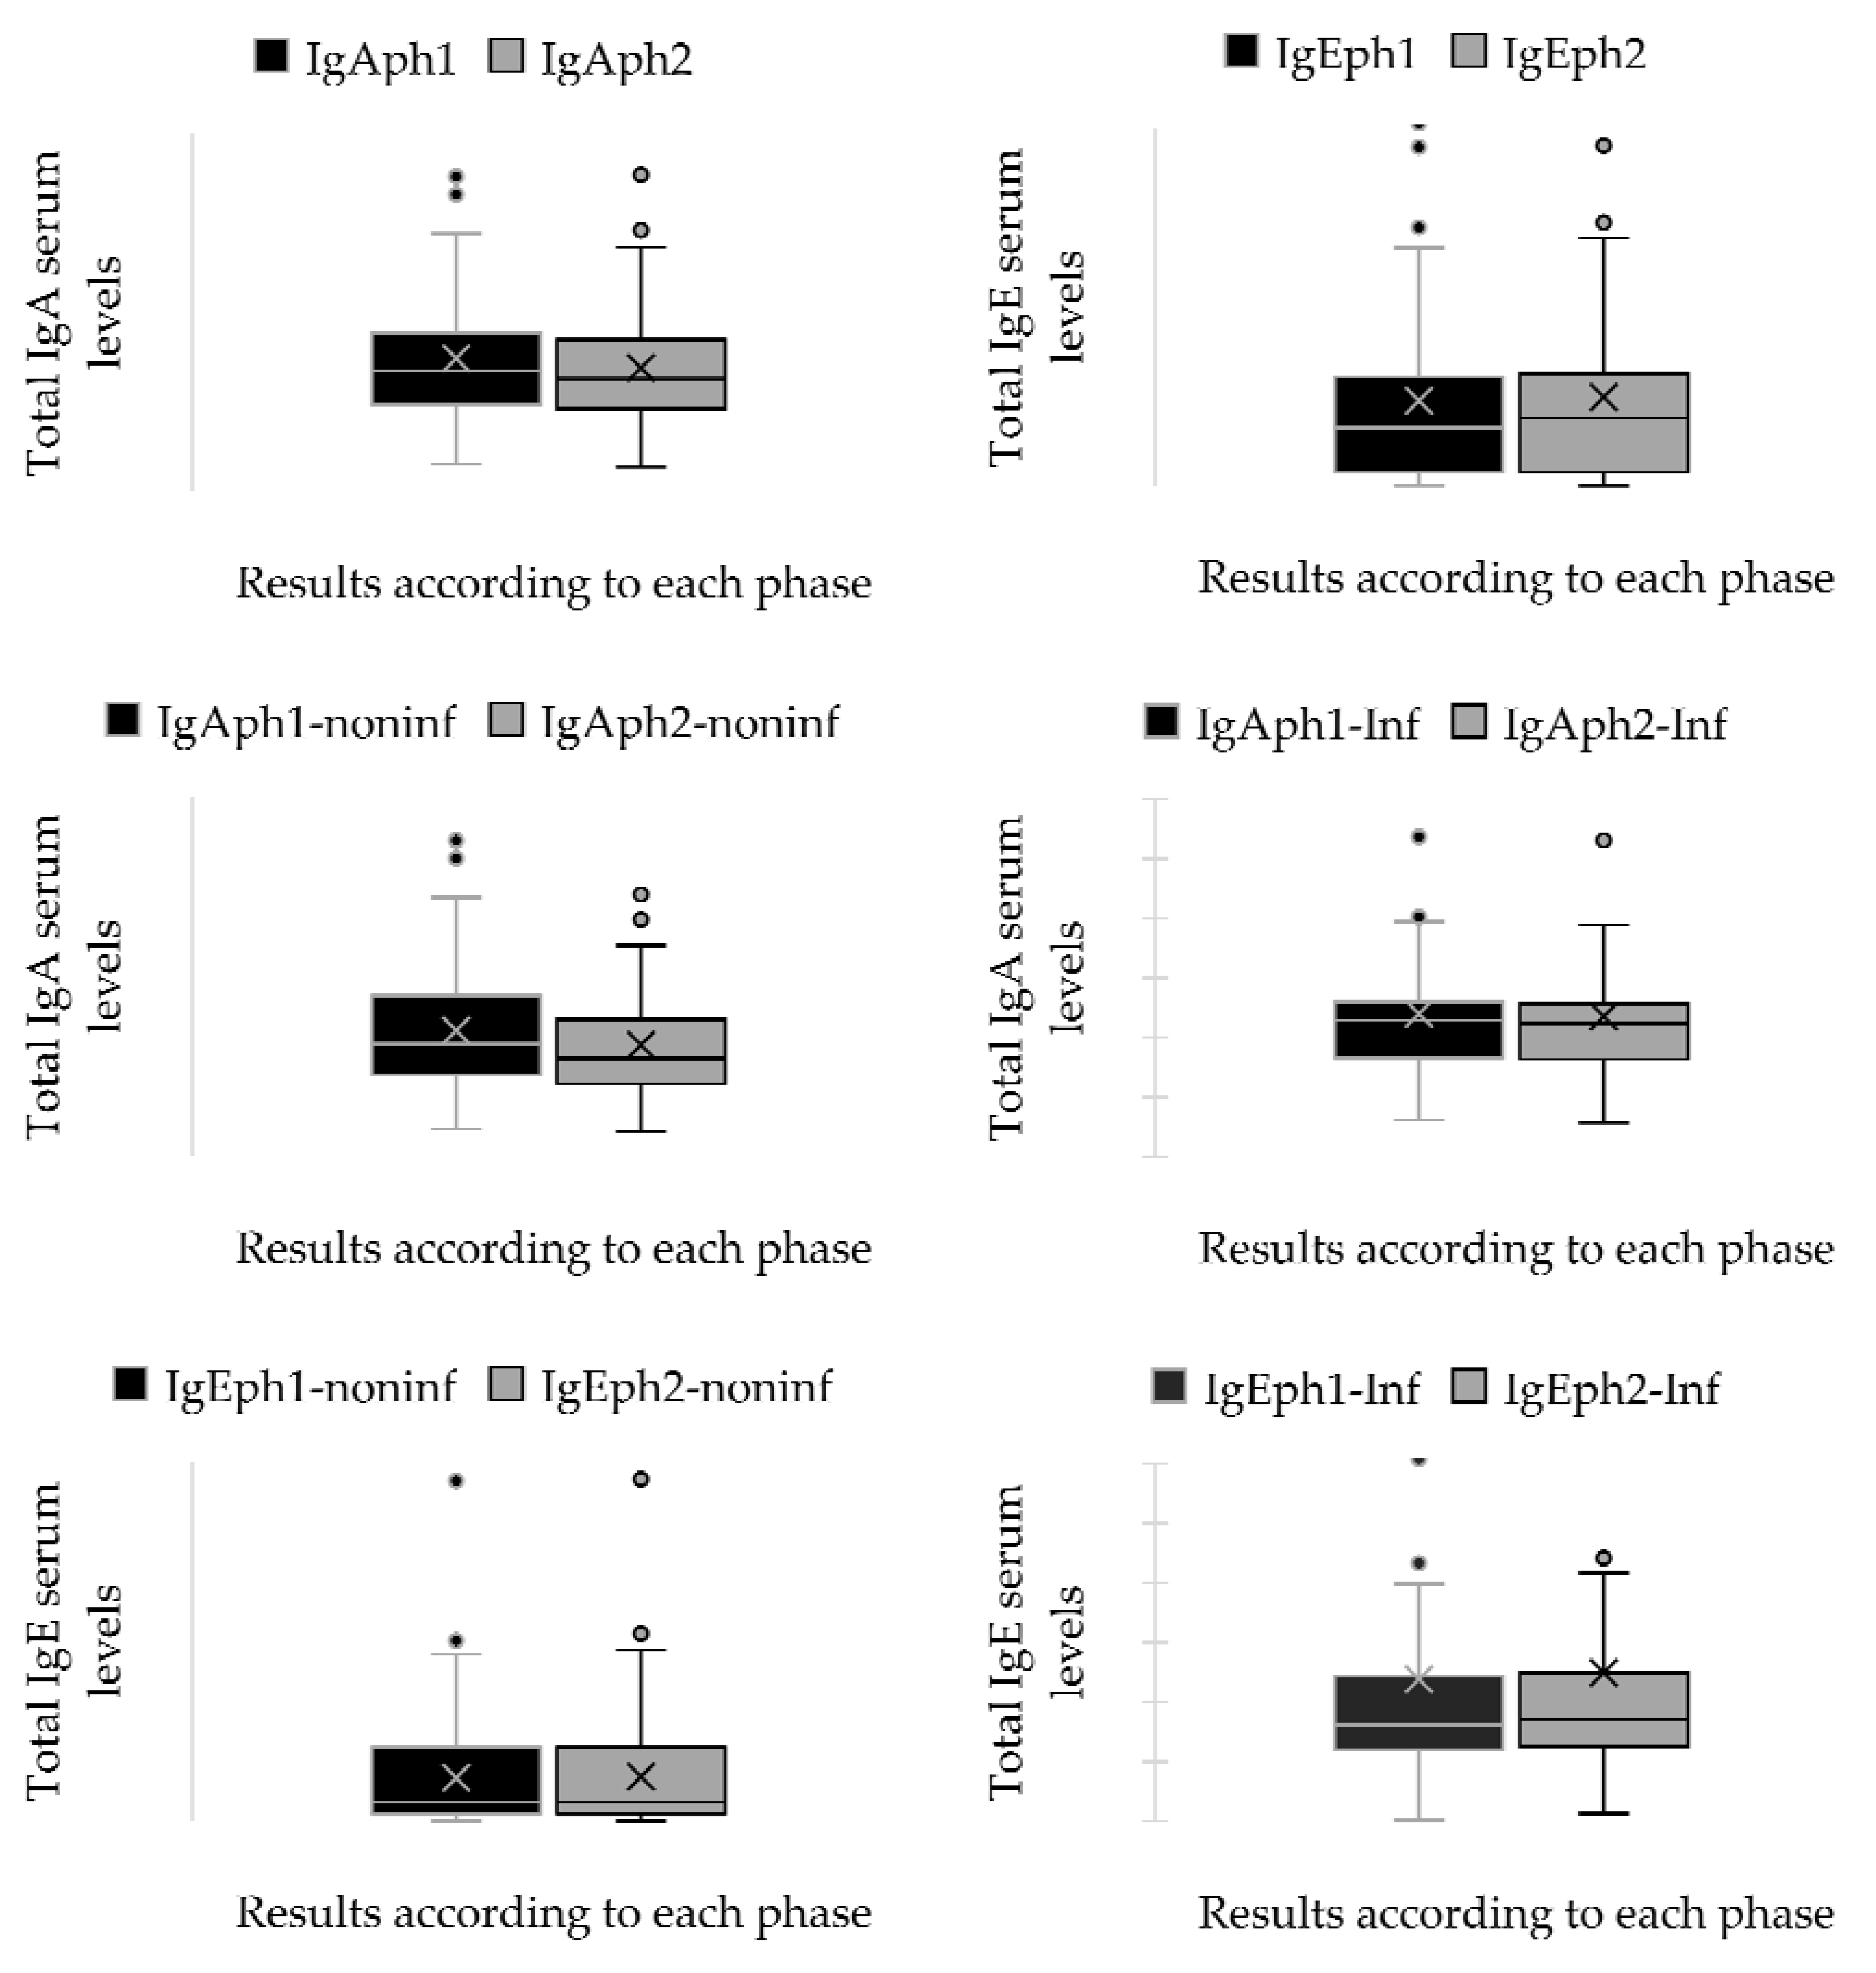
Figure 5.
ROC curves obtained from the IgE serum levels. Sensitivity is shown in the ordinate, while the false positive rate (1-specificity) is presented in the abscissa.
Figure 5.
ROC curves obtained from the IgE serum levels. Sensitivity is shown in the ordinate, while the false positive rate (1-specificity) is presented in the abscissa.
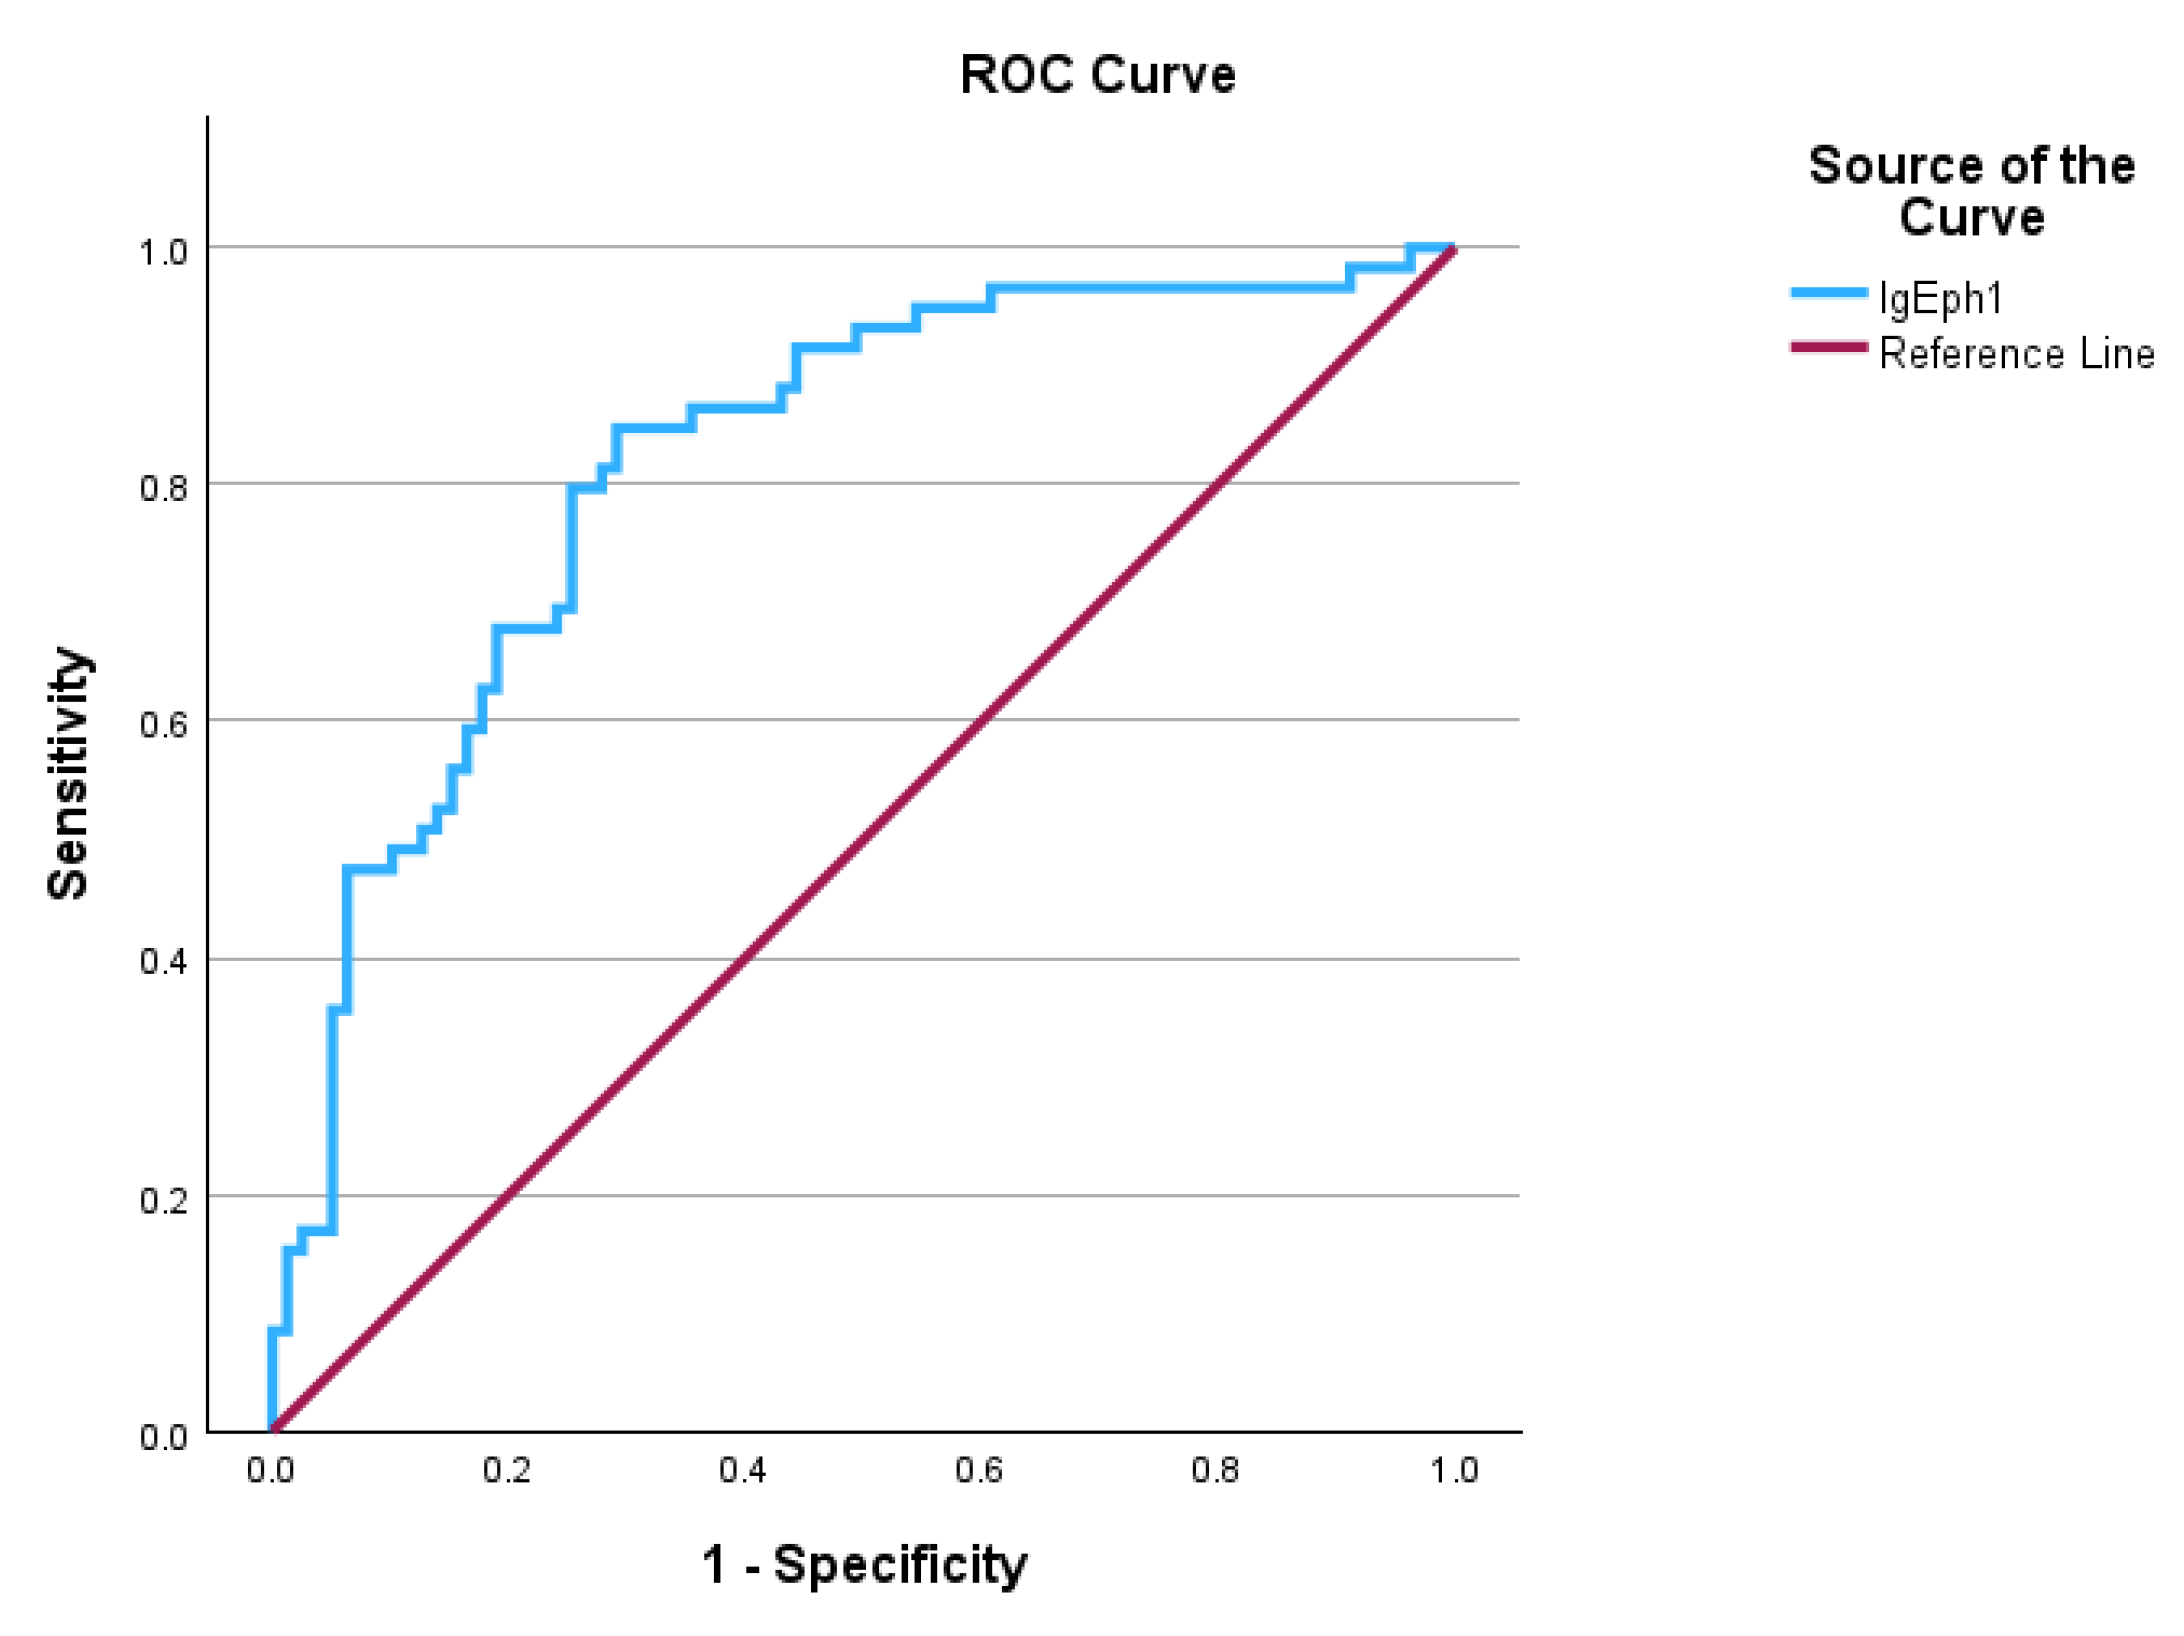
Figure 6.
Graphic representation of the allergen panel results for patients identified as having elevated total serum IgE levels.
Figure 6.
Graphic representation of the allergen panel results for patients identified as having elevated total serum IgE levels.
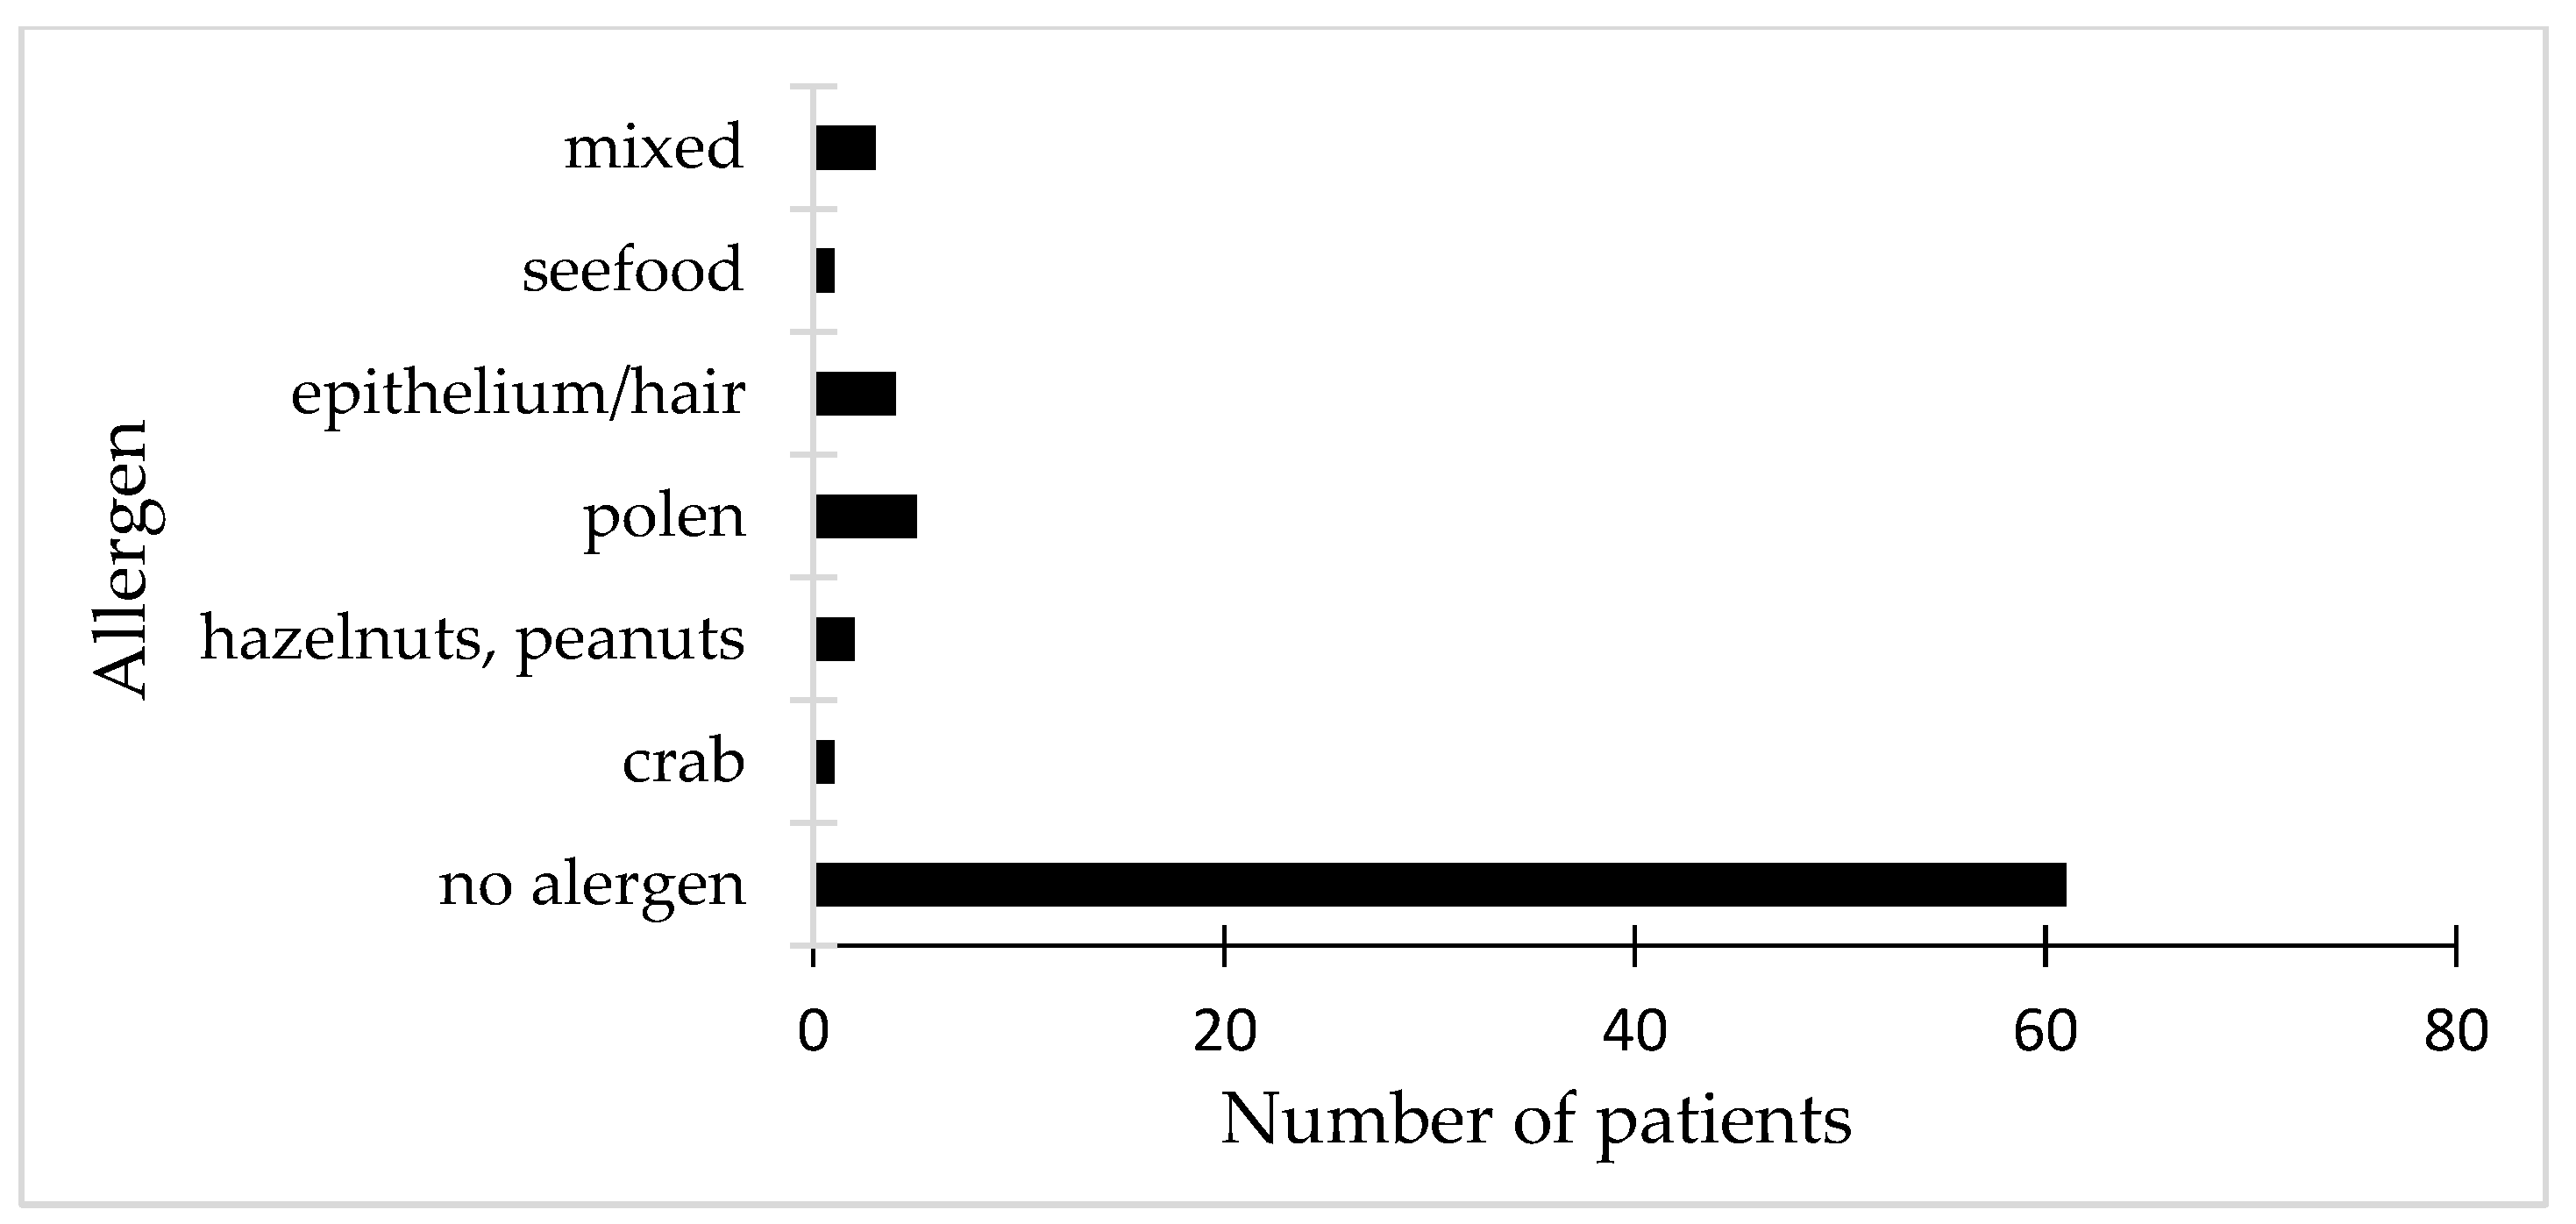
Table 1.
ROC analyses for total IgE levels (area under the ROC curve and test result variable(s)).
| Area | Std. Error a | Asymptotic Sig. b | Asymptotic 95% Confidence Interval | |
| Lower Bound | Upper Bound | |||
| 0.817 | 0.031 | 0.000 | 0.778 | 0.907 |
a. Under the nonparametric assumption. b. Null hypothesis: true area = 0.5.
Disclaimer/Publisher’s Note: The statements, opinions and data contained in all publications are solely those of the individual author(s) and contributor(s) and not of MDPI and/or the editor(s). MDPI and/or the editor(s) disclaim responsibility for any injury to people or property resulting from any ideas, methods, instructions or products referred to in the content. |
© 2025 by the authors. Licensee MDPI, Basel, Switzerland. This article is an open access article distributed under the terms and conditions of the Creative Commons Attribution (CC BY) license (http://creativecommons.org/licenses/by/4.0/).
Copyright: This open access article is published under a Creative Commons CC BY 4.0 license, which permit the free download, distribution, and reuse, provided that the author and preprint are cited in any reuse.


