
Submitted:
03 May 2025
Posted:
05 May 2025
You are already at the latest version
Abstract
This paper deals with a comparative study of the effect of carbon nanotubes (CNTs) and expanded graphite (EG) on the thermal, mechanical, morphological, electrical, and piezoresistive properties of poly(ethylene-co-methacrylic acid) (EMAA) nano-composites. To this end, different amounts of carbonaceous fillers (5, 10, 15 wt% of CNT and 10, 15, 30 wt% of EG) have been added to the EMAA thermoplastic matrix. The electrical percolation threshold (EPT) was determined to know the percentages of nanofillers capable of forming a continuous electrical conductive network through the matrix. The thermogravimetric analysis (TGA) highlights that the conductive network behaves like a protective mesh against thermo-oxidative degradation. Differential scanning calorimetry (DSC) evidences how the presence of carbon nanoparticles af-fects the crystallinity of the EMAA matrix. From a mechanical point of view, the stress-strain curves, the storage modulus, and the graph of tan demonstrate that both the fillers determine an enhancement in the Yang and storage moduli and in the glass transition temperature. A quantitative comparison between the different fillers evi-dences greater improvements for the bidimensional nanofiller, most likely due to the cumulative effect of more extended filler-matrix interactions. Field Emission Scanning Electron Microscopy (FESEM) and Tunnelling Atomic Force Microscopy (TUNA) were used to study the interaction between the filler nanoparticles and the polymeric chains of the hosting thermoplastic matrix. Among all the experimented filler concentrations, EMAA 10% CNT and EMAA 15% EG have been selected for studying the piezoresis-tive response of the formulated nanocomposites. The electrical parameters were found to depend sensitively on the aspect ratio and the structural and morphological features of the nanofillers. A very relevant difference was detected in the Gauge Factor (G.F.) of the two typologies of nanocomposites. The G.F. of EMAA 10% CNT and EMAA 15% EG, were found to be 0.5 and 165, respectively.
Keywords:
carbon nanotubes
; expanded graphite
; strain sensitivity
; soft nanocomposites
1. Introduction
Poly(ethylene-co-methacrylic acid) (EMAA) is a thermoplastic soft material present on the market in the forms of copolymers and ionomers. Its chemical structure is characterized by the presence of carboxyl groups along the backbone of the macromolecules. More in detail, EMAA has a block structure made of segments of poly(ethylene)(E) and polymethacrylic acid (MAA). The characteristic elasticity of EMAA is due to the E-segments that favor a partial recovery of the initial shape, while the MAA segments containing carboxylic groups establish intermolecular chemical interaction (i.e., hydrogen bonds). In the case of ionomers, the acid groups are partially neutralized by metallic ions such as Sodium (EMAA_Na) or Zinc (EMAA_Zn) ions responsible for ionic cross-links [1] . EMAA copolymer and its ionomers have attracted a lot of interest in the research field because of their peculiar self-healing and shape memory properties [2,3]. The mobility of the E-segment, coupled with the strong attraction of MAA segments, allows the reduction of delamination of composites [4], to repair damage and improve energy dissipation during impact [5]. This is the reason why EMAA has been widely applied as self-healing material in epoxy resin [6,7,8,9] and in glass/carbon fiber composites [7,9,10,11,12,13] to mitigate costly maintenance of aeronautical vehicles, facilitate repair of difficult-to-access structures (e.g., wind-turbine blades), and reduces part replacement. More recently, Snyder et al. [14] used the Fused Filament Fabrication (FFF) process to locally depose beads of EMAA into a glass fiber and carbon fiber reinforced panel to impart self-healing function to the final composite structure, demonstrating the possibility of processing this material with Additive Manufacturing (AM) technologies. EMAA has been revealed to be a valuable and advantageous component that is also blended with other thermoplastic polymers. Blending thermoplastic materials is a common practice in the industrial and research fields to combine the benefits of two or more materials [15]. As proof of this, EMAA has been blended with polyethylene (PE) to improve adhesion properties and obtain a matte surface for packaging applications [16]. It has been demonstrated that only 3 wt% of EMAA copolymer is sufficient to make 3:1 mass ratio of polyethylene terephthalate (PET) bottles and polyethylene bags compatible for the recycling of plastic wastes [17]. Poly(ε-caprolactone)/EMAA-Zn blend has been studied to merge PCL diffusion with thermo-responsive shape memory, ionic interactions, and supramolecular bonds of EMAA-Zn to obtain a final material of healing efficiencies between 90% and 96% [18].
However, EMAA could be a good candidate for strain sensor applications due to its high stretchability. To the author's knowledge, only a few papers are focused in the literature on EMAA nanocomposites for self-sensing applications. Using nanoparticles is one of the most effective strategies to add the self-sensing function to EMAA polymer [19,20]. Carbon nanotube (CNT) [21,22,23], expanded graphite (EG) [24,25,26], short carbon fibers [27,28], carbon black [29,30], metallic and ceramic nanoparticles [31,32,33] are the most used filler for improving the electrical, thermal and mechanical properties of the thermoplastic matrix and to confer smart functions to the resulting nanocomposite materials. Basuli et al. [34,35] were among the first researchers interested in EMAA-CNT nanocomposites. The authors focused their attention on morphological, thermal, and mechanical characterization. Cohen et al. [36] performed an investigation a few years later, trying to lower the electrical percolation threshold by non-covalent compatibilization of the EMAA matrix and CNT with 4-(aminomethyl)pyridine. The applications mentioned in their work are antistatic packaging, electromagnetic interference shielding films, conductive inks, paints, and a conductive coating on top of polyolefin matrices. Another example of EMAA nanocomposite is given by Tita et al. [37], who exploited zirconate titanate as a piezoelectric active filler (PZT) to develop reliable piezoelectric strain sensors applicable over an extensive temperature range, from liquid nitrogen temperature to the cure temperature of high-performing polymer matrix composite materials, for in situ health monitoring of aircraft components. Lastly, the only example of piezoresistive characterization of the EMAA-CNT system is provided by Hia et al. [38]. In their work, the authors used fused filament fabrication (FFF), an AM technology, to customize and directly depose on a glass fiber composite an EMAA-CNT-based piezoresistive sensor for structural health monitoring (SHM) applications, obtaining a minimal sensor hysteresis after twenty flexural load-unload cycles. Based on this example and the literature review, the present paper aims to cover the lack of EMAA nanocomposites for strain monitoring by comparing two different systems: CNT and EG-based EMAA nanocomposites. The differences and the common points between them have been evidenced and investigated through a dense and in-depth correlation between thermal, mechanical, morphological, electrical, and piezoresistive results.
2. Materials and Methods
EMAA copolymer (CAS#9010-77-9) has been provided by Scientific Polymer Products, Inc. (Sp2) (Ontario, NY, USA). Carbon nanotubes (CNTs) and Expanded graphite (EG) used in the present paper were supplied by ARKEMA (GRAPHISTRENGTH C100) and by Superior Graphite Co (Chicago, Illinois, USA), respectively. The authors have calculated the aspect ratio of these two fillers in previous work; it is around 1000 for the CNT and between 1128 and 3541 for EG [39].
EMAA nanocomposite blends were obtained by mixing overnight dried pristine EMAA copolymer in the form of pellets with nanofiller powder in a twin counter-rotating internal mixer (Rheomix 600 Haake, Germany) connected to a control unit (Haake PolyLab QC). The mixing temperature, rotation speed, and mixing time were 150°C, 50 rpm, and 10 min, respectively. These process conditions are common to all prepared blends. Then, nanocomposite materials are obtained in sheets of about 1mm thickness via the compression molding process, for which a Carver press (Wabash, IN, USA) was used. Thermo-gravimetric analysis (TGA), differential scanning calorimetry (DSC), and dynamic mechanical analysis (DMA) have been performed using the equipment and the methods described in Table 1.
FESEM micrographs of the printed samples were acquired using the equipment and procedures described in Ref. [40]. Before the FESEM investigation, the samples were subjected to a procedure to remove part of the polymeric matrix using an oxidizing solution (etching solution), according to Ref.[41]. The etching treatment used for the FESEM investigation was also adopted to prepare samples for the TUNA investigation, which was performed via NanoScope Analysis 1.80 (Build R1.126200; Bruker, Billerica, MA, USA). The optimized parameters for this technique are reported in Table S1 of the Supplementary Materials (S.M.). TUNA images were elaborated according to Ref [42].
Electrical conductivity was measured for all the experimented EMAA nanocomposites according to Ref. [43]. Piezoresistive properties were investigated during the tensile test. The mechanical response was monitored by an INSTRON dynamometer (series 5967 INSTRON, Norwood, Massachusetts, USA) equipped with a long stroke extensometer (XL) 750 mm to measure the real sample strain. A 1 mm/min strain rate was applied to specimens (dimensions: 0.1x10x1 cm3). Two-wire electrical resistance variation during the tensile test was measured by a Multimeter 3458A (Agilent, Santa Clara, CA, USA) coupled with a designed Labview program with an acquisition frequency of 2 Hz.
3. Results and Discussion
3.1. Electrical Properties
The electrical conductivity to the EMAA matrix has been imparted by adding CNT and EG filler in different concentrations in such a way as to investigate the region near the electrical percolation threshold (EPT), which ranges from the point where the electrically conductive network starts to form till it is entirely built. Figure 1 shows the electrical conductivity (σe) as a function of the filler concentration (%wt./wt.). A considerable increase in electrical conductivity is obtained by adding conductive fillers in percentages equal to or higher than 5% for CNTs and 10% for EG.
The electrical conductivity passes from 10-16 S/m of the insulating polymeric matrix alone [44] to 2.6 S/m for 15 wt% of CNT and 0.41 S/m for 30 wt% of EG. The insulator-to-conductor transition happens only when a continuous conductive path allows the electron to flow through the material [45]. According to the electrical percolation threshold theory, the inter-particle distances must be sufficiently near the so-called "tunneling distance" to allow an appreciable electrical current flow [46,47]. In the two cases studied herein, the insulator-to-conductor transition occurs below 5 wt% for CNT-based nanocomposites and below 10 wt% for EG-based nanocomposites. The difference in the EPT values is most likely attributable to the different number of functional groups on the edges of the two types of fillers and their shape [48]. As regards the first aspect, based on the characterization of the nanofillers summarized in the Supplementary Materials (S.M), a higher content of oxygen was detected for EG than CNT, meaning that on the edge surface of EG nanoparticles, there is a larger number of oxygenated functional groups which reduces the electrical conductivity increasing the electrical percolation threshold value [39]. Moreover, although both nanofillers show a high aspect ratio (about 1000), the EG is classified as a 2D particle, while a CNT is a 1D nanoparticle (second aspect). Concerning the first aspect, the elemental composition, evaluated through X-ray Photoelectron Spectroscopy (XPS), provides a value of the ratio C/O of 74.76 for the CNT filler and 35.10 for the EG (see Figure S1 c and Figure S2 c, respectively).
From Transmission electron microscopy (TEM) images shown in the S.M. section, CNTs (see Figure S1d) appear as long and interconnected bundles like ropes, while EG nanoparticles (see Figure S2d) have a sheet-like shape. The rope structure of the CNTs allows the formation of a conductive network at a lower concentration of the filler than that obtained for the 2D nanofiller; similar results were obtained with nanocomposites based on a thermosetting matrix [43]. Electrical results are corroborated by the SEM investigation described in the following paragraph.
3.2. Morphological Investigation: SEM Images
Figure 2 shows SEM images of EMAA nanocomposites in correlation with their relative electrical conductivity values. An oxidizing treatment was performed on the samples before morphological investigation to make nanofiller particles more visible. The main aspect to be underlined is the increase in the density of the CNT (Figure 2a,b,c) and EG (Figure 2d,e,f) network by increasing the filler content. CNTs appear to be distributed over the entire sample surface, especially in Figure 2c, for the highest analyzed filler content, for which the sample is beyond the EPT value. In Figure 2a, b, CNTs are less densely distributed, justifying the lower conductivity. In the same way, according to the EPT of EG-based nanocomposites (Figure 1), the conductive network starts to form at 10 wt% when EG particles begin to be sufficiently closer (Figure 2d). Increasing the filler content reduces the insulating regions between EG particles, making them better interpenetrated into the matrix (Figure 2f).
Moreover, SEM evidences the role of filler shape in constructing the conductive path. The rope-like shape of CNT allows for the easy creation of contact points along with one CNT with the adjacent ones. In the case of EG filler, the sheet-like shape requires a higher concentration of filler content to build a continuous conductive path. This condition is evident when comparing Figure 2c with Figure 2e where the matrix is loaded with the same filler concentration (i.e., 15% CNT and 15 %EG, respectively). Insulating zones of the polymeric matrix are not detectable in the EMAA 15% CNT system.
In comparison, some EG particles appear sufficiently far apart in the EMAA 15% EG sample to hinder the electrical current flow. These results perfectly agree with those related to the thermogravimetric analysis commented on in the next section.
3.3. Thermal Analysis
3.3.1. Thermogravimetric Analysis (TGA)
Thermogravimetric analysis was carried out to evaluate the effect of the two typologies of nanofillers and their percentage on the thermal stability of the EMAA polymer, as previously done with a thermosetting polymeric matrix [49]. Figure 3 shows the TGA and derivative thermogravimetric curves (DTGA), obtained under reactive atmosphere (air), of the EMAA-CNT and EMAA-EG nanocomposites together with the two nanofillers (CNTs and EG powder) and EMAA matrix, respectively.
As expected, CNT and EG filler (dot lines in Figure 3 a,c) are more thermally stable than the EMAA matrix alone (solid black line in Figure 3 a,c). EG nanoparticles are stable up to 700 °C, about 100 °C higher than CNTs. The presence of the filler in the nanocomposites causes an increase in their thermal stability since filler nanoparticles hinder the thermo-oxidation of the polymer in the early stage [50]. Both thermogravimetric curves manifest two main steps of degradation events, the first due to the polymeric matrix and the second/last one due to filler degradation. The study of DTGA curves (Figure 3 b,d) allows us to identify at least three main degradation steps after the interval of temperature where the nanocomposites are stable (i.e., processing windows), that are: i) the main degradation of polymer chains, ii) the oxidation of charred residue, and iii) the degradation of filler. The first degradation step is due to dehydration and random and homolytic scission of a methoxycarbonyl side group [34,51] followed by the degradation of the ethylene main chains [35]. The second step at a temperature higher than 510°C is due to oxidation of the charred residue formed by oxidative dehydrogenation of EMAA taking place throughout the heating process in air, besides thermal oxidation and pyrolysis (for samples with CNTs). In particular, the charred residue obtained immediately downstream from the first loss curve completely disappears in the second main degradation step corresponding to the filler degradation only, whose value strongly depends on the filler nature. Since EG filler degrades at a higher temperature than CNT, the degradation step for EG in the nanocomposites starts at a higher temperature (around 700 °C) with respect to the value of 570°C related to the nanocomposites with CNT filler. As expected, the EMAA component does not influence the degradation of the carbonaceous filler, whereas the filler considerably stabilizes the polymer at the beginning of the degradation phenomena.
The extension of the processing window changes from CNT-based nanocomposites to EG-based nanocomposites, even though it is only by a few degrees. More in detail, in Tables S1 and S2 of the S.M., the value of the initial degradation temperature evaluated at the 5% by weight loss is higher for all the experimented concentrations of CNT nanocomposites than the EG nanocomposites. This result is most likely due to the type of network that hinders the diffusion of gases. Filler particles physically hinder both the penetration of oxidative gases into the matrix and the release of pyrolytic gases ("labyrinth effect") [52], increasing the average free path of gases. Since the conductive fillers also protect against degradation, the degradation temperature is expected to be higher in the nanocomposites where the electrical path is formed. As shown in paragraph 3.1, the electrically conductive path composed of CNT forms at a lower filler concentration than the EG filler. This aspect explains why EMAA-CNT nanocomposites at lower filler concentrations are more thermally stable than EMAA-EG nanocomposites. In other words, at the same filler content of 15 wt% in the EMAA-CNT sample, the conductive network is already formed, and it is the same network that protects the polymeric chains against the gas contacts.
On the other hand, at 15 wt% of EG, the conductive network is not completely formed (as also highlighted in Figure 2e of the SEM images). Thus, it is less effective against the degradation. As well as the electrically conductive network forms in the EMAA-EG nanocomposites at 30 wt%, the degradation temperature becomes more similar to that of the EMAA-CNT nanocomposite. SEM image (Figure 2f) of EMAA 30% EG confirms the presence of a more robust filler network against oxidative gas diffusion.
Another aspect to be considered is the shape of the main peak of the DTGA, which differs between EMAA-CNT and EMAA-EG nanocomposites. In the case of CNT-based nanocomposites, carbon nanotubes form a thin layer of polyaromatic carbon char, protecting the underlying polymer from oxygen. For this reason, the thermal stability does not change significantly with the filler concentration, as confirmed by Bocchini et al. [50] in a study on polyethylene-based composite. For EG-based nanocomposites, it can be noted that the step 1 becomes composed of two peaks, one near the peak of the pristine matrix and the other one at a higher temperature. The changes in the DTGA curves suggest that at 10% wt. of EG, a fraction of the matrix degrades almost at the same temperature as the unfilled matrix, whereas a second fraction degrades at a higher temperature (see the profile of the orange curve in Figure 3 d). This behavior is mainly due to the morphological arrangements of the graphitic block in the matrix. Most probably, it is also correlatable with the Electrical behavior of the sample. In fact, in EMAA 10% EG, at a low concentration of the filler particles, there are still few graphitic blocks in forming a percolative network. From an electrical point of view, the path of oxidative gases is not so tortuous, and they can easily reach some of the unprotected matrix regions. Then, the sample shows a fraction of the polymeric matrix, which degrades almost at the same temperature as the unfilled matrix, and a second fraction with a higher degradation temperature corresponding to the fraction that degrades at higher temperatures (see the profile of the orange curve in Figure 3 d). For higher filler concentrations, this phenomenon is less marked and the main change is observed at higher temperatures, as expected when the percolative network is completely formed as for the 30 wt% of the filler particles.
3.3.2. Differential Scanning Calorimetry (DSC)
Differential scanning calorimetry allows the determination of the crystallinity degree (Xc), melting temperature (Tm), crystallization temperature (Tc), and glass transition temperature (Tg), which are helpful in the investigation of the structure of the polymer, which strongly affects the mechanical properties of the material. The crystallinity degree (Xc) of the EMAA and the composites was determined by the melting peak area as follows (Equation 1)
where ∆Hm is the melting enthalpy of the sample, ∆H0m is the melting heat for 100% crystalline EMAA (taken to be 290.4 J/g, [53]), and f is the mass fraction of matrix in the nanocomposite materials. Figure 4 shows the DSC heating and subsequent cooling thermograms of the EMAA nanocomposites, while Table 2 and Table 3 summarize the corresponding thermal parameters.
Both the heating and cooling curves of EMAA nanocomposites suggest the formation of small crystals that originate from filler nanoparticles acting as heterogeneous nuclei. Heating curves in Figure 4a,c show that the melting temperature tends to decrease by a few degrees (see Table 2 and Table 3) by increasing the filler content (both in the case of CNT and EG), indicating a reduction in crystal size. This hypothesis is also confirmed by the widening of the melting peak in the presence of filler nanoparticles, which opens at lower temperatures than that the matrix alone. The nucleation effect of filler nanoparticles is also evident from the cooling curves of Figure 4 b,d. In fact, the crystallization enthalpy increases with increasing filler content, and the crystallization event starts at higher temperatures both in the presence of CNT or EG filler (see Tc values in Table 2 and Table 3). Increasing the filler content (from 5% to 10% for EMAA CNT nanocomposites and from 10% to 15% EG for EMAA EG nanocomposites), the number of nuclei increases, leading to an increase of small crystals and of the crystallinity degree [54]. However, when the filler content is high, small crystals are not meant to grow as in the matrix alone because the arrangement of conductive filler in a network structure exerts a nanoconfinement effect. This means that, while on the one hand the nucleation effect of the nanoparticles favors the formation of crystals, on the other hand, the nanoconfinement effect limits their growth. In the sample of EMAA 15% CNT, the nanoconfinement effect prevails over the nucleation effect, and the degree of crystallinity lowers.
3.4. Mechanical Characterization
3.4.1. Dynamic Mechanical Analysis (DMA)
DMA analysis was performed to investigate the changes in the mechanical response of the matrix in the presence of the two different fillers. The storage modulus and loss factor (tan δ) vs. temperature for the neat polymer and nanocomposites are reported in Figure 5. The storage modulus starts to decrease from 0°C up to 80°C (Figure 5a,b), where the glass transition event occurs as shown by the tanδ profile in Figure 5c,d. As expected, the introduction of rigid fillers (CNT and EG) in the polymeric matrix causes an increase in storage modulus. This is due to the fact that both the theoretical modules of CNTs (around 0.2-1.0 TPa [55]) and EG (around 1.0- 2.8 TPa [56,57]) are higher than that of the matrix. Comparing the storage modulus of EMAA-CNT nanocomposites with that of EG-based nanocomposites (Figure 5a,c), a higher increase is detected in the presence of EG filler. A higher number of polar groups on the surface of the 2D filler (see S.M.), together with a higher surface area of EG, leads to better filler-matrix interactions responsible for an effective transmission of load applied from the matrix to the more rigid filler.
The tan δ profile also changes due to the presence of the filler (Figure 5b,d).
According to the theory of Stimonaris et al. [58], tan δ profile can be analyzed as a distribution of multiple relaxation phenomena involving regions at different chain mobility. In the case of nanocomposite materials, filler nanoparticles represent physical knots in the matrix, limiting chain movements and causing a shift in the maximum of tan δ profiles of EMAA nanocomposites at higher temperatures [59]. The shift of the tan δ peak means that in the nanocomposites, the fraction of regions at reduced mobility increases. In fact, polymeric chains confined between filler nanoparticles have low freedom of movement due to both nanoparticle-polymer interactions and filler rigidity.
The increase in the crystallinity obtained by introducing the filler (see Section 3.3.2), added to the contribution of polymeric chains confined between filler nanoparticles causes a shift and an enlargement of the tan δ peak
This last phenomenon is particularly relevant for EMAA 15 % CNT and EMAA 30% EG samples. In these samples, the conductive network is more "robust" since the higher filler content implies a dense dispersion of nanoparticles in the whole matrix, as confirmed by electrical and morphological investigation. In these two cases, the contribution of regions characterized by nanoparticle-polymer interactions plays a relevant role.
3.4.2. Tensile Test
The real mechanical deformation, here also indicated as true strain, is the deformation of the material calculated by considering the necking phenomenon. EMAA matrix a soft material that undergoes cross-section reduction during the loading phase (i.e., the necking phenomenon). For this reason, from a mechanical point of view, it is more appropriate to convert the stress and the strain calculated on the base of the initial cross section of the sample, and respectively, into the true stress and the true strain (i.e., and , respectively), considering the cross-section reduction of the materials during the loading phase as follow:
The comparison of the mechanical properties of EMAA pristine matrix with those of nanocomposites systems is reported in Figure 6.
The mechanical curve of the EMAA matrix is typical of a block copolymer [55], characterized by two distinct regions: region 1, below 10% of true strain, and region 2, above this point, up to failure. Region 1 includes the short elastic region and the beginning of plastic deformation. In fact, for soft polymers, the elastic region is restricted to low strains. Due to their organization into soft and rigid domains, block copolymers do not exhibit an evident yield stress [56]. The passage from region 1 to region 2 is characterized by a reduction in the slope of the mechanical curve. This means that the strain increases faster than the increase in applied stress due to the propagation of the necking phenomenon in the whole sample. In region 2, the stress rises almost linearly with the strain, absorbing energy to align the macromolecules in the load direction. The enlargement in Figure 6b evidences the similarity between the mechanical curve of EMAA- CNT nanocomposites with that of the pristine matrix alone and, at the same time, the limitation of EMAA 15% EG and EMAA- 30% EG curve to region 1. The two fillers in the matrix differently affect the behavior of the stress-strain curve. In the case of CNT-based polymer, thanks to their 1D shape and high aspect ratio, the CNT can easily interpenetrate macromolecules and accompany their movement under the applied load in the elastic region. At low CNT content, the curve of EMAA 5% CNT remains very similar to that of the EMAA matrix. As for electrical properties, in this case, the effect of the filler is still limited due to its low content. As filler concentration increases, the Young modulus of EMAA 10% CNT increases by 145% with respect to the matrix alone due to the efficient load transfer from the soft matrix to the more rigid CNT [39]. The functional groups of the matrix, in fact, could interact with the groups on the surface of the CNT [60], whose presence is demonstrated by the oxygen content detected in the XPS analysis (see Figure S1c). In addition, the high aspect ratio of the filler causes adequate stress transmission via interfacial shear between the CNT and the polymer [61]. CNTs continue to untangle, deforming together with the matrix until the applied load overcomes a critical value that causes CNT debonding from the matrix ("stick-slip" phenomenon [58]). From this point on, in region 2, macromolecules can straighten, as in pristine EMAA, due to the loss of stress transfer between the nanotubes and the matrix.
On the contrary, the mechanical curve does not show the second linear region in the case of EMAA 15% EG and EMAA 30% EG. According to the XPS results (Figure S2c), the oxygen content is higher than that of CNT (Figure S1c). It follows that a higher number of functional groups decorates the surface of EG nanosheets. This aspect justifies both the higher Young modulus and the absence of region 2. The higher the number of interactions between the filler nanoparticles and the matrix, the better the load transfer from the soft matrix to the rigid EG nanosheets (i.e., improvement of Young modulus). Moreover, when high stresses are applied to the material above the elastic regime, the material directly undergoes failure. The trend of the mechanical curve of EMAA 10% EG also evidences the absence of the stick-slip phenomenon in EG nanocomposites since the higher filler-matrix interactions do not allow the matrix to disengage from the filler before failure, as on the contrary happens for EMAA 10%CNT.
3.5. Piezoresistive Response
This paragraph compares the piezoelectric responses of CNT- and EG-based nanocomposites. Piezoresistive behavior of the two systems has been obtained by combining the mechanical test with the electrical resistance variation. Among all the experimented concentrations, EMAA 10% CNT and EMAA 15% EG have been selected as these samples show an electric conductivity value suitable for self-sensing applications [19]. In the case of low electrically conductive samples (i.e., EMAA 5% CNT and EMAA 10% EG), the reproducibility of the electrical response is low, while in the case of highly concentrated samples (EMAA 15% CNT and EMAA 30% EG), the sensitivity to the strain is reduced (as reported in the S.M.) [62]. The sensitivity to the mechanical strain is calculated in terms of the gauge factor (G.F.) defined as follows:
where is the electrical resistance variation with respect to the initial resistance value and is the real mechanical deformation of the sample. The so defined gauge factor is the equivalent of the slope of the piezoresistive curve in the elastic regime. A high G.F. value suggests that small deformations can be detected by high electrical resistance.
In Figure 7 and Figure 8, the mechanical curves of selected nanocomposites systems are reported jointly with their piezoresistive response (Figure 7a and Figure 8a).
To fully understand the differences obtained in the piezoresistive results, TUNA images of the two systems (EMAA 10% CNT and EMAA 15% EG) have been reported in Figure 7c and Figure 8c, respectively.
The first aspect emerging from Figure 7a, and Figure 8a is that the electrical resistance variation perfectly follows the mechanical trend both in the case of EMAA 10% CNT and EMAA 15% EG. This result is also confirmed at high filler concentrations (see Figure S3a,b of the S.M.). In the case of EMAA 10% CNT, the piezoresistive response can be divided into two consecutive exponential trends corresponding to linear trends on the mechanical curve of region 1 and region 2, respectively. On the other hand, EMAA-15% EG, characterized by a short elongation at break limited to region 1, has a piezoresistive response consisting of a single exponential trend. The exponential trend is typical of the "tunnelling effect", according to which electrons are able to pass from one conductive particle to the adjacent one only if the inter-particle space is sufficiently close to the so-called "tunneling distance" [63,64]. This distance may change with filler size and concentration, interphase thickness, and surface energy [65]. When the nanocomposite material is under a tensile stress, the electrical resistance at the interface between particles (i.e., tunnelling resistance) increases because of a variation in the tunneling distance and contact area, causing a monotonic increase in the electrical resistance of the whole sample. The G.F. of EMAA 10% CNT is 0.5 (see Figure 7b), while a much higher value is obtained in the case of EMAA 15% EG, that is 165 (see Figure 8b). Not only in the linear region but along the entire tensile test, the EG-based nanocomposite remains more sensitive to the strain than CNT nanocomposites, as can be noted by the right vertical axis scale of Figures 7a and 8a. Considering the same strain value, the corresponding ΔR/R0 of EMAA-15%EG is higher than ΔR/R0 of EMAA 10% CNTs, although it has a lower filler content. The higher sensitivity of the EG sample than that obtained with the CNT filler relies on how the different aspect ratios and particle contact area affect the conductive network when the nanocomposite material is under load. To better understand this aspect, TUNA images in Figures 7c and 8c show CNT and EG based conductive networks at a nanoscale level. TUNA images (Height, Deflection Error, Friction, and TUNA Current) reported in Figures 7c and 8c were collected in a single region of the EMAA 10% CNT and EMAA 15% EG samples, respectively. From the Deflection Error image, the presence of carbon nanotubes can be detected as extended bundles along their length over the entire investigated area, as confirmed by the FESEM image at high magnification in Figure 2b. The Friction image serves as a map of the lateral flexion of the cantilever during the sample scan. This signal not only contains information about the friction between the sample and the tip but also offers topographic details about the non-flat sample surface. In the present case, the regions with a higher friction value correspond to the high conductive area more densely populated by CNT. The conductive network composed of CNT emerges more clearly from the TUNA Current image, for which electric current values ranging from -12.3 pA to 9.4 pA are measured. In the TUNA Current image, the electric current values linked to the local conductive domains dispersed across the matrix at the nanometric level are represented by the respective colors on the side scale bar. It is possible to distinguish a densely interconnected network characterized by a linked tangle arrangement, colored light green, on the entire investigated region. When external stress acts on the nanocomposites, the material deformation leads to an increase in the tunneling distance between CNT particles. However, since CNTs form an intricated network, new contacts may form with other neighboring CNTs [66], limiting a huge increase in the electrical resistance.
In the case of EMAA 15%EG, the TUNA image, together with Friction and Deflection Error images clearly shows partially overlapped EG sheets. When external stress is applied to EG-based nanocomposites, graphitic blocks change their arrangement and orientation, causing a reduction of the overlapping area and interlayer distance [66]. Due to their 2D structure, each EG particle may have a large contact area with another EG block. However, small deformation in the nanocomposite is sufficient to reduce the contact area, i.e., tunneling area, resulting in a large variation in the electrical resistance [43]. For this reason, the increase in the electrical resistance sensed by CNT nanocomposite is lower than the electrical resistance variation shown by EG nanocomposite [67,68]. As can be seen from the TUNA Current image of the sample EMAA 15%EG, electric current values ranging from -1.1 pA to 1.3 pA are measured.
5. Conclusions
The EMAA matrix has been mixed with two different carbon-based nanofillers separately, namely carbon nanotubes (CNTs) and expanded graphite (EG). The diverse content of polar groups on fillers surface and their different shape affects electrical, thermal, mechanical, morphological and piezoresistive properties of EMAA nanocomposites. The main conclusions are summarized as follows:
From an electrical point of view, higher filler content is required in the case of EG particles, mainly due to the characteristic 2D shape to reach the EPT. On the contrary, the rope-like shape of CNT (1D filler) allows to reach the EPT at lower filler concentrations.
CNTs seem to be more effective in the improvement of thermal stability than EG filler since, as for the electrical percolation threshold, lower concentrations of CNTs are sufficient to create an interconnected protective network against oxidative gases.
Comparing the DSC results of EG-based nanocomposites with those of CNTs-based nanocomposites, it can be concluded that both fillers have the same effect on the crystallinity of the EMAA matrix, slightly favoring the crystallinity.
DMA results of EG-based nanocomposites and CNT-based nanocomposites show a high elastic modulus in the case of EG filler. The higher number of interaction between EMAA matrix and the polar groups on the EG edges lead to a more effective transmission of the load applied from the matrix to the rigid filler in the EMAA-EG nanocomposites than in the EMAA-CNT nanocomposites.
Higher Young modulus of EG nanocomposites than CNT nanocomposites have been confirmed by tensile test. The lower number of CNT-matrix interactions favors the stick-slip phenomenon obtaining high elongation at break, while EMAA-EG samples directly undergo the failure at high applied stress.
Both piezoresistive response of EMAA 10% CNT and EMAA 15% EG perfectly reproduce the mechanical behavior during tensile tests. The 2D shape of EG nanoparticles justify the much higher gauge factor of EMAA 15% EG (165) than the value of EMAA 10% CNT gauge factor (0.5).
Supplementary Materials
The following supporting information can be downloaded at the website of this paper posted on Preprints.org, Figure S1: a) C1s scans of powders by XPS analysis; b) O1s scans of powder by XPS analysis; c) elemental composition and percentage of groups of CNT by XPS analysis; d) TEM image of CNT; Figure S2: a) C1s scans of powders by XPS analysis; b) O1s scans of powder by XPS analysis; c) elemental composition and percentage of groups of EG by XPS analysis; d) TEM image of EG; Figure S3: Piezoresistive response during tensile test of a) EMAA 15 % CNT and b) EMAA 15 % EG; Table S1: Characteristic temperatures of D-TGA of EMAA-CNT nanocomposites; Table S2: Characteristic temperatures of D-TGA of EMAA-EG nanocomposites;.
Author Contributions
Conceptualization, L.G. and F.A.; methodology, F.A., R.L., L.V. and M.R.; software, R.L., A.S., L.V. and F.A.; validation, L.G., R.P., F.A., A.S. and M.R; formal analysis, A.S., R.L. and M.R.; investigation, A.S., R.L., F.A., L.V. and M.R.; resources, L.G., A.S. and R.P.; data curation, L.G., R.L., L.V., R.P. and F.A.; writing—original draft preparation, F.A., L.V. and M.R.; writing—review and editing, F.A., L.V., L.G. and M.R.; visualization, R.P., R.L., L.V. and A.S.; supervision, L.G., R.P. and M.R.; project administration, L.G. and R.P. All authors have read and agreed to the published version of the manuscript.
Funding
This research received no external funding.
Data Availability Statement
The data presented in this study are available on request from the corresponding author due to privacy reasons.
Conflicts of Interest
The authors declare no conflicts of interest.
Abbreviations
The following abbreviations are used in this manuscript:
| MDPI | Multidisciplinary Digital Publishing Institute |
| DOAJ | Directory of open access journals |
| TLA | Three letter acronym |
| LD | Linear dichroism |
References
- Fallahi, A.; Bahramzadeh, Y.; Tabatabaie, S.E.; Shahinpoor, M. A Novel Multifunctional Soft Robotic Transducer Made with Poly (Ethylene-Co-Methacrylic Acid) Ionomer Metal Nanocomposite. Int J Intell Robot Appl 2017, 1, 143–156. [CrossRef]
- Tiwari, S.; Bag, D.S.; Dwivedi, M. Poly (Ethylene-Co-Methacrylic Acid) (PEMA) Ionomers and Their Applications Including Self-Healing and Shape Memory Applications. Journal of Polymer Research 2024, 31, 1–40. [CrossRef]
- Cunha, R.B. da; Agrawal, P.; Brito, G. de F.; Mélo, T.J.A. de Exploring Shape Memory and Self-Healing Behavior in Sodium and Zinc Neutralized Ethylene/Methacrylic Acid (EMAA) Ionomers. Journal of Materials Research and Technology 2023, 27, 7304–7317. [CrossRef]
- Peñas-Caballero, M.; Chemello, E.; Grande, A.M.; Hernández Santana, M.; Verdejo, R.; Lopez-Manchado, M.A. Poly(Ethylene-Co-Methacrylic Acid) Coated Carbon Fiber for Self-Healing Composites. Compos Part A Appl Sci Manuf 2023, 169, 107537. [CrossRef]
- Zhang, Z.; Tie, Y.; Li, C. Low-Velocity Impact and Self-Healing Behavior of CFRP Laminates with Poly(Ethylene-Co-Methacrylic Acid) Filament Reinforcement. Polym Compos 2023, 44, 6012–6026. [CrossRef]
- Meure, S.; Wu, D.Y.; Furman, S. Polyethylene-Co-Methacrylic Acid Healing Agents for Mendable Epoxy Resins. Acta Mater 2009, 57, 4312–4320. [CrossRef]
- Pingkarawat, K.; Dell’Olio, C.; Varley, R.J.; Mouritz, A.P. Poly(Ethylene-Co-Methacrylic Acid) (EMAA) as an Efficient Healing Agent for High Performance Epoxy Networks Using Diglycidyl Ether of Bisphenol A (DGEBA). Polymer (Guildf) 2016, 92, 153–163. [CrossRef]
- Dell'Olio, C.; Yuan, Q.; Varley, R.J. Epoxy/Poly(Ethylene-Co-Methacrylic Acid) Blends as Thermally Activated Healing Agents in an Epoxy/Amine Network. Macromol Mater Eng 2015, 300, 70–79. [CrossRef]
- Nascimento, A.; Trappe, V.; Pavasaryte, L.; Melo, J.; Barbosa, A.P.C. Effects of Particle Size and Particle Concentration of Poly (Ethylene-Co-Methacrylic Acid) on Properties of Epoxy Resin. J Appl Polym Sci 2024, 141, e55677. [CrossRef]
- Azevedo do Nascimento, A.; Trappe, V.; Diniz Melo, J.D.; Cysne Barbosa, A.P. Fatigue Behavior of Self-Healing Glass Fiber/Epoxy Composites with Addition of Poly (Ethylene-Co-Methacrylic Acid) (EMAA). Polym Test 2023, 117, 107863. [CrossRef]
- Zhang, X.; Zhao, G.; Lai, J.; Yu, T.X.; Zhang, X. Interlaminar Toughening and Self-Healing Mechanism for Hard-and-Soft Layered Composite Laminates. Compos Part A Appl Sci Manuf 2025, 189, 108623. [CrossRef]
- Hargou, K.; Pingkarawat, K.; Mouritz, A.P.; Wang, C.H. Ultrasonic Activation of Mendable Polymer for Self-Healing Carbon–Epoxy Laminates. Compos B Eng 2013, 45, 1031–1039. [CrossRef]
- Pingkarawat, K.; Wang, C.H.; Varley, R.J.; Mouritz, A.P. Mechanical Properties of Mendable Composites Containing Self-Healing Thermoplastic Agents. Compos Part A Appl Sci Manuf 2014, 65, 10–18. [CrossRef]
- Snyder, A.D.; Phillips, Z.J.; Turicek, J.S.; Diesendruck, C.E.; Nakshatrala, K.B.; Patrick, J.F. Prolonged in Situ Self-Healing in Structural Composites via Thermo-Reversible Entanglement. Nature Communications 2022, 13, 1–12. [CrossRef]
- Aliberti, F.; Oliviero, M.; Longo, R.; Guadagno, L.; Sorrentino, A. Effect of Crystallinity on the Printability of Poly(Ethylene Terephthalate)/Poly(Butylene Terephthalate) Blends. Polymers (Basel) 2025, 17, 156. [CrossRef]
- Ali, S.; Ji, Y.; Zhang, Q.; Zhao, H.; Chen, W.; Wang, D.; Meng, L.; Li, L. Preparation of Polyethylene and Ethylene/Methacrylic Acid Copolymer Blend Films with Tunable Surface Properties through Manipulating Processing Parameters during Film Blowing. Polymers 2019, 11, 1565. [CrossRef]
- Rajasekaran, D.; Maji, P.K. Recycling of Plastic Wastes with Poly (Ethylene-Co-Methacrylic Acid) Copolymer as Compatibilizer and Their Conversion into High-End Product. Waste Management 2018, 74, 135–143. [CrossRef]
- da Cunha, R.B.; Agrawal, P.; da Silva Lúcio, A.; Cunha, C.T.C.; de Figueiredo Brito, G.; de Mélo, T.J.A. Evaluation of Shape Memory and Self-Healing of Poly(ε-Caprolactone)/Poly(Ethylene-Co-Methacrylic Acid) Ionomer (PCL/EMAA-Zn) Blends. J Mater Sci 2024, 59, 4700–4721. [CrossRef]
- Aliberti, F.; Guadagno, L.; Longo, R.; Raimondo, M.; Pantani, R.; Sorrentino, A.; Catauro, M.; Vertuccio, L. Three-Dimensional Printed Nanocomposites with Tunable Piezoresistive Response. Nanomaterials 2024, 14, 1761. [CrossRef]
- Guadagno, L.; Longo, R.; Aliberti, F.; Lamberti, P.; Tucci, V.; Pantani, R.; Spinelli, G.; Catauro, M.; Vertuccio, L. Role of MWCNTs Loading in Designing Self-Sensing and Self-Heating Structural Elements. Nanomaterials 2023, 13, 495. [CrossRef]
- Guadagno, L.; Aliberti, F.; Longo, R.; Raimondo, M.; Pantani, R.; Sorrentino, A.; Catauro, M.; Vertuccio, L. Electrical Anisotropy Controlled Heating of Acrylonitrile Butadiene Styrene 3D Printed Parts. Mater Des 2023, 225, 111507. [CrossRef]
- Aliberti, F.; Sorrentino, A.; Palmieri, B.; Vertuccio, L.; De Tommaso, G.; Pantani, R.; Guadagno, L.; Martone, A. Lightweight 3D-Printed Heaters: Design and Applicative Versatility. Composites Part C: Open Access 2024, 100527. [CrossRef]
- Guadagno, L.; Vertuccio, L.; Aliberti, F.; Pantani, R.; Raimondo, M.; Catauro, M.; Longo, R. Development of De-Icing/Self-Sensing Structural Composites via Controlled Joule Heating Curing. Compos B Eng 2025, 292, 112079. [CrossRef]
- Guadagno, L.; Foglia, F.; Pantani, R.; Romero-Sanchez, M.D.; Calderón, B.; Vertuccio, L. Low-Voltage Icing Protection Film for Automotive and Aeronautical Industries. Nanomaterials 2020, 10, 1343. [CrossRef]
- Raimondo, M.; Donati, G.; Milano, G.; Guadagno, L. Hybrid Composites Based on Carbon Nanotubes and Graphene Nanosheets Outperforming Their Single-Nanofiller Counterparts. FlatChem 2022, 36, 100431. [CrossRef]
- Guadagno, L.; Naddeo, C.; Sorrentino, A.; Raimondo, M. Thermo-Mechanical Performance of Epoxy Hybrid System Based on Carbon Nanotubes and Graphene Nanoparticles. Nanomaterials 2023, 13, 2427. [CrossRef]
- Zhan, X.; Su, K.; Tuo, X.; Gong, Y. Mechanical, Thermal, and Electrical Properties on 3D Printed Short Carbon Fiber Reinforced Polypropylene Composites. ACS Appl Polym Mater 2024, 6, 3787–3795. [CrossRef]
- Lu, H.; Li, Z.; Qi, X.; Xu, L.; Chi, Z.; Duan, D.; Islam, M.Z.; Wang, W.; Jin, X.; Zhu, Y.; et al. Flexible, Electrothermal-Driven Controllable Carbon Fiber/Poly(Ethylene-Co-Vinyl Acetate) Shape Memory Composites for Electromagnetic Shielding. Compos Sci Technol 2021, 207, 108697. [CrossRef]
- Chung, K.Y.; Xu, B.; Li, Z.; Liu, Y.; Han, J. Bioinspired Ultra-Stretchable Dual-Carbon Conductive Functional Polymer Fiber Materials for Health Monitoring, Energy Harvesting and Self-Powered Sensing. Chemical Engineering Journal 2023, 454, 140384. [CrossRef]
- Yuan, J.; Li, Q.; Ding, L.; Shi, C.; Wang, Q.; Niu, Y.; Xu, C. Carbon Black/Multi-Walled Carbon Nanotube-Based, Highly Sensitive, Flexible Pressure Sensor. ACS Omega 2022, 7, 44428–44437. [CrossRef]
- Longo, R.; Guadagno, L.; Lamberti, P. Electromagnetic Characterization of Polycaprolactone Electrospun Nanofibers Filled with Fe3O4Nanoparticles. 4th International Symposium on Multidisciplinary Studies and Innovative Technologies, ISMSIT 2020 - Proceedings 2020. [CrossRef]
- Chen, X.; Tang, Z.; Liu, P.; Gao, H.; Chang, Y.; Wang, G. Smart Utilization of Multifunctional Metal Oxides in Phase Change Materials. Matter 2020, 3, 708–741. [CrossRef]
- Marinho, T.; Costa, P.; Lizundia, E.; Costa, C.M.; Corona-Galván, S.; Lanceros-Méndez, S. Ceramic Nanoparticles and Carbon Nanotubes Reinforced Thermoplastic Materials for Piezocapacitive Sensing Applications. Compos Sci Technol 2019, 183, 107804. [CrossRef]
- Basuli, U.; Chaki, T.K.; Chattopadhyay, S.; Sabharwal, S. Thermal and Mechanical Properties of Polymer-Nanocomposites Based on Ethylene Methyl Acrylate and Multiwalled Carbon Nanotube. Polym Compos 2010, 31, 1168–1178. [CrossRef]
- Basuli, U.; Chaki, T.K.; Setua, D.K.; Chattopadhyay, S. A Comprehensive Assessment on Degradation of Multi-Walled Carbon Nanotube-Reinforced EMA Nanocomposites. J Therm Anal Calorim 2011, 108, 1223–1234. [CrossRef]
- Cohen, E.; Ophir, A.; Kenig, S.; Barry, C.; Mead, J. Pyridine-Modified Polymer as a Non-Covalent Compatibilizer for Multi-Walled CNT/Poly[Ethylene-Co-(Methacrylic Acid)] Composites Fabricated by Direct Melt Mixing. Macromol Mater Eng 2013, 298, 419–428. [CrossRef]
- Tita, S.P.S.; Magalhães, F.D.; Paiva, D.; Bertochi, M.A.Z.; Teixeira, G.F.; Pires, A.L.; Pereira, A.M.; Tarpani, J.R. Flexible Composite Films Made of EMAA−Na+ Ionomer: Evaluation of the Influence of Piezoelectric Particles on the Thermal and Mechanical Properties. Polymers 2022, 14, 2755. [CrossRef]
- Hia, I.L.; Snyder, A.D.; Turicek, J.S.; Blanc, F.; Patrick, J.F.; Therriault, D. Electrically Conductive and 3D-Printable Copolymer/MWCNT Nanocomposites for Strain Sensing. Compos Sci Technol 2023, 232, 109850. [CrossRef]
- Vertuccio, L.; Foglia, F.; Pantani, R.; Romero-Sánchez, M.D.; Calderón, B.; Guadagno, L. Carbon Nanotubes and Expanded Graphite Based Bulk Nanocomposites for De-Icing Applications. Compos B Eng 2021, 207, 108583. [CrossRef]
- Guadagno, L.; Sorrentino, A.; Delprat, P.; Vertuccio, L. Design of Multifunctional Composites: New Strategy to Save Energy and Improve Mechanical Performance. Nanomaterials 2020, 10, 2285. [CrossRef]
- Guadagno, L.; Vertuccio, L.; Naddeo, C.; Calabrese, E.; Barra, G.; Raimondo, M.; Sorrentino, A.; Binder, W.H.; Michael, P.; Rana, S. Self-Healing Epoxy Nanocomposites via Reversible Hydrogen Bonding. Compos B Eng 2019, 157, 1–13. [CrossRef]
- Longo, R.; Raimondo, M.; Vertuccio, L.; Ciardulli, M.C.; Sirignano, M.; Mariconda, A.; Della Porta, G.; Guadagno, L. Bottom-Up Strategy to Forecast the Drug Location and Release Kinetics in Antitumoral Electrospun Drug Delivery Systems. Int J Mol Sci 2023, 24, 1507. [CrossRef]
- Spinelli, G.; Lamberti, P.; Tucci, V.; Guadagno, L.; Vertuccio, L. Damage Monitoring of Structural Resins Loaded with Carbon Fillers: Experimental and Theoretical Study. Nanomaterials 2020, 10, 434. [CrossRef]
- Bhawal, P.; Ganguly, S.; Das, T.K.; Mondal, S.; Choudhury, S.; Das, N.C. Superior Electromagnetic Interference Shielding Effectiveness and Electro-Mechanical Properties of EMA-IRGO Nanocomposites through the in-Situ Reduction of GO from Melt Blended EMA-GO Composites. Compos B Eng 2018, 134, 46–60. [CrossRef]
- Guadagno, L.; Vertuccio, L. Resistive Response of Carbon Nanotube-Based Composites Subjected to Water Aging. Nanomaterials 2021, 11, 2183. [CrossRef]
- De Vivo, B.; Lamberti, P.; Spinelli, G.; Tucci, V. A Morphological and Structural Approach to Evaluate the Electromagnetic Performances of Composites Based on Random Networks of Carbon Nanotubes. J Appl Phys 2014, 115. [CrossRef]
- Li, C.; Thostenson, E.T.; Chou, T.W. Dominant Role of Tunneling Resistance in the Electrical Conductivity of Carbon Nanotube-Based Composites. Appl Phys Lett 2007, 91, 223114. [CrossRef]
- Mergen, Ö.B.; Umut, E.; Arda, E.; Kara, S. A Comparative Study on the AC/DC Conductivity, Dielectric and Optical Properties of Polystyrene/Graphene Nanoplatelets (PS/GNP) and Multi-Walled Carbon Nanotube (PS/MWCNT) Nanocomposites. Polym Test 2020, 90, 106682. [CrossRef]
- Ciprioti, S.V.; Raimondo, M.; Vertuccio, L.; Calabrese, E.; Aliberti, F.; Guadagno, L. Multi-Technique Characterization and Thermal Degradation Study of Epoxy Modified Resins Designed for Multifunctional Applications. J Therm Anal Calorim 2024, 149, 11041–11055. [CrossRef]
- Bocchini, S.; Frache, A.; Camino, G.; Claes, M. Polyethylene Thermal Oxidative Stabilisation in Carbon Nanotubes Based Nanocomposites. Eur Polym J 2007, 43, 3222–3235. [CrossRef]
- Poomalai, P.; Ramaraj, B.; Siddaramaiah Thermal and Mechanical Properties of Poly(Methyl Methacrylate) and Ethylene Vinyl Acetate Copolymer Blends. J Appl Polym Sci 2007, 106, 684–691. [CrossRef]
- Dittrich, B.; Wartig, K.A.; Hofmann, D.; Mülhaupt, R.; Schartel, B. Carbon Black, Multiwall Carbon Nanotubes, Expanded Graphite and Functionalized Graphene Flame Retarded Polypropylene Nanocomposites. Polym Adv Technol 2013, 24, 916–926. [CrossRef]
- Yano, S.; Nagao, N.; Hattori, M.; Hirasawa, E.; Tadano, K. Dielectric Relaxations of Ethylene Ionomers. Macromolecules 1992, 25, 368–376. [CrossRef]
- Ming, Y.; Zhou, Z.; Hao, T.; Nie, Y. Polymer Nanocomposites: Role of Modified Filler Content and Interfacial Interaction on Crystallization. Eur Polym J 2022, 162, 110894. [CrossRef]
- Lau, K.T.; Chipara, M.; Ling, H.Y.; Hui, D. On the Effective Elastic Moduli of Carbon Nanotubes for Nanocomposite Structures. Compos B Eng 2004, 35, 95–101. [CrossRef]
- Scarpa, F.; Adhikari, S.; Srikantha Phani, A. Effective Elastic Mechanical Properties of Single Layer Graphene Sheets. Nanotechnology 2009, 20, 065709. [CrossRef]
- Shi, J.X.; Natsuki, T.; Lei, X.W.; Ni, Q.Q. Equivalent Young's Modulus and Thickness of Graphene Sheets for the Continuum Mechanical Models. Appl Phys Lett 2014, 104. [CrossRef]
- Stimoniaris, A.; … C.S.-E.P.; 2012, undefined A Detailed Study of α-Relaxation in Epoxy/Carbon Nanoparticles Composites Using Computational Analysis. expresspolymlett.comAZ Stimoniaris, CA Stergiou, CG DelidesExpress Polymer Letters, 2012•expresspolymlett.com. [CrossRef]
- Menes, O.; Cano, M.; Benedito, A.; Giménez, E.; Castell, P.; Maser, W.K.; Benito, A.M. The Effect of Ultra-Thin Graphite on the Morphology and Physical Properties of Thermoplastic Polyurethane Elastomer Composites. Compos Sci Technol 2012, 72, 1595–1601. [CrossRef]
- Nurazzi, N.M.; Sabaruddin, F.A.; Harussani, M.M.; Kamarudin, S.H.; Rayung, M.; Asyraf, M.R.M.; Aisyah, H.A.; Norrrahim, M.N.F.; Ilyas, R.A.; Abdullah, N.; et al. Mechanical Performance and Applications of CNTs Reinforced Polymer Composites—A Review. Nanomaterials 2021, 11, 2186. [CrossRef]
- Coleman, J.N.; Khan, U.; Gun'ko, Y.K. Mechanical Reinforcement of Polymers Using Carbon Nanotubes. Advanced Materials 2006, 18, 689–706. [CrossRef]
- Wang, L.; Xu, X.; Chen, J.; Su, W.; Zhang, F.; Li, A.; Li, C.; Xu, C.; Sun, Y. Crack Sensing of Cardiomyocyte Contractility with High Sensitivity and Stability. ACS Nano 2022, 16, 12645–12655. [CrossRef]
- Meola, C.; Carlomagno, G.M.; Bonavolontà, C.; Valentino, M. Monitoring Composites under Bending Tests with Infrared Thermography. Advances in Optical Technologies 2012, 2012, 720813. [CrossRef]
- Wu, S.; Ladani, R.B.; Zhang, J.; Ghorbani, K.; Zhang, X.; Mouritz, A.P.; Kinloch, A.J.; Wang, C.H. Strain Sensors with Adjustable Sensitivity by Tailoring the Microstructure of Graphene Aerogel/PDMS Nanocomposites. ACS Appl Mater Interfaces 2016, 8, 24853–24861. [CrossRef]
- Zare, Y.; Rhee, K.Y. Calculation of Tunneling Distance in Carbon Nanotubes Nanocomposites: Effect of Carbon Nanotube Properties, Interphase and Networks. J Mater Sci 2020, 55, 5471–5480. [CrossRef]
- Hao, B.; Ma, Q.; Yang, S.; Mäder, E.; Ma, P.C. Comparative Study on Monitoring Structural Damage in Fiber-Reinforced Polymers Using Glass Fibers with Carbon Nanotubes and Graphene Coating. Compos Sci Technol 2016, 129, 38–45. [CrossRef]
- Kim, Y.J.; Cha, J.Y.; Ham, H.; Huh, H.; So, D.S.; Kang, I. Preparation of Piezoresistive Nano Smart Hybrid Material Based on Graphene. Current Applied Physics 2011, 11, S350–S352. [CrossRef]
- Wang, B.; Lee, B.K.; Kwak, M.J.; Lee, D.W. Graphene/Polydimethylsiloxane Nanocomposite Strain Sensor. Review of Scientific Instruments 2013, 84. [CrossRef]
Figure 1.
Electrical percolation thresholds of EMAA-CNT nanocomposites and EMAA-EG nanocomposites.
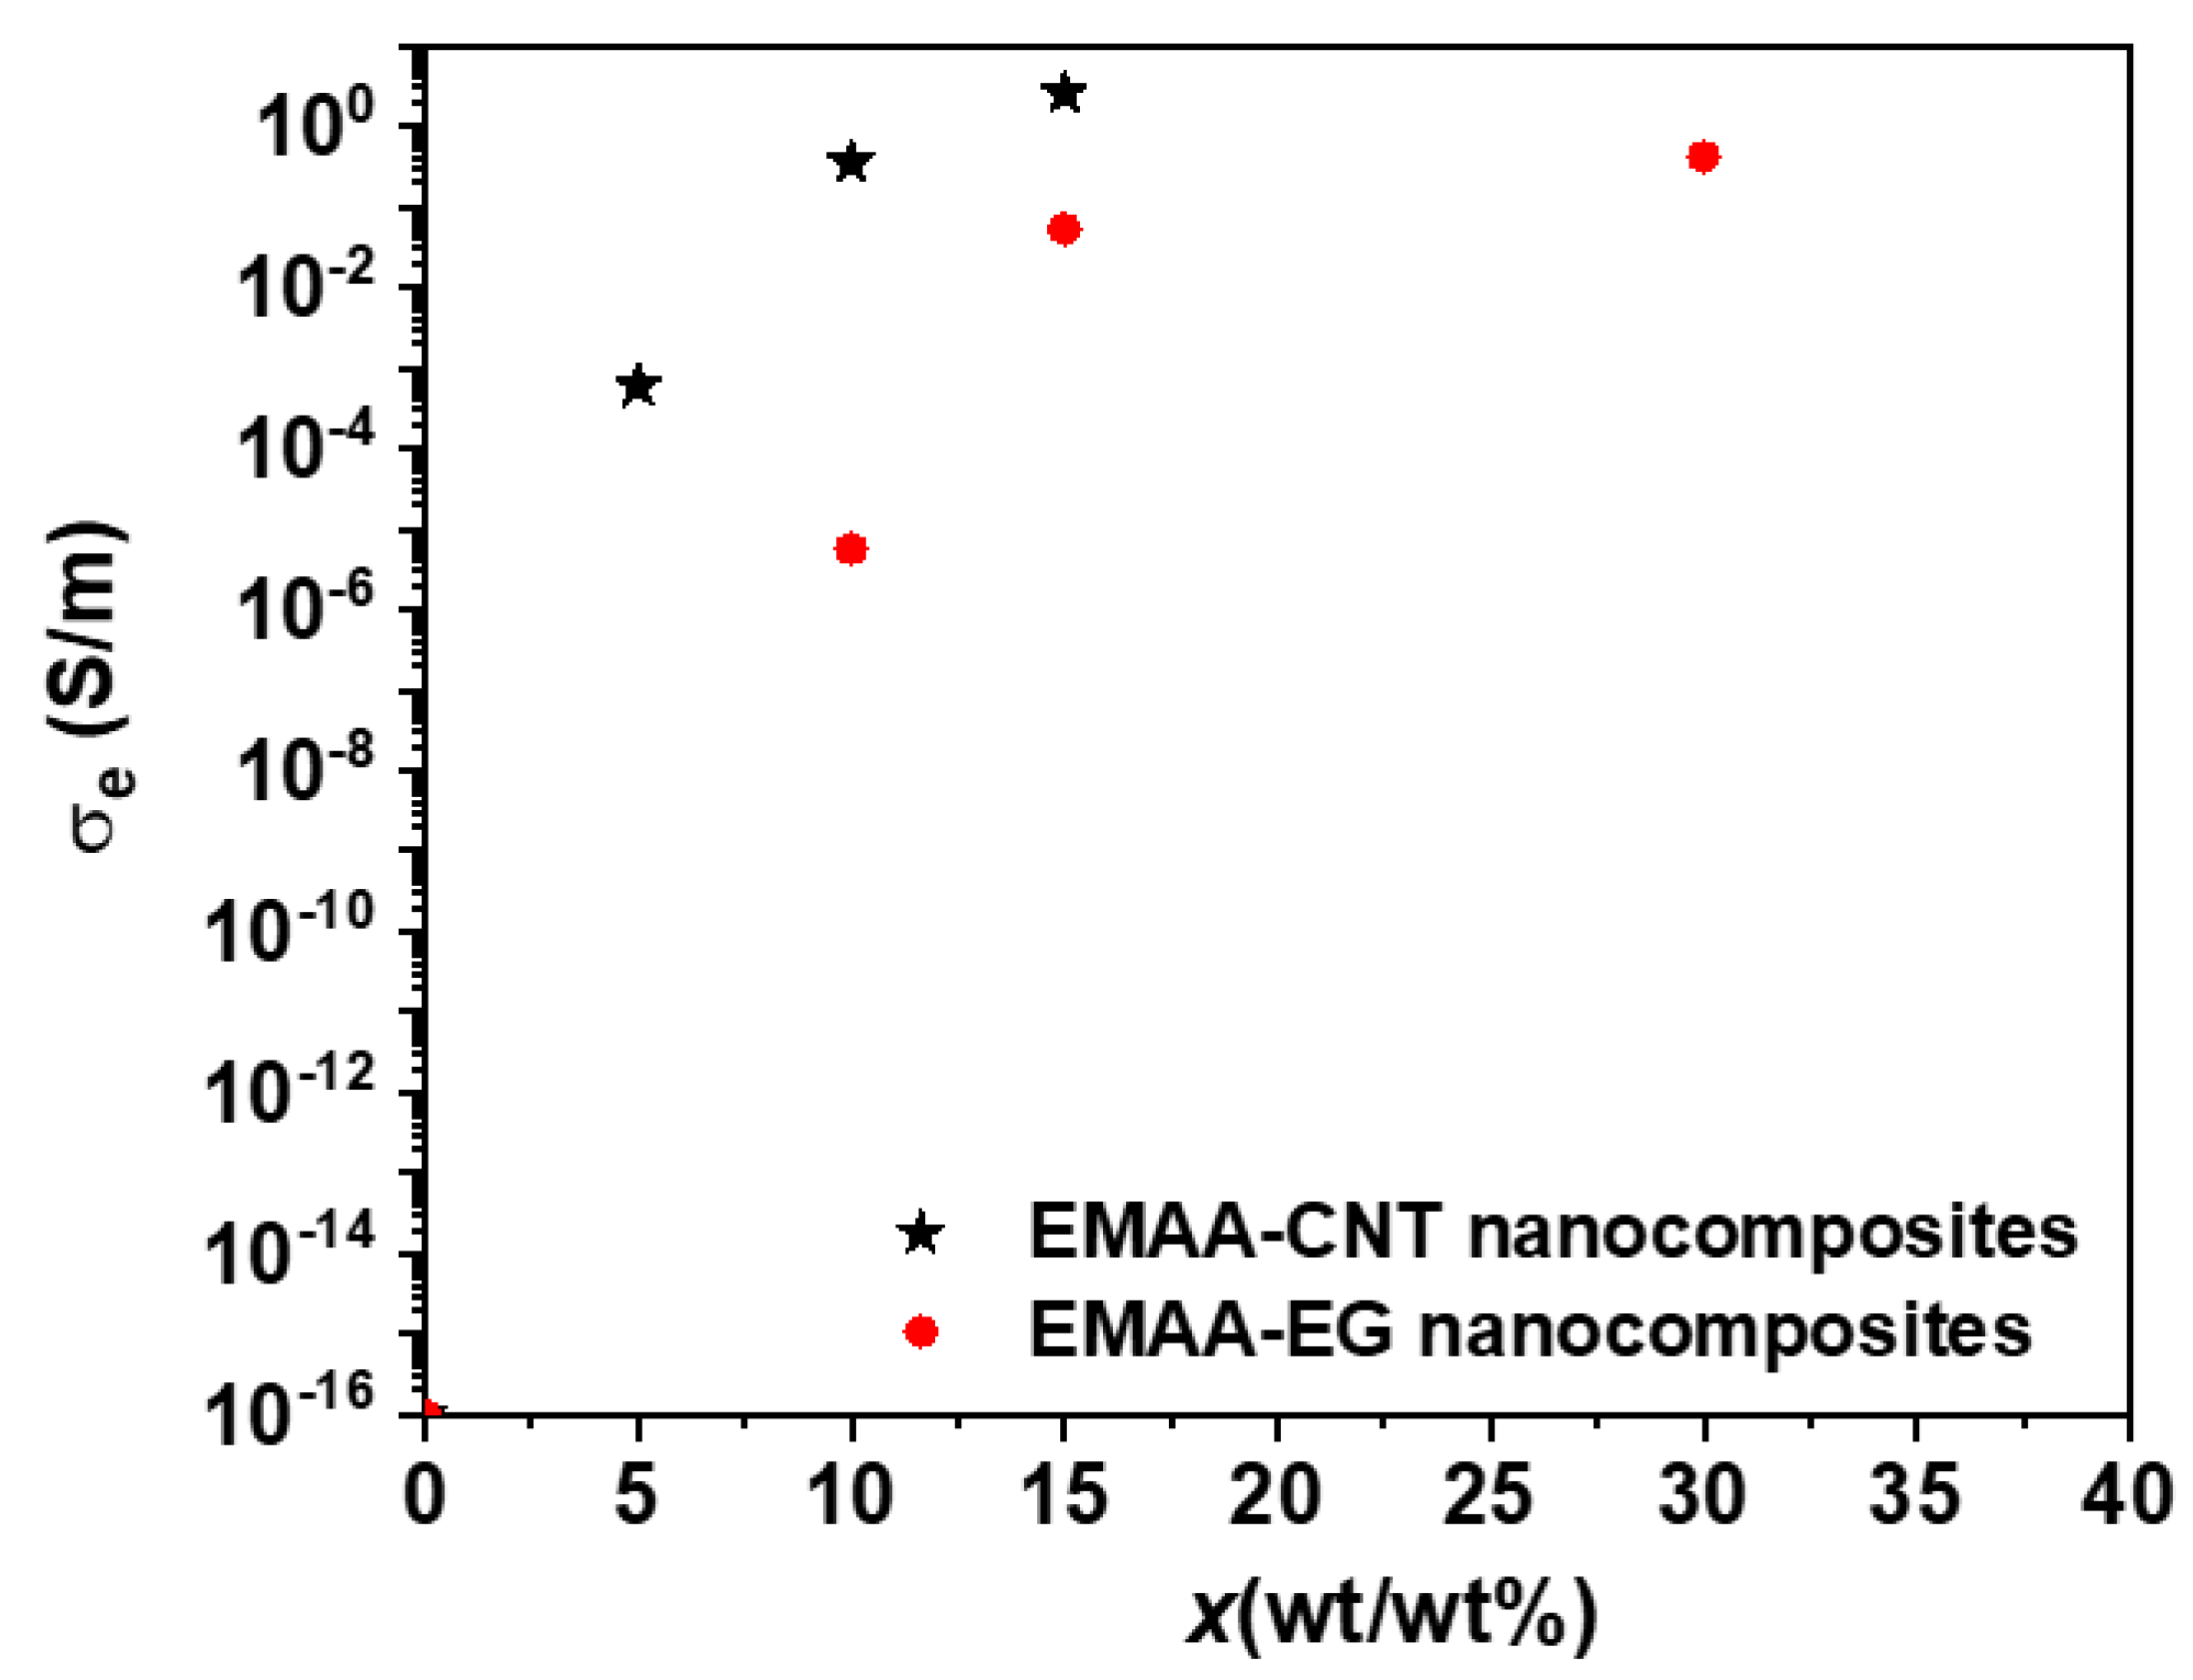
Figure 2.
SEM images of EMAA nanocomposites and their electrical conductivity values: a) EMAA 5% CNT; b)EMAA 10% CNT; c) EMAA 15% CNT; d) EMAA 10% EG; e) EMAA 15% EG; f) EMAA 30% EG.
Figure 2.
SEM images of EMAA nanocomposites and their electrical conductivity values: a) EMAA 5% CNT; b)EMAA 10% CNT; c) EMAA 15% CNT; d) EMAA 10% EG; e) EMAA 15% EG; f) EMAA 30% EG.
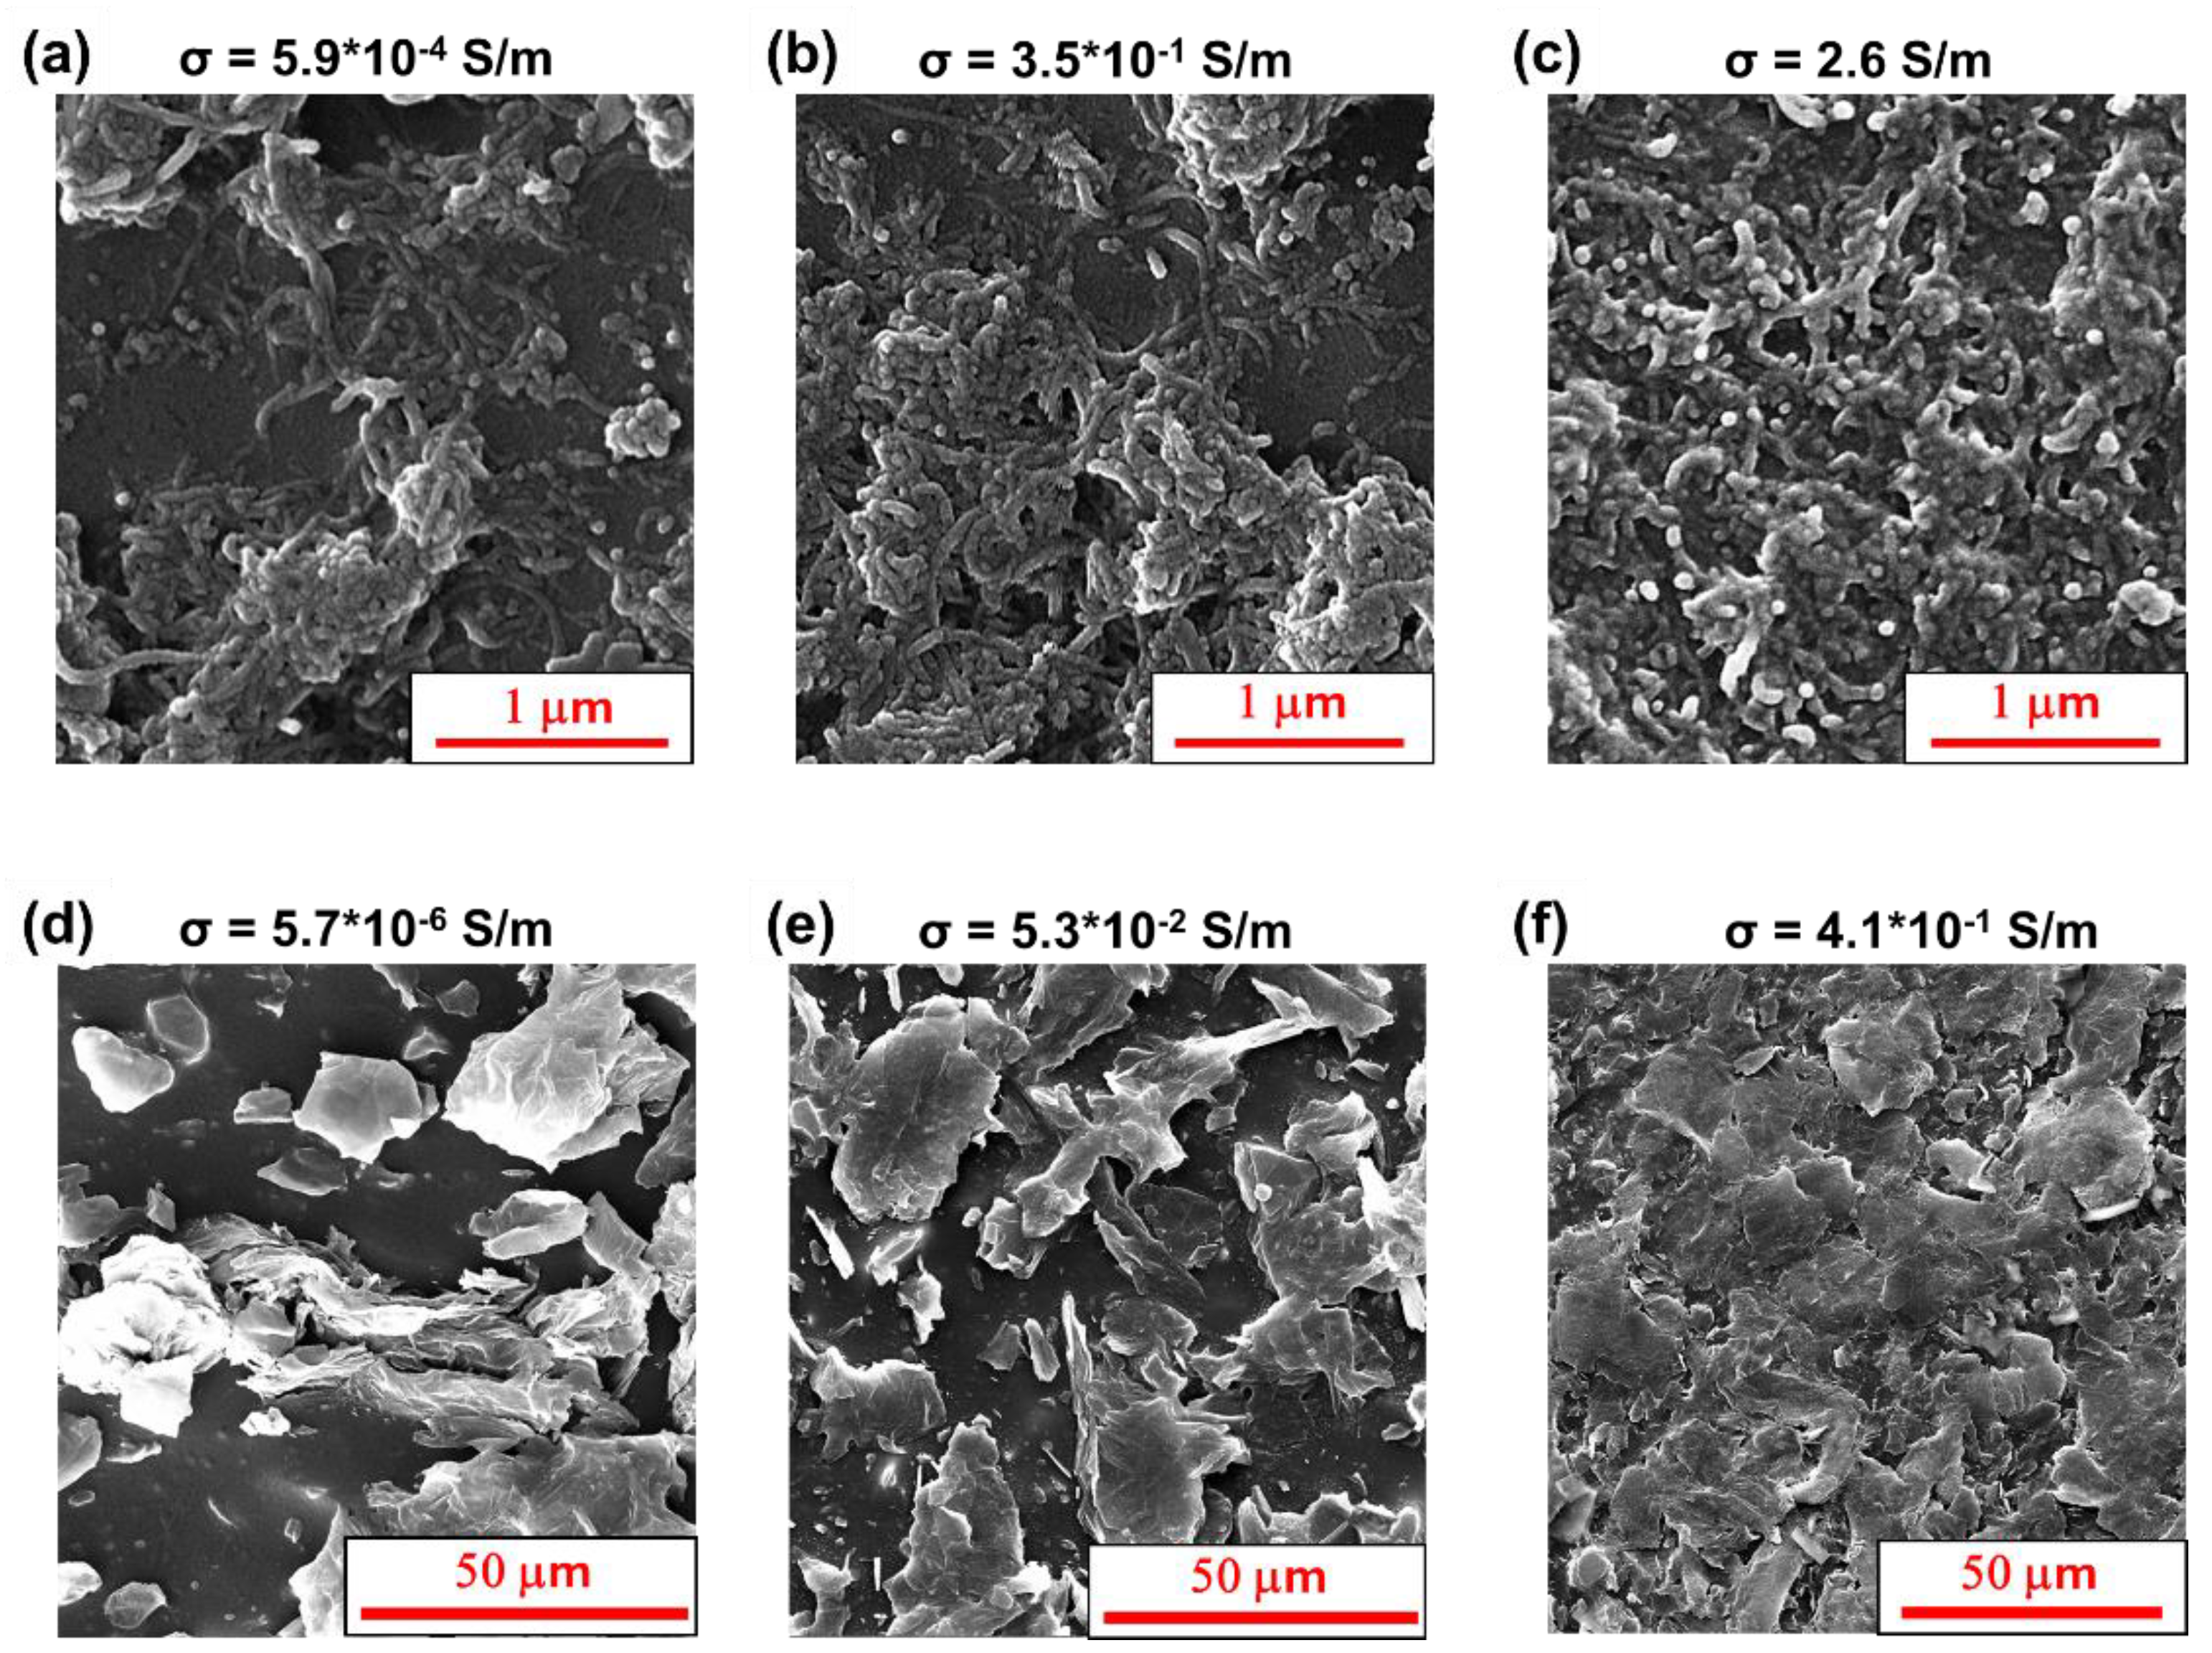
Figure 3.
a) TGA curves of EMAA-CNT nanocomposites, EMAA matrix and CNT filler, b) DTGA curves of EMAA-CNT nanocomposites, EMAA matrix and CNT filler; c) TGA curves of EMAA-EG nanocomposites, EMAA matrix and EG filler; d) DTGA curves of EMAA-EG nanocomposites, EMAA matrix and EG filler.
Figure 3.
a) TGA curves of EMAA-CNT nanocomposites, EMAA matrix and CNT filler, b) DTGA curves of EMAA-CNT nanocomposites, EMAA matrix and CNT filler; c) TGA curves of EMAA-EG nanocomposites, EMAA matrix and EG filler; d) DTGA curves of EMAA-EG nanocomposites, EMAA matrix and EG filler.
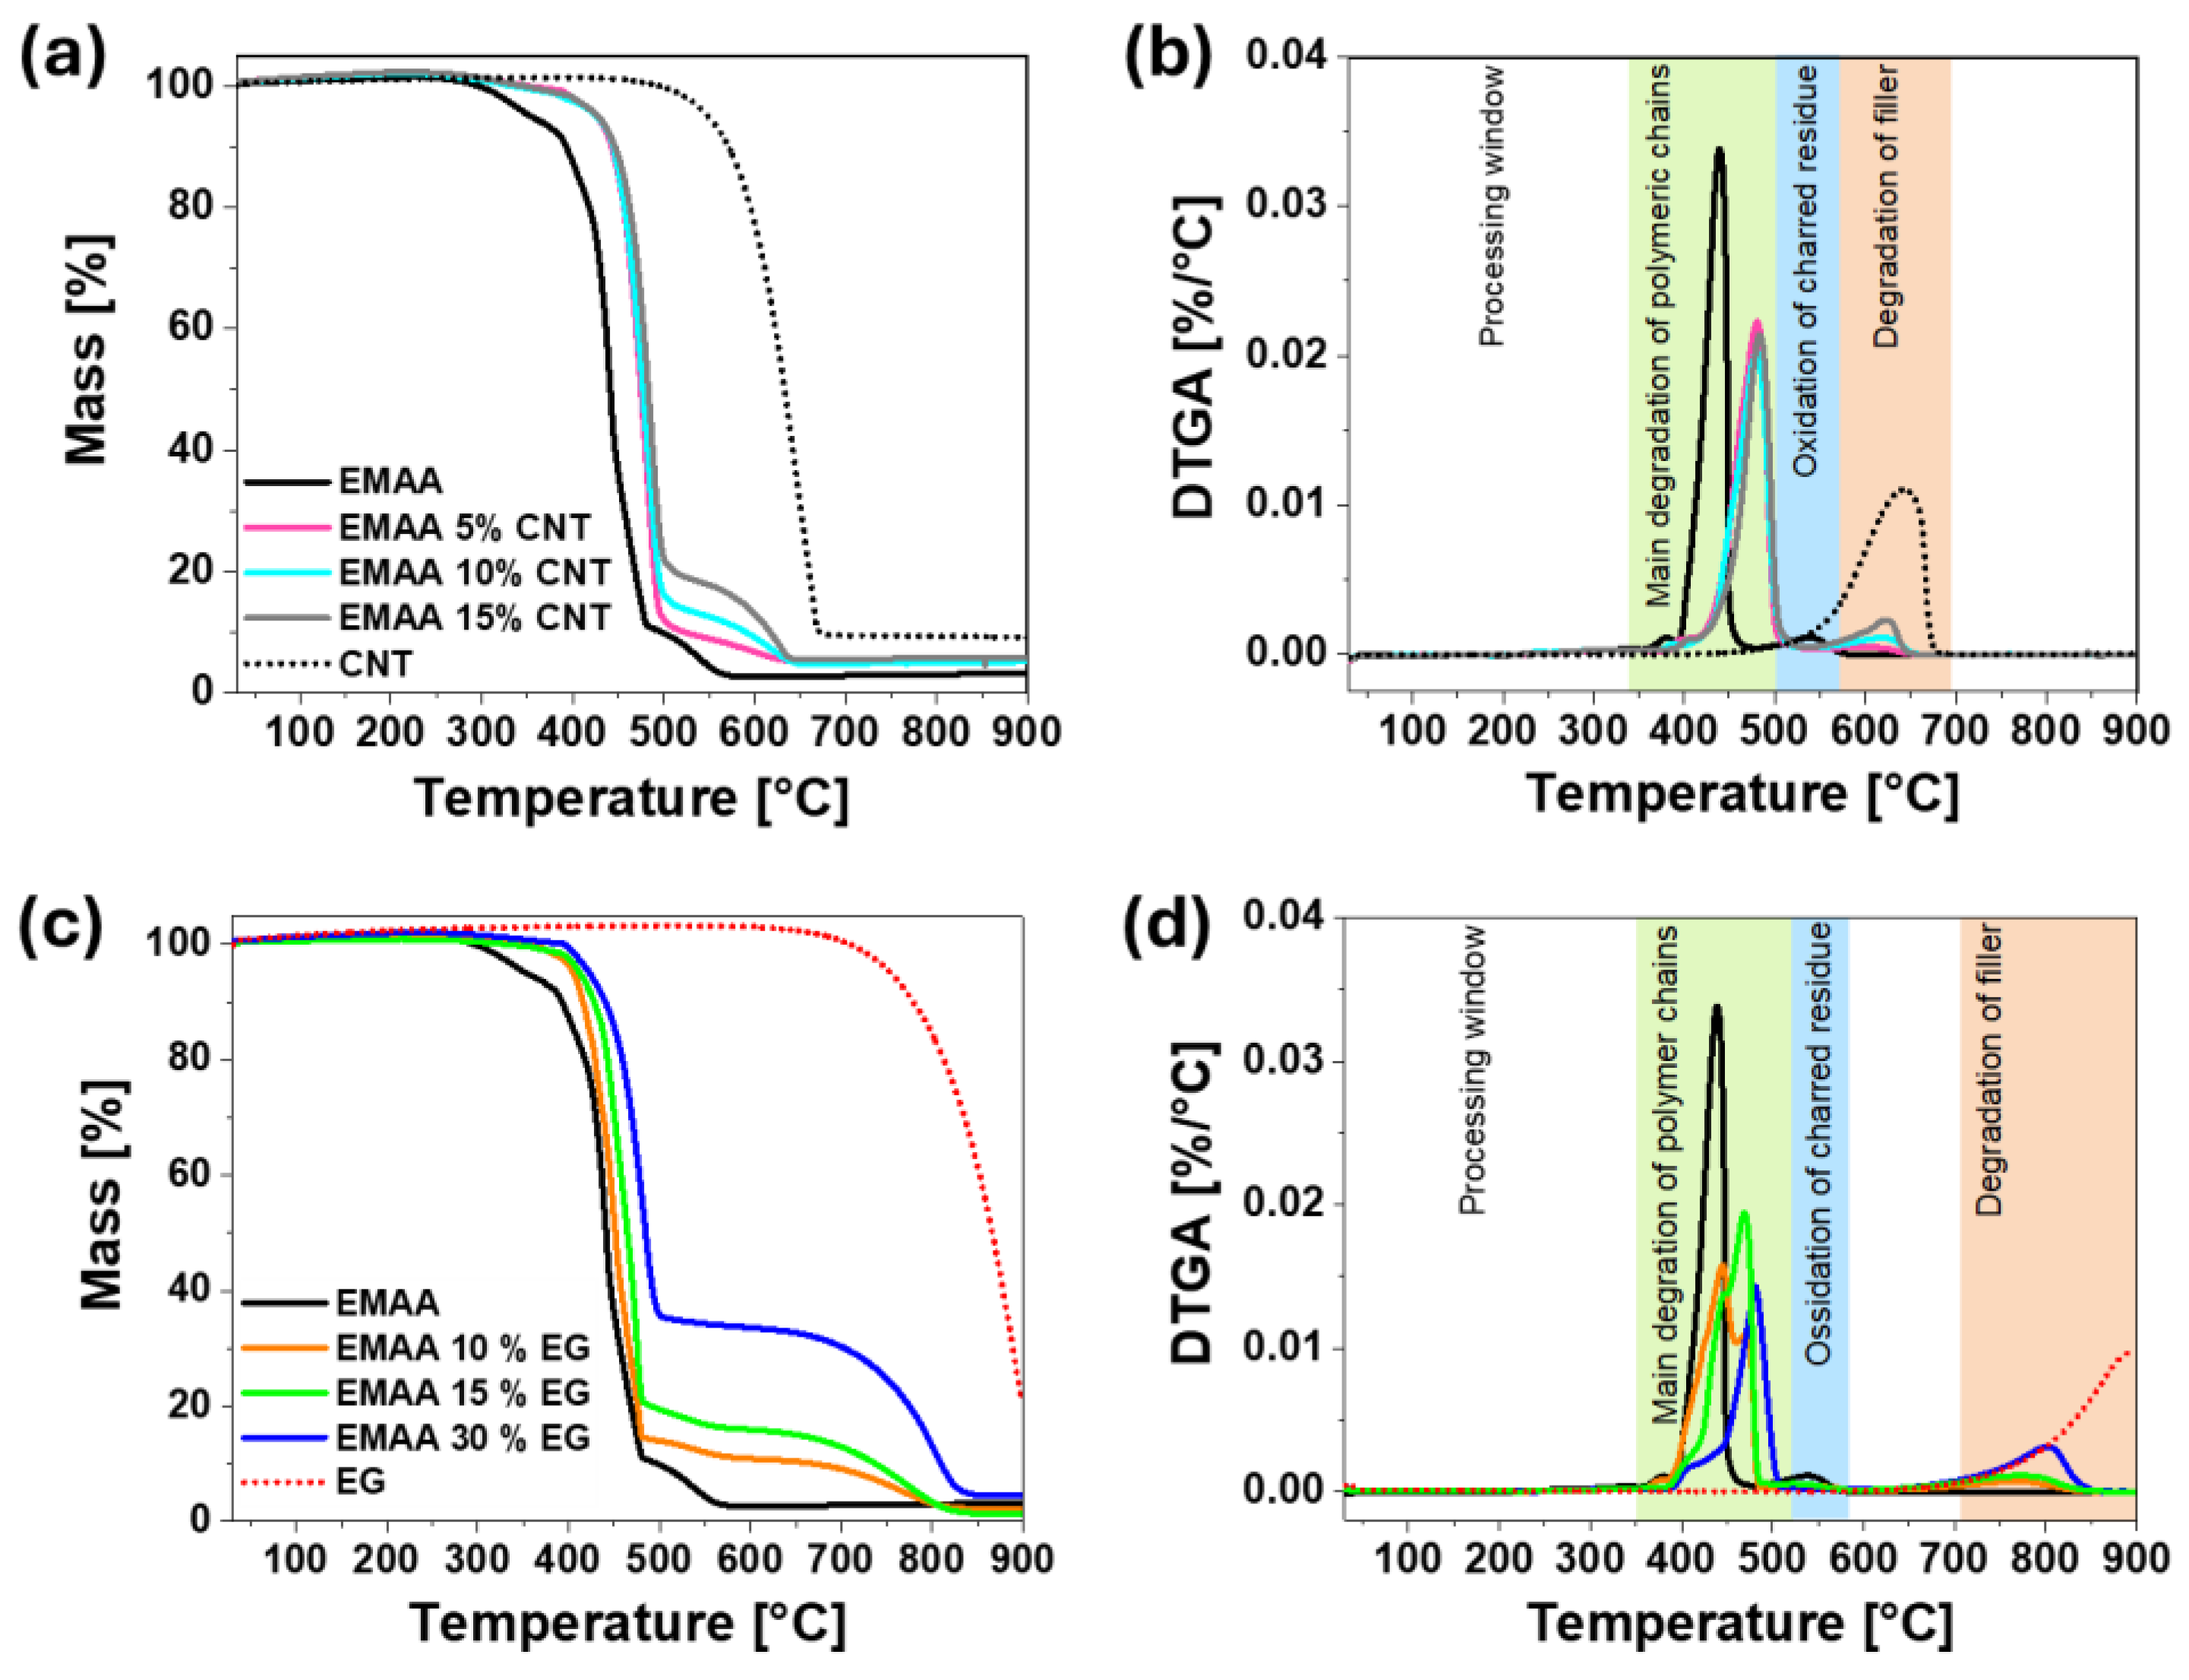
Figure 4.
a) Heating and b) cooling curves of DSC of EMAA-CNTs nanocomposites and EMAA matrix; c) heating and d) cooling curves of DSC of EMAA-EG nanocomposites and EMAA matrix. .
Figure 4.
a) Heating and b) cooling curves of DSC of EMAA-CNTs nanocomposites and EMAA matrix; c) heating and d) cooling curves of DSC of EMAA-EG nanocomposites and EMAA matrix. .
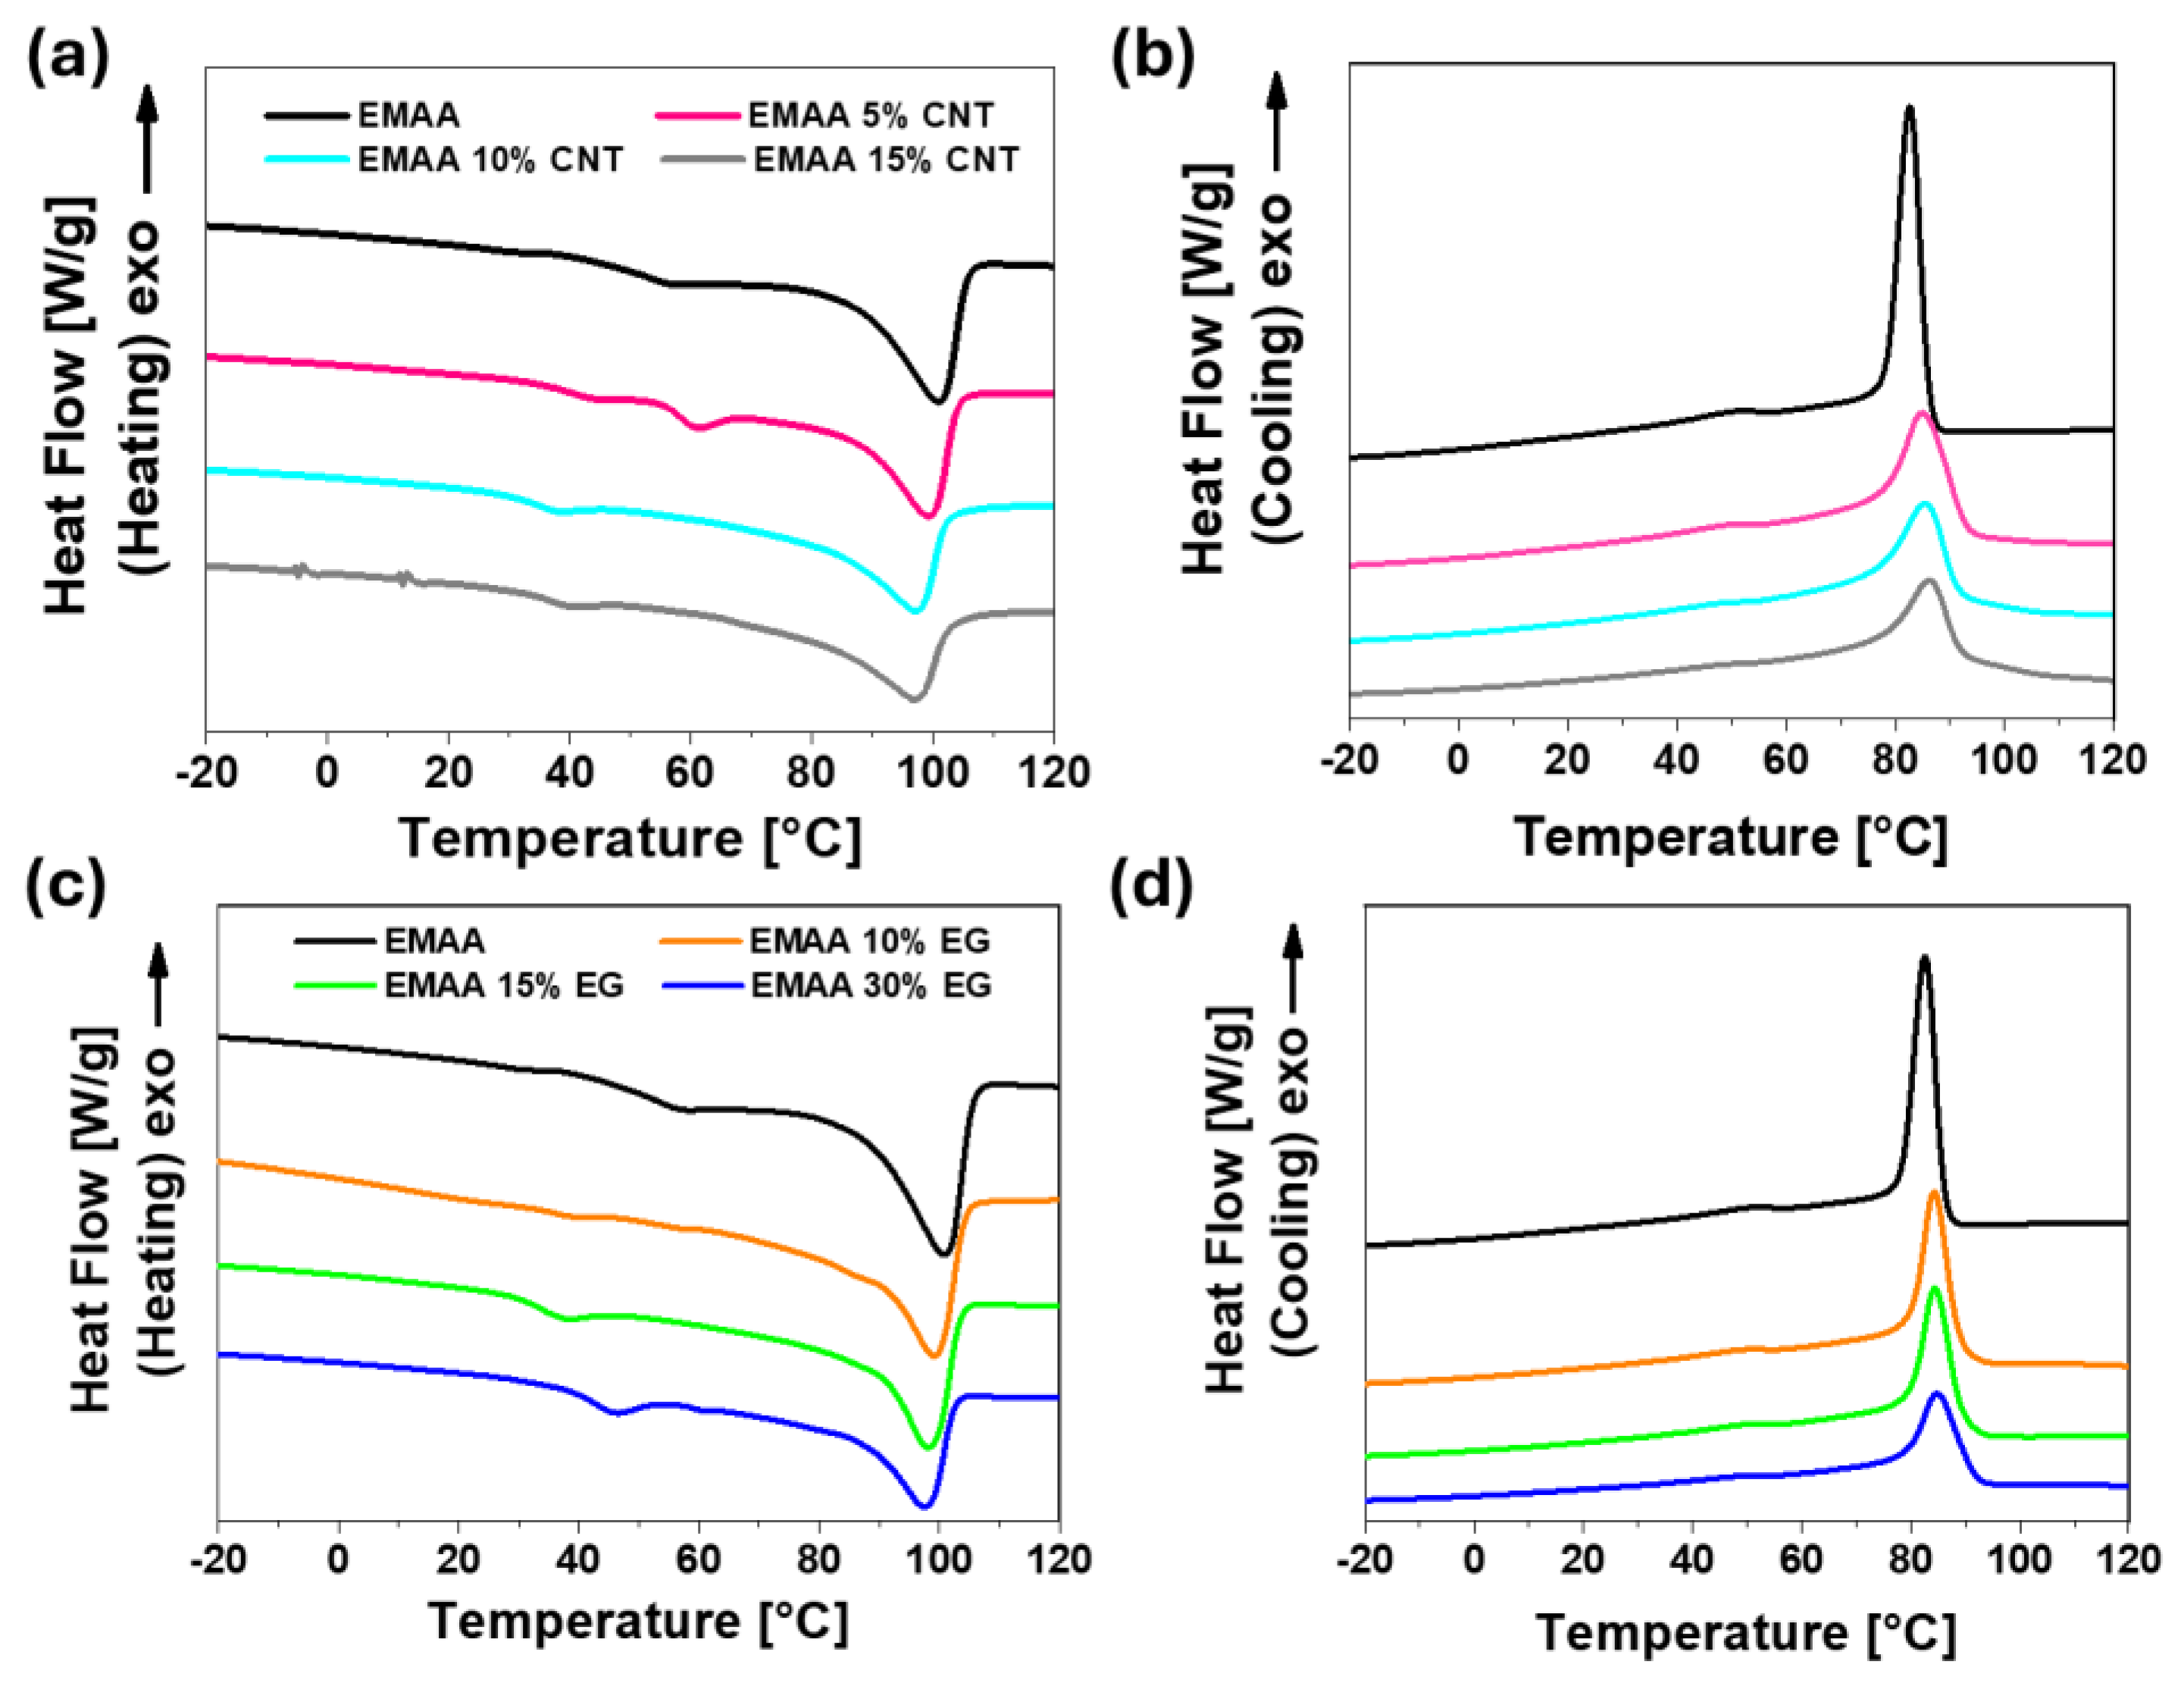
Figure 5.
DMA results: a) storage modulus and b) tan δ of EMAA CNT nanocomposites and EMAA matrix; c) storage modulus and d) tan δ of EMAA EG nanocomposites and EMAA matrix.
Figure 5.
DMA results: a) storage modulus and b) tan δ of EMAA CNT nanocomposites and EMAA matrix; c) storage modulus and d) tan δ of EMAA EG nanocomposites and EMAA matrix.
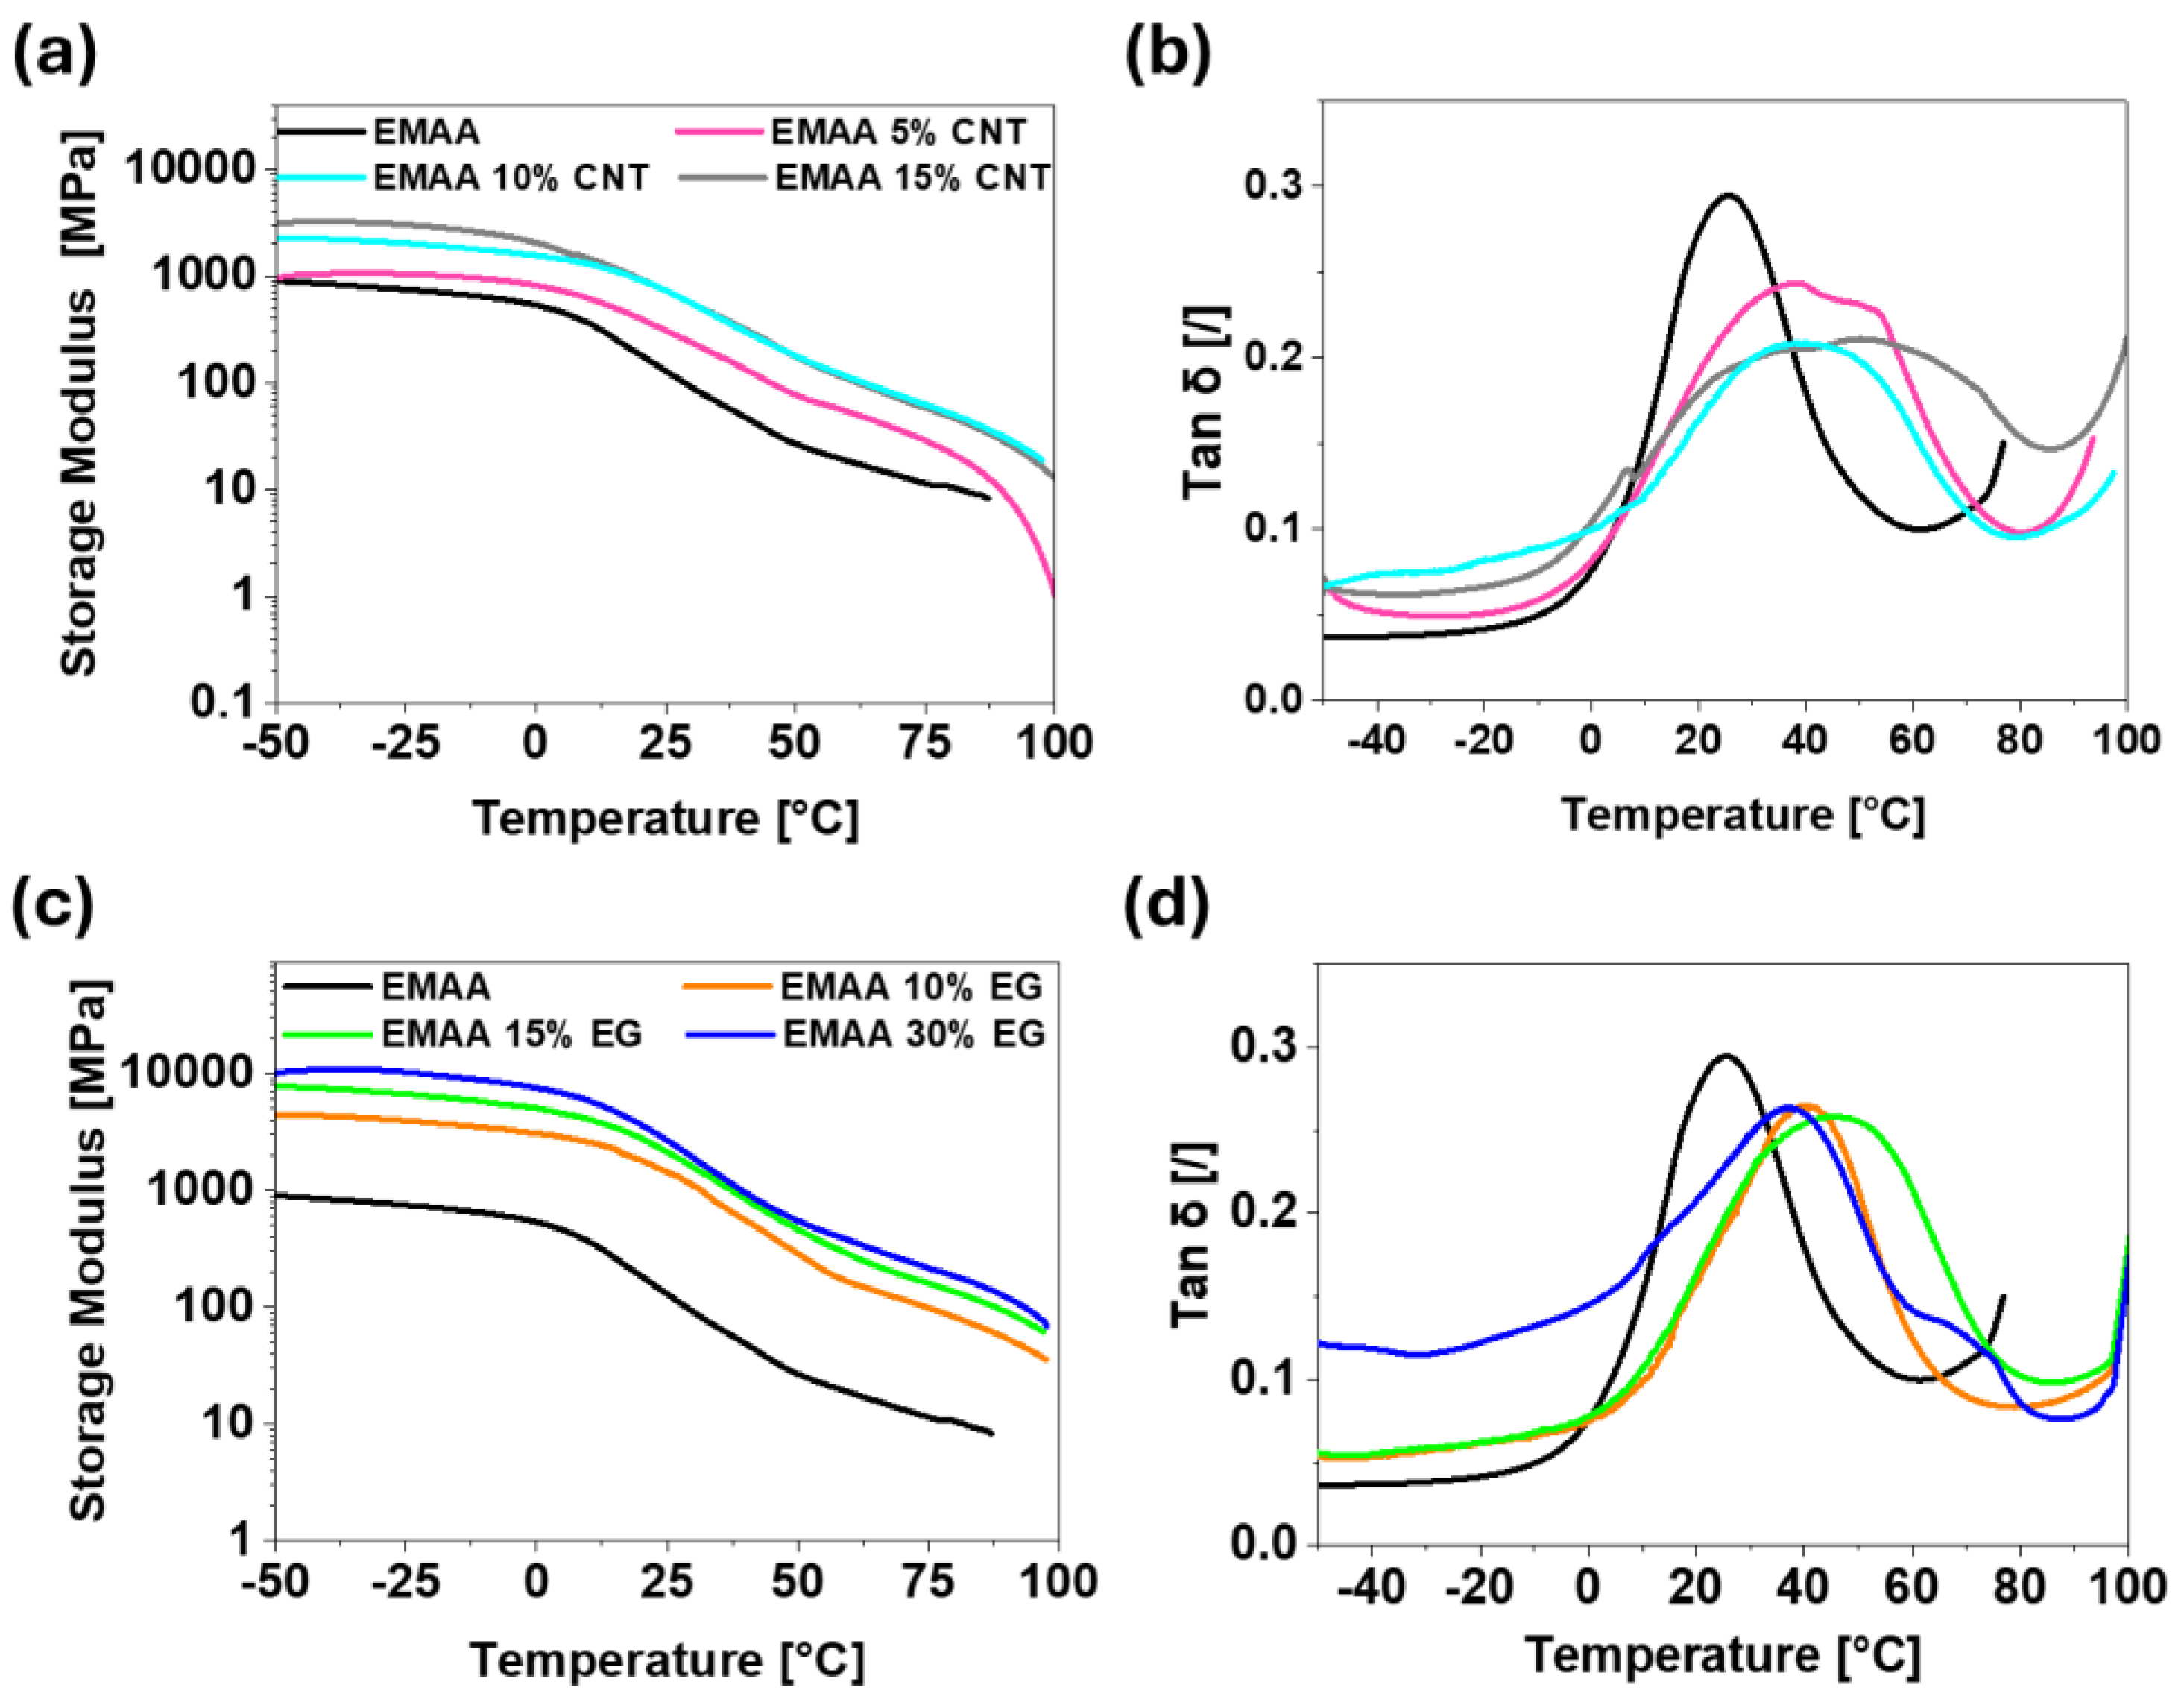
Figure 6.
a) Mechanical curve of EMAA matrix and its nanocomposites; b) enlargement at lower strains.
Figure 6.
a) Mechanical curve of EMAA matrix and its nanocomposites; b) enlargement at lower strains.
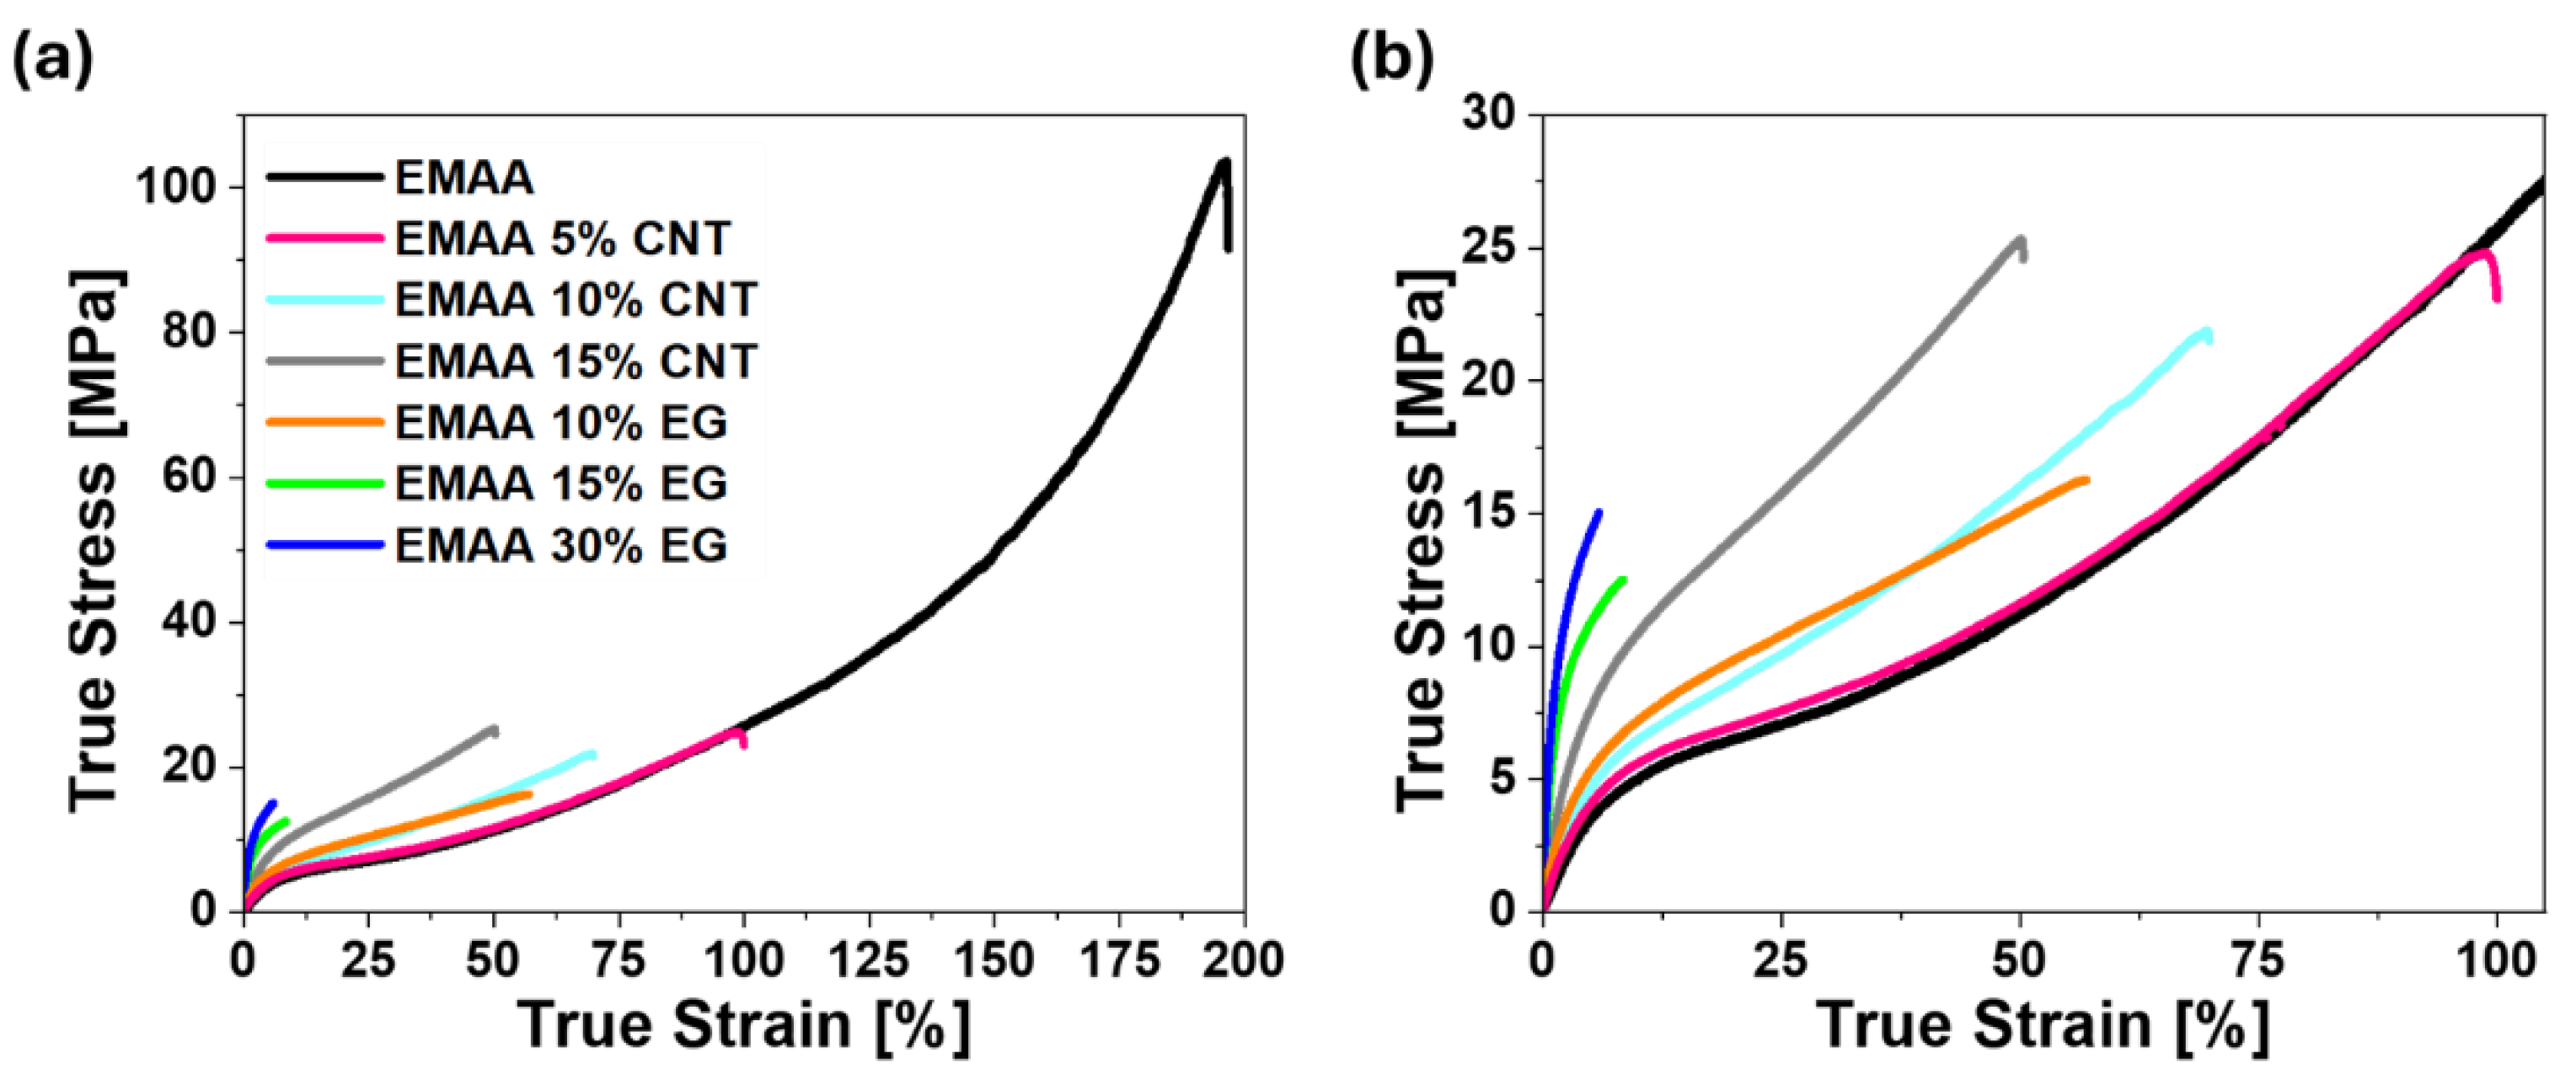
Figure 7.
a) Piezoresistive response during tensile test ; b) enlargement of piezoresistive curve; c) TUNA morphology of EMAA 10 % CNT.
Figure 7.
a) Piezoresistive response during tensile test ; b) enlargement of piezoresistive curve; c) TUNA morphology of EMAA 10 % CNT.
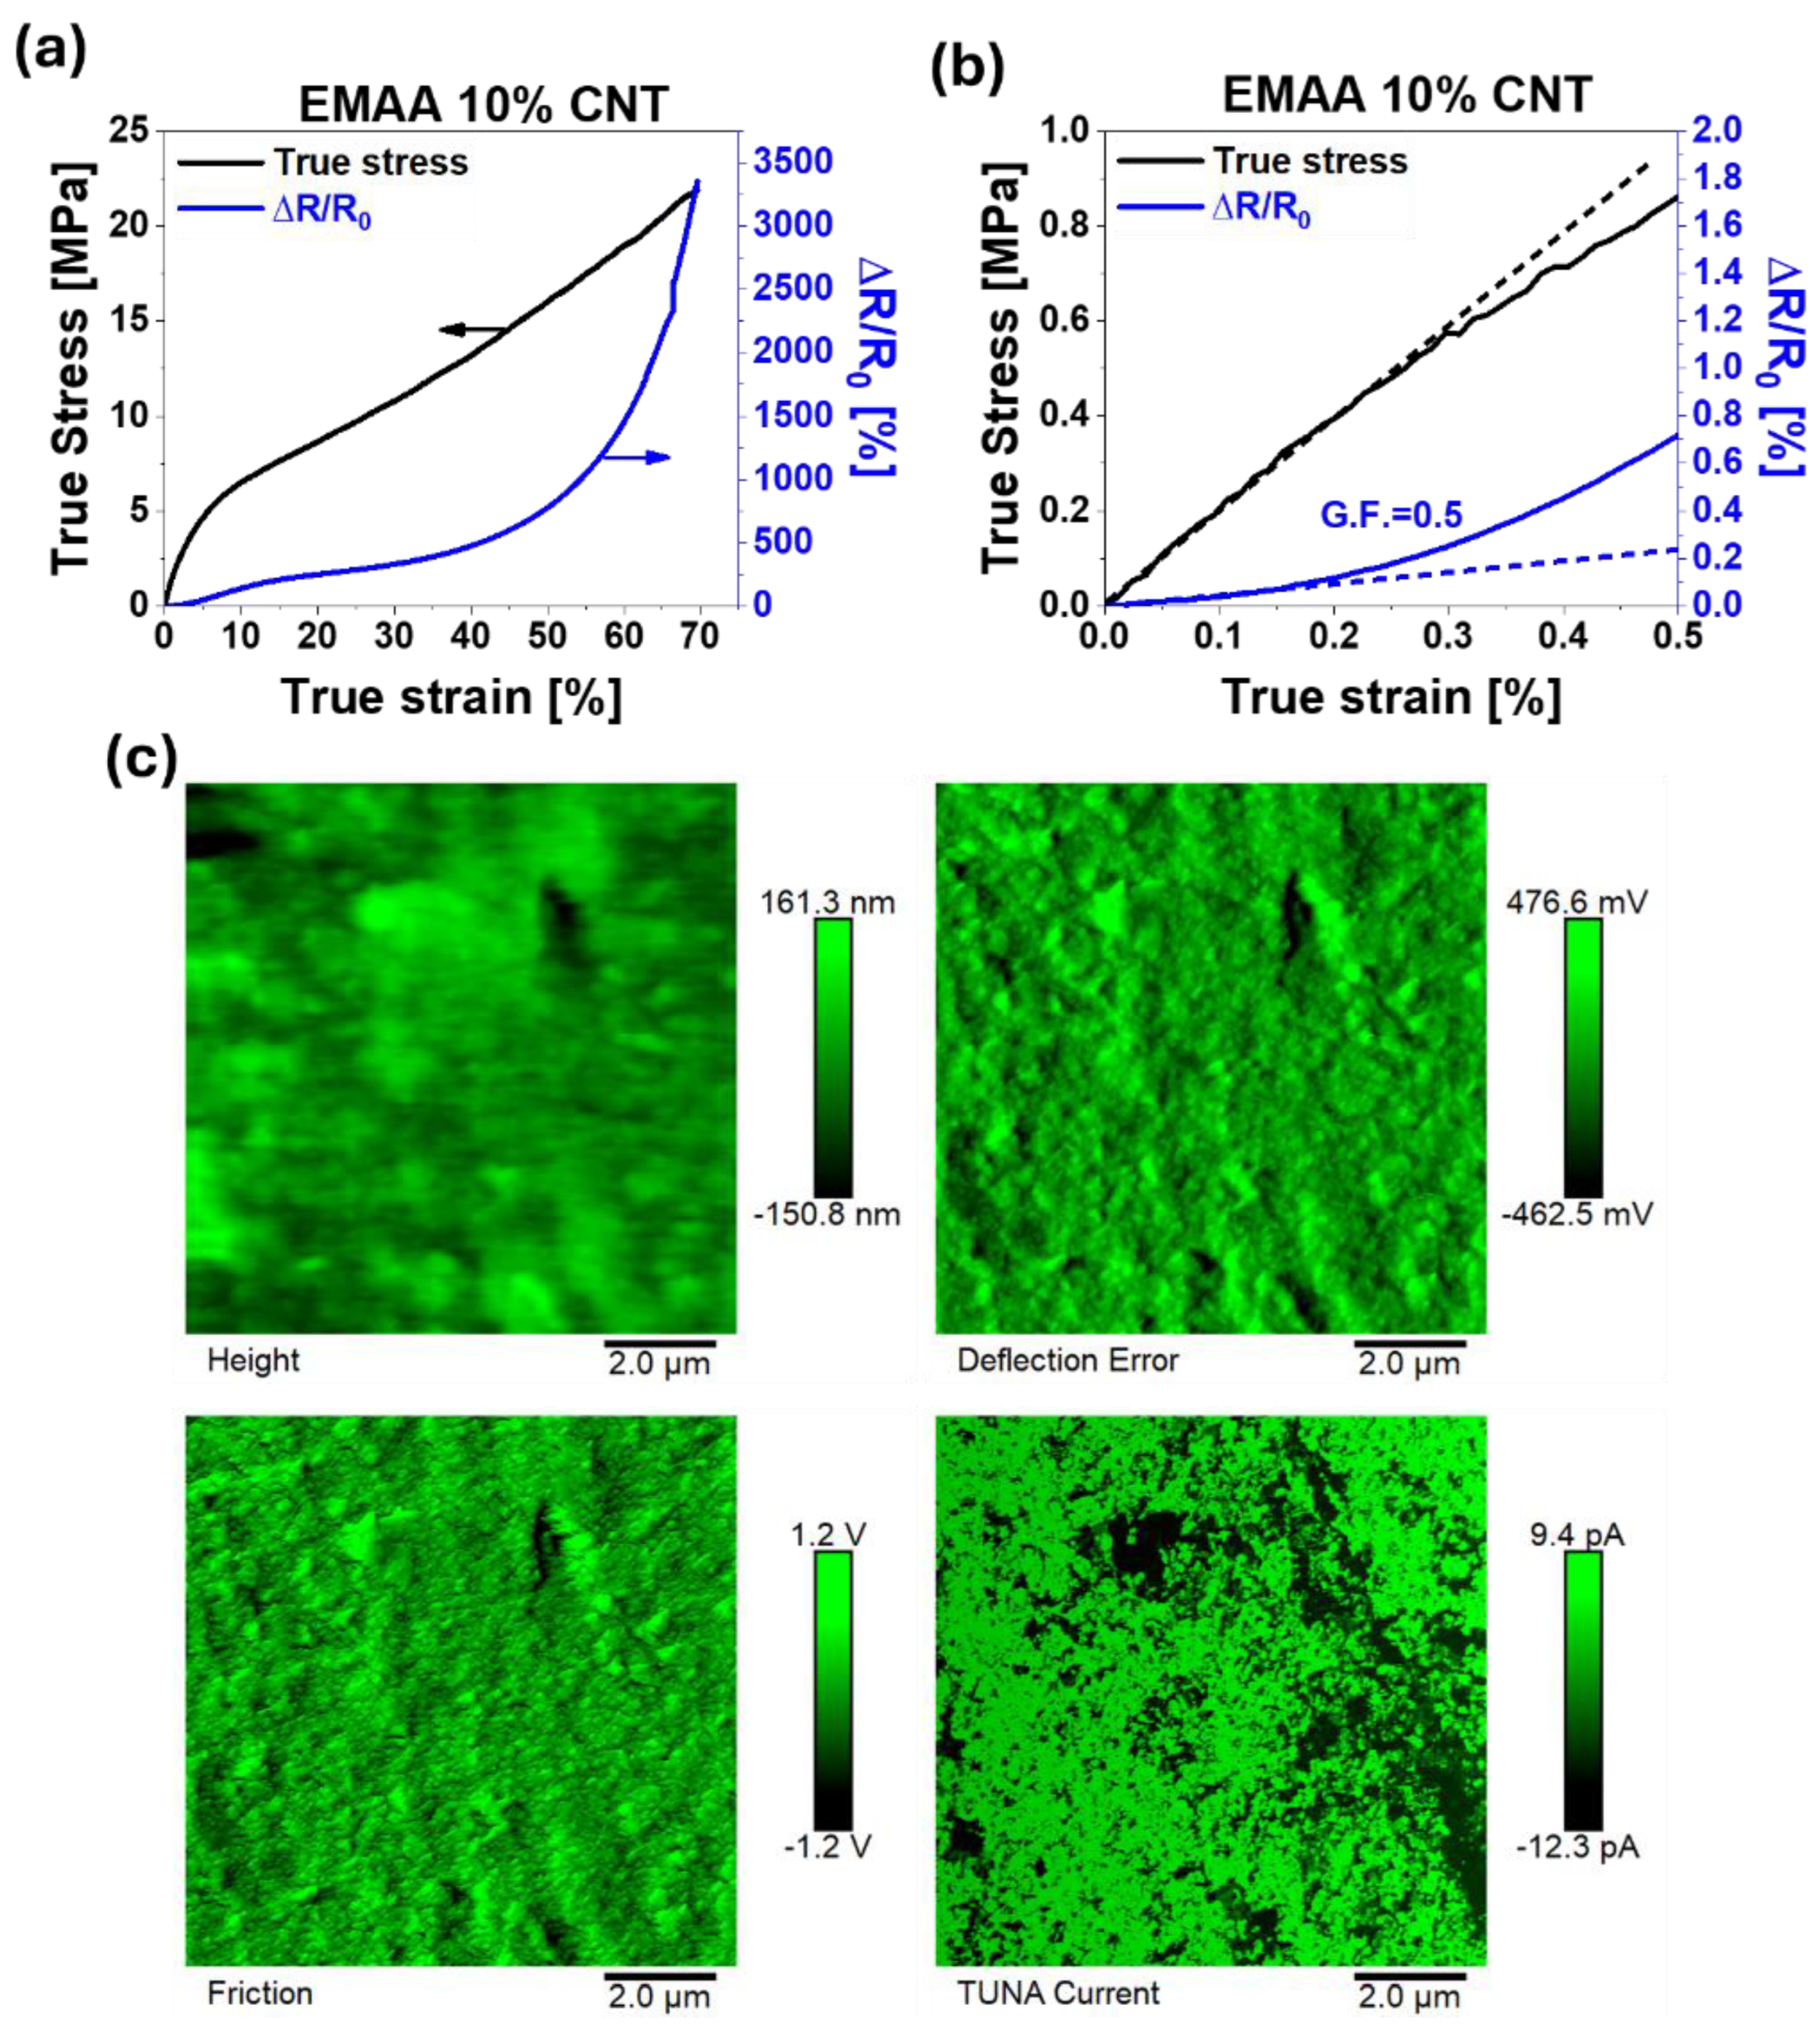
Figure 8.
a) Piezoresistive response during tensile test ; b) enlargement of piezoresistive curve; c) TUNA morphology of EMAA 15 % EG.
Figure 8.
a) Piezoresistive response during tensile test ; b) enlargement of piezoresistive curve; c) TUNA morphology of EMAA 15 % EG.
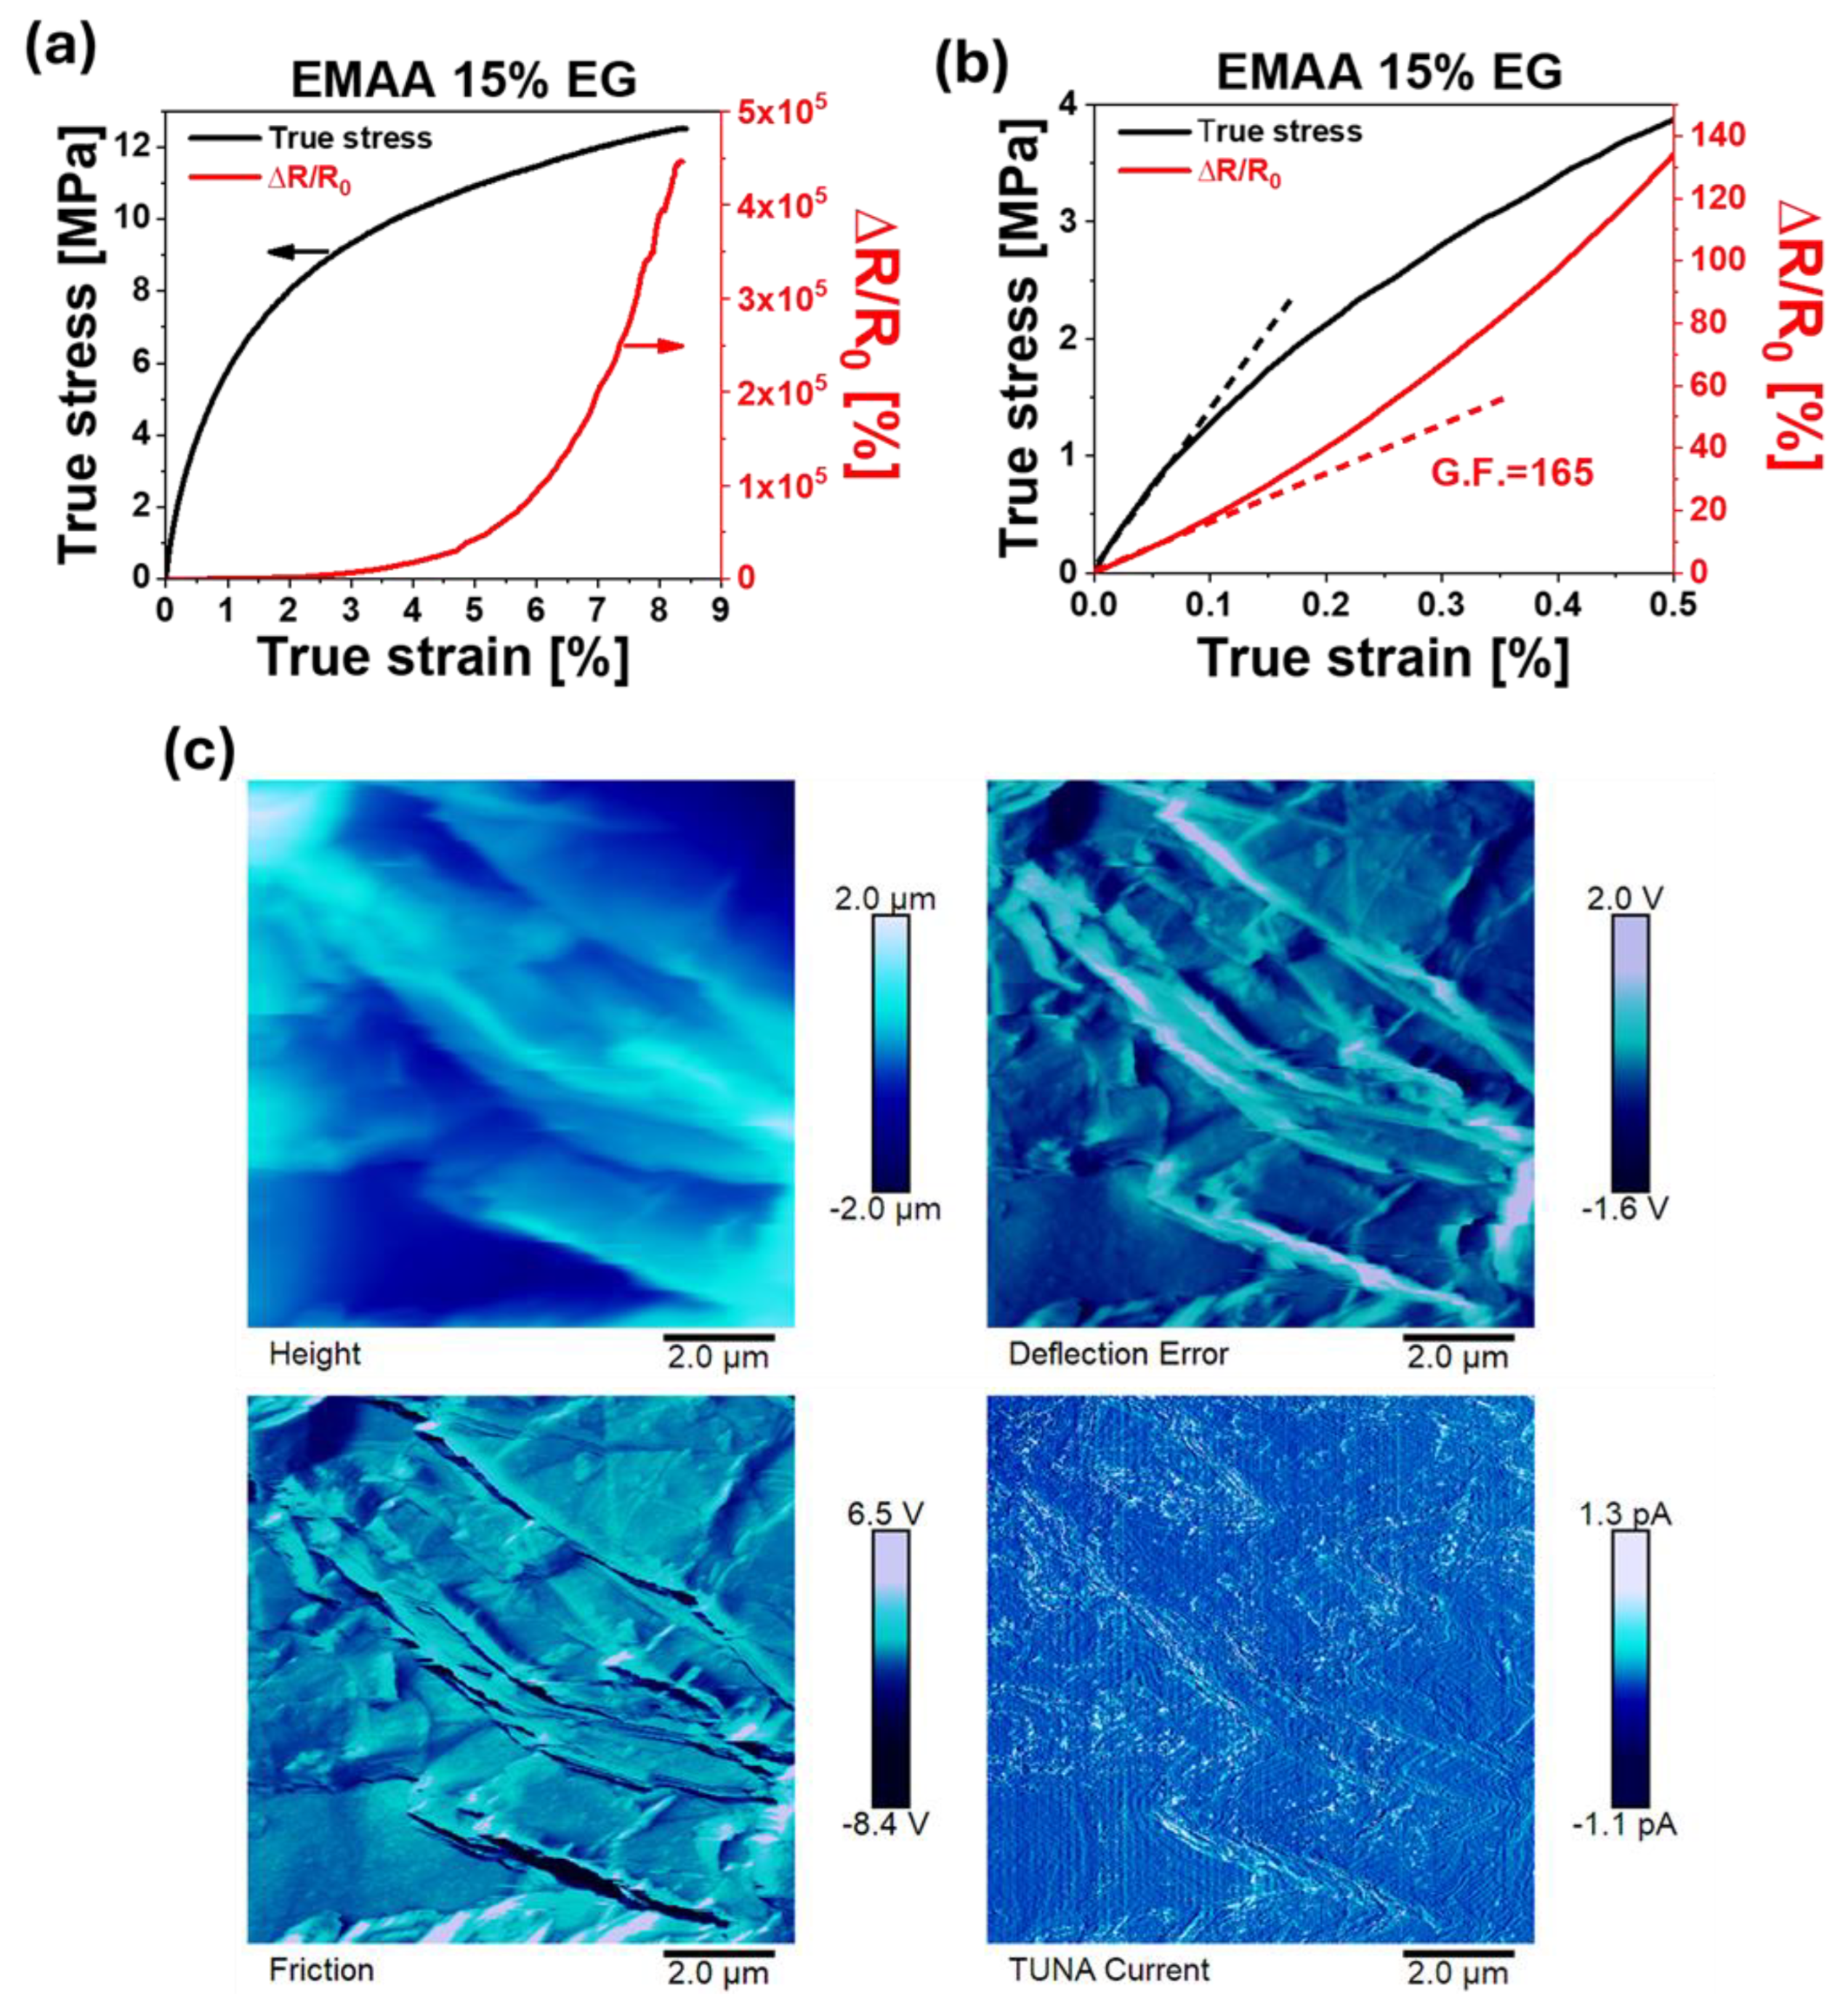

Table 1.
Equipment and methods of TGA, DSC, and DMA analysis.
| Analysis | Device | Method |
| TGA | Mettler TGA/SDTA 851 (Mettler-Toledo Columbus, OH, USA) |
Temperature range from 25°C to 900°C, in air, heating rate 10°C/min |
| DSC | Mettler DSC 822/400 (Mettler-Toledo Columbus, OH, USA) | Temperature range from -20°C to 115°C, heating and following cooling scan at 10°C/min. |
| DMA | DMA 2980 TA instrument (New Castle, DE 19720, USA) | Tensile mode at 1Hz frequency, from -60°C to 105°C, at 3°C/min |
Table 2.
Summary of DSC results of EMAA-CNTs nanocomposites and EMAA matrix. .
| Sample |
CNT (%) |
∆Hm (J/g) |
∆Hc (J/g) |
Tm (°C) |
Tc (°C) |
Xc (%) |
| EMAA | 0 | 43.0 | 54.9 | 102.1 | 82.2 | 14.8 |
| EMAA 5% CNT | 5 | 51.3 | 49.9 | 100.2 | 85.0 | 17.7 |
| EMAA 10%CNT | 10 | 51.1 | 52.7 | 97.05 | 85.4 | 17.6 |
| EMAA 15% CNT | 15 | 41.6 | 43.1 | 97.99 | 86.6 | 14.3 |
Table 3.
Summary of DSC results of EMAA-EG nanocomposites and EMAA matrix.
| Sample | EG (%) | ∆Hm (J/g) | ∆Hc (J/g) | Tm (°C) | Tc (°C) | Xc (%) |
| EMAA | 0 | 43.0 | 54.9 | 102.1 | 82.2 | 14.7 |
| EMAA 10% EG | 10 | 53.5 | 57.0 | 100.1 | 84.4 | 18.3 |
| EMAA 15% EG | 15 | 52.5 | 57.4 | 98.19 | 84.4 | 17.9 |
| EMAA 30% EG | 30 | 51.4 | 53.1 | 98.66 | 84.9 | 17.6 |
Disclaimer/Publisher’s Note: The statements, opinions and data contained in all publications are solely those of the individual author(s) and contributor(s) and not of MDPI and/or the editor(s). MDPI and/or the editor(s) disclaim responsibility for any injury to people or property resulting from any ideas, methods, instructions or products referred to in the content. |
© 2025 by the authors. Licensee MDPI, Basel, Switzerland. This article is an open access article distributed under the terms and conditions of the Creative Commons Attribution (CC BY) license (http://creativecommons.org/licenses/by/4.0/).
Copyright: This open access article is published under a Creative Commons CC BY 4.0 license, which permit the free download, distribution, and reuse, provided that the author and preprint are cited in any reuse.


