Submitted:
01 May 2025
Posted:
05 May 2025
You are already at the latest version
Abstract
Avocado commodity is one of the horticultural commodities that has high economic value and has great potential to be traded to meet market needs, both domestic and international. This study investigates the variables of farmer participation that are influential in efforts to increase the productivity of Avocado farming based on Good Agricultural Practices (GAP), and standard operating procedures (SOP), and the direct and indirect effects of exogenous latent variables of farmer characteristics, farmer abilities, farmer opportunities and production factors, as well as the direct effect of endogenous variables of farmer participation on Avocado farming performance in Baruppu' District, North Toraja Regency. Data were collected from 120 respondents through purposive sampling and analyzed using descriptive statistics and SEM-PLS. The findings showed that influential variables such as farmers' ability, farmers' opportunity, production factors, farmers' participation, and Avocado farming performance were in the moderate category. This indicates that farmers in Baruppu' sub-district have basic knowledge and skills in managing Avocado farming, but there is still room for improvement, and through direct effect analysis results show that all independent variables have a significant effect on farm performance. Production factors, farmer characteristics, farmer abilities, farmer opportunities, and farmer participation all have a positive and significant influence on farm performance.
Keywords:
farmer participation
; avocado farming
; productivity improvement
; Good Agricultural Practices (GAP)
; standard operating procedures (SOP)
1. Introduction
Commodity avocado is a significant component of the global horticultural landscape, exhibiting considerable economic potential (Bappenas, 2018). This fruit possesses the capacity to meet substantial trade demands, catering to both domestic and international markets (Tamalia et al., 2019). As the general public becomes increasingly aware of the importance of a healthy diet, demand for avocados is expected to rise (Cahyo, 2019; Dyanto et al., 2022; Fanani et al., 2023; Permatasari et al., 2021; Suryana, 2016). Avocados are considered to be one of the most beneficial fruits (Suryana, 2016).
As demonstrated in the Statistical Yearbook of Indonesia (2022), the production of fruit avocado in Indonesia in 2019 was documented as 998 tons, and this figure increased to 1,491 tons in 2020. The production of this product is intended for both domestic consumption and export. In 2020, the export of avocados from Indonesia amounted to 483 tons. Nevertheless, the increase in demand necessitates the implementation of measures to enhance sustainable productivity through the optimisation of business management practices, with the ultimate objective of supporting farmers in achieving their endeavours.
The North Toraja Regency (South Sulawesi) has the potential for significant development in the avocado industry, with a particular focus on the Persea americana variety, commonly referred to as avocado butter. Avocado production is a prominent agricultural activity in the district, with the Baruppu subdistrict being a notable contributor to this endeavour. In 2021, the production of avocados in the District of Baruppu was recorded at 629 tons (BPS North Toraja, 2022). The district is situated at an altitude of 1,000–1,800 metres above sea level, with a temperature of 15–20°C. These conditions are optimal for avocado cultivation. The region's fertile volcanic soil is conducive to avocado cultivation, obviating the necessity for excessive fertiliser.
Nevertheless, there is a considerable amount of arable land in the District of Baruppu that is currently being utilised for the cultivation of commodities such as coffee and cocoa. Indeed, the potential of avocados as a commodity is considerable. In addition to the geographical conditions, the cultural norms of mutual cooperation, termed ma'pasonglo, which are still prevalent in the local community, can facilitate the establishment of farmer groups for the management of avocado cultivation.
Nevertheless, the distribution of avocados from Subdistrict Baruppu continues to be confined to traditional markets. A key factor underpinning this issue is the limited engagement of the public in the realm of management and development initiatives pertaining to avocado farming. Despite the presence of abundant natural resources and a strong tradition of mutual cooperation, the absence of a robust implementation system, effective management techniques and suitable agricultural practices has resulted in a decline in productivity. Furthermore, constraints in terms of market access, in addition to limitations in infrastructure such as transportation and facilities post-harvest, act as obstacles to the expansion of avocado marketing ranges. It is imperative that an evaluation system is implemented for the management of agriculture, encompassing the implementation of Good Agricultural Practice (GAP) and Standard Operational Procedure (SOP). This is necessary to enhance productivity and broaden the avocado market reach within the Baruppu subdistrict.
The implementation of GAP has been demonstrated to engender an enhancement in productivity levels in a number of other countries. For instance, as demonstrated by the case of Mexico, the implementation of Good Agricultural Practices (GAP) has been shown to enhance avocado yields by up to 20% (FAO, 2018). This approach also fosters environmental sustainability and minimises the utilisation of chemical pesticides. Furthermore, the implementation of effective Standard Operating Procedures (SOPs) has been demonstrated to enhance the quality of produce. The California Avocado Commission (2020) has demonstrated through rigorous research that adhering to the stipulated Standard Operating Procedure (SOP) during the harvest process can enhance the level of oil content in avocados. Consequently, the price of these fruits has exhibited a notable increase of up to 30%.
Nevertheless, the successful implementation of GAP and SOP is contingent upon the active involvement of farmers in both the group and individual farmer categories. Participation is an ongoing process which encompasses a number of distinct stages, commencing with the initial planning phase and culminating in the evaluation of activities (Suryana, 2016). The limited engagement of farmers is frequently attributable to factors including restricted access to information, inadequate education, conventional thinking patterns, and insufficient communication support (Alif, 2017; Putri et al., 2019). Conversely, the success of business farming is also influenced by the efforts of the workforce. A similar dynamic exists in institutional agriculture, from the farmer to the industry downstream, which plays a role in processing, harvesting, and delivering results to consumers (Dyanto et al., 2022). As Anwari et al. (2021) argue, the provision of facilities, infrastructure, and training and outreach programmes by private parties is also very necessary, as is the provision of support for the government.
Furthermore, it is imperative to consider the term 'sustainability' in relation to its temporal dimension. It is anticipated that the implementation of GAP and SOP will yield enhanced productivity and efficiency, thereby addressing both the support market's demands and the enhancement of farmers' welfare in the District Baruppu. The implementation of sustainable agricultural practices is a pivotal factor in the enhancement of land productivity. Concurrently, it has the potential to exert a favourable environmental impact.
In accordance with the aforementioned description, the primary objective of the present study is to analyse the participation of farmers in the endeavour to enhance productivity through the implementation of Good Agricultural Practices (GAP) and Standard Operational Procedures (SOP) in avocado farming enterprises within the District of Baruppu', North Toraja Regency. The present study aims to investigate the direct and indirect influence of exogenous latent variables, such as characteristics, abilities, opportunities, and production factors, on farmer performance in avocado production in the region. In addition, the influence of direct endogenous participation variables on farmer performance will be examined.
Therefore, the Structural Equation Modeling - Partial Least Square (SEM-PLS) approach was utilised to ascertain the elements that require consideration for the enhancement of the sustainability of avocado farmers' businesses in Baruppu' District. It is anticipated that this approach will furnish pertinent recommendations for the government and relevant stakeholders, with a view to enhancing the productivity and management of avocado farming in the Baruppu' Sub-district.
2. Theoritical Foundation and Hypotheses Development
2.1. Theoritical Foundation
This research draws on the Active engagement (Katz et al., 1973) in the implementation of GAP and SOP has the potential to contribute meaningfully to the empowerment of farmers. Participation enables farmers to adapt these practices to suit the specific conditions of their land and resources, thereby increasing their effectiveness and relevance. Furthermore, engagement in the learning and experimentation process has been shown to enhance farmers' comprehension of the principles underlying GAP and SOP, thereby empowering them to make more informed and autonomous decisions regarding the management of their farms. Furthermore, engagement in farmer collectives or organizations that advocate for Good Agricultural Practices (GAP) and Good Animal Practices (GAP) can fortify social capital, enhance access to information and resources, and establish a framework for collective advocacy. Consequently, the active involvement of farmers in the adoption of GAP and SOP not only enhances productivity but also fosters long-term sustainability in farming practices and the overall well-being of farmers, , Good Agricultural Practices (GAP (Pine & Gilmore, 1999) and ), and standard operating procedures (SOP) theories by Mehrabian & Russell in 1974 (Jung et al., 2021).
2.1. Hypotheses Development
The conceptual framework of the theory that will be developed in this study refers to the study of various literature that has been conducted. The participation that will be studied is farmer participation in the performance of farming businesses in the Avocado commodity. Farmer participation (Y1) also acts as an intervening or mediating variable of Avocado farming business performance (Y2) (Nisita Wuri et al., 2021).
According to (Martadona & Elhakim, 2020) Farmer characteristics are influenced by age, education, experience, and complexity. Meanwhile, farmer abilities according to (Permatasari et al., 2021) are influenced by technical, social, conceptual, and managerial factors. Meanwhile, opportunities according to (Triguna et al., 2022) are influenced by market support, government support, private support, and information. According to (Fangohoi et al., 2022) production factors are influenced by land, labor, fertilizers, pesticides, and capital.
According to (Fangohoi et al., 2022) Participation is grouped according to its stages, namely: (1) the planning stage is the stage where the community participates in planning the implementation of an activity or program; (2) the implementation stage is the stage where the community participates in contributing actions as members of activities or programs, thoughts, and materials; (3) the stage of enjoying the results is the stage where the community as the subject of development feels the benefits of the program; and (4) the evaluation stage is feedback from the community by providing input for improving program implementation. Furthermore, participation will directly affect the performance of avocado farming businesses which can be measured by fruit quality, total production, productivity, R/C ratio, B/C ratio, gross margin (Dyanto et al., 2022).
The measuring variables or exogenous variables in this study are farmer characteristics (X1) with indicators including age (X1.1), education (X1.2), experience (X1.3), and cosmopolitanism (X1.4); Farmer Ability (X2) with indicators including technical ability (X2.1), social ability (X2.2), conceptual ability (X2.3), and managerial ability (X2.4); Farmer Opportunities (X3) with indicators including market support (X3.1), government support (X3.2), private support (X3.3), and availability of information (X3.4) (Mulyaningsih et al., 2018; Triguna et al., 2022). In addition to the three exogenous variables, the allocation of production factors is also one of the variables assumed to influence farmer participation in the performance of avocado farming, so that the SEM modeling that will be built also involves the variable of production factor allocation (X4) with indicators including land allocation (X4.1), labor allocation (X4.2), fertilizer allocation (X4.3), pesticide allocation (X4.4), and capital allocation (X4.5) (Kewu et al., 2020; Mayasari, 2016). These variables are then arranged in a theoretical model which is then used as the basis for developing the SEM model. Based on the explanation of the research background, previous research and theoretical studies, the conceptual framework of this research can be stated as follows:
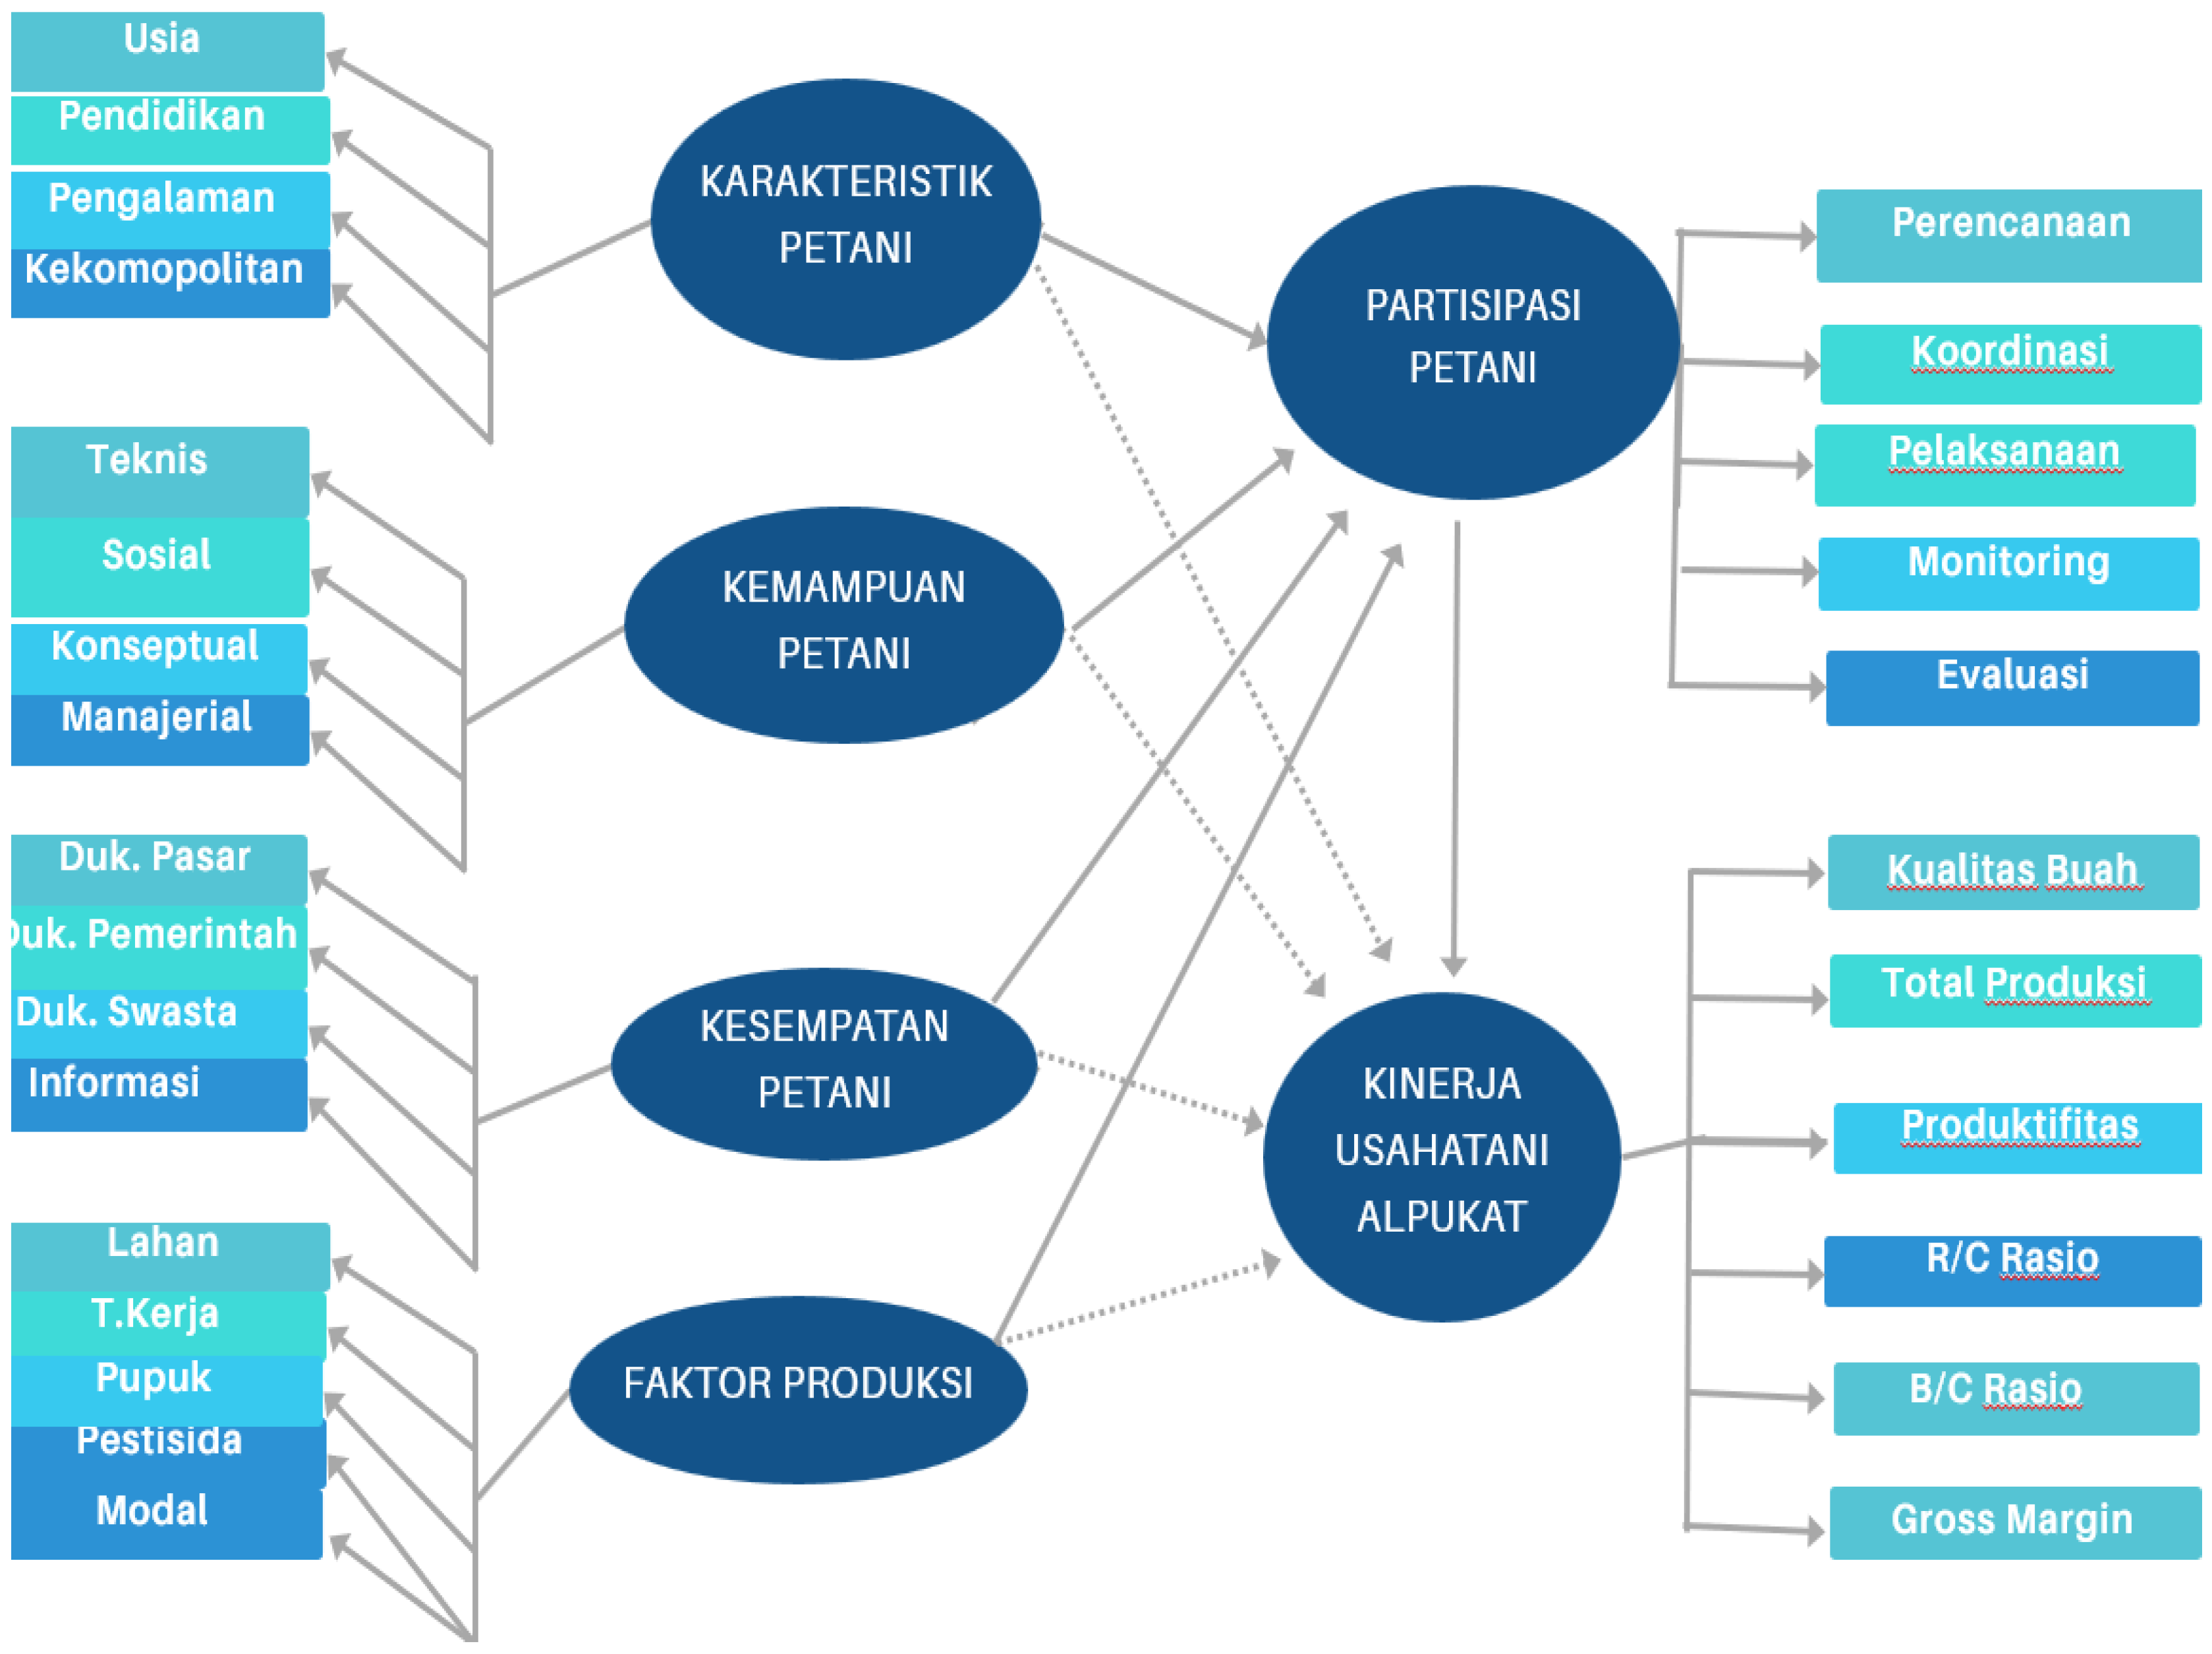
Figure 1. Conceptual Model.
The relationship between these variables can be explained briefly as follows:
- It is suspected that the farmer characteristics variables (X1), farmer abilities (X2), farmer opportunities (X3), production factors (X4), have a significant relationship and have a direct influence on farmer participation (Y1).
- It is suspected that the farmer characteristics variables (X1), farmer abilities (X2), farmer opportunities (X3), production factors (X4), have a significant relationship and have an indirect influence but are suspected of influencing the farm business performance variable (Y2).
- It is suspected that the farmer participation variable (Y1) has a significant relationship with the farm business performance variable (Y2).
3. Materials and Methods
3.1. Data Collection
This study was conducted in October-December 2024, in Toraja Utara. This study uses purposive sampling, a method where the determination of the sample is carried out de-liberately and there are conditions that must be met by the sample (Creswell & Creswell, 2011). Data collection in research This done through technique interview structured with use questionnaire to the farmers Avocado in the District Baruppu ' North Toraja Regency based on questionnaire that has been made. Interview structured is technique data collection when researcher or data collector has know with Certain about information What will obtained , in the interview structured this , every Respondent given question the same , and the data collector records them (Wilinny et al., 2019). The sample is part quantity and characteristics from population The technique used in election sample is simple random sampling. Simple random sampling is taking member sample from population that is done in a way random without pay attention to existing strata in population (Sugiyono, 2013). Number Respondent sample This obtained use Slovin's formula is as follows :
n=71, 43 ; adjusted by researcher 120.
Information :
n = number the sample ( soul )s
N = Number population ( people )
= Error rate (10%)
Amount sample used follow criteria amount respondents who will used in the SEM ( Structural Equation Modeling ) Hair model (2009) States that size recommended minimum sample ranges from 100 – 300 in SEM ( Structural Equation Modeling) estimation. Therefore that , for make it easier in data processing and results more testing Good so in study This sample to be used rounded up to 120 respondents farmer Avocados located in the District Baruppu ' North Toraja Regency.
3.1. Data Analysis
3.2.1. Descriptive Statistical Analysis
In this study, descriptive statistical analysis is used to describe the variables used in the study. Interpretation of descriptive statistical data in this study using the TCR (Respondent Achievement Level) criteria. The following is a formula for determining the value of the Respondent Achievement Level according to (Sugiyono, 2013):
TCR= X 100
Table 1. TCR (Respondent Achievement Level) Value Criteria.

| TCR | Scale Range |
|---|---|
| Very Good | 90% - 100% |
| Good | 80% - 89,99% |
| Enough | 65% - 79,99% |
| Not Enough | 55% - 64,99% |
| Not Good | 0% - 54,99% |
Sumber : Sugiyono (2013).
3.2.2. Structural Equation Modeling (SEM) Data Analysis
Structural Equation Modeling (SEM) is combination technique multivariate data analysis interdependence and dependency , namely analysis factor confirmatory and analytical path. Variables analyzed is latent variables ( constructs ), namely variables that are not can observed direct (unobservable) but measured through indicators – indicators measurable which is called manifest variable ( variable indicators ). SEM aims No For produce a model but test or confirming the model based theory , namely measurement models and structural models ( Kusnendi , 2008).
In research This is the data that has been collected through questionnaire will recapitulated using MS Excel. Processed results the furthermore be input and analyzed with SEM method uses help SEM-PLS program for all over SEM modeling test stages (Abdillah & Nugroho, 2024).
- Model Identification
Stage identification of the purpose of the model For ensure the model to be tested No is an under -identifield model , but is a just- identifield model and more liked is an over -identifield model. Model identification is performed with inspect amount variable the existing manifest in the model ( p + q ) and the sum all model parameters will be estimated ( t ).
- 2.
- Model Parameter Estimation
Stage the intended model parameter estimation For to obtain all statistics of the proposed model. Stage model parameter estimation includes three matter as following :
- Determine the input data to be analyzed.
- Determine method the estimate that will be used.
- Determining the model parameter estimation strategy.
- Testing the Model
After do approach 2- stage parameter estimation that is measurement model parameter estimation Then structural model estimation , then furthermore will done model testing.
- a)
- Evaluation validity indicators and reliability construct.
Validity test indicator estimated based on coefficient weight the standardized factor (standardized factor loading) No not enough from 0.40 no not enough from 0.50 (Ghozali, 2014). If there is invalid indicator then issued from the model and measurement parameters estimated repeat.
Furthermore evaluation reliability construct for each measurement model. Reliability counted through construct reliability (CR) and or average variance extracted (AVE) as well cronbach alpha. Measurement model it is said reliable If results estimate CR coefficient is the same with or more big from 0.70 and or AVE is the same with or more big from 0.50 and Cronbach alpha is more big or The same with 0.70.
- b) Measurement Model Test
Measurement model testing done as following :
- Testing overall model fit.
Table 2.
Some Measures of Goodness of Fit Test (GFT).
| GFT Size | Description |
|---|---|
| Probability (P-value) | The size of the model- based fit test maximum likelihood (ML). mark P (probability) is expected exceeds 0.05 (model fit ) or P = 1 (perfect fit) |
| CMIN/DF | The CMIN/DF ≤2 value indicates that the model fits the data. This means that the more proposed model persimmon compared to with alternative models. |
| Root Mean Square Error of Approximate – on (RMSEA) | Approximation value root mean square error. Expected its value low.RMSEA < 0.08 means the model fits the data. |
| Tucker-Lewis Index (TLI) | Expected >0.90 then said to be a fit model. |
| Comparative Fit Index (CFI) | Size model -based suitability comparative with the null model. The CFI value is range between 0 – 1.0.CFI > 0.90 model fits the data. |
| Normed Fit Index (NFI) | The model is said fit if NFI > 0.90. |
| Parsimonious Normed Fit Index (PNFI) | The more tall the resulting PNFI value so increasingly fit the proposed model. |
Source : Kusnendi (2008).
Minimum measurement model suitability test is carried out with using at least 3 GFT sizes. Here is a number of the most common measure of goodness of fit (GFT). used by researchers in test model suitability.
- c) Hybrid Model Test
Testing hybrid model is done in 2 stages as following :
- Testing overall model fit
Statistics and criteria testing same model fit with that used in testing the measurement model.
- Testing meaningfulness (test of significance) coefficient structural model path
This matter means test hypothesis research. Criteria the test use statistics t , if mark t count t table value at level error 0.05 and degrees freedom of n-1 (n is size sample ) then hypothesis zero rejected and hypothesis alternative ( hypothesis) research ) is accepted. A hypothesis it is said significant If t- value count The same or more big from 1.96 or own higher P - value small or The same with cut-off value of 0.05. (Ghozali, 2014).
- d) Model Improvement and Interpretation of Results
Model improvements were made with objective For obtain the simplest model. This is done when in the structural model found coefficient the path that is not significant. Interpretation results done For answer problem proposed research through discussion or discussion statistics
4. Results
4.1. Identity Respondents
Identity Respondent is description about characteristics possessed Respondent based on education , age , and gender sex (Tamalia et al., 2019). Identity Respondent used in give description about respondents who became subject research. Identity Respondent in study This can seen from a number of side , namely based on level age , type gender , and number power Work (Permatasari et al., 2021). Respondents in the study This as many as 120 farmers Avocados in Baruppu ' are willing for made into respondents.
4.1.1. Age
Age is one of the related factors direct with productivity Work productivity work. Age is still in productive period usually have level productivity more tall compared to with power work that has been done aged old so that physical possession become weak and limited (Sasongko, 2015). Age productive be in range age 15-64 years (Bappenas, 2018).
Based on Table 3, it can be seen that amount Respondent dominant be in range age 26-35 years as much as 36% or a total of 42 people from overall amount respondents. This is show that age productive farmer Avocado in study This be in range age 26-35 years. In the productive period a person , power physique will close the relation with age Because If age somebody past the productive period , then will decrease strength his physical so that productivity and income received will influential.
4.2. Gender
At the corner view biological type sex is difference between men and women. As for the differences between men and women can seen through approach cultural , social , psychological , and genetic (V. J. Caiozzo, F. Haddad, S. Lee, M. Baker et al., 2019).
Respondents in study This consists of of 81 men and 39 women. Based on Table 4 show that amount Respondent man more dominant that is by 65% compared to with Respondent Woman that is by 35%. Can concluded that man tend more productive in work compared to women. This is in accordance with opinion Boitshwarelo (2011 ) said that level participation Work man always more tall from level participation Work Woman Because man considered seeker main livelihood for family.
4.3. Number of Workers
Labor is source the most important power for a farming Because have energy , talent , and much needed creativity in reach a objective (Sudarwani & Ekaputra, 2017). In the research This amount power work owned Respondent shared become three group that is not enough from 2 people, 2 to 4 people, and more from 4 people.
Based on Table 5 , it can be seen that the average number power Work farmer Avocado in the District Baruppu ' which is lacking from 2 people as many as 85 respondents with percentage 75%, then the amount power work of 2-4 respondents as many as 33 respondents with percentage 24%, and the number power Work more out of 4 people , 2 people were respondents with percentage 1%. According to Kusumaningrum (2019) power Work play a role important in give attention to a farming as a process and activity related to with skills and expertise in satisfying consumer with method Keep going evaluate needs and wants consumers. Number calm down the work that is owned will also give contribution in increase success farming.
4.4. Characteristics Farmer (X1)
Characteristics farmer can made into reflection condition social and economic status of each respondent (Permatasari et al., 2021 ). The indicators included in variable This is Age , Education, Experience , and Competence.In measure big influence from indicator the can seen big Achievement Level Values and Categories Respondents (TCR):
Based on Table 6 above obtained the average variable characteristics farmer of 2.79 and the level achievement respondents 69.79% with category enough. With thus can it is said influence characteristics farmer to performance farming Avocado own category enough. Indicator with lowest TCR value in variable characteristics farmer is Comprehensiveness with average score 2.76 with category enough. While indicator with highest TCR value in variable characteristics farmer is Experience with average score 2.83 with category Enough.
4.5. Capabilities Farmer (X2)
Ability farmer is ability farmer in covers ability in adapt with Good (Permatasari et al., 2021). So that indicators entered in variable This are Technical, Social , Conceptual , and Managerial. In measuring big influence from indicator the can seen big Achievement Level Values and Categories Respondents ( TCR) :
Based on Table 7 above obtained the average variable ability farmer of 2.76 and the level achievement respondents 69.01% with category enough. With thus can it is said influence variable ability farmer to performance farming Avocado own category enough. Indicator with lowest TCR value in variable ability farmer is Technical and Social with average score 2.74 with category enough. While indicator with highest TCR value in variable ability farmer is Managerial with average score 2.79 with category Enough.
4.6. Opportunities Farmer (X3)
Chance farmer is chance for farmer in increase income and welfare of farmers (Hijriati & Mardiana, 2014). So that indicators entered in variable This is Market Support , Support Government , Private , and Information. In measuring big influence from indicator the can seen big Achievement Level Values and Categories Respondent (TCR).
Based on Table 8 above obtained the average variable chance farmer of 2.82 and the level achievement respondents 70.57% with category enough. With thus can it is said influence variable chance farmer to performance farming Avocado own category enough. Indicator with lowest TCR value in variable chance farmer is Support Government with average score 2.79 with category enough. While indicator with highest TCR value in variable chance farmer is Information with average score 2.88 with category Enough.
4.7. Production Factors (X4)
Production factors is very important factor in determine the quantity and quality of output produced (Putri et al., 2019). So that indicators entered in variable This is Land, Labor , Fertilizer Pesticides , and Capital. In measuring big influence from indicator the can seen big Achievement Level Values and Categories Respondent (TCR).
Based on Table 9 above obtained the average variable factor production of 2.72 and the level achievement respondents 68.08% with category enough. With thus can it is said influence variable factor production to performance farming Avocado own category enough. Indicator with lowest TCR value in variable factor production is Pesticide with average score 2.70 with category enough. While indicator with highest TCR value in variable factor production is Land with average score 2.77 with category Enough.
4.8. Participation Farmer (Y1)
Participation farmer is involvement active farmer in various aspect agriculture , start from stage planning , up to evaluation activity agriculture (Rosanti, N., Sinaga, BM, Daryanto, A., & Kariyasa, 2019). So that indicators entered in variable This is Planning , Coordination , Implementation , Monitoring, and Evaluation. In measuring big influence from indicator the can seen big Achievement Level Values and Categories Respondent (TCR).
Based on Table 10 above obtained the average variable participation farmer of 3.47 and the level achievement respondents 69.40% with category enough. With thus can it is said influence variable participation farmer to performance farming Avocado own category enough. Indicator with lowest TCR value in variable participation farmer is Coordination with average score 3.43 with category enough. While indicator with highest TCR value in variable participation pet is Monitoring with average score 3.50 with category Enough.
4.9. Farm Business Performance Avocado (Y2)
Farm business performance Avocado is achievement or results obtained from business agriculture Avocado (Dyanto et al., 2022). So that indicators entered in variable This is Quality Fruit , Total Production , Productivity , R/C Ratio , B/C Ratio , Gross Margin. In measuring big influence from indicator the can seen big Achievement Level Values and Categories Respondent (TCR).
Based on Table 11 above obtained the average variable performance farming Avocado of 3.46 and the level achievement respondents 69.19% with category enough. Variable performance farming Avocado consists of on six indicator that is quality fruit , total production , productivity , R/C Ratio , B/C Ratio , and Gross Margin, and is in the category Enough.
4.10. Structural Equation Modeling-Partial Least Square (SEM-PLS) Analysis
4.10.1. Measurement Model Testing
Partial least square (PLS) uses method bootstrapping or duplication in a way random which assumption normality No will become problem for PLS. Research model This consists of of 6 ( six ) constructs among them variable Characteristics Farmer (X1), Ability Farmer (X2), Opportunity Farmers (X3), Production Factors (X4), Participation Farmers (Y1), Farm Business Performance Avocado (Y2). Measurement model testing is stages For test validation and reliability a construct. Measurement This done with analysis measurement model (outer model) where measurement at stage This through 4 ( four ) stages analysis testing , including is individual item reliability , internal consistency reliability , average variance extracted , and discriminant validity. Following results analysis model measurement explained in four stage as following :
A. Individual Item Reliability
At the stage early , done testing For validate every indicator to variables under review based on outer loading value. High loading factor value indicates that indicator the capable explain the variables it measures. According to (xxx), the indicators with mark loading factor of 0.7 or more considered fulfil criteria acceptance.
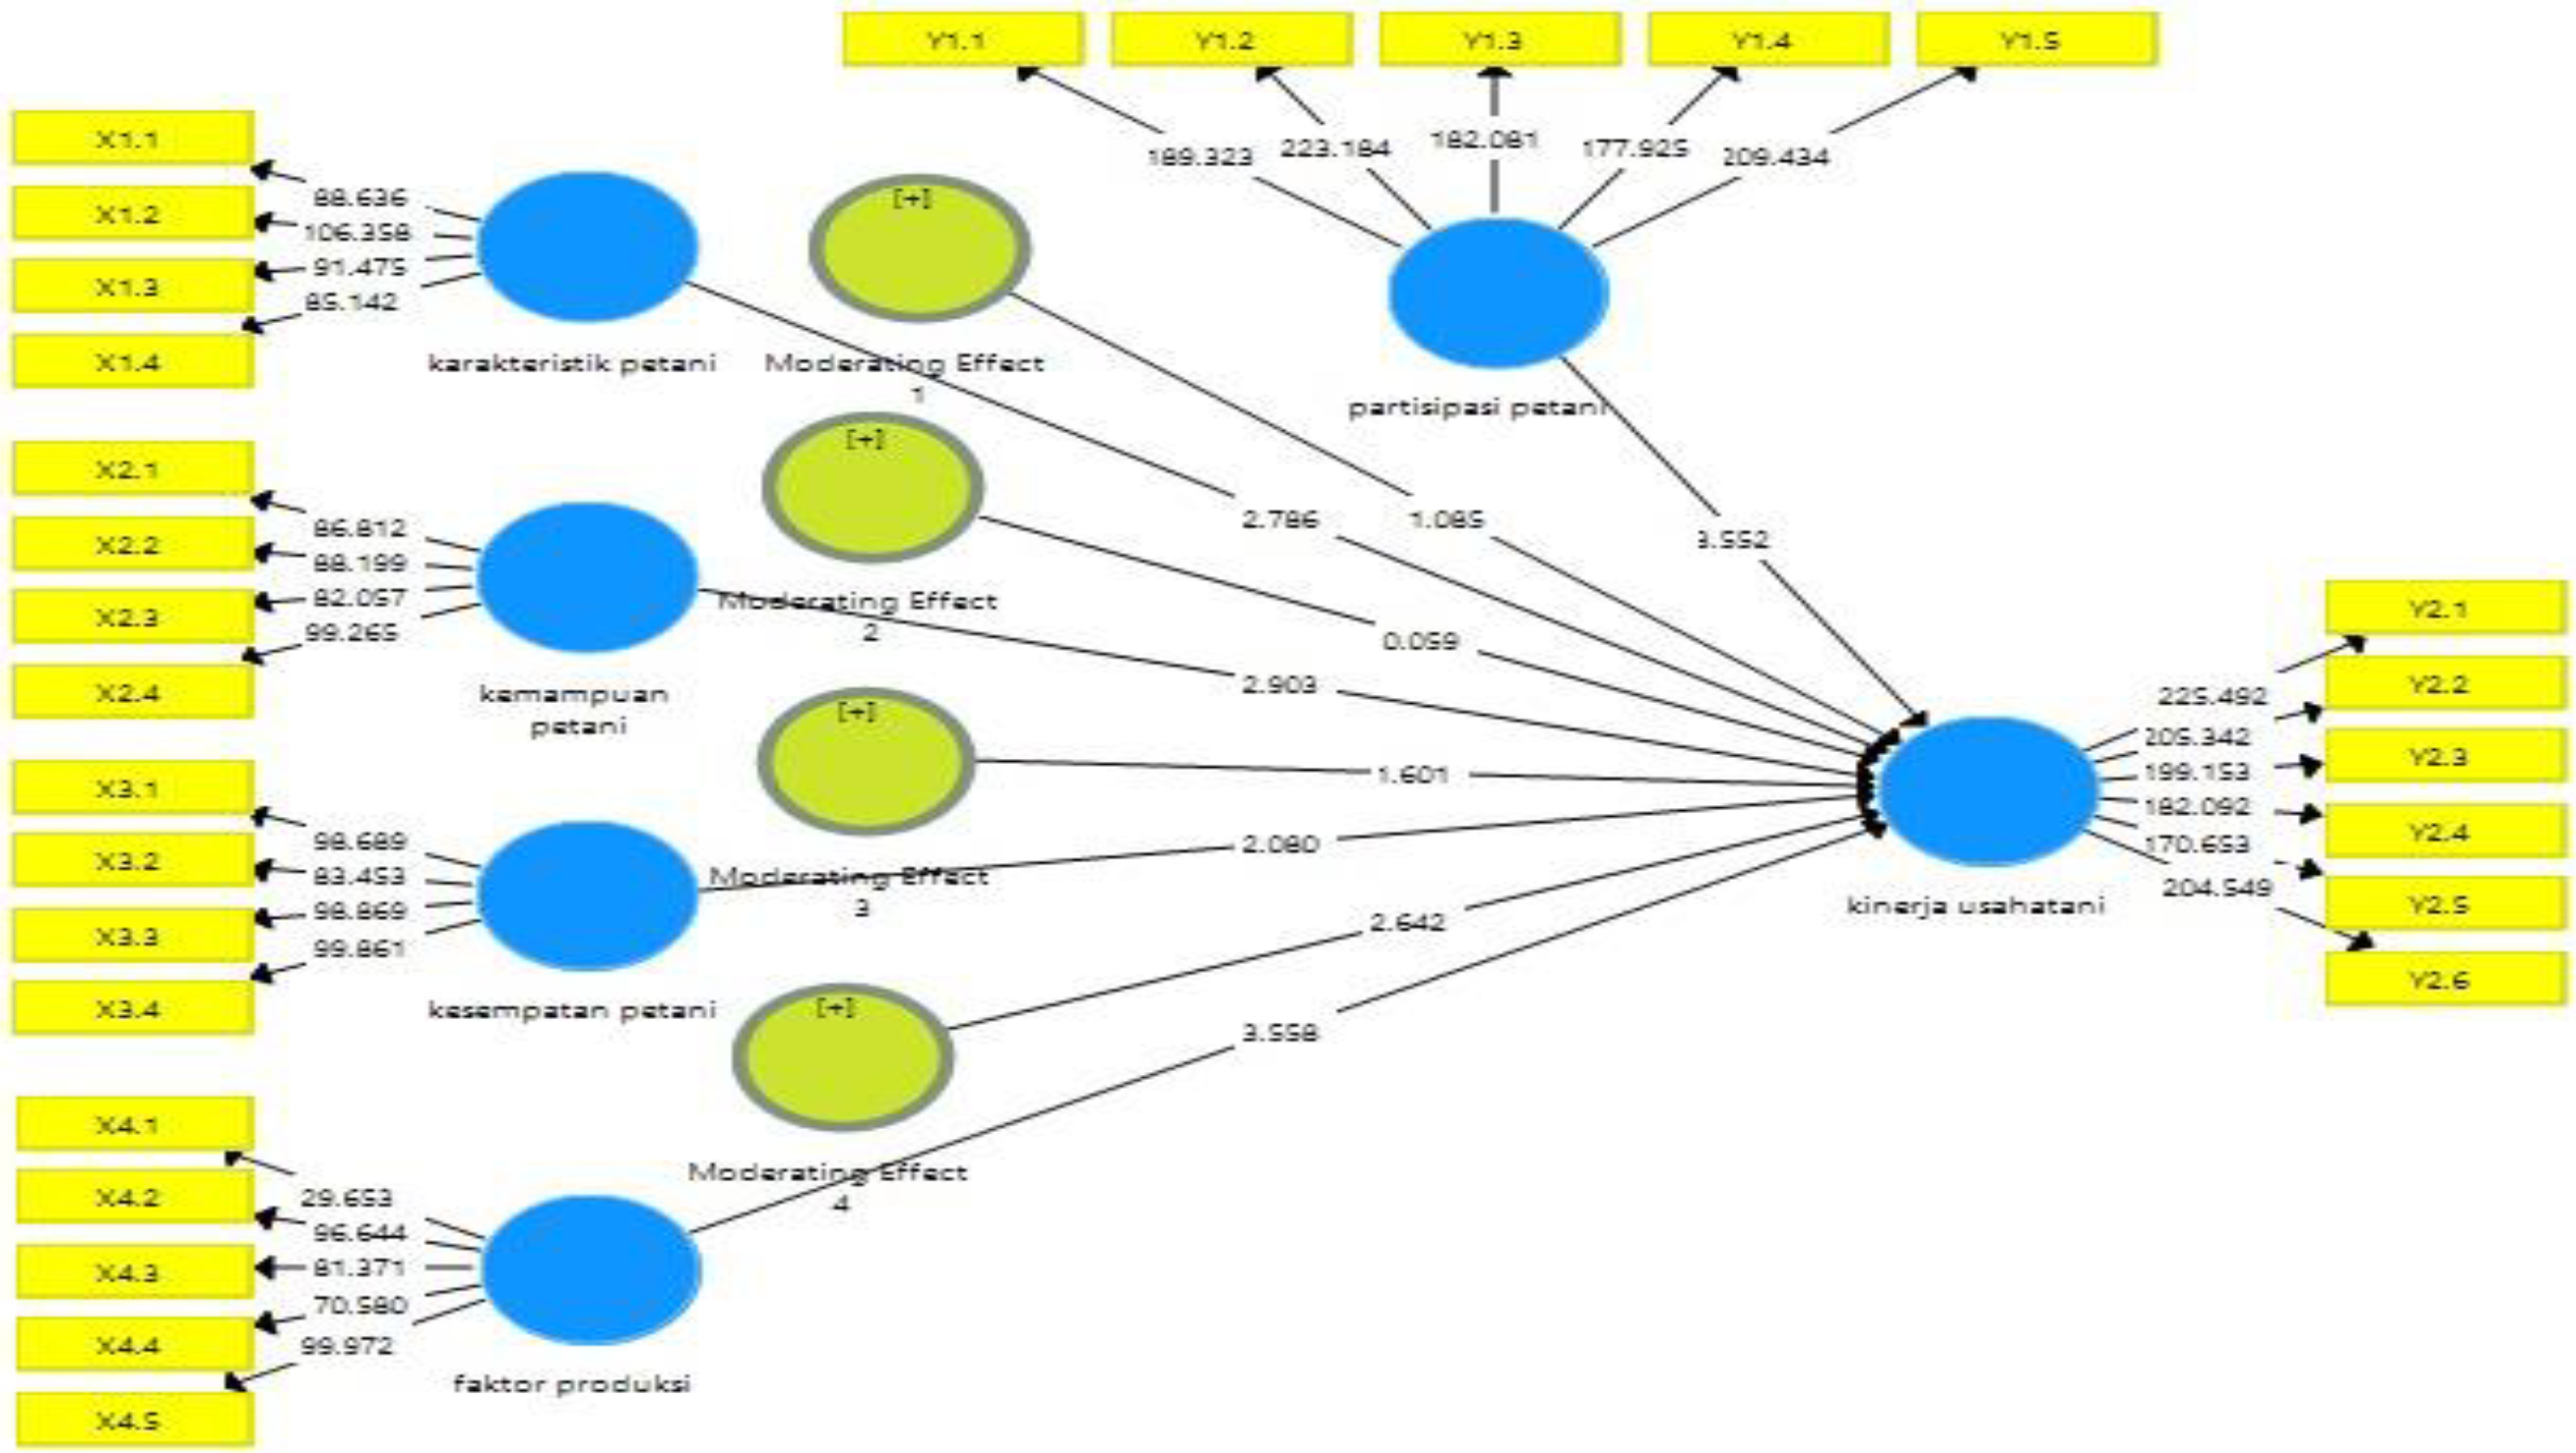
Gambar 3. Output Outer Model.
Outer model in the picture the show connection between indicators ( manifest variables ) with latent variables. The outer loading value for each indicator show how much big contribution indicator the in represent variable latent represented. In In general , a high outer loading value ( ideally >0.7) indicates that indicator the own a strong and valid contribution to latent variable. In this model , the indicators such as X1.1 to X4.5 and Y1.1 to Y2.6 have the varying outer loading values reflect the strength of each indicator in explain latent variables such as characteristics farmer , ability farmer , opportunity farmer , factor production , participation farmers , and performance farming. Values This become reference important For evaluate relevance every indicator in the model, where is the indicator with low outer loading Possible need under consideration For issued from the model because lack of contribution to latent variables.
Analysis results outer loading show that all over indicators on each latent variables meet criteria validity with mark loading factor above 0.7. On the variable factor production , indicators X4.1 to X4.5 have mark loading factor range between 0.842 to 0.924, shows strong contribution in represent variable said. For variable characteristics farmers , indicators X1.1 to X1.4 have mark loading factor height , namely between 0.909 to 0.930, which also shows very good validity.
On the variables ability farmers , indicators X2.1 to X2.4 have mark loading factor in range 0.893 to 0.911, indicating consistent and significant contribution. Furthermore , on the variable chance farmers , indicators X3.1 to X3.4 show mark very high loading factor , namely between 0.909 to 0.930, which supports validity its construction.
For latent performance variables business farmers , indicators Y2.1 to Y2.6 have mark very strong loading factor , ranging from between 0.945 to 0.958, which shows excellent representation to the latent variable. Similar things were also found in the latent variable. participation farmers , where indicators Y1.1 to Y1.5 have mark loading factor high , between 0.950 to 0.958. With thus , all indicator in this model has fulfil criteria validity , so that can concluded that indicators the capable represent latent variables with Good.
B. Internal Consistency Reliability
Testing done with utilise composite reliability (CR) value. This internal consistency refers to the level conformity or reliability between observer or instrument measurements used in study.
Table 13.
Cronbach's Alpha and rho A.
| Cronbach's Alpha | rho_A | Kritea | Test Results | |
|---|---|---|---|---|
| factor production | 0.937 | 0.938 | 0.70 | VALID |
| characteristics farmer | 0.938 | 0.938 | 0.70 | VALID |
| ability farmer | 0.927 | 0.928 | 0.70 | VALID |
| chance farmer | 0.938 | 0.938 | 0.70 | VALID |
| performance farming | 0.980 | 0.980 | 0.70 | VALID |
| participation farmer _ | 0.976 | 0.976 | 0.70 | VALID |
Reliability test results show that all over variable in study This fulfil criteria high reliability and validity. The Cronbach's Alpha value for all variable is above 0.7, which shows level excellent internal consistency. In addition , the value rho_A is also consistent with Cronbach's Alpha results indicate stability and reliability instrument measurement.
Composite Reliability (CR) value for all variables also exceed threshold of 0.7, with mark highest on variables performance farming (0.983) and participation farmers (0.981). This is show that constructs on each variable own excellent reliability.
Next , the Average Variance Extracted (AVE) value for all variable exceeding 0.5, with mark highest on variables participation farmers (0.912) and performance farming (0.908). This indicates that more from 50% variance from every construct can explained by its indicators , so that validity convergent fulfilled.
C. Average Variance Extracted (AVE)
On testing at stage This with method see average variance extracted value , a mark declared valid if AVE test value is above 0.5.
Table 14.
Average Variance Extracted (AVE).
| Average Variance Extracted (AVE) | Criteria | Test Results | |
|---|---|---|---|
| factor production | 0.800 | 0.50 | VALID |
| characteristics farmer | 0.844 | 0.50 | VALID |
| ability farmer | 0.821 | 0.50 | VALID |
| chance farmer | 0.844 | 0.50 | VALID |
| performance farming | 0.908 | 0.50 | VALID |
| participation farmer _ | 0.912 | 0.50 | VALID |
The results of the Average Variance Extracted (AVE) test show that all variable in study fulfil criteria validity convergent. AVE is size indicating how much big proportion variance in the indicators that can explained by the construct being measured. In the research all of these AVE value is higher big from threshold of 0.50, which indicates that every construct capable explain more of 50% of the variance in its indicators.
In general detailed , variable factor production own AVE value of 0.800, characteristics farmer own value 0.844, ability farmer 0.821, opportunity farmer 0.844, performance farming 0.908, and participation farmers 0.912. Values This show that all variable in study has fulfil criteria validity , so that can it is said that indicators used For measure each construct is valid. With Thus , research This show that measurements taken can reliable in represent the construct being studied.
D. Discriminant Validity
Discriminant validity testing was carried out aiming For test how much Far latent constructs are truly different from construct others. Validity value high discriminant show that A construct capable explain current phenomenon measured. Discriminant validity testing was carried out with with 2 methods that is see cross loading value between indicators , as well as Fornell-Lacker's cross loading.
Table 15.
Cross Loading.
| factor production | characteristics farmer | ability farmer | chance farmer | performance farming | participation farmer _ | |
|---|---|---|---|---|---|---|
| X1.1 | 0.805 | 0.916 | 0.856 | 0.862 | 0.872 | 0.879 |
| X1.2 | 0.814 | 0.930 | 0.853 | 0.859 | 0.881 | 0.874 |
| X1.3 | 0.806 | 0.920 | 0.871 | 0.873 | 0.880 | 0.891 |
| X1.4 | 0.783 | 0.909 | 0.857 | 0.851 | 0.888 | 0.880 |
| X2.1 | 0.799 | 0.866 | 0.911 | 0.861 | 0.890 | 0.891 |
| X2.2 | 0.818 | 0.845 | 0.911 | 0.846 | 0.873 | 0.868 |
| X2.3 | 0.801 | 0.842 | 0.893 | 0.844 | 0.854 | 0.861 |
| X2.4 | 0.817 | 0.837 | 0.910 | 0.836 | 0.862 | 0.854 |
| X3.1 | 0.824 | 0.892 | 0.882 | 0.930 | 0.891 | 0.895 |
| X3.2 | 0.814 | 0.839 | 0.864 | 0.909 | 0.877 | 0.879 |
| X3.3 | 0.801 | 0.859 | 0.842 | 0.916 | 0.866 | 0.865 |
| X3.4 | 0.799 | 0.854 | 0.846 | 0.920 | 0.880 | 0.877 |
| X4.1 | 0.842 | 0.854 | 0.861 | 0.848 | 0.880 | 0.862 |
| X4.2 | 0.908 | 0.775 | 0.776 | 0.792 | 0.803 | 0.773 |
| X4.3 | 0.904 | 0.749 | 0.786 | 0.763 | 0.787 | 0.780 |
| X4.4 | 0.891 | 0.746 | 0.774 | 0.751 | 0.765 | 0.765 |
| X4.5 | 0.924 | 0.762 | 0.780 | 0.771 | 0.788 | 0.782 |
| Y1.1 | 0.840 | 0.919 | 0.906 | 0.919 | 0.932 | 0.955 |
| Y1.2 | 0.849 | 0.912 | 0.916 | 0.913 | 0.925 | 0.958 |
| Y1.3 | 0.875 | 0.909 | 0.916 | 0.915 | 0.932 | 0.950 |
| Y1.4 | 0.863 | 0.920 | 0.916 | 0.918 | 0.933 | 0.956 |
| Y1.5 | 0.820 | 0.919 | 0.924 | 0.904 | 0.929 | 0.956 |
| Y2.1 | 0.846 | 0.918 | 0.916 | 0.911 | 0.957 | 0.925 |
| Y2.2 | 0.870 | 0.914 | 0.922 | 0.927 | 0.958 | 0.928 |
| Y2.3 | 0.868 | 0.916 | 0.913 | 0.897 | 0.954 | 0.929 |
| Y2.4 | 0.848 | 0.915 | 0.920 | 0.914 | 0.954 | 0.933 |
| Y2.5 | 0.860 | 0.913 | 0.902 | 0.913 | 0.945 | 0.922 |
| Y2.6 | 0.874 | 0.903 | 0.919 | 0.909 | 0.951 | 0.931 |
Analysis results cross loading value shows to what extent are the indicators from each construct correlated with other constructs. In research Here , cross loading is used For ensure that every indicator have more loading high on the construct in question compared to with construct others , which indicates good discrimination between construct.
In general general , part big indicator shows more loading high on the appropriate construct compared to with other constructs. For example , indicators X1.1 has the highest loading on the characteristics farmers (0.916), followed by a significant loading on the construct other , but more low compared to with construct main. Indicator Y1.1 shows the highest loading on participation farmers (0.955), which is also more tall compared to with loading on the construct other.
However , some indicators , such as X4.2 until X4.5 , has sufficient loading value high on construction main , but also has relative loading value high on construction others , so that need be noticed in interpretation results. This is show existence potential overlap possible overlap need review more carry on For ensure validity construct.
Table 16.
Fornell-Larcker.
| factor production | characteristics farmer | ability farmer | chance farmer | performance farming | participation farmer _ | |
|---|---|---|---|---|---|---|
| production factors | 0.894 | |||||
| characteristics of farmers | 0.873 | 0.919 | ||||
| ability farmer | 0.893 | 0.935 | 0.906 | |||
| chance farmer | 0.881 | 0.938 | 0.935 | 0.919 | ||
| performance farming | 0.904 | 0.958 | 0.960 | 0.957 | 0.953 | |
| participation farmer _ | 0.890 | 0.959 | 0.959 | 0.957 | 0.974 | 0.955 |
In the table this , diagonal shows AVE value for every construct , while numbers outside the diagonal indicate correlation between construct. Based on results mentioned , all AVE values on the diagonal ( for example , the factor production 0.894, characteristics farmer 0.919, and so on ) more big compared to with mark correlation between construct and other constructs around it ( e.g. , correlation factor production with characteristics farmers 0.873). This shows that every construct own more Lots variations that can explained by its indicators Alone compared to with shared variations with construct others , so that fulfil criteria good discrimination.
As example , construct performance farming own AVE value of 0.953, which is more big compared to with correlation with other constructs such as factor production (0.904) or participation farmers (0.974). Likewise , participation farmer show the highest AVE value at 0.955, which is more big from correlation with construct others , showing that construct This in a way strong represent measured variables compared to with influence another construct.
3.2.2. Inner Model Testing ( Structural Model )
Inner model or measurement part in called a structural model. The inner model is a model that specifies connection between latent variable. Structural model in PLS is evaluated with using R2 for variables , Q2 and Goodness of Fit Index ( GoF) Index ). Exogenous and value path coefficient for endogenous variables which are then rated its significance based on t-statistic value of each path. The more tall r square value means the more good prediction model from the proposed research model. The path coefficients value shows level significance in testing hypothesis
A. R-Square
R square has a value between 0 and 1.00, with the condition that the closer it is to 1.00 (one), the better it is.
Table 17.
R-square value.
| R Square | R Square Adjusted | |
|---|---|---|
| performance farming | 0.969 | 0.967 |
In research This , the R² value for performance farming is 0.969, which means that 96.9% of variation in performance farming can explained by the variables independent used in the model. This shows that the model used is very good in predict or explain performance farming , because an R² value that is close to 1 indicates strong relationship.
The Adjusted R-squared value of 0.967 indicates that this model No only Enough Good in explain variation in variable dependent but also consider amount variable independent in the model. Adjusted R² is usually used For evaluate how much both models have more from One variable independent , because take into account model complexity ( number of variables ). Very close values with R² ( i.e. 0.967) indicating that the model does not only explain variation with Good but also not too complex , so that variables its independence own contribution significant in the model.
B. Q-Square
Predictive relevant values are used For see how much Good mark observations made For evaluate compatibility relevance of the model in structural.
Table 18.
Q-Square.
| SSO | SSE | Q² (=1-SSE/SSO) | |
|---|---|---|---|
| factor production | 258 | 258 | 0.02 |
| characteristics farmer | 516 | 305,766 | 0.307 |
| ability farmer | 387 | 251,953 | 0.319 |
| chance farmer | 516 | 516 | 0.042 |
| performance farming | 387 | 387 | 0.032 |
Based on results testing , known that For factor production , a Q² value of 0.02 indicates that the model has ability very low prediction , almost No can predict variation in factor production in a way significant. Characteristics farmer own Q² value of 0.307, which indicates that the model has relevance moderate predictive. Although not very high , model is quite effective in predict characteristics farmers. Likewise with ability farmers , who show Q² value of 0.319, indicating that the model has relevance moderate predictive in predict ability farmers. However , for chance farmers , the Q² value of 0.042 indicates low model capabilities in predict variable this. Lastly , performance farming own Q² value of 0.032, which indicates that the model does not Enough effective in predict performance farming.
C. Goodness of Fit Index ( GoF Index)
The Goodness of Fit ( GoF ) value ranges from between 0 and 1, where is the suggested communality value is 0.50, and the R square value is used For interpretation. GoF values below 0.10 are included in category small , 0.25 for medium category , and 0.36 for category big. Calculation Tenenhaus GoF done as following :
Table 19.
Goodness of Fit Index.
| Saturated Model | Estimated Model | |
|---|---|---|
| SRMR | 0.036 | 0.041 |
| d_ULS | 0.541 | 0.680 |
| d_G | 0.930 | 1,326 |
| Chi-Square | 550,394 | 993.224 |
| NFI | 0.902 | 0.823 |
Based on Goodness of Fit ( GoF ) criteria , results analysis show that the estimated model own a number of indicators that can evaluated For evaluate model fit to data. SRMR (Standardized Root Mean Square Residual) value for the estimated model is 0.041, which is still is at in the threshold that is considered good ( below 0.08). This indicates that the model has relative mean error low. However , the value d_ULS (Unweighted Least Squares Distance) for the estimated model is 0.680, which shows distance between the estimated models with the expected model , and the value This show existence significant difference. This figure show that the model is still need refinement For approach ideal value.
In addition , the value d_G (Geodesic Distance) for the estimated model reached 1,326, more big compared to with saturated model value (0.930), which indicates that difference conformity between estimated models with observed data Enough big , so need repair more continued. Chi-Square value for the estimated model is 993,224, more tall compared to with a saturated model with a value of 550.394, indicating that this model Possible No fully adequate. Finally , the NFI (Normed Fit Index) value for the estimated model is 0.823, which means still below the number 0.90, shows that level model suitability can considered enough , but Still There is room For repair. In overall , although a number of indicator as SRMR and NFI show goodness of model, indicators other like d_ULS , d_G , and Chi-Square indicate the need model refinement to be able to more suitable with the observed data
D. Hypothesis Testing

Gambar 4. Inner Model.
1. Direct Effect
Direct effect analysis is useful For test hypothesis influence direct a variables that influence (exogenous ) influenced variables ( endogenous ).
Table 20.
Direct Effect.
| Original Sample (O) | Sample Mean (M) | Standard Deviation (STDEV) | T Statistics (|O/STDEV|) | P Values | |
|---|---|---|---|---|---|
| factor production - > performance farming | 0.156 | 0.155 | 0.044 | 3,558 | 0.000 |
| characteristics farmer - > performance farming | 0.177 | 0.172 | 0.063 | 2,786 | 0.006 |
| ability farmer - > performance farming | 0.180 | 0.183 | 0.062 | 2.903 | 0.004 |
| chance farmer - > performance farming | 0.143 | 0.132 | 0.069 | 2,080 | 0.038 |
| participation farmer _ -> performance farming | 0.299 | 0.291 | 0.084 | 3,552 | 0.000 |
The results of the direct effect analysis show that all variable independent own influence significant to performance farming. Production factors own coefficient of 0.156 with T- statistic value of 3.558 and a P value of 0.000, indicating influence significant at the level 99% confidence Characteristics farmer own coefficient of 0.177 with T- statistic value of 2.786 and P of 0.006, which is also significant at the level 95% confidence.
Ability farmer show coefficient of 0.180 with a T- statistic of 2.903 and a P value of 0.004, so that its influence significant at the level 95% confidence Chance farmer own coefficient of 0.143 with a T- statistic of 2.080 and a P of 0.038, which is significant at the level 95% confidence. Finally , participation farmer own coefficient the largest , namely 0.299, with a T- statistic of 3.552 and a P of 0.000, indicating influence significant at the level 99% confidence.
2. Indirect Effect
Analysis This used For test hypothesis influence No direct a variables that influence (endogenous ) variable influenced (endogenous) mediated by mediation a intervening variable (mediator variable ).
Table 21.
Indirect Effect.
| Original Sample (O) | Sample Mean (M) | Standard Deviation (STDEV) | T Statistics (|O/STDEV|) | P Values | |
|---|---|---|---|---|---|
| factor production - > participation farmers > performance farming | -0.069 | -0.071 | 0.064 | 1,085 | 0.279 |
| characteristics farmers > participation farmer -> performance farming | -0.004 | -0.015 | 0.070 | 0.059 | 0.953 |
| ability farmers > participation farmers > performance farming | 0.110 | 0.106 | 0.069 | 1,601 | 0.110 |
| chance farmers > participation farmer -> performance farming | -0.139 | -0.142 | 0.053 | 2,642 | 0.009 |
The results of the indirect effect analysis show that No all moderation own influence significant to performance farming. Moderating Effect 1 ( factor production - > participation farmers > performance farming ) has coefficient of -0.069 with T- statistics of 1.085 and the P value of 0.279, so that No significant at the level 95% confidence. Similar things are also seen in Moderating Effect 2 ( characteristics farmers > participation farmer -> performance farming ), which has coefficient of -0.004, T- statistic of 0.059, and the P value of 0.953, so that No significant. While that , Moderating Effect 3 ( ability farmers > participation farmers > performance farming ) shows coefficient of 0.110 with T- statistics of 1.601 and a P value of 0.110, which is close to significance but still No significant at the level 95% confidence. On the other hand , Moderating Effect 4 ( opportunity farmers > participation farmer -> performance farming ) shows significant results , with coefficient of -0.139, T- statistic of 2.642, and the P value of 0.009, so that significant at the level 95% confidence.
3. Total Effect
Total effect is the path coefficient of influence direct summed up with influence No direct.
Table 22.
Total Effect.
| Influence Direct | Indirect Influence | Total Effect | |
|---|---|---|---|
| factor production - > participation farmers > performance farming | 0.156 | -0.069 | 0.087 |
| characteristics farmers > participation farmer -> performance farming | 0.177 | -0.004 | 0.173 |
| ability farmers > participation farmers > performance farming | 0.180 | 0.110 | 180.11 |
| chance farmers > participation farmer -> performance farming | 0.143 | -0.139 | 0.004 |
Based on total effect analysis , which is summation between influence direct and influence No directly , found that influence factor production to performance farming through participation farmer produce total effect of 0.087. This is show that although there is influence direct positive of 0.156, the influence No direct negative by -0.069 reduces the total influence in a way overall.
Influence characteristics farmer to performance farming through participation farmer have a total effect of 0.173. Although influence No directly very small and negative (-0.004), the influence direct of 0.177 dominates , so that produce a fixed total effect positive.
Ability farmer shows a very significant total effect by 180.11, driven by the influence of direct enough large (0.180) and influence No direct positive of 0.110. This is show that ability farmer give impact big to performance farming through participation farmer.
On the contrary , the influence chance farmer to performance farming through participation farmer produces a total effect that is almost neutral , namely of 0.004. This is caused by the presence of influence direct positive of 0.143, which is almost fully balanced by the influence No direct negative of -0.139.
4. Effect Test Mediation
Testing variable mediators can also seen from seen from mark Variants allele fraction /VAF of each intervening/ mediating variable.
Table 23.
Effect Test Mediation.
| Indirect Influence | Total Effect | VAF | |
|---|---|---|---|
| factor production - > participation farmers > performance farming | -0.069 | 0.087 | -0.79 |
| characteristics farmers > participation farmer -> performance farming | -0.004 | 0.173 | -0.023 |
| ability farmers > participation farmers > performance farming | 0.110 | 180.11 | 0.00 |
| chance farmers > participation farmer -> performance farming | -0.139 | 0.004 | -3.47 |
Based on results Variance Accounted For (VAF) calculation , the influence No direct to the total effect show significant variation between path. On the path factor production -> participation farmer -> performance farming , the VAF value of -0.79 indicates that influence No direct own contribution negative to the total effect , although in a way overall the effect still small. Next , the path characteristics farmer -> participation farmer -> performance farming show VAF value of -0.023, which indicates that contribution influence No direct almost No significant and even A little reduce the total effect.
Different with that , on the path ability farmer -> participation farmer -> performance farming , VAF approaching 0.00 indicates that almost all over total influence is dominated by the influence directly , while influence No direct almost No contribute. On the contrary , the path chance farmer -> participation farmer -> performance farming recorded a VAF of -3.47, which means influence No directly greatly reduces the total effect in a way significant , even produce effect big negative to connection overall.
5. Discussion
5.1. Influence of Production Factors on Farm Business Performance
The first hypothesis in this study is the influence of production factors on farm performance. Based on the results of the study, it is known that production factors have a significant influence on farm performance, with a coefficient value of 0.156. The t-count value of 3.558 is greater than the t-table value, and the significance level of 0.000 is below the threshold of 0.05. This shows that the contribution of production factors to farm performance is real and positive. In other words, an increase in production factors can directly improve farm performance significantly.
Production factors play a very important role in determine success and performance business farmer , because covers various aspects that are direct influence the process and results production. Main factors in production business farmer covering land , power labor , capital, and technology. Land, as element basic , determining capacity production Good from aspect wide and also its fertility. The more fertile and vast managed land , increasingly big potential results farmers who can achieved. In addition , the power work , good That power Work family and also laborer farmer , become mover main in process land , planting , maintaining plants , up to harvest the result. Skill and efficiency power work greatly influences productivity and quality results farmer ( Wahyunindyawati , 2022).
Capital is also components that are not lost important in business farmer , because provide support in the form of means production like seed superior , fertilizer , pesticides , and tools agriculture. Sufficient capital allow farmer For increase intensity and quality activity his farmers. On the other hand , the development modern technology brings impact significant to performance business farmers , especially in matter efficiency and productivity. Technology like machine processor land , irrigation automatic , and tools modern harvesters can reduce the time and effort required in the production process , at the same time increase results harvest. Harmonious interaction between factors production This will create performance business optimal farming. With proper management , results production can increase Good from aspect quantity and also quality , cost production become more efficient , and power competition product farmers in the market can reinforced. On the other hand , if one of the or more from factor production This No fulfilled , then business farmer potential experience obstacles that have an impact on the decline results harvest , efficiency work , and profits ( Wahyunindyawati , 2022).
5.2. Influence Characteristics Farmer on Farm Business Performance
The second hypothesis in this study is the influence of farmer characteristics on farm performance. Based on the results of the study, it is known that farmer characteristics have a significant influence on farm performance, with a coefficient value of 0.177. The t-count value of 2.786 is greater than the t-table value, and the significance level of 0.000 is below the threshold of 0.05. This shows that the contribution of farmer characteristics to farm performance is real and positive. In other words, an increase in farmer characteristics can directly improve farm performance significantly.
Characteristics farmer own significant influence to performance business farmer , because covers personal factors that influence method farmer manage source power and take decision in activity farmer. Characteristics This covering level education , experience farming , age , access to information , as well as openness to innovation. Education level , for example , plays a role in ability farmer understand technology new , access market information , and manage business farmer in a way more efficient. Farmers with education more tall tend more fast adapt with changes , such as use modern technology or implementation practice agriculture sustainable ( Kurniati and Vaulina , 2020).
Experience farming also becomes aspect important , because the longer a person farmer manage land , increasingly Lots knowledge practical to have , such as pattern appropriate planting , selection variety plants , and how to face challenge like pest or change weather. Age farmer participate influence performance business farmer , where the farmer young generally more energetic and open to innovation , while more farmers old own experience more Lots but tend not enough flexible to changes. Access to information also determines How farmer get knowledge about market price , technology new , and policies relevant government. Farmers who have access good information can make decision which are more precise and strategic in management his efforts ( Kurniati and Vaulina , 2020).
5.3. Influence Ability Farmer on Farm Business Performance
The third hypothesis in this study is the influence of farmer's ability on the performance of farming businesses. Based on the results of the study, it is known that farmer's ability has a significant influence on the performance of farming businesses, with a coefficient value of 0.180. The t-count value is 2.903 greater than the t-table value, and the significance level of 0.000 is below the threshold of 0.05. This shows that the contribution of farmer ability to farm business performance is real and positive. In other words, an increase in farmer ability can directly improve farm business performance significantly.
Ability farmer is factor crucial that affects performance business farmer , because reflect how far farmers capable manage source power possessed and faced challenge in the production process. Ability farmer covering aspect technical , managerial , and adaptive. In general technical , ability farmer covers knowledge and skills in apply technique good cultivation , such as choose seed superior , using fertilizer in a way efficient , manage irrigation , as well as control pests and diseases plants. Ability technical This determine quality and quantity results harvest , so that direct impact on productivity business farmers ( Indraningsih , 2016).
On the side managerial , ability farmer related with How they planning , organizing , and managing business farmer as a efficient system. Farmers who have ability good managerial can arrange allocation source power , such as power work , capital, and time , respectively more effective. They also tend to more intelligent in take decision related rotation plants , diversification business , or utilise market opportunities. Capabilities This often influenced by the level of education and experience farmers , as well as access to training or guidance technical. Ability adaptive farmers also become determinant main in performance business farmers , especially in face dynamics environment and change external. Ability This covers sensitivity farmer to change climate , fluctuation market price , or policy government , as well as ability For adjust business strategy farmer them. For example , adaptive farmers can with fast switch to variety more plants stand to weather extreme or adopt technology more agriculture efficient For face water scarcity ( Indraningsih , 2016 )..
Farmer with high ability in all three aspect This tend own business more farmers productive , efficient and sustainable. They capable increase results production , optimizing costs , and take advantage of market opportunities for to achieve more benefits big. On the other hand , if ability farmer low , effort farmer can face various obstacles , such as low results harvest , inefficiency management , and inability compete in the market ( Indraningsih , 2016).
5.4. Influence Chance Farmer on Farm Business Performance
The fourth hypothesis in this study is the influence of farmer opportunities on farming business performance. Based on the results of the study, it is known that farmer opportunities have a significant influence on farming business performance, with a coefficient value of 0.143. The t-count value is 2.080 greater than the t-table value, and the significance level of 0.038 is below the threshold of 0.05. This shows that the contribution of farmer opportunities to farm business performance is real and positive. In other words, an increase in farmer opportunities can directly improve farm business performance significantly.
Chance farmer hold role important in determine performance business farmer , because reflect how far farmers own access to source power , information and opportunities For increase results and efficiency business farmer they. Opportunity This can originate from various factor external like access to land , capital, technology , markets, education , training , and policy government that supports. The more Lots available opportunities for farmers , increasingly big possibility they For increase productivity , quality results harvest , and sustainability business farmers. Access to Land , for example , greatly influences capacity production. Farmers who have Enough land productive can develop activity his farm with more optimal. Likewise , access against capital allows farmer For buy means production like fertilizer , seeds superior , or tool modern agriculture that can increase efficiency work. Opportunity For get training or counseling agriculture also becomes factor important , because give farmer knowledge and skills new relevant with the challenges they face face , like change climate or market needs.
Chance For utilise modern technology , such as tool mechanization , system irrigation smart , or technology information , also become determinant main performance business farmer. With technology , farmers can increase efficiency time and energy , at the same time increase results harvest. In addition , access to a bigger market wide , good through network distribution local and digital platforms, opening opportunity for farmer For sell results harvest with higher price competitive. This is give profit significant and strengthening economy Power competition farmers. The role of government and other institutions also contributes big in create chance for farmers. Policy like subsidy fertilizer , aid tool agriculture , or opening access credit business farmer give support directly that can increase performance business farmer. Likewise , empowerment programs group farmer or cooperative give receptacle for farmer For each other share information , improve position bargain , and take advantage of opportunity together.
However , if chance This limited , farmers will face various obstacles , such as difficulty access to capital, technology , or markets, which ultimately hinder performance business farmer. Therefore that , creates a supportive and expanding environment chance for farmer become step strategic For increase productivity , efficiency and well-being farmers , so that business farmer can develop in a way sustainable and empowered competitive ( Yusdja et al., 2004).
5.5. Influence Participation Farmer on Farm Business Performance
The fifth hypothesis in this study is the influence of farmer participation on farming business performance. Based on the results of the study, it is known that farmer participation has a significant influence on farming business performance, with a coefficient value of 0.299. The t-count value is 3.552 greater than the t-table value, and the significance level of 0.000 is below the threshold of 0.05. This shows that the contribution of farmer participation to farm business performance is real and positive. In other words, an increase in farmer participation can directly improve farm business performance significantly.
Participation farmer in manage business farmer play a very important role in determine performance. Participation farmer covers how far farmers involved in the process of taking decision , implementation technology new , planning business , and activity group or community farmer. Level of participation This influence How farmer manage business they , take advantage of source available power , and adapt with changes in the environment business farmer.Wrong One aspect important from participation farmer is involvement in planning and decision making decision. Active farmers participate in designing business strategy farmers , such as choose variety plants that will planted , set pattern planting , and manage use fertilizers and pesticides , tend to own more performance good. Participation in planning This allow farmer For identify risks and opportunities , as well as respond challenge like change weather or fluctuation market price with more good ( Jamrin et al., 2019).
Participation in group or organization farmers also have impact positive on performance business farmer. Through participation in groups farmer , farmer can exchange information , sharing experience , as well as access training and knowledge latest about technology agriculture. Group this can also help farmer in increase Power bid they are in the market, as well as to obtain access to source Power like tool agriculture or credit with more easy. Engagement in group farmer increase the sense of solidarity and collaboration , which in turn can strengthen position farmer in face challenges and improvements efficiency effort.participation farmers also include participation in implementation technology new and practice innovative agriculture. Active farmers try technology new , like system irrigation automatic , usage fertilizer organic , or mechanization tool agriculture , tend to capable increase productivity and efficiency effort. Participation This often influenced by support from institution government , NGO, or company private sector that provides training and technology For farmers. In addition , participation farmer in taking decision related policy agriculture can also influence performance business farmer in a way macro. When farmers involved in formulation policies , such as subsidy agriculture , arrangement prices , and policies export-import , policy the will more reflect needs and conditions actual in the field. This is can create a more environment conducive for development business farmers ( Jamrin et al., 2019).
5.6. Influence of Production Factors on Farm Business Performance Through Participation Farmer
The sixth hypothesis in this study is the influence of production factors on farming performance through farmer participation. Based on the results of the study, it is known that production factors have a negative influence on farming performance mediated by farmer participation, with a coefficient value of -0.069. The t-count value is 1.085 smaller than the t-table value, and the significance level of 0.279 is above the threshold of 0.05.
Factors of production , which include source Power like power work , capital, land , and technology , play a role big in determine performance business farmers. However , it is important For understand that performance business farmer No only influenced by factors production in a way individual , but also how farmer participate in manage and utilize factors said. Participation farmer in manage business farmer influence how much effective factor production the used and optimized , so that impact directly to productivity and success business farmer ( Purba , 2023).
First , participation farmer in planning and decision making decision related use factor production will determine efficiency and effectiveness business farmers. Farmers involved in make decision about allocation land , election variety plants , use fertilizer , and selection tool agriculture tend more capable maximize potential results harvest. With participation active , farmer can adapt use source Power like fertilizers and pesticides with more wise , so that increase results production and reduce waste ( Purba , 2023).
Second , participation farmer in utilization modern technology influences performance business farmer in a way significant. Active farmers follow training and trying technology new like tool mechanization , system irrigation smart , or use application agriculture digital based will capable increase efficiency work , reduce cost production , and increase results harvest. Participation in adoption technology this also allows farmer For overcome challenge like change climate or condition the weather is not determined with more good. In the context of this , farmer No only as user factor production , but also as agent changes that take advantage of innovation For increase its performance ( Purba , 2023).
Next , participation farmer in group or organization farming also has an impact on performance business farmer. Through collaboration in group farmer , farmer can share knowledge , experience , and strategies about How utilise factor production optimally. They can also access source Power additional , such as tool agriculture together , business capital , or more market information wide. Participation in group This strengthen solidarity , increase Power bid farmers in the market, and help they get more access Good to government programs or supporting institutions business farmer ( Purba , 2023).
5.7. Influence Characteristics Farmer on Farm Business Performance Through Participation Farmer
The seventh hypothesis in this study is the influence of farmer characteristics on farming performance through farmer participation. Based on the results of the study, it is known that farmer characteristics have a negative influence on farming performance mediated by farmer participation, with a coefficient value of -0.004. The t-count value of 0.059 is smaller than the t-table value, and the significance level is 0.953 is above the threshold of 0.05.
Characteristics farmer play role important in influence performance business farmers , especially through participation they in management business. Characteristics This covers various aspects , such as age , education , experience , knowledge , and attitude and motivation to activity business farmer. Factors the can influence How farmer participate in business farmer , good in matter taking decision , implementation technology new , and in activity group farmer. Participation optimal farmers can contribute to the improvement productivity and efficiency business farmer , who in the end impact on its performance ( Lailiyah et al., 2023).
Age farmer can influence how far they are willing For participate in adopt technology new and following training. Farmers who are more young tend more open to innovation and more active in adopt modern technology compared with more farmers old. While that , farmers who are more old Possible more depend on experience traditional and tend to more conservative in take decisions. Farmer education also plays a role important ; farmer with level more education tall usually more easy understand information new , following development knowledge agriculture , and implementing knowledge the in practice them. Good education also influences ability farmer in manage business farmer in a way more efficient.
Experience and knowledge farmer about agriculture greatly influences method they participate in business farmer. Farmers who have experience more Lots tend more believe self in manage business them and can make more decisions good. Experience this also helps they overcome possible challenges appear , such as attack pest or change weather , with more solutions effective. While that , farmers who have knowledge more about technique modern agriculture , such as use proper fertilizer , control disease plants , and technology agriculture latest , will more capable increase productivity and quality results harvest ( lailiyah et al., 2023).
Attitude and motivation Farmers also play a role important in participation they. Farmers who have motivation height and attitude positive to business farmer more tend For active participate in activity group , adopt technology new , and look for opportunity For increase skills they through training. Those who have Spirit strong entrepreneur usually more creative in look for solutions and innovations For increase results business farmers. On the other hand , farmers with poor attitude proactive or low motivation Possible No participate in a way maximum in potential activities increase performance. Participation good farmers , who are driven by these characteristics positive like age , education , experience , and attitude , will allow farmer For more involved in taking decision , implementation technology , as well as learning from group farmer. With increasing participation this , management factor production like power work , capital and use land will more optimal, which in turn increase performance business farmers. On the other hand , the characteristics less farmers support participation , such as low level education , experience limited , and weak motivation , can hinder effort improvement performance business farmers ( lailiyah et al., 2023).
5.8. Influence Ability Farmer on Farm Business Performance Through Participation Farmer
The eighth hypothesis in this study is the influence of farmer's ability on the performance of farming businesses through farmer participation. Based on the results of the study, it is known that farmer's ability has a negative influence on the performance of farming businesses mediated by farmer participation, with a coefficient value of -0.110. The t-count value of 1.610 is smaller than the t-table value, and the significance level is 0.110 is above the threshold of 0.05.
Ability farmer own influence important to performance business farmers , especially in context participation they. Ability farmer covers knowledge , skills , and capacity For apply techniques and practices effective farming. When farmers own adequate capabilities , they can participate optimally in management business farmer , who finally can increase productivity and success effort. Participation farmer in context This No only means presence physical , but also includes involvement in planning , decision making decision , implementation technology new , and implementation activities that improve results business farmers ( Koampa et al., 2015).
First , the ability farmer in understand and apply knowledge knowledge agriculture play a role big in performance business farmer. Farmers who have good knowledge about technique cultivation , effective fertilization , and control pests and diseases , will capable manage business his farm with more efficient. Knowledge This increase trust self farmer in adopt method new that can increase results harvest , reduce losses , and maximize use source power. Then skills practical farmers , such as ability operate tool agriculture and modern technology , also influence performance. Skilled farmers in use machine agriculture , system irrigation , or other modern tools can save time and energy , as well as increase productivity business Farmer. Ability This can obtained through formal education , training from party related , or experience work in the field. With adequate skills , farmers can Work more effective and reduce risk errors that can occur harm business farmers ( Koampa et al., 2015).
5.9. Influence Chance Farmer on Farm Business Performance Through Participation Farmer
The ninth hypothesis in this study is the influence of farmer opportunities on farming performance through farmer participation. Based on the results of the study, it is known that farmer opportunities have a significant influence on farming performance mediated by farmer participation, with a coefficient value of -0.139. The t-count value of 2.624 is smaller than the t-table value, and the significance level is 0.009 is above the threshold of 0.05.
Chance farmer in access source power and opportunity play a role important in influence performance business farmer they through participation. Opportunity This covers access to capital, technology , training , market information , and support from government or institution related. The more big the opportunity that is owned farmers , increasingly the potential is also great they For participate in a way active in manage business farmers. High participation this , in turn , can increase productivity and quality results business Farmers. Access to capital is essential for farmer For purchase production inputs , such as seed superior , fertilizer , and tools necessary agriculture. Without sufficient capital , farmers Possible difficult For adopt technology new or increase scale business farmer them. Therefore that , opportunity For get financing or credit business farmer can push farmer For participate in business they with more maximum (Elizabeth, 2019).
Chance For follow training and acquiring education also influences ability farmer in manage business farmer in a way effective. Training provided by the government , institutions self-reliance society , or organization agriculture other can give knowledge new about technique more agriculture productive and efficient. With increasing knowledge , farmers can make more decisions Good related with maintenance plants , management land , and use technology latest. Participation active farmer in follow training This increase quality management business farmer They. Access to market information is also very important For increase performance business farmer. Farmers who have chance For to obtain information related market price , demand products , and trends consumer will more capable plan production they with more good. This is allow farmer For minimize loss consequence price that is not profitable and maximize potential benefits. Participation farmer in community or association farmers , and participation in activity agriculture share information , can also expand network them and open opportunity more marketing good (Elizabeth, 2019).
5.10. Farmer Participation in Improving Good Agricultural Practices (GAP) Standard Operating Procedures (SOP) for Avocado Farming in Baruppu' District, North Toraja Regency
Participation active farmer in group farming is very important For success management farming Avocado. In the group farmer , farmer can involved in various stage activities , start from planning until program evaluation. According to Suryana (2016), activity farmer influence the effectiveness of the extension program , in particular in increase skills technical and management. With existence communication between farmers in groups farming , transfer of knowledge and experience related to GAP and SOP can in progress more effective.
Based on results study known that Good ability farmer , opportunity farmers , factors production , participation farmers , and performance farming put it in is in the category Enough. This matter show that the farmers in the District Baruppu ' has own knowledge and skills base in manage farming Avocado , however Still there is room For improvement. Category enough on occasion farmer describe existence limited access to training , technology , or a wider market area. Production factors that are at the level enough also reflects that availability and use source Power like seeds , fertilizers , and technology cultivation Not yet maximum. Likewise , participation farmer in group farming and activities counseling Still need strengthening to be more effective. Sufficient farm performance show that although farmer capable produce product with quality standard , optimization in implementation of Good Agricultural Practices (GAP) and Standards Operational Procedure (SOP) still required For increase productivity and power compete.
In line with Adreina et al., (2022)' s opinion explains this that business agribusiness Avocado face various challenges that affect effectiveness and sustainability production. Limitations land and capital for development land become obstacle the main thing that reduces potential development business. Management finance farmers who are still weak participate influence ability they in planning and managing budget effort , so that optimization results harvest difficult achieved. Cultivation techniques that are not yet optimal, including quality less seeds well , also inhibits productivity.
The role of Gapoktan which has not been walk in a way maximum , such as Not yet existence regular meetings and work programs , limiting potential cooperation between farmers. In addition , instability supply seeds and planting media can influence results production. External factors like change weather extreme that increases risk pests and diseases also become threat , while competition with seller seed other the more tightening the market. Impact economy from the COVID-19 pandemic also reduce income business , make farmer must face challenge addition in maintain continuity business all of them factor This need attention Serious For ensure development business agribusiness Sustainable avocado (Adreina et al., 2022).
Therefore that , counseling agriculture play role strategic in increase ability farmer implementing GAP and SOP. Factors like competence extension workers , adequate facilities , and support policy the government is very decisive the success of this program. The intensity training also becomes aspect important in support understanding and application technique modern cultivation by farmers. Structured extension can help farmer face challenge productivity and quality results Avocado , so results production more in accordance with market standards. North Toraja has great potential in develop Avocado as commodity featured. However , fluctuations productivity Still become constraint main consequence limitations knowledge and skills farmers. Through training intensive and implementation of GAP and SOP, farmers can increase quality and quantity production them. In addition , the potential of domestic and international markets give opportunity big for farmer For increase income If quality results agriculture fulfil expected standards.
Development farming Avocado in the District Baruppu ' needs synergy between farmers , extension workers , and government. Participation active farmer in group farming and extension agriculture become foundation important For increase productivity and quality results. With consistent implementation of GAP and SOP , potential North Toraja avocado can optimized For fulfil market needs at once increase welfare farmers. Improvement participation This No only impact on aspects economy but also supports development sustainable agriculture in the region.
References
- Abdillah, MA, & Nugroho, SH (2024). Structural Equation Modeling (SEM) Analysis of the Influence of Job Satisfaction, Environment, Work Life Balance, Competence and Employee Commitment on Performance. 17 (1), 23–30.
- Abdullah, M. (2015). Quantitative research methods. Aswaja pressindo.
- Adreina, S. , Yoesdiarti, A. and Arsyad, A. (2022). Strategy for Developing Agribusiness of Avocado Nursery (Persea Americana) in Sukahati Village, Cibinong District, Bogor Regency. AgribiSains Journal ISSN 2550-1151 Volume 8 Number 2. October 2022. [Google Scholar]
- Ananda, LR, & Kristiana, IF (2017). Case Study: Social Maturity in Homeschooling Students. Empathy Journal, 6(1), 257–263.
- Anwari, MZ, Maryati, S., & Budastra, IK (2021). Financial Feasibility Analysis of Avocado Farming Business in Sembalun District, East Lombok Regency. Agroteksos, 31(3), 160. [CrossRef]
- Bappenas. (2018). Avocado (Persea americana Mill / Persea gratissima Gaerth). Agricultural Cultivation, Minister of Research and Technology for the Utilization and Socialization of Science and Technology, 1–18.
- Boitshwarelo, B. Proposing an integrated research framework for connectivism: Utilizing theoretical synergies. International Review of Research in Open and Distance Learning 2011, 12, 161–179. [Google Scholar] [CrossRef]
- BPS, North KT. (2022). North Toraja Regency in Figures 2022 (S. Inek Serahbayu Solon (ed.)). Central Statistics Agency of North Toraja Regency.
- Cahyo, BF (2019). Faculty of Agriculture, Muhammadiyah University of North Sumatra, Medan 2019. Scholar, 1–60.
- Dyanto, R. , Sukmawati, D., Nataliningsih, & Nyanjang Apandi. THE EFFECT OF SOCIO-ECONOMIC FACTORS AND PARTICIPATION OF FARMERS AS MEMBERS OF FARMERS' GROUPS ON THE SUCCESS OF TOMATO FARMING (Solanum lycopersicum L). Agrivet: Journal of Agricultural Sciences and Veterinary Sciences 2022, 10, 25–32. [Google Scholar] [CrossRef]
- Fangohoi, L. , Makabori, Y.Y., & Ataribaba, Y. Farmer Characteristics and Level of Participation in Tonongrejo Village, East Java. Agromix 2022, 13, 104–111. [Google Scholar] [CrossRef]
- Ghozali, I. (2014). Structural Equation Modeling Alternative Method with Partial Least Square (PLS) 4th Edition. Diponegoro University Publishing Agency.
- Fadhla, T. Analysis of Farming Business Management in Increasing Income and Rice Production in Tangan-Tangan District, Southwest Aceh Regency. Visionary & Strategic Journal 2017, 6, 9–23. [Google Scholar]
- Fauzi, A. , & Karsudjono, AJ The Effect of Workload on Turnover Intention Through Work Stress at Bni Life Banjarmasin. Scientific Journal of Business Economics 2021, 3, 368–380. [Google Scholar]
- Fitriandani, Susilowati, D., & Hindarti, S. Analysis of Factors Affecting Avocado Farming Income in Bocek Village, Karangploso District…. Journal of Socio-Economics of Agriculture and Agribusiness 2020, 8, 1–6. Available online: http://www.riset.unisma.ac.id/index.php/SEAGRI/article/view/6176.
- Hanafi, J. , Pudjiastuti, AQ, & Mutiara, F. FACTORS INFLUENCING AVOCADO FARMING PRODUCTION AND INCOME IN MOJOREJO VILLAGE, JUNREJO DISTRICT, BATU CITY. Scientific Periodical of Agribusiness AGRIDEVINA 2022, 11(2), 95–104. [Google Scholar]
- Jannah, N. , Tangkesalu, D., & Alamsyar, A. Factors influencing corn farming production after the earthquake in Pandere Village, Gumbasa District, Sigi Regency. Agrotekbis Journal 2023, 11(1), 181–188. [Google Scholar]
- Juliandi, A. Structural Equation Model Partial Least Square (SEM-PLS) Using SmartPLs. Training Module. 2018. [Google Scholar]
- Kabeakan, NTMB, Habib, A., & Manik, JR Technical Efficiency of Use of Production Factors in Corn Farming in Pintu Angin Village, Laubaleng, Karo Regency, North Sumatra, Indonesia. Agro Bali: Agricultural Journal 2021, 5, 42–49. [CrossRef]
- Kawengian, T. .., Mandey, JR, & Waney, NFL Labor Inflow in Rice Farming in Lowian Village, Maesaan District. Agri-Socioeconomics 2019, 15, 397. [Google Scholar] [CrossRef]
- Lam, T.Y. , & Maguire, D.A. Structural Equation Modeling: Theory and Applications in Forest Management. International Journal of Forestry Research 2012, 1–16. [Google Scholar] [CrossRef]
- Latumeten, R. , Lesnussa, YA, & Rumlawang, FY. The Use of Structural Equation Modeling (Sem) to Analyze Factors Affecting Customer Loyalty (Case Study: PT Bank Negara Indonesia (BNI) KCU Ambon). Sainmatika: Scientific Journal of Mathematics and Natural Sciences 2018, 15, 76. [Google Scholar] [CrossRef]
- Lenaini, I. Purposive sampling and snowball sampling techniques. Journal of History Education Studies, Research & Retrieval 2021, 6, 33–39. Available online: http://journal.ummat.ac.id/index.php/historis/article/download/4075/pdf.
- Maramba, U. The Influences Of Characteristic On Corn Farmers Revenue In East Sumba Regency (Case In Kiritana Village, Kambera Subdistrict, East Sumba Regency). Journal of Agricultural Economics and Agribusiness (JEPA) 2018, 2, 94–101. [Google Scholar]
- Merita, AI. Analysis of Corn Farming Income in Tohupo Village, Bongomeme District, Gorontalo Regency. Journal of Socio Economics Agricultural 2020, 15, 10–14. [CrossRef]
- Nashwari, IP, Rustiadi, E., Siregar, H., & Juanda, B. Spatial Analysis of Farmer Institutions and Poverty of Food Crop Farmers Using Geographically Weighted Regression in Jambi Province. Globe Scientific Magazine 2016, 18, 83. [CrossRef]
- Nasrullah, Novita, AD, & Yusmanizar, Y. Improving the Processing Skills of Corn Snacks “Pulut” of Corn Farmer Mothers in Manongkoki Village. Warta LPM 2020, 23, 141–150. [CrossRef]
- Novianda, FK, Saidah, Z., Hapsari, H., & Wulandari, E. The Influence of the Role of Agricultural Extension Workers on the Level of Avocado Farming Production. Journal of Extension 2021, 17, 113–125. [CrossRef]
- Nurcahya, ARI, Noor, TI, & Novianty, ANE (2022). ANALYSIS OF CORN FARMING INCOME ON DRY LAND (Case Study on the Mekar Arum Women Farmers Group, Tambaksari Village, Tambaksari District, Ciamis Regency). AGROINFO GALUH Student Scientific Journal , 9 (1), 246–256.
- Food, DJT (2023). Performance Report of the Directorate General of Food Crops. In Performance Report of the Directorate General of Oil and Gas (Vol. 53, Issue 9).
- Parjaman, T., & Akhmad, D. (2019). As a “Middle Way” for the Quantitative-Qualitative Dichotomy. Moderat Journal , 5 (4), 530–548. https://jurnal.unigal.ac.id/index.php/moderat.
- Paulus, AL, Wangke, WM, & Moniaga, VRB (2015). Contribution of Long Bean Farming to Farmer Household Income in Warembungan Village, Pineleng District. Agri-Socioeconomics , 11 (3), 53. [CrossRef]
- Pradnyawati, IGAB, & Cipta, W. (2021). The Effect of Land Area, Capital and Production Amount on Vegetable Farmers' Income in Baturiti District. Ekuitas: Journal of Economic Education , 9 (1), 93. [CrossRef]
- Putri, RW, Qurniati, R., & Hilmanto, R. (2015). Characteristics of Farmers in Community Forest Development in the Village of Buana Sakti, Batanghari District, East Lampung Regency. Sylva Lestari Journal , 3 (2), 89–98.
- Rahayuningsih, T., Muharijanto, RE, Nooryanto, FH, Achwan, M., Jadid, A., & Romdhoni, ANR (2023). Legal Assistance Regarding Subsidized Fertilizers and Agricultural Technology for Corn Farmers. JIIP - Scientific Journal of Educational Sciences , 6 (1), 230–235. [CrossRef]
- Rahmat, MP, Nurlaila, H., & Puti, A. (2021). Analysis of Agricultural Sector Development Strategy in Efforts to Increase Gross Regional Domestic Product in East Aceh Regency. Jurnal Samudra Ekonomika , 5 (2), 178–186. [CrossRef]
- Raksun, A., Japa, L., & Mertha, I.G. (2019). APPLICATION OF ORGANIC AND NPK FERTILIZERS TO IMPROVE MELON (Cucumis melo L.) VEGETATIVE GROWTH. Journal of Tropical Biology , 19 (1), 19–24. [CrossRef]
- Rifai, M., Made, U., & Rois, R. (2020). GROWTH AND YIELD OF CORN (Zea mays L.) ON VARIOUS CONCENTRATIONS OF POC AND COMBINATION OF INORGANIC FERTILIZER DOSES. Agrotekbis: E-Journal of Agricultural Sciences , 8 (5), 1070–1078.
- Sari, M., Mastuti, R., & Basriwijaya, KMZ (2022). ANALYSIS OF FACTORS AFFECTING CORN FARMING INCOME (Zea mays L) IN DARUL HASANAH DISTRICT, SOUTHEAST ACEH REGENCY. Journal of Research Innovation , 3 (5), 6055–6063. [CrossRef]
- Statistics, BP, & Bantaeng, K. (2023). Bantaeng Regency in Figures 2023.
- Sukratman, IM (2022). THE ROLE OF AGRICULTURAL EXTENSION WORKERS IN THE UPSUS PROGRAM IN INCREASING CORN PRODUCTION IN KONAWE DISTRICT. Sibatik Journal , 1 (4), 441–452.
- Sulistyaningsih, CR (2019). STUDY OF FACTORS INFLUENCING CORN PRODUCTION IN WONOGIRI DISTRICT. Agrisaintifika Journal of Agricultural Sciences , 3 (1), 52–58.
- Tangkowit, CD, Manginsela, EP, & Lumingkewas, JR (2023). Factors Affecting Corn Production in Poigar District, Bolaang Mongondow Regency. Agri-Socioeconomics , 19 (1), 17–22. [CrossRef]
- Trenggonowati, DL, & Kulsum, K. (2018). Analysis of Optimization Factors for Early Childhood Golden Age Case Study in Cilegon City. Journal Industrial Servicess , 4 (1), 48–56. [CrossRef]
- Wahyuningsih, A., Setiawan, BM, & Kristanto, BA (2018). ECONOMIC EFFICIENCY OF PRODUCTION FACTORS USE, INCOME OF HYBRID CORN AND LOCAL CORN FARMING IN KEMUSU DISTRICT, BOYOLALI REGENCY (Economic Efficiency Of Production Factors Allocation, Income Of Hybrid Maize Farming and Local Maize in Kemu. Agrisocionomics , 2 (1), 1–13. http://ejournal2.undip.ac.id/index.php/agrisocionomics.
- Widiyasari, R., & Mutiarani, M. (2017). The Use of Structural Equation Modeling Method for Analysis of Factors Affecting Student Learning Motivation at FIP Umj. FIBONACCI: Journal of Mathematics and Mathematics Education , 3 (2), 147. [CrossRef]
- Wilinny, W., Halim, C., Sutarno, S., Nugroho, N., & Hutabarat, FAM (2019). Communication Analysis at PT. Asuransi Buana Independent Medan. Simantek Scientific Journal , 3 (1), 1–6.
- Yuniati, S., Susilo, D., & Albayumi, F. (2017). INSTITUTIONAL STRENGTHENING IN AN EFFORT TO IMPROVE THE WELFARE OF SUGAR CANE FARMERS. Proceedings of the National Seminar and Call for Paper on Economics and Business , 498–505.
Table 3.
Identity Respondents based on Age.
| Age Respondents ( Year ) | Amount Respondents (people) | Percentage (%) |
|---|---|---|
| 17 - 25 | 20 | 16 |
| 26 - 35 | 42 | 36 |
| 36 - 45 | 28 | 26 |
| 46 - 55 | 30 | 22 |
| Total | 120 | 100% |
Source : Primary Data (2024).
Table 4.
Identity Respondents by Gender.
| Gender | Amount Respondents (people) | Percentage (%) |
|---|---|---|
| Man | 81 | 65 |
| Woman | 39 | 35 |
| Total | 120 | 100% |
Source : Primary Data (2024).
Table 5.
Identity Respondents based on Number of Workers.
| Number of Workers | Amount Respondents (people) | Percentage (%) |
|---|---|---|
| <2 | 85 | 75 |
| 2 - 4 | 33 | 24 |
| >4 | 2 | 1 |
| Total | 120 | 100% |
Source : Primary Data (2024).
Table 6.
Statistical Values Variables Characteristics Farmer.
| No. | Indicator | N | Max | Mean | TCR | Category |
|---|---|---|---|---|---|---|
| 1 | Age | 120 | 4 | 2.78 | 69.58 | Enough |
| 2 | Education | 120 | 4 | 2.79 | 69.79 | Enough |
| 3 | Experience | 120 | 4 | 2.83 | 70.83 | Enough |
| 4 | Completeness | 120 | 4 | 2.76 | 68.96 | Enough |
| Average | 2.79 | 69.79 | Enough | |||
Source : Research Result Data (2024).
Table 7.
Statistical Values Variables Ability Farmer.
| No. | Indicator | N | Max | Mean | TCR | Category |
|---|---|---|---|---|---|---|
| 1 | Technical | 120 | 4 | 2.74 | 68.54 | Enough |
| 2 | Social | 120 | 4 | 2.74 | 68.54 | Enough |
| 3 | Conceptual | 120 | 4 | 2.77 | 69.17 | Enough |
| 4 | Managerial | 120 | 4 | 2.79 | 69.79 | Enough |
| Average | 2.76 | 69.01 | Enough | |||
Source : Research Result Data (2024).
Table 8.
Statistical Values Variables Chance Farmer.
| No. | Indicator | N | Max | Mean | TCR | Category |
|---|---|---|---|---|---|---|
| 1 | Market Support | 120 | 4 | 2.82 | 70.42 | Enough |
| 2 | Support Government | 120 | 4 | 2.79 | 69.79 | Enough |
| 3 | Private | 120 | 4 | 2.81 | 70.21 | Enough |
| 4 | Information | 120 | 4 | 2.88 | 71.88 | Enough |
| Average | 2.82 | 70.57 | Enough | |||
Source : Research Result Data (2024).
Table 9.
Statistical Values Production Factor Variables.
| No. | Indicator | N | Max | Mean | TCR | Category |
|---|---|---|---|---|---|---|
| 1 | Land | 120 | 4 | 2.77 | 69.17 | Enough |
| 2 | Labor | 120 | 4 | 2.71 | 67.71 | Enough |
| 3 | Fertilizer | 120 | 4 | 2.71 | 67.71 | Enough |
| 4 | Pesticide | 120 | 4 | 2.70 | 67.50 | Enough |
| 5 | Capital | 120 | 4 | 2.73 | 68.33 | Enough |
| Average | 2.72 | 68.08 | Enough | |||
Source : Research Result Data (2024).
Table 10.
Statistical Values Variables Participation Farmer.
| No. | Indicator | N | Max | Mean | TCR | Category |
|---|---|---|---|---|---|---|
| 1 | Planning | 120 | 5 | 3.48 | 69.50 | Enough |
| 2 | Coordination | 120 | 5 | 3.43 | 68.67 | Enough |
| 3 | Implementation | 120 | 5 | 3.48 | 69.50 | Enough |
| 4 | Monitoring | 120 | 5 | 3.50 | 70.00 | Enough |
| 5 | Evaluation | 120 | 5 | 3.47 | 69.33 | Enough |
| Average | 3.47 | 69.40 | Enough | |||
Source : Research Result Data (2024).
Table 11.
Statistical Values Farm Business Performance Variables Avocado.
| No. | Indicator | N | Max | Mean | TCR | Category |
|---|---|---|---|---|---|---|
| 1 | Quality Fruit | 120 | 5 | 3.48 | 69.50 | Enough |
| 2 | Total Production | 120 | 5 | 3.46 | 69.17 | Enough |
| 3 | Productivity | 120 | 5 | 3.43 | 68.67 | Enough |
| 4 | R/C Ratio | 120 | 5 | 3.47 | 69.33 | Enough |
| 5 | B/C Ratio | 120 | 5 | 3.45 | 69.00 | Enough |
| 6 | Gross Margin | 120 | 5 | 3.48 | 69.50 | Enough |
| Average | 3.46 | 69.19 | Enough | |||
Source : Research Result Data (2024).
Table 12.
Outer Loadings.
| Variables | Indicator | Loadings factors | Criteria | Test results |
|---|---|---|---|---|
| Production factors | X4.1 | 0.842 | > 0.7 | VALID |
| X4.2 | 0.908 | > 0.7 | VALID | |
| X4.3 | 0.904 | > 0.7 | VALID | |
| X4.4 | 0.891 | > 0.7 | VALID | |
| X4.5 | 0.924 | > 0.7 | VALID | |
| Characteristics farmer | X1.1 | 0.916 | > 0.7 | VALID |
| X1.2 | 0.930 | > 0.7 | VALID | |
| X1.3 | 0.920 | > 0.7 | VALID | |
| X1.4 | 0.909 | > 0.7 | VALID | |
| Ability farmer | X2.1 | 0.911 | > 0.7 | VALID |
| X2.2 | 0.911 | > 0.7 | VALID | |
| X2.3 | 0.893 | > 0.7 | VALID | |
| X2.4 | 0.910 | > 0.7 | VALID | |
| Chance farmer | X3.1 | 0.930 | > 0.7 | VALID |
| X3.2 | 0.909 | > 0.7 | VALID | |
| X3.3 | 0.916 | > 0.7 | VALID | |
| X3.4 | 0.920 | > 0.7 | VALID | |
| Business performance farmer | Y2.1 | 0.957 | > 0.7 | VALID |
| Y2.2 | 0.958 | > 0.7 | VALID | |
| Y2.3 | 0.954 | > 0.7 | VALID | |
| Y2.4 | 0.954 | > 0.7 | VALID | |
| Y2.5 | 0.945 | > 0.7 | VALID | |
| Y2.6 | 0.951 | > 0.7 | VALID | |
| Participation farmer | Y1.1 | 0.955 | > 0.7 | VALID |
| Y1.2 | 0.958 | > 0.7 | VALID | |
| Y1.3 | 0.950 | > 0.7 | VALID | |
| Y1.4 | 0.956 | > 0.7 | VALID | |
| Y1.5 | 0.956 | > 0.7 | VALID |
Disclaimer/Publisher’s Note: The statements, opinions and data contained in all publications are solely those of the individual author(s) and contributor(s) and not of MDPI and/or the editor(s). MDPI and/or the editor(s) disclaim responsibility for any injury to people or property resulting from any ideas, methods, instructions or products referred to in the content. |
© 2025 by the authors. Licensee MDPI, Basel, Switzerland. This article is an open access article distributed under the terms and conditions of the Creative Commons Attribution (CC BY) license (http://creativecommons.org/licenses/by/4.0/).
Copyright: This open access article is published under a Creative Commons CC BY 4.0 license, which permit the free download, distribution, and reuse, provided that the author and preprint are cited in any reuse.


