Submitted:
01 May 2025
Posted:
05 May 2025
You are already at the latest version
Abstract
PPV, an early air-stable conjugated polymer, is widely used in organic electronics and bioimaging due to its simple structure and UV-Vis spectral properties. This chapter explores the design, synthesis, and potential applications of near-infrared two-photon fluorescent dyes derived from PPV. Small molecule dyes (HO-PPV-X) with improved water solubility and strong push-pull structures were created by modifying PPV. Three synthesized dyes, HO-PPV-3CN, HO-PPV-MePy, and HO-PPV-EtBT, showed good solubility and near-infrared fluorescence. Live-cell imaging revealed different cellular localization: HO-PPV-3CN stained cytoplasm, HO-PPV-MePy stained the whole cell, and HO-PPV-EtBT targeted the nucleus. These findings suggest potential for developing fluorescent probes and diagnostic reagents with specific subcellular localization functions, especially HO-PPV-EtBT for nuclear staining.
Keywords:
two-photon imaging
; subcellular localization
; nucleus-localized fluorescent probe
1. Introduction
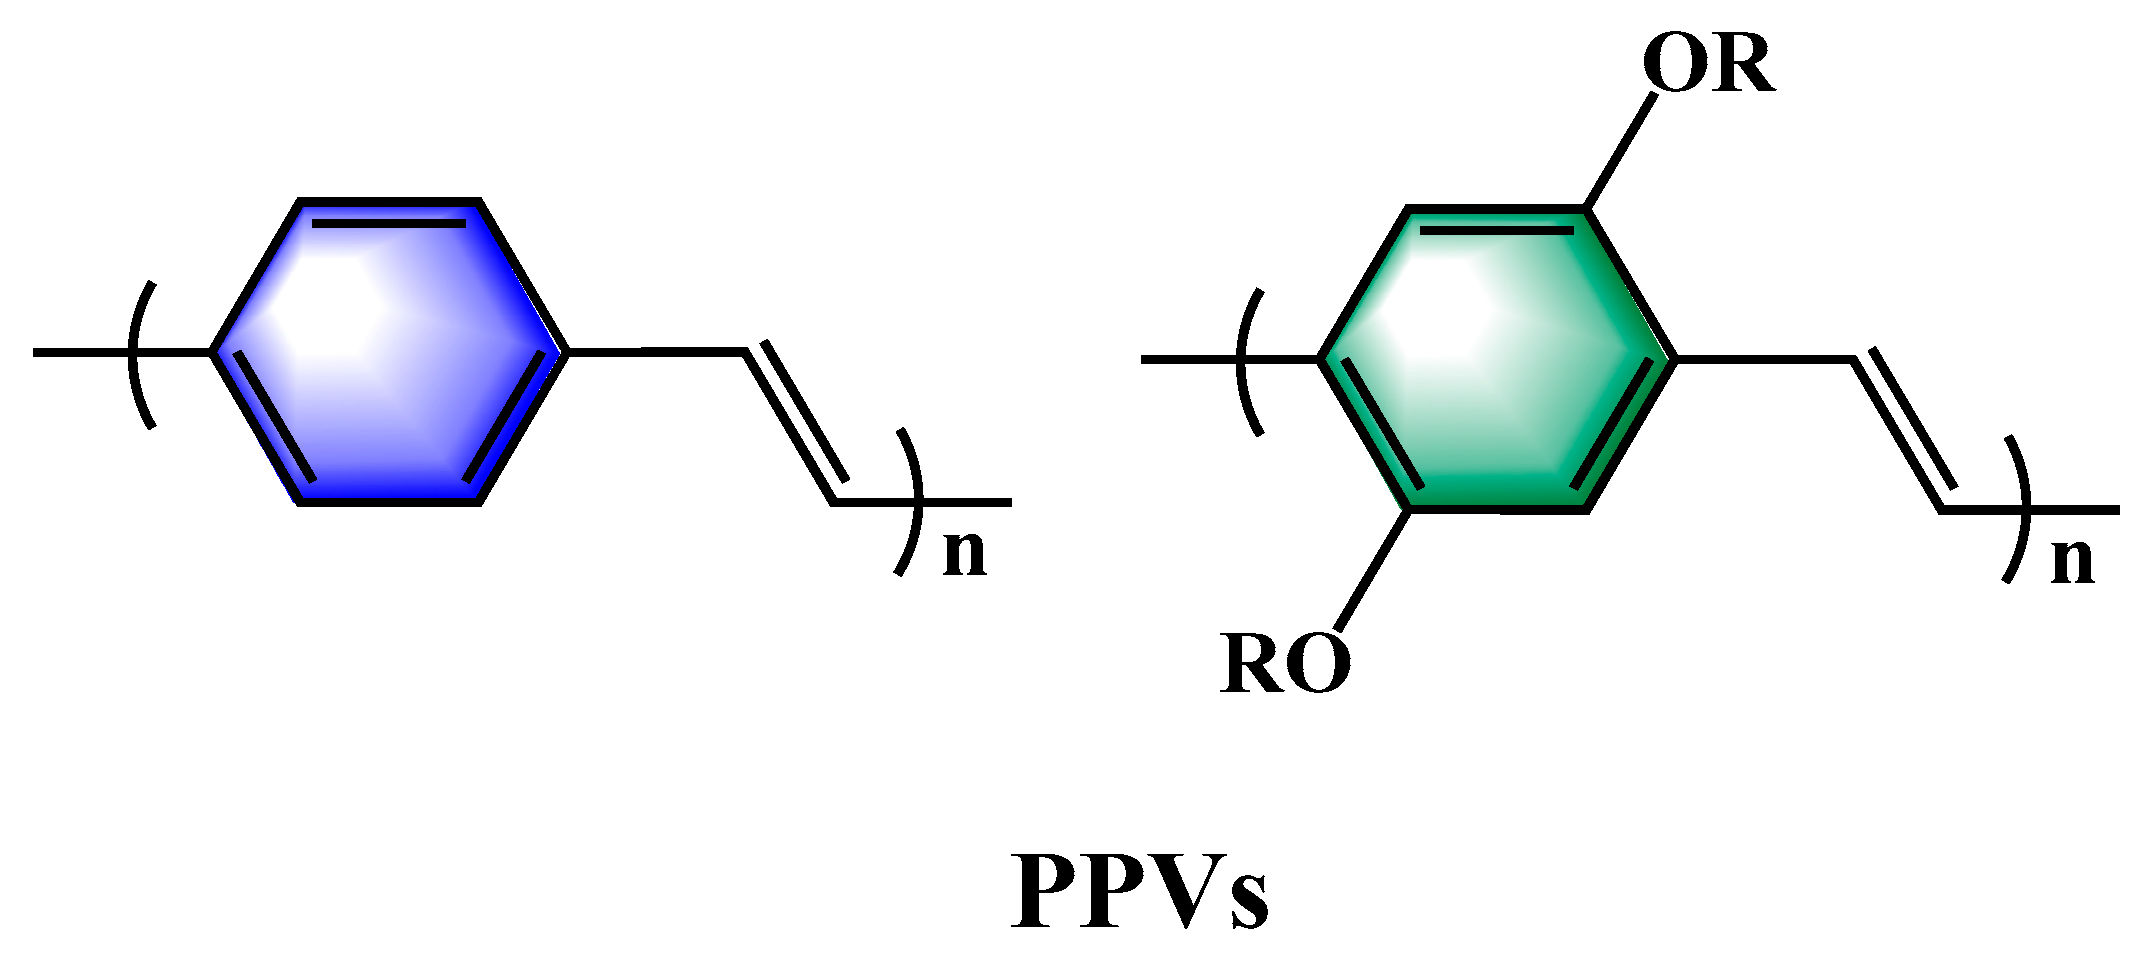
Although PPVs have many advantages as important polymers, their simple and efficient synthesis methods have always been a major challenge for researchers [1], and as a rigid rod polymer, unsubstituted PPVs are insoluble in water and most solvents, so the development of soluble PPVs has always been the goal of researchers [2]. Although PPV is water-insoluble, its precursors can be chemically modified to improve their water solubility [1].
Figure 1.
Chemical structures of PPV and its derivatives.
In terms of molecular chemical structure, PPVs themselves are excellent two-photon fluorescent materials, and although the research work on the development and design of fluorescent probes is scarce, there are some developments. It has been widely used in the design of metal ions, enzymes, ROS, Aβ-amyloid, and DNA fluorescent probes, as well as in photodynamic therapy (PDT) [3,4,5,6,7,8,9]. Despite these developments, there is still a huge scope for the development of PPV-derived fluorescent dyes and probes with better performance, especially in terms of improving the water solubility of molecules and redshifting the fluorescence emission wavelength [10,11,12,13].
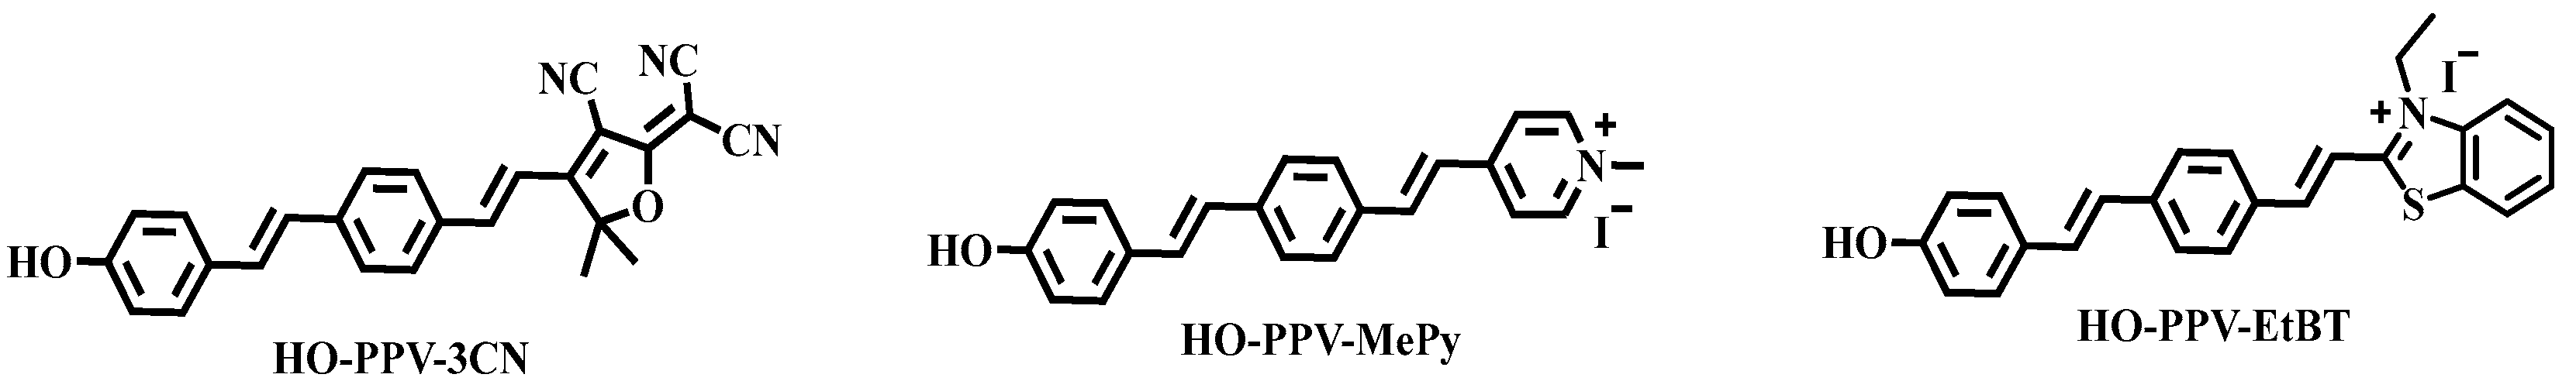
In this chapter, near infrared two-photon fluorescent dyes are derived through structural modification with PPV as the core backbone. A series of small molecule fluorescent dyes with improved water solubility with strong push-pull structure (named HO-PPV-X, Figure 2.) were designed by inserting electron-donating hydroxyl groups (-OH) and various electron-withdrawing groups (neutral and cationic fragments) at both ends of the PPV core fragment. The final three dyes, HO-PPV-3CN, HO-PPV-MePy and HO-PPV-EtBT, were successfully applied to two-photon imaging in live cells, and the imaging results showed that HO-PPV-3CN was mainly distributed in the cytoplasm, HO-PPV-MePy was distributed in the whole cell, and HO-PPV-EtBT could be concentrated in the nucleus. The different cellular localization of the three fluorochromes gives them the potential for the development of fluorescent probes and diagnostic reagents with different suborganelle localization functions. Among them, HO-PPV-EtBT itself can serve as a new near-infrared two-photon fluorescence probe to locate atomic nuclei [14].
2. Materials and Methods
2.1. Materials
The probes HO-PPV-3CN, HO-PPV-MePy, and HO-PPV-EtBT are all custom-synthesized and commercially available.
The reagents used in organic synthesis include: 4-Hydroxybenzaldehyde(CAS 123-08-0), TBSCl(CAS 18162-48-6), Imidazole(CAS 288-32-4),4-Cyanobenzyl bromide(CAS 17201-43-3), Lithium diisopropylamide,LDA,CAS 4111-54-0), DIBALH(CAS 1191-15-7), TBAF(CAS 429-41-4),3-Hydroxy-3-methyl-2-butanone(CAS 115-22-0), Malononitrile(CAS 109-77-3),Ammonium acetate(CAS 631-61-8), Sodium ethoxide(CAS 141-52-6), Potassium tert-butoxide(CAS 865-47-4), 2-Methylbenzothiazole(CAS 120-75-2), Iodoethane(CAS 75-03-6), all reagents were of analytical grade.
Roswell Park Memorial Institute (RPMI) -1640 culture medium was purchased from Sigma Aldrich (St. Louis, MO, USA). 3-4 (4,5-dimethyl-2-thiazole) -2,5-diphenyltetrazolium bromide (MTT) was purchased from Beijing Boaotoda Technology Co., Ltd. Pancreatic enzyme cell digestion solution (0.25% trypsin, containing phenol red), Hoechst 33342, Mito Tracker Green, Lyso Tracker Green, and ER Tracker Green were purchased from Shanghai Biyuntian Biotechnology Co., Ltd. Penicillin and streptomycin were purchased from Beijing Soleibao Technology Co., Ltd. Fetal bovine serum was purchased from Lanzhou Rongye Biotechnology Co., Ltd.
2.2. Instrumentation
- UV spectrophotometer: TU-1901,Persee
- Fluorescence spectrophotometer: LS55, PerkinElmer, USA
- PH meter: PB-10, Sartorius, Germany
- Microplate Reader: Infinite M200,TECAN,Switzerland
- Cell culture incubator: Thermo Scientific
- Laser confocal microscope: STELLARIS 5, CLSM, Leica Co., Ltd. Germany
2.3. Design and Synthesis of PPV Fluorescent Dyes
PPV and its derivatives have excellent photoluminescence efficiency and can achieve high quantum yield luminescence through conjugated π - electron structures. This characteristic enables it to generate strong and stable fluorescence signals during intracellular imaging, significantly improving imaging sensitivity and signal-to-noise ratio. For example, the derivative of PPV, MEH-PPV (poly [2-methoxy-5- (2-ethylhexoxy) -1,4-phenylene])[14], exhibits excellent fluorescence emission performance in the visible light range and is suitable for live cell imaging. PPV materials can be chemically modified (such as introducing hydrophilic groups or biomolecules) to improve their water solubility and biocompatibility, reducing their toxicity to cells.
The chemical structure of PPV can be customized through modification to achieve precise control of its fluorescence properties. For example, by adjusting the emission wavelength and introducing different substituents (such as alkoxy and halogen atoms), the fluorescence emission wavelength of PPV can be tuned from the visible light region (about 500 nm) to the near-infrared region (about 700-900 nm), reducing self fluorescence interference in biological tissues and improving imaging depth.
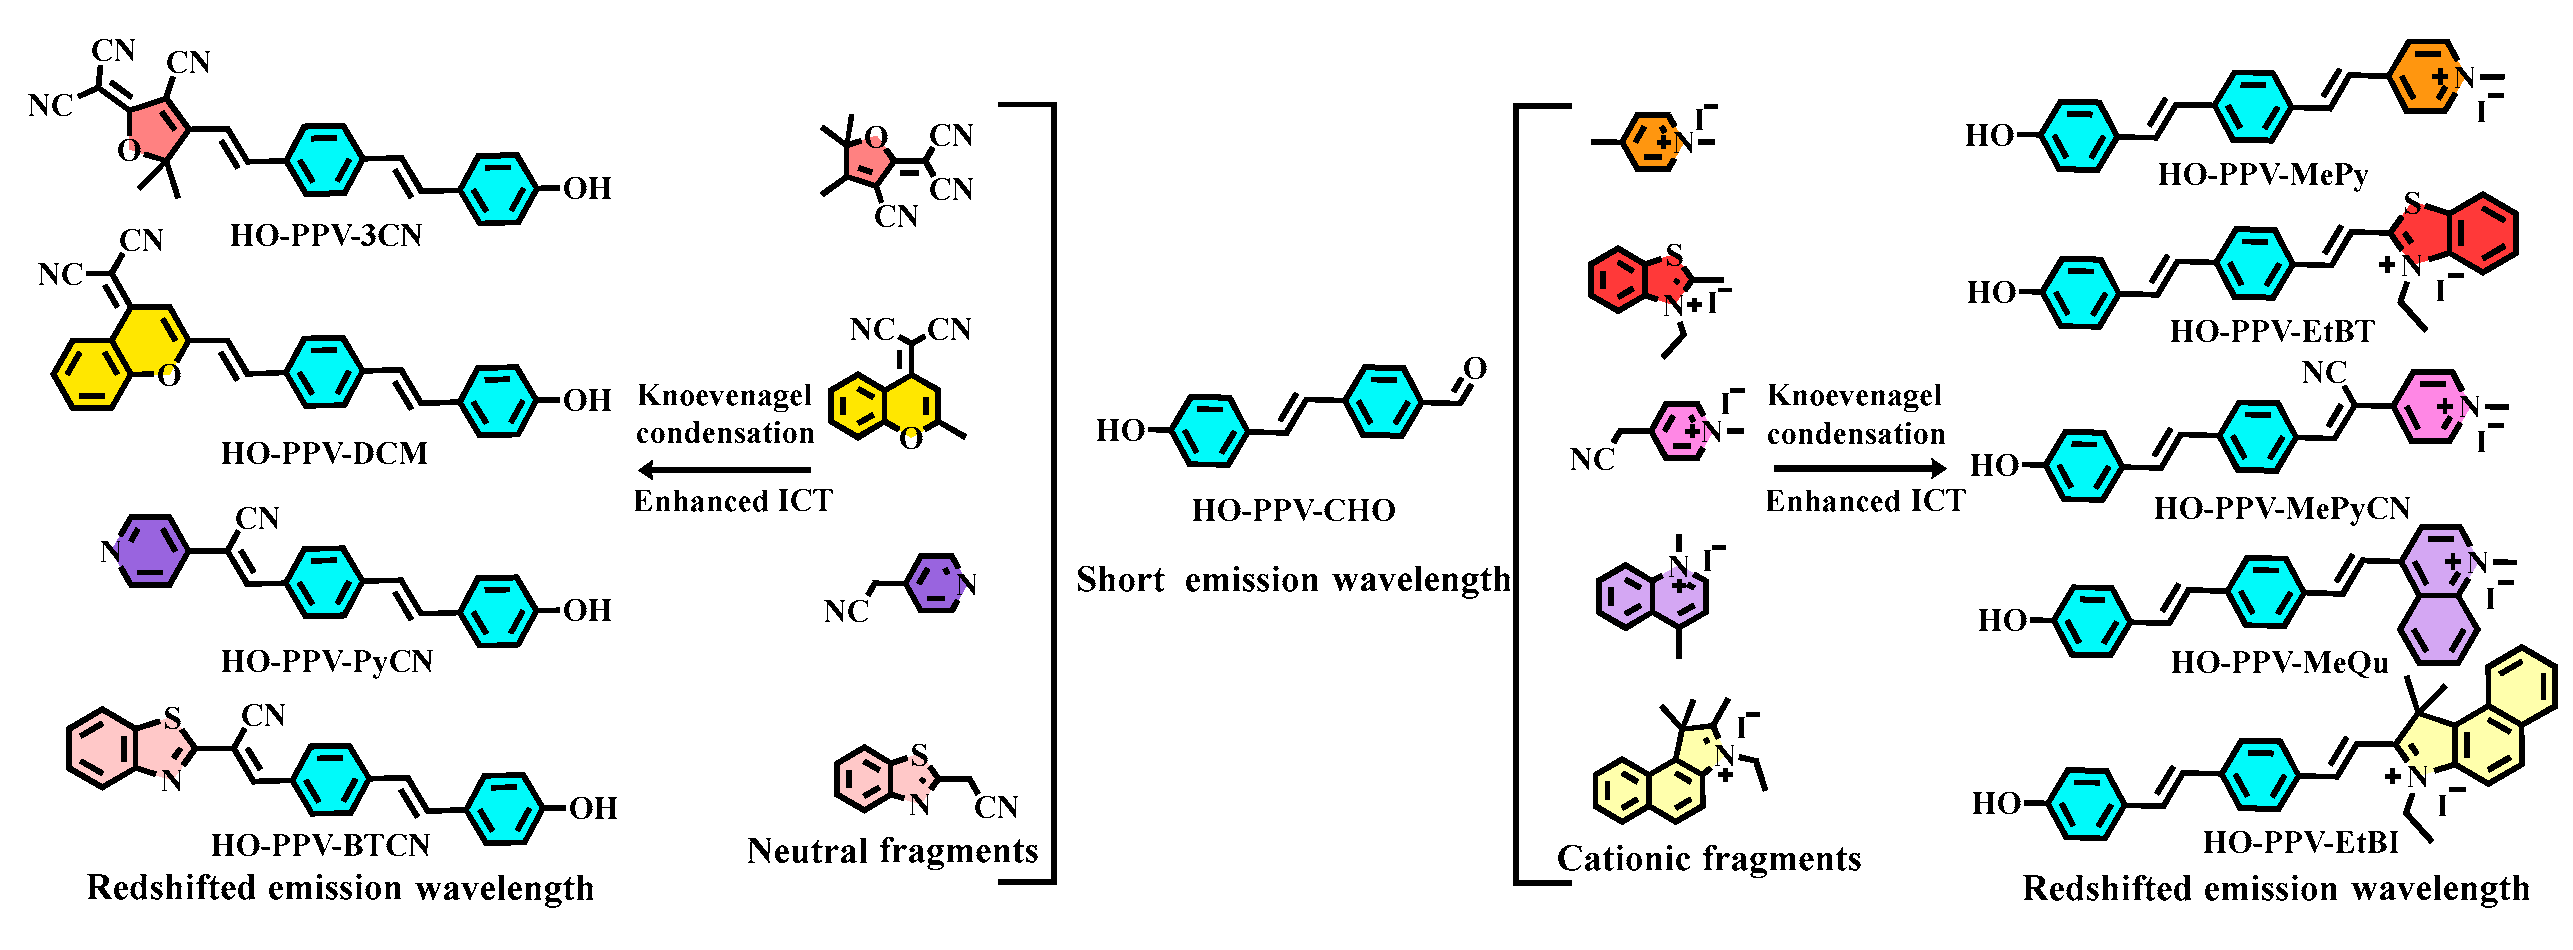
This article focuses on the design, synthesis, and potential application exploration of near-infrared two-photon fluorescent dyes with a new poly (p-phenylene vinylene) (PPV) skeleton structure. Firstly, the core fragment HO-PPV-CHO of PPV structure was constructed using the method described in reference [15]. Then, based on this fragment, the classical Knoevenagel condensation reaction was attempted to introduce various neutral and cationic electron withdrawing groups, in order to increase the push-pull effect of the entire conjugated fluorescent dye molecule, enhance the ICT effect, and shift the fluorescence emission wavelength to the red. Through continuous synthetic exploration, three fluorescent probes, HO-PPV-3CN, HO-PPV MePy, and HO-PPV EtBT, were synthesized(Scheme 1.).
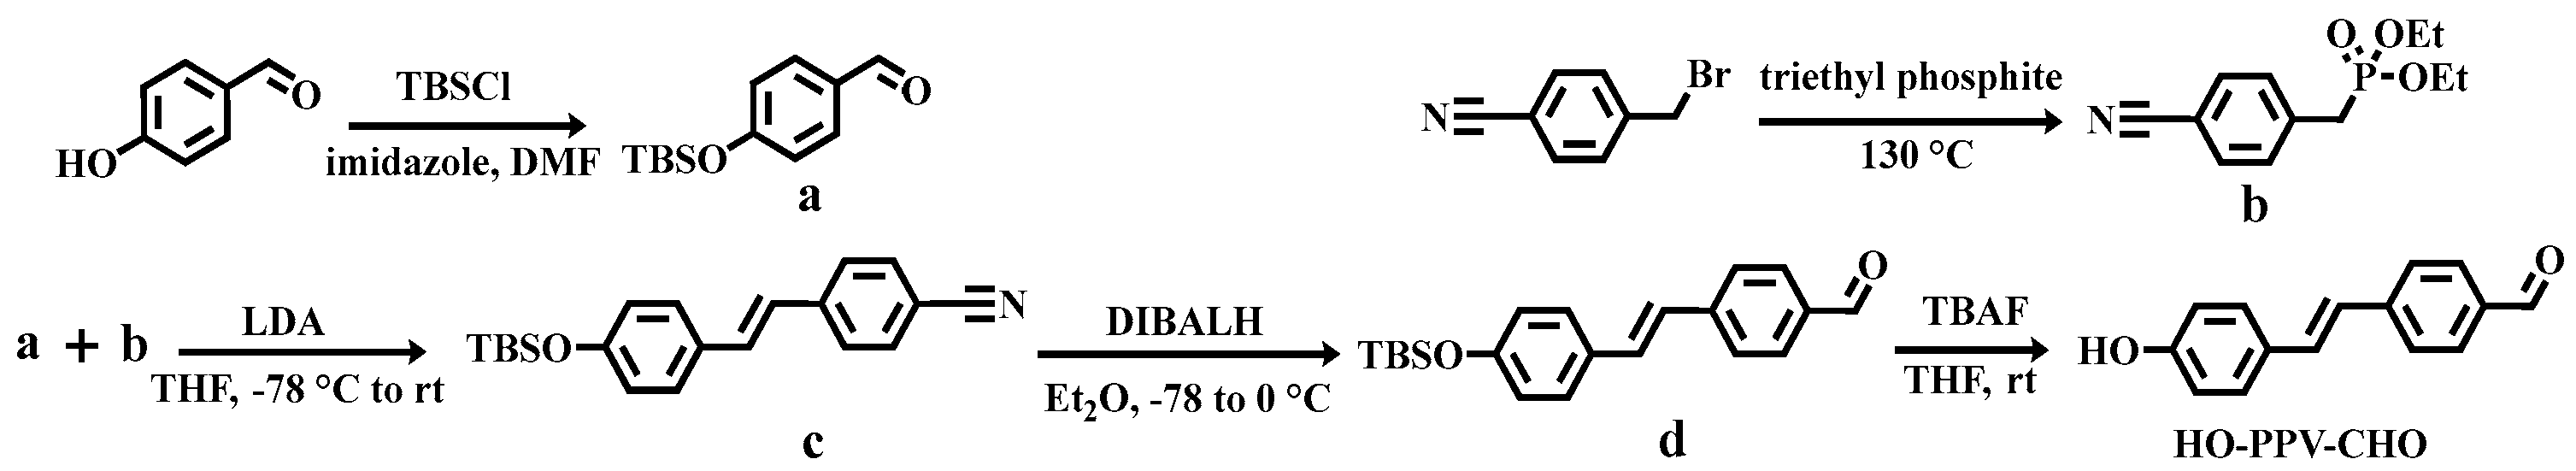
Firstly, the intermediate HO-PPV-CHO was synthesized using the method reported in reference [14]. In short, p-hydroxybenzaldehyde (compound a) protected by tert butyldimethylsilyl (TBS) and diethyl (4-cyanobenzyl) phosphate (compound b) were reacted with strong base lithium diisopropylamide (LDA) at low temperatures (-78 ℃ to room temperature) to construct an olefin double bond through the classical Wittig Horner Emmons reaction, resulting in compound c. Then, using diisobutylaluminum hydride (DIBALH) at low temperatures (-78 ℃ to 0 ℃), the cyanide group in compound c was reduced to an aldehyde group, resulting in compound d. Finally, TBS protection was removed using tetrabutylammonium fluoride (TBAF) to obtain the intermediate HO-PPV-CHO (Scheme 2.).
Next, we will explore the synthesis methods and results of the PPV series fluorescent dyes (HO-PPV-3CN, HO-PPV-MePy, HO-PPV-EtBT) derived from HO-PPV-CHO.
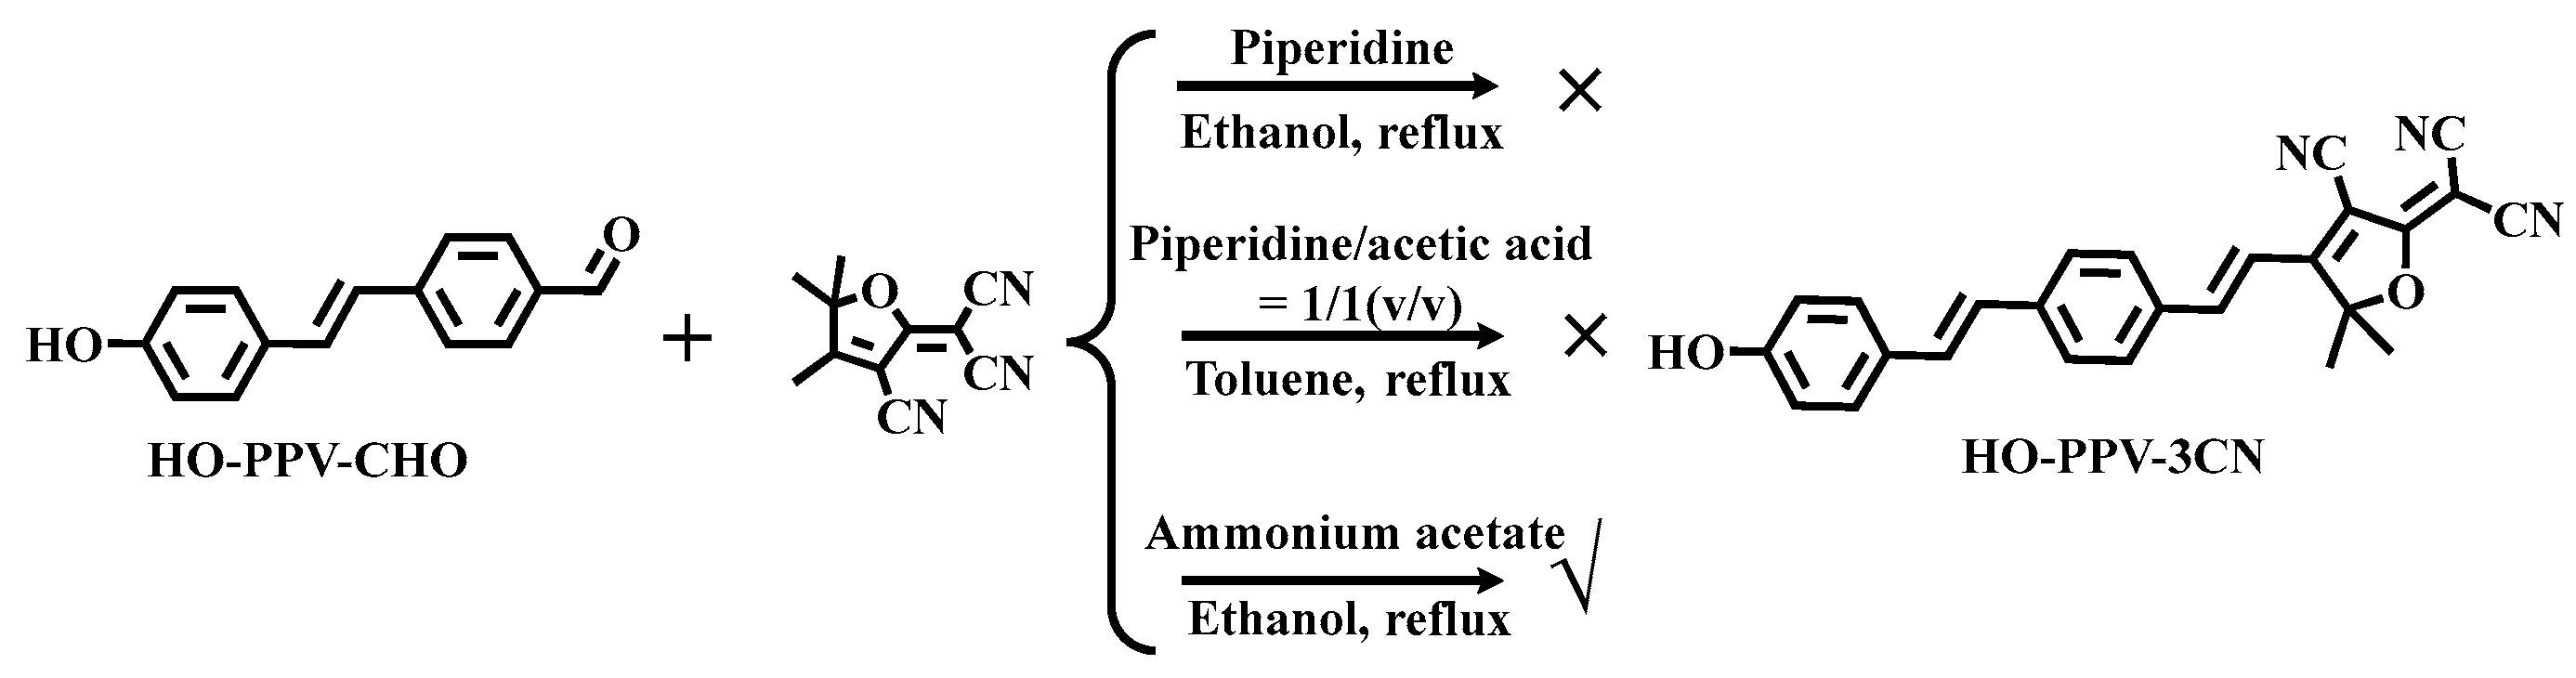
The synthesis of fluorescent dye HO-PPV-3CN: Firstly, we attempted to use pyridine catalysis and ethanol as the solvent for direct reflux. TLC monitoring showed that the reaction could hardly occur; Further attempts were made to use the salt produced in situ by piperidine and acetic acid for catalysis, with toluene as the solvent for reflux, but the target product still could not be obtained; Finally, using ammonium acetate as a catalyst and ethanol as a solvent, the reaction is carried out under reflux conditions for 7-8 hours. After cooling, natural crystallization can precipitate a black precipitate, which is the target molecule HO-PPV-3CN(Scheme 3.).
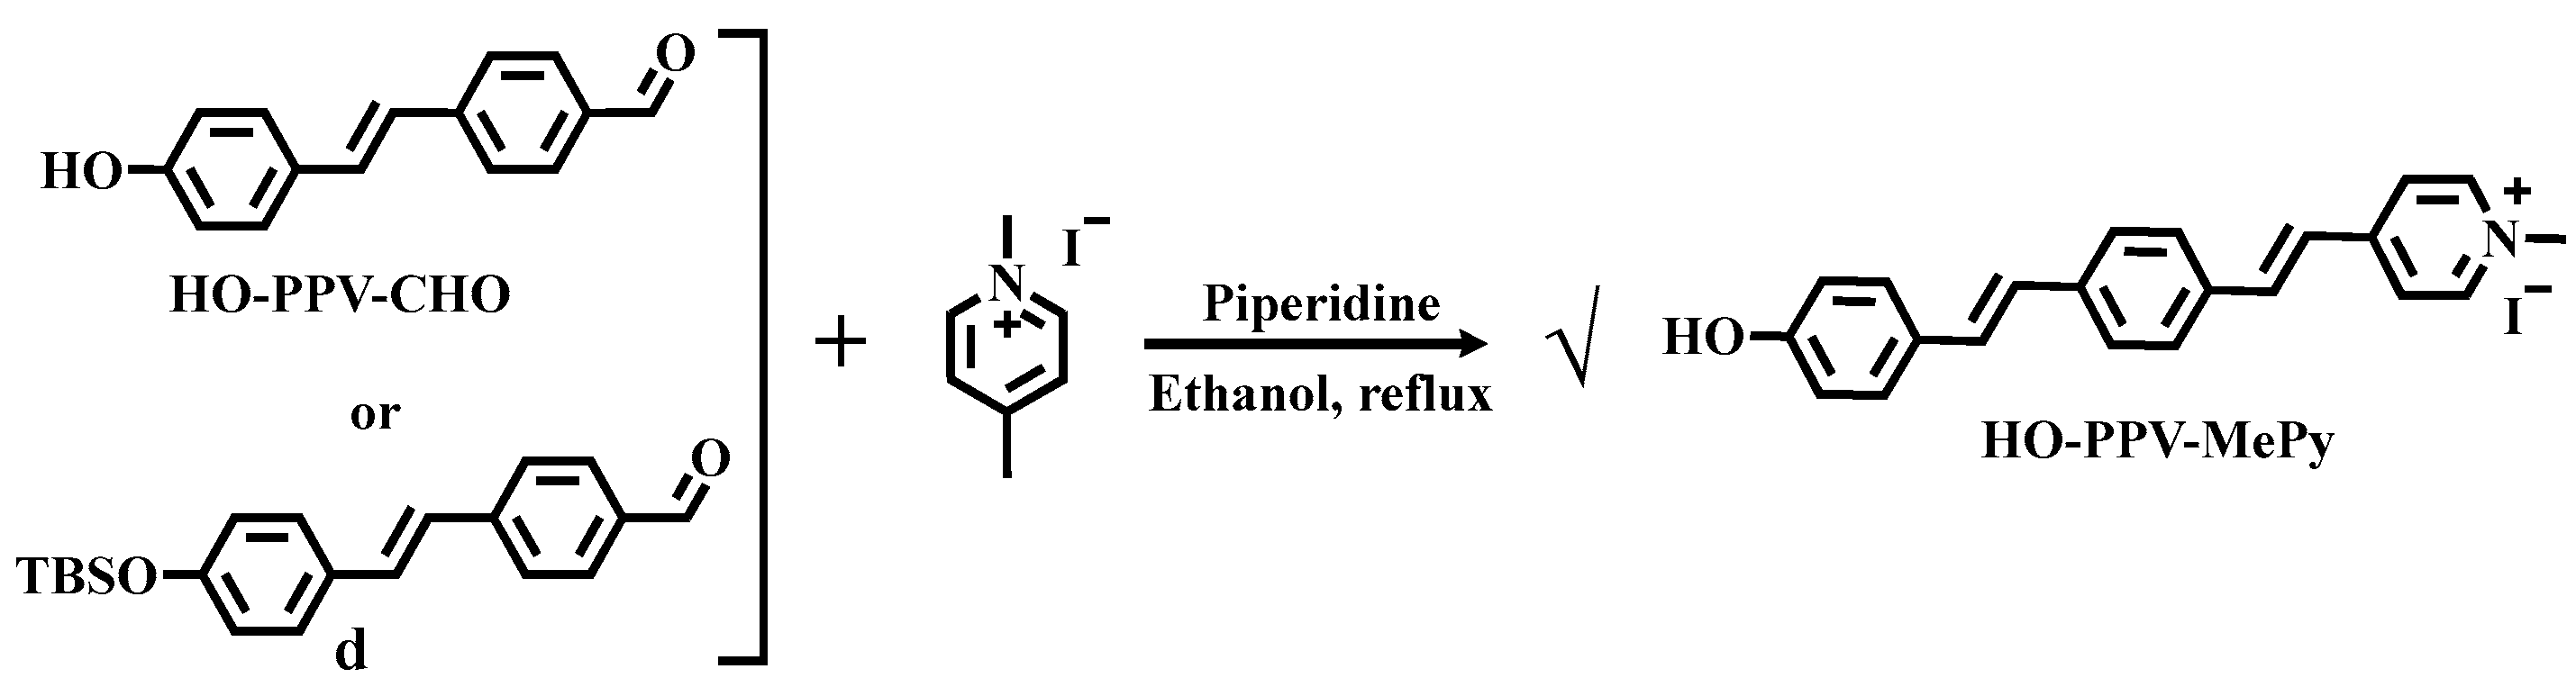
The synthesis of fluorescent dye HO-PPV-MePy: The synthesis method of this target molecule is very clear, that is, using pyridine catalysis and ethanol as the solvent reflux conditions, the target molecule can be successfully obtained. However, during the synthesis process, it was found that the target molecule can also be directly obtained by reacting with 1,4-dimethylpyridine salt using aldehyde without removing TBS protection under these conditions. Compared with the two methods, it is obvious that the latter is simpler, and it has been observed that the reaction effect is better, with fewer by-products in the reaction system(Scheme 4.).
The synthesis of fluorescent dye HO-PPV-EtBT: Firstly, we attempted to use pyridine catalysis and reflux ethanol as a solvent overnight. The reaction system turned dark purple, and TLC monitoring showed that the raw material HO-PPV-CHO was completely consumed. However, the reaction system was very complex, with many by-products and no clear target point. Try replacing the weaker base with pyridine catalysis. After refluxing in ethanol for 7-8 hours, a large amount of brownish red precipitate appears. After cooling to room temperature, filter and wash the solid three times with cold ethanol. Then air dry naturally and dry in a vacuum drying oven at 60 ℃ for 6 hours to obtain the target molecule(Scheme 5.).
In summary, after the above synthesis exploration, a total of 3 molecules were successfully synthesized, purified, and obtained in quantities suitable for subsequent performance testing, namely: HO-PPV-3CN、HO-PPV-MePy、HO-PPV-EtBT.
2.4. General Procedures for Spectral Research
Prepare stock solutions of 1 mM HO-PPV-3CN, HO-PPV-MePy, and HO-PPV-EtBT fluorescent dyes in analytical pure DMSO. Before spectral measurement, prepare the corresponding test solution by diluting the high concentration reserve solution fresh. The spectral performance testing in different solvents was carried out according to the following procedure: 30 μ L of fluorescent dye stock solution (1 mM) was added to a 4 mL test tube, and then diluted with 2.97 mL of the corresponding solvent to a total volume of 3 mL. The final tested fluorescent dye concentration was 10 μ M. The excitation wavelength, spectral acquisition range, and measurement slit width are determined based on the instrument performance, fluorescence excitation spectrum, and actual spectral emission, and remain consistent within the group.
2.5. Determination of Absolute Fluorescence Quantum Yield
The absolute fluorescence quantum yields (Φ) of three probes in different solvents were obtained using an integrating sphere on a FLS 920 fluorescence spectrophotometer (Edinburgh Instruments, UK). The excitation wavelength is set to 610 nm, and the collected fluorescence emission band is 625-780 nm. The width of the slit and the final concentration of the test sample depend on the strength of the test signal. The final absolute fluorescence quantum yield was automatically simulated by specific computer software, and the results are summarized in the table
2.6. Cell Culture
HeLa and HepG2 cells were purchased from the Chinese Academy of Sciences Shanghai Institute of Biochemistry and Cell Biology. Cells were cultured in RPMI-1640 medium containing 10% fetal bovine serum (FBS), 100U/mL streptomycin, 100U/mL penicillin, 2g/L NaHCO3, or DMEM medium containing 10% fetal bovine serum (FBS), 100U/mL streptomycin, 100U/mL penicillin, 3.7g/L NaHCO3. Cultivate in a 37 ℃ incubator containing 5% CO2. Experiments were conducted using cells in the exponential growth phase.
2.7. Cytotoxic Assay
MTT assay was used to determine the cytotoxicity of probes on HeLa, HepG2 cells. 100pL cells (density 6x10⁴ cells/mL) were seeded onto a 96 well plate and incubated overnight in a 5% CO2 incubator at 37 ° C. Remove the old culture medium, add fresh culture medium, and incubate with different concentrations (0、1.25、2.5、5、10、20、25、30、40 μM) of probes in fresh culture medium for 24 hours. Subsequently, remove the old culture medium and incubate with 10 pL MTT (5 mg/mL) and 90 pL culture medium for 4 hours. Finally, remove the MTT containing culture medium, add 100 μ L DMSO to each well, shake, dissolve with formazan crystals, and measure the absorbance value of each well at 570m using an enzyme-linked immunosorbent assay (ELISA) reader. All experiments were repeated three times independently.
2.8. Cell Imaging
Two photon imaging of HeLa and HepG2 cells using fluorescent dyes HO-PPV-3CN, HO-PPV-MePy, and HO-PPV-EtBT was performed on a laser scanning confocal microscope (upright) (Olympus FV1000 MPE, 100x oil objective); Single photon imaging of HeLa and HepG2 cells using HO-PPV-MePy was performed on a laser confocal microscope (inverted) - Olympus FV3000 (40x air objective).
3. Results
3.1. Spectral Properties of PPV Fluorochromes
After successfully synthesizing dye molecules HO-PPV-3CN, HO-PPV-MePy, and HO-PPV-EtBT, their basic luminescent properties were preliminarily tested at 25 ℃. As shown in Figure 3., the three dye molecules exhibit different absorption bands in the twelve selected solvents. Specifically, HO-PPV-3CN exhibits dual absorption in the UV visible range, with the center positions of the two absorption peaks concentrated at approximately 330nm and 500nm, respectively, with varying deviations in different solvents. The absorption peak center of HO-PPV-MePy in most sol outlets is concentrated at about 425 nm, and the red shift in dichloromethane (DCM) is about 460 nm. The absorption spectra of HO-PPV-EtBT in different solvents show varying degrees of blue or red shift at 460nm.
Based on the measurement results of UV visible absorption spectra mentioned above, although there is a theoretical conclusion that UV absorption spectra are highly similar to fluorescence excitation spectra, considering the physical differences between instruments, the acetonitrile PBS mixed solvent system was further selected to test the fluorescence excitation spectra of the three dye molecules, and based on this, combined with the actual light emission situation, the fluorescence excitation wavelength was selected and determined. The fluorescence excitation spectra of HO-PPV-3CN, HO-PPV-MePy, and HO-PPV-EtBT in the acetonitrile PBS solvent system are shown in Figure 4.
After determining the fluorescence excitation wavelengths of the three fluorescent dyes, the fluorescence emission spectra of HO-PPV-3CN, HO-PPV MePy, and HO-PPV EtBT in different solvents are shown in Figure 5. The fluorescence emission spectrum of HO-PPV-3CN is greatly affected by solvents, and the emission wavelength is relatively short in solvents with low polarity such as 1,4-dioxane, ether, tetrahydrofuran, and dichloromethane, ranging from 660-750 nm; And in DMF DMA、DMSO、 The center of the maximum fluorescence emission wavelength in highly polar solvent systems such as acetonitrile PBS can be red shifted to around 830 nm, and the spectral band becomes wider; The emission wavelength center is around 800 nm in acetonitrile, methanol, ethanol, and PBS (Figure 5A). Preliminary speculation suggests that solvent polarity may directly affect the fluorescence emission spectrum of HO-PPV-3CN, and changing solvent polarity can directly alter its fluorescence emission spectrum characteristics, including peak shape and peak position. The emission spectrum center of HO-PPV-MePy is around 730 nm in most solvents, with blue shift to 710 nm in tetrahydrofuran and 610 nm in 1,4-dioxane. However, there is almost no fluorescence in ether and pure PBS (Figure 5B). The emission spectrum center of HO-PPV-EtBT shows a slight red or blue shift around 770 nm in most solvents, while the fluorescence is weak in 1,4-dioxane, ether, and pure PBS(Figure 5C).
It is worth noting that under the condition of dioxane, the PPV series probes undergo a red shift, which is mainly related to solvent polarity, intermolecular forces, solvent probe molecule interaction modes, and solvent molecule structural characteristics. Firstly, the probe is affected by the polarity of the solvent. An increase in solvent polarity can cause a change in the energy difference between the excited and ground states of the fluorescent probe, resulting in a shift of the fluorescence peak towards longer wavelengths, i.e., a red shift. As a polar solvent, dioxane can stabilize the excited state of probe molecules through solvation, reduce the excited state energy, and thus cause a red shift in fluorescence emission wavelength. Secondly, influenced by intermolecular forces, hydrogen bonds or other intermolecular forces may form between the dioxane ring and the PPV series probe molecules. These forces can alter the electron cloud distribution of the probe molecules, thereby affecting their electron transition energy levels and causing a red shift in the fluorescence spectrum.
In addition, in the concentration dependent fluorescence titration experiment (Figure 6.), with the probe HO-PPV-3CN, As the concentration of HO-PPV-MePy and HO-PPV-EtBT increased from 0 μ M to 10 μ M, the ratio of probe fluorescence intensity gradually increased and showed a good linear relationship in the concentration range of 0-5 μ M.
From the above basic spectral property test results, it can be seen that the solvent properties have the least influence on the fluorescence emission spectrum of HO-PPV-EtBT, followed by HO-PPV-MePy, and the greatest influence on HO-PPV-3CN. However, in any case, the emission wavelengths of the three fluorochromes can fall in the near-infrared region (650-900 nm), which is the near-infrared emitting fluorescent dye, and from the difference between the absorption wavelength and the emission wavelength, it can be known that all three exhibit huge Stokes shifts, which is conducive to reducing background interference, reducing biological sample damage, enhancing sample penetration ability, and improving detection sensitivity.
3.2. Cell Imaging of PPV Fluorescent Dyes
Prior to cell staining, the cytotoxic activity of three dye molecules (HO-PPV-3CN, HO-PPV-MePy, and HO-PPV-EtBT) was first evaluated by MTT method. After 24 hours of treatment with different doses of dyes (0, 1.25, 2.5, 5, 10, 20, 25, 30, 40 μM), the viability of almost all selected cell lines (HeLa and HepG2 cells) exceeded 85%, indicating that the three dyes had little cytotoxicity to living cells and exhibited good biocompatibility (Figure 7.).
3.3. Cell Imaging
Next, three dye molecules, HO-PPV-3CN, HO-PPV-MePy and HO-PPV-EtBT, were applied to live-cell staining imaging. First, as shown in Figure 8., the fluorescence intensity of different concentrations of HO-PPV-3CN for HeLa cell staining increased with the increase of dye concentration under the two-photon excitation wavelength of 850 nm, but the staining region was always concentrated in the cell cytoplasm, indicating that the dye molecule HO-PPV-3CN was suitable for two-photon imaging of live cell cytoplasm. As shown in Figure 9., the two-photon imaging of HeLa cells stained by different concentrations of HO-PPV-MePy shows that HO-PPV-MePy stains almost the entire cell region (cytoplasm and nucleus), which is further confirmed by the single-photon imaging of HeLa and HepG2 cells (Figure 10.). Futhermore, the dye HO-PPV-EtBT was applied to two-photon imaging of HeLa and HepG2 cell staining, respectively, and it can be seen from the staining results of multiple images in Figure 11. that the fluorescence signal of HO-PPV-EtBT is mainly concentrated in the nuclear region, indicating that HO-PPV-EtBT can be used as a specific nucleus-targeting dye molecule, that is, a nucleus-selective near-infrared two-photon fluorescent probe.Finally, We selected the commercial cell nucleus probe Hoechst 33342 as a reference, and in the subcellular co localization experiment (Figure 12.), HepG2 cells were incubated with HO-PPV-EtBT and Hoechst 33342 for 30 minutes before imaging. The red fluorescence signal of the probe HO-PPV-EtBT overlaps well with the blue fluorescence signal of Hoechst 33342, with a Pearson's colorization coefficients (PCC) of 0.89. As a control, we also selected endoplasmic reticulum green fluorescent probe ER Tracker Green, mitochondrial green fluorescent probe Mito Tracker Green, lysosome green fluorescent probe Lyso Tracker Green and incubated them together with probe HO-PPV-EtBT. As shown in Figure 11, the red fluorescence signal of the probe does not almost overlap with the green fluorescence signals of the ER Tracker Green, Mito Tracker Green, and Lyso Tracker Green probes. The calculated Pearson co localization coefficients are -0.15, -0.21, and -0.14, respectively. The above experimental results indicate that the probe has good nuclear targeting ability.
3.4. Light Stability Testing of Probe HO-PPV-EtBT
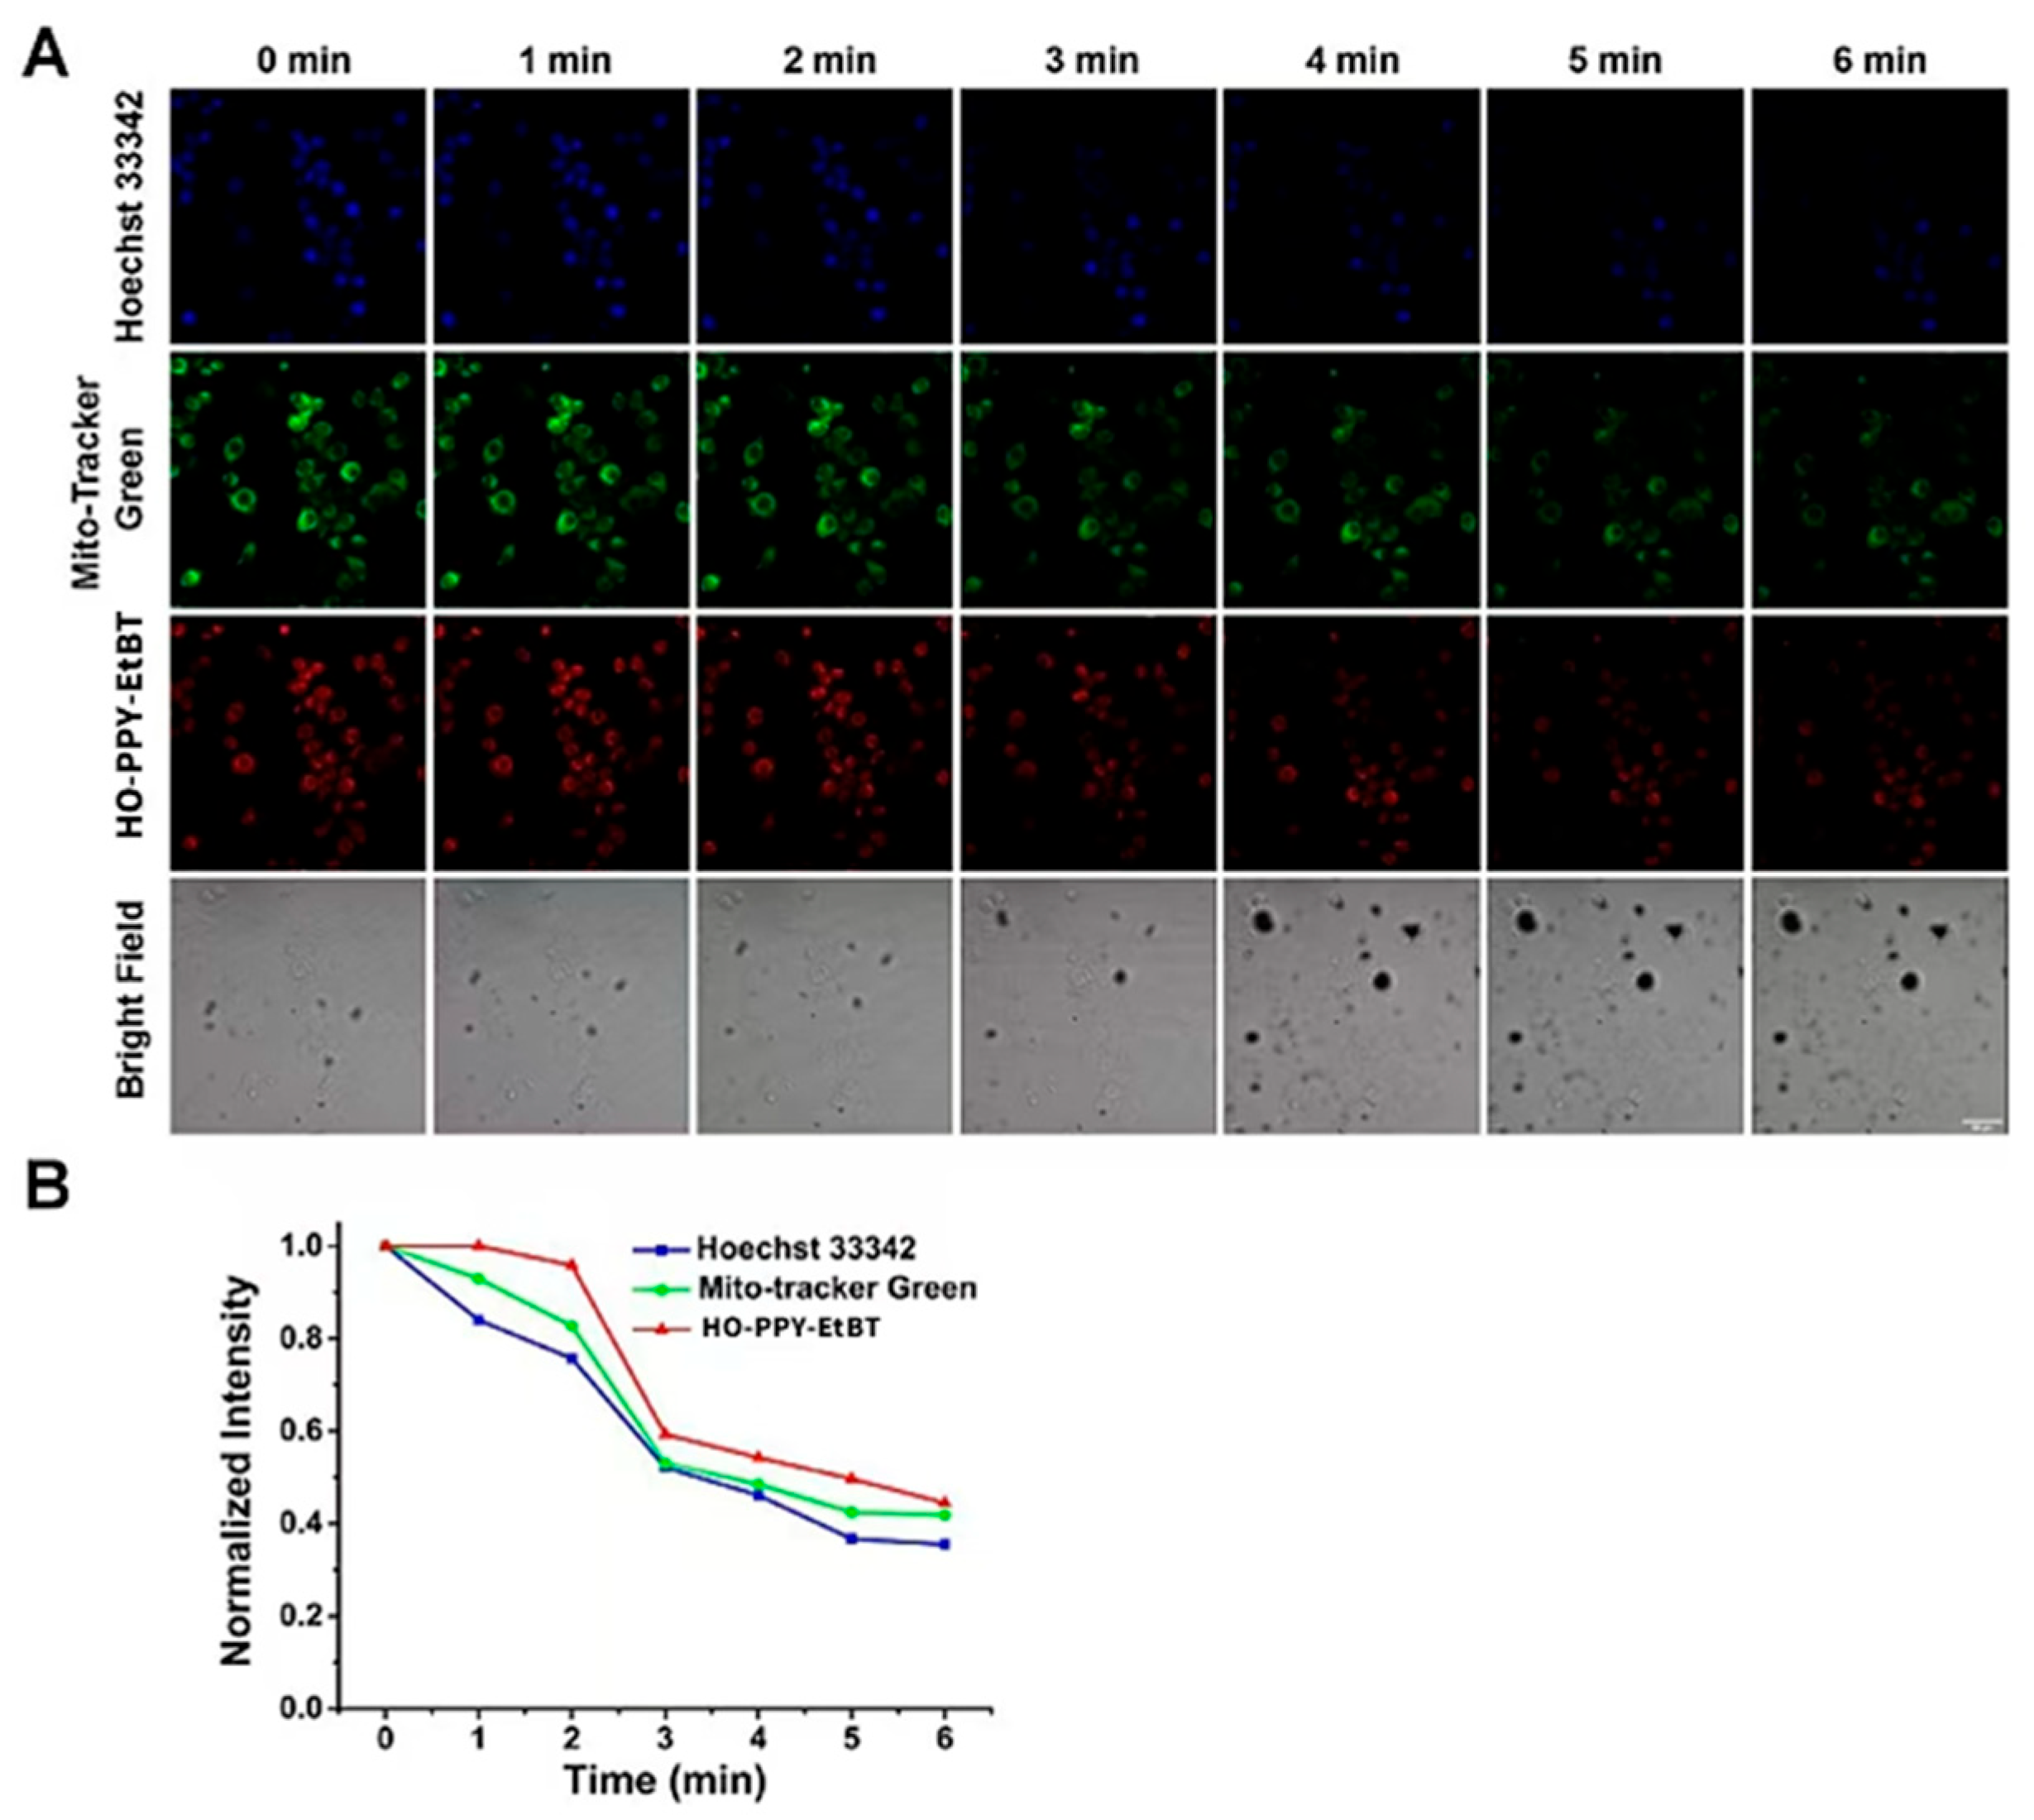
Light stability and tissue penetration depth are important parameters for the application of fluorescent probes in in vivo imaging of target analytes. We compared the photostability of HO-PPV-EtBT with two commercial probes (Hoechst 33342 and Mito Tracker Green) in HepG2 cells using confocal laser scanning microscopy for photobleaching experiments (Figure 13.), it can be seen that the intensity of the red fluorescence signal generated by HO-PPV-EtBT remains unchanged for the first 2 minutes, Significant attenuation only appears after 3-6 minutes. Under the same testing conditions, the attenuation of blue and green fluorescence intensity emitted at the same time point is higher than that of HO-PPV-EtBT. The experimental results indicate that the photostability of HO-PPV-EtBT is superior to that of Hoechst 33342 and Mito Tracker Green.
4. Discussion
The design, synthesis, and application of near-infrared two-photon fluorescent dyes derived from PPV have been the focus of this study. The insertion of electron-donating hydroxyl groups (-OH) and various electron-withdrawing groups at both ends of the PPV core fragment has led to the creation of three novel dyes: HO-PPV-3CN, HO-PPV-MePy, and HO-PPV-EtBT. These dyes exhibit improved water solubility and strong push-pull structures, contributing to their unique optical properties.
The spectral analysis revealed that HO-PPV-3CN, HO-PPV-MePy, and HO-PPV-EtBT display distinct absorption and emission characteristics in various solvents. Notably, HO-PPV-3CN demonstrated dual absorption peaks in the ultraviolet-visible range, with significant solvent-dependent shifts in its emission wavelength. This suggests a strong influence of solvent polarity on the fluorescence emission spectrum of HO-PPV-3CN. In contrast, HO-PPV-EtBT showed the least variation in its emission spectrum across different solvents, indicating greater stability in its optical properties.
The cellular staining experiments using these dyes provided intriguing results. HO-PPV-3CN predominantly stained the cytoplasm, suggesting its potential use for cytoplasm-specific imaging. HO-PPV-MePy stained the entire cell, encompassing both cytoplasm and nucleus, as further confirmed by single-photon imaging. Most notably, HO-PPV-EtBT demonstrated selective staining of the nucleus, positioning it as a promising candidate for nucleus-localized near-infrared two-photon fluorescent probes.
The cytotoxicity assessments using the MTT assay ensured the biocompatibility of these dyes, particularly at lower concentrations, which is crucial for their potential applications in biological imaging. The selective staining patterns observed in live-cell imaging experiments underscore the potential of these PPV-derived dyes for subcellular localization studies.
When compared to existing literature, the PPV-based dyes developed in this study offer several advantages. Their improved water solubility broadens the scope of applications in aqueous environments, such as biological samples. Moreover, the near-infrared emission wavelengths place them within a range that minimizes autofluorescence and maximizes tissue penetration, making them suitable for deep-tissue imaging. However, further studies are needed to fully understand the mechanisms underlying their subcellular localization and to explore their potential applications in disease diagnosis and therapy.
5. Conclusions
In conclusion, this study successfully synthesized and characterized three novel near-infrared two-photon fluorescent dyes derived from PPV. These dyes, HO-PPV-3CN, HO-PPV-MePy, and HO-PPV-EtBT, exhibit distinct optical properties and subcellular localization patterns. HO-PPV-3CN is suitable for cytoplasm-specific imaging, HO-PPV-MePy stains the entire cell, and HO-PPV-EtBT demonstrates selective staining of the nucleus. Their biocompatibility and near-infrared emission make them promising candidates for biological imaging applications.
The results obtained in this study contribute to the expanding field of PPV-derived fluorescent dyes and probes. Future work will focus on refining the synthesis methods, exploring additional subcellular targets, and evaluating the potential of these dyes in preclinical studies for disease diagnosis and treatment monitoring. The unique properties of these PPV-based dyes hold promise for advancing the field of biological imaging and opening new avenues for research in biomedicine.
Author Contributions
Synthesis of Fluorescent Probes, Haopeng Yang; UV and fluorescence spectroscopy testing, HaoPeng Yang; Cell culture and toxicity testing, HaoPeng Yang; Cell Imaging, HaoPeng Yang; data curation, Haopeng Yang; writing—original draft preparation, Haopeng Yang; writing—review and editing, Jieting Zheng; Visualization, Jietingzheng; funding acquisition, Bo Chou; All authors have read and agreed to the published version of the manuscript.
Funding
This research was funded by National Natural Science Foundation of China General Project, grant number 21672091. The APC was funded by leader author.
Institutional Review Board Statement
Not applicable.
Informed Consent Statement
Not applicable.
Data Availability Statement
Data are contained within the article. The data presented in this study can be requested from the authors.
Conflicts of Interest
The authors declare no conflicts of interest.
References
- Chiang, C.K.; Fincher, J.C.R.; Park, Y.W.; Heeger, A.J.; Shirakawa, H.; Louis, E.J.; Gau, S.C.; MacDiarmid, A.G. Electrical Conductivity in Doped Polyacetylene : Phys. Rev. Lett. 39 (1977) 1098 ( The Nobel Prize in Chemistry to Dr. Hideki Shirakawa). 2001; pp. 572-575.
- Heeger, A.J. Semiconducting and Metallic Polymers: The Fourth Generation of Polymeric Materials (Nobel Lecture) Copyright(c) The Nobel Foundation 2001. We thank the Nobel Foundation, Stockholm, for permission to print this lecture. Angewandte Chemie (International ed. in English) 2001, 40, 2591-2611. [CrossRef]
- Swager, T.M. 50th Anniversary Perspective: Conducting/Semiconducting Conjugated Polymers. A Personal Perspective on the Past and the Future. Macromolecules 2017, 50, 4867–4886. [Google Scholar] [CrossRef]
- Kraft, A.; Grimsdale, A.C.; Holmes, A.B. Electroluminescent Conjugated Polymers — Seeing Polymers in a New Light. ChemInform 1998, 37, 402–428. [Google Scholar] [CrossRef]
- Banerjee, J.; Dutta, K. A short overview on the synthesis, properties and major applications of poly(p-phenylene vinylene). Chemical Papers 2021, 5139–5151. [Google Scholar] [CrossRef]
- Mann, A.; Hannigan, M.D.; Weck, M. Cyclophanediene and Cyclophanetriene-Based Conjugated Polymers. Macromolecular Chemistry and Physics 2022, 224, 2200397. [Google Scholar] [CrossRef]
- Sil, A.; Maity, A.; Giri, D.; Patra, S.K. A phenylene–vinylene terpyridine conjugate fluorescent probe for distinguishing Cd 2+ from Zn 2+ with high sensitivity and selectivity. Sensors and Actuators B-chemical 2016, 226, 403–411. [Google Scholar] [CrossRef]
- Feng, Q.; Zhang, Z.; Yuan, Q.; Yang, M.; Zhang, C.; Tang, Y. Conjugated oligomer-based ultrasensitive fluorescent biosensor for activatable imaging of endogenous NQO1 with High catalytic efficiency in cancer cells. Sensors and Actuators B: Chemical 2020, 312, 127981. [Google Scholar] [CrossRef]
- Gao, C.; Liu, S.Y.; Zhang, X.; Liu, Y.K.; Qiao, C.D.; Liu, Z.E. Two-photon fluorescence and fluorescence imaging of two styryl heterocyclic dyes combined with DNA. Spectrochimica acta. Part A, Molecular and biomolecular spectroscopy 2016, 156, 1–8. [Google Scholar] [CrossRef]
- Sun, L.; Cho, H.J.; Sen, S.; Arango, A.S.; Huynh, T.T.; Huang, Y.; Bandara, N.; Rogers, B.E.; Tajkhorshid, E.; Mirica, L.M. Amphiphilic Distyrylbenzene Derivatives as Potential Therapeutic and Imaging Agents for Soluble and Insoluble Amyloid β Aggregates in Alzheimer's Disease. Journal of the American Chemical Society 2021, 143, 10462–10476. [Google Scholar] [CrossRef]
- Sun, C.L.; Li, J.; Wang, X.-Z.; Shen, R.; Liu, S.; Jiang, J.-Q.; Li, T.; Song, Q.W.; Liao, Q.; Fu, H.; et al. Rational Design of Organic Probes for Turn-On Two-Photon Excited Fluorescence Imaging and Photodynamic Therapy. Chem 2019, 5, 600–616. [Google Scholar] [CrossRef]
- Cao, J.; Jiang, D.-M.; Ren, X.; Li, T.; Gong, X.-T.; Yang, Y.-R.; Xu, Z.-G.; Sun, C.L.; Shi, Z.-F.; Zhang, S.; et al. A highly selective two-photon probe with large turn-on signal for imaging endogenous HOCl in living cells. Dyes and Pigments 2017, 146, 279–286. [Google Scholar] [CrossRef]
- Feng, X.; Feng, F.; Yu, M.; He, F.; Xu, Q.; Tang, H.; Wang, S.; Li, Y.; Zhu, D. Synthesis of a new water-soluble oligo(phenylenevinylene) containing a tyrosine moiety for tyrosinase activity detection. Organic letters 2008, 10, 5369–5372. [Google Scholar] [CrossRef] [PubMed]
- Messmore, B.W.; Hulvat, J.F.; Sone, E.D.; Stupp, S.I. Synthesis, self-assembly, and characterization of supramolecular polymers from electroactive dendron rodcoil molecules. Journal of the American Chemical Society 2004, 126, 14452–14458. [Google Scholar] [CrossRef] [PubMed]
- Kurutos, A.; Nikodinovic-Runic, J.; Veselinovic, A.; Veselinović, J.B.; Kamounah, F.S.; Ilic-Tomic, T. RNA-targeting low-molecular-weight fluorophores for nucleoli staining: synthesis, in silico modelling and cellular imaging. New Journal of Chemistry 2021, 45, 12818–12829. [Google Scholar] [CrossRef]
- Hu, C.; Xu, S.; Song, Z.; Li, H.; Liu, H. Recent Advance in Nucleus-Targeted Fluorescent Probes for Bioimaging, Detection and Therapy. Chemosensors 2023, 11, 125. [Google Scholar] [CrossRef]
- Fabijanić, I.; Kurutos, A.; Paić, A.T.; Tadić, V.; Kamounah, F.S.; Horvat, L.; Brozovic, A.; Crnolatac, I.; Stojković, M.R. Selenium-Substituted Monomethine Cyanine Dyes as Selective G-Quadruplex Spectroscopic Probes with Theranostic Potential. Biomolecules 2023, 13, 128. [Google Scholar] [CrossRef]
- Šmidlehner, T.; Kurutos, A.; Slade, J.; Belužić, R.; Ang, D.L.; Rodger, A.; Piantanida, I. Versatile Click Cyanine Amino Acid Conjugates Showing One-Atom-Influenced Recognition of DNA/RNA Secondary Structure and Mitochondrial Localisation in Living Cells. European Journal of Organic Chemistry 2018, 2018, 1682–1692. [Google Scholar] [CrossRef]
- Abeywickrama, C.S.; Bertman, K.A.; Pang, Y. From nucleus to mitochondria to lysosome selectivity switching in a cyanine probe: The phenolic to methoxy substituent conversion affects probe’s selectivity. Bioorganic Chemistry 2020, 99, 10384. [Google Scholar] [CrossRef]
- Kurutos, A.; Ilic-Tomic, T.; Kamounah, F.S.; Vasilev, A.A.; Nikodinovic-Runic, J. Non-cytotoxic photostable monomethine cyanine platforms: Combined paradigm of nucleic acid staining and in vivo imaging. Journal of Photochemistry and Photobiology a Chemistry 2020, 397, 112598. [Google Scholar] [CrossRef]
- Alamudi, S.H.; Lee, Y.-A. Design strategies for organelle-selective fluorescent probes: where to start? RSC Advances 2025, 15, 2115–2131. [Google Scholar] [CrossRef]
- Ishida, M.; Watanabe, H.; Takigawa, K.; Kurishita, Y.; Oki, C.; Nakamura, A.; Hamach, I.; Tsukiji, S. Synthetic Self-Localizing Ligands That Control the Spatial Location of Proteins in Living Cells. Journal of the American Chemical Society 2013, 135, 12684–12689. [Google Scholar] [CrossRef]
- Gao, Y.; Wang, X.; He, X.; He, Z.; Yang, X.; Tian, S.; Meng, F.; Ding, D.; Luo, L.; Tang, B.Z. A Dual-Functional Photosensitizer for Ultraefficient Photodynamic Therapy and Synchronous Anticancer Efficacy Monitoring. Advanced Functional Materials 2019, 29, 1902673. [Google Scholar] [CrossRef]
- Lu, Y.-J.; Deng, Q.; Hou, J.-Q.; Hu, D.-P.; Wang, Z.-Y.; Zhang, K.; Luyt, L.G.; Wong, W.-L.; Chow, C.-F. Molecular Engineering of Thiazole Orange Dye: Change of Fluorescent Signaling from Universal to Specific upon Binding with Nucleic Acids in Bioassay. ACS Chemical Biology 2016, 11, 1019–1029. [Google Scholar] [CrossRef] [PubMed]
- Aristova, D.; Selin, R.; Heil, H.S.; Kosach, V.; Slominsky, Y.; Yarmoluk, S.; Pekhnyo, V.; Kovalska, V.; Henriques, R.; Mokhir, A.; Chernii, S. Trimethine Cyanine Dyes as NA-Sensitive Probes for Visualization of Cell Compartments in Fluorescence Microscopy. ACS Omega 2022, 7, 47734–47746. [Google Scholar] [CrossRef] [PubMed]
- Zhou, B.; Liu, W.; Zhang, H.; Wu, J.; Liu, S.; Xu, H.; Wang, P. Imaging of nucleolar RNA in living cells using a highly photostable deep-red fluorescent probe. Biosensors and Bioelectronics 2014, 68, 189–196. [Google Scholar] [CrossRef]
- Zheng, Y.-C.; Zheng, M.-L.; Chen, S.; Zhao, Z.-S.; Duan, X.-M. Biscarbazolylmethane-based cyanine: a two-photon excited fluo rescent probe for DNA and selective cell imaging. Journal of Materials Chemistry B 2014, 2, 2301–2310. [Google Scholar] [CrossRef]
- Peng, X.; Wu, T.; Fan, J.; Wang, J.; Zhang, S.; Song, F.; Sun, S. An Effective Minor Groove Binder as a Red Fluorescent Marker for Live-Cell DNA Imaging and Quantification. Angewandte Chemie International Edition 2011, 50, 4180–4183. [Google Scholar] [CrossRef]
Figure 2.
Chemical structures of HO-PPV-3CN, HO-PPV-MePy, HO-PPV-EtBT.
Scheme 1.
Design of PPV two-photon fluorescent dyes based on ICT mechanism.
Scheme 2.
Synthesis route of intermediate HO-PPV-CHO.
Scheme 3.
Synthesis route of fluorescent dye HO-PPV-3CN.
Scheme 4.
Synthesis route of fluorescent dye HO-PPV-MePy.
Scheme 5.
Synthesis route of fluorescent dye HO-PPV-EtBT.
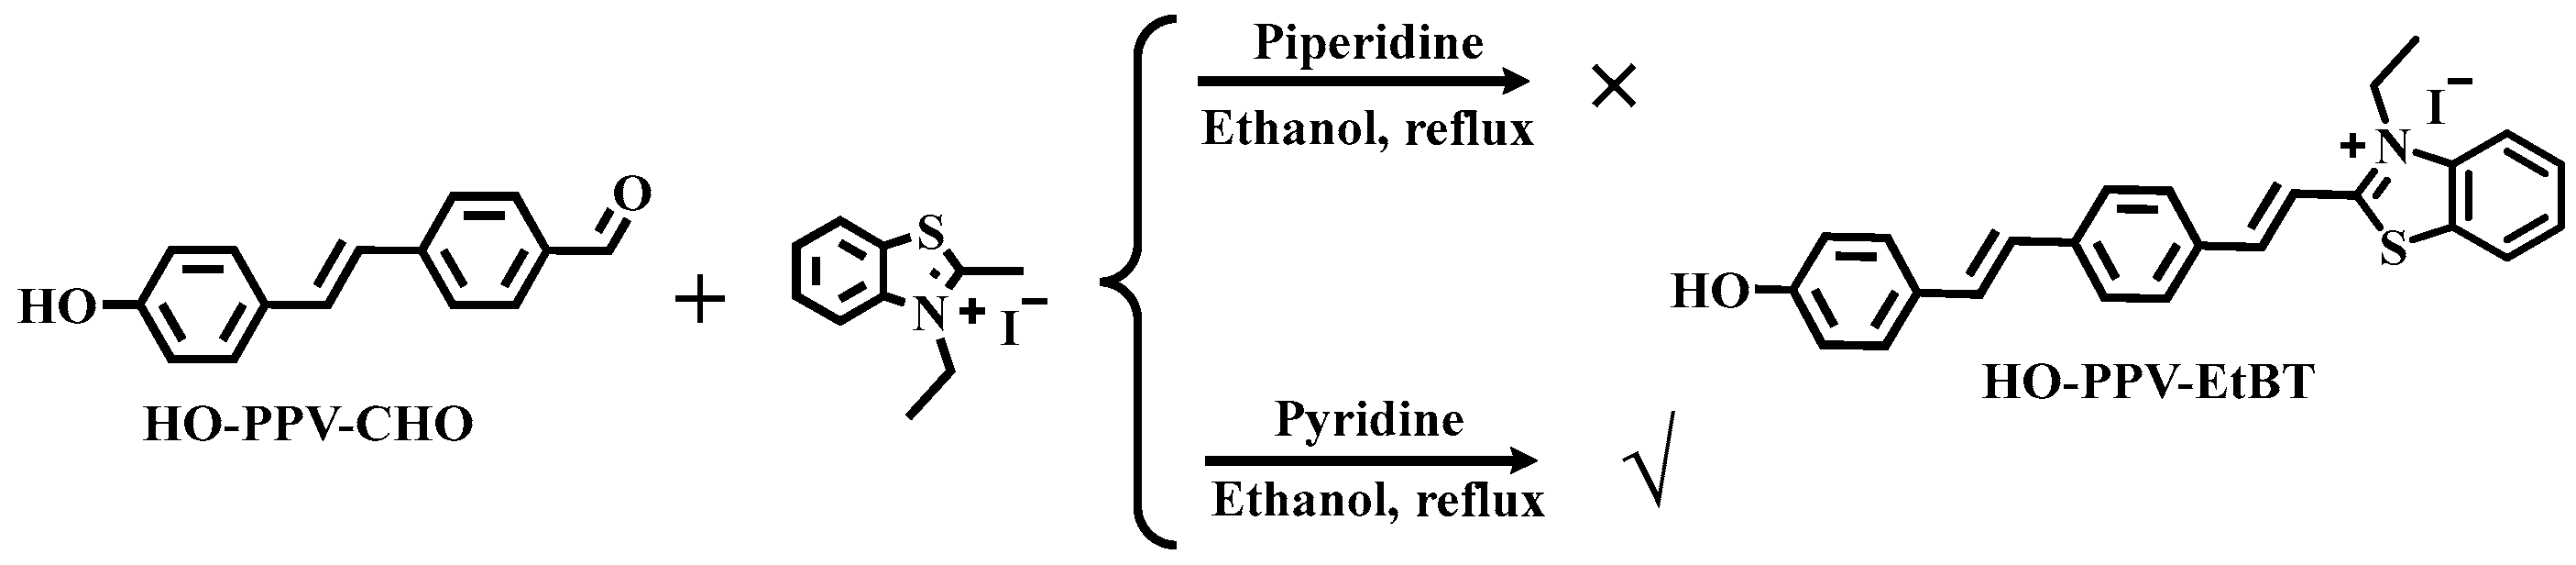
Figure 3.
Uv-vis absorption spectra of fluorescent dyes HO-PPV-3CN, HO-PPV-MePy and HO-PPV-EtBT (Concentration=10 μ m) in different solvents at 25℃, slit width: 10/10 nm.
Figure 3.
Uv-vis absorption spectra of fluorescent dyes HO-PPV-3CN, HO-PPV-MePy and HO-PPV-EtBT (Concentration=10 μ m) in different solvents at 25℃, slit width: 10/10 nm.
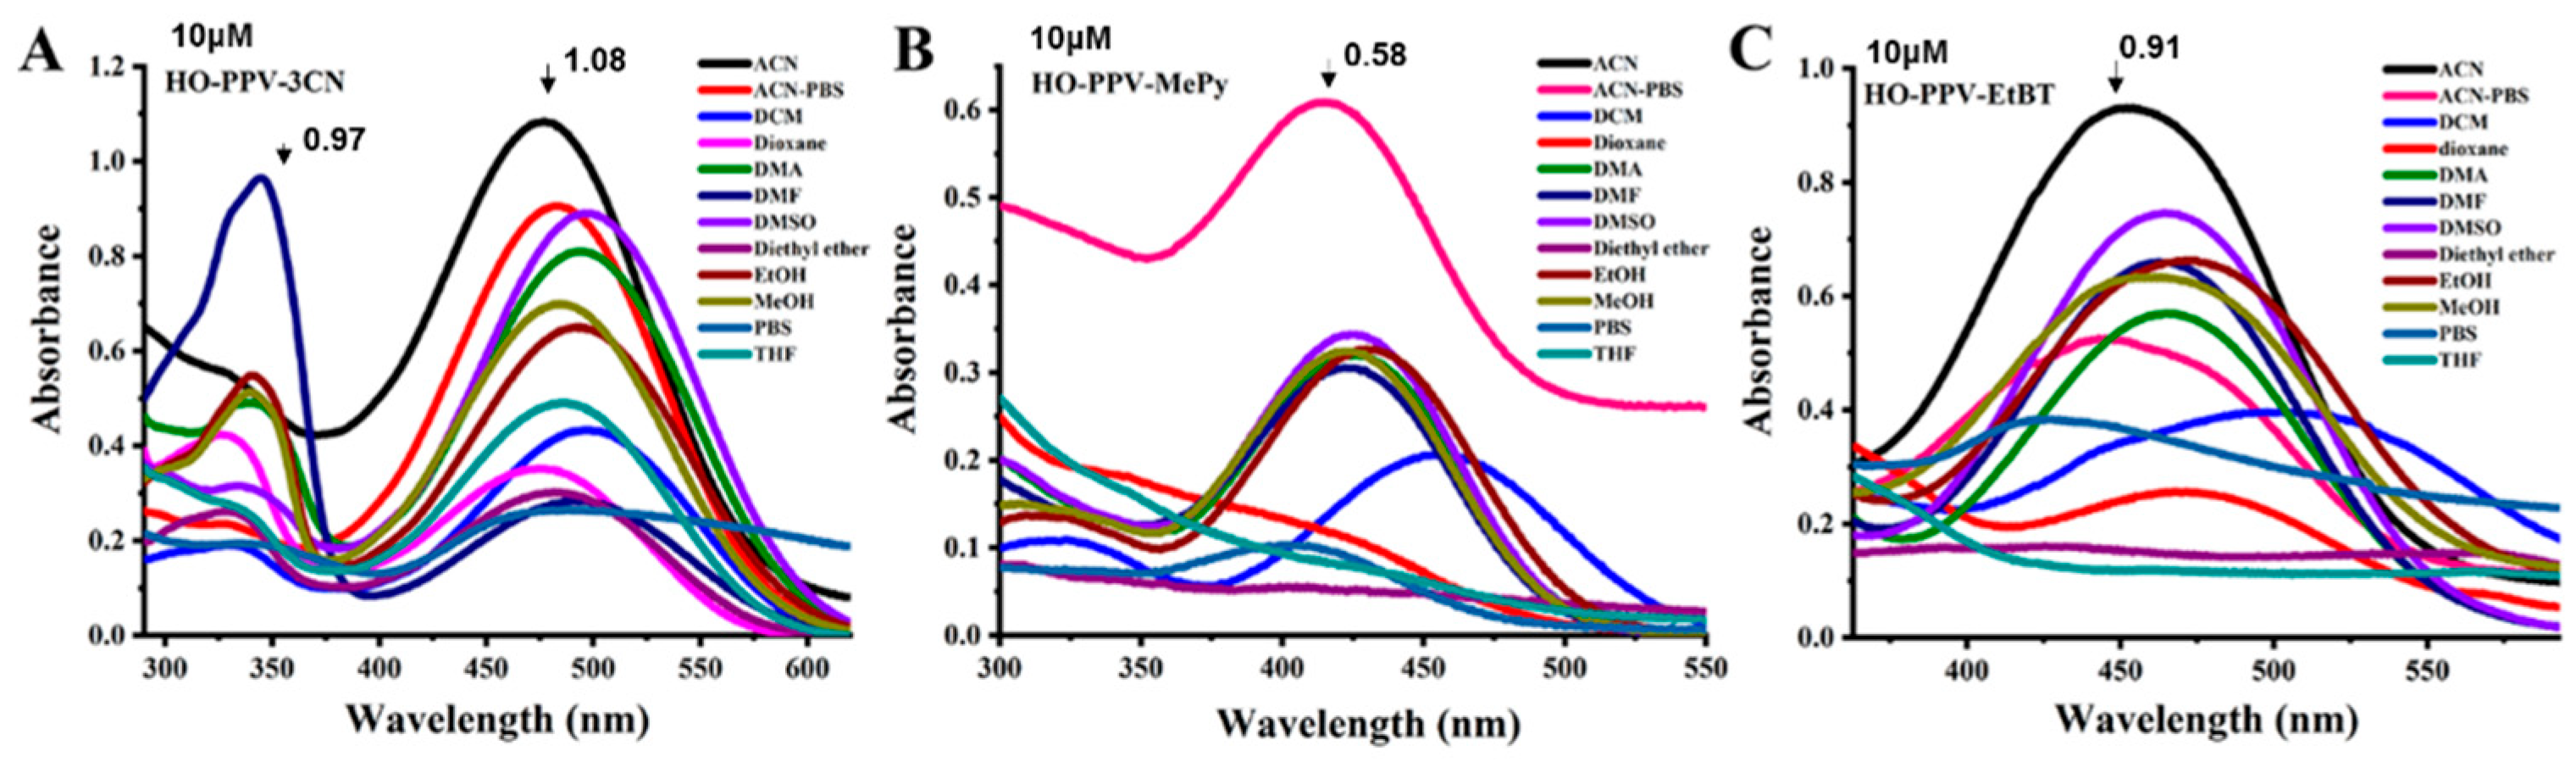
Figure 4.
Fluorescence excitation spectra of fluorescent dyes HO-PPV-3CN, HO-PPV-MePy and HO-PPV-EtBT (λex = 440 nm, 380 nm, 380 nm, Concentration=10 μ m) in Acetonitrile-PBS (1:1, v/v, pH =7.4, 10 mM) solvents at 25℃, slit width: 10/10 nm.
Figure 4.
Fluorescence excitation spectra of fluorescent dyes HO-PPV-3CN, HO-PPV-MePy and HO-PPV-EtBT (λex = 440 nm, 380 nm, 380 nm, Concentration=10 μ m) in Acetonitrile-PBS (1:1, v/v, pH =7.4, 10 mM) solvents at 25℃, slit width: 10/10 nm.
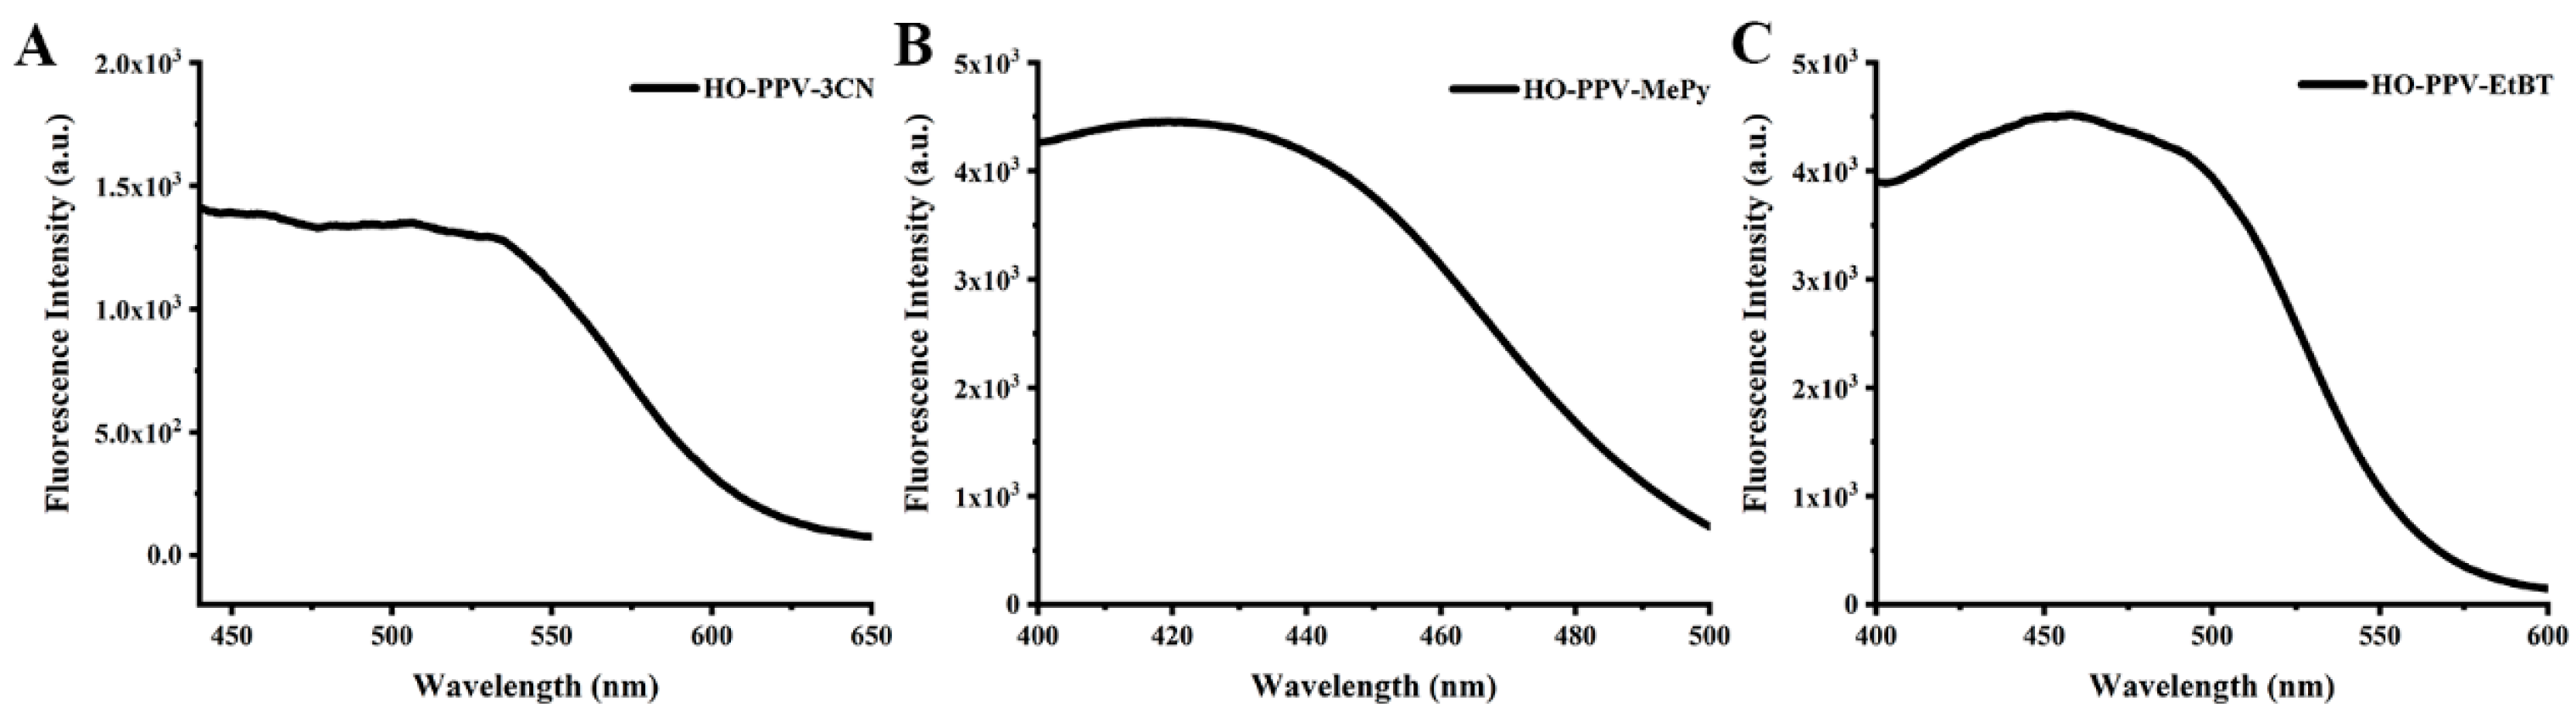
Figure 5.
Fluorescence emission spectra of fluorescent dyes HO-PPV-3CN, HO-PPV-MePy and HO-PPV-EtBT(λex = 550 nm, 470 nm, 550 nm, Concentration=10 μ m) in different solvents at 25℃, slit width: 10/10 nm.
Figure 5.
Fluorescence emission spectra of fluorescent dyes HO-PPV-3CN, HO-PPV-MePy and HO-PPV-EtBT(λex = 550 nm, 470 nm, 550 nm, Concentration=10 μ m) in different solvents at 25℃, slit width: 10/10 nm.
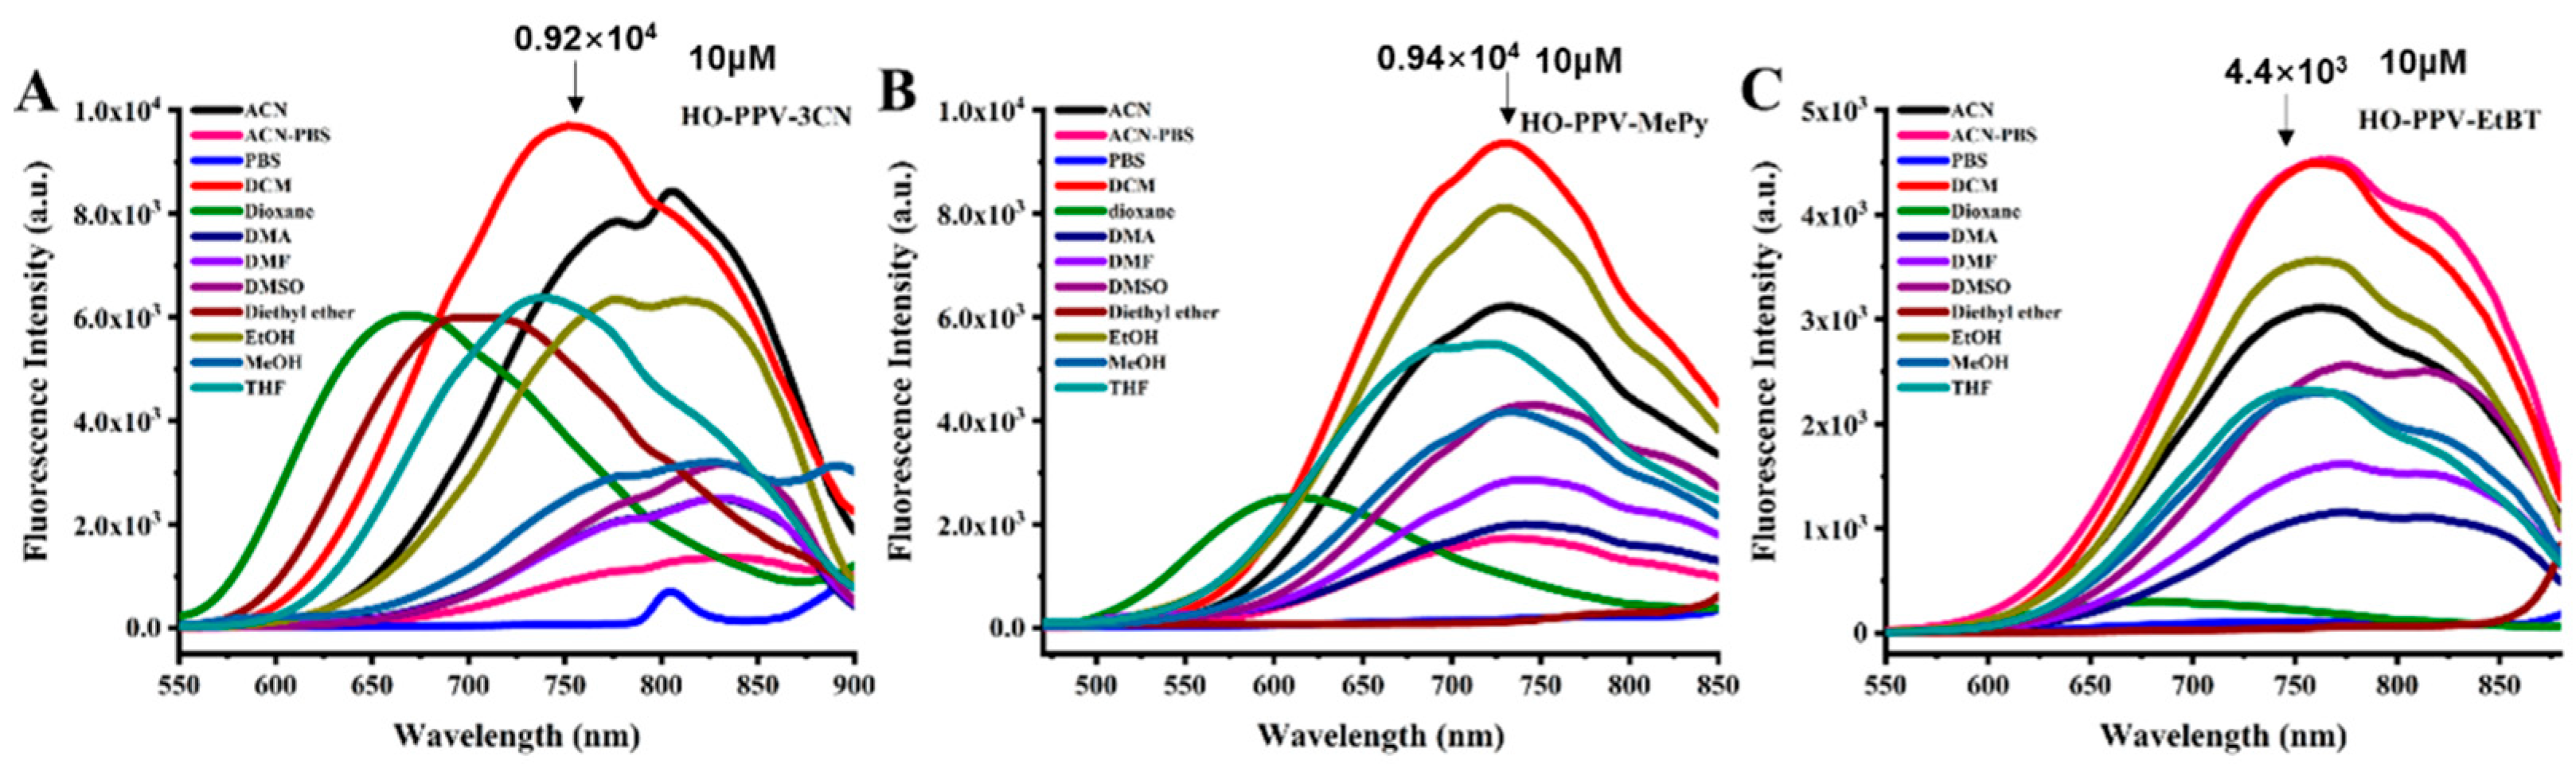
Figure 6.
Concentration-dependence of HO-PPV-3CN, HO-PPV-MePy, HO-PPV-EtBT (A) The fluorescence intensity (λex/λem = 550 nm/750 nm) of probe HO-PPV-3CN (1, 2, 3, 4, 5, 6, 7, 8, 9, 10 μM) in DCM at 25 °C. , slit width: 10/10 nm. (B) The fluorescence intensity (λex/λem = 445 nm/730 nm) of probe HO-PPV-MePy (1, 2, 3, 4, 5, 6, 7, 8, 9, 10 μM) in DCM at 25 °C, slit width: 10/10 nm. (C) The fluorescence intensity (λex/λem = 550 nm/770 nm) of probe HO-PPV-EtBT (1, 2, 3, 4, 5, 6, 7, 8, 9, 10 μM) in DCM at 25 °C, slit width: 10/10 nm. (D)The linear relationship of fluorescence intensity of HO-PPV-3CN (1-5 μM). λex/λem = 550 nm/750 nm in DCM at 25 °C, slit width: 10/10 nm.(E) The linear relationship of fluorescence intensity of HO-PPV-MePy (1-5 μM). λex/λem = 445 nm/730 nm in DCM at 25 °C, slit width: 10/10 nm. (F) The linear relationship of fluorescence intensity of HO-PPV-EtBT (1-5 μM). λex/λem = 550 nm/770 nm in DCM at 25 °C, slit width: 10/10 nm.
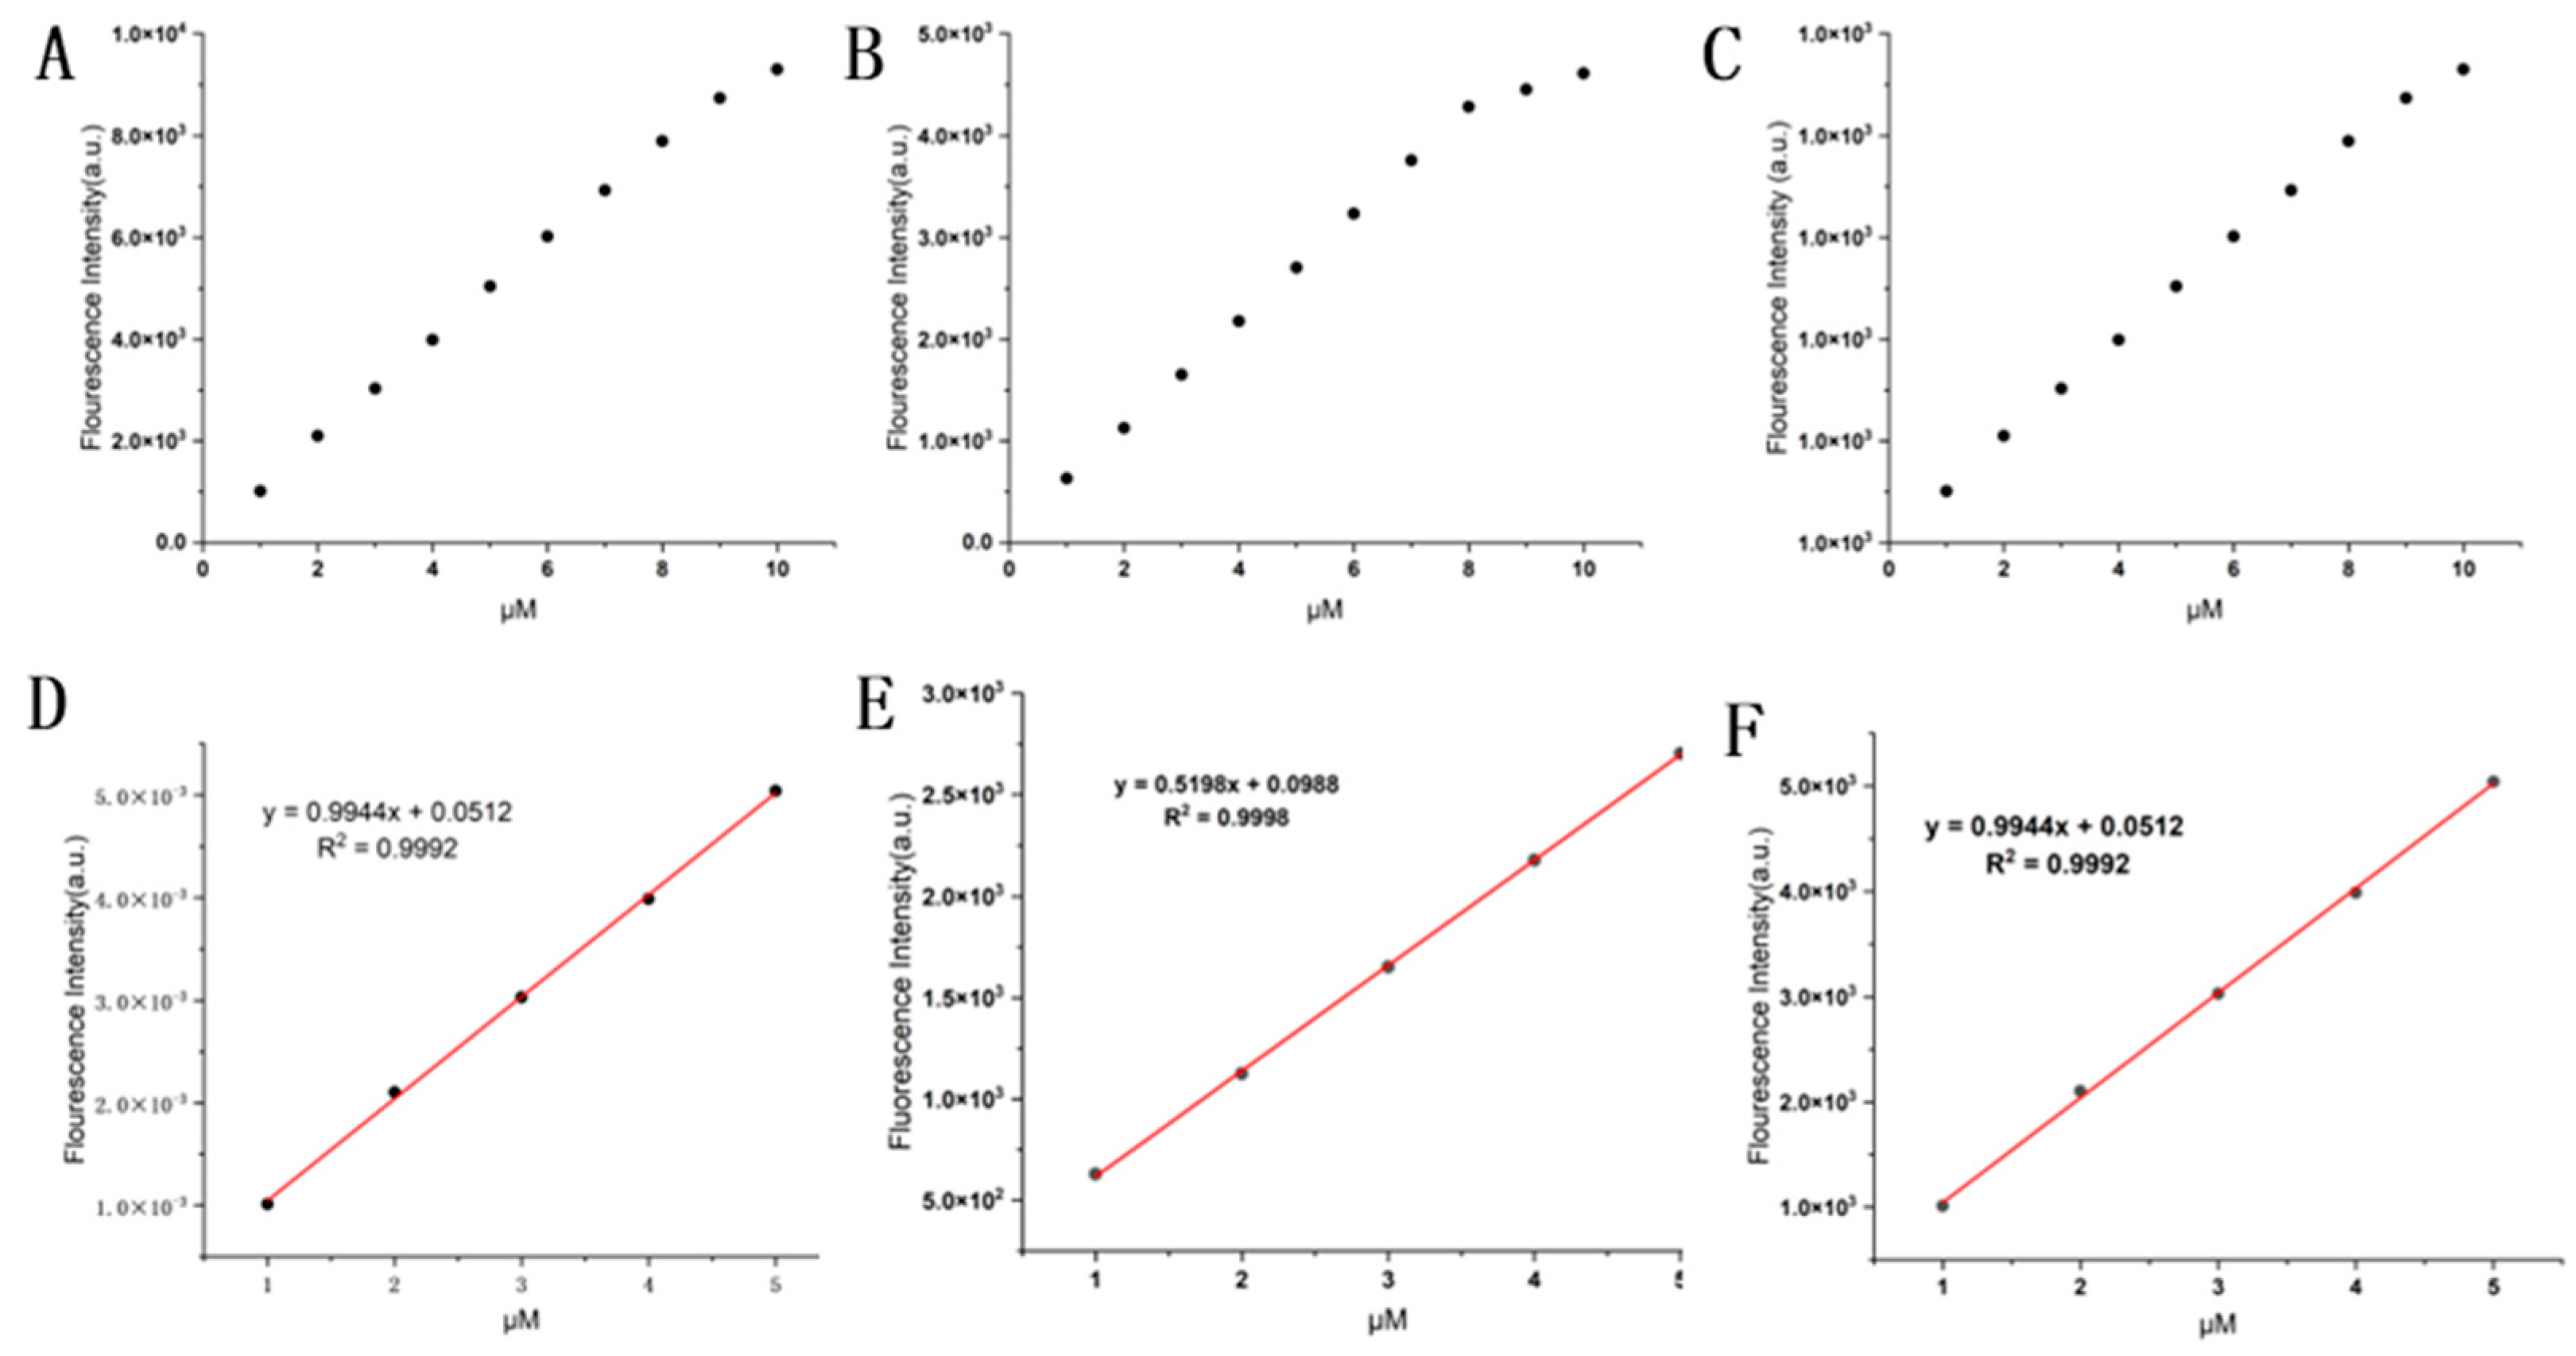
Figure 7.
Cell viabilities of HeLa (A) and HepG2 (B) cells treated with three dyes for 24 h.
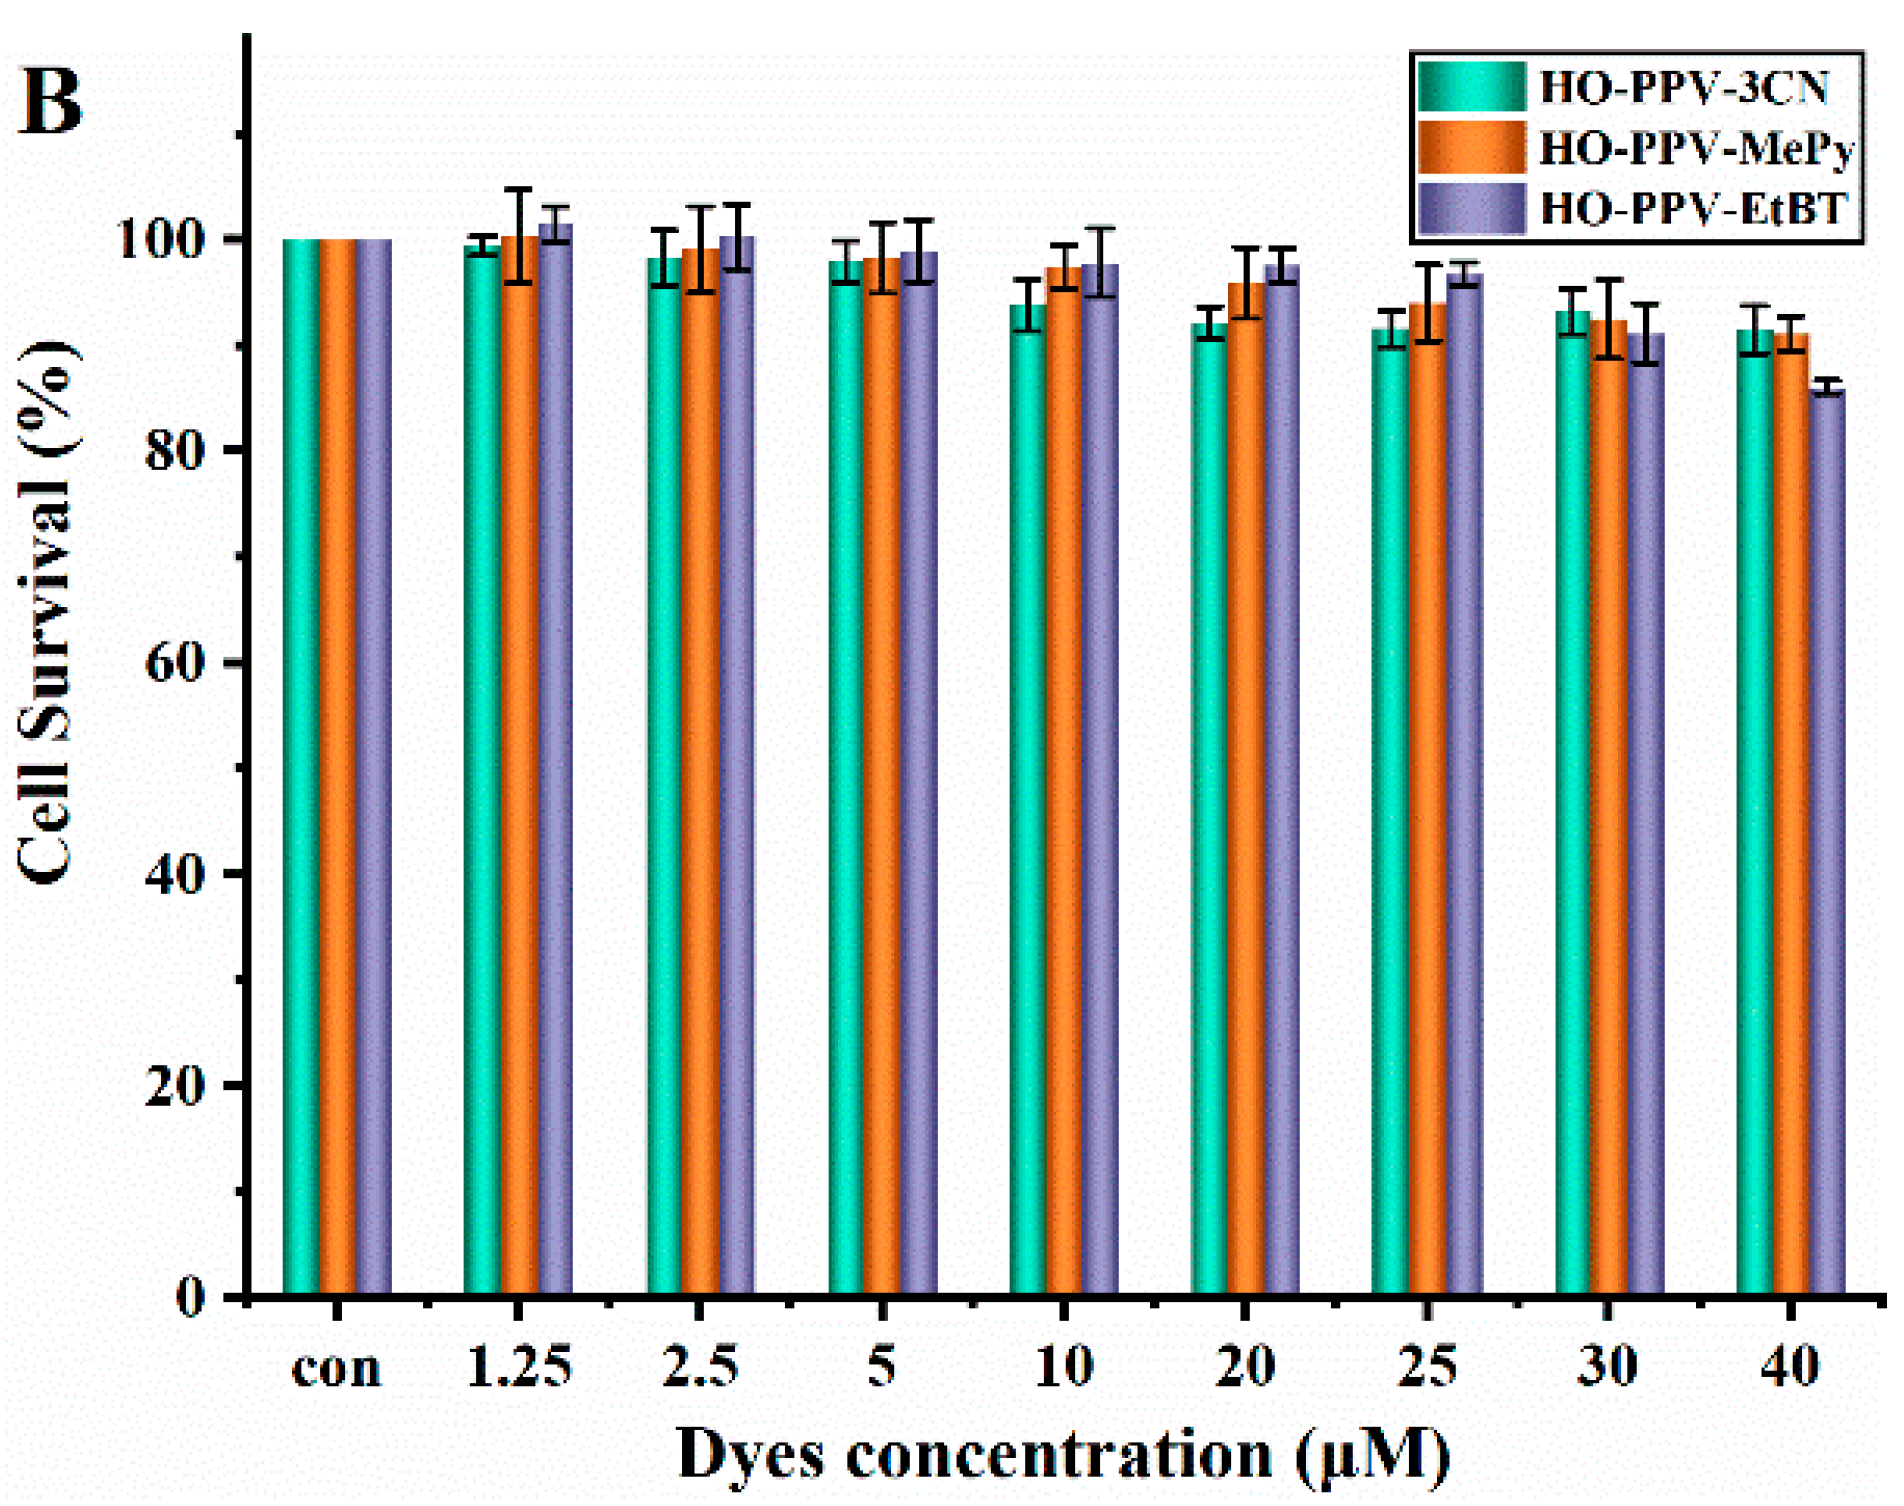
Figure 8.
Two-photon confocal fluorescence images of HeLa cells stained with different concentrations of the fluorescent dye HO-PPV-3CN (5, 10 and 20 μM). From left to right: different HO-PPV-3CN concentrations. From top to bottom: bright field images, fluorescence images, and overlay images. (λex = 850 nm, red channel emission wavelength, λex≥575 nm) Scale bar: 20 μm.
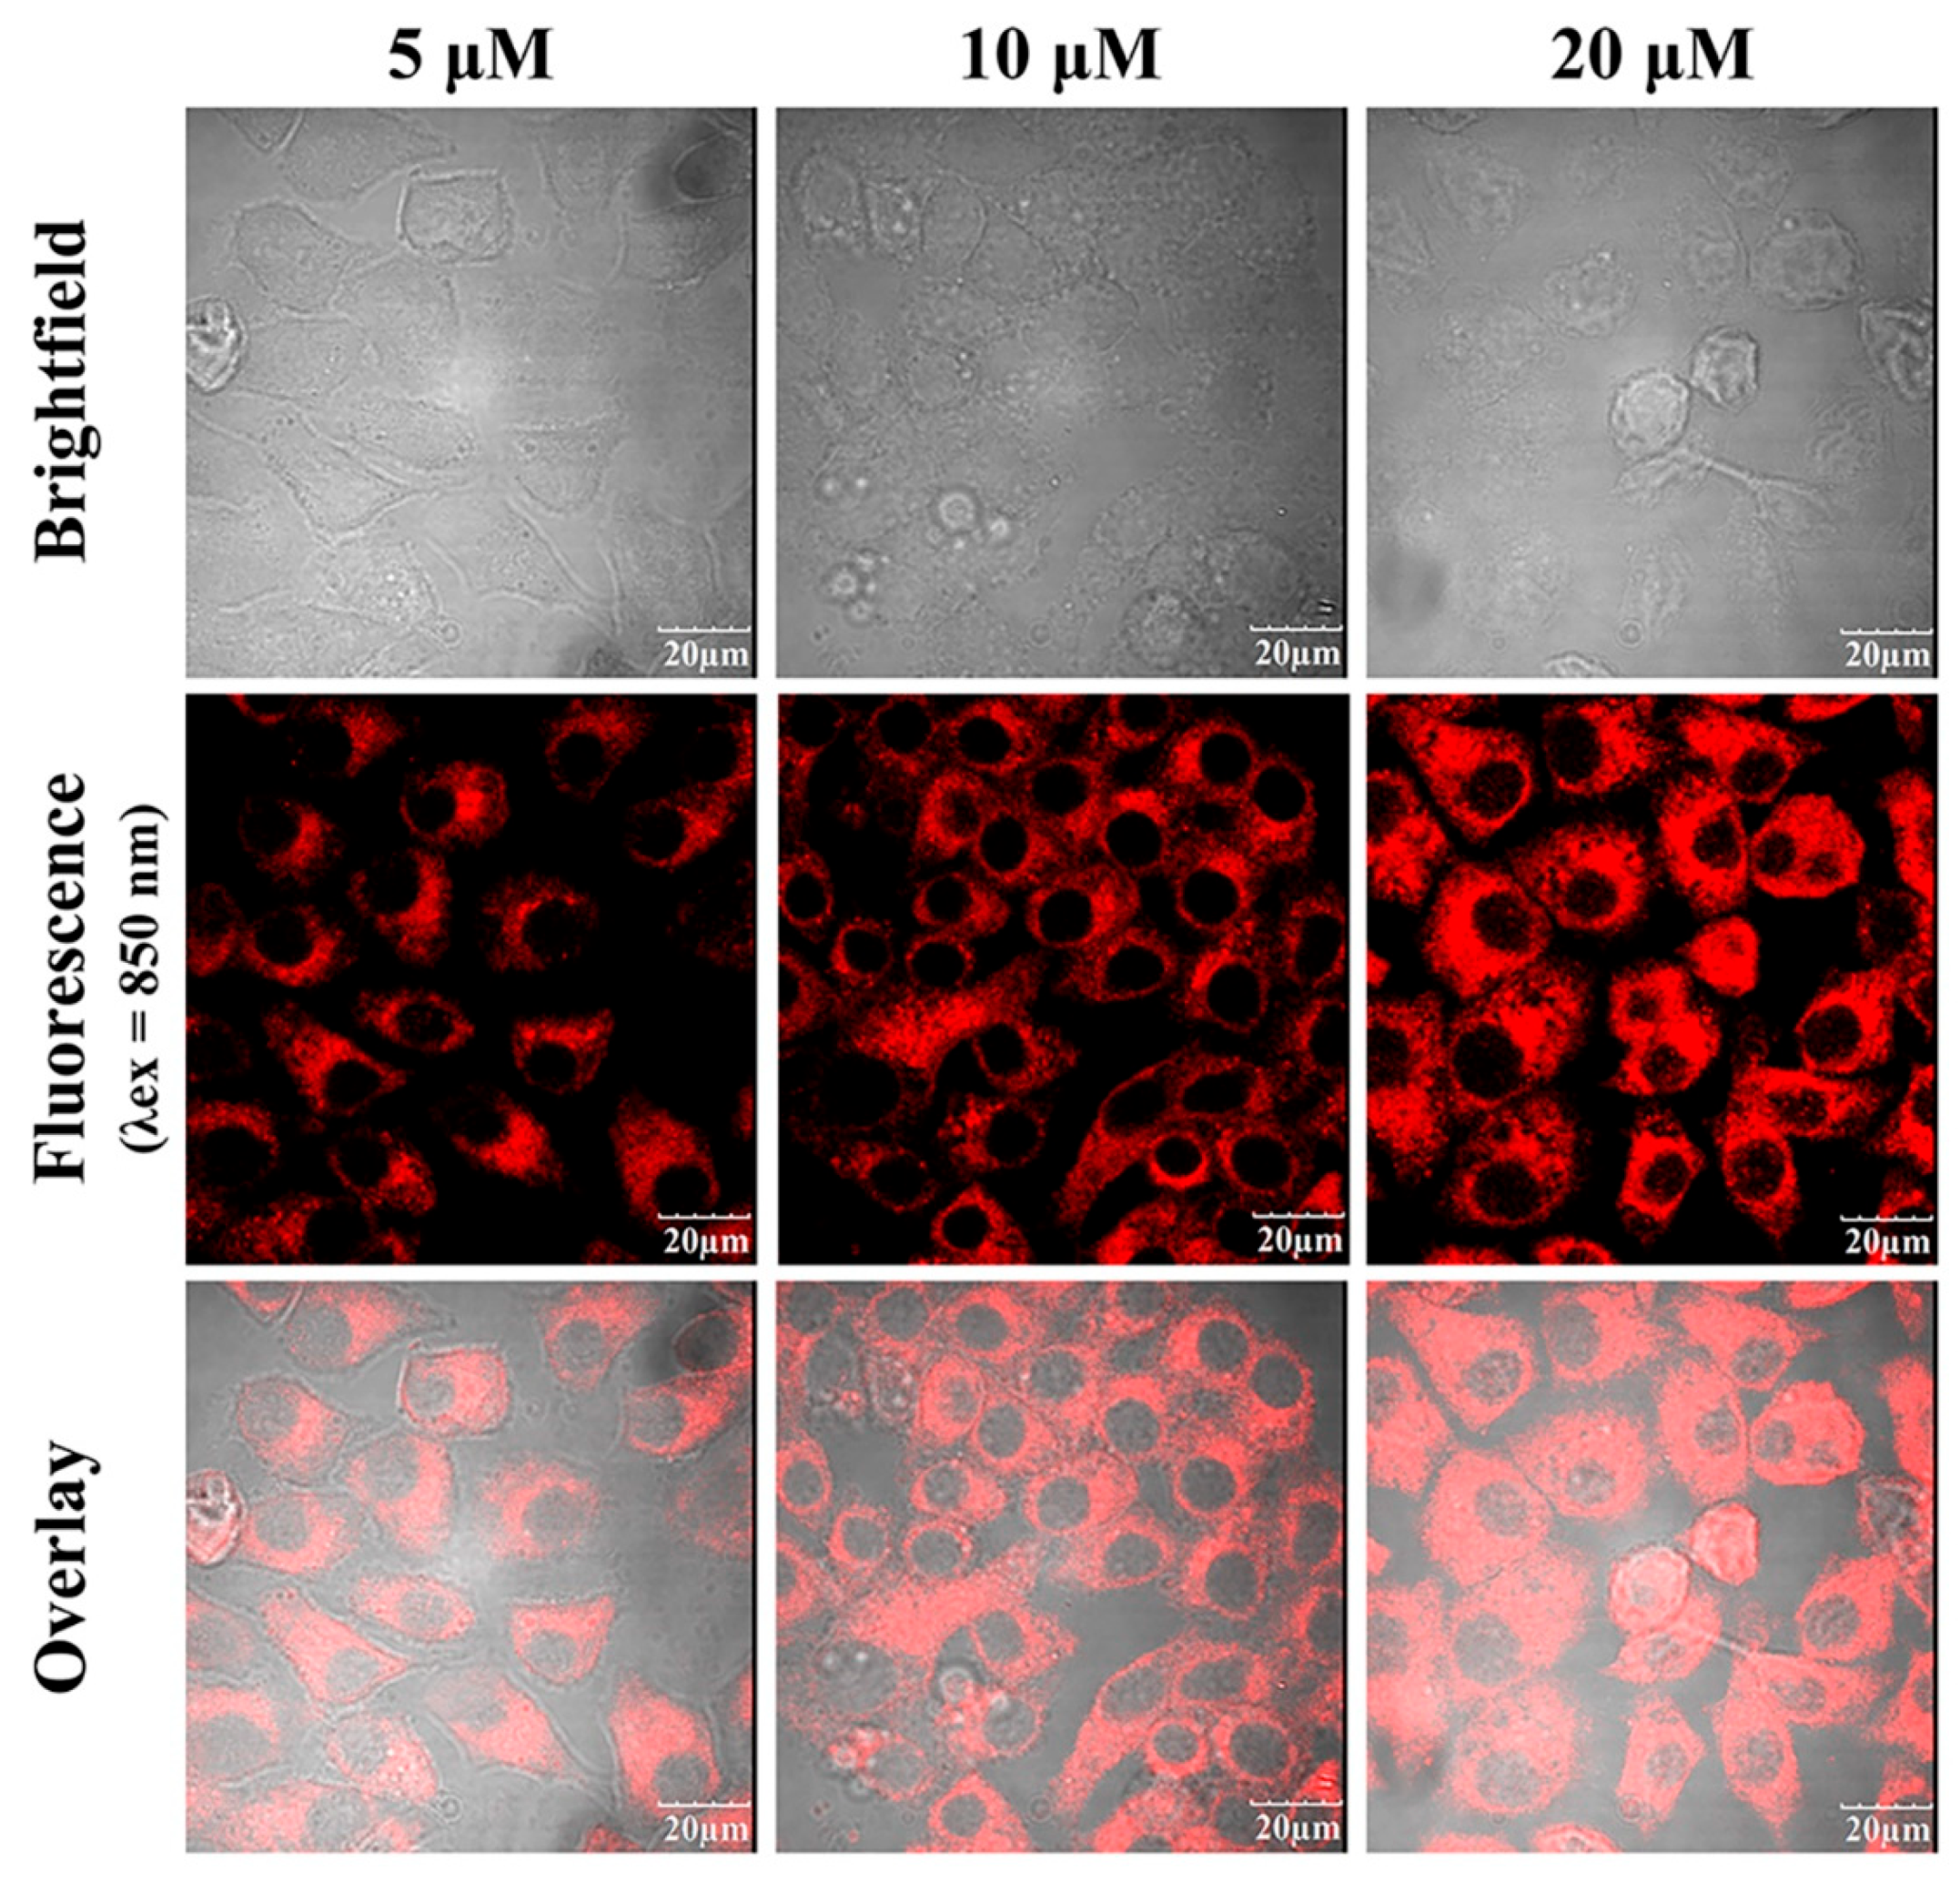
Figure 9.
Two-photon confocal fluorescence images of HeLa cells stained with different concentrations of the fluorescent dye HO-PPV-MePy (5, 10 and 20 μM). From left to right: different HO-PPV-MePy concentrations. From top to bottom: bright field images, fluorescence images, and overlay images. (λex = 820 nm, red channel emission wavelength, λex≥575 nm) Scale bar: 20 μm.
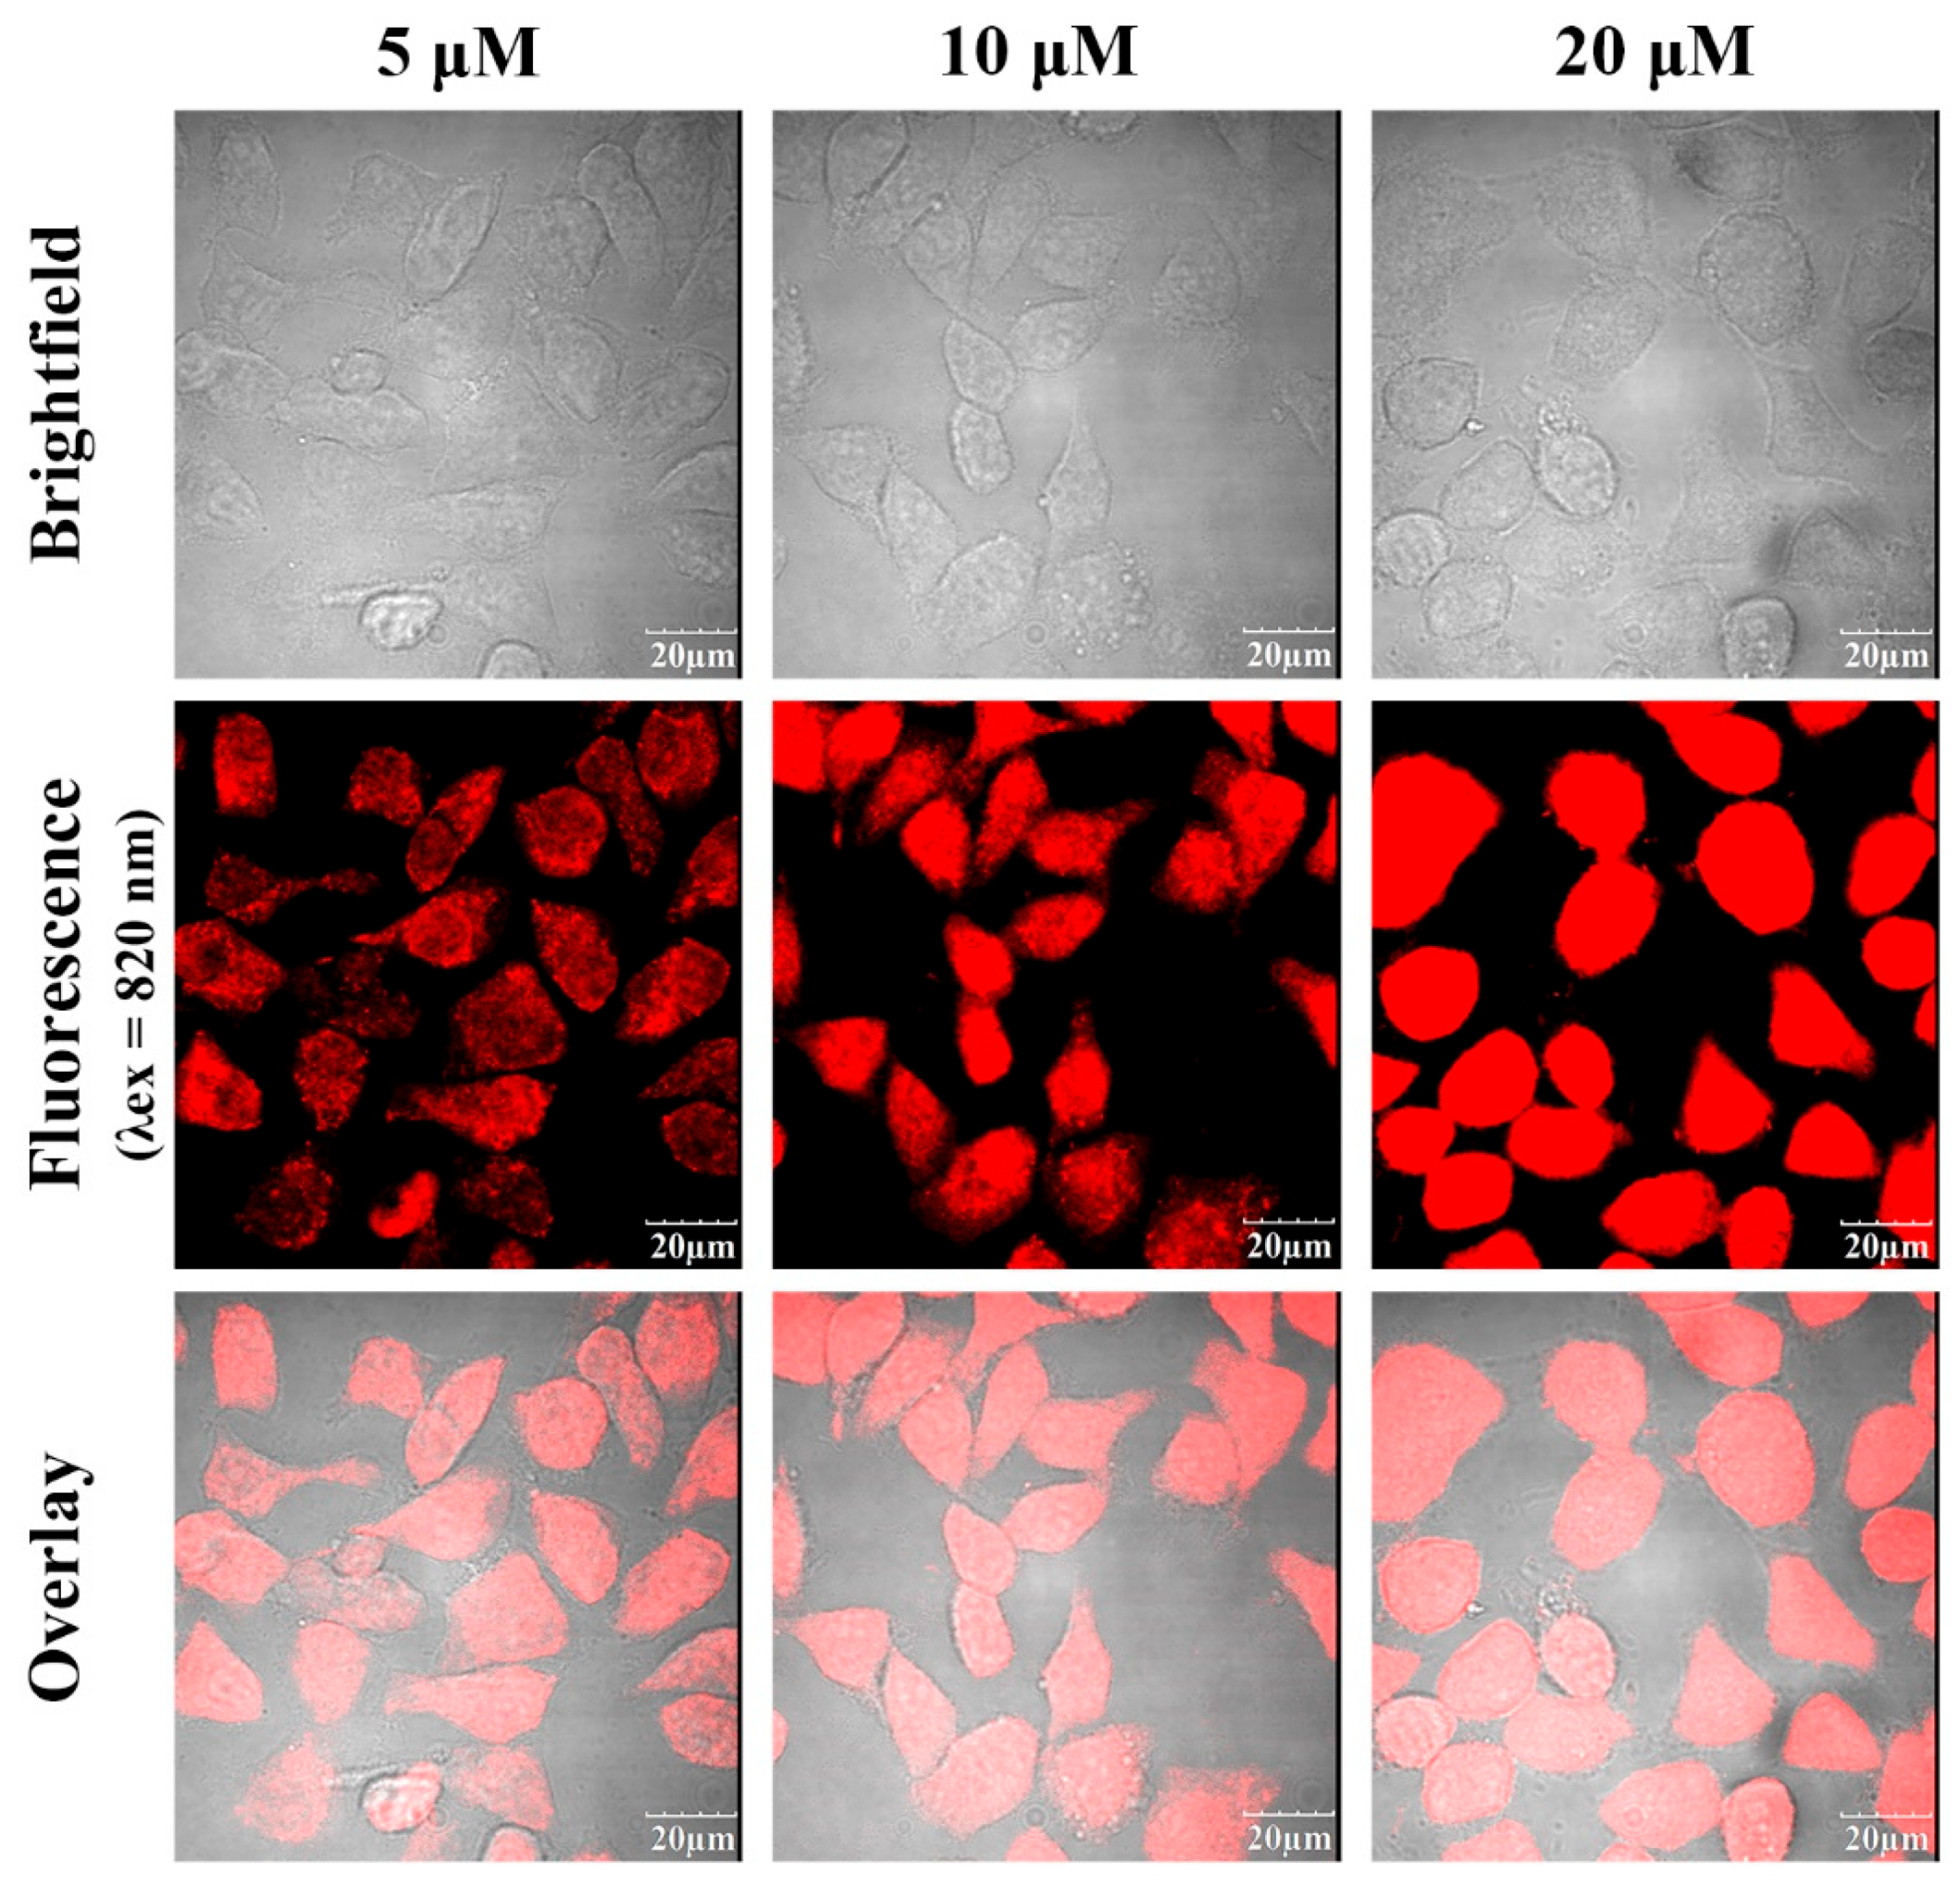
Figure 10.
One-photon confocal fluorescence images of HeLa and HepG2 cells stained with different concentrations of the fluorescent dye HO-PPV-MePy (10 and 20 μM). From left to right: different HO-PPV-MePy concentrations with HeLa and HepG2 cells, respectively. From top to bottom: bright field images, pseudocolored fluorescent images, and overlay images. (λex = 405 nm, red channel emission wavelength, λem = 700 -740 nm) Scale bar: 50 μm.
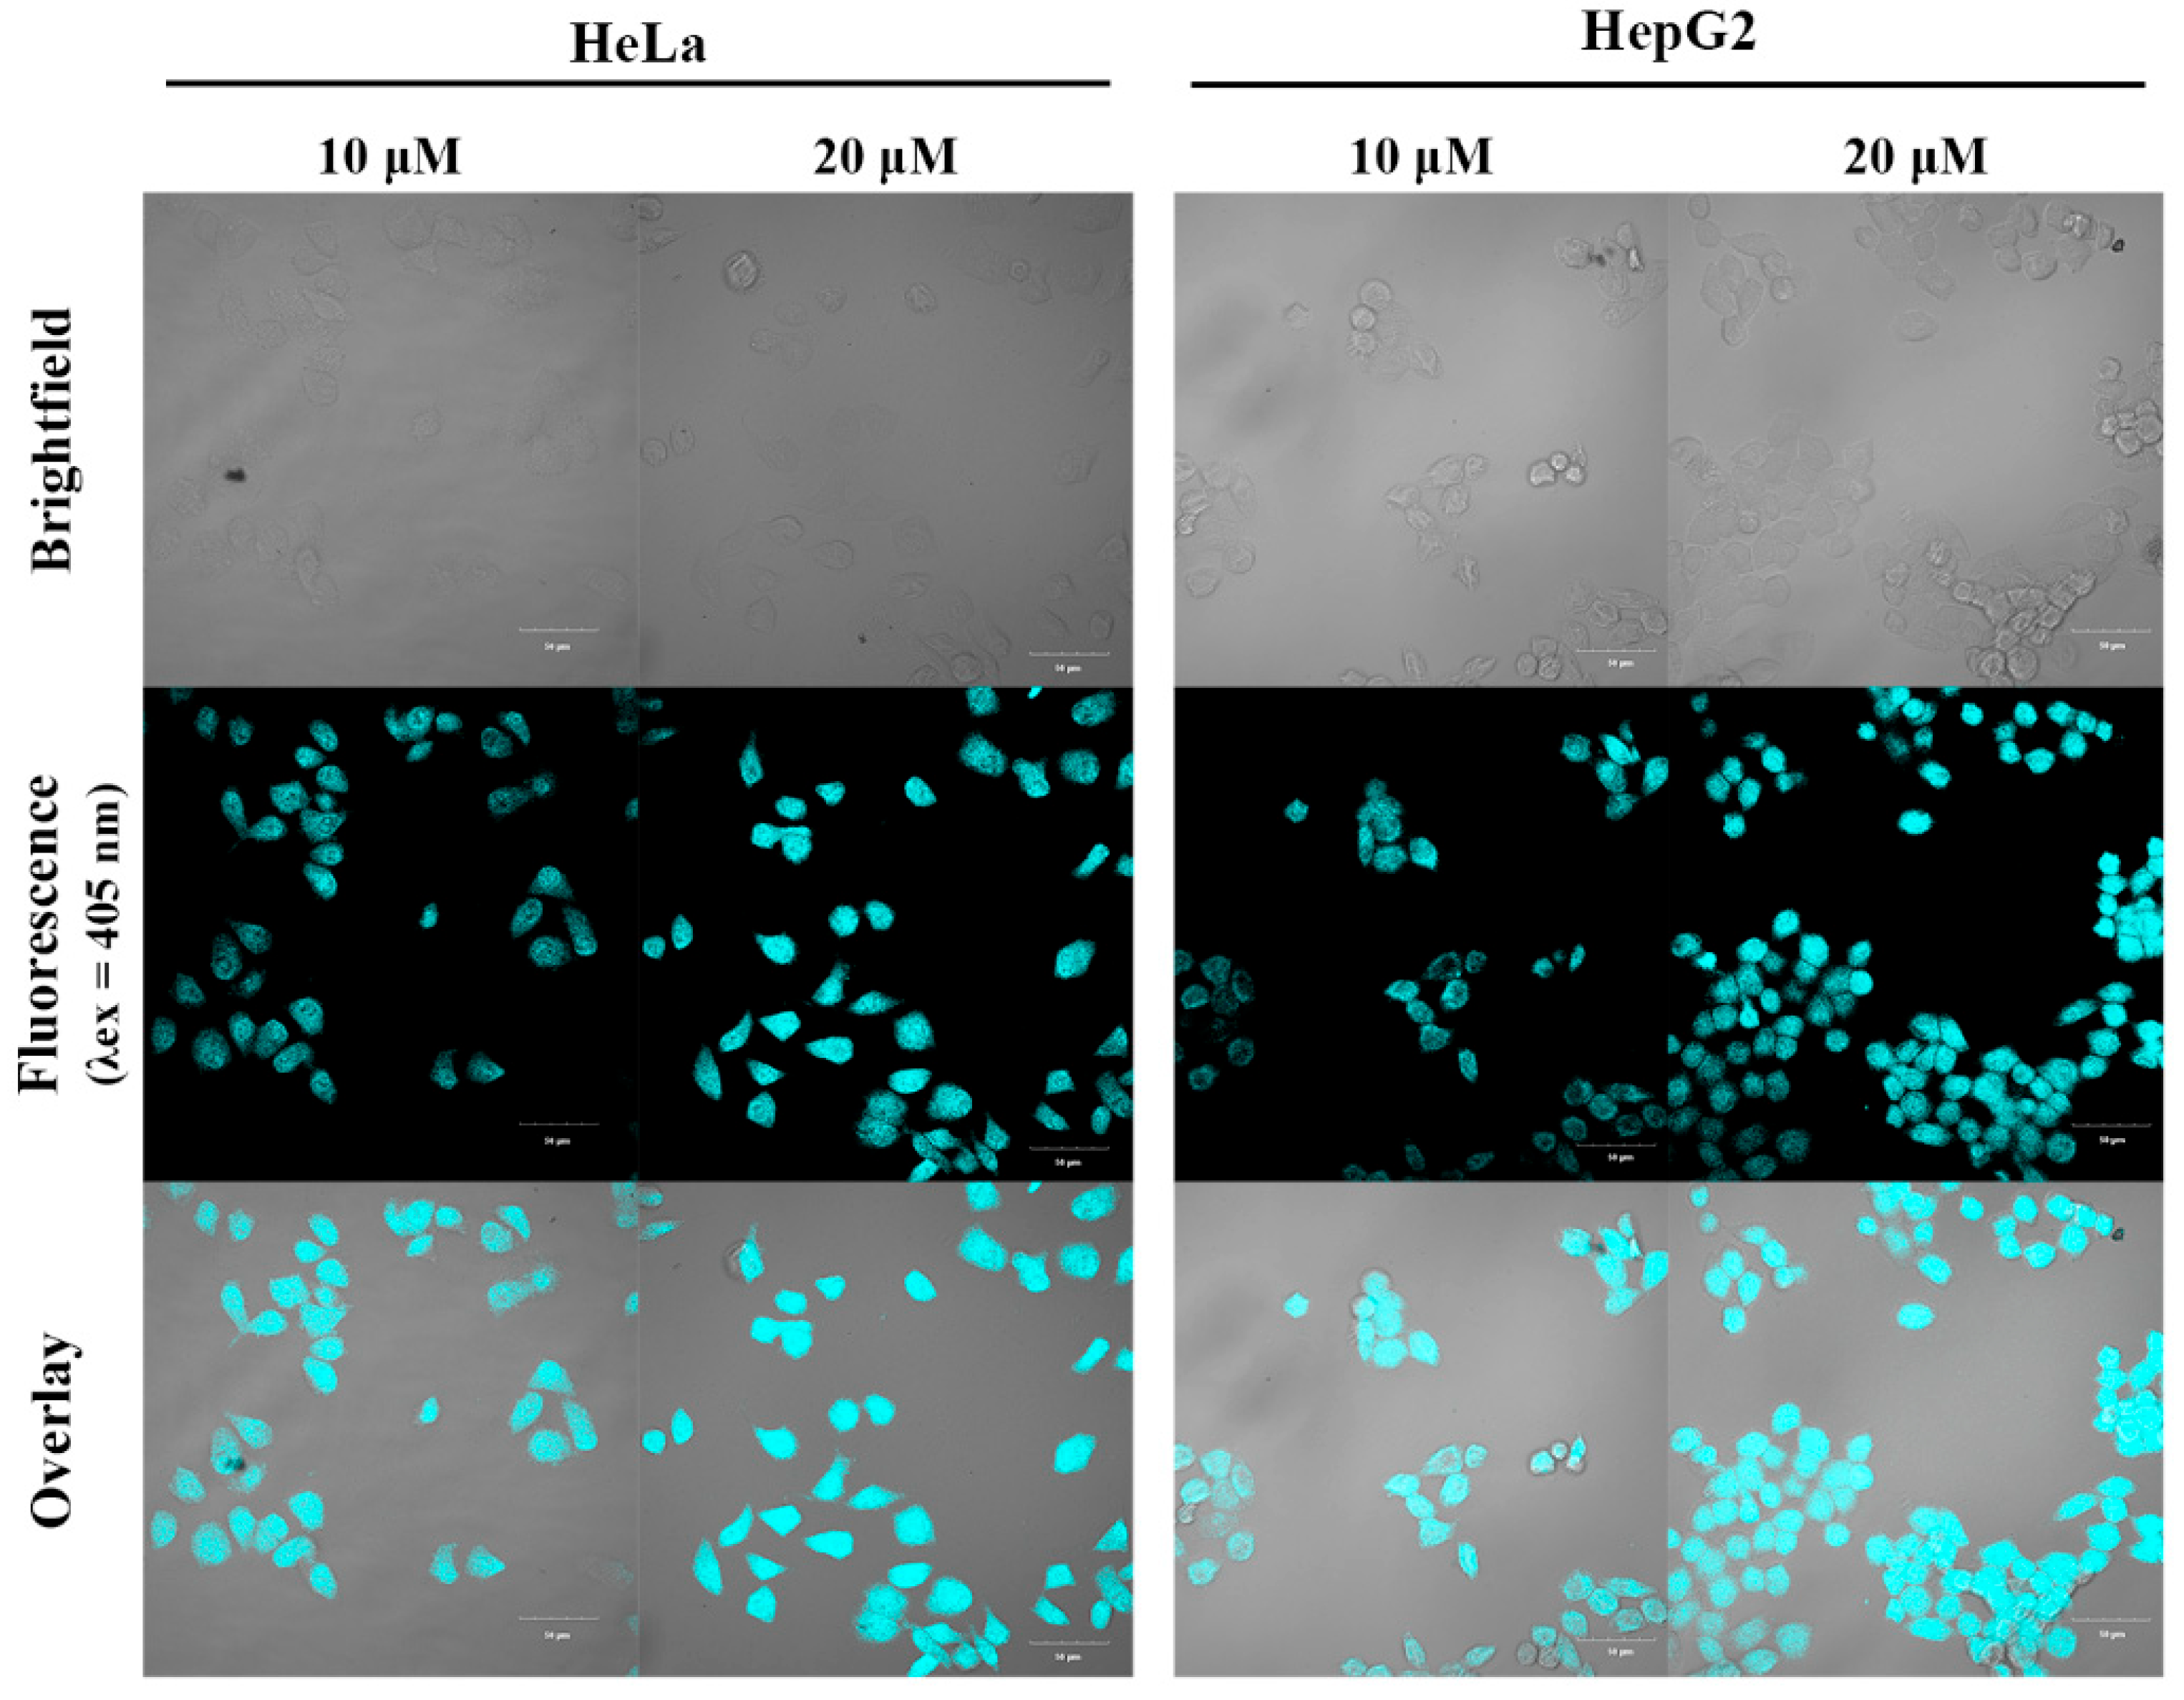
Figure 11.
Two-photon confocal fluorescence images of HeLa and HepG2 cells stained with different concentrations of the fluorescent dye HO-PPV-EtBT (5, 10 and 20 μM). From left to right: HeLa and HepG2 cells. From top to bottom: bright field image, fluorescence image, and superimposed image. (λex = 820 nm, red channel emission wavelength, λex≥575 nm) Scale bar: 20 μm.
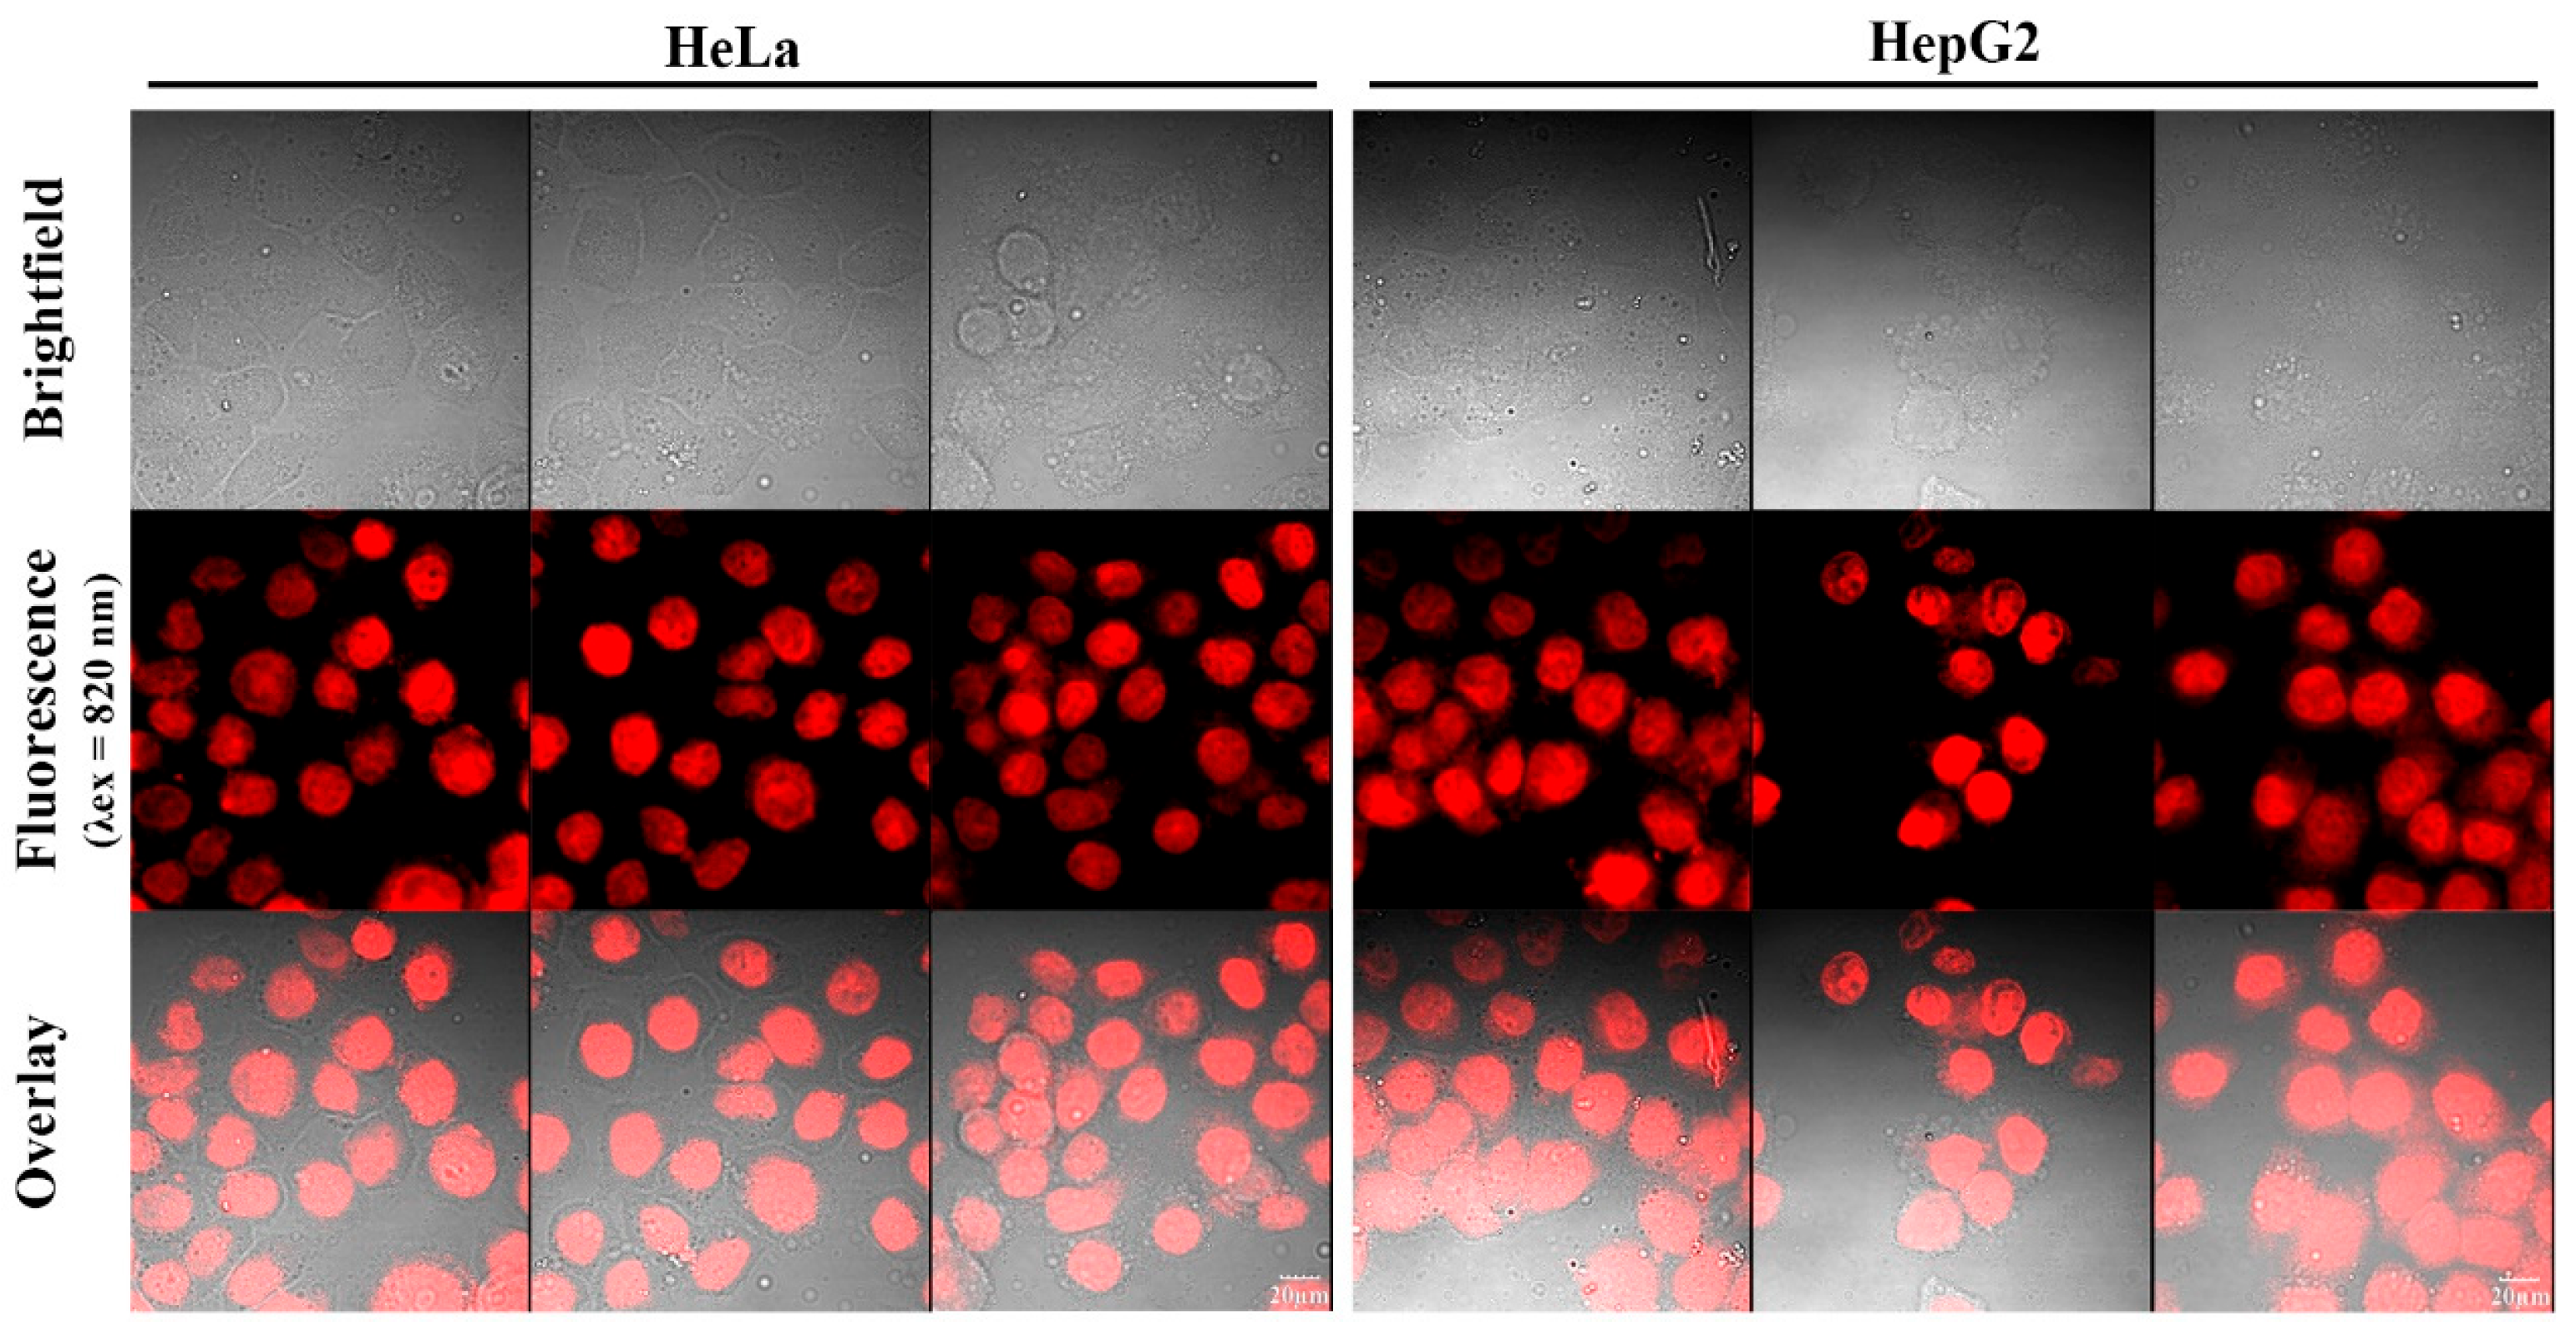
Figure 12.
Subcellular organelle colocalization of HO-PPV-EtBT. Confocal fluorescence images of HepG2 cells co-stained with HO-PPV-EtBT (10 μM) and Hoechst 33342 (A1-A4), ER-Tracker Green (B1-B4), Mito Tracker Green (C1-C4) or Lyso-Tracker Green (D1-D4) for 30 min respectively. HO-PPV-EtBT: λex/λem = 575 nm/730 ± 25 nm; Hoechst 33342: λex/λem = 405 nm/445 ± 25 nm; ER-Tracker Green, Mito-Tracker Green, Lyso-Tracker Green: λex/λem = 488 nm/525 ± 25 nm. Scale bar: 25 μm.
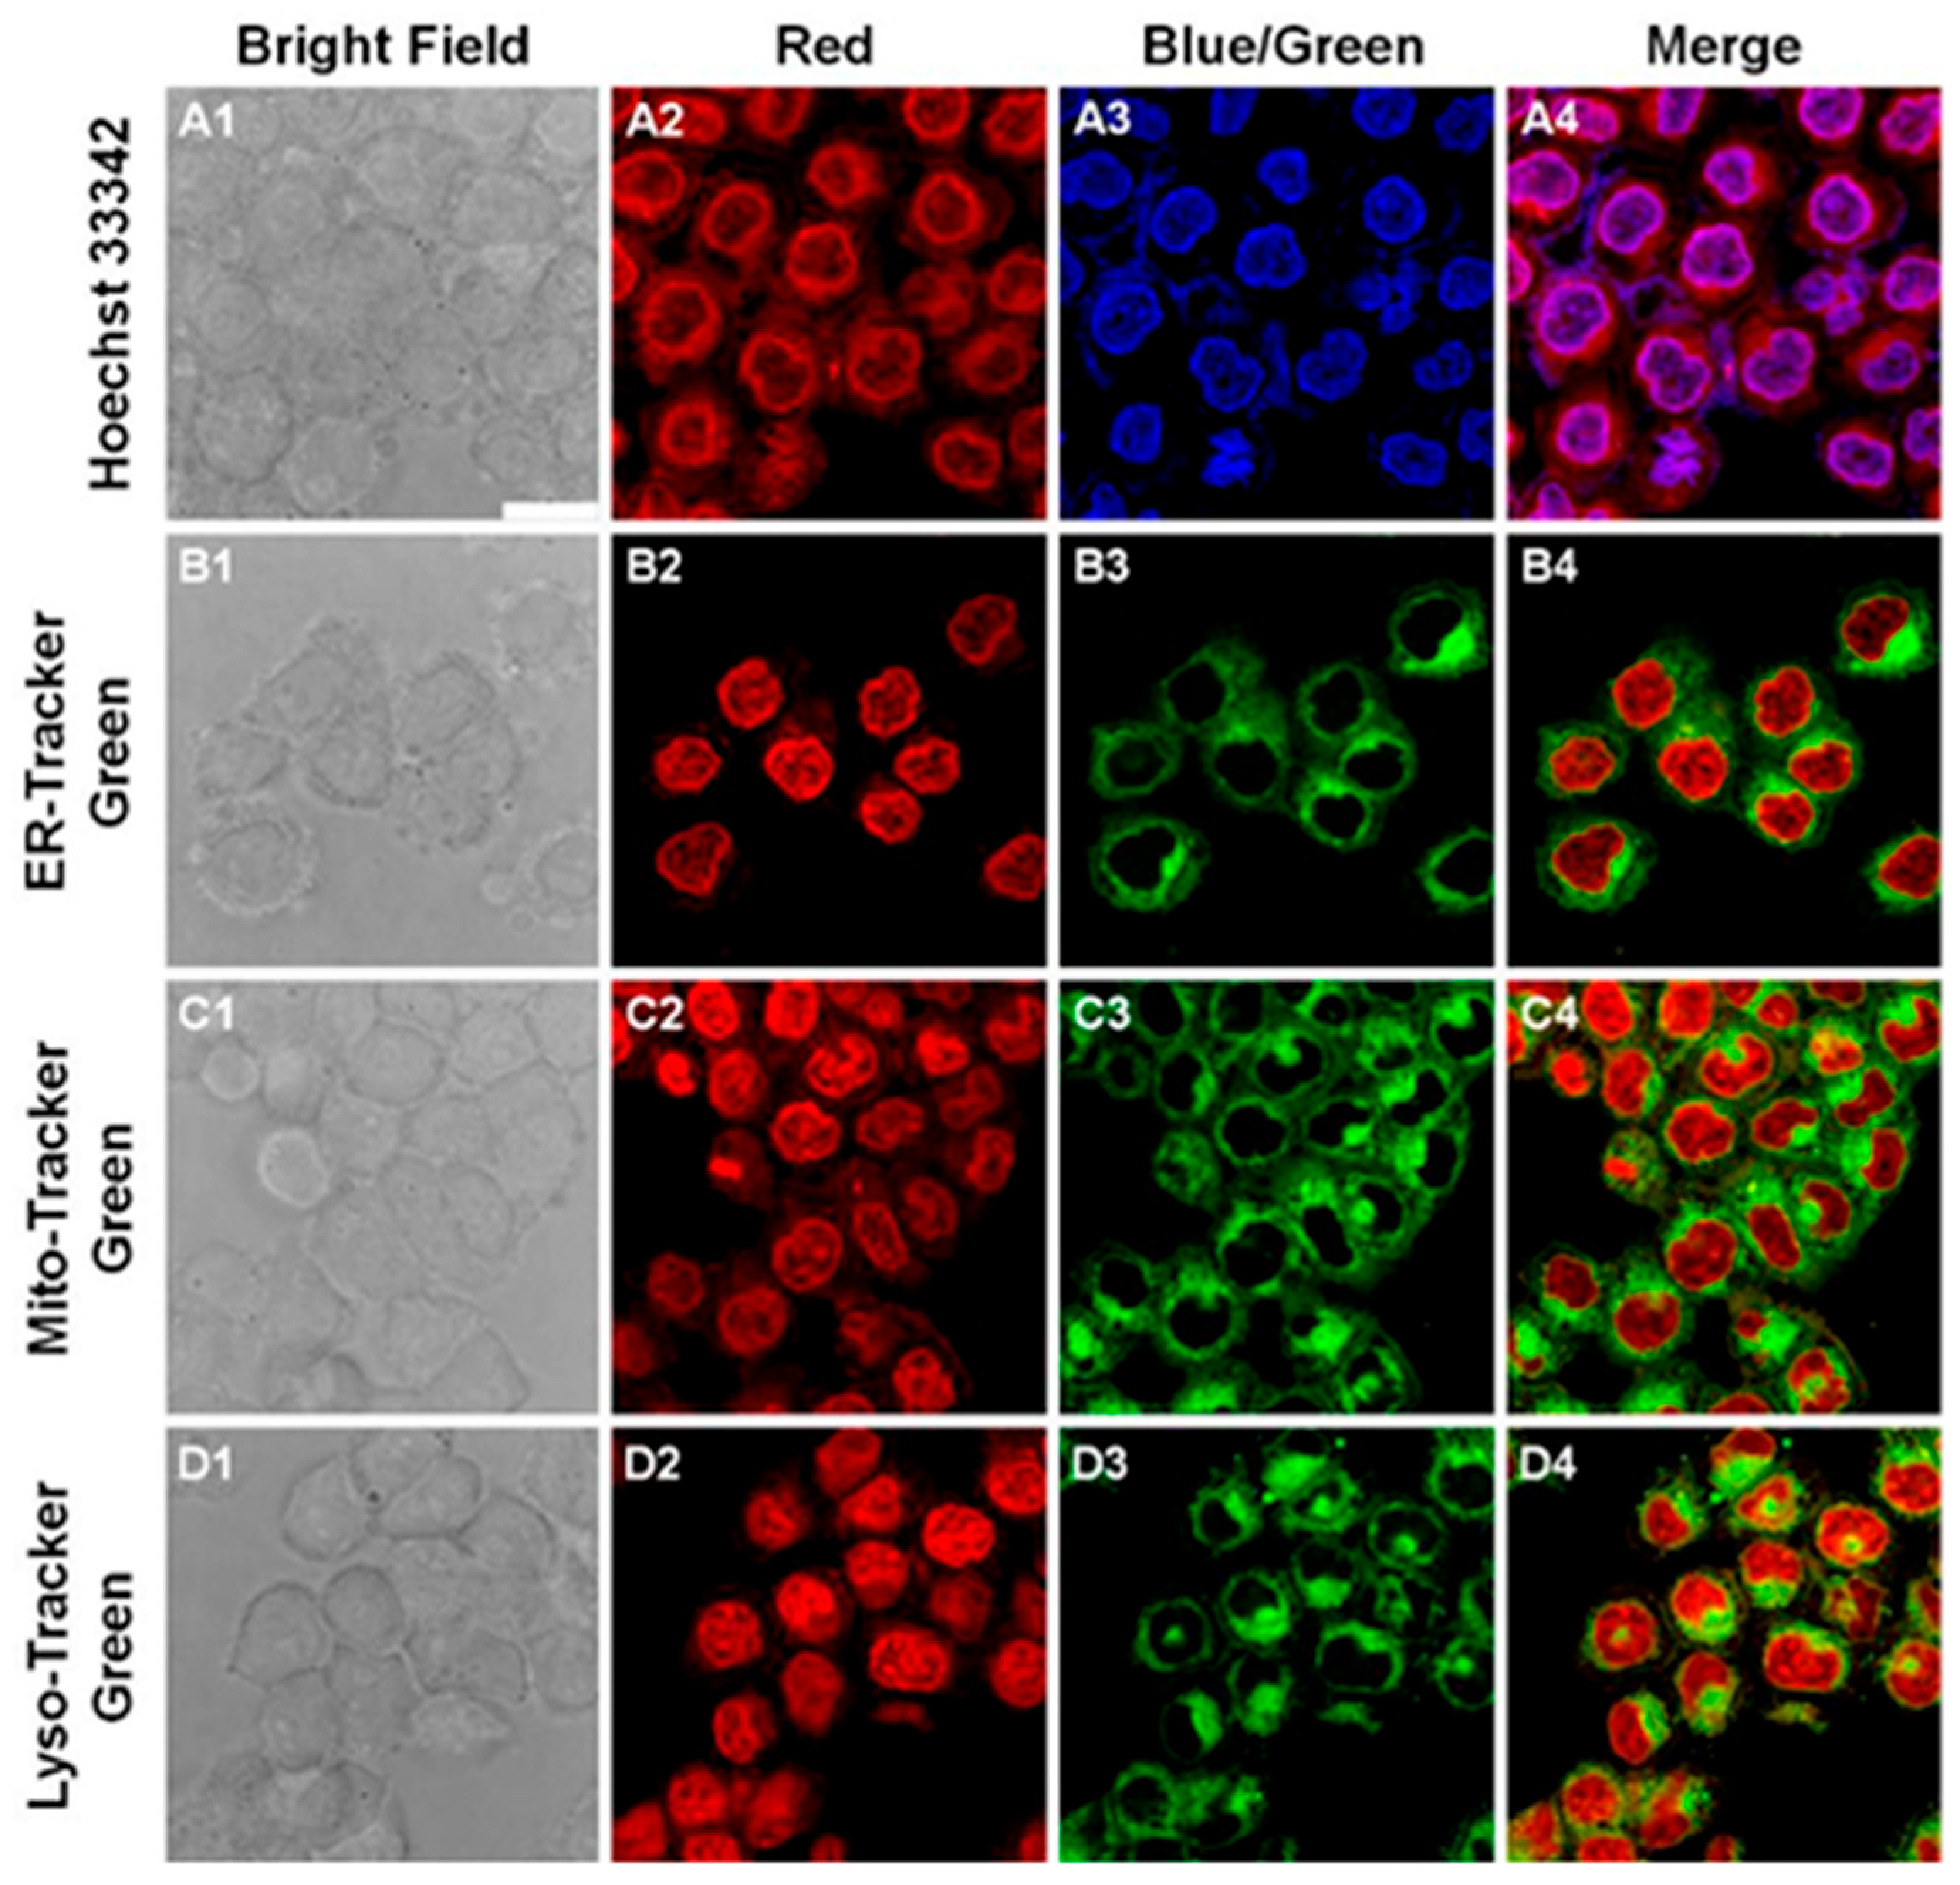
Figure 13.
The photostability experiments of HO-PPV-EtBT, Hoechst 33342, and Mito Tracker Green HepG2 cells were co stained with Hoechst 33342 (1 μ M), Mito Tracker Green (500 nM), and HO-PPV-EtBT (10 µ M) for 30 minutes, and then images at different time points were obtained by continuous scanning in chronological order. From left to right: 0 1 2 3 4 5. 6 minutes. From top to bottom, they are the blue channel, green channel, red channel, and bright field. Ruler: 50 μ m.
Disclaimer/Publisher’s Note: The statements, opinions and data contained in all publications are solely those of the individual author(s) and contributor(s) and not of MDPI and/or the editor(s). MDPI and/or the editor(s) disclaim responsibility for any injury to people or property resulting from any ideas, methods, instructions or products referred to in the content. |
© 2025 by the authors. Licensee MDPI, Basel, Switzerland. This article is an open access article distributed under the terms and conditions of the Creative Commons Attribution (CC BY) license (http://creativecommons.org/licenses/by/4.0/).
Copyright: This open access article is published under a Creative Commons CC BY 4.0 license, which permit the free download, distribution, and reuse, provided that the author and preprint are cited in any reuse.


