
Submitted:
29 April 2025
Posted:
06 May 2025
You are already at the latest version
Abstract
This study proposes a methodology for assessing and enhancing vertical partitions' airborne sound insulation performance by incorporating the indoor environment's geometric configuration and material characteristics into the analysis. An experimental campaign was carried out to verify whether the real partition complies with the minimum acoustic requirements and to validate the results obtained from the predictive model, subsequently used to evaluate the acoustic performance of alternative configurations. Specifically, a case study was conducted on an existing wall separating two laboratories at the University of Calabria (Italy), where experimental measurements revealed that the current structure fails to meet the minimum acoustic insulation requirement set by Italian regulation. To evaluate the potential improvement in acoustic performance resulting from the use of alternative structures, predictive modelling based on UNI EN ISO 12354-1 was carried out. In the simulations, the laboratories were modelled according to their actual geometry, and different types of vertical partitions between the two spaces were assessed, including commercially available heavyweight masonry walls, lightweight gypsum-based systems, drywall linings, and four innovative configurations. In addition to acoustic performance, implementation costs were also considered. Among the commercial systems, the highest-performing solution achieved a R'w of 58.0 dB for €168.9/m², while a cost-effective innovative solution based on double gypsum boards reached a R'w equal to 51.4 dB with a cost of €65.9/m².
Keywords:
experimental measurements
; acoustic insulation
; acoustic performances
; parametric study
; implementation costs
1. Introduction
The control of noise in indoor environments is a critical challenge in modern architecture [1], engineering [2], and urban planning [3,4]. The presence of unwanted sound, or noise pollution, can significantly affect comfort [5], productivity [6], and health [7] in various settings, including residential, office, and industrial spaces [8]. With the increasing densification of urban areas and the widespread adoption of open-plan spaces, the need for effective acoustic management has become more pressing than ever [9,10]. Consequently, the study and development of acoustic enhancement strategies are crucial for mitigating the adverse effects of noise and ensuring acceptable indoor sound quality [11].
Acoustic enhancement strategies generally fall into two categories: sound absorption and sound insulation [12]. Sound absorption involves reducing the reflection of sound waves within a space, thereby improving the overall acoustic environment [13]. This is particularly relevant for reducing reverberation times and enhancing speech intelligibility. On the other hand, sound insulation focuses on preventing the transmission of sound from one space to another, which is essential for ensuring privacy and reducing disturbances [14,15]. While significant research has been conducted on developing materials for sound absorption and insulation, challenges persist, especially in designing effective solutions that balance economic and functional constraints.
One of the most significant challenges in indoor acoustic management is the presence of partition walls that inadequately isolate noise between adjacent spaces [16]. Such partitions, commonly found in office buildings, educational institutions, and healthcare facilities, often fail to provide sufficient sound attenuation, leading to disruptive noise transfer between rooms [17]. The impact of poor acoustic insulation is well-documented, with studies indicating that excessive noise exposure in workplaces can lead to reduced cognitive performance, increased stress levels, and lower job satisfaction. In residential settings, inadequate sound insulation can compromise privacy and reduce the overall quality of life. In particular, Araújo Alves et al. [18] examine the impact of low-frequency noise on human health, highlighting how this type of noise can cause discomfort and long-term non-auditory effects, despite the human ear’s low sensitivity to these frequencies. Pawlaczyk-Luszczyńska et al. [19] employ three different assessment methods for low-frequency noise in workplaces, which can be a source of disturbance for workers. Van Kempen et al. [20] present a systematic review on the effects of environmental noise on the cardio-metabolic system, contributing to the update of WHO guidelines on environmental noise for the European region.
Over the years, numerous methods have been developed to enhance the acoustic performance of partitions, including the use of composite materials [21], decoupling techniques, and resonant absorbers. Traditional solutions, such as increasing the mass of walls or incorporating air gaps [22], remain effective but may not always be feasible due to space or weight constraints. More recently, researchers have explored the use of advanced materials, such as metamaterials and porous absorbers, which offer promising results in terms of both sound absorption and insulation [23]. Martellotta et al. [21] discuss the evolution of materials with sound-absorbing or sound-insulating properties, highlighting the use of innovative composite materials to enhance acoustic performance. Arjunan et al. [23] examine the use of acoustic metamaterials for sound absorption and insulation in buildings, discussing how these materials can complement traditional solutions to achieve acoustically efficient designs. Qu et al. [24] explore the design and application of lightweight partitions made of composite materials with high sound insulation properties, specifically in hotel interior spaces. Moravec et al. [22] analyse how different partition structure compositions influence sound insulation, considering factors such as the surface weight of materials, the number of layers, and the presence of air gaps.
The review by Tao et al. [25] provides an overview of recent advancements in acoustic materials and noise control strategies, including the use of polyurethane foams, sandwich panels, and textile materials for sound absorption. Zhao et al. [26] explore the use of “acoustic black holes” in structural design for vibration and noise control. Acoustic black holes are conical profiles that reduce the phase and group velocities of waves, offering new possibilities for structural noise control. Oyelade et al. [27] examine sound transmission loss in double-layer partitions filled with lateral local resonators, providing insights into strategies for improving sound insulation in building constructions.
Caniato et al. [28,29,30] explore the energy and acoustic performance of timber in buildings, providing an overview of the potential of this material to enhance sound insulation. Additionally, they analyse the use of numerical models to predict the noise generated by service equipment in both heavyweight and lightweight timber buildings, contributing to a better understanding of sound insulation dynamics in such structures. Secchi et al. [31] present an experimental and environmental analysis of new sound-absorbing and insulating elements made from recycled cardboard, highlighting the effectiveness of sustainable materials in acoustic insulation.
Additionally, active noise control techniques, which involve the use of anti-phase sound waves to cancel unwanted noise, have been investigated as potential solutions for reducing sound transmission through partitions. Yang et al. [32] provide a comprehensive overview of active noise control algorithms in the frequency domain, analyzing signal path delays and weight adaptation, as well as their impact on the convergence and stability of the algorithms.
Current studies primarily focus on identifying the sound insulation properties of individual materials, often through laboratory measurements. However, these approaches do not account for the fact that the real-world performance of these materials depends on the context in which they are applied, including factors such as the reverberation time of the room in which they are placed. This limitation highlights the need for research that considers both material properties and their interaction with the surrounding acoustic environment. Despite the extensive research on indoor noise control, the study of the acoustic performance of building partitions still presents certain challenges, particularly in reconciling experimental validation, accurate modelling, and economic analysis. In this context, the present study introduces an approach that combines experimental measurements and acoustic simulations, leveraging the detailed geometric model of the indoor environment. The use of Echo® software to generate a model based on the actual spatial configuration of the rooms allows for overcoming the simplifications often adopted in theoretical studies, improving the accuracy of simulations and making the results more representative of real-world conditions. Another distinguishing feature of this research is the comparative analysis of the acoustic performance of different construction solutions, achieved by varying the partition structures between the noise-emitting and the noise-receiving environments. While many studies focus on innovative materials in isolation, without considering their practical application, this study evaluates the effectiveness of different solutions in a realistic scenario, providing data directly applicable to the building sector. This approach not only identifies the most effective configurations in terms of sound insulation but also assesses the economic impact of different solutions, an aspect often overlooked in scientific literature. This work aims to provide a methodological framework for the design and optimization of building partitions, bridging the gap between theoretical research and practical applications. By integrating various acoustic treatment strategies, the paper seeks to provide actionable insights for architects, engineers, and policymakers aiming to design quieter and more comfortable indoor spaces.
A methodological approach is proposed to evaluate the acoustic performance of partition walls. Section 2 details the methodology, including the description of the procedures for assessing the sound insulation index using both experimental measurements and theoretical models, the case study and the presentation of improvement solutions. Section 3 presents the results obtained, including the sound pressure levels, the reverberation time, and the apparent airborne sound insulation index of the actual partition measured experimentally, as well as the theoretical acoustic outcomes of the proposed enhancements. Finally, Section 4 outlines the conclusions.
2. Materials and Method
This section describes the procedure followed to determine the improvement in the apparent airborne sound insulation index of a vertical partition, achieved through the implementation of commercial or innovative sound-insulating solutions. To this end, an experimental campaign was conducted to assess the acoustic performance of the existing partition under investigation. The results were used both to verify whether the in-situ wall complies with the national regulatory limits DPCM 05/12/1997 [33], and to validate the outcomes of a predictive model. The same model was then used to evaluate the acoustic performance of the proposed alternative solutions.
2.1. Experimental Determination of the Apparent Airborne Sound Insulation Index
To experimentally determine the apparent airborne sound insulation index of the vertical partition, the procedure described in UNI EN ISO 16283-1 [34] was followed. Specifically, the standard defines the following steps:
- Use a dodecahedral source to generate pink noise in the source room.
- Measure the sound pressure levels at a minimum of five random positions in both the source room and the receiving room. Measurements must be taken at distances greater than 1 meter from any room surfaces and performed in third-octave bands over the frequency range from 100 Hz to 3150 Hz.
- Turn off the dodecahedral source and measure the background noise level Lb in the receiving room.
If the difference between the combined signal and background level Lsb, and the background noise level Lb, falls between 6 dB and 10 dB, the correction of the signal level is calculated as:
If the difference is less than or equal to 6 dB in all frequency bands, the correction is equal to:
- Use an impulsive sound source to determine the reverberation time RT60 in the receiving room, measured in third-octave bands.
- Determine the apparent airborne sound insulation trend R′ in third-octave bands between the source and receiving rooms using the following equation:
In particular, for each frequency band, Lp1 and Lp2 represent the spatial-temporal logarithmic averages of the sound pressure levels measured at the five positions in the receiving and source rooms, respectively.
- Determination of the apparent airborne sound insulation index through the comparison between the experimental curve R′ and the reference curve provided by UNI EN ISO 717-1 [35].
This procedure, along with the processing of the experimental data, was implemented using the VibRum Plus® software, as illustrated in Subsection 2.8.1.
2.2. Prediction of the Apparent Airborne Sound Insulation Index
The following paragraph describes the predictive calculation method outlined in UNI EN ISO 12354-1 [36], which provides procedures for estimating the acoustic performance of buildings based on the properties of individual building elements, and defines the following expression for calculating the apparent airborne sound insulation index of a vertical partition :
where is the reference equivalent absorption area, set at 10 m²; is the area of the separating partition and represents the sound transmission coefficient of any elements eventually inserted within the partition. Rij,w represents the sound insulation index for the sound propagation path ij, and it is calculated as:
and are the sound reduction indices of the individual building components involved in the propagation path; accounts for any increase in sound reduction due to the presence of additional layers along the propagation path; is the vibration reduction index through the junction between elements, which depends on the junction type and the surface mass of the involved partitions and is the length of the junction.
As detailed in Subsection 2.8.2, the predictive calculation was implemented using the Echo® software.
2.3. Case Study
The acoustic analysis was carried out with reference to the vertical partition wall separating two adjacent laboratories at the University of Calabria, Rende (Italy). The first room, identified as the source room, is a technical space, while the adjacent room, designated for office use, represents the receiving room. Figure 1 highlights in red the vertical partition under investigation, which consists of 2 cm thick plywood panels enclosing an unventilated air cavity of 6 cm thickness. The stratigraphy of the remaining building elements is described in detail in Section 2.8.2.
2.4. Measurement Equipment
The measurements were carried out using a Svantek 979 integrating sound level meter, equipped with a condenser microphone and calibrated with a certified Class 1 acoustic calibrator. The noise was generated using a 12-dodicifacce DF02AD dodecahedral loudspeaker (see Figure 4).
Signal sampling was carried out without any weighting (Z-weighting mode). All data acquisitions were performed in third-octave bands, as required by the regulation. The integration interval and measurement duration were set to 1 second (Slow time constant) and 15 seconds, respectively. Regarding the measurement of the reverberation time in the receiving room, the integration interval and duration were set to 0.125 seconds (Fast time constant) and 1 second, respectively.
2.5. Commercially Available Improvement Walls
Several commercially available sound-insulating materials were evaluated, produced by three companies operating in the acoustic sector (Isolmant, FIBRAN and Fermacell).
With regard to Isolmant, the walls are acoustically insulated using a panel made of recycled polyester-based technical textile fiber (see Figure 5). The wall configurations analyzed are as follows:
- Perfetto Special 1 features a total thickness of 30 cm and consists of a 15 cm thick masonry block layer, a 5 cm air cavity containing 3 cm of insulating material, and a second masonry layer of 10 cm. Additionally, an elastic joint between the wall and the floor is provided by means of a perimeter acoustic decoupling strip, in order to reduce flanking sound transmission.
- Perfetto Special 2 has an overall thickness of 26 cm and is composed of a 12 cm thick masonry block layer, a 4 cm cavity with 3 cm of insulation, and a 10 cm thick masonry block layer.
- Perfetto Special CG comprises a 2 cm plaster layer, 8 cm of hollow clay brick, a 2 cm base coat, and a 7.5 cm metal frame filled with 4.5 cm of insulation and covered with a double 2.5 cm gypsum board. The geometrical configuration of the metal support frame is illustrated in Figure 6.
The main characteristics used for the determination of the apparent airborne sound insulation index of the Isolmant analysed wall configurations are reported in Table 1 [37].
FIBRAN proposes lightweight and less invasive solutions compared to those developed by Isolmant, employing gypsum plasterboard panels and rockwool as the insulating material. Specifically:
- The FIBRAN B-040/A13 – 1 wall system has a total thickness of 10 cm and consists of two FIBRANgyps A13 plasterboards, each 1.3 cm thick, a 4 cm layer of FIBRANgeo B-040 rockwool, a 1 cm air cavity, and other two plasterboards, also 1.3 cm thick.
- The FIBRAN B-050/SUPER13 configuration follows the same stratigraphy as the previous one, while featuring two FIBRANgyps SUPER13 plasterboards, a 5 cm thick layer of FIBRANgeo B-050 rockwool, and a 2.5 cm air cavity.
- The FIBRAN B-040/A13 – 2 wall features the same materials as the first configuration, with a 5 cm thick air cavity, bordered this time by two layers of FIBRANgeo B-040 rockwool, each 4 cm thick.
The main characteristics used for the determination of the apparent airborne sound insulation index of the FIBRAN analysed wall configurations are reported in Table 2 [38].
To avoid the demolition of the existing wall and the construction of a new partition, Fermacell offers the possibility of improving acoustic performance through the installation of an additional acoustic partition, consisting of a 1 cm thick gypsum-fibre board and a 5 cm rock wool panel placed in the air cavity [39], as shown in Figure 7. In the predictive calculations, it was assumed that this additional partition is applied to both sides of the existing wall.
2.6. Novel Improvement Proposals
This section presents and analyses innovative structural proposals aimed at improving the apparent airborne sound insulation index to meet regulatory requirements, while being more cost-effective. Specifically, four different types of walls were studied, as described below:
- Type A: masonry wall consisting of a 2 cm thick plaster layer, 8 cm thick perforated brick wall, and another 2 cm thick plaster layer.
- Type B: masonry wall of Type A with an additional partition on the side of the receiving room, consisting of 1.3 cm thick drywall layer, 5 cm thick layer of sintered expanded polystyrene, and 2 cm thick non-ventilated air cavity.
- Type C: partition wall consisting of two plasterboard layers, each 2.6 cm thick, enclosing a 5 cm thick rock wool panel and a 5 cm thick non-ventilated air cavity.
- Type D: partition wall consisting of two plywood layers, each 3 cm thick, enclosing a 5 cm thick rock wool panel and a 5 cm thick non-ventilated air cavity.
The main characteristics for determining the index of the four analyzed walls are shown in Table 3.
2.7. Cost Analysis
Based on manufacturer catalogues [40,41,42,43] and a market analysis, the cost per square meter was estimated for each of the proposed solutions. The values reported in Table 4 refer to the complete system, including ancillary components, plasterboard panels, masonry elements, metal framework, and labour costs.
2.8. Software
2.8.1. On-Site Measurements Processing Software
For processing the measurements, the VibRum Plus® software was used, which implements the reference standard UNI EN ISO 16283-1:2018 in order to determine the apparent airborne sound insulation index . To this end, the software compares the sound insulation trend R’ obtained from the processing of the experimental measurements, with the limiting curve from the UNI EN ISO 717-1 standard reported in Table 5. The software requires both the volume of the rooms and the surfaces of the building components.
2.8.2. Predictive Calculations Software
The predictive calculations of the sound insulation indices for the proposed vertical partitions were conducted using the ECHO® software, in which the volumes and surfaces defining the emitting and receiving rooms were reconstructed. Furthermore, the stratigraphy, surface mass, and sound insulation performance Rw of each building components were specified. Figure 8 shows the characteristics of the vertical partition and the building components of the two rooms, as actually installed on-site.
After validation, the characteristics of the vertical partition were modified according to the proposed and analyzed construction typologies and, for each of them, the software computed the corresponding apparent airborne sound insulation index .
As indicated in Eq. (5), to evaluate the term Rij along each sound propagation path i-j between the two rooms, it is necessary to define the type and length of the joints, as detailed in Figure 9.
3. Results
This section presents the results obtained from the experimental campaign and processed using the VibRum Plus® software, with the aim of evaluating the apparent airborne sound insulation index of the actual vertical partition. Subsequently, the result of the predictive calculation is shown in order to assess whether the value obtained with the Echo® software is consistent with the experimentally measured outcome. Finally, the apparent airborne sound insulation index obtained through the use of commercially available solutions or innovative wall proposed in this study are presented, along with a corresponding cost estimate.
3.1. Experimental Measurement Results
Figure 10, Figure 11 and Figure 12 report the frequency-domain spectral analysis of the equivalent sound pressure levels, obtained from the spatial average of five measurements taken in the source room, the receiving room, and the background noise in the receiving room, respectively. The last bar in each graph represents the total equivalent sound pressure level. Both at the total and spectral levels (with the exception of the low frequency bands), a reduction in sound pressure levels is observed between the source and receiving rooms, as a result of the presence of the vertical partition separating the two environments.
Figure 13 shows the frequency analysis in the time domain of the RMS sound pressure levels, measured in one-third octave bands in the receiving room for the purpose of determining the reverberation time. For the experimental measurement of RT, the sound pressure level drops of 10 dB, 20 dB and 30 dB were considered and, for each of them, the time corresponding to a 60 dB decay was obtained through linear extrapolation (EDT, RT20 and RT30, respectively). The RT value corresponds to the extrapolated time associated with the highest drop achievable. Table 6 reports the reverberation time RT as a function of frequency, highlighting that it slightly exceeds one second only in the frequency bands centred at 63 Hz and 80 Hz.
Using the VibRum Plus® software, the acquisitions were processed, and the UNI EN ISO 717-1 standard was implemented to determine the value of the index . Figure 14 shows the trend of the apparent airborne sound insulation trend R’ in black, and the limiting curve provided by the standard in red. The value is provided alongside the C and Ctr values, defined by the standard as the spectral adaptation terms for high and medium-low frequencies, respectively.
The value of obtained from the experimental measurements is 28 dB, and since the Italian regulations on passive acoustic performance for buildings (DPCM 05/12/1997) prescribe a value greater than 50 dB, the result show that the actual partition does not meet the acoustic insulation requirements.
3.2. Predictive Calculation Results
Using the Echo® software, the predictive calculation was conducted considering the vertical partition currently installed between the two laboratories. Figure 15 presents the results of the term Rij as a function of the sound propagation path.
The predicted value of the apparent airborne sound insulation index for the vertical partition currently used to separate the two rooms was found to be 32.1 dB, which shows good agreement with the experimentally determined value of 28 dB. This confirms that the software can be effectively used to evaluate the performance of the vertical partitions under investigation.
3.3. Commercial Improvement Proposals
Table 7 presents the index obtained from the predictive calculations along with the total cost associated with each type of analyzed vertical partition. Figure 16 shows the breakdown of the total cost into its individual contributions for each commercial solution.
As shown, the most expensive solution is the Perfetto Special 1, mainly due to the significant cost contributions of both the masonry and the insulation layer, which also provides the best acoustic performance. Conversely, the most cost-effective solution is the Fermacell partition, which, however, fails to meet the regulatory requirements and exhibits the lowest sound insulation performance. Similarly, the FIBRAN B-040/A13 – 1 system does not comply with the national standard and is also more expensive than the Perfetto CG, which is the most economical among the configurations that meet regulatory limits, with an index of 52.5 dB. In the case of FIBRAN B-040/A13 – 2, which includes a double insulating layer and results in a slightly higher cost, the regulatory threshold is met, and the value is only 0.5 dB lower than that of the FIBRAN B-050/SUPER13 configuration. However, the cost of the latter is comparable to that of the Perfetto Special 2, while its acoustic performance is 5.4 dB lower. The Perfetto Special 2 solution, which achieves an value only 1.2 dB lower than the Perfetto Special 1, is less expensive due to the use of 12 cm thick concrete blocks instead of 15 cm.
3.4. Novel Improvement Proposals
Similarly, for the innovative wall configurations proposed, Table 8 reports the results of the predicted apparent sound insulation index and the corresponding total cost for each solution. Figure 17 illustrates the cost breakdown for each wall type.
The results indicate that, compared to the currently installed wall, which provides a predicted index of 32.1 dB (with an experimentally measured value of 28 dB), the use of Wall Type A, consisting of standard uninsulated masonry, yields an acoustic performance improvement. However, it still fails to meet the regulatory requirement, achieving an index of 41.2 dB. The other three wall types exceed the minimum required value. In particular, Wall Type B, a masonry wall combined with a lining, provides the highest airborne sound insulation performance, equal to 53.8 dB. Among the configurations with an index greater than 50 dB, the most cost-effective is Wall Type C, a plasterboard partition. Wall Type D, which incorporates plywood panels, delivers a slightly higher performance of 52.7 dB, only 1.3 dB more than Wall Type C, it is the most expensive solution due to the high cost of plywood. In contrast, Wall Type C allows for a 30% cost saving relative to Wall Type B, with only a 2.4 dB reduction in the performance index. Furthermore, Wall Type C is the lightest among the proposed alternatives, with a surface mass of 51.8 kg/m², and features a compact thickness of just 15 cm.
4. Conclusions
This study investigated the improvement in the apparent sound insulation index for airborne noise as a function of the wall system used to separate two laboratories at the University of Calabria. An experimental campaign was conducted to assess the acoustic performance of the existing wall and to validate the theoretical prediction model used for evaluating alternative structural solutions. The experimental study was carried out using a Svantek 979 sound level meter equipped with a condenser microphone and a Svantek SI 312 dodecahedral sound source. Data processing was performed using VibRum Plus® software.
The results showed that the existing wall does not comply with the minimum regulatory requirement of 50 dB, exhibiting an value of 28 dB. This was compared with the predicted results obtained via the Echo® software, showing good agreement. This software was subsequently used to evaluate theoretical improvements in acoustic performance achievable with commercially available systems and innovative wall types proposed in this study. For each option, a cost analysis was also carried out to identify a cost-effective solution that meets the regulatory minimum of 50 dB.
Regarding commercial systems, the best acoustic performance was associated with the Perfetto Special 1 system, which also exhibits the highest cost. Conversely, although the use of a Fermacell lining is easy to install and inexpensive, its performance index of 47.3 dB does not satisfy the regulatory limit. The Perfetto CG system achieves an index of 52.5 dB with only a 3.08% cost increase compared to the Fermacell solution.
In terms of the proposed innovative solutions, replacing the existing wall with Wall Type A (perforated brick masonry without acoustic insulation) represents the most economical intervention and improves the sound reduction index to 41.2 dB. However, this remains below the threshold. The remaining three wall types met the regulatory limit, with a maximum difference of 2.4 dB between Wall Type B (53.8 dB) and Wall Type C (51.4 dB). Wall Type B, a masonry construction, shows a 42.9% higher cost compared to Wall Type C, which is a plasterboard partition. Moreover, Wall Type C has the lowest surface mass among the proposed solutions. Wall Type D is the least economical due to the use of plywood panels, with a cost approximately double that of Wall Type C, offering only a 1.3 dB improvement. Comparing the commercial solution Perfetto CG with the innovative Wall Type C reveals a marginal advantage of 1.1 dB in favour of the former, which comes at a 69.4% higher cost. In terms of weight and thickness, Wall Type C exhibits a surface mass of 51.8 kg/m² and a thickness of 15 cm, whereas the commercial masonry system has significantly higher values of 122 kg/m² and 22 cm, respectively.
A limitation of this study lies in the uncertainty associated with the predictive calculation model, which, despite validation against the existing wall, still requires experimental verification through real-world implementation of the proposed solutions. However, such an approach is impractical in the context of retrofitting existing environments or designing new constructions. Therefore, the presented results are of significant value in the field of building acoustics, providing technical and economic guidance for the selection of effective wall systems capable of achieving regulatory sound insulation requirements at minimized cost. Future work will involve the demolition of the current wall and the construction of the Wall Type C to evaluate its in-situ performance.
References
- Łapińska, A. , Grochowska, N., Cieplak, K., Płatek, P., Wood, P., Deuszkiewicz, P., Dużyńska, A., Sztorch, B., Głowcka, J., Przekop, R., Jóźwik, P., Gołofit, T., & Plichta, A. Architecture influence on acoustic performance, EMI shielding, electrical and thermal, properties of 3D printed PLA/graphite/molybdenum disulfide composites. Materials & Design 2024, 245, 113241. [Google Scholar] [CrossRef]
- Arias-Cárdenas, B. , Lacasta, A. M., & Haurie, L. Bibliometric analysis of research on thermal, acoustic, and/or fire behaviour characteristics in bio-based building materials. Construction and Building Materials 2024, 432, 136569. [Google Scholar] [CrossRef]
- Llorca-Bofí, J. , Heck, J., Dreier, C., & Vorländer, M. Urban background sounds under various weather conditions categorized for virtual acoustics. Journal of Environmental Management 2024, 371, 123081. [Google Scholar] [CrossRef]
- Haselhoff, T. , Schuck, M., Lawrence, B. T., Fiebig, A., & Moebus, S. Characterizing acoustic dimensions of health-related urban greenspace. Ecological Indicators 2024, 166, 112547. [Google Scholar] [CrossRef]
- Esfandiari, M.; Mohamed Zaid, S.; Ismail, M.A.; Reza Hafezi, M.; Asadi, I.; Mohammadi, S.; Vaisi, S.; Aflaki, A. Occupants’ Satisfaction toward Indoor Environment Quality of Platinum Green-Certified Office Buildings in Tropical Climate. Energies 2021, 14, 2264. [Google Scholar] [CrossRef]
- Wang, X. , Li, D., Menassa, C. C., & Kamat, V. R. Investigating the effect of indoor thermal environment on occupants’ mental workload and task performance using electroencephalogram. Building and Environment 2019, 158, 120–132. [Google Scholar] [CrossRef]
- Bluyssen, P. M. , Zhang, D., Kurvers, S., Overtoom, M., & Ortiz-Sanchez, M. Self-reported health and comfort of school children in 54 classrooms of 21 Dutch school buildings. Building and Environment 2018, 138, 106–123. [Google Scholar] [CrossRef]
- Tarrazó-Serrano, D. , Castiñeira-Ibáñez, S., Bautista, A. S., Rubio, C., & Uris, A. Optimization of acoustic subwavelength slit barrier to control low-frequency noise in industrial buildings. Journal of Building Engineering 2025, 103, 111926. [Google Scholar] [CrossRef]
- Zhang, X. , Ba, M., Kang, J., & Meng, Q. Effect of soundscape dimensions on acoustic comfort in urban open public spaces. Applied Acoustics 2018, 133, 73–81. [Google Scholar] [CrossRef]
- Ren, X. Combined effects of dominant sounds, conversational speech and multisensory perception on visitors’ acoustic comfort in urban open spaces. Landscape and Urban Planning 2023, 232, 104674. [Google Scholar] [CrossRef]
- Chen, K. , Kang, J., & Ma, H. Evaluation of healthy indoor acoustic environments in residential buildings by the occupants: A mixed-method approach. Building and Environment 2023, 246, 110950. [Google Scholar] [CrossRef]
- Arjunan, A. , Baroutaji, A., Robinson, J., Vance, A., & Arafat, A. Acoustic metamaterials for sound absorption and insulation in buildings. Building and Environment 2024, 251, 111250. [Google Scholar] [CrossRef]
- Shtrepi, L. , & Prato, A. Towards a sustainable approach for sound absorption assessment of building materials: Validation of small-scale reverberation room measurements. Applied Acoustics 2020, 165, 107304. [Google Scholar] [CrossRef]
- Chen, S. , Chen, Q., Fan, H., Liu, L., Yan, Z., Chen, Y., Luo, L., & Li, J. Lightweight, strong, and sound insulation bio-based structural material from discarded coconut wood. Construction and Building Materials 2025, 458, 139765. [Google Scholar] [CrossRef]
- Mehrzad, S. , Taban, E., Soltani, P., Samaei, S. E., & Khavanin, A. Sugarcane bagasse waste fibers as novel thermal insulation and sound-absorbing materials for application in sustainable buildings. Building and Environment 2022, 211, 108753. [Google Scholar] [CrossRef]
- Li, K. , Dauchez, N., & Nennig, B. A metaporoelastic structure that overcomes the sound insulation weaknesses of single and double panel partitions. Applied Acoustics 2023, 210, 109409. [Google Scholar] [CrossRef]
- Júnior, O. J. S. , Pinheiro, M. A. S., Silva, J. J. R., Pires, T. A. C., & Alencar, C. O. S. Sound insulation of gypsum block partitions: An analysis of single and double walls. Journal of Building Engineering 2021, 39, 102253. [Google Scholar] [CrossRef]
- Araújo Alves, J.; Neto Paiva, F.; Torres Silva, L.; Remoaldo, P. Low-Frequency Noise and Its Main Effects on Human Health—A Review of the Literature between 2016 and 2019. Appl. Sci. 2020, 10, 5205. [Google Scholar] [CrossRef]
- Pawlaczyk-Luszczyńska M, Szymczak W, Dudarewicz A, Sliwińska-Kowalska M. Proposed criteria for assessing low frequency noise annoyance in occupational settings. Int J Occup Med Environ Health. 2006, 19, 185–97. [Google Scholar] [CrossRef] [PubMed]
- Van Kempen, E.; Casas, M.; Pershagen, G.; Foraster, M. WHO Environmental Noise Guidelines for the European Region: A Systematic Review on Environmental Noise and Cardiovascular and Metabolic Effects: A Summary. Int. J. Environ. Res. Public Health 2018, 15, 379. [Google Scholar] [CrossRef]
- Martellotta, F. Innovative Composite Materials for Sound Absorption and Insulation: Where We Are and Where We Are Going. Materials 2021, 14, 1954. [Google Scholar] [CrossRef] [PubMed]
- Arjunan, A. , Baroutaji, A., Robinson, J., Vance, A., & Arafat, A. Acoustic metamaterials for sound absorption and insulation in buildings. Building and Environment 2024, 251, 111250. [Google Scholar] [CrossRef]
- Qu, T.; Wang, B.; Min, H. Lightweight Composite Partitions with High Sound Insulation in Hotel Interior Spaces: Design and Application. Buildings 2022, 12, 2184. [Google Scholar] [CrossRef]
- Moravec, M.; Pinosova, M.; Badida, M.; Izarikova, G.; Badidova, M. Analysis of the Acoustic Parameters of Building Partition Structures of Varying Composition. Buildings 2024, 14, 2440. [Google Scholar] [CrossRef]
- Tao, Y. , Ren, M., Zhang, H., & Peijs, T. Recent progress in acoustic materials and noise control strategies – A review. Applied Materials Today 2021, 24, 101141. [Google Scholar] [CrossRef]
- Zhao, C.; Prasad, M.G. Acoustic Black Holes in Structural Design for Vibration and Noise Control. Acoustics 2019, 1, 220–251. [Google Scholar] [CrossRef]
- Oyelade AO, Akano TT, Odesanmi GA. Enhancing the sound transmission loss in double-leaf partitions with lateral local resonators substructure. Advances in Mechanical Engineering. 2022, 14. [Google Scholar] [CrossRef]
- Caniato, M. , Bettarello, F., & Gasparella, A. (2018). Energy and Acoustic Performances of Timber in Buildings. In Reference Module in Materials Science and Materials Engineering. Elsevier. [CrossRef]
- Caniato M, Bettarello F, Schmid C, Fausti P. The use of numerical models on service equipment noise prediction in heavyweight and lightweight timber buildings. Building Acoustics. 2018, 26, 35–55. [Google Scholar] [CrossRef]
- Caniato, M. , Bettarello, F., Ferluga, A., Marsich, L., Schmid, C., & Fausti, P. Acoustic of lightweight timber buildings: A review. Renewable and Sustainable Energy Reviews 2017, 80, 585–596. [Google Scholar] [CrossRef]
- Secchi, S. , Asdrubali, F., Cellai, G., Nannipieri, E., Rotili, A., & Vannucchi, I. Experimental and environmental analysis of new sound-absorbing and insulating elements in recycled cardboard. Journal of Building Engineering 2016, 5, 1–12. [Google Scholar] [CrossRef]
- Yang, F.; Cao, Y.; Wu, M.; Albu, F.; Yang, J. Frequency-Domain Filtered-x LMS Algorithms for Active Noise Control: A Review and New Insights. Appl. Sci. 2018, 8, 2313. [Google Scholar] [CrossRef]
- Presidenza del Consiglio dei Ministri, DPCM 5 dicembre 1997: Determinazione dei requisiti acustici passivi degli edifici, Serie Generale n. 297, Dec. 22, 1997.
- UNI, UNI EN ISO 16283-1:2014 – Acoustics – Field measurement of sound insulation in buildings and of building elements – Part 1: Airborne sound insulation, 2014.
- UNI, UNI EN ISO 717-1:2013 – Acoustics – Rating of sound insulation in buildings and of building elements – Part 1: Airborne sound insulation, 2013.
- UNI, UNI EN ISO 12354-1:2017 – Building acoustics – Estimation of acoustic performance of buildings from the performance of elements – Part 1: Airborne sound insulation between rooms, 2017.
- “Catalog Isolmant.” Available online: https://www.isolmant.com/it/prodotti/rumore-aereo/isolamento-pareti-con-intercapedine/.
- “FIBRANgyps - 500 Dry Construction Systems - Catalog.” Available online: https://fibran.it/wp-content/uploads/sites/2/2020/10/FIBRANgyps-catalogo-500-sistemi-a-secco.pdf.
- “Fermacell Catalog - Gypsum-Fibre Board.” Available online: https://www.fermacell.it/it/prodotti/lastre-in-gessofibra-fermacell/lastra-gessofibra.
- “Isolmant - Pricing Catalog.”. Available online: https://www.isolmant.com/it/download/listini.
- “FIBRAN - Pricing Catalog,” 2025.. Available online: https://fibran.it/downloads/listino-prezzi.
- “Fermacell Gypsum-Fibre Pricing.”. Available online: https://edilcommerce.com/67-fermacell.
- “Rockwool - Pricing Catalog 2025.”. Available online: https://www.rockwool.com/it/download-strumenti/listini.
Figure 1.
Case study environment.
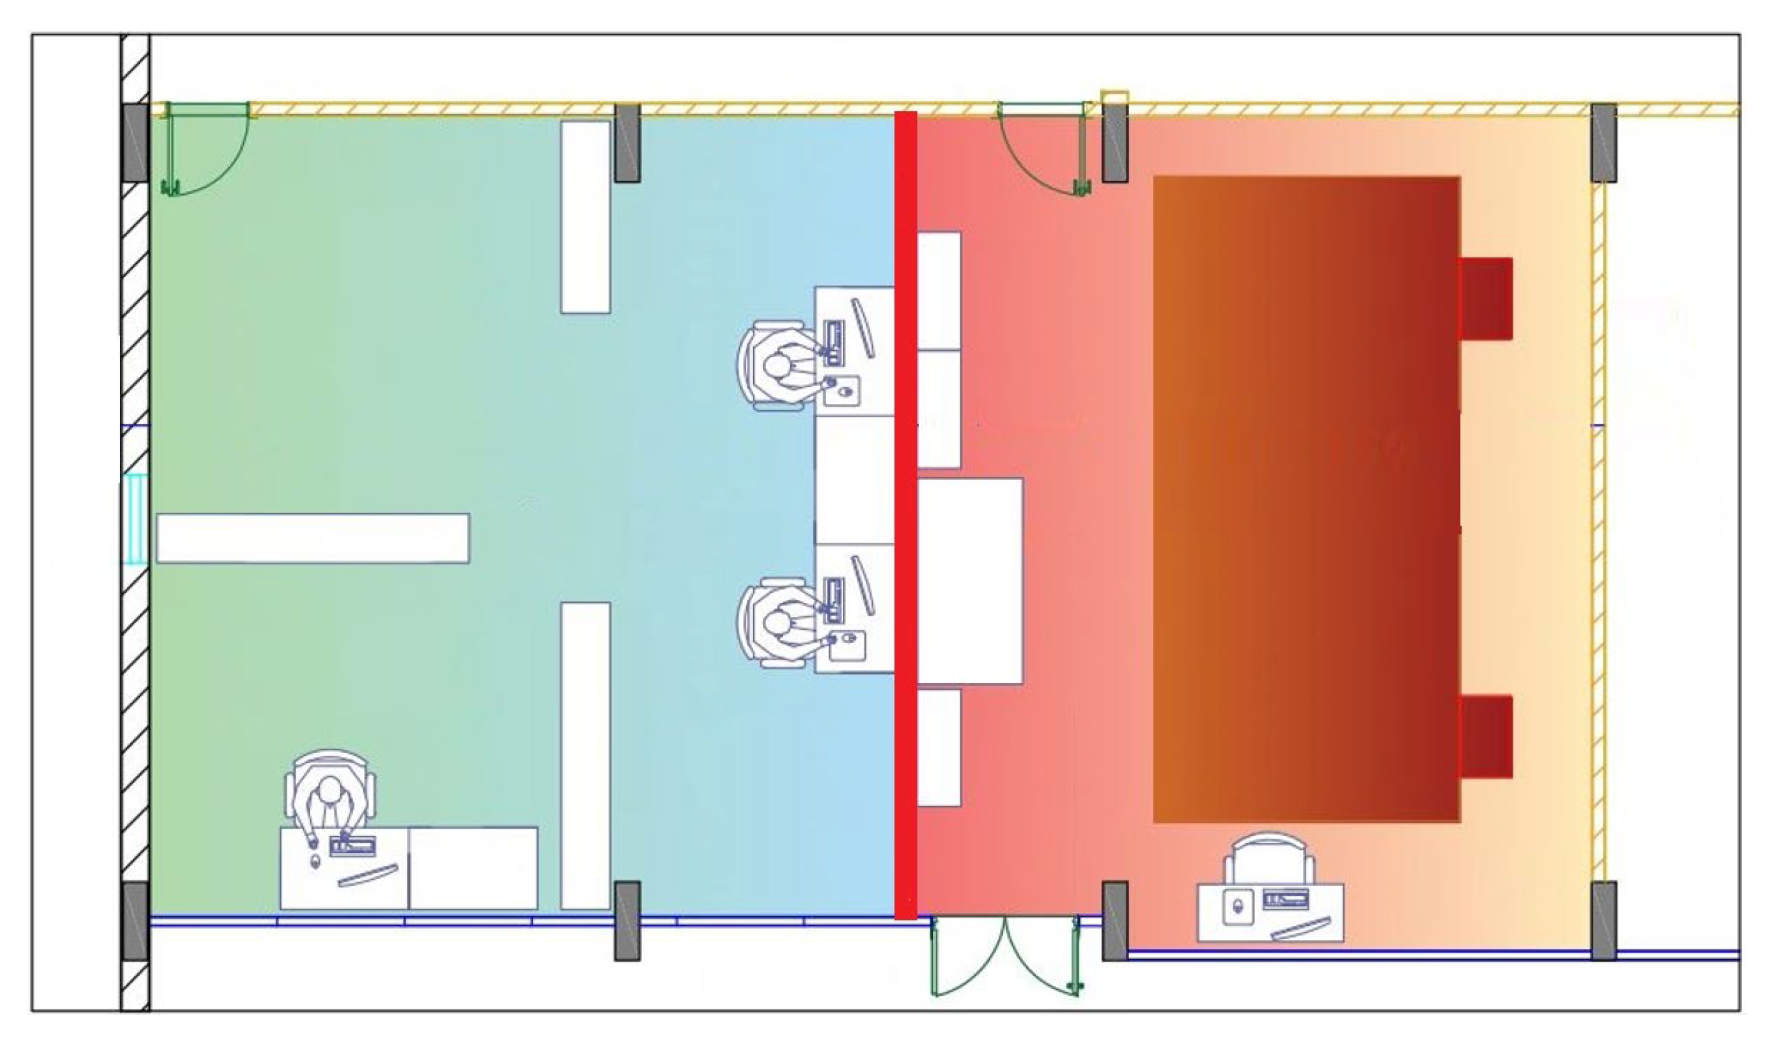
Figure 2.
Receiving room.
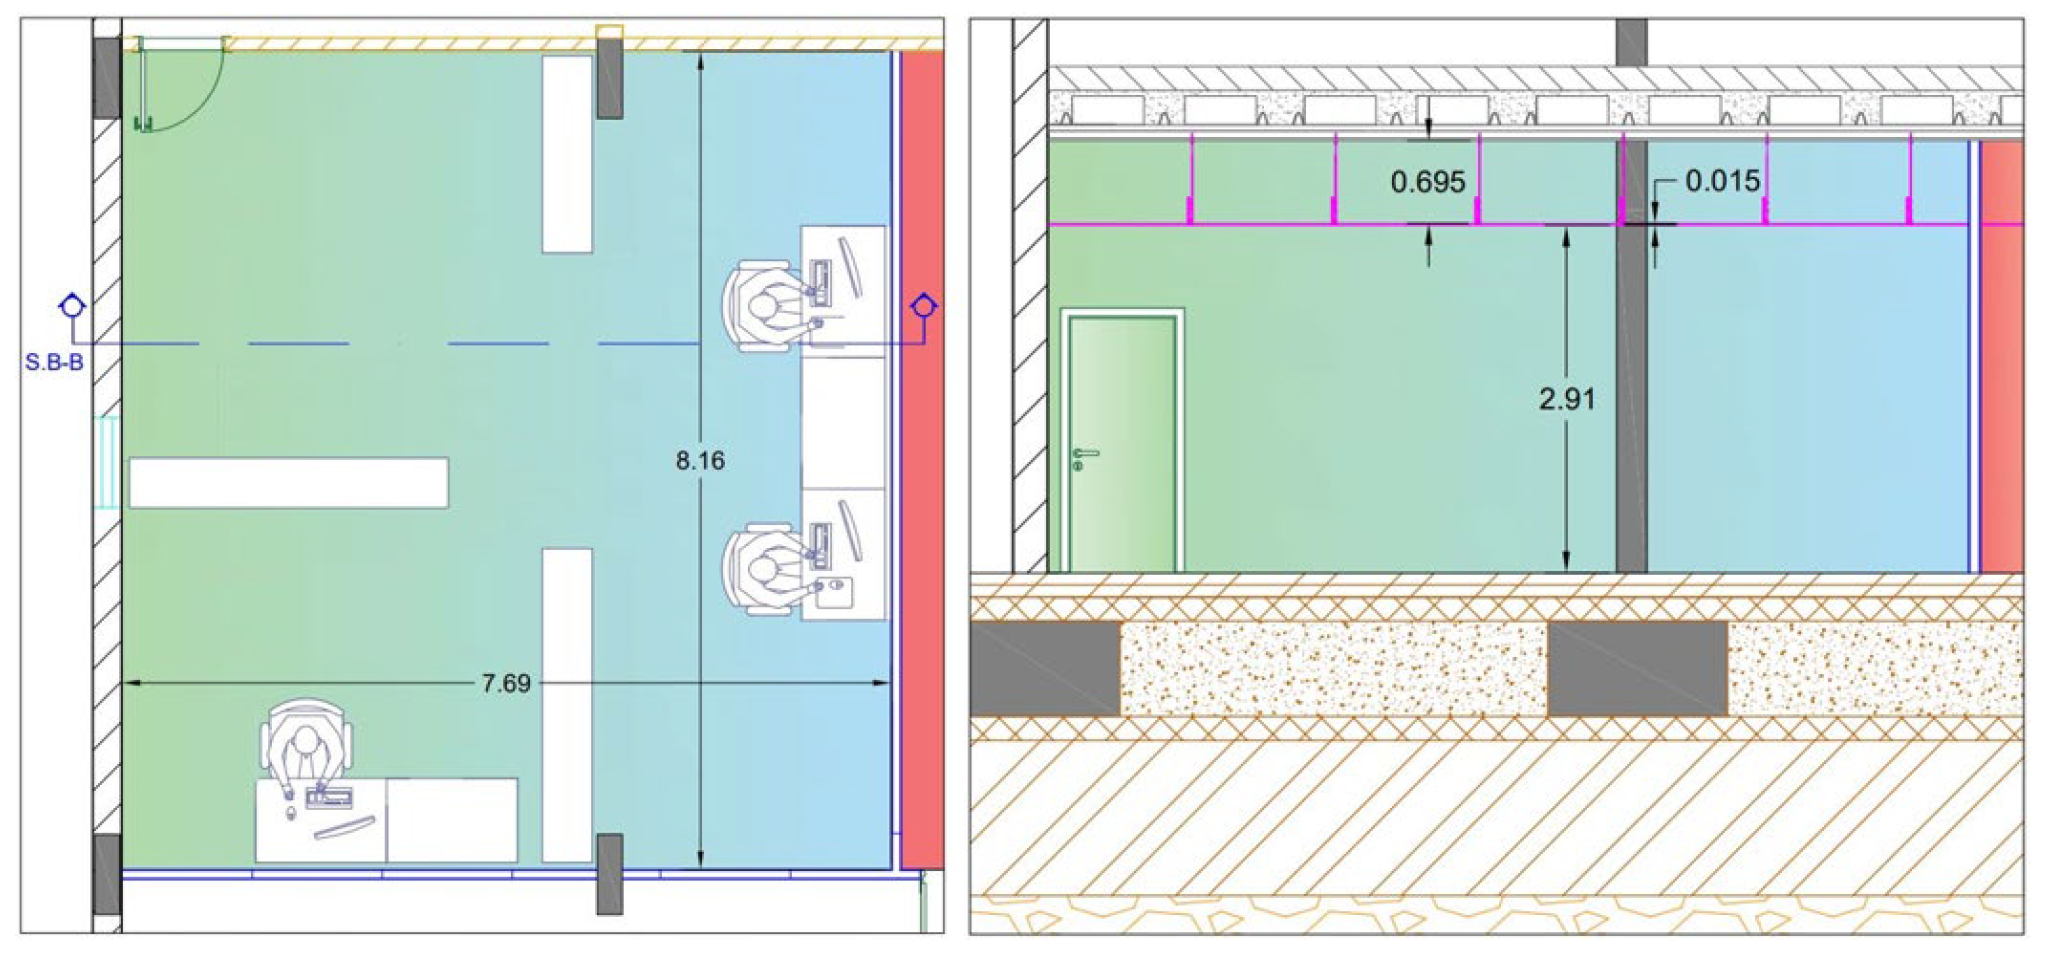
Figure 3.
Source room.
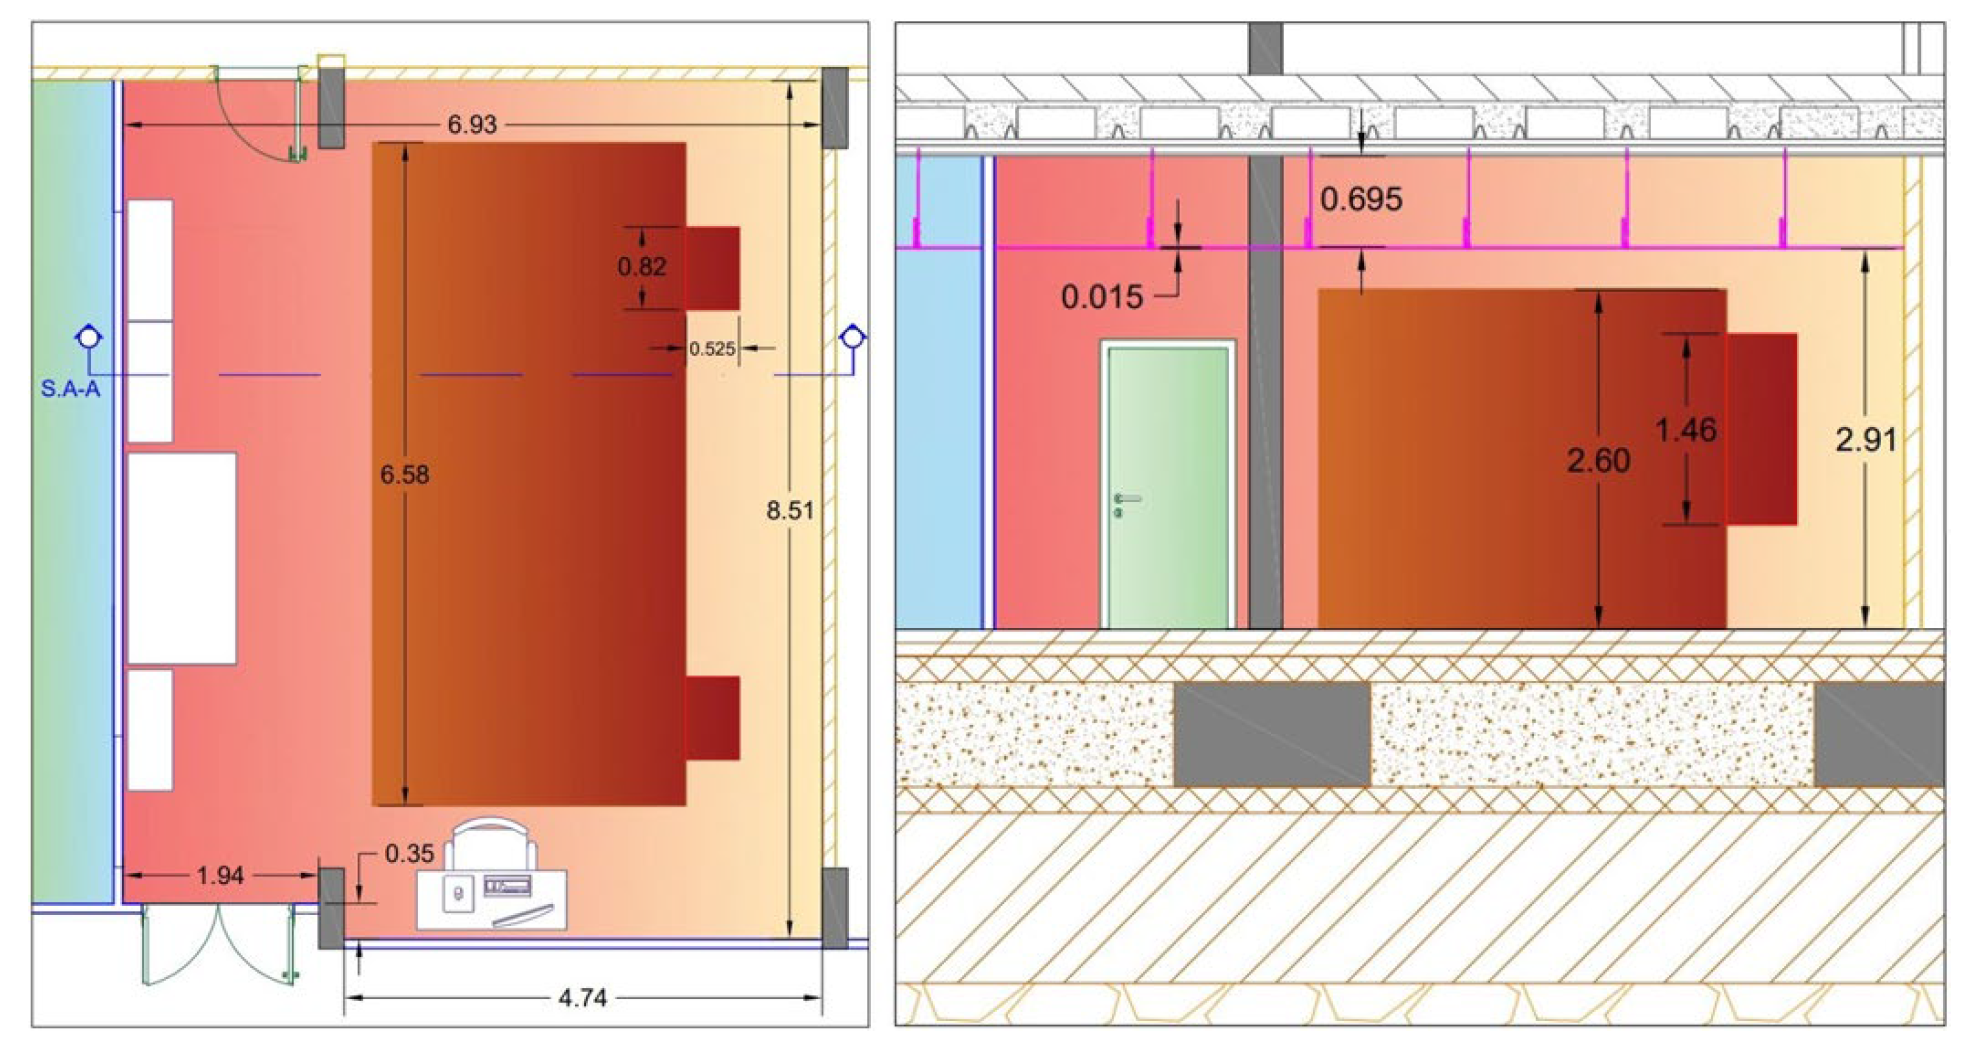
Figure 4.
Svantek SI 312 dodecahedral loudspeaker and Svantek 979 integrating sound level meter.
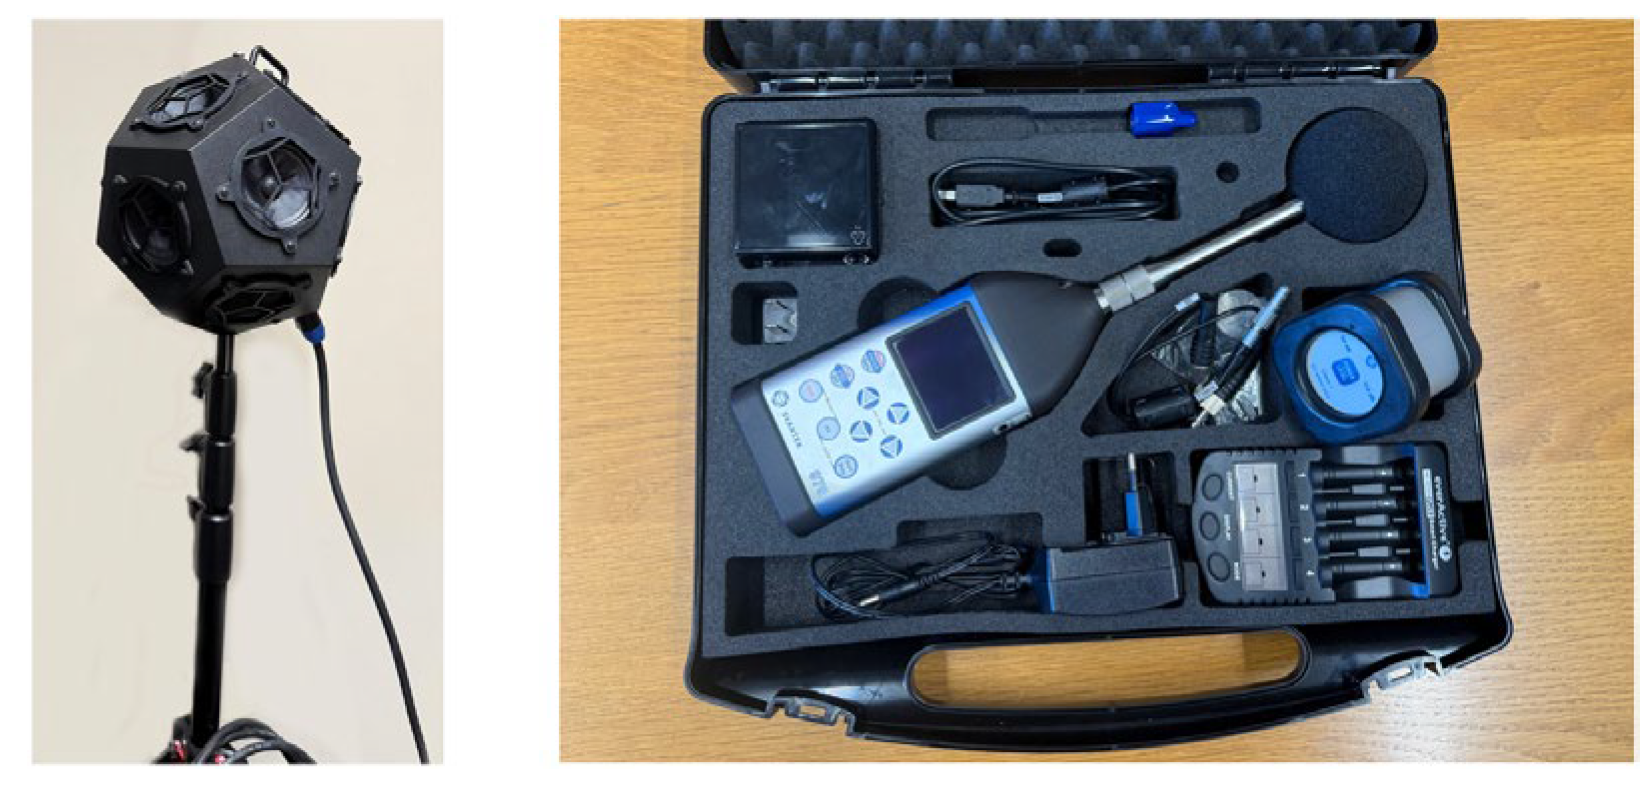
Figure 5.
a) Isolmant Perfetto Special b) Isolmant Perfetto CG.
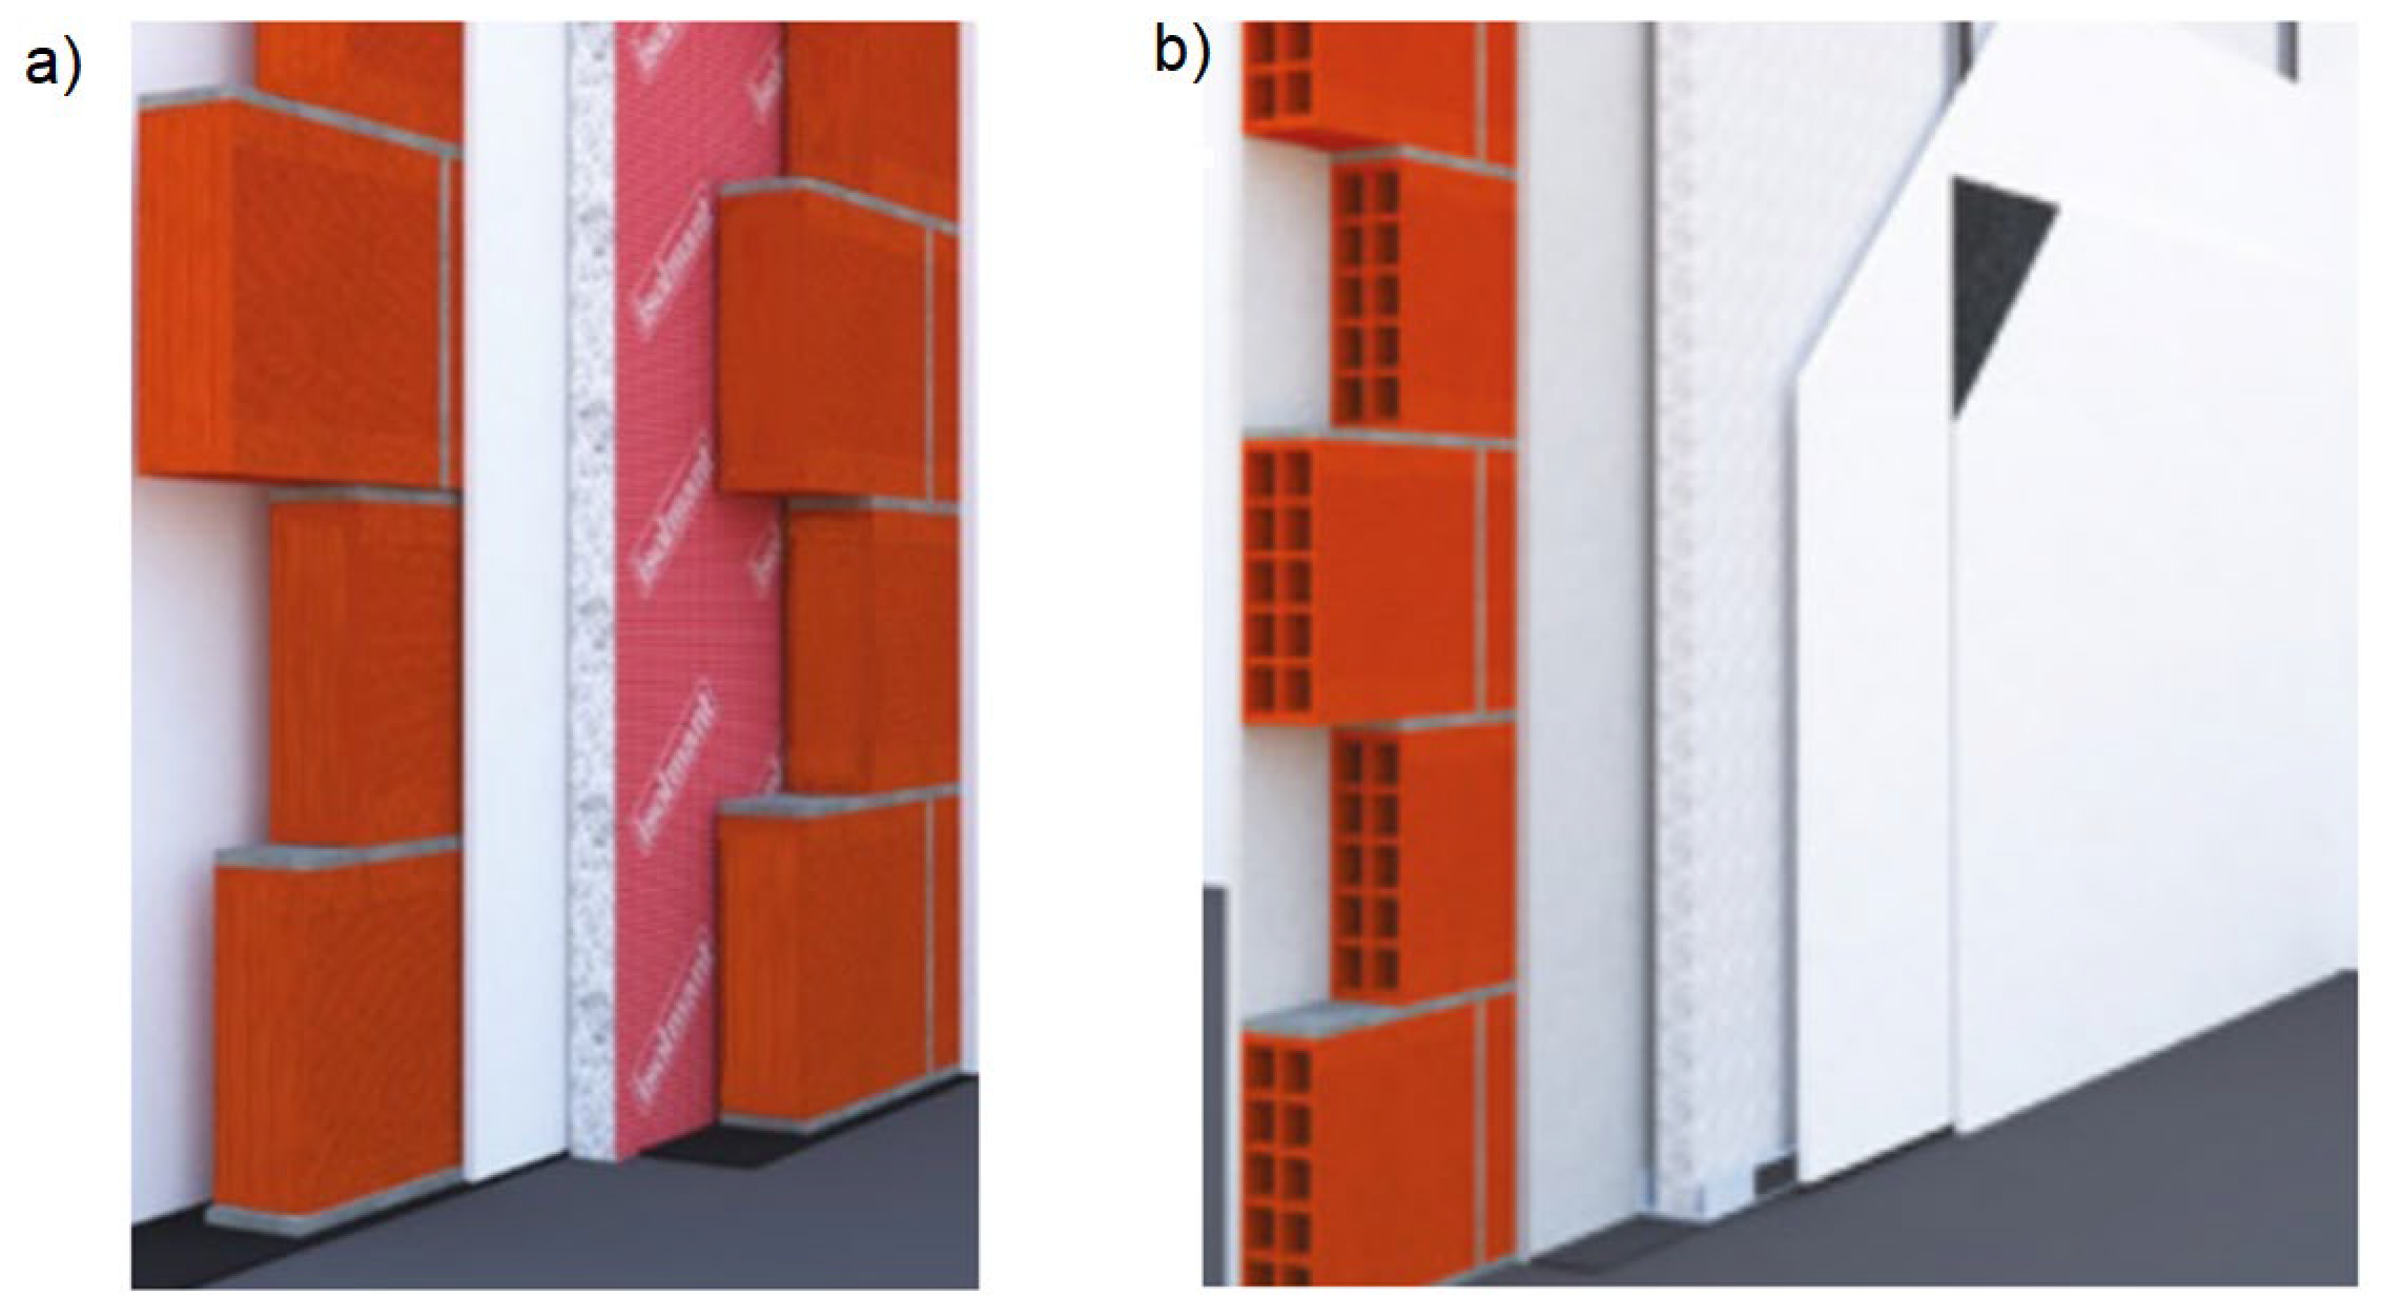
Figure 6.
Schematic representation of the metal support.
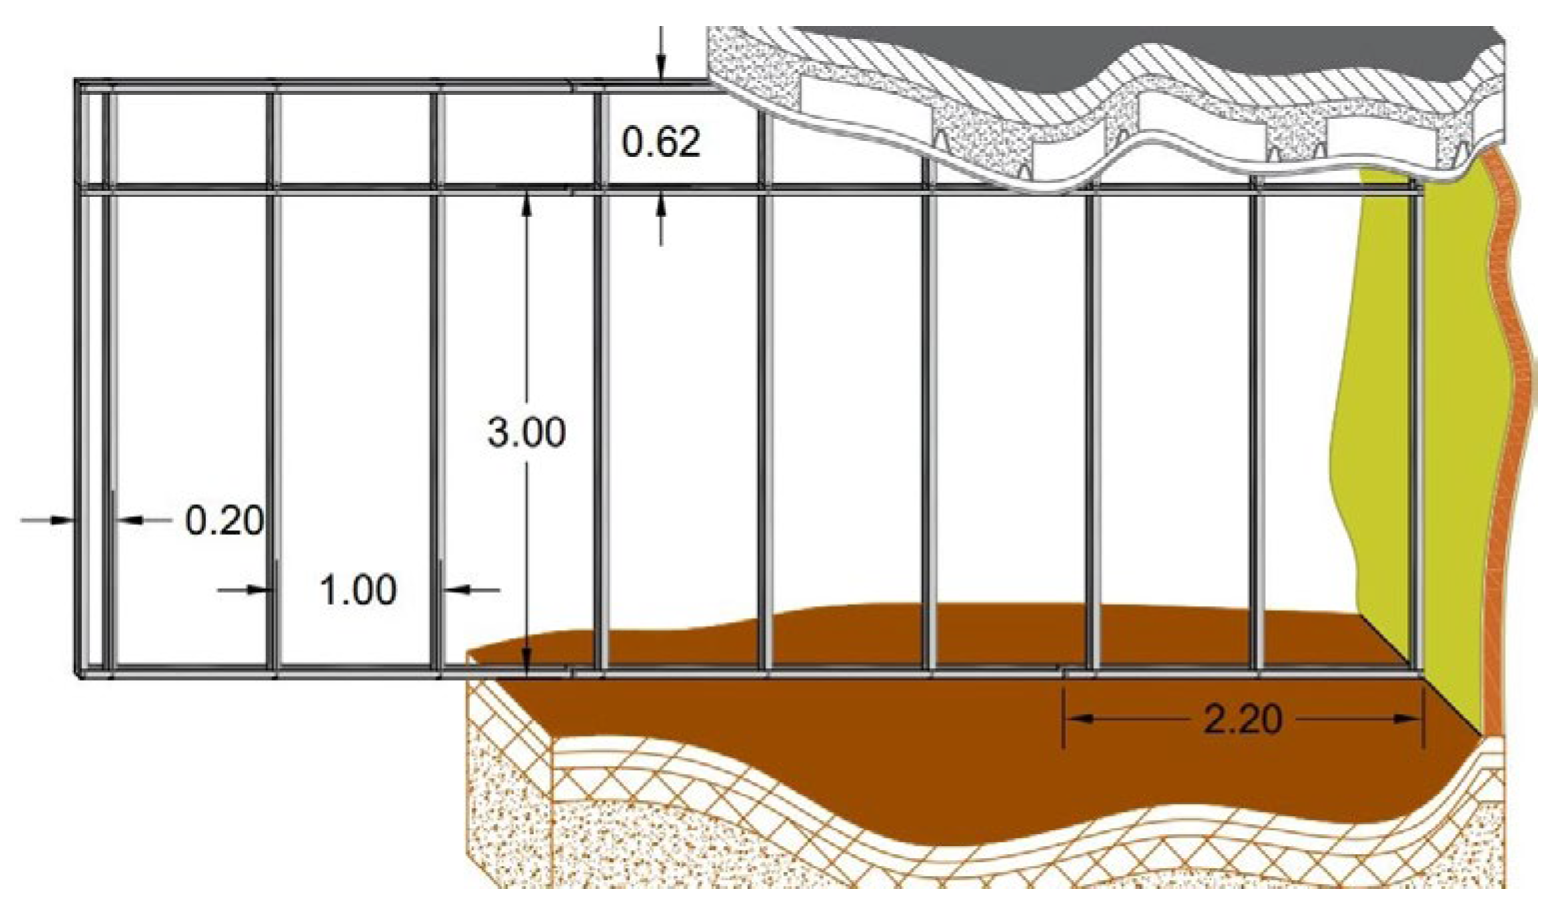
Figure 7.
Additional partition produced by Fermacell.
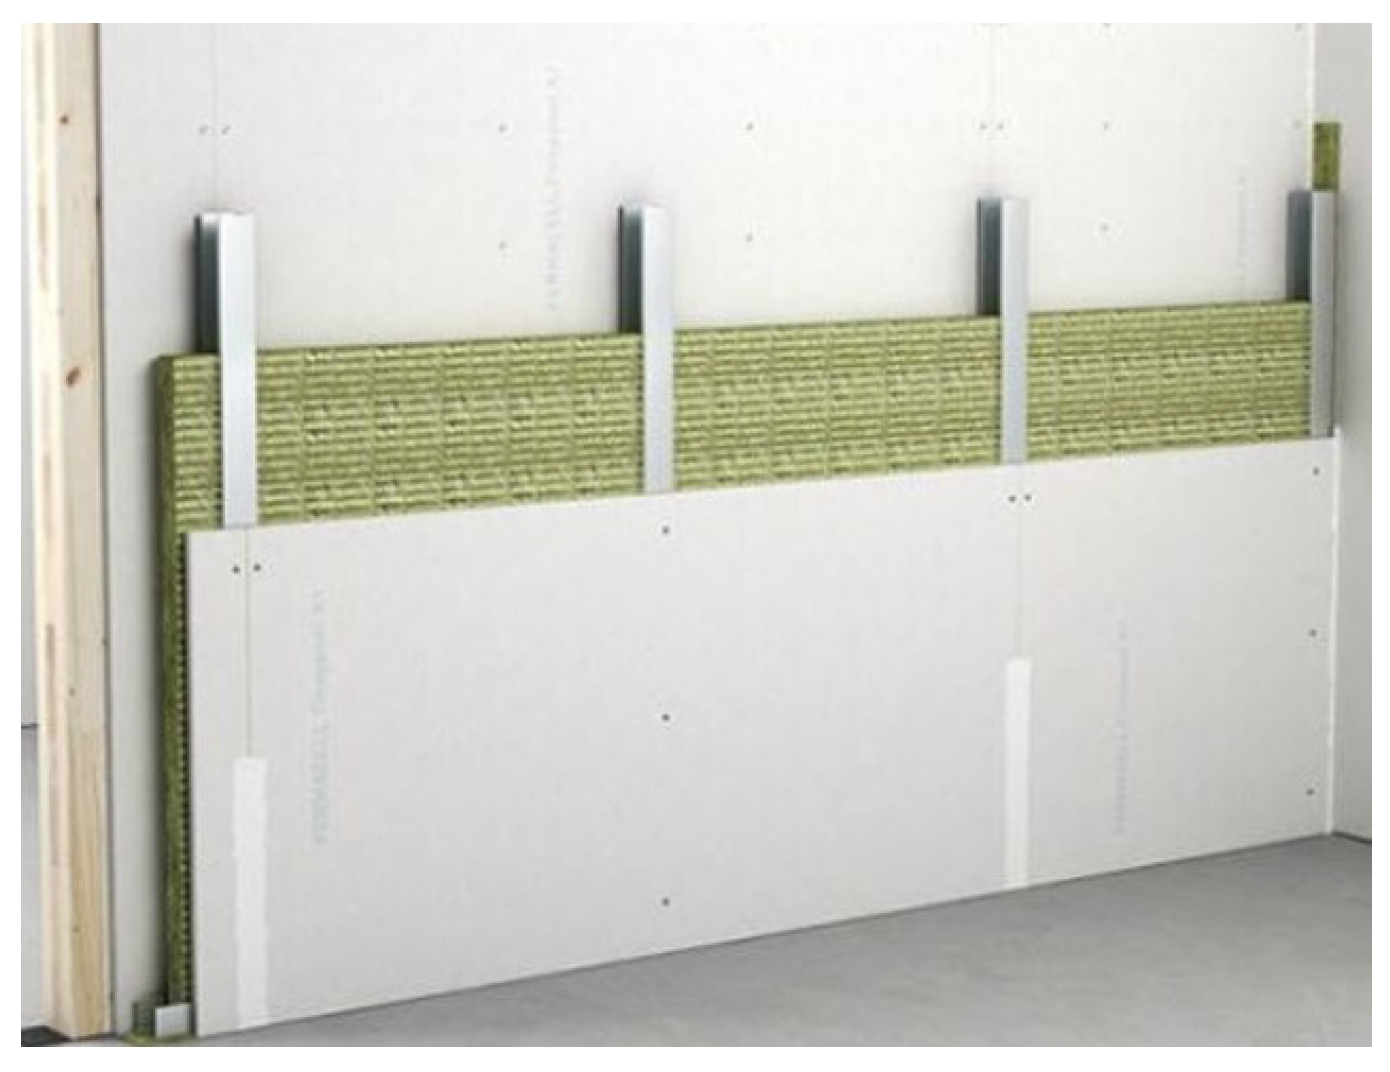
Figure 8.
Characteristics of the vertical partition and building components as installed on-site.
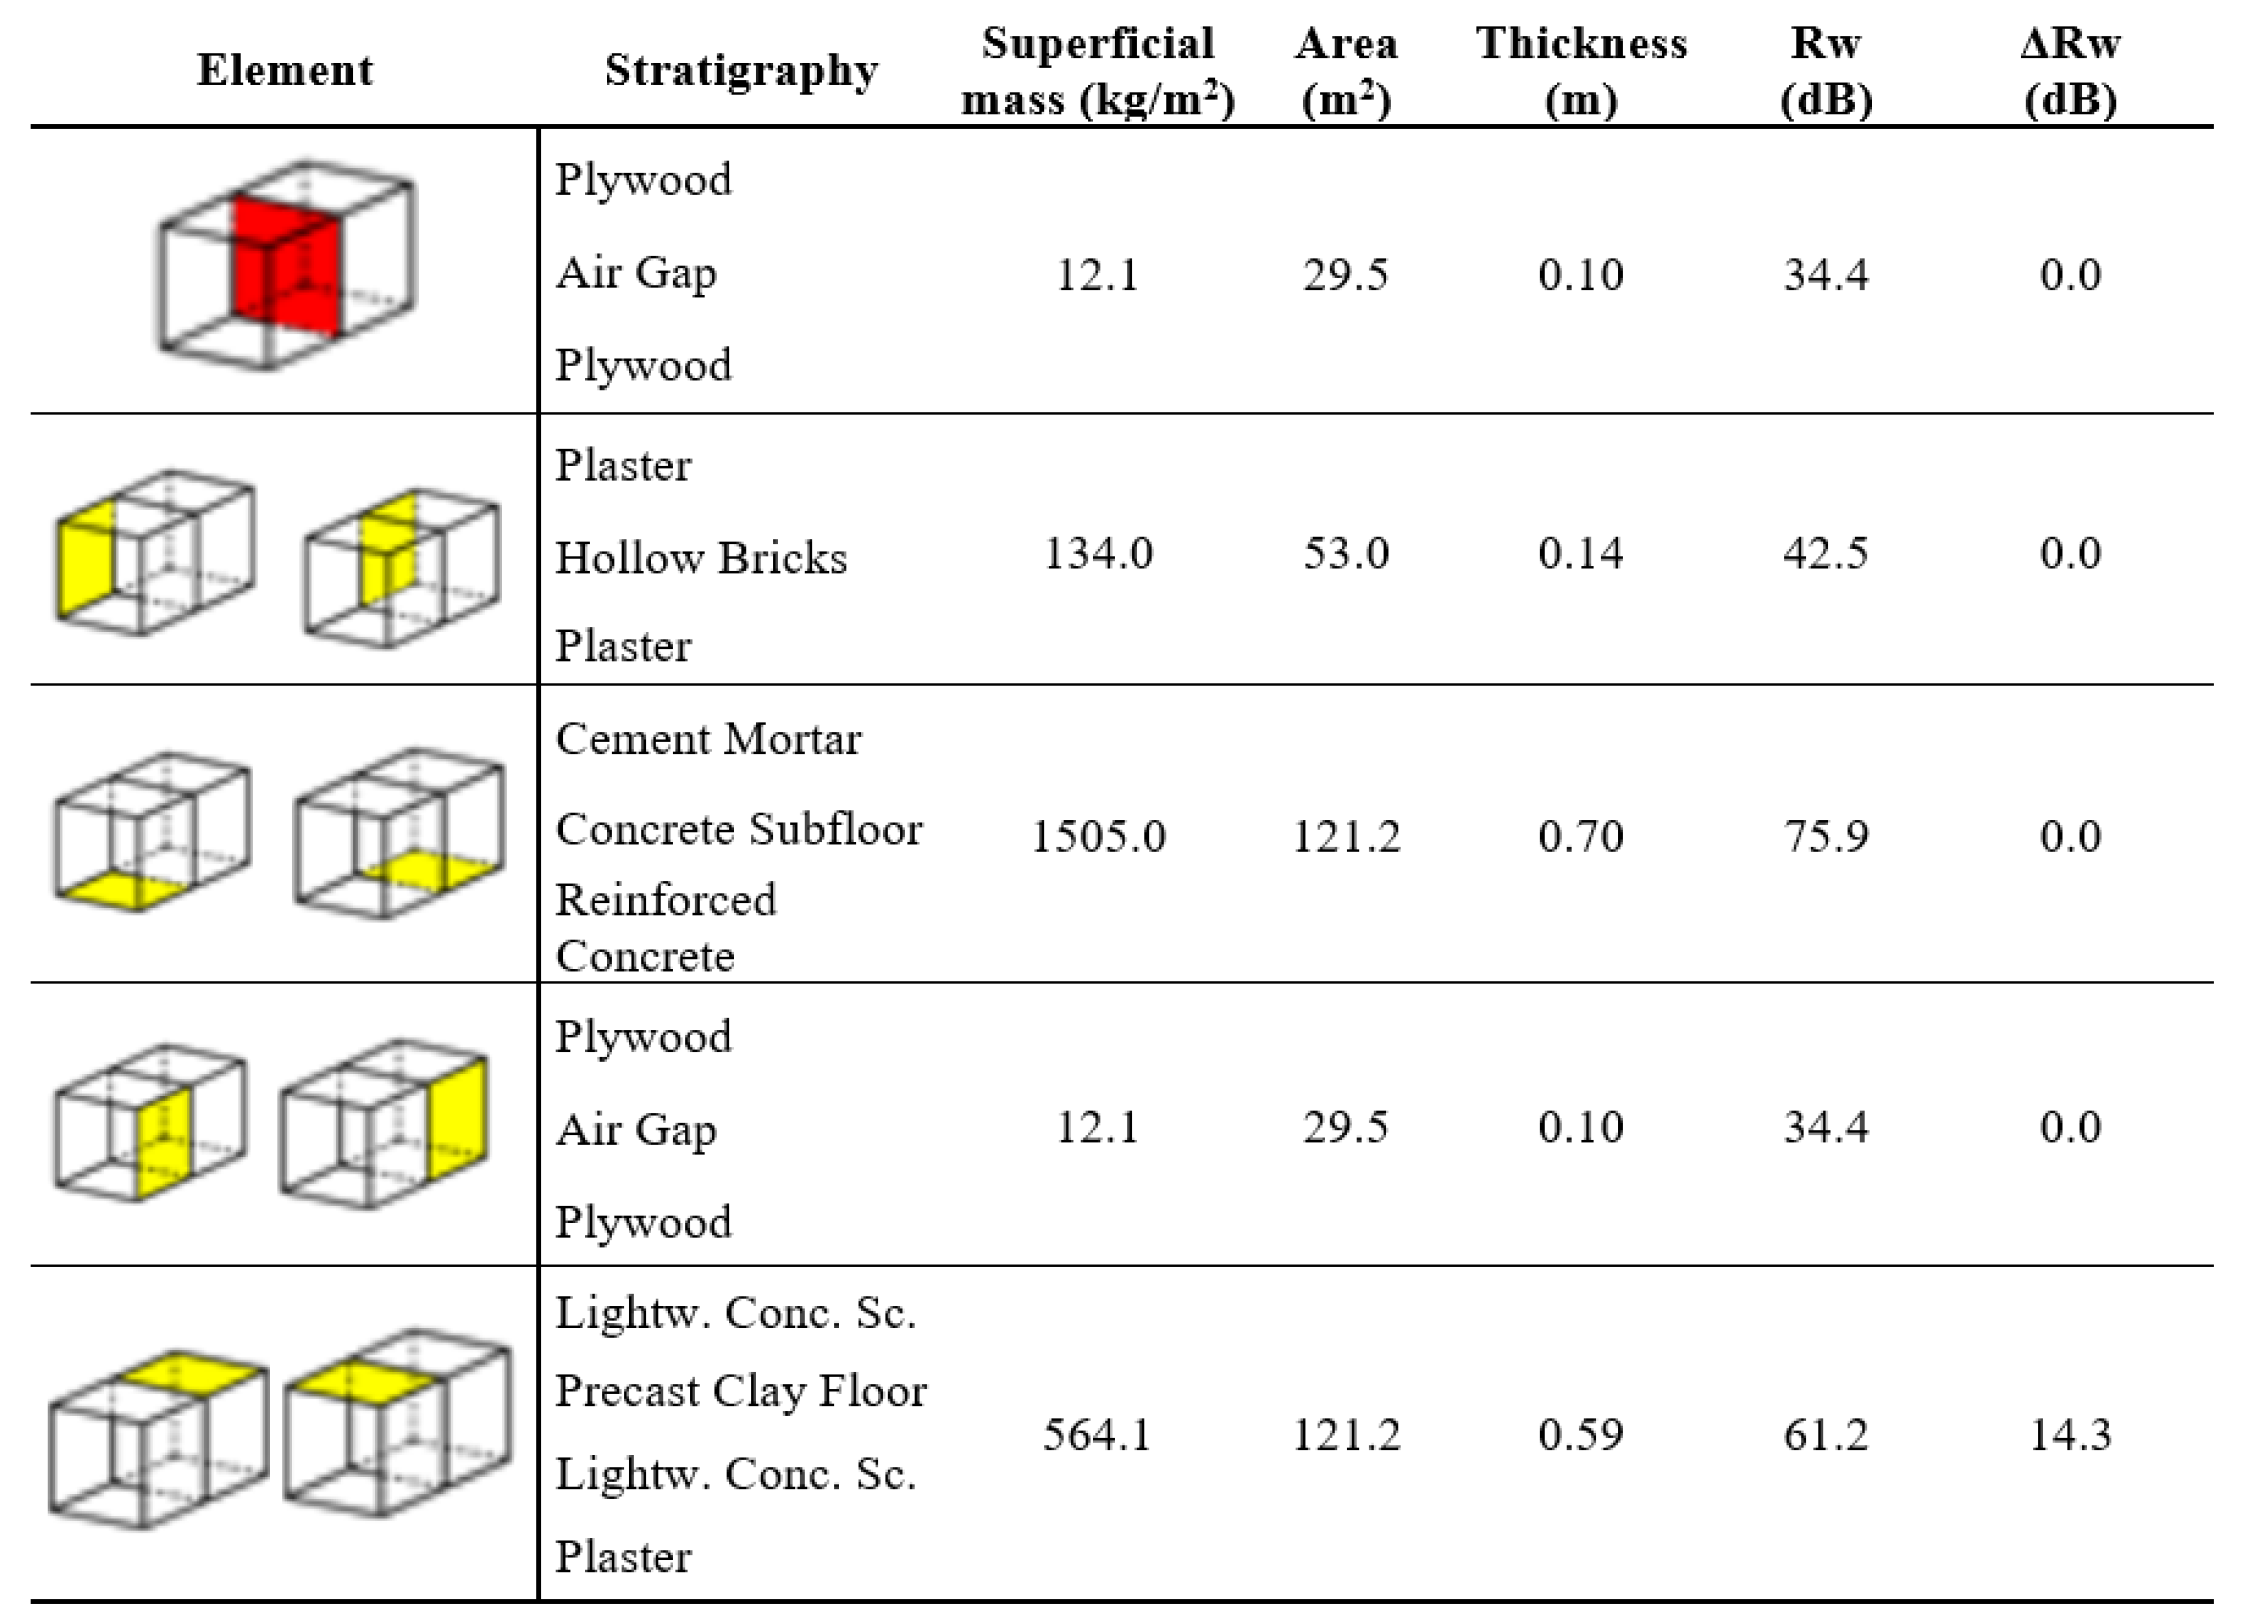
Figure 9.
Joint characteristics.
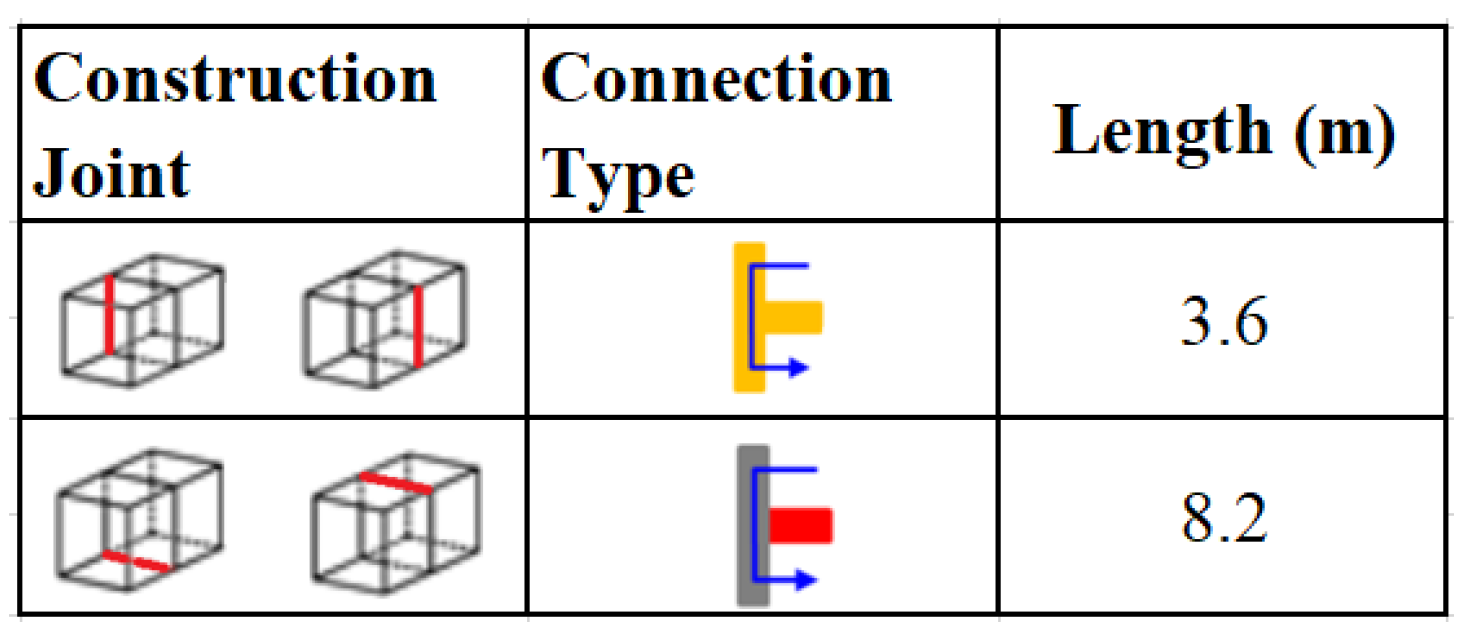
Figure 10.
Spectral and total equivalent sound pressure levels in the source room.
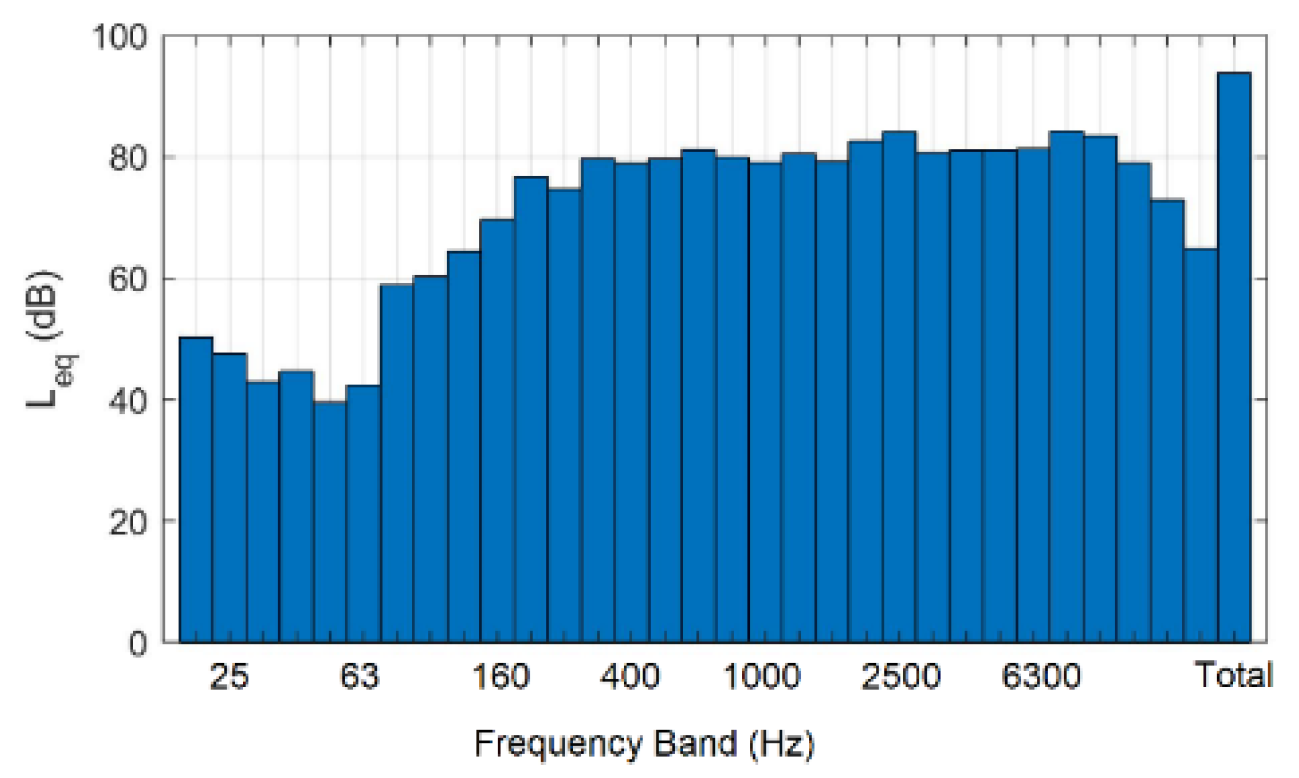
Figure 11.
Spectral and total equivalent sound pressure levels in the receiving room.
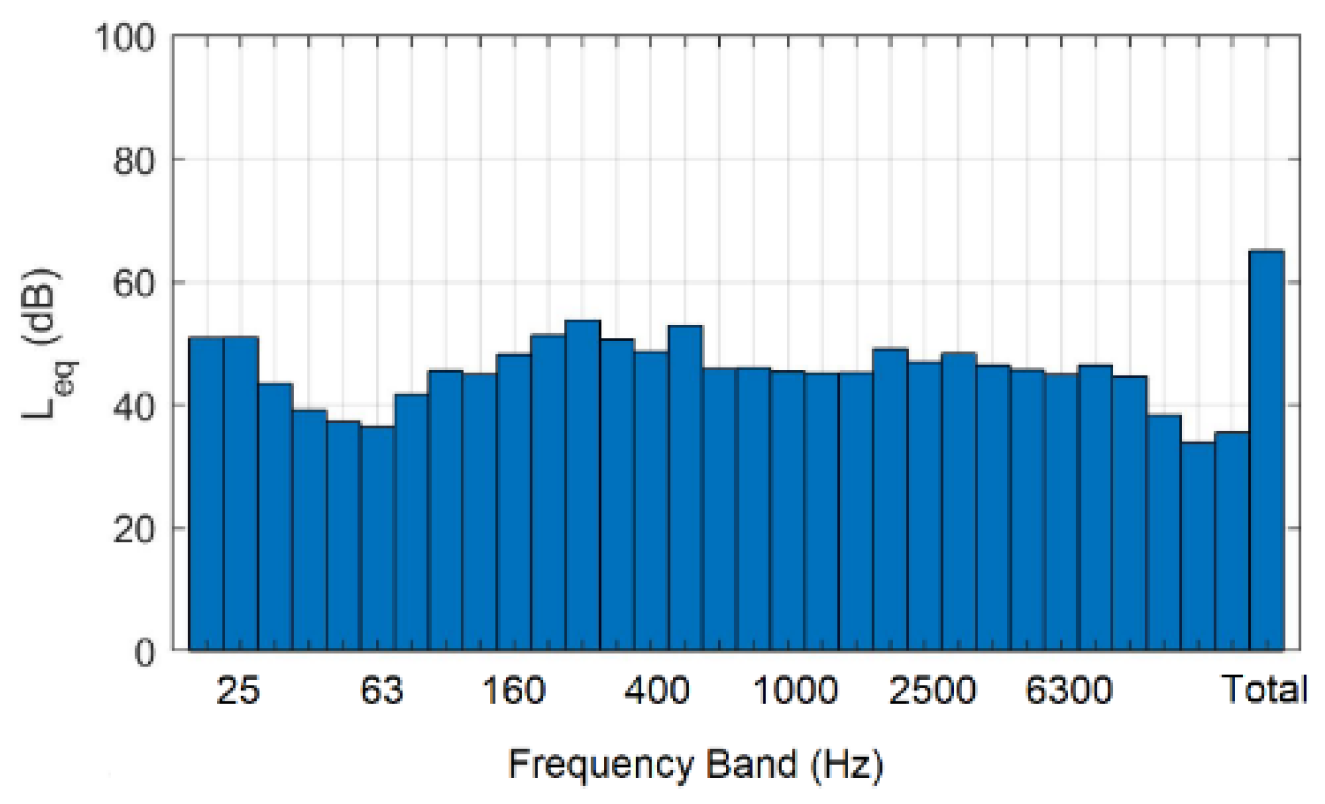
Figure 12.
Spectral and total background noise in the receiving room.
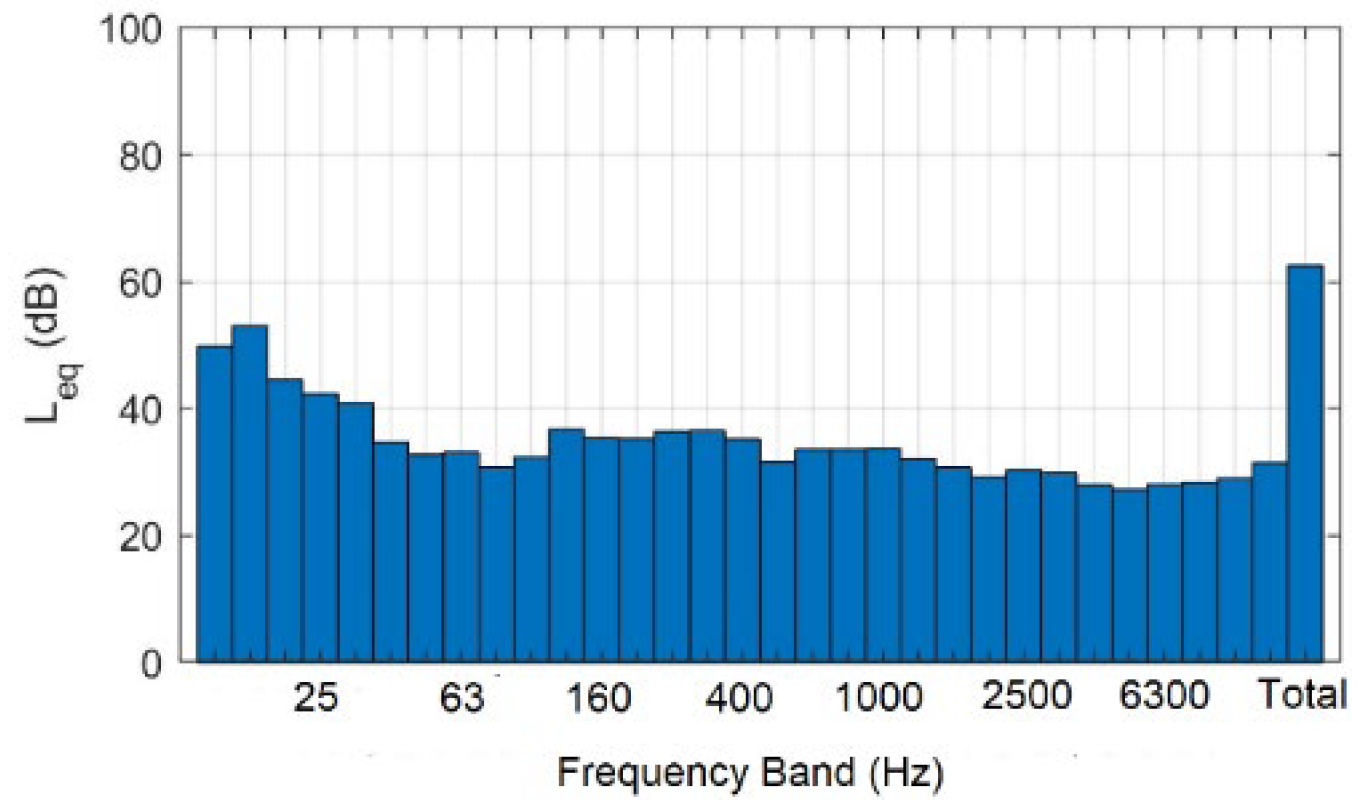
Figure 13.
Time-domain frequency analysis of sound pressure measured in the receiving room.
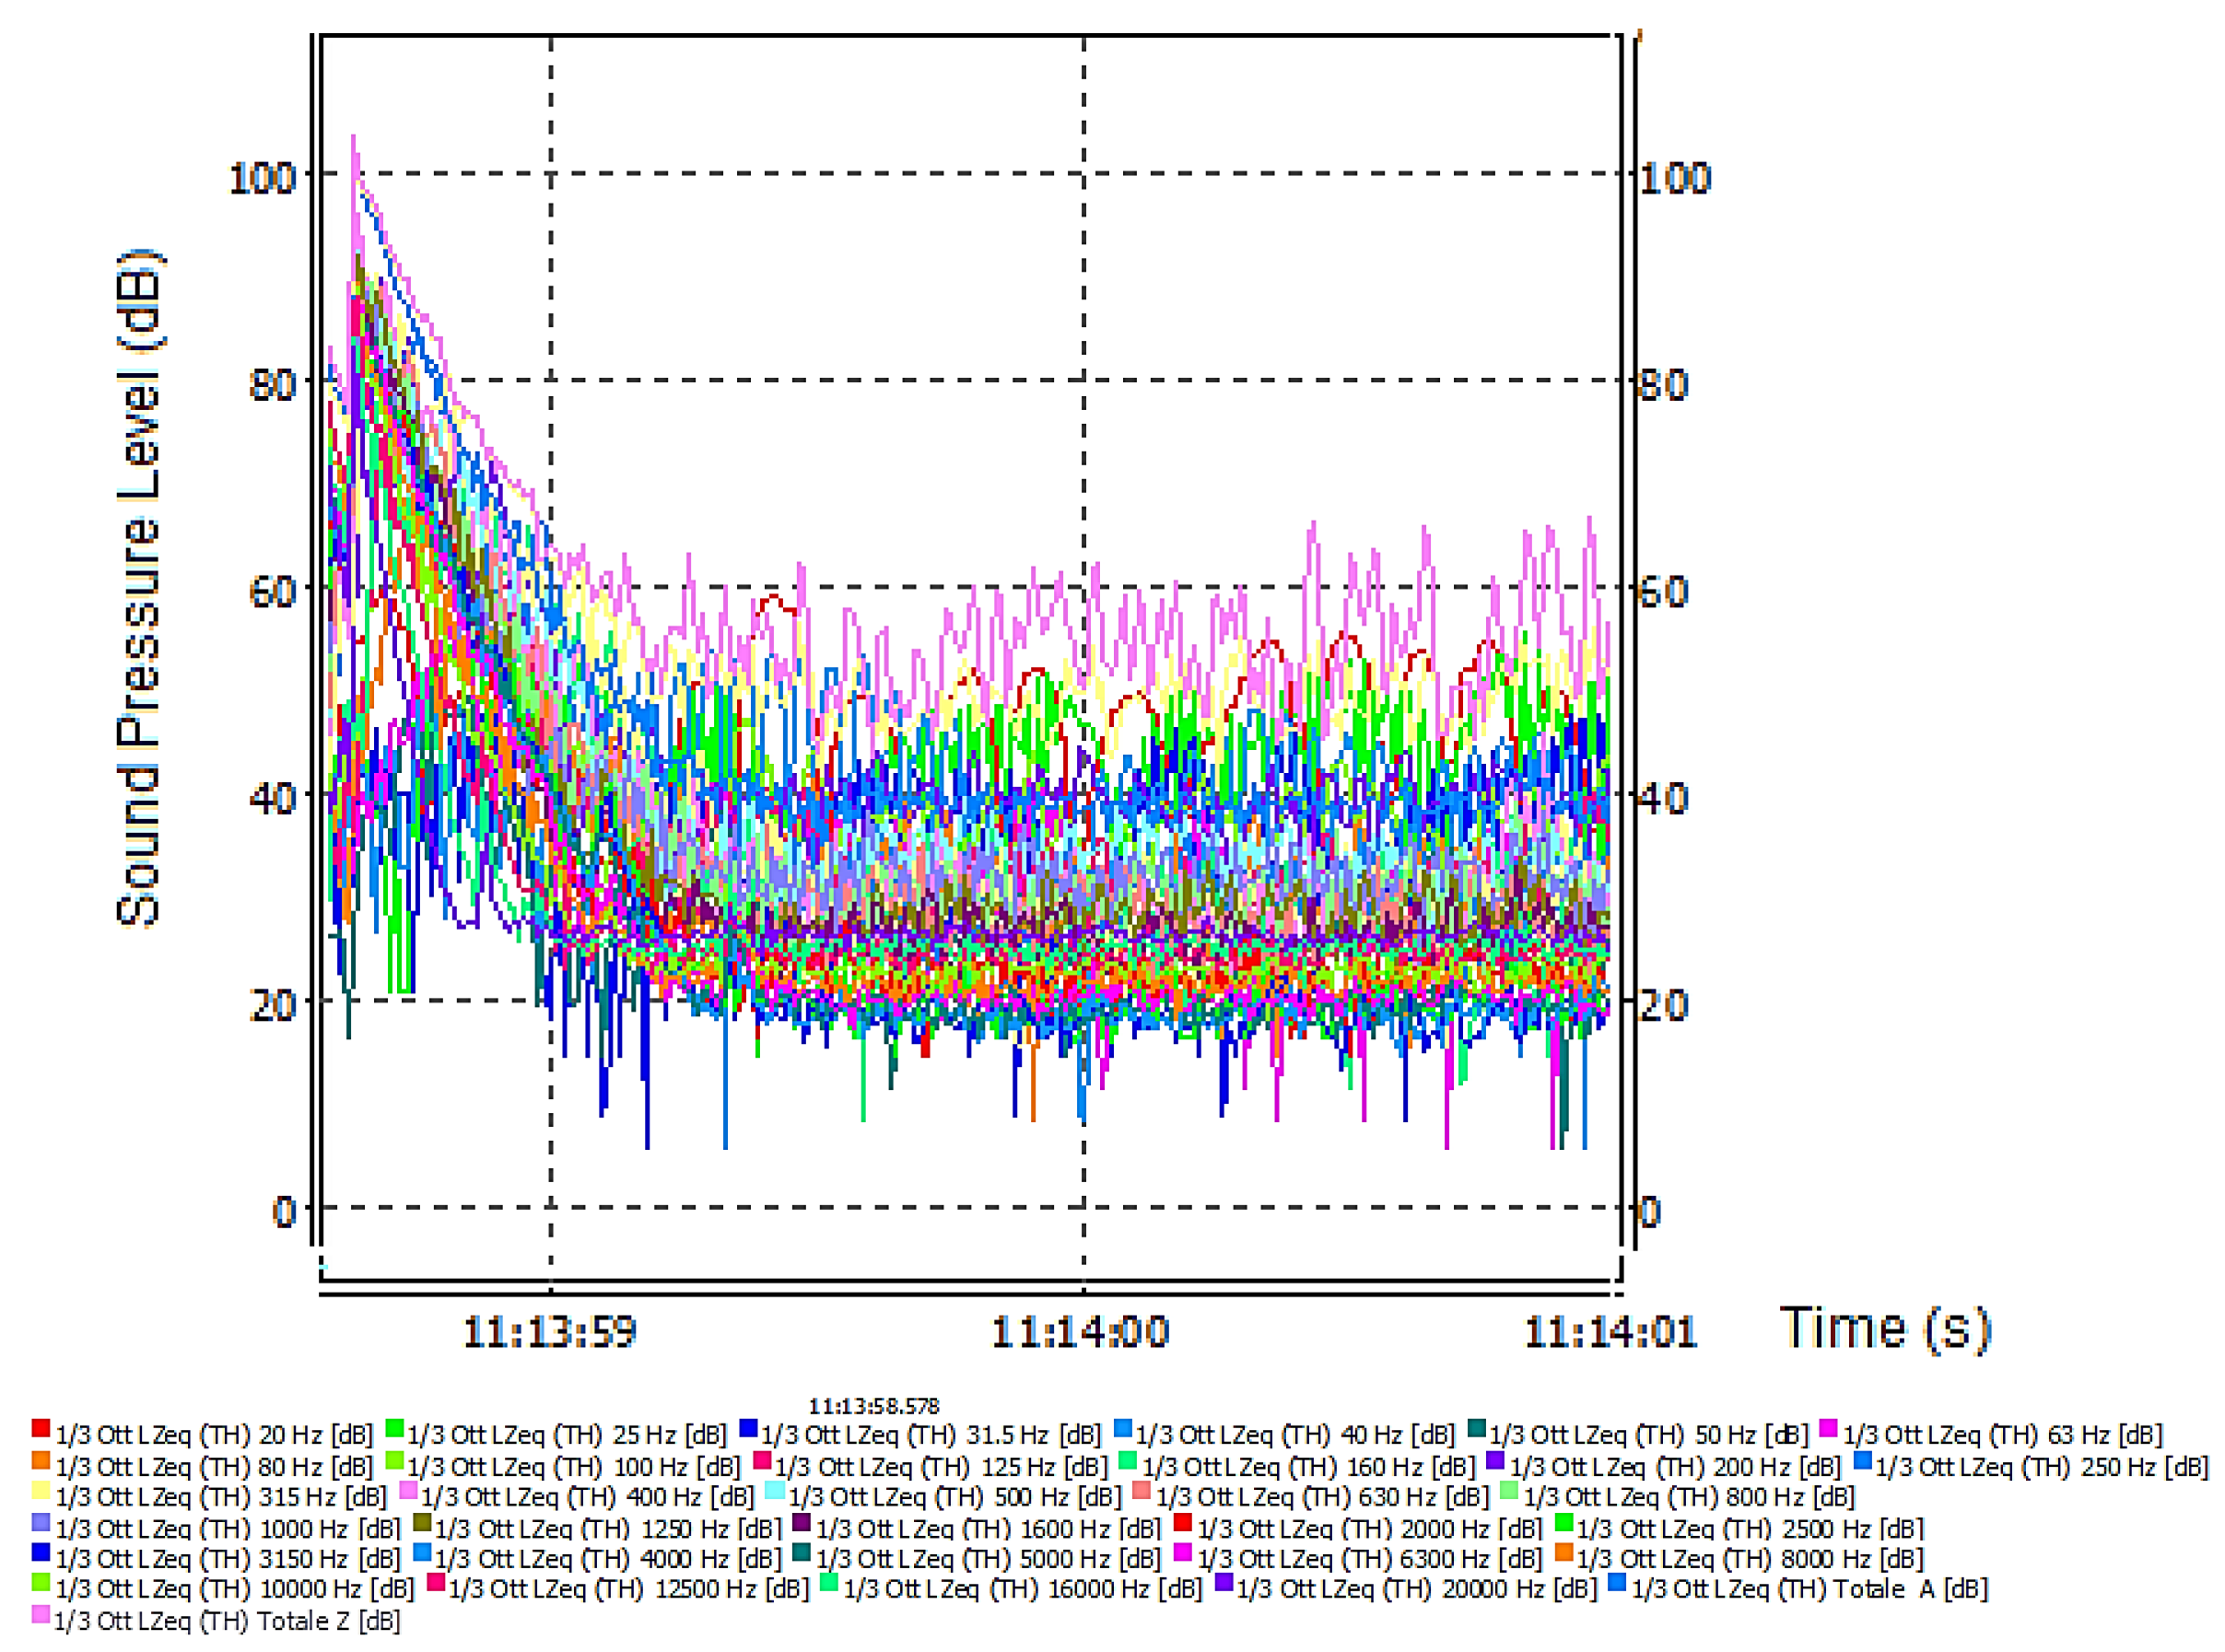
Figure 14.
Apparent airborne sound insulation trend R’ and determination of the index.
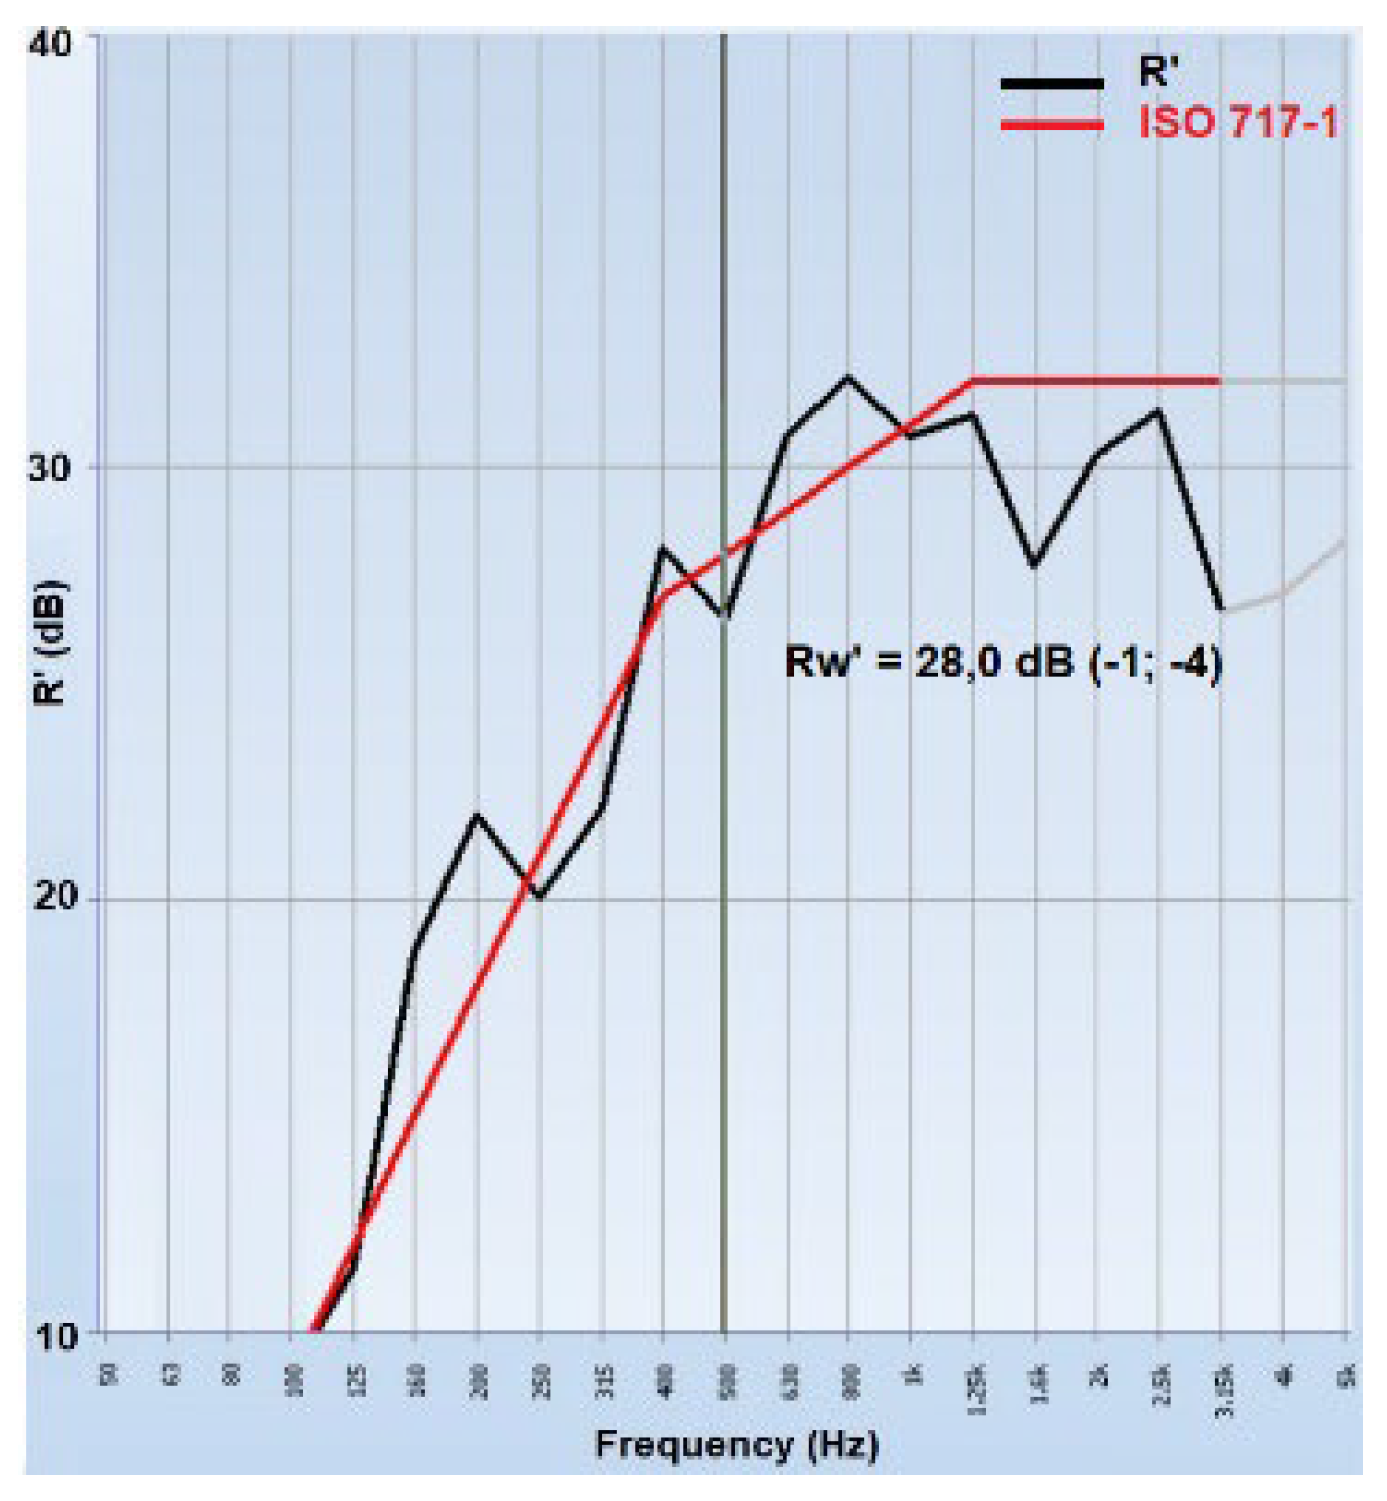
Figure 15.
Sound insulation index as a function of the sound propagation path.
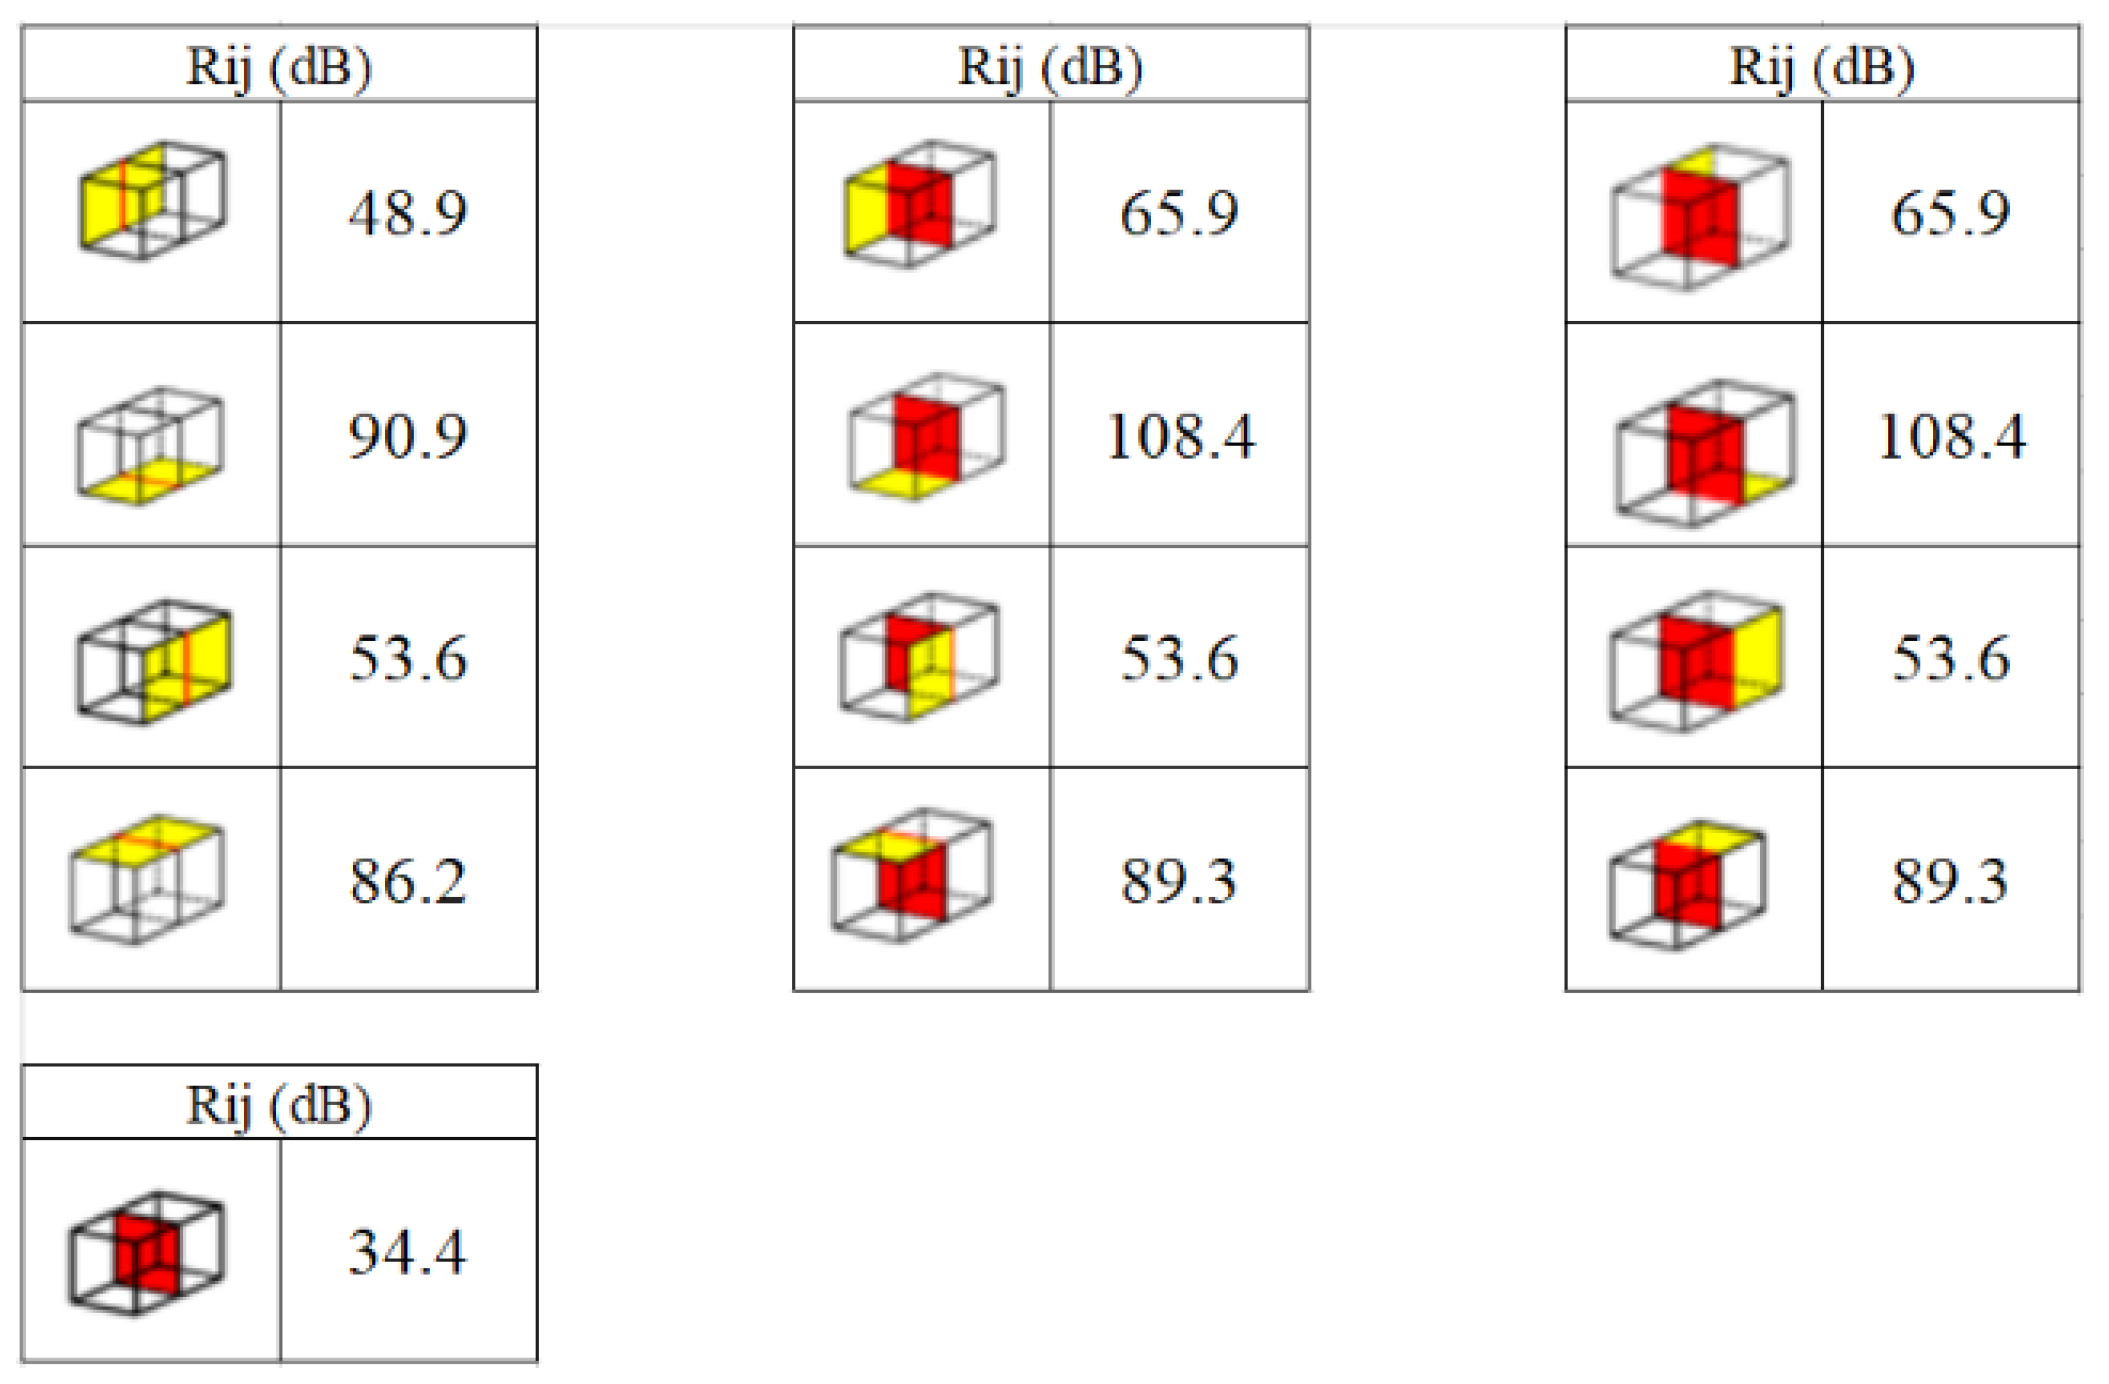
Figure 16.
Cost breakdown for each proposed commercial wall configuration.
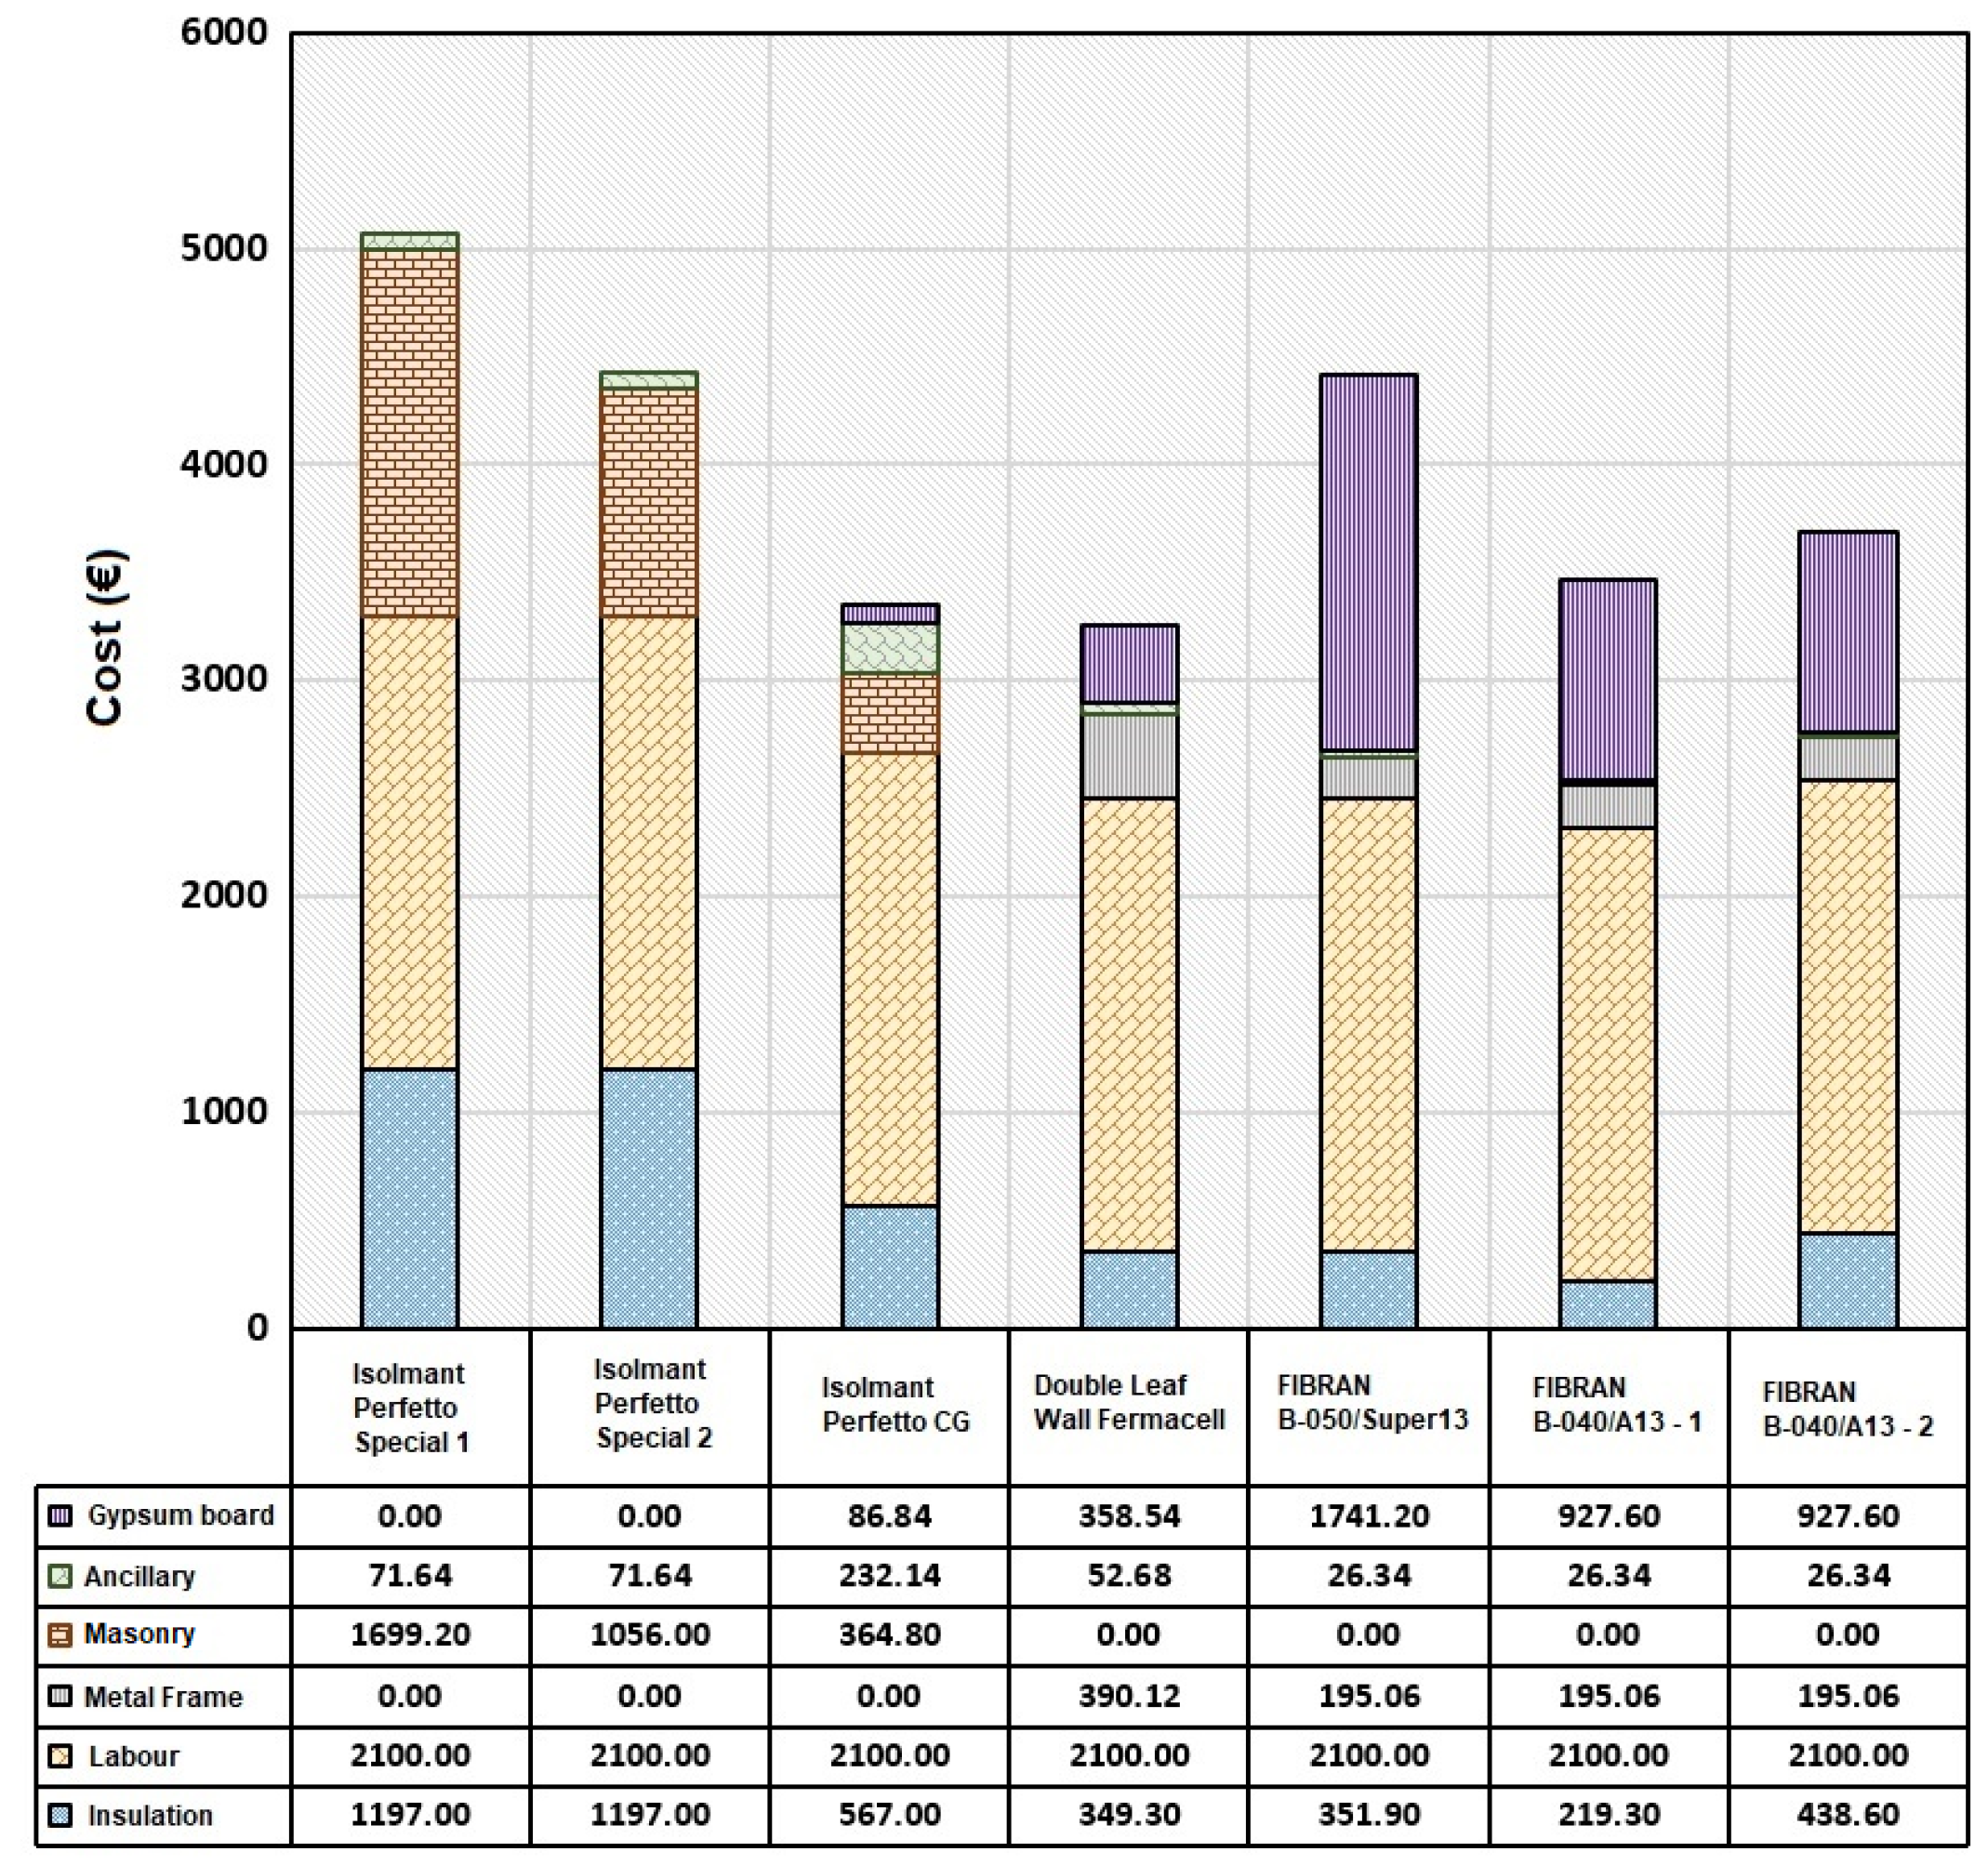
Figure 17.
Cost breakdown for each innovative wall configuration.
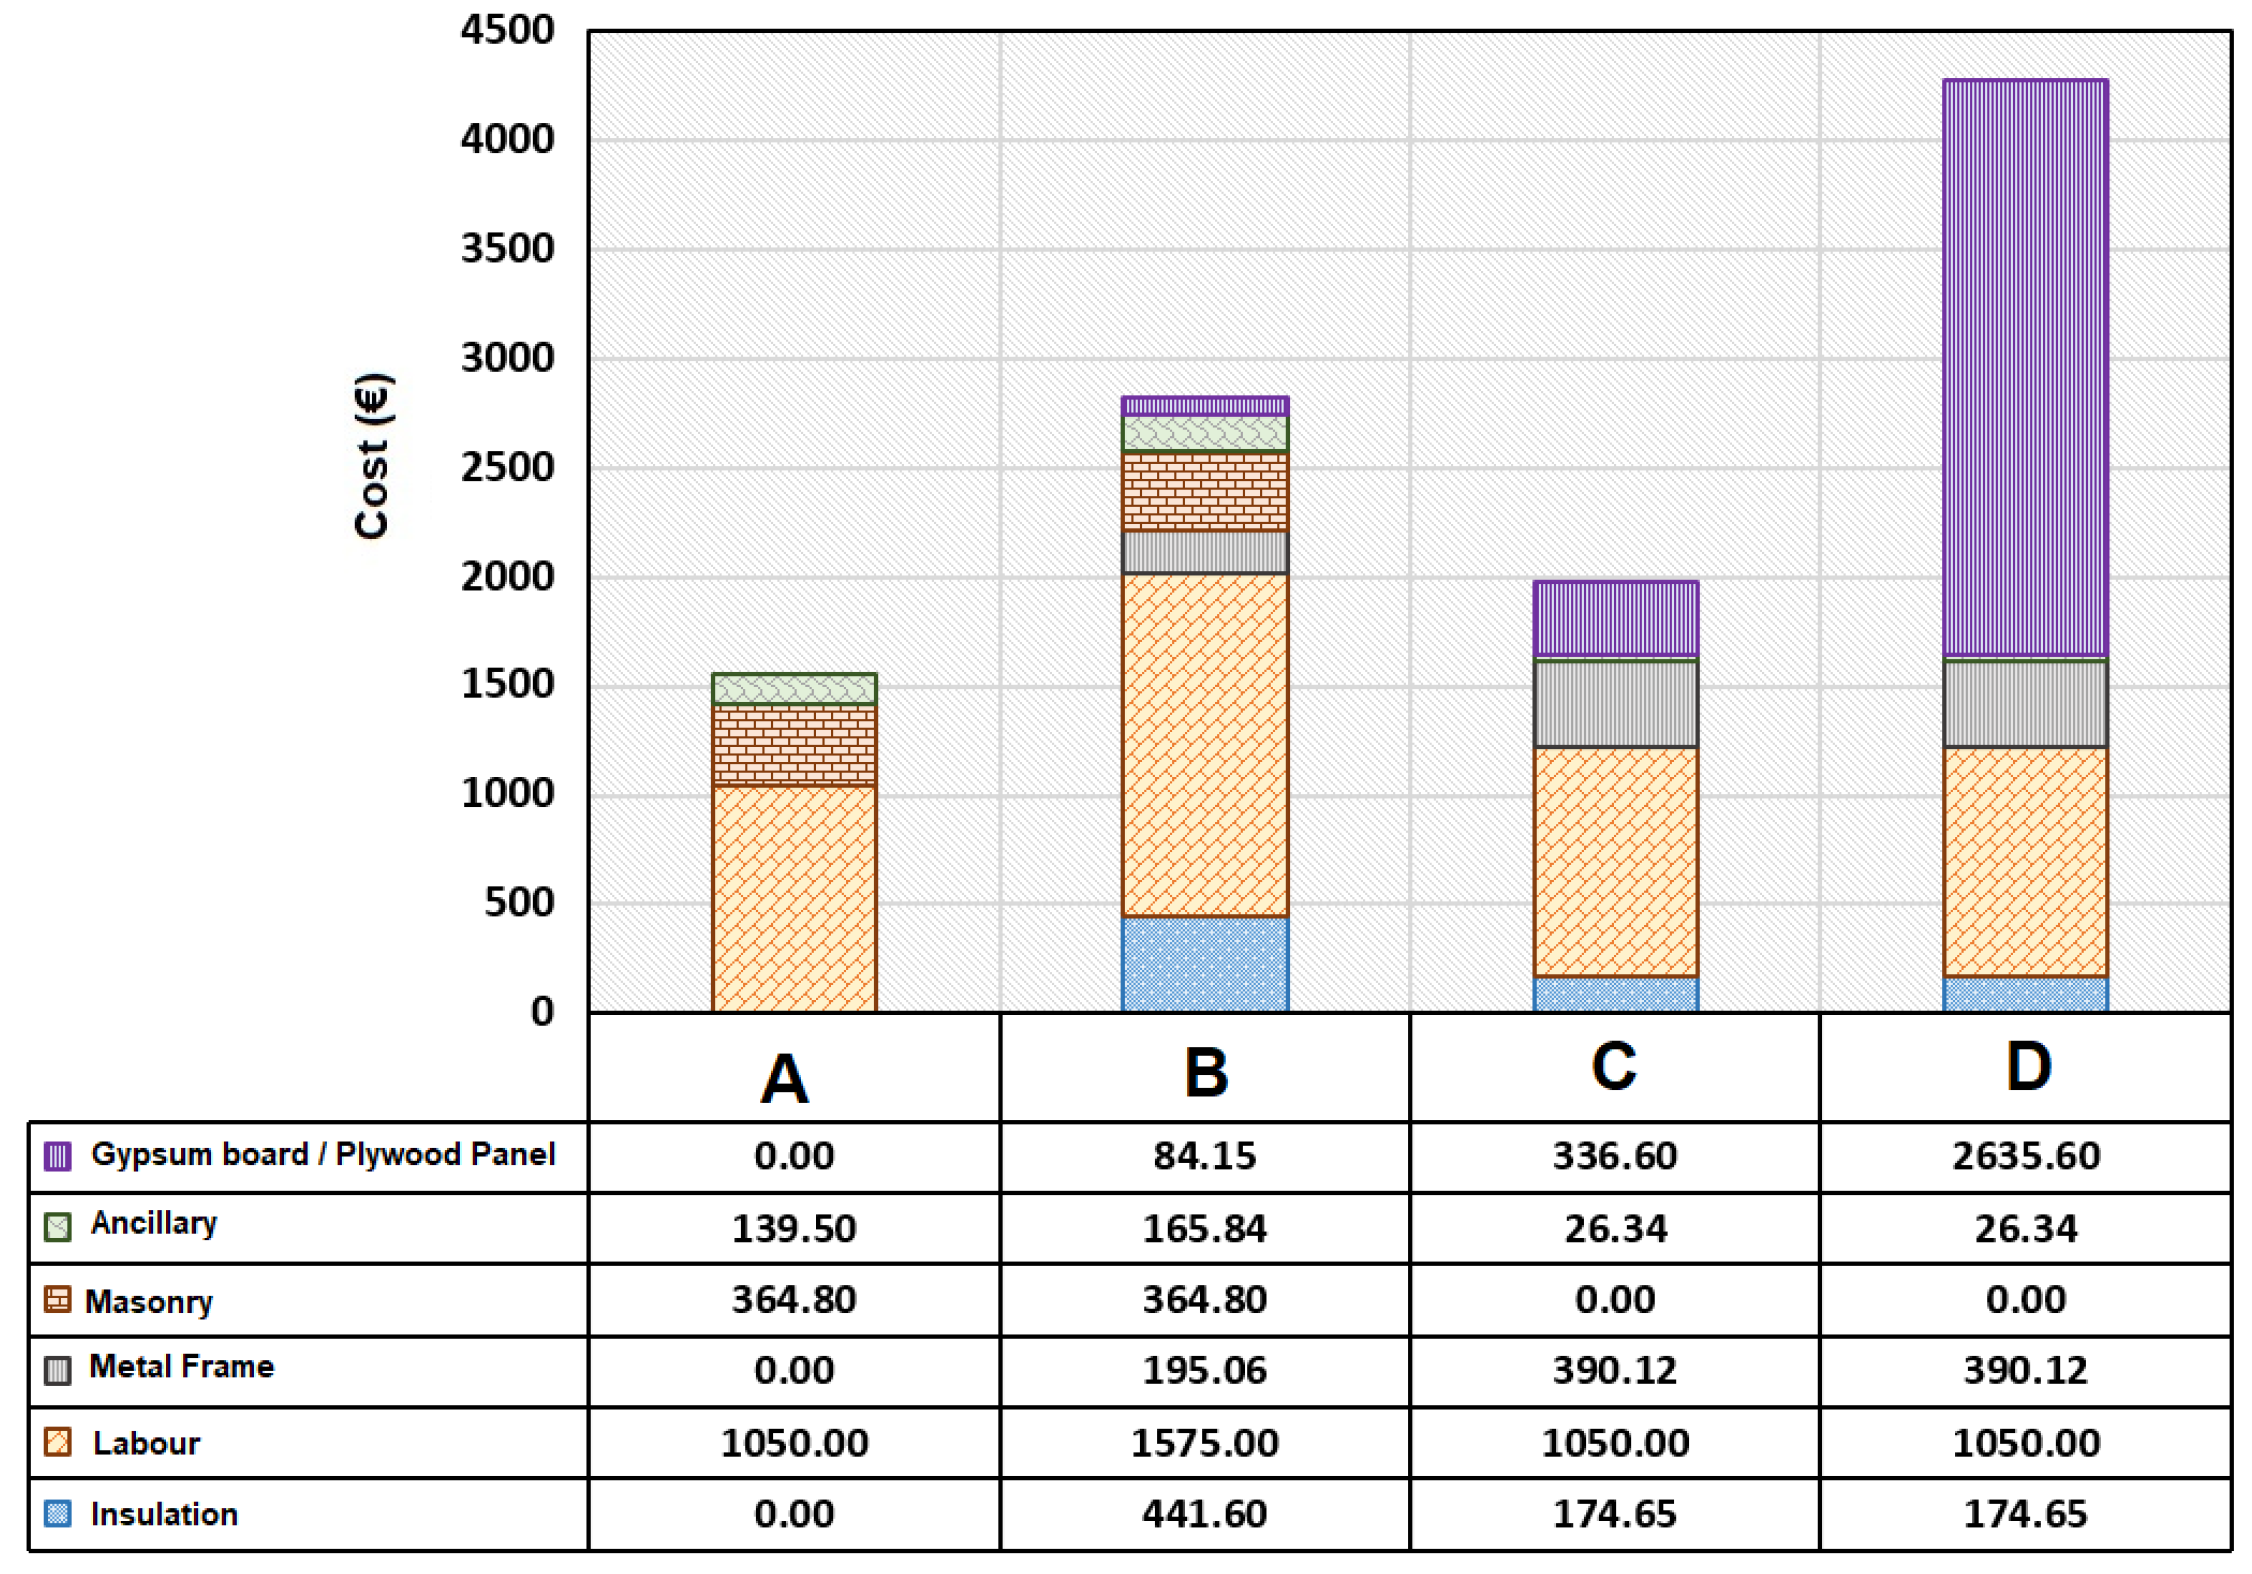

Table 1.
Main characteristics of the wall configurations using Isolmant materials.
| Wall type | Thickness (m) | Insulation thickness (m) |
Superficial mass (kg/m2) | Total Area (m2) |
Rw (dB) |
|---|---|---|---|---|---|
| Perfetto Special 1 | 0.30 | 0.030 | 170 | 29.5 | 67 |
| Perfetto Special 2 | 0.26 | 0.030 | 160 | 29.5 | 63 |
| Perfetto CG | 0.22 | 0.045 | 122 | 29.5 | 55 |
Table 2.
Main characteristics of the wall configurations using FIBRAN materials.
| Wall type | Thickness (m) | Insulation thickness (m) |
Superficial mass (kg/m2) |
Total Area (m2) |
Rw (dB) |
|---|---|---|---|---|---|
| FIBRAN B-040/A13 -1 | 0.10 | 0.04 | 38.6 | 29.5 | 51 |
| FIBRAN B-050/SUPER13 | 0.13 | 0.05 | 53.3 | 29.5 | 59 |
| FIBRAN B-040/A13 - 2 | 0.18 | 0.08 | 40.3 | 29.5 | 62 |
Table 3.
Main characteristics of the novel configurations.
| Wall type | Thickness (m) | Insulation thickness (m) |
Superficial mass (kg/m2) |
Total Area (m2) |
Rw (dB) |
|---|---|---|---|---|---|
| A | 0.12 | 0.00 | 118.0 | 29.5 | 41.4 |
| B | 0.20 | 0.05 | 130.7 | 29.5 | 41.4 |
| C | 0.15 | 0.05 | 51.8 | 29.5 | 59.3 |
| D | 0.16 | 0.05 | 67.0 | 29.5 | 61.5 |
Table 4.
Costs per square meter for the analysed partition walls.
| Wall type | Cost (€ /m2) |
|---|---|
| Perfetto Special 1 | 168.9 |
| Perfetto Special 2 | 147.5 |
| Perfetto CG | 111.7 |
| FIBRAN B-040/A13 – 1 | 115.6 |
| FIBRAN B-050/SUPER13 | 147.15 |
| FIBRAN B-040/A13 – 2 | 122.92 |
| Fermacell | 54.2 |
| A | 51.81 |
| B | 94.2 |
| C | 65.9 |
| D | 142.6 |
Table 5.
Limiting curve from the UNI EN ISO 717-1.
| Frequency (Hz) | UNI EN ISO 717-1 (dB) |
|---|---|
| 100 | 33 |
| 125 | 36 |
| 160 | 39 |
| 200 | 42 |
| 250 | 45 |
| 315 | 48 |
| 400 | 51 |
| 500 | 52 |
| 630 | 53 |
| 800 | 54 |
| 1000 | 55 |
| 1250 | 56 |
| 1600 | 56 |
| 2000 | 56 |
| 2500 | 56 |
| 3150 | 56 |
| Frequency (Hz) | EDT (s) | RT20 (s) | RT30 (s) | RT (s) |
|---|---|---|---|---|
| 50 | 0.551 | - | - | 0.551 |
| 63 | 1.002 | - | - | 1.002 |
| 80 | 0.698 | 1.003 | - | 1.003 |
| 100 | 0.801 | 0.637 | - | 0.637 |
| 125 | 1.218 | 0.606 | 0.511 | 0.511 |
| 160 | 1.009 | 0.782 | 0.797 | 0.797 |
| 200 | 0.458 | 0.796 | 0.685 | 0.685 |
| 250 | 0.843 | 0.759 | 0.713 | 0.713 |
| 315 | 0.620 | 0.636 | 0.708 | 0.708 |
| 400 | 0.482 | 0.582 | 0.592 | 0.592 |
| 500 | 0.485 | 0.640 | 0.679 | 0.679 |
| 630 | 0.577 | 0.434 | 0.526 | 0.526 |
| 800 | 0.394 | 0.482 | 0.561 | 0.561 |
| 1000 | 0.410 | 0.466 | 0.492 | 0.492 |
| 1250 | 0.459 | 0.461 | 0.466 | 0.466 |
| 1600 | 0.415 | 0.427 | 0.416 | 0.416 |
| 2000 | 0.414 | 0.418 | 0.436 | 0.436 |
| 2500 | 0.460 | 0.443 | 0.493 | 0.493 |
| 3150 | 0.391 | 0.491 | 0.490 | 0.490 |
| 4000 | 0.457 | 0.468 | 0.478 | 0.478 |
| 5000 | 0.395 | 0.454 | 0.485 | 0.485 |
| 6300 | 0.393 | 0.430 | 0.424 | 0.424 |
| 8000 | 0.297 | 0.370 | 0.380 | 0.380 |
| 10000 | 0.240 | 0.332 | 0.347 | 0.347 |
| 12500 | 0.182 | 0.274 | 0.292 | 0.292 |
| 16000 | 0.150 | 0.254 | 0.254 | 0.254 |
| 20000 | 0.126 | 0.200 | 0.208 | 0.208 |
Table 7.
Predicted apparent airborne sound insulation index and total cost for each commercial wall configuration.
Table 7.
Predicted apparent airborne sound insulation index and total cost for each commercial wall configuration.
| Wall type |
(dB) |
Total Cost (€) |
|---|---|---|
| Perfetto Special 1 | 58.0 | 5068.0 |
| Perfetto Special 2 | 56.8 | 4424.6 |
| Perfetto CG | 52.5 | 3350.8 |
| FIBRAN B-040/A13 -1 | 47.9 | 3468.3 |
| FIBRAN B-050/SUPER13 | 51.4 | 4414.5 |
| FIBRAN B-040/A13 -2 | 50.9 | 3687.6 |
| Fermacell | 47.3 | 3250.6 |
Table 8.
Predicted apparent airborne sound insulation index and total cost for the proposed innovative wall solutions.
Table 8.
Predicted apparent airborne sound insulation index and total cost for the proposed innovative wall solutions.
| Wall type | (dB) | Total Cost (€) |
|---|---|---|
| A | 41.2 | 1554.3 |
| B | 53.8 | 2826.4 |
| C | 51.4 | 1977.7 |
| D | 52.7 | 4276.7 |
Disclaimer/Publisher’s Note: The statements, opinions and data contained in all publications are solely those of the individual author(s) and contributor(s) and not of MDPI and/or the editor(s). MDPI and/or the editor(s) disclaim responsibility for any injury to people or property resulting from any ideas, methods, instructions or products referred to in the content. |
© 2025 by the authors. Licensee MDPI, Basel, Switzerland. This article is an open access article distributed under the terms and conditions of the Creative Commons Attribution (CC BY) license (http://creativecommons.org/licenses/by/4.0/).
Copyright: This open access article is published under a Creative Commons CC BY 4.0 license, which permit the free download, distribution, and reuse, provided that the author and preprint are cited in any reuse.


