Submitted:
28 April 2025
Posted:
30 April 2025
You are already at the latest version
Abstract
Sugarcane is a globally important crop traditionally bred for sucrose yield, yet its potential as a lignocellulosic biomass resource remains underexplored. This study evaluated 17 diverse sugarcane genotypes across two contrasting environments in northern Queensland at two developmental stages—maximum vegetative growth and peak sucrose accumulation. Cell wall composition, fibre traits, and theoretical digestibility were quantified to assess biomass quality and explore genotype × environment interactions. Results revealed significant genotypic variation in fibre content and digestibility, with younger tissues generally showing higher digestibility due to lower lignification and xylan deposition. While some genotypes showed stable performance across stages and sites, others exhibited pronounced plasticity. Importantly, digestibility declined with age in most genotypes, suggesting benefits to harvesting at earlier stages for bioenergy purposes. The findings support the strategic use of genotype selection and harvest timing to optimize sugarcane for both sucrose and biofuel production. This dual-purpose approach offers a pathway for more sustainable and versatile sugarcane cropping systems.
Keywords:
sugarcane
; biomass digestibility
; lignocellulose
; cell wall composition
; growth stage
; genotype × environment interaction
1. Introduction
Sugarcane (Saccharum spp.) is a major C4 crop cultivated globally for its high sucrose yield, historically optimized through long cropping cycles and selective breeding focused on sugar content. Physiological studies over the past several decades have described in detail the patterns of water relations and sucrose accumulation in sugarcane culms, showing how maturing internodes lose water as sucrose concentration increases, and how this progression correlates with developmental stage and vascular structure [1,2,3]. However, these foundational insights are based on a relatively narrow selection of commercial genotypes, and comparative analyses across genetically diverse sugarcane populations remain scarce, particularly under varying environmental conditions.
To maximize sucrose production, sugarcane is traditionally grown for 12–16 months, allowing time for internode elongation to cease and sucrose to accumulate in the storage parenchyma. This strategy, while effective for sugar extraction, may not align with emerging goals for biomass utilization which prioritize both total stem yield and cell wall digestibility. Unlike sucrose concentration, biomass quality traits—particularly those related to cell wall composition—are less well documented in sugarcane, and their seasonal dynamics across genotypes are poorly understood.
The efficiency of lignocellulosic biomass conversion into biofuels or fermentable products depends largely on the digestibility of the plant cell wall, which governs the release of sugars during enzymatic hydrolysis. Among various compositional metrics, the ratio of glucan to the combined content of lignin and xylan (Glucan/(Lignin + Xylan)) has emerged as a useful proxy for estimating biomass digestibility [4] A higher ratio reflects a cellulose-rich wall with lower fractions of recalcitrant polymers like lignin and hemicellulose, thus enhancing saccharification efficiency.
In sugarcane, hybrids exhibiting reduced lignin and elevated glucan levels have demonstrated superior enzymatic digestibility—glucose conversion rates as high as 31% have been observed in lines with altered lignin content [5]. Studies in other C4 grasses such as maize (Zea mays) and switchgrass (Panicum virgatum) have reinforced this concept, showing that not only the absolute quantities of lignin and xylan, but also their interactions with cellulose influence cell wall recalcitrance [6,7]. Importantly, QTL studies suggest partial genetic independence between sucrose yield and lignin biosynthesis, indicating the potential for breeding dual-purpose ideotypes that retain high sugar or biomass yield along with improved digestibility.
Recent advances in conversion technologies such as ionic liquid and hot water pretreatments have further underscored the relevance of cell wall composition in feedstock optimization [4]. Yet, few studies have systematically quantified glucan, xylan, and lignin fractions in sugarcane across both growth stages and genotypic variation, particularly with the goal of evaluating theoretical digestibility and identifying optimal harvest windows.
Interestingly, several reports suggest that sugarcane digestibility declines with age, coinciding with increased lignification and hemicellulose deposition. This raises a critical consideration: a shorter growth cycle may offer improved digestibility, alongside potentially greater biomass productivity per unit time and land area. Shifting breeding objectives toward high-biomass, high-digestibility cultivars—rather than purely high-sucrose lines—could unlock new value streams from sugarcane in bio-economy contexts.
In this study, 17 sugarcane genotypes ranging in sucrose were grown at two contrasting environments (inland and coastal) and analysed at two developmental stages—maximum vegetative growth and peak sucrose accumulation. The aims were to assess how seasonal development affects cell wall composition and digestibility. In addition, determine whether shorter growth cycles can improve biomass quality in terms of digestibility and yield traits. This integrated approach bridges classical physiology with modern compositional analytics, providing a novel framework for evaluating sugarcane as a multi-use crop that can contribute simultaneously to food, fuel, and fiber value chains.
2. Materials and Methods
2.1. Material
The growth of the 17 sugarcane genotypes was monitored over a plant and two ratoon crops. Fifteen sugarcane genotypes were planted at each of the two trial sites at Mossman and Atherton Tablelands in Northern Queensland. These included six current commercial varieties and nine non-commercial genotypes. The Mossman trial was established at the Mango Park Cane Farm Company, Farm number: 5185 (16°28’38.16"S 145°20’59.16"E). The clones were planted on 2 September 2020. The Tablelands trial was established at the Salvetti Farming Company, Farm number: 6207 (17°6’8"S 145°20’28"E). The trials were planted in a completely randomised design, including three replicate plots per treatment. Each replicate consists of 4 x 10 meters of cane. Billets obtained from disease-free stalks were used as planting material. The Tablelands trial site was fully irrigated and the Mossman site rainfed. Daily maximum and minimum air temperatures, rainfall, daily global incoming radiation for each of the trial sites were extracted from [8]. Photosynthetic active radiation was calculated [9]. Thermal time as growing degree days(GDD) [10] were calculated as previously described using a base temperature of 18oC [11]
2.2. Non-Destructive Sampling
To gather data on germination and crop establishment, both on-ground measurements and aerial photography [12] using drones were utilised. In each plot, ten primary shoots were tagged for easy identification. Non-destructive measurements of stalk elongation and phyllochron development were taken in the field to ensure minimal disruption to canopy development. Monthly measurements were taken for sugarcane throughout the first six months of crop development.The canopy height for sugarcane was measured from the base of the stalk to the first visible dewlap [13].
2.3. Destructive Sampling
Six culm samples were collected from the field plots approximately 6 and 12 months after planting.The culm samples were disintegrated using either a garden mulcher or Dedini laboratory disintegrator at room temperature. The mulched material was then weighed to determine the fresh weight (FW) and transferred to a paper bag to be dried at 70°C until a constant dry weight (DW) was reached (usually 6 to 7 days).
2.4. Millroom Analysis for Primary Quality Components
Samples were analysed with a modified method (Berding and Marston, 2010). Culm samples were disintegrated using a Dedini laboratory disintegrator and then processed using the SpectraCane™ automated NIR-based system [@berding2010]. At the end of each harvesting season, SpectraCane™ is re-calibrated against the conventional laboratory data. In addition, every tenth sample through SpectraCane™ is automatically saved and processed through the conventional laboratory where juice is squeezed from the shredded cane using a hydraulic press. The remaining fibre is then dried and weighed to calculate the fibre content.
2.5. Biomass Composition
All the analyses biomass compositional analysis were conducted at Celignis Analytical using the analytical package P19 (Deluxe lignocellulose: Sugars, Lignin, Extractives, and Ash, protein-corrected lignin, water-soluble sugars, uronic acids, acetyl content and starch).
2.5.1. Extraction of Biomass Component
All extractions were carried out with a Dionex Accelerated Solvent Extractor (ASE) 200 [14] . The extractions were carried out according to the National Renewable Energy Laboratory (NREL) standard operating procedure for determining extractives in biomass [15]. Ash content was determined using a Nabertherm L-240H1SN furnace, according to the NREL operating procedure for the determination of ash in biomass [15].
2.5.2. Cell Wall Constituents
Hydrolysis of the dry extractives-free samples was performed according to a modification of the NREL standard operating procedure for the determination of structural carbohydrates and lignin in biomass [16]. The procedure was divided into two main steps: a two-stage acid hydrolysis of the samples and the gravimetric filtration of the hydrolysate to separate it from the acid-insoluble residue (AIR) [15]. Klason lignin was calculated by determining the weight difference between the AIR and its ash content. Acid-soluble lignin was measured by determining the absorbance of an aliquot of the hydrolysate at 240 nm using an Agilent 8452 UV–vis spectrophotometer. The results are then converted to ASL based on Beer’s law [17]. The lignocellulosic sugars resulting from hydrolysis were determined by ion-chromatography techniques adapted from [16]. The method consisted of diluting the hydrolysate samples 20× with a deionised water solution containing known amounts of melibiose as an internal standard [14]. The diluted hydrolysates were filtered and then analysed with HPLC and fitted with an electrochemical detector (PAD).
2.5.3. Water Solubles
The sugars in the water-soluble fraction Section 2.5.1 were analysed using ion–chromatography [14].
2.6. Computational Analysis
The computational analyses used Python (version X.X.X) in the Spyder Integrated Development Environment (IDE; version 6.0.3) [18,19]. Data preprocessing, statistical modelling, and network visualizations were implemented using the NumPy (Numerical Python)(2.2.2), pandas (2.2.3), SciPy (1.15.2), matplotlib (3.10.0), scienceplots (2.1.1) and seaborn (0.13.2) libraries in Python. To visualize strong trait correlations, we constructed an undirected network graph were constructed using NetworkX (3.4.2).
3. Results and Discussion
3.1. Environmental Conditions and Growth
There was a notable contrast between the two locations in terms of their daily minimum temperatures. The tablelands site had lower night temperatures compared to the Mossman site, which consequently leads to a faster accumulation of heat units at the latter (Figure S1B,D). However, the accumulation of photosynthetic active radiation remains comparable between the two research sites, as shown in (Figure S1A,C).
Sugarcane height and biomass do not increase in a linear fashion. Instead, growth can be best modelled by the application of a logistic function. Growth of the genotypes (expressed as increase in height) is presented in (Figure S2A). The genotypes differ significantly in the time point where the maximum growth rate is achieved (Figure S1B). The maximum biomass accumulation rate is reached between 4.5 and 6 months after planting (1050 - 1250 GDD18) .
3.2. Water and sucrose content
A two-way ANOVA was conducted to evaluate the influence of genotype, crop age, and location on moisture content in sugarcane culms (Table S1). Results revealed that genotype had a highly significant effect (), confirming inherent genetic variation in water retention capacity among sugarcane cultivars. Crop age also had a significant impact: mature stems (12 months) consistently showed lower moisture content than younger stems (6 months), a trend observable across both trial locations (Figure 1).
This age-dependent decline in stem moisture content is a well-documented physiological transition in sugarcane and other Poaceae. During the early growth phase, sugarcane internodes are expanding, metabolically active, and maintain high water content (% FW) to support turgor-driven elongation and nutrient transport [1,3]. As internodes mature, cell wall stiffening and cessation of growth lead to increased turgor pressure (), which in turn limits further water influx despite continued sugar accumulation and increasingly negative osmotic potential ().
The significant age effects align with physiological transitions from juvenile to mature tissues, where lignification and reduced cellular hydration are expected.
This apparent paradox—lower water content despite higher sugar concentration—can be explained by changes in total water potential () and a reduction in the driving gradient for water uptake. Furthermore, sugar accumulation physically displaces water in the storage parenchyma, leading to a relative reduction in water content on a dry-weight basis [2,18].
Environmental factors also played a significant role. The Tablelands site, characterized by lower night temperatures and slower accumulation of thermal time, showed distinct differences in moisture profiles compared to Mossman (Figure 2). The ANOVA (Table ) confirmed significant location × age and location × Genotype interactions, indicating that both environment and genotype modulate water content during the cropping season. These findings align with prior work that showed that temperature and soil conditions affect internal water dynamics in sugarcane culm [19].
In parallel, sucrose content showed the inverse trend. Older internodes (12 months) consistently had higher sucrose concentrations (Figure 2), and the ANOVA results (Table S2). highlighted strong effects of genotype, location, and all interaction terms. This supports the physiological observation that as sugar accumulates, water content declines, reflecting the shift from water-rich, expanding tissues to sugar-rich, mature storage tissues [2,18].
Importantly, significant Genotype × Age and Genotype × Location interactions for both moisture and sucrose content highlight the genotypic plasticity in response to environmental conditions and developmental stage. Some genotypes maintained higher water content at maturity—possibly highlighting differences in the timing of maturation and sucrose accumulation.
3.3. Biomass Yield
Although it is customary to express sugarcane yield as TCH the significant variation in moisture content not only at growth stage but also between genotypes can provide misleading information on the true amount of biomass available for processing. As the purpose of this study is focussed on biomass production potential all yield data has been converted and yield data is expressed as tonne dry weight of cane per hectare (TCHDW).
Figure 3.
Sucrose content (% DW) of sugarcane genotypes across two trial locations during the crop cycle at Mossman (A) and the Tablelands (B). The boxplots show the distribution of each genotype’s performance. Box colors reflect crop age. Young (6 months) and mature (12 months) after planting/ratooning.
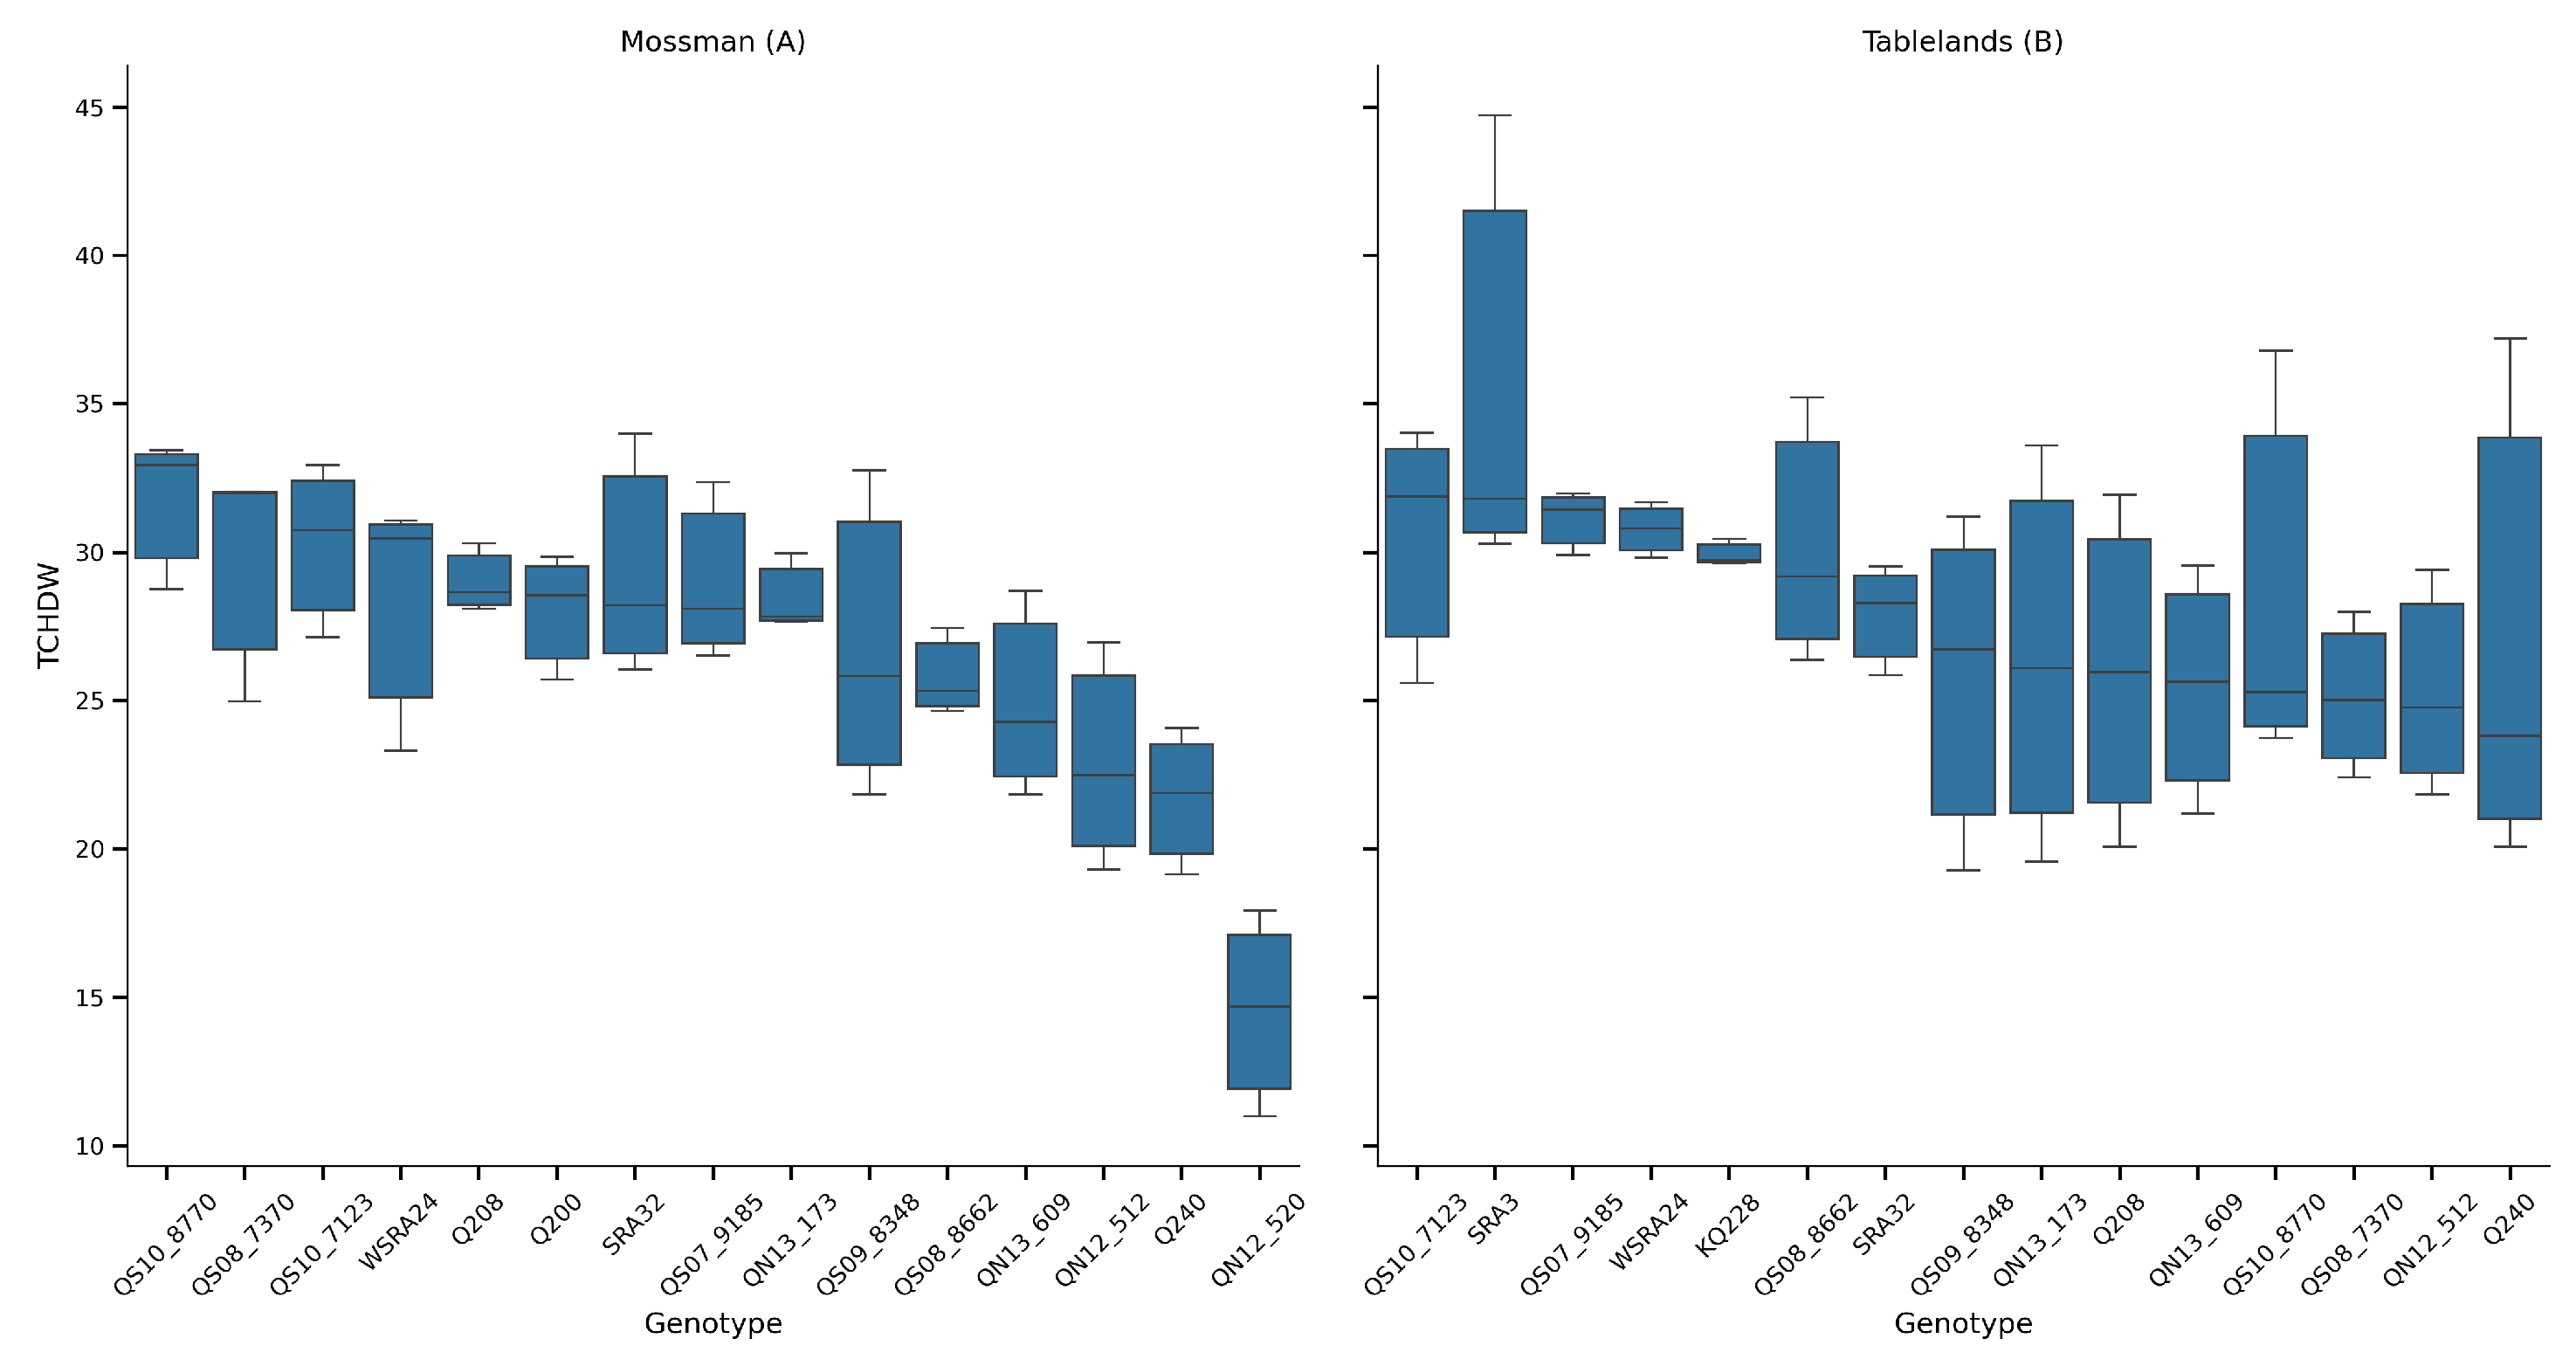
A two-way ANOVA was conducted to assess the effects of genotype, cycle, and location on TCHDW. The analysis revealed that genotype (G) and cycle (C) had highly significant effects on TCHDW (P < 0.001), and their interaction (G × C) was also statistically significant (P = 0.036), suggesting some genotype-specific sensitivity to seasonal conditions. Location effects, when assessed via a genotype × location model, were also highly significant (P < 0.001), indicating clear environmental influences on trait expression. The residual variance remained comparatively low, confirming good model fit.

Table 1.
Analysis of variance (ANOVA) summary for dry weight tonnes cane per hectare (TCHDW) across Genotype, growth cycle and production area. Significant effects () are highlighted.
Table 1.
Analysis of variance (ANOVA) summary for dry weight tonnes cane per hectare (TCHDW) across Genotype, growth cycle and production area. Significant effects () are highlighted.
| Parameter | Effect | Sum Sq | df | F-value | P-value |
|---|---|---|---|---|---|
| TCHDW | C(Genotype) | 31195.3 | 16 | 50 | <0.001 |
| TCHDW | C(Location) | 166.98 | 1 | 4.28 | 0.039 |
| TCHDW | C(Genotype):C(Location) | 1574.91 | 16 | 2.52 | 0.002 |
| TCHDW | Residual | 12869 | 330 |
1Growth cycle. Plant and ratoon crop and average over the two crops.; 2 Two production areas. The Tablelands and Mossman areas.
3.4. Fibre Content
The fibre content in sugarcane genotypes was examined across the two locations (Mossman and Tablelands), and developmental age (young and mature). A combination of two-way ANOVA and post hoc Tukey HSD tests was used to assess main effects and interactions. Boxplots were then used to visualize genotype-specific differences and significance groupings under each condition.
A two-way ANOVA revealed a strong and highly significant effect of genotype on fibre content, expressed as a percentage of total dry weight (F = 231.04, P < 0.001; Table S3). Across both cropping cycles and production areas, genotypic differences accounted for a substantial proportion of the observed variance. This was further confirmed by the Tukey HSD test, which showed distinct groupings among genotypes (Figure 4). High-fibre genotypes such as QS97-9185 and QS07-2122 consistently ranked among the top performers, while others, such as QS08-8682, exhibited significantly lower fibre content.
These results indicate that fibre content is under strong genetic control, with consistent differences between genotypes across environments. Similar findings have been reported in sugarcane and other grasses, where fibre traits are known to be highly heritable and amenable to selection [20,21,22].
The cropping cycle (plant vs ratoon) had no significant effect on fibre content (P = 0.567), and no significant interaction was detected between genotype and cycle (P = 0.274). This suggests that fibre content remains stable between the plant and ratoon crops, and that genotypic rankings are largely preserved across cycles. Such stability is advantageous for breeding programs, as it reduces the need to evaluate each genotype in multiple crop cycles to confirm trait performance.
In contrast, location and developmental stage (age) had significant effects on fibre content ), as did their interactions with genotype. These findings indicate that while genotype remains a dominant driver, environmental conditions and tissue maturity modulate fibre content in a genotype-dependent manner. Such genotype × environment (G × E) interactions are well-documented in sugarcane [21,23]and highlight the importance of multi-environment testing in breeding programs targeting fibre traits.
The boxplots reveal a general trend toward lower fibre content in mature tissues, particularly in the later harvest stages (Panels C and D). This finding is somewhat counterintuitive, given that cell wall lignification and pentose deposition typically increase as tissues mature [24]. However, this apparent paradox may be explained by the disproportionate accumulation of sucrose during the later stages of internode development.
Once internode elongation ceases, sugarcane tissues continue to accumulate biomass—primarily in the form of sucrose—at a much faster rate than cell wall components [2,18]. As a result, the proportion of fibre in the dry matter declines, even though the absolute amount of fibre may continue to rise. This suggests that cell wall biosynthesis slows post-elongation, whereas sucrose loading and storage accelerate.
From a breeding perspective, these results emphasize the need to consider both developmental stage and environmental context when selecting for fibre traits. Genotypes like QS97-9185, which maintain high fibre content across stages and environments, may be valuable for bioenergy applications, where lignocellulosic biomass is the target. Conversely, genotypes with low fibre content and high sucrose accumulation in mature tissues, such as QS08-8682, are better suited for conventional sugar production.
Furthermore, the significant G × Age interaction highlights the plasticity of fibre content during development, implying that selection strategies should carefully define the target harvest window. For dual-purpose applications—where both sugar and fibre are valued—intermediate genotypes may offer a balanced solution.
3.5. Fibre Composition
The lignocellulosic biomass (fibre) constitutes the structural component of the sugarcane plant cell walls and comprises mainly cellulose, hemicellulose, and lignin. In grasses like sugarcane, maize, and sorghum, the digestibility of this fraction significantly affects the efficiency of ruminant nutrition and bioethanol conversion processes. Sugarcane is especially important in tropical regions as both a sugar and bioenergy crop, and its fibre digestibility varies substantially across genotypes.
Generally the sugarcane cell wall composition is described in terms of cellulose (29-44%), hemicellulose (27-3%), lignin (19-43%) and pectins (which includes uronic acids) approximately 10%. The hemicellulose fraction of sugarcane is primarily composed of hexosans(polysaccharides made up of hexose sugars like glucose and mannose), pentosans (polysaccharides composed of pentose sugars such as xylose and arabinose) and uronic acids.
Sugarcane hemicellulose primarily consists of glucuronoarabinoxylan (GAX), a complex polysaccharide with a backbone of -linked xylose residues. This backbone is variably substituted with side chains of arabinose and glucuronic acid, among other components. The ratio of these substituents, particularly arabinose to glucuronic acid, influences the structural properties and digestibility of the hemicellulose. The contribution of th major compounds in the lignocellulosic fraction in both youn and mature sugarcane from both locations were determined (Table S4)
There are varietal and maturity influences on the hemicellulose composition of sugarcane.
An analysis of variance (ANOVA) was performed to assess the influence of location, growth cycle, and their interaction on the concentration of major cell wall components glucan, Xylan, Lignin, and Uronic acidsin sugarcane. The summary of the results is presented in (Table 3).
Glucan content was significantly affected by both location (F = 40.5,) and the interaction between location and age (F = 20.1,). However, growth cycle (age) alone did not significantly influence glucan levels (P = 0.2157). These results suggest that environmental conditions between the two locations—Tablelands and Mossman—strongly influence glucan deposition, and that this effect is further modulated by developmental stage. Previous studies have demonstrated that environmental factors such as temperature, soil type, and rainfall can significantly affect cellulose biosynthesis in sugarcane and other C4 grasses [25,26].
For xylan, significant effects were observed for location (F = 94.3,), age (F = 17.8, ), and their interaction (F = 4.7, P = 0.0304). These findings indicate that hemicellulose content is influenced by both spatial and temporal factors, with evidence of interaction effects implying genotype-by-environment interplay. Xylan variation has been linked to differences in developmental regulation and environmental plasticity, affecting digestibility and cell wall architecture [27].
Lignin accumulation was significantly influenced by location (F = 9.7, ) and age (F = 82.5, ), but not by their interaction. This result aligns with prior findings that lignin biosynthesis is largely developmentally regulated but can also be modified by environmental stressors such as temperature and water availability [28]. The strong age effect suggests a marked increase in lignification during stem maturation, which is critical in determining forage quality and biomass recalcitrance.
Table 2.
Analysis of variance (ANOVA) summary for the major cell wall components across genotype, growth cycle and production area. Significant effects () are highlighted.
Table 2.
Analysis of variance (ANOVA) summary for the major cell wall components across genotype, growth cycle and production area. Significant effects () are highlighted.
| Componentl | Effect | Sum Sq | df | F-value | P-value |
|---|---|---|---|---|---|
| Glucan | C(Location) | 520.5 | 1 | 40.5 | |
| C(Age) | 19.7 | 1 | 1.5 | 0.2157 | |
| C(Location):C(Age) | 258.2 | 1 | 20.1 | ||
| Residual | 6307.0 | 491 | |||
| Xylan | C(Location) | 530.5 | 1 | 94.3 | |
| C(Age) | 99.9 | 1 | 17.8 | ||
| C(Location):C(Age) | 26.5 | 1 | 4.7 | 0.0304 | |
| Residual | 2761.3 | 491 | |||
| Lignin | C(Location) | 11.6 | 1 | 9.7 | 0.0020 |
| C(Age) | 99.1 | 1 | 82.5 | ||
| C(Location):C(Age) | 3.0 | 1 | 2.5 | 0.1144 | |
| Residual | 589.4 | 491 | |||
| Uronic Acids | C(Location) | 115.2 | 1 | 494.0 | |
| C(Age) | 134.8 | 1 | 578.3 | ||
| C(Location):C(Age) | 130.2 | 1 | 558.5 | ||
| Residual | 114.5 | 491 |
1 Growth cycle. Plant and ratoon crop and average over the two crops; 2 Two production areas. The Tablelands and Mossman areas.
Uronic acid content was significantly affected by all factors: location, age , and their interaction (Table 3), indicating highly dynamic regulation. Uronic acids, primarily galacturonic and glucuronic acids, contribute to pectin and hemicellulose structure and are involved in cross-linking of cell wall polysaccharides.The pronounced interaction effect indicates that different locations and growth stages can cause significant shifts in uronic acid levels, possibly through differential activation of pectin-modifying enzymes.
Understanding the variation in cell wall components is crucial for improving sugarcane biomass digestibility for bioenergy. Cell wall traits such as low lignin and optimized polysaccharide content enhance saccharification efficiency [29]. The observed environmental and developmental effects underscore the importance of considering genotype × environment interactions in breeding programs aimed at producing sugarcane varieties tailored for cell wall-based bioenergy applications.
3.6. Digestibility
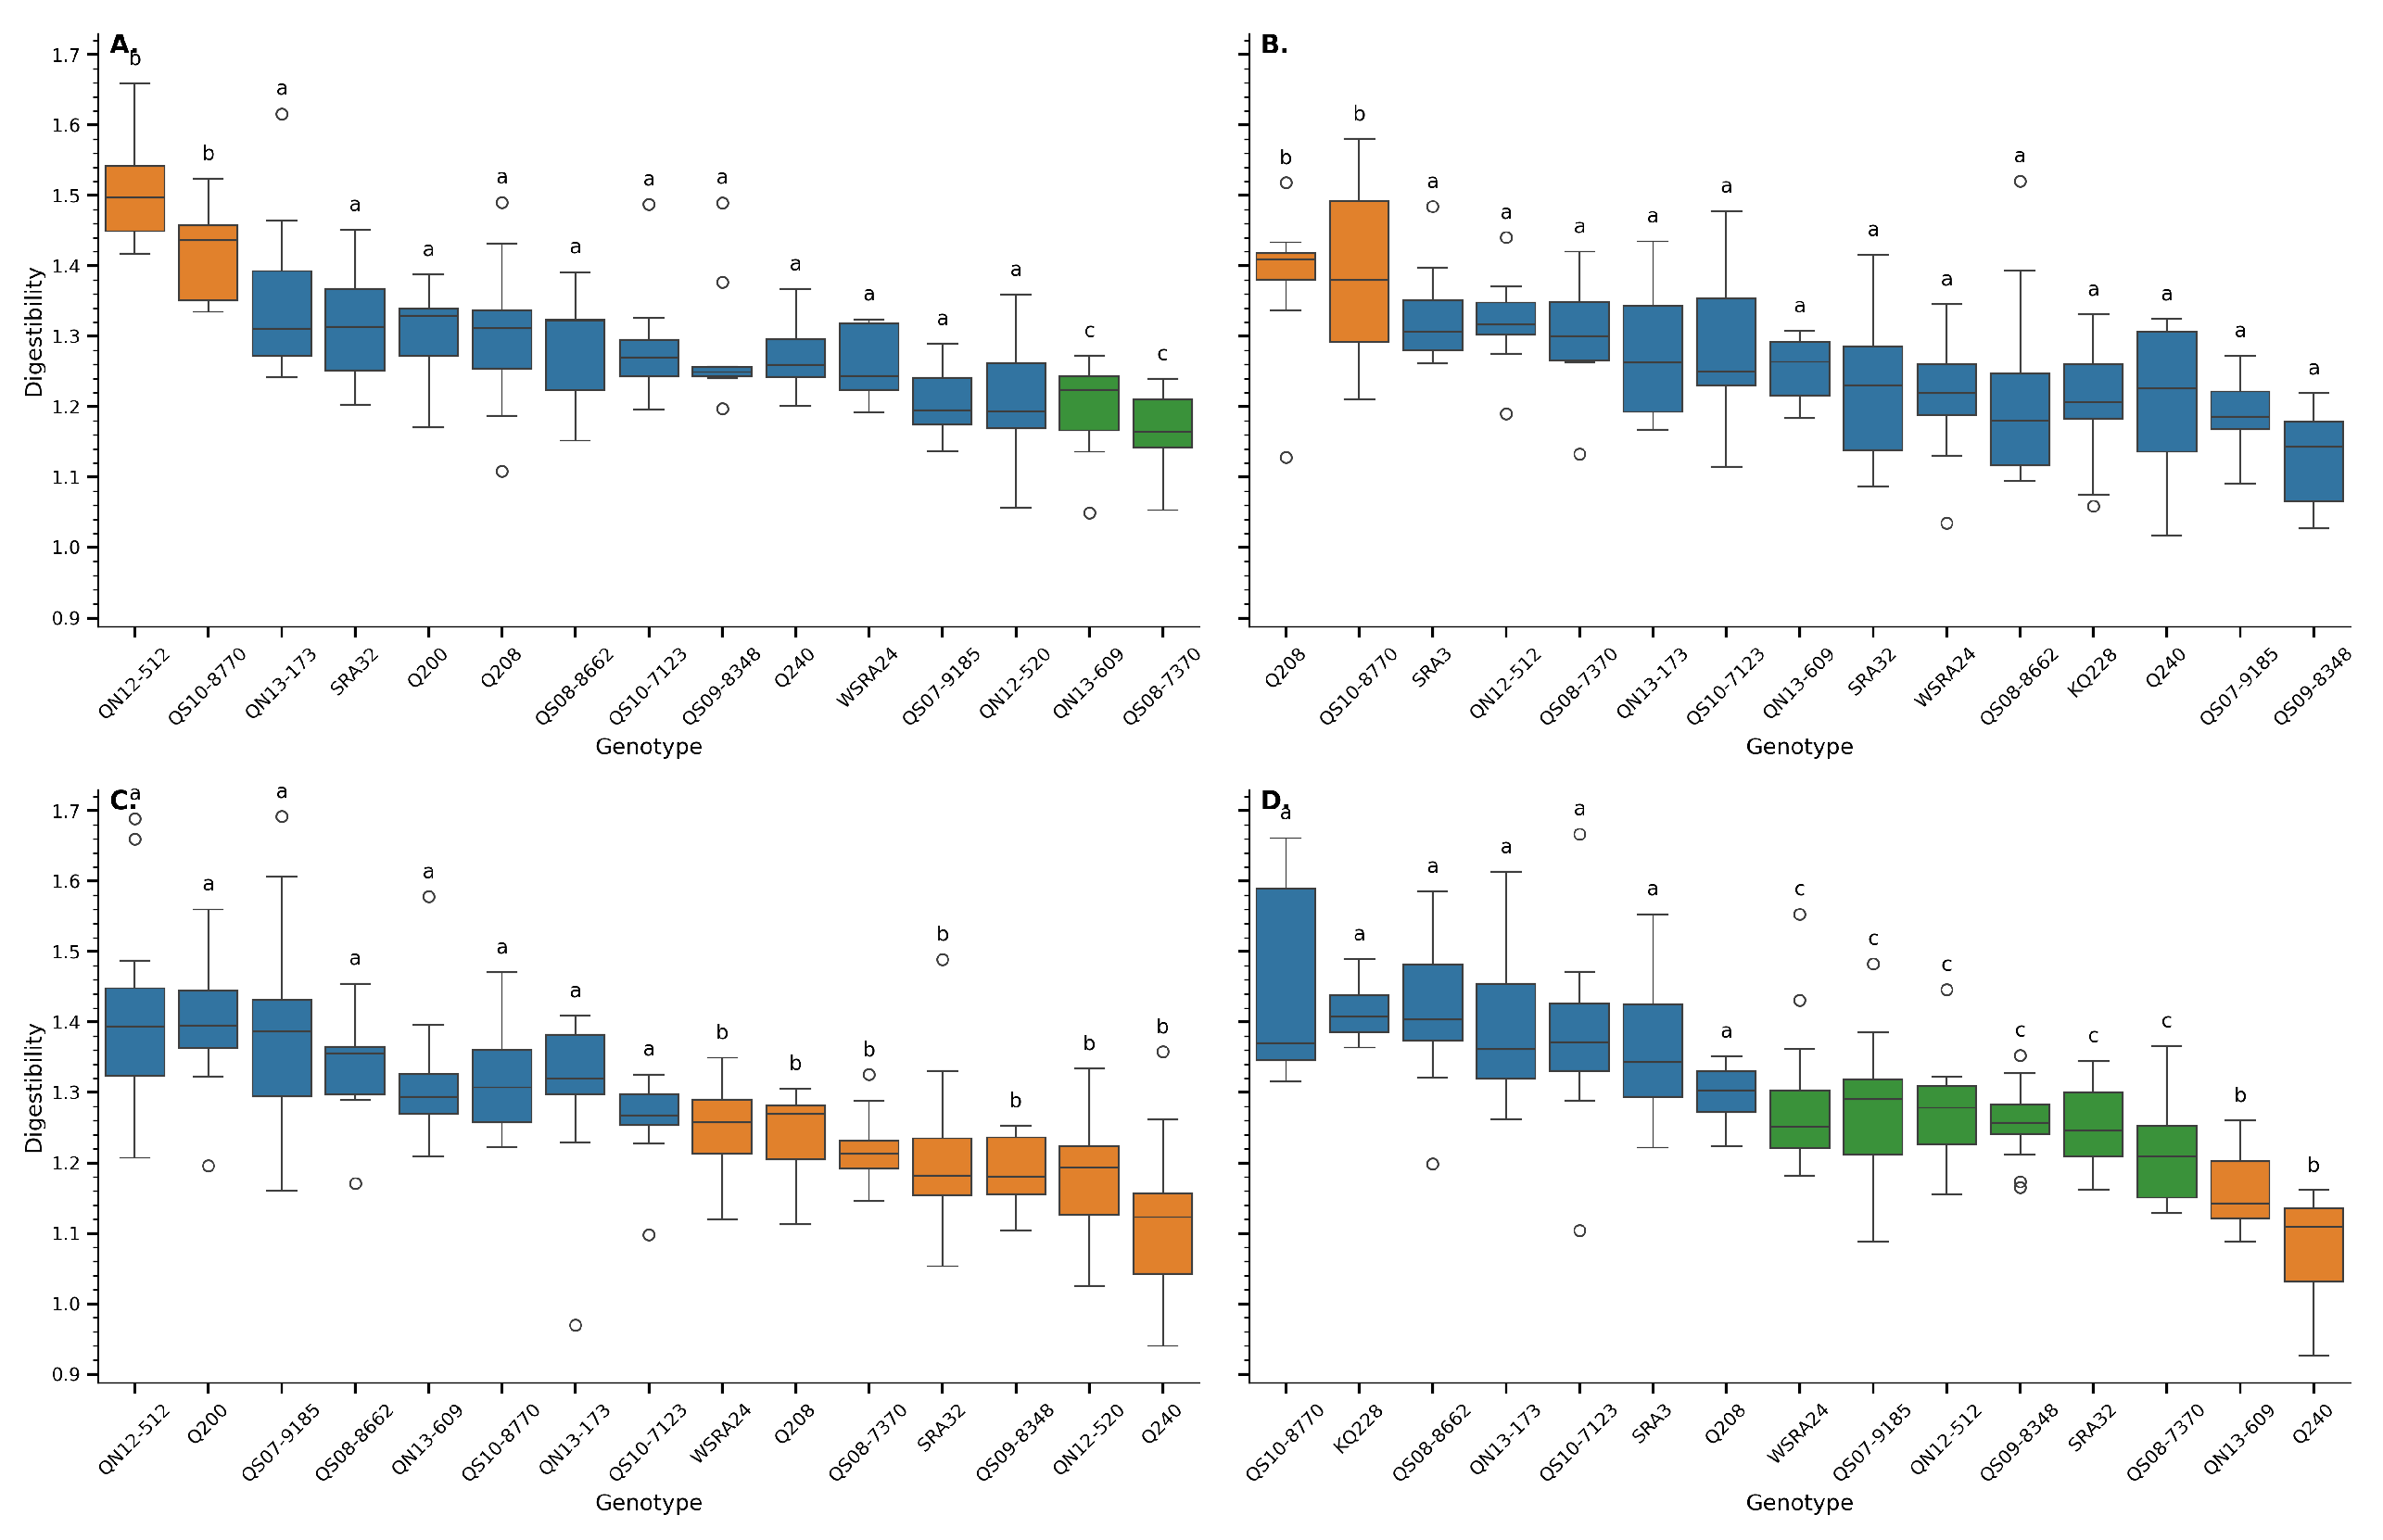
Digestibility, calculated as the ratio of glucan to the sum of xylan and lignin (digestibility = glucan / [xylan + lignin]), revealed marked genotypic variation across sugarcane genotypes and developmental stages (Figure 5). The ANOVA (Table 3) confirmed a highly significant effect of genotype on digestibility across all tested combinations (), indicating that genetic background is a key determinant of fibre composition and, consequently, the potential for enzymatic degradation.
In all panels of Figure 5, which represent different combinations of location and developmental stage (Mossman and Tablelands at both young and mature stages), boxplots are ordered by mean fibre content, with noticeable shifts in genotype rankings. Several genotypes consistently exhibited higher digestibility values, particularly in the young stages (panels A and B), which corresponds with the reduced lignification and xylan accumulation known to occur earlier in internode development [30,31].
The statistical analysis also demonstrated a significant interaction between genotype and age (), emphasizing that the response of fibre digestibility to maturation differs by genotype. This interaction was visually apparent in the contrasting rankings between panels A/B (young) and C/D (mature). For instance, some genotypes ranked highly at early stages but showed significant reductions in digestibility upon maturation, likely due to increased lignin deposition during cell wall thickening [4].
Digestibility decreases with maturity due to increased lignin deposition, especially in the rind compared to the pith of sugarcane internodes [32,33]. Early-harvested material often shows better digestibility profiles.
Table 3.
Analysis of variance (ANOVA) summary for fibre content as a % of total dry weight across genotype, growth cycle and production area. Significant effects () are highlighted.
Table 3.
Analysis of variance (ANOVA) summary for fibre content as a % of total dry weight across genotype, growth cycle and production area. Significant effects () are highlighted.
| Trait | Effect | df | Sum of Squares | Mean Square | F-value | P-value |
|---|---|---|---|---|---|---|
| Digestibility | C(Genotype) | 16 | 2.89 | 0.18 | 16.44 | |
| Digestibility | C(Cycle) | 2 | 0.01 | 0.0 | 0.31 | 0.733 |
| Digestibility | C(Genotype):C(Cycle) | 32 | 0.34 | 0.01 | 0.97 | 0.515 |
| Digestibility | Residual | 669 | 7.34 | 0.01 | nan | nan |
| Digestibility | C(Genotype) | 16 | 141.68 | 8.85 | 868.7 | |
| Digestibility | C(Location) | 1 | 0.02 | 0.02 | 2.24 | 0.135 |
| Digestibility | C(Genotype):C(Location) | 16 | 1.59 | 0.1 | 9.74 | |
| Digestibility | Residual | 690 | 7.03 | 0.01 | nan | nan |
| Digestibility | C(Genotype) | 16 | 2.89 | 0.18 | 19.09 | |
| Digestibility | C(Age) | 1 | 0.04 | 0.04 | 4.34 | 0.038 |
| Digestibility | C(Genotype):C(Age) | 16 | 1.16 | 0.07 | 7.66 | |
| Digestibility | Residual | 686 | 6.49 | 0.01 | nan | nan |
1 Growth cycle. Plant and ratoon crop and average over the two crops; 2 Two production areas. The Tablelands and Mossman areas.
While genotype had a pronounced effect, the production location (Mossman vs. Tablelands) showed no significant main effect on digestibility (P = 0.135), although the genotype-by-location interaction approached significance (P = 0.001). This suggests that environmental modulation of digestibility traits is complex and may depend on specific genotype responses rather than broad location-based effects.
A consistent trend was observed where digestibility declined with plant age (P = 0.038), supporting the notion that fibre becomes more recalcitrant as internodal tissues mature. The significant genotype × age interaction () underlines the importance of evaluating fibre traits at different developmental stages to fully capture genotypic potential. This has practical implications for breeding programs targeting bioenergy applications, as genotypes maintaining higher digestibility at maturity would be particularly valuable for reducing preprocessing requirements in lignocellulosic biomass conversion [29,34].
The Tukey HSD test further delineated groupings within each panel (Figure 5), identifying genotypes that were not significantly different at P = 0.05. These groupings offer practical value for identifying statistically robust top performers within each developmental and environmental context. Notably, some genotypes consistently clustered among the most digestible across multiple panels, indicating stable expression of favourable cell wall composition traits.
4. Conclusions
This study demonstrates that lignocellulosic quality in sugarcane is strongly influenced by genotype, growth stage, and environment. Notably, genotypes differed significantly in fibre content and digestibility, with some maintaining superior traits across both developmental stages and locations. Digestibility generally declined with age due to increased lignification, but genotypic variation in this decline suggests opportunities for breeding lines that retain higher biomass quality at maturity. The integration of physiological, agronomic, and compositional analyses supports the feasibility of selecting sugarcane genotypes optimized for both high biomass yield and improved digestibility. These findings highlight the potential of sugarcane as a dual-purpose crop for sugar and bioenergy, particularly when grown under shortened cycles to capitalize on peak digestibility windows.
Acknowledgement
The project received financial support from the Cooperative Research Centre for Developing Northern Australia, the University of Queensland, and the Queensland Government. The field trials were made possible by the generous provision of land and farming infrastructure by Donald Murday, Jason Salvetti, and Rajinder Singh. I would also like to express my gratitude to the following institutions for their critical support in the analyses and data collection presented in this report: Sugar Research Australia for providing research facilities, expertise, and access to specialised equipment, including NIR and RPA, which were invaluable for conducting the experiments and analyses; and Celignis Limited for their analysis of lignocellulosic and water-soluble components. Furthermore, I acknowledge Drewe Burgess, Dan Hayes, Robert Henry, Sijesh Natarajan, and David de Souza, who actively participated in discussions, shared their expertise, and provided invaluable input throughout the course of this project. Technical support and assistance were provided by Drewe Burgess, Rebecca McHardy, and Simon Engdahl in establishing, monitoring, and sample collection during the field trials.
References
- Moore, P.H. Temporal and Spatial Regulation of Sucrose Accumulation in the Sugarcane Stem. 22, 661–679.
- Lingle, S. Sugar Metabolism during Growth and Development in Sugarcane Internodes. 39, 480–486.
- Welbaum, G.; Meinzer, F.; Grayson, R.; Thornham, K. Evidence for the Consequences of a Barrier to Solute Diffusion Between the Apoplast and Vascular Bundles in Sugarcane Stalk Tissue. 19, 611–623. [CrossRef]
- Li, M.; Pu, Y.; Yoo, C.G.; Gjersing, E.; Decker, S.R.; Ragauskas, A.J. Study of Traits and Recalcitrance Reduction of Field-Grown COMT down-Regulated Switchgrass. 7, 65. [CrossRef]
- family=Souza, given=A.P., p.u.; Grandis, A.; Leite, D.; Buckeridge, M. Sugarcane as a Bioenergy Crop: Challenges and Opportunities for Biomass Quality and Conversion. 65, 102158.
- Barrière, Y.; Thomas, J.; Dénoue, D. QTL Mapping for Lignin Content, Lignin Monomeric Composition, p-Hydroxycinnamate Content, and Cell Wall Digestibility in the Maize Recombinant Inbred Line Progeny F838× F286. 175, 585–595.
- Mazarei, M.; Baxter, H.L.; Li, M.; Biswal, A.K.; Kim, K.; Meng, X.; Pu, Y.; Wuddineh, W.A.; Zhang, J.Y.; Turner, G.B. Functional Analysis of Cellulose Synthase CesA4 and CesA6 Genes in Switchgrass (Panicum Virgatum) by Overexpression and RNAi-mediated Gene Silencing. 9, 1114.
- Jeffrey, S.; Carter, J.; Moodie, K.; Beswick, A. Using Spatial Interpolation to Construct a Comprehensive Archive of Australian Climate Data. 16, 309–330. [CrossRef]
- Meek, D.W.; Hatfield, J.L.; Howell, T.A.; Idso, S.B.; Reginato, R.J. A Generalized Relationship between Photosynthetically Active Radiation and Solar Radiation1. 76, 939–945.
- Yang, S.; Logan, J.; Coffey, D. Mathematical Formulae for Calculating the Base Temperature for Growing Degree Days. 74, 61–74.
- Botha, F.C.; Marquardt, A. Metabolic Control of Sugarcane Internode Elongation and Sucrose Accumulation. 14, 1487.
- Natarajan, S.; Basnayake, J.; Wei, X.; Lakshmanan, P. High-Throughput Phenotyping of Indirect Traits for Early-Stage Selection in Sugarcane Breeding. 11, 2952. [CrossRef]
- family=Dillewijn, given=C., p.u. Botany of Sugarcane; Chronica Botanica Co.
- Pisanó, I.; Gottumukkala, L.; Hayes, D.J.; Leahy, J.J. Characterisation of Italian and Dutch Forestry and Agricultural Residues for the Applicability in the Bio-Based Sector. 171, 113857. [CrossRef]
- Sluiter, A.; Hames, B.; Ruiz, R.; Scarlata, C.; Sluiter, J.; Templeton, D. family=Crocker, given=DLAP, g.i. Determination of Structural Carbohydrates and Lignin in Biomass. 1617, 1–16.
- Hayes, D.J. Development of near Infrared Spectroscopy Models for the Quantitative Prediction of the Lignocellulosic Components of Wet Miscanthus Samples. 119, 393–405.
- Bhagia, S.; Li, H.; Gao, X.; Kumar, R.; Wyman, C.E. Flowthrough Pretreatment with Very Dilute Acid Provides Insights into High Lignin Contribution to Biomass Recalcitrance. 9, 1–15.
- Rae, A.L.; Grof, C.P.; Casu, R.E.; Bonnett, G.D. Sucrose Accumulation in the Sugarcane Stem: Pathways and Control Points for Transport and Compartmentation. 92, 159–168.
- Inman-Bamber, N.; Smith, D. Water Relations in Sugarcane and Response to Water Deficits. 92, 185–202. [CrossRef]
- Piperidis, G.; Jackson, P.A. Marker-Assisted Breeding in Sugarcane: Progress and Challenges. 5, 134–145.
- Jackson, P.A. Breeding for Improved Sugar Content in Sugarcane. 92, 277–290. [CrossRef]
- Oliveira, K.M. Genetic Architecture and Heritability of Biomass Yield and Its Components in Sugarcane. 134, 2219–2234.
- Bischoff, K.P.; Gravois, K.A.; Reagan, T.E.; Hoy, J.W. Genetic Variation for Resistance to Multiple Diseases and Pests in Sugarcane. 107, 106–115.
- Zhao, Q.; Dixon, R.A. The ‘Ins’ and ‘Outs’ of Lignin Biosynthesis: Building Blocks, Traffic and Beyond. 61, 22–29.
- family=Weijde, given=T., p.d.u.; Alvim Kamei, C.; Torres, A.; Vermerris, W.; Dolstra, O.; Visser, R.; Trindade, L. Genetic Variation in Cell Wall Composition and Biomass Digestibility for Bioenergy Production Using Miscanthus. 112, 1243–1257. [CrossRef]
- Wang, J.; Nayak, S.; Koch, K.; Ming, R. Carbon Partitioning in Sugarcane (Saccharum Species). 4, 201.
- Scheller, H.V.; Ulvskov, P. Hemicelluloses. 61, 263–289.
- Grabber, J.H. How Do Lignin Composition, Structure, and Cross-linking Affect Degradability? A Review of Cell Wall Model Studies. 45, 820–831.
- Himmel, M.E.; Ding, S.Y.; Johnson, D.K.; Adney, W.S.; Nimlos, M.R.; Brady, J.W.; Foust, T.D. Biomass Recalcitrance: Engineering Plants and Enzymes for Biofuels Production. 315, 804–807. [CrossRef]
- Zhang, L.; Zhou, Y.; Zhang, B. Xylan-Directed Cell Wall Assembly in Grasses. p. kiad665. [CrossRef]
- Chen, F.; Dixon, R.A. Lignin Modification Improves Fermentable Sugar Yields for Biofuel Production. 25, 759–761.
- Collucci, D.; Bueno, R.C.; Milagres, A.M.; Ferraz, A. Sucrose Content, Lignocellulose Accumulation and in Vitro Digestibility of Sugarcane Internodes Depicted in Relation to Internode Maturation Stage and Saccharum Genotypes. 139, 111543. [CrossRef]
- Collucci, D.; Bueno, R.C.; Milagres, A.M.; Ferraz, A. Composition and Structure of Sugarcane Cell Wall Polysaccharides: Implications for Second-Generation Bioethanol Production. 139, 111543.
- Xu, B.; Escamilla-Treviño, L.L.; Sathitsuksanoh, N.; Shen, Z.; Shen, H.; Percival Zhang, Y.; Dixon, R.A.; Zhao, B. Silencing of 4-coumarate: Coenzyme A Ligase in Switchgrass Leads to Reduced Lignin Content and Improved Fermentable Sugar Yields for Biofuel Production. 192, 611–625.
Figure 1.
Moisture content (% DW) of sugarcane genotypes across two trial locations during the crop cycle at Mossman (A) and the Tablelands (B). The boxplots show the distribution of each genotype’s performance. Box colors reflect crop age. Young (6 months) and mature (12 months) after planting/ratooning.
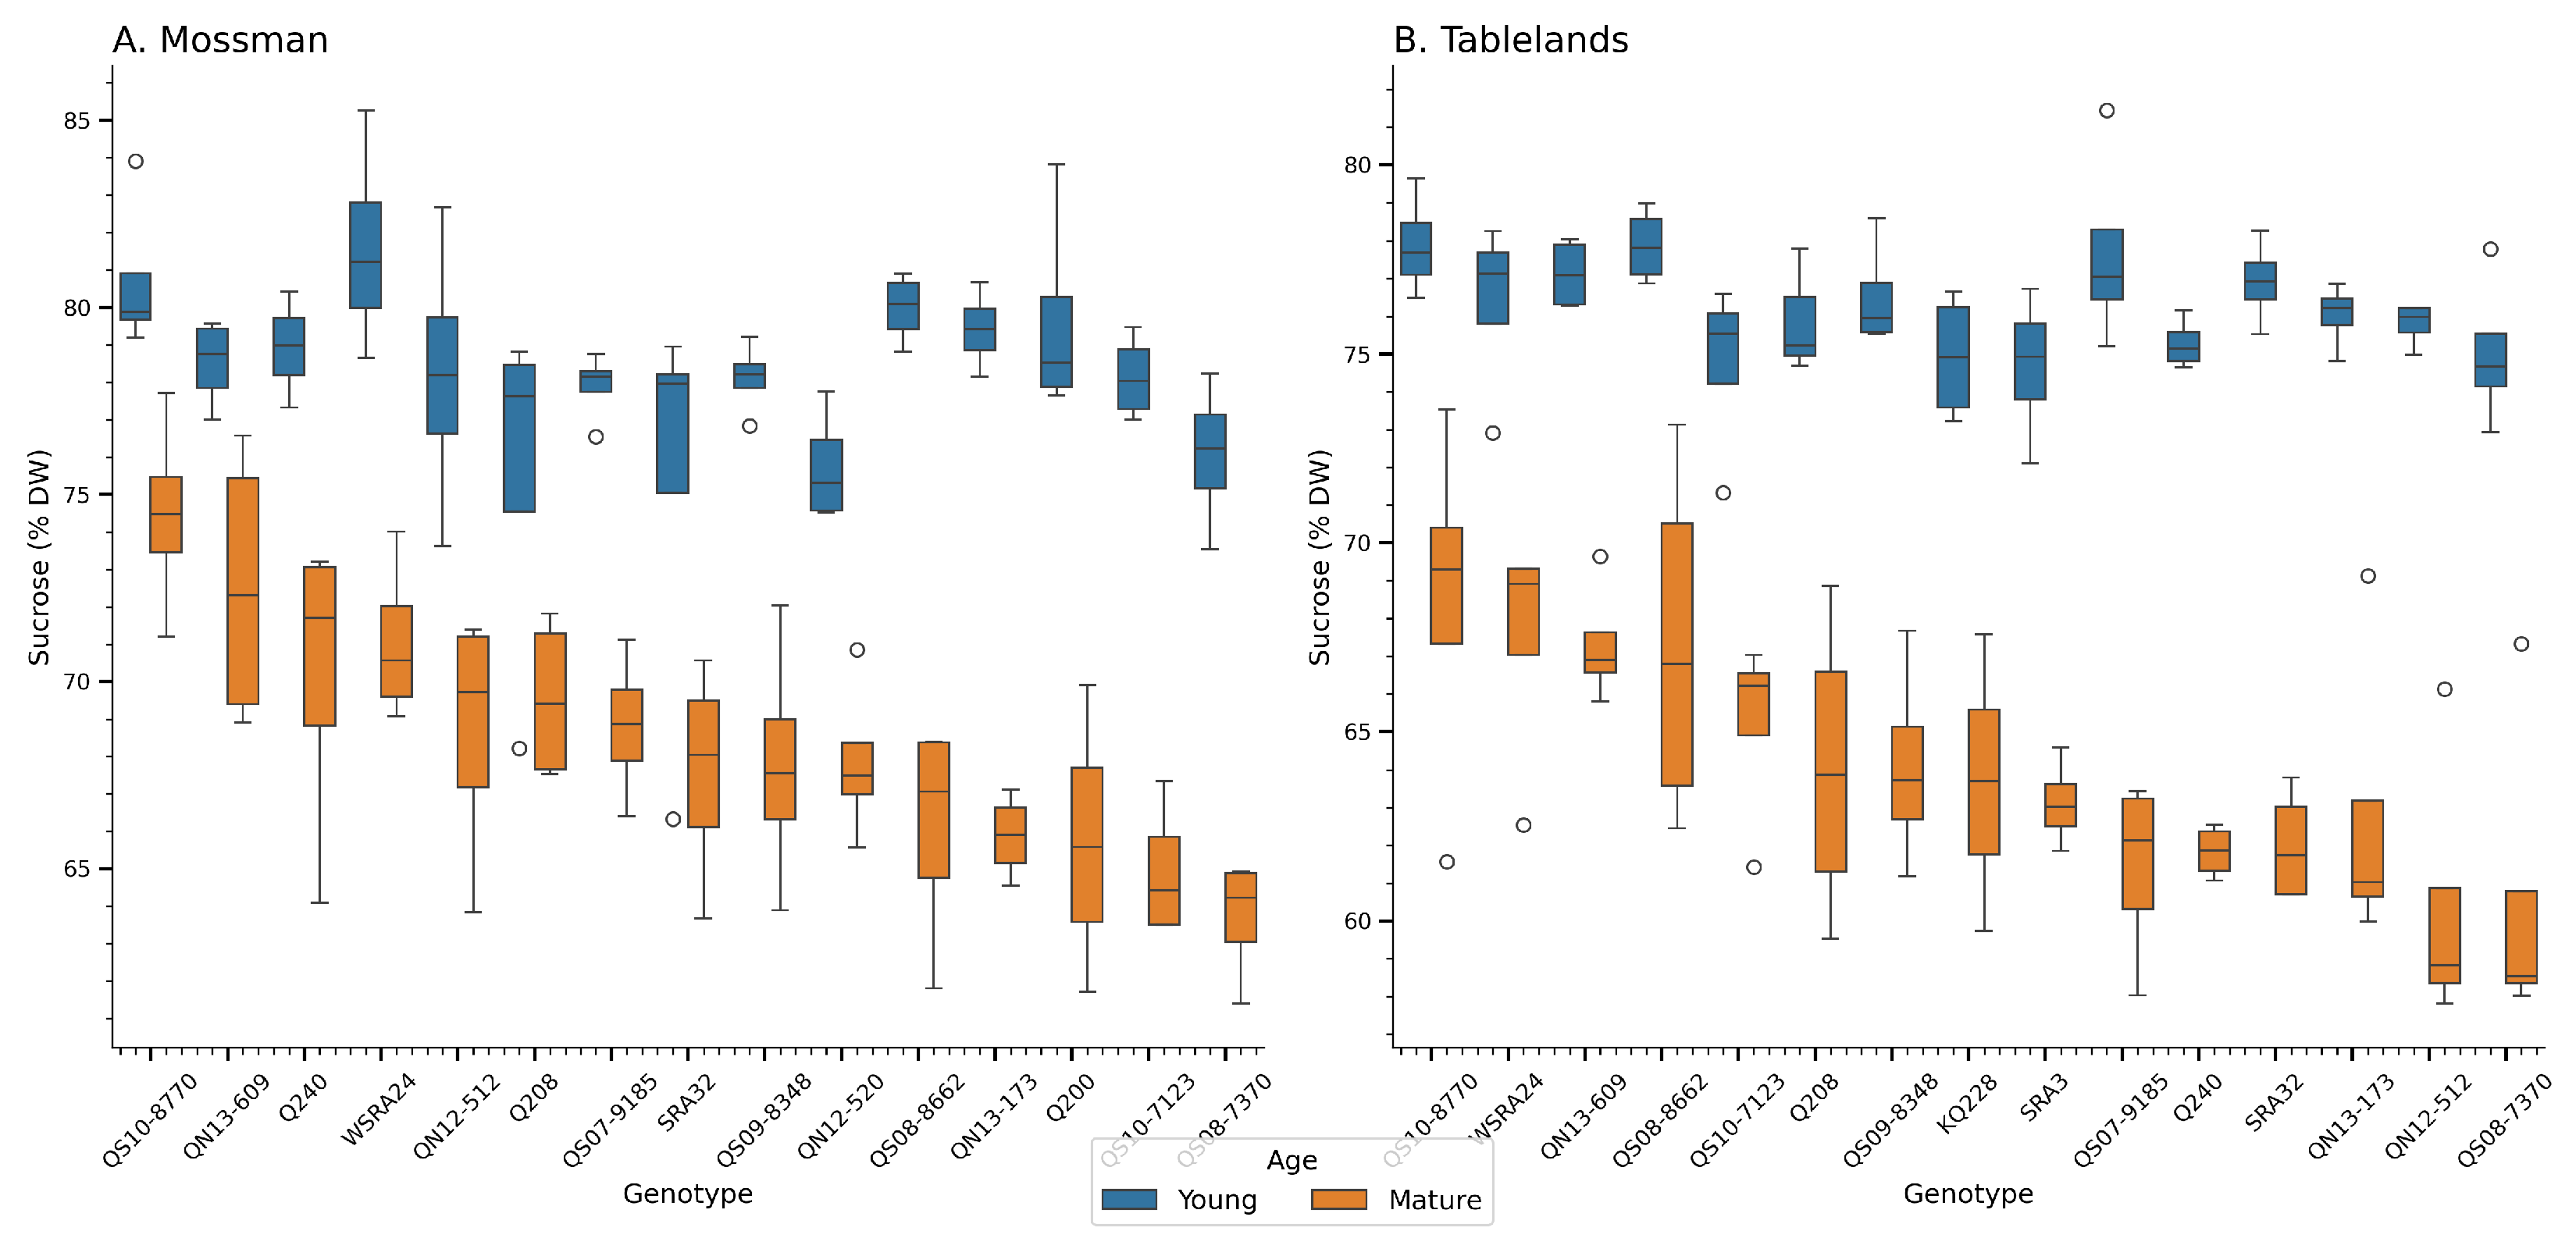
Figure 2.
Sucrose content (% DW) of sugarcane genotypes across two trial locations during the crop cycle at Mossman (A) and the Tablelands (B). The boxplots show the distribution of each genotype’s performance. Box colors reflect crop age. Young (6 months) and mature (12 months) after planting/ratooning.
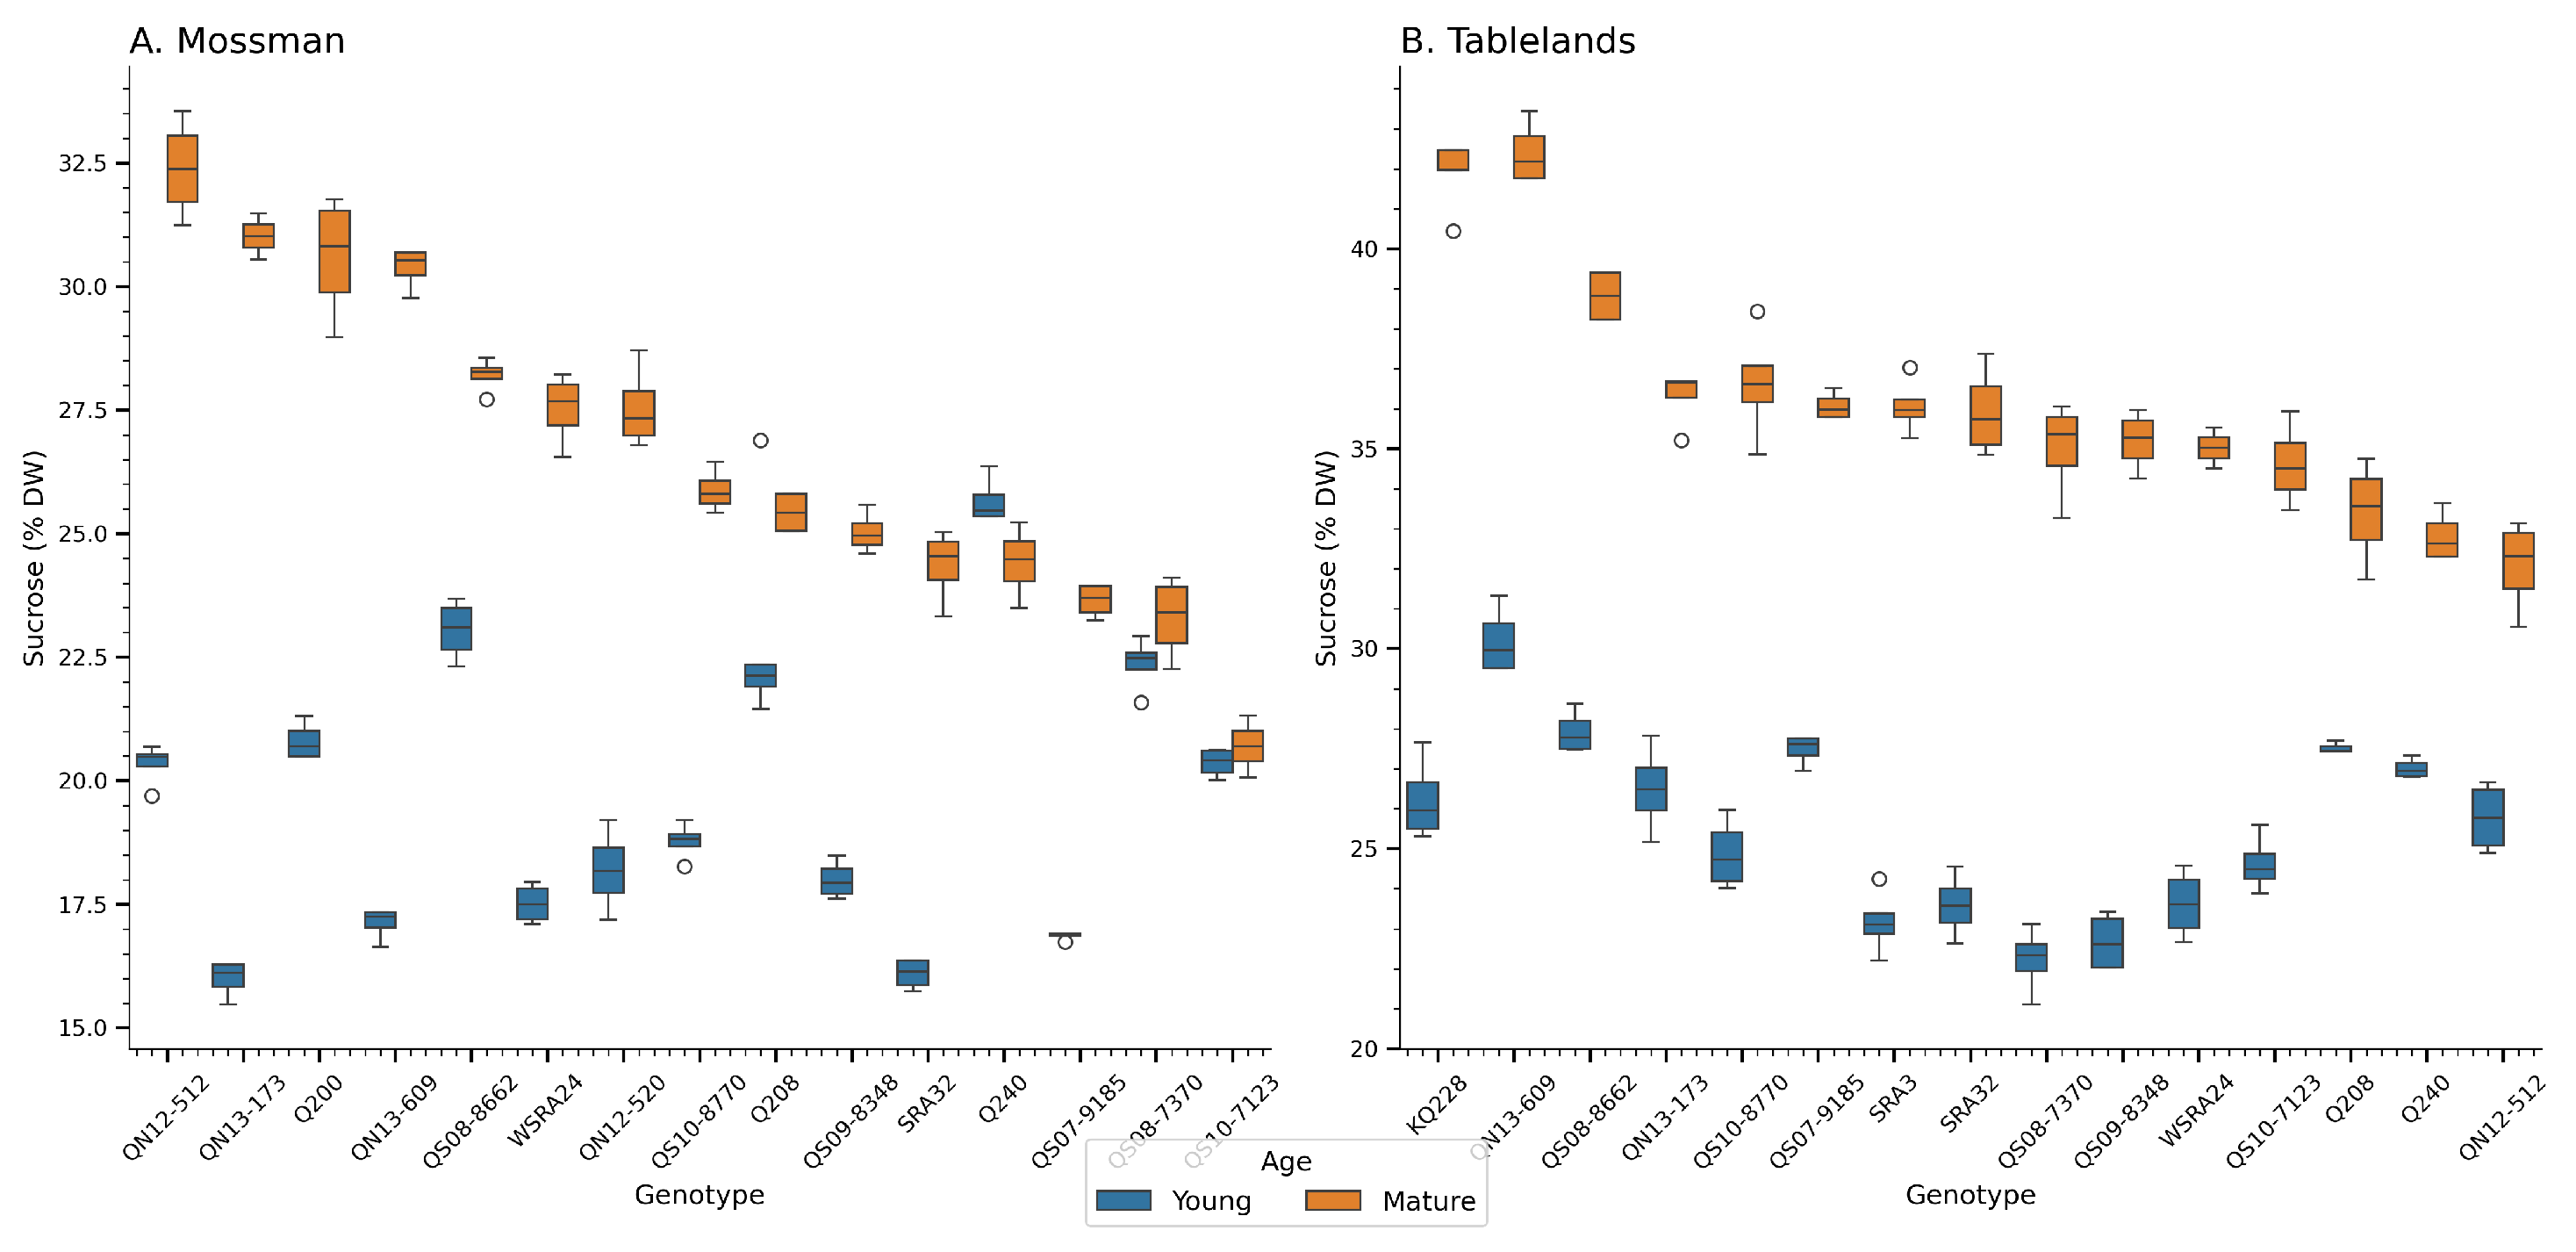
Figure 4.
Fibre content in sugarcane genotypes across two locations Mossman (A, C) and Tablelands (B,D)) and two developmental stages young (A,B) and mature(C,D)). Each panel represents a unique Location x Age combination. Boxplots show variation in fibre content by genotype, and letters above boxes indicate groups that are not significantly different based on Tukey’s HSD test (). Genotypes are ordered by mean fibre content within each panel.
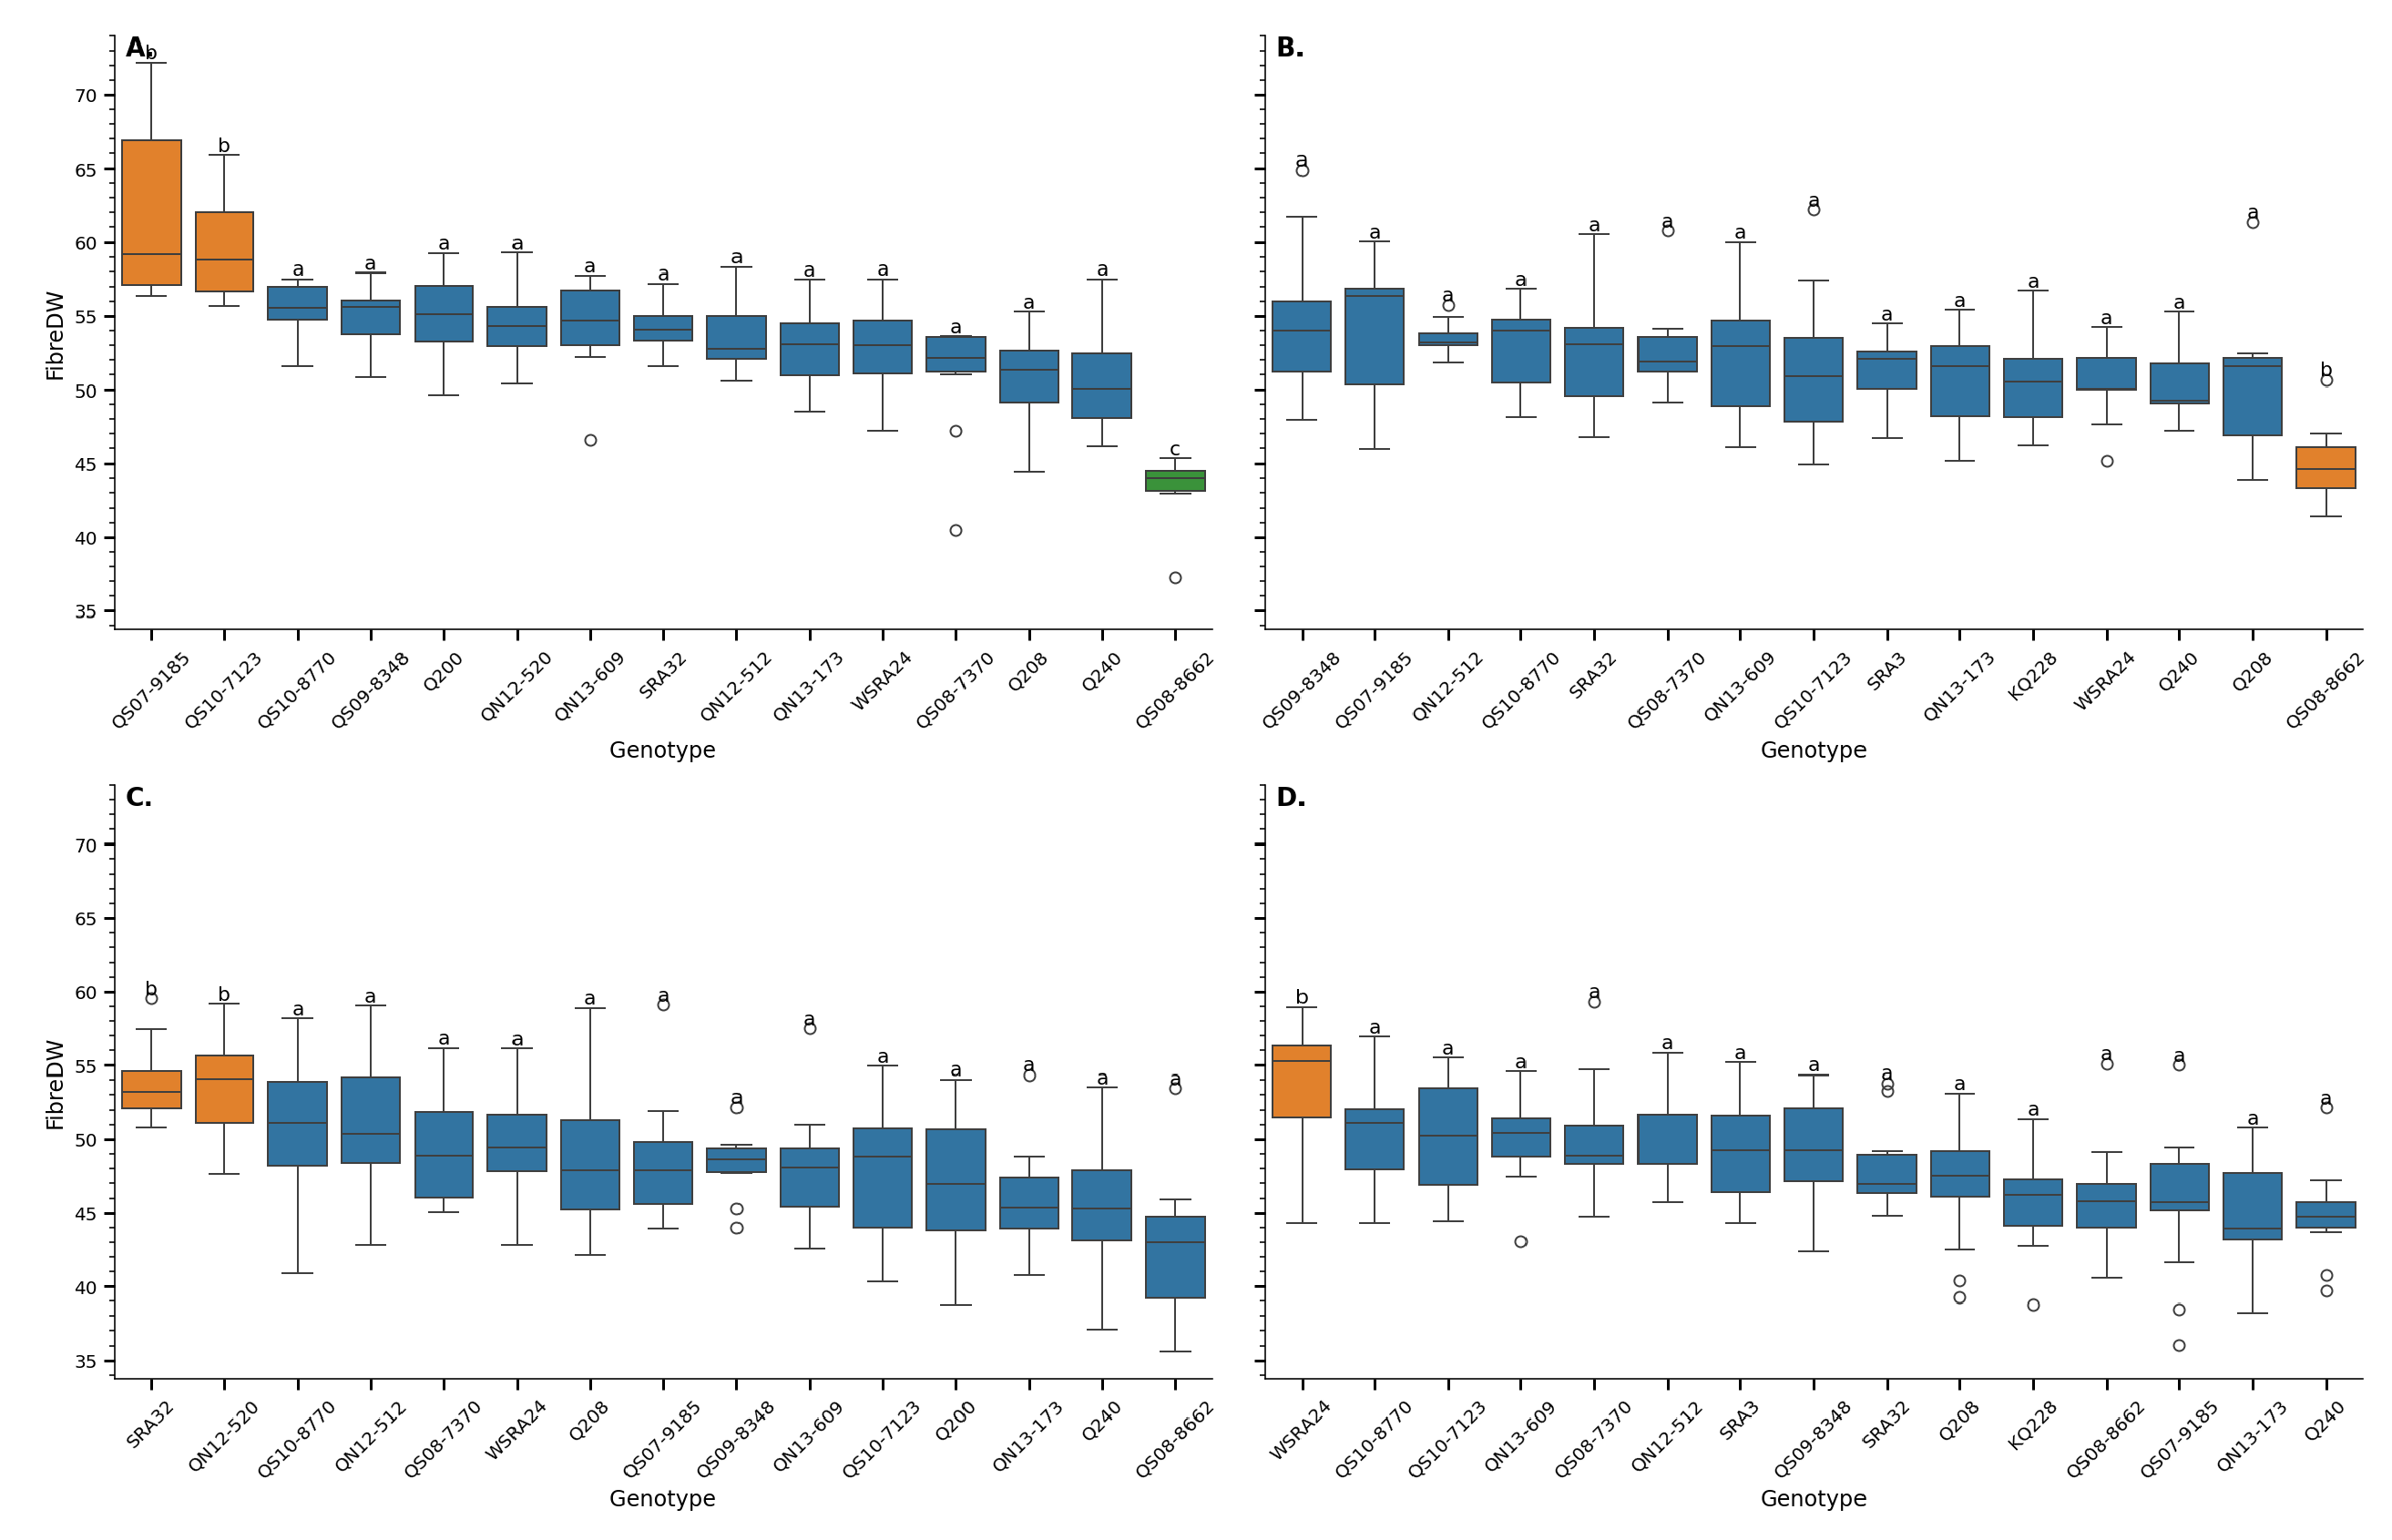
Figure 5.
Digestibility of the lignocellulosic fraction of sugarcane genotypes across two locations Mossman (A, C) and Tablelands (B,D)) and two developmental stages young (A,B) and mature(C,D)). Each panel represents a unique Location x Age combination. Boxplots show variation in fibre content by genotype, and letters above boxes indicate groups that are not significantly different based on Tukey’s HSD test (). Genotypes are ordered by mean fibre content within each panel.
Disclaimer/Publisher’s Note: The statements, opinions and data contained in all publications are solely those of the individual author(s) and contributor(s) and not of MDPI and/or the editor(s). MDPI and/or the editor(s) disclaim responsibility for any injury to people or property resulting from any ideas, methods, instructions or products referred to in the content. |
© 2025 by the authors. Licensee MDPI, Basel, Switzerland. This article is an open access article distributed under the terms and conditions of the Creative Commons Attribution (CC BY) license (http://creativecommons.org/licenses/by/4.0/).
Copyright: This open access article is published under a Creative Commons CC BY 4.0 license, which permit the free download, distribution, and reuse, provided that the author and preprint are cited in any reuse.


