Submitted:
28 April 2025
Posted:
29 April 2025
You are already at the latest version
Abstract
Nitrosamines (NAs) are toxic compounds associated mostly with disinfection processes. Human exposure to these compounds can occur in different settings, among them, the hydraulic hoses and seals of materials that are in contact with drinking water. This study aims to develop and validate a chromatographic method to quantify 11 NAs in water leaches of different materials. The method is based on liquid-liquid extraction (LLE) followed by gas chromatography coupled with mass spectrometry (GC-MS). The method was validated by the application of several statistical tests, namely, linearity/working range, precision, trueness, and recovery tests. The GC-MS method showed a good linear range for all NAs with coefficients of determination (r2) higher than 0.9989, coefficients of variation of the method (CVm) lower than 2.5% and PG < F (0.05; 1; N-3). The working range varies between 10 µg/L and 386.7 µg/L. The GC-MS method showed good precision under repeatability and reproducibility conditions with a relative standard deviation (RSD) lower than 12% and 10%, respectively. The GC-MS showed good trueness with a relative error lower than 20%. Matrix effects were significant, with recovery (Rec) values between 47% and 125% and an RSD lower than 20%. The limit of detection (LOD) and quantification (LOQ) ranged between 0.71 µg/L and 8.9 µg/L and between 2.3 µg/L and 29.8 µg/L, respectively. The method quantification limits (MQL) ranged from 0.0045 µg/L to 0.0378 µg/L. The sum of the MQL (0.2 µg/L) is lower than the reference limit of 0.3 µg/L for NAs in the leachates from the migration tests.
Keywords:
Nitrosamines
; Water
; Materials
; GC-MS
; LLE
; Migration Assays
1. Introduction
Water intended for human consumption, usually called drinking water or tap water, is water free of pathogenic microorganisms and harmful substances [1]. In the water supply system, the water interacts with different materials, which can have the capacity to change its quality due to the leaching process. Therefore, water quality management in water supply systems must consider the exchanges between the water and the network materials [2].
The materials and chemicals used in water supply systems can interfere with water quality by different ways: i) By altering the chemical characteristics of the water; ii) By contributing to bacteriological development/microbiological activity; iii) By changing the physical and organoleptic characteristics of the water; and iv) By migration of harmful substances [3,4].
The choice of material should be made considering the specifications for use, the characteristics of the water distributed (incrusting or aggressive), the location of the pipes, economic aspects, the fittings to be applied, and the heterogeneous mix of materials [4]. Depending on their formulation, materials can leach inorganic and organic substances into the water, which can affect the organoleptic properties of water or cause toxicological effects [5]. The nature of these interactions depends on the type of materials used. Materials can be grouped into three classes: i) Organic, which includes plastics, rubbers, silicones, coatings, and lubricants; ii) Metallic, which comprises metals, especially steel, copper, ductile iron, and metal alloys (e.g. brass); and iii) Cementitious, are those that include cement in their composition (e.g. mortar, cement and cement-based composite materials) [5].
Most of the materials in the supply system are organic, such as plastics, rubber, cement, enamel, and silicone, and can be used for sealants, reservoirs, pipes, coatings, and taps [6]. Organic materials represent a wide range of substances, including manufacturing by-products, polymerization aids, additives, dyes, pigments, and intermediate products that arise during the manufacture or decomposition by-products. These organic materials include accessories and their components, storage systems, and repair products. All these leached materials can react with the natural water compounds, namely, inorganic and organic compounds [7]. Included in the vast group of potential organic compounds from materials in contact with water are nitrosamines (NAs).
N-nitrosamines were first mentioned in the literature in 1853 as a product of the reaction of secondary amines with nitrous acid. However, it wasn’t until 1956 that they began to gain notoriety [8]. The term NAs is used to refer to a large group of N-nitroso compounds (R2N-NO) of different molecular weights that contain a characteristic nitroso functional group (?NNO) covalently linked to their molecules [9]. N-nitrosamines are synthesized from nitrosation reactions because of the reaction of secondary and tertiary amines with nitrous acid or by the direct action of nitrosating agents, in which nitro groups are transferred from one molecule to another [10]. These organic compounds are volatile solids or non-hydroscopic liquids, depending on the structure of the precursor amine. They have a yellow or greenish yellow color due to the absorption of visible light by the NNO group [11]. The physical-chemical properties of NAs depend on their substituent groups. In general, low molecular weight NAs are liquid soluble in water, while high molecular weight NAs are only soluble in organic solvents. These compounds have boiling points between 150 °C and 220 °C and do not decompose when boiled. They are very stable compounds in neutral solutions and strongly alkaline solutions [12]. Their high stability in neutral solutions explains their occurrence and stability in the atmosphere, food products and water. Under strong acidic conditions or ultraviolet (UV) radiation, NAs can decompose by cleaving the nitroso group [13].
These compounds are widespread in the aquatic environment and have at least four possible sources: i) industrial or human contamination; ii) microbial action; iii) formation of disinfection by-products; or iv) degradation of natural precursors [14,15].
NAs can be formed in water by the reaction of disinfectant chemicals with secondary amines. Contaminated water can be used for direct consumption or for food production, making it a possible source of nitrosamine contamination [16].
Extensive research has been conducted on NAs due to their potential carcinogenic, teratogenic, and mutagenic effects, even in low concentrations within the nanogram-per-liter (ng/L) range [15]. According to the available data, the Agency for Research on Cancer (IARC) classified most NAs as probably carcinogenic to humans (Group 2A) or possibly carcinogenic to humans (Group 2B). Only tobacco-related NAs are classified as carcinogenic to humans (Group 1) [17].
NAs have been identified in different types of water, such as wastewater, chlorinated drinking water, ozonated wastewater, and tap water (AT) [18,19,20,21]. The most detected nitrosamine in water is N-nitrosodimethylamine (NDMA), a by-product of water disinfection [15,22]. Seven nitrosamines including N-nitrosodimethylamine (NDMA), N-nitrosomethylethylamine (NMEA), N-nitrosodiethylamine (NDEA), N-nitrosodi-n-propylamine (NDPA), N-nitrosopyrrolidine (NPYR), N-nitrosopiperidine (NPIP) and N-nitrosodi-n-butylamine (NDBA) have been widely detected in various waters and listed as target compounds in the method 521 of U.S. Environmental Protection Agency (EPA) [23].
The World Health Organization (WHO) set a limit of 100 ng/L for NDMA in drinking water, which is associated with a 10-5 risk of developing cancer [24].
The US Environmental Protection Agency (EPA) established reference levels for other NAs: NDBA at 30 ng/L, NDEA at 0.4 ng/L, NDMA at 0.6 ng/L, NDPA at 7 ng/L, NMEA at 3 ng/L, and NPYR at 2 ng/L [23].
Sample preparation methods typically include separation, purification and preconcentration steps for obtaining the target compounds and adapting the extracts or the analytes to the requirements of separation and detection methods. Sample preparation methods for NAs monitorization in several matrices are based on steam distillation [25], celite column extraction method [26], liquid-liquid extraction (LLE) [27], pressurized liquid extraction (PLE) [28], solid-phase extraction (SPE) [29,30] and solid-phase microextraction (SPME) [31].
Common pretreatment methods for extracting and purifying NAs include solid-phase extraction, liquid-liquid extraction, and various microextraction methods, such as solid-phase microextraction and liquid-phase microextraction [32].
In this study, the LLE was selected to extract target NAs. The LLE is a technique widely used in the qualitative and quantitative analysis of organic compounds in water samples and is also one of the oldest sample preparation techniques. LLE provides huge linear sample capacity in comparison to other batch-type phase-distribution techniques. This is so that there is less competition for space in the extract phase as its entire bulk-phase volume is available [33]. A second benefit is directly exposing the organic extract to a quantitative analytical measurement step, like liquid or gas chromatography. Desorbing the analyte from the extract phase is not required. Furthermore, “carryover” and other “memory” effects are minimal because each sample is extracted using a new quantity of solvent [34]. One last benefit of LLE comes from the extensive literature on solvent extraction that has been gathered over many years. This literature covers topics such as pH, organic solvent selection, and the types and concentrations of reagents (such as metal-chelation agents). It also discusses how these decisions impact selectivity, which is important for cleaning up samples, and quantitative extraction, which is important for preconcentrating the analyte component [34,35].
Quantification methods include liquid chromatography, gas chromatography, supercritical fluid chromatography, and electrochemical methods [30]. Several analytical methods based on liquid chromatography coupled with tandem mass spectrometry (LC-MS/MS) have been applied to the quantification of NAs in drinking water samples. However, LC-MS/MS shows relatively low sensitivity for some NAs [36]. On the other hand, gas chromatography (GC) has high sensitivity and good precision, but its disadvantage is the high matrix effect [37]. Currently, gas chromatography (GC) and mass spectrometry (MS) methods are used in combination. The best sample preparation technique for gas chromatography coupled with mass spectrometry (GC-MS) is SPE, which allows low detection limits for NAs in water samples [38]. GC-MS aims to increase the speed, sensitivity, and selectivity of methods adapted to water analyses [30,37].
Water for human consumption is in contact with different materials until it reaches the consumer’s tap. Due to the migration of some compounds and the oxidative process on the surface of materials, the water can undergo changes in its organoleptic properties, which can alter the harmlessness of the water. Therefore, it is necessary to control the materials used in the supply system to guarantee the protection of human health [39]. The approval of materials to be applied in the supply system must comply with some requirements defined in a reference document relating to the material in question, which defines that tests have been carried out on the influence of the materials on the water for human consumption, following European or national standards. The European standards adopted for the assessment of manufacturing, non-metallic, and cementitious materials to be applied in the supply network regarding the leaching of organic materials are EN 12783-1 and EN 12873-2 [40,41].
Moreover, Directive (EU) 2020/2184 [1]. on the quality of water intended for human consumption transposed into national law by Decree-Law 69/2023 [42] requires, among other things, an analysis of the potential risks associated with the building water distribution system and related products and materials, as well as verification of the extent to which they affect the quality of the water at the point where it leaves the taps, as usually used for water intended for human consumption. Besides, article 11 of Directive (EU) 2020/2184 requires that Member States ensure that the materials that come into contact with water intended for human consumption do not directly or indirectly compromise the protection of human health, adversely affect the color, odor or taste of the water, enhance microbial growth, or leach contaminants into the water at levels that are higher than necessary given the intended purpose of the material [1].
Since 1998, the European Commission has been discussing how to implement a common approval scheme for materials in contact with water intended for human consumption. The 4MSI Initiative group (4 Member States Initiative) is responsible for developing a European approval scheme. Its sub-group developed several proposals, which were subsequently submitted to the European Commission and taken as a reference for a European approval scheme in Directive 2020/2184 [1]. The document written by this group, called “Requirements and test methods for products made of organic materials in contact with drinking water - 4MSI Draft Common Approach on Organic Materials - Part C”, has the main objective of developing data for the construction of the European approval scheme for materials in contact with water and describes the maximum tolerable limits of compounds that can be found after migration testing of materials used in drinking water distribution systems [43]. In this document, the guideline value or the maximum tolerable concentration at the tap (MTCTap) for the sum of NAs is 0.3 ug/L [43].
The composition and concentration of NAs in migration water from the supply system can vary depending on the material used. To the best of our knowledge, few studies have focused on this field. Therefore, this study aims to develop and validate a method to simultaneously quantify eleven NAs in the leachates from migration assays from different materials. The target NAs include 11 compounds, namely, N-Nitrosodimethylamine (NDMA), N-Nitrosomethylethylamine (NMEA), N-Nitrosodiethylamine (NDEA), N-Nitrosodiisopropylamine (NDIPA), N-Methyl-N-nitrosobenzeamine (MNBA), N-Nitrosopyrrolidine (NPYR), N-Nitrosomorpholine (NMOR), N-Nitrosodipropylamine (NDPA), N-Nitrosopiperidine (NPIP), N-Ethyl-N-nitrosobenzeamine (ENBA), N-Nitrosodibutylamine (NDBA).
2. Results and Discussion
2.1. Chromatographic Run
The GC-MS method for NAs quantification shows a chromatographic run of 35 min (Figure 1).
2.2. LLE Procedure
To fulfil the guideline value of 0.3 µg/L for NAs in tap water (CTap) [43], the concentration factor must be 2000. If the LLE is carried out with 500 mL of sample, and for a final extract of 0.5 mL, the concentration factor is 1000, which is not enough. However, for a sample volume of 1000 mL, the concentration factor is 2000, and it is possible to fulfil the 4MSI requirement [43]. Therefore, the LLE optimization for NAs analysis was performed with a 1000 mL water sample.
pH is an important parameter in the extraction efficiency of analytes in aqueous matrices. In solvent-water systems, the partition coefficients of various solutes can change with the sample pH. It can change the ionization of the compound and consequently change its affinity for the organic solvent used in the extraction. Figure 2 shows the recovery of NAs when extracted at different pH values. The recovery rates are significantly higher (p < 0.05) when the sample is extracted in both acidic and basic conditions. The remaining tests were therefore carried out under these conditions.
Regarding the volume of extraction solvent (Figure 3), the recoveries ranged between 18% (NDMA) and 84% (NDIPA) with 50 mL, 33% (NDMA) and 110% (NDIPA) with 100 mL, 55% (NDMA) and 162% (NDBA) with 150 mL and 70% (NDMA) and 170% (NDBA) with 200 mL. Recoveries are significantly higher (p < 0.05) when 200 mL of solvent is used in the extraction, which is the volume selected.
2.3. Linear/Working Range
The chromatographic linearity range was first studied by analysis of 20 standard solutions of NAs at different and equitably distributed concentration levels (2 µg/L - 338.8 µg/L, preliminary linear range). The full concentration range showed r2 values varying between 0.9697 and 0.9994, and CVm between 3.1% and 29%. Most of NAs failed the statistical requirements. In this way, the whole concentration range was narrowed.
The best values were obtained for the concentration range (10 µg/L – 386.7 µg/L) with r2 ≥ 0.9989 and CVm < 2.5% (Table 1).
In addition, the requirements of the Mandel test were fulfilled. Therefore, this linear range represents the working range of the method [45].
The LOD and LOQ of the GC-MS method based on calibration curves (Table 1) ranged between 0.7 – 8.9 µg/L and 2.3 – 29.8 µg/L, respectively.
The LOD and LOQ of GC-MS method under repeatability conditions (Table 1) ranged between 0.03 – 0.16 µg/L and 0.11 – 0.53 µg/L, respectively.
For most of the NAs, the LOQ is lower than the lowest concentration level of the working range.
For NAs quantification, the instrumental LOQ was set to the first point of the working range.
2.4. Precision
The data on method precision under repeatability and intermediate precision conditions for NAs by GC-MS are shown in Table 2 and Table 3.
The precision under repeatability conditions is lower for the upper concentration range, with RSDr between 0.80% (NMEA) and 11% (NPYR and NDPA). The RSDr in the lower concentration range varied between 1.1% (NDIPA) and 5.3% (ENBA) (Table 3). Under repeatability conditions, the GC-MS method showed good precision since the RSDr values were less than 25%.
The RSDR of the GC-MS method for NAs ranged between 5.6% (NMOR) and 8.8% (ENBA) (Table 3). As the RSDR values are less than 25% and like those obtained in repeatability conditions, it can be concluded that the time variable does not significantly impact the method’s accuracy.
2.5. Recovery and Method Quantification Limit
The recovery studies were performed with ultrapure and drinking water (Table 4). Based on recovery results, the LOQs of NAs by the LLE-GC-MS method and the corresponding MQL were determined (Table 5).
The average recoveries of NAs in ultrapure water ranged between 57% (NDMA) and 106% (NDEA). For drinking water, the recoveries ranged between 47% (NDMA) and 125% (NDEA). Although the recovery profile is similar for both types of water, the recovery values in drinking water are mostly lower than those in ultrapure water, as observed by other authors [36,44,46,47]. For both waters, the RSD was lower than 20%.
Ideally, recoveries should be between 75% and 125%. However, when analyzing organic compounds in trace concentrations in complex matrices, recoveries tend to be lower due to matrix interferences. Besides, the target NAs have low and similar molecular weights. Therefore, they have very simple mass spectra, whose molecular ion is of low intensity and like that of the potential interfering compounds in the sample. For these reasons, lower recovery values are acceptable with good precision. Therefore, recoveries lower than or equal to 50% were accepted since the RSD was lower than 25%.
The method quantification limits (MQL) ranged from 0.0045 µg/L (ENBA) to 0.0378 µg/L (NDBA). The MQL (0.2 µg/L) is lower than the guideline limit of 0.3 µg/L for NAs in the leachates from the migration tests [43]. Therefore, this MQL allows the migration studies of target NAs from materials in contact with water and makes it possible to assess the suitability of various materials.
2.6. Nitrosamines in Drinking Water
The migration tests were carried out on organic materials to assess their applicability to real samples (different materials). The parameters required for the calculations are summarized in Table 6. The results of the migration tests are shown in Table 7 and Table 8.
No NAs were detected in the migration waters of materials A and B. Four nitrosamines were quantified in the migration waters of materials C and D, namely MNBA, NMOR, NDPA, and ENBA.
However, at the end of the 3rd migration, only the migration water from material C (with and without chlorine) showed NAs above the LOQ. The migration water without chlorine showed 23 µg/L and 39 µg/L of MNBA and ENBA, respectively. The chlorinated migration water showed 50 µg/L and 58 µg/L of MNBA and ENBA, respectively. There was a moderate correlation between NA concentrations in the chlorinated and non-chlorinated migration water over the three migration tests, with a Pearson coefficient of 0.61. NA concentrations are around two-fold higher in the chlorinated migration waters.
In material C, the only one with NAs in 3rd migration, the CTap is 0.070 µg/L and 0.040 µg/L for migration waters with and without chlorine, respectively.
All the materials under study fulfil the necessary requirements to be in contact with drinking water since the total concentration of NAs quantified in the consumer’s water (CTap) is lower than the MTCTap (0.3 µg/L).
3. Materials and Methods
3.1. Materials
All nitrosamine standards are of analytical grade and with the highest purity available (purity between 90.30% and 99.90%) were provided by Dr.Ehrenstorfer. Ultrapure water for in-house validation studies was obtained from an ultrapure water system, Mili Q (Millipore). Dichloromethane for trace analysis (RS-Atrasol, 99.95%) and methanol for HPLC plus gradient grade (HPLC Plus, 99.9%) were provided by Carlo Erba. Individual stock solutions of 400 mg/L were prepared in methanol and stored at 5 °C ± 3 °C in the absence of light. The sulphuric acid and sodium hydroxide from Supelco were used for LLE. The migration studies were performed with demineralized water obtained by reverse osmosis, Elga Centra R200 (Veolia).
Free chlorine stock solutions were prepared by dilution from purchased 12% sodium hypochlorite solution (Sigma Aldrich). Intermediate and standard solutions were prepared from sodium hypochlorite stock solution at concentrations between 0.5 – 10 mg/L.
3.2. Sample Selection
Four different organic materials (Table 9) used in the water supply system were selected and subjected to migration tests. The amount of material used for each test depends on each material’s surface-to-volume ratio (S/V).
The migration tests were performed over 11 days. They were carried out with chlorinated water (1 mg/L of chlorine) and demineralized water without chlorine. Demineralized water was also used as a test blank.
3.3. Liquid-Liquid Extraction
The target NAs were extracted using LLE. To optimize the LLE technique, various extraction conditions, namely the pH of the water samples and the volume of the organic solvent used for the extraction (dichloromethane) were tested.
The ultrapure water was spiked with 40 µL of NAs standard solution. The recovery of target compounds was evaluated under two pH conditions: one at pH 6 and another where the pH of the sample was changed; in the first extractions, the sample was acidified (pH 2), and in the last extractions, it was alkalinized (pH 10). The effect of extraction volume was evaluated with four volumes of solvent extraction (50 mL, 100 mL, 150 mL, and 200 mL).
The extraction material (borosilicate glass separating funnel and Turbovap tubes) was pre-rinsed with dichloromethane. 1000 mL of water samples were transferred to the glass-separating funnel and acidified with 6 mL of sulphuric acid (0.5 mol/L). 50 mL of dichloromethane was added, and the water sample was shaken vigorously for 3 minutes. After the phase’s separation, the organic layer was collected into the Turbvap tube. One more extraction was carried out in an acidic medium. 12 mL of sodium hydroxide solution (0.5 mol/L) was added to the aqueous phase, and the extraction was repeated until 200 mL of organic extract was collected (two extraction in alkaline conditions). The organic extract was concentrated to 0.5 mL in the TurboVap evaporation system (Biotage) at 25 °C and with a nitrogen (99.9995%) flow of 0.3 bar, resulting in a concentration factor of 2000. The final extracts were stored in 2 mL vials for chromatographic analysis.
3.4. GC-MS Analysis
The analyses were performed on a Trace 1300 gas chromatography coupled with an ISQ 700 mass spectrometer (Thermo Fisher Scientific) and electron ionization (EI) mode. Chromatographic separation was performed on a 60 m × 0.250 mm ×0.25 µm HP-5MS capillary column (Agilent). Helium (99.9995%) was used as carrier gas with a constant flow rate of 1 mL/min. The injection was performed in splitless mode with a splitless time of 1 minute. The injection volume was 1 µL, and the injector temperature was set at 250 °C. The transfer line and ion source temperatures were operated at 290 °C and 240 °C, respectively. The oven temperature ramp was programmed as follows: isotherm at 40 °C for 5 minutes, then heated to 170 °C at a rate of 4 °C/min, increased by 20 °C/min up to the final temperature of 250 °C (3 minutes). The chromatographic run is performed in 44.5 minutes. Selected ion monitoring (SIM) mode was used for quantitation with a dwell time of 0.1 seconds (Table 10).
3.5. Quality Assurance and In-House Validation Studies
All the glassware was left overnight at 55 °C before use. For quality and assurance purposes, at least one blank sample (BS), two standard control (SC), one duplicate (DD) and one recovery assay (REC) were performed for each batch of samples (daily analysis and chromatographic run) and they fulfilled the acceptance criteria defined in the laboratory for the analysis of trace organic compounds in water matrices (BS ≤ LOQ, standard error of SC≤ 15%, DD ≤ 15%, and Rec = 100 ± 25%). The determination coefficients (r2) of calibration curves (daily calibration curves with a minimum of five standards) were higher than 0.995, and coefficients of variation of the method (CVm) were lower than 5%. In this study, all NA concentrations lower than their detection limit were represented by not detected (n.d.).
The linear range was studied using an external calibration method at twenty concentration levels, ranging from 2 µg/L to 338.8 µg/L. The linear range was evaluated by several statistical tests, namely the coefficient of determination (r2) and the coefficient of variation of the method (CVm, %). The working range was evaluated by the Mandel test [44,45].
The detection (LOD) and quantification (LOQ) limits of the GC-MS method were determined based on the standard deviation of the method (Sm), namely LOD = 3 × Sm and LOQ = 10 × Sm, respectively. Sm is the ratio between the relative standard deviation of the calibration curves (Sy/x) and its slope (b). The LOD and LOQ were also determined under repeatability conditions. Ten replicate solutions with concentrations equal to the concentration of the first point of the linear range were analyzed GC-MS. The standard deviations (SD) were determined based on the areas for each compound. The LOD and LOQ were calculated using the formula (3 × SD) and (10 × SD), respectively.
The precision of the chromatographic method was evaluated under repeatability conditions and intermediate accuracy conditions. For repeatability studies, 30 standard solutions with NA concentrations corresponding to three concentration ranges were prepared: i) 10 solutions with NA concentration between 10 – 64.5 µg/L (first level of working range), ii) 10 solutions with NA concentration between 20 – 128.9 µg/L (equivalent to the intermediate level of the working range), and iii) 10 solutions with NA concentration between 59.9 – 269.3 µg/L (equivalent to the higher level of working range). The intermediate precision study was carried out over several days by analyzing a standard solution with NA concentrations between 20 – 128.9 µg/L.
The NAs recoveries were also performed by spiking ultrapure water with 40 µL of a standard solution with NAs with concentrations between 20 – 128.9 µg/L. The analysis was performed with ten replicates. Due to the possibility of migration studies with tap water, the recovery was also performed with tap water under the same conditions.
The RSD (%) of the replicate analyses was determined for all target NAs and all fortification levels. The precision of the global method (LLE-GC-MS) was evaluated under repeatability and reproducibility conditions, and it was expressed as a relative standard deviation, RSDr and RSDR, respectively.
The individual LOQ of each NA and the method quantification limit (MQL) of the global method (LLE-GC-MS) for all NAs were calculated based on equations 1 and 2, respectively.
Where LOQ(x) is the limit of quantification for each NA (x), expressed in µg/L, P1 is the concentration corresponding to the initial standard of the working range of that NA (µg/L), Rec is the average recovery of each NA (%), FC is the concentration factor, and MQL is the limit of quantification of the global method, LLE-GC-MS, for all target NAs (sum of NAs LOQ) expressed in µg/L.
3.6. Migration Assays
The migration tests were carried out with two types of migration water: chlorinated water (1 mg/L of chlorine) and non-chlorinated water. Demineralized water was also used for the blank assay, which was analyzed under the same conditions as the material migration tests.
The amount of material used for each test depends on each material’s surface-to-volume ratio (S/V). The tests were carried out over 11 days, with one day of pre-treatment, nine days of migration procedure, and one day of NAs quantification by LLE-GC-MS (Figure 4).
The tests had a pre-treatment phase, which consisted of cleaning the materials with a jet of demineralized water for 60 minutes, followed by immersion in demineralized water for 24 hours. After this treatment, the immersion water was discarded, and the materials were cleaned again with a jet of water for 60 minutes. After pre-treatment, the migration test consisted of immersing the materials in the test water for 72 hours at 23 °C. At the end of these three days, the migration water was collected and analyzed by LLE-GC-MS. Two more migrations were carried out (3 migration assays, 9 days), and all the migration waters were analyzed.
The concentration of the NAs in the migration waters was obtained with equation 3, where is the concentration of the substance leached from the material, expressed in mg/L (or µg/L), is the concentration of the substance in mg/L (or µg/L) measured in the migration water, and is the concentration of the substance in mg/L (or µg/L) measured in the blank test.
The migration rate of a given substance ( – measured in mg dm-2 d-1 (or µg dm-2 d-1)) in migration water is calculated from its concentration in that water, according to equation 4 where t is the period of the migration test, expressed in days: 3 days in this test, and is the surface area/volume ratio, expressed in dm-1.
According to equation 5, the estimated concentration at the consumer tap (CTap) was determined by considering the migration rate from the third migration test and the conversion factor (CF) of each material.
4. Conclusions
The LLE combined with GC-MS provides a sensitive and an accurate method for the trace analysis of 11 nitrosamines.
The GC-MS showed good linearity with coefficients of determination (r2) greater than 0.9989 (NDPA) and excellent coefficients of variation of the method (< 2.5%). The LOD and LOQ of the GC-MS method under repeatability conditions ranged between 0.03 – 0.16 µg/L and 0.11 – 0.53 µg/L, respectively.
The precision of the GC-MS method is acceptable with RSDr values between 1.1% (NDIPA) and 5.3% (ENBA) for the first standard in the working range, and between 0.80% (NMEA) and 11% (NDPA and NPYR) for the highest concentration. Regarding intermediate precision, the RSDR ranged between 5.6% (NMOR) and 8.8% (ENBA).
The average recoveries of NAs ranged from 47% (NDMA) to 125% (NDBA), with RSD lower than 25%. The LOQ of NAs by the LLE-GC-MS method ranged from 0.0045 µg/L (ENBA) to 0.0378 µg/L (NDBA), with an MQL of 0.20 µg/L. The LLE-GC-MS method showed good accuracy, and therefore, it is suitable for analysing NAs in materials in contact with water.
The migration water from materials A, B, and D did not show NAs (< LOQ). Four nitrosamines were quantified in the migration waters of material C with concentrations between 1.4 µg dm-2 d-1 (MNBA) and 18.6 µg dm-2 d-1 (ENBA). The CTap was 0.070 µg/L and 0.040 µg/L for migration waters with and without chlorine, respectively. Both values were lower than 0.3 µg/L.
All materials under study met the requirements for materials to be used in the water network.
The present study represents an important contribution to filling gaps in knowledge about the NAs in leachates of materials in contact with water for human consumption. It is crucial for assessing potential health hazards. Therefore, it is a step forward in ensuring compliance with materials regulations and safeguarding public health and the environment.
The knowledge acquired can empower individuals, communities, and policymakers to proactively safeguard water resources and minimize exposure to harmful substances. These studies are essential for protecting public health, ensuring regulatory compliance, preserving environmental quality, and promoting awareness of water quality issues.
Author Contributions
Conceptualization, V.V.C., A.V., A.P. and C.M.M.A.; methodology and validation, V.V.C., A.V., A.P. and C.M.M.A.; formal analysis, B.A.; resources, R.N.C.; data curation, B.A.. and C.M.M.A.; writing—original draft preparation, B.A. and C.M.M.A.; writing—review and editing, V.V.C. and C.M.M.A; supervision, R.N.C.; All authors have read and agreed to the published version of the manuscript.
Funding
This research received no external funding.
Institutional Review Board Statement
Not applicable.
Informed Consent Statement
Not applicable.
Data Availability Statement
The data on NAs in migration waters are private due to the identification of materials.
Acknowledgments
Not applicable.
Conflicts of Interest
The authors declare no conflict of interest.
References
- Directive (UE) 2020/2184 of the European Parliament and of the Council of 16 December 2020 on the quality of water intended for human consumption. Official Journal of the European Union L435/1. 2020:1–62.
- Benoliel MJ (2013) Influência de produtos químicos e de materiais na qualidade da água de consumo humano. Associação Portuguesa dos Recursos Hídricos (APRH),1–12 https://www.aprh.pt/congressoagua98/files/com/133.pdf.
- Chaves Simões L, Simões M (2013) Biofilms in drinking water: Problems and solutions. RSC Adv 3:2520–2533. [CrossRef]
- Gonzalez S, Lopez-Roldan R, Cortina JL (2013) Presence of metals in drinking water distribution networks due to pipe material leaching: A review. Toxicol Environ Chem 95:870–889. [CrossRef]
- Naismith I, Jönssen J, Pitchers, Rocket L et al (2017) Draft Final Report: Support to the implementation and further development of the Drinking Water Directive (98/83/EC): Study on materials in contact with drinking water, Umweltbundesamt GmbH in cooperation with subcontractor WRc. Available at: https://www.ecocae.it/wp-content/uploads/2020/06/Study-on-materials-in-contact-with-drinking-water.pdf.
- Tomboulian P, Schweitzer L, Mullin K, et al (2004) Materials used in drinking water distribution systems: Contribution to taste-and-odor. Water Science and Technology 49:219–226. [CrossRef]
- Fawell J, Nieuwenhuijsen MJ (2003) Contaminants in drinking water. Br Med Bull 68:199–208. [CrossRef]
- Iram M (2019) From Valsartan to Ranitidine: The Story of Nitrosamines So Far. Indian Journal of Pharmacy Practice 13:01–02. [CrossRef]
- Vrzal T, Olsovská J (2016) N-nitrosamines in 21th Century. Kvasny Prumysl 62:2–8. [CrossRef]
- Fernández-Alba A and Agüera A (2005) Nitrosamines. In book: Encyclopedia of Analytical Science. 197–202. [CrossRef]
- Low H (1974) Nitroso compounds: Safety and public health. Arch Environ Health 29:256–260. [CrossRef]
- Crosby NT, Sawyer R (1976) N-Nitrosamines: A review of chemical and biological properties and their estimation in foodstuffs. Adv Food Res 22:1–71. [CrossRef]
- Hayes JE (2010) Sensory descriptors for cooked meat products. In Book: Sensory Analysis of Foods of Animal Origin, Edited ByLeo M.L. Nollet, Fidel Toldra, Chapter 10, 26 pages, CRC Press, https://www.taylorfrancis.com/chapters/edit/10.1201/b10822-12/sensory-descriptors-cooked-meat-products-jenny-hayes?context=ubx&refId=9cf8333d-c685-4439-9a1f-fbe9f3327439.
- Deblonde T, Cossu-Leguille C, Hartemann P, et al (2022) Nitrosamines. Water Res 47:1–62. [CrossRef]
- Xia J, Chen Y, Huang H, et al (2023) Occurrence and mass loads of N-nitrosamines discharged from different anthropogenic activities in Desheng River, South China. Environmental Science and Pollution Research 30:57975–57988. [CrossRef]
- Crews C (2014) Processing Contaminants: N-Nitrosamines. Encyclopedia of Food Safety 2:409–415. [CrossRef]
- IARC (2022) Agents Classified by the IARC Monographs, Volumes 1–135, https://monographs.iarc.who.int/agents-classified-by-the-iarc/.
- Ripollés C, Pitarch E, Sancho J V., et al (2011) Determination of eight nitrosamines in water at the ngL-1 levels by liquid chromatography coupled to atmospheric pressure chemical ionization tandem mass spectrometry. Anal Chim Acta 702:62–71. [CrossRef]
- Yoon S, Nakada N, Tanaka H (2012) A new method for quantifying N-nitrosamines in wastewater samples by gas chromatography - Triple quadrupole mass spectrometry. Talanta 97:256–261. [CrossRef]
- Qian Y, Wu M, Wang W, et al (2015) Determination of 14 nitrosamines at nanogram per liter levels in drinking water. Anal Chem 87:1330–1336. [CrossRef]
- Sieira BJ, Carpinteiro I, Rodil R, et al (2020) Determination of N-nitrosamines by gas chromatography coupled to quadrupole–time-of-flight mass spectrometry in water samples. Separations 7:1–12. [CrossRef]
- Nawrocki J, Andrzejewski P (2011) Nitrosamines and water. J Hazard Mater 189:1–18. [CrossRef]
- US EPA (2016) Six-Year Review 3 Technical Support Document for Nitrosamines. United states environmental protection agency.
- World Health Organization (WHO). N-Nitrosodimethylamine (NDMA), Guidelines for Drinking-Water Quality, 3rd ed. including 1st and 2nd addenda, 2008. Available at: http://www.who.int/water_sanitation_health/dwq/chemicals/ndmasummary_2ndadd.pdf.
- Crews C (2010) The determination of N- nitrosamines in food. Quality Assurance and Safety of Crops and Foods 2:2–12. [CrossRef]
- Sen NP, Seaman S, Tessier L (1982) Comparison of Two Analytical Methods for the Determination of Dimethylnitrosamine in Beer and Ale, and Some Recent Results. J Food Saf 4:243–250. [CrossRef]
- Scheeren MB, Sabik H, Gariépy C, et al (2015) Determination of N-nitrosamines in processed meats by liquid extraction combined with gas chromatography-methanol chemical ionisation/mass spectrometry. Food Addit Contam Part A Chem Anal Control Expo Risk Assess 32:1436–1447. [CrossRef]
- Aragón M, Marcé RM, Borrull F (2013) Determination of N-nitrosamines and nicotine in air particulate matter samples by pressurised liquid extraction and gas chromatography-ion trap tandem mass spectrometry. Talanta 115:896–901. [CrossRef]
- Yurchenko S, Mölder U (2006) Volatile N-nitrosamines in various fish products. Food Chem 96:325–333. [CrossRef]
- Bian Y, Zhang Y, Zhou Y, et al (2021) Progress in the pretreatment and analysis of N-nitrosamines: an update since 2010. Crit Rev Food Sci Nutr 61:3626–3660. [CrossRef]
- Llop A, Borrull F, Pocurull E (2012) Pressurised hot water extraction followed by headspace solid-phase microextraction and gas chromatography-tandem mass spectrometry for the determination of N-nitrosamines in sewage sludge. Talanta 88:284–289. [CrossRef]
- Fekete A, Malik AK, Kumar A, Schmitt-Kopplin P (2010) Amines in the environment. Crit Rev Anal Chem 40:102–121. [CrossRef]
- Cantwell FF, Losier M (2002) Liquid-liquid extraction. Comprehensive Analytical Chemistry 37:297–340. [CrossRef]
- Ma M, Cantwell FF (1999) Solvent microextraction with simultaneous back-extraction for sample cleanup and preconcentration: quantitative extraction. Anal Chem 71:388–393. [CrossRef]
- Thornton JD (2011) Extraction, Liquid-Liquid. A-to-Z Guide to Thermodynamics, Heat and Mass Transfer, and Fluids Engineering. [CrossRef]
- Wang W, Ren S, Zhang H, et al (2011) Occurrence of nine nitrosamines and secondary amines in source water and drinking water: Potential of secondary amines as nitrosamine precursors. Water Res 45:4930–4938. [CrossRef]
- Rudneva II, Omel’chenko SO (2021) Nitrosamines in Aquatic Ecosystems: Sources, Formation, Toxicity, Environmental Risk (Review). 2. Content In Aquatic Biota, Biological Effects and Risk Assessment. Water Resources 48:291–299. [CrossRef]
- Planas C, Palacios Ó, Ventura F, et al (2008) Analysis of nitrosamines in water by automated SPE and isotope dilution GC/HRMS. Occurrence in the different steps of a drinking water treatment plant, and in chlorinated samples from a reservoir and a sewage treatment plant effluent. Talanta 76:906–913. [CrossRef]
- Heim TH, Dietrich AM (2007) Sensory aspects and water quality impacts of chlorinated and chloraminated drinking water in contact with HDPE and cPVC pipe. Water Res 41:757–764. [CrossRef]
- EN 12873-1: 2003. Influence of materials on water intended for human consumption- Influence due to migration - Part 1: Test method for factory-made products made from or incorporating organic or glassy (porcelain/vitreous enamel) materials.
- EN 12873-2: 2005. Influence of materials on water intended for human consumption- Influence due to migration- Part 2: Test method for non-metallic and noncementitious site-applied materials.
- Decreto - Lei no 69/2023 de 21 de agosto. Diário da República - I Série-B 5–13.
- JMC (2020) 4MSI Joint Management Committee, Common Approach on Organic Materials in Contact with Drinking Water. 1–26. Available at: https://www.umweltbundesamt.de/sites/default/files/medien/5620/dokumente/common_approach_on_organic_materials_-_part_a_methodologies_for_testing_and_accepting_starting_substances_0.pdf.
- Almeida CMM (2021) Overview of sample preparation and chromatographic methods to analysis pharmaceutical active compounds in waters matrices. Separations 8:1–50. [CrossRef]
- ISO 8466-1:2021 Water quality — Calibration and evaluation of analytical methods — Part 1: Linear calibration function.
- Munch JW, Bassett MV (2004) Method 521: Determination of nitrosamines in drinking water by solid-phase extraction and capillary column gas chromatography with large volume injection and chemical ionization tandem mass spectrometry (MS/MS). https://cfpub.epa.gov/si/si_public_record_report.cfm?Lab=NERL&dirEntryId=103912.
- De Caroli Vizioli B, Wang Hantao L, Carolina Montagner C (2021) Drinking water nitrosamines in a large metropolitan region in Brazil. Environmental Science and Pollution Research 28:32823–32830. [CrossRef]
Figure 1.
Chromatogram of a standard control with the targeted NAs: N-Nitrosodimethylamine (NDMA), N-Nitrosomethylethylamine (NMEA), N-Nitrosodiethylamine (NDEA), N-Nitrosodiisopropylamine (NDIPA), N-Methyl-N-nitrosobenzeamine (MNBA), N-Nitrosopyrrolidine (NPYR), N-Nitrosomorpholine (NMOR), N-Nitrosodipropylamine (NDPA), N-Nitrosopiperidine (NPIP), N-Ethyl-N-nitrosobenzeamine (ENBA), N-Nitrosodibutylamine (NDBA).
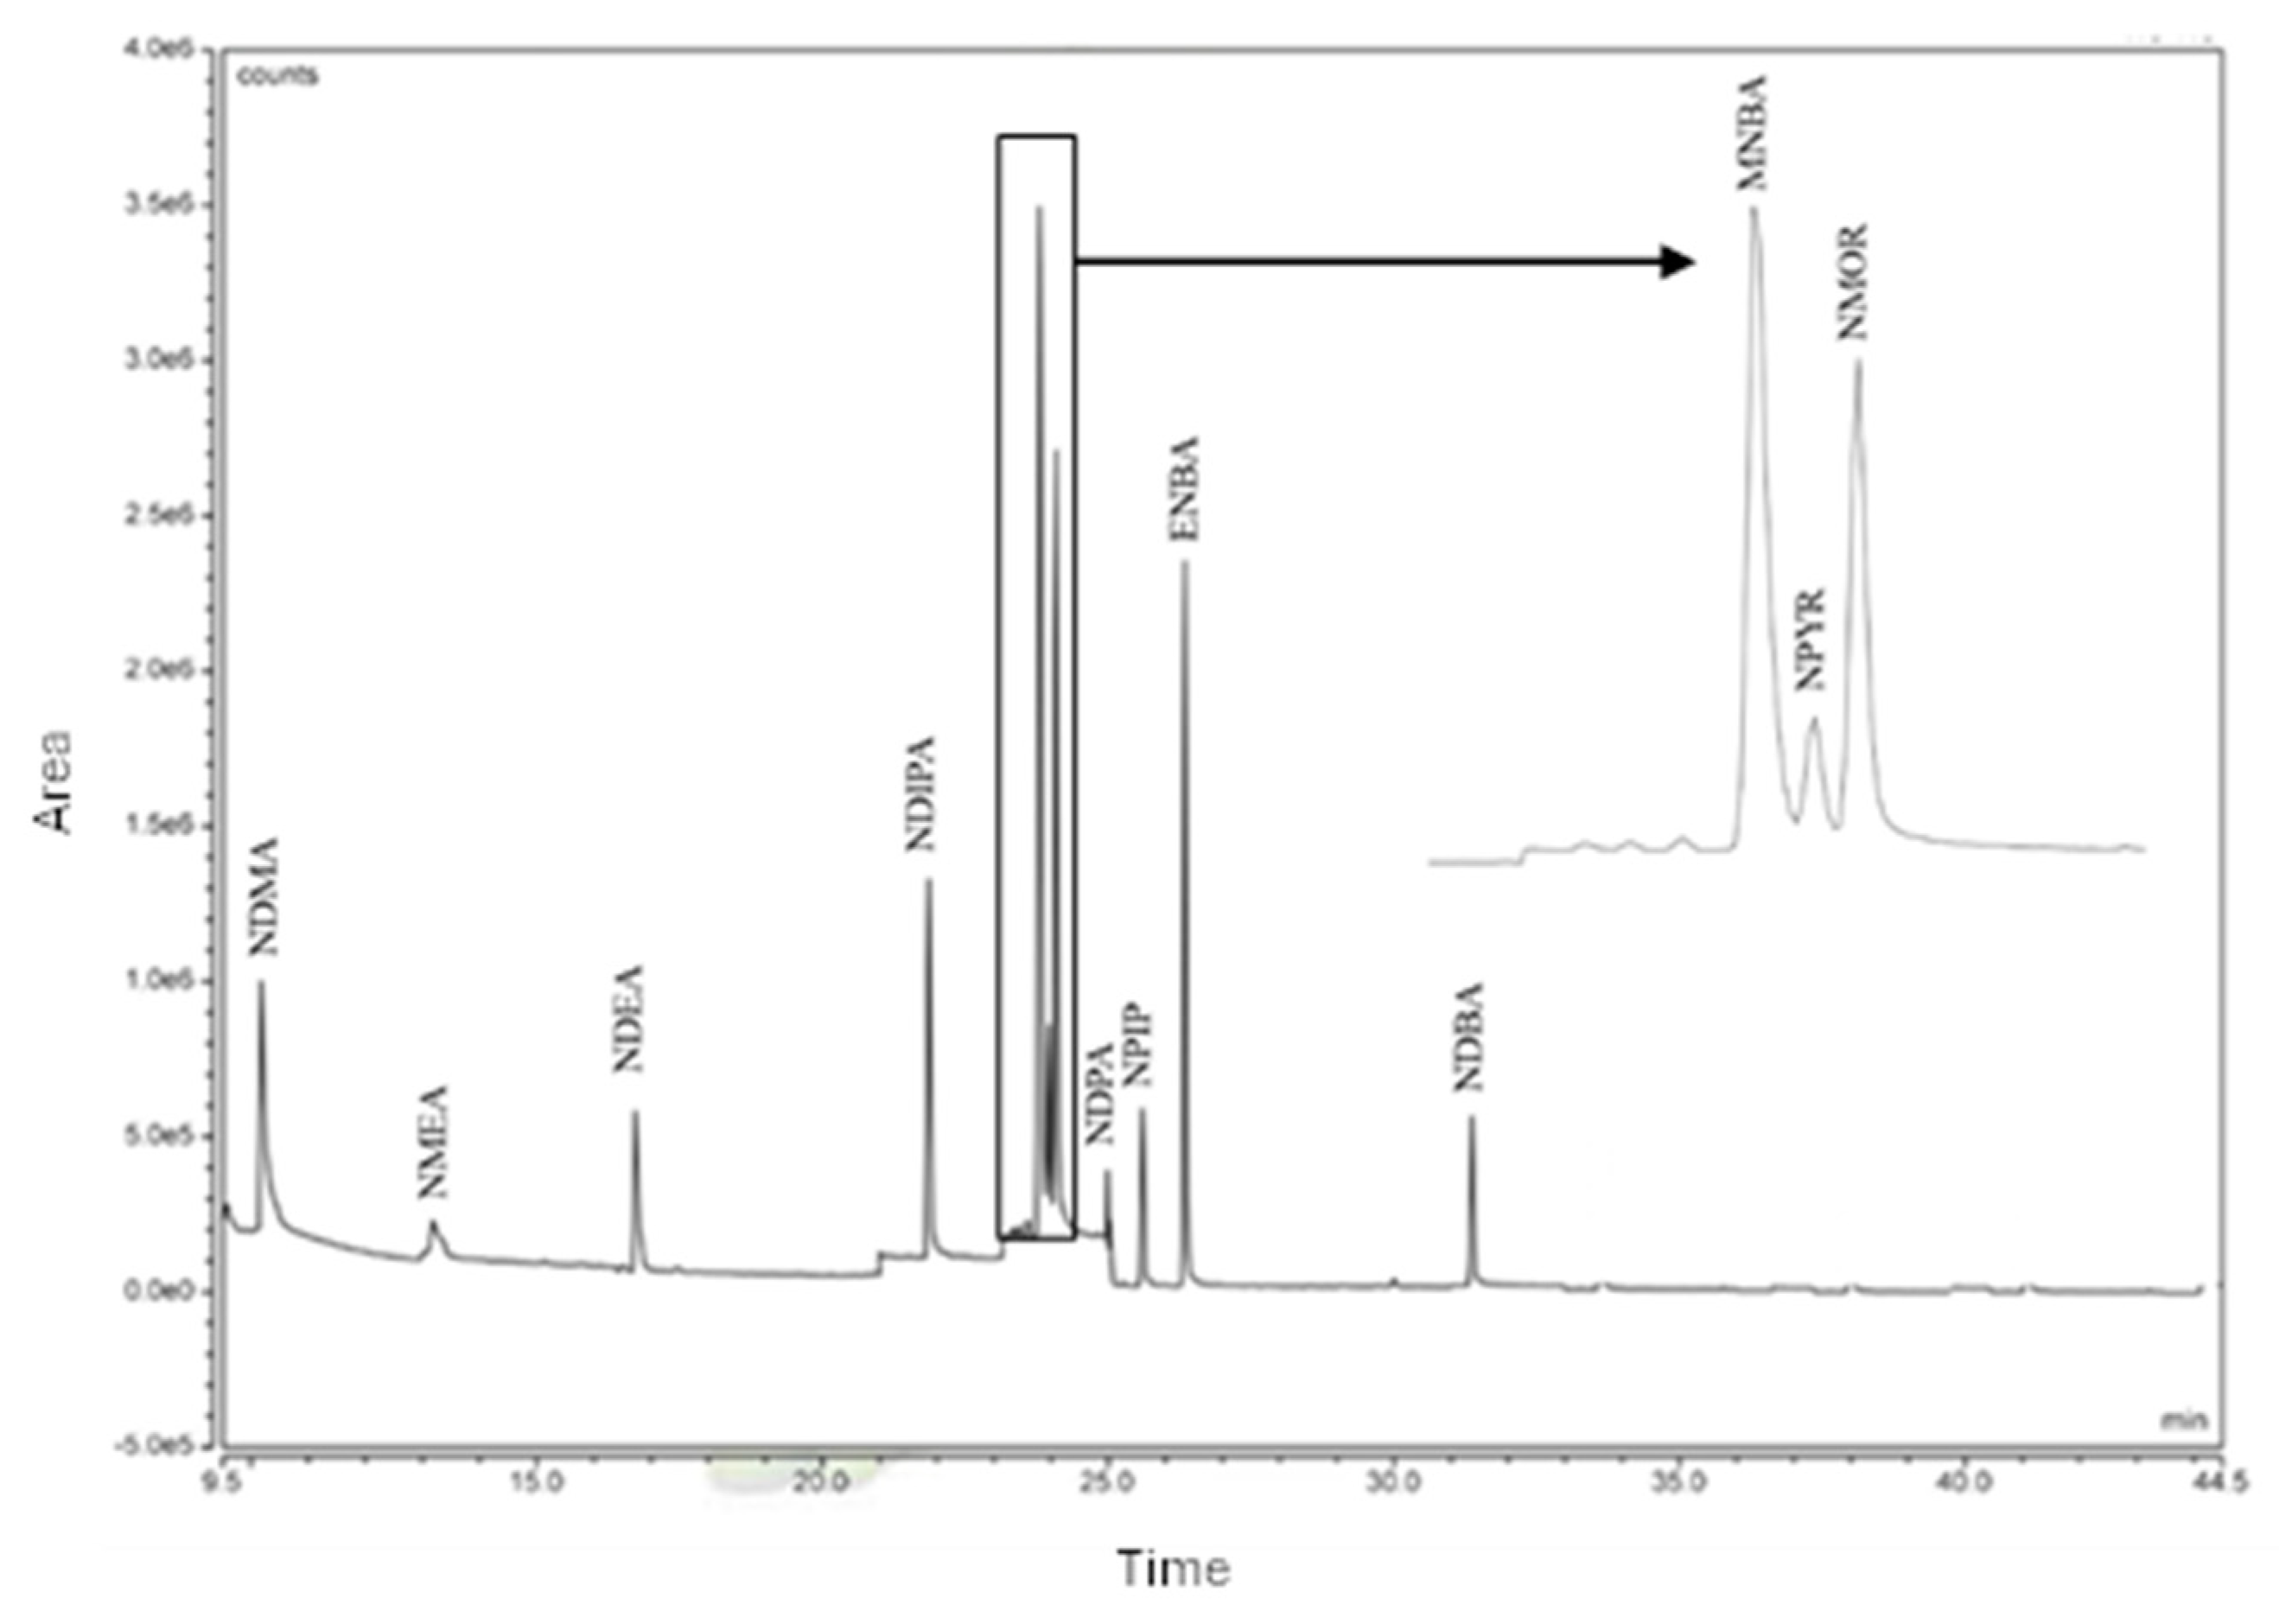
Figure 2.
Recovery of NAs by LLE-GC-MS at pH 6 and both pH (pH 2 + pH 9), (n=3).

Figure 3.
Recovery of NAs by LLE-GC-MS with different volumes of extraction solvent.
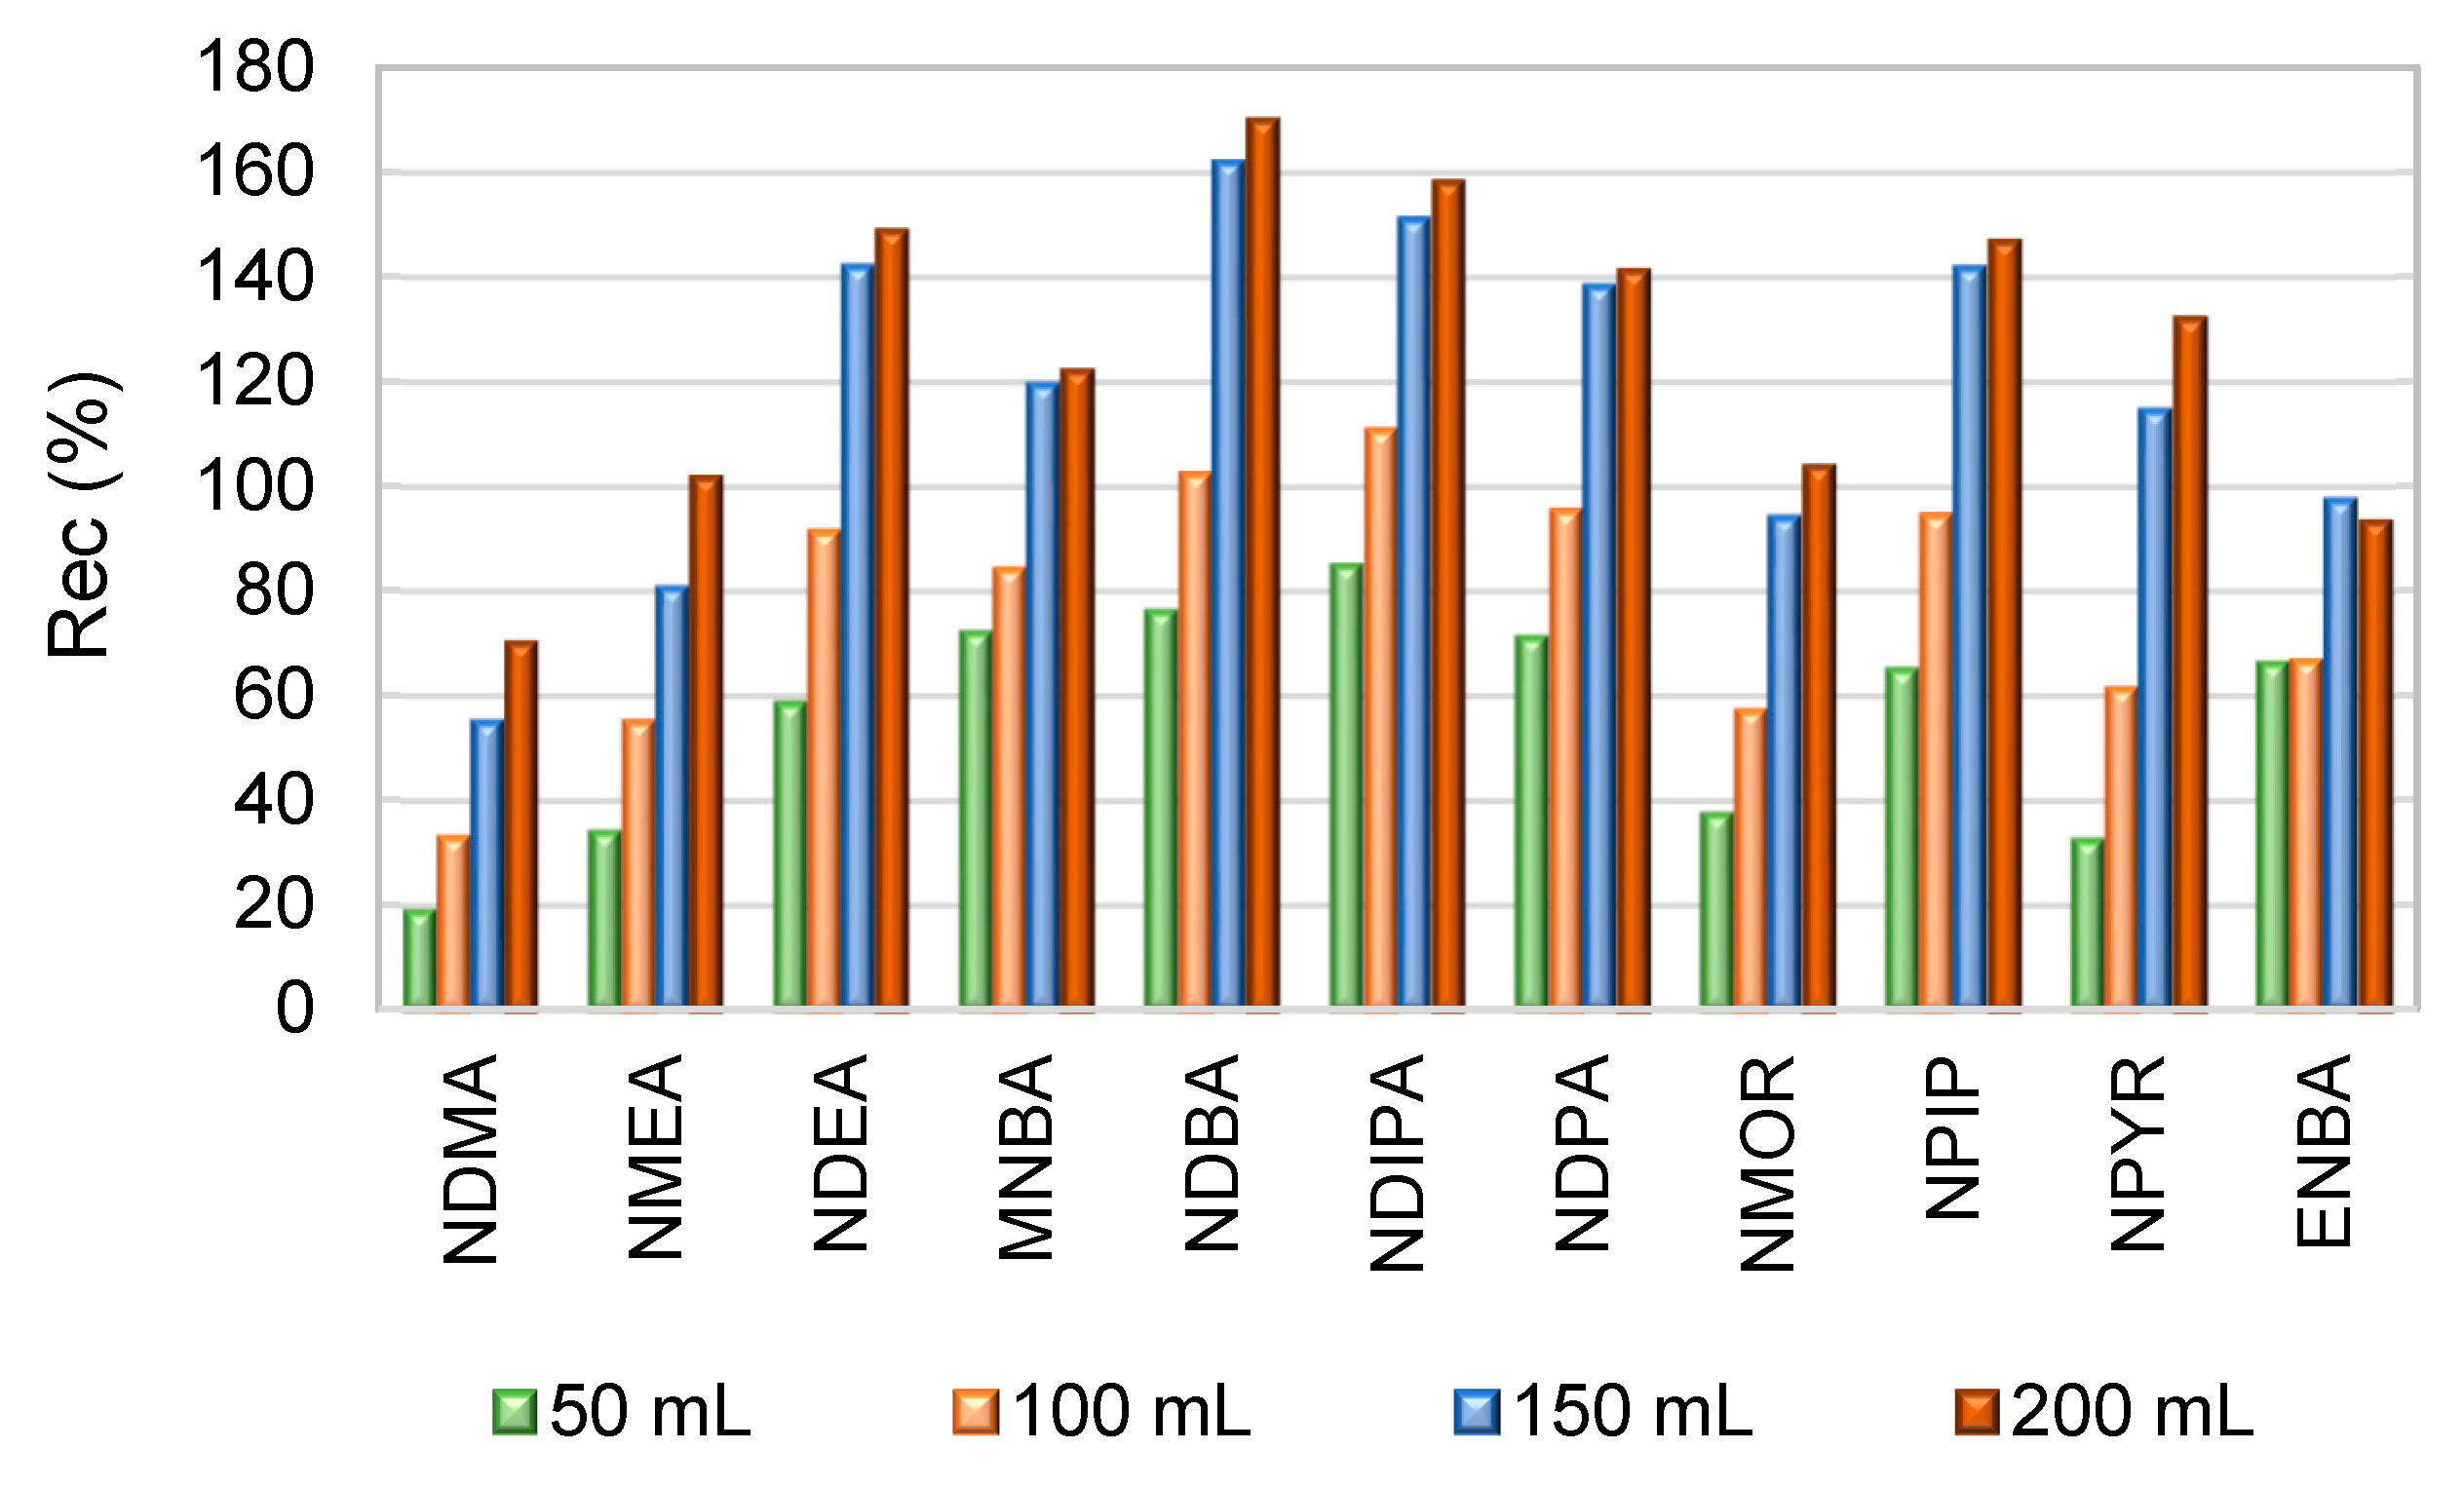
Figure 4.
Material migration tests for NAs monitorization.
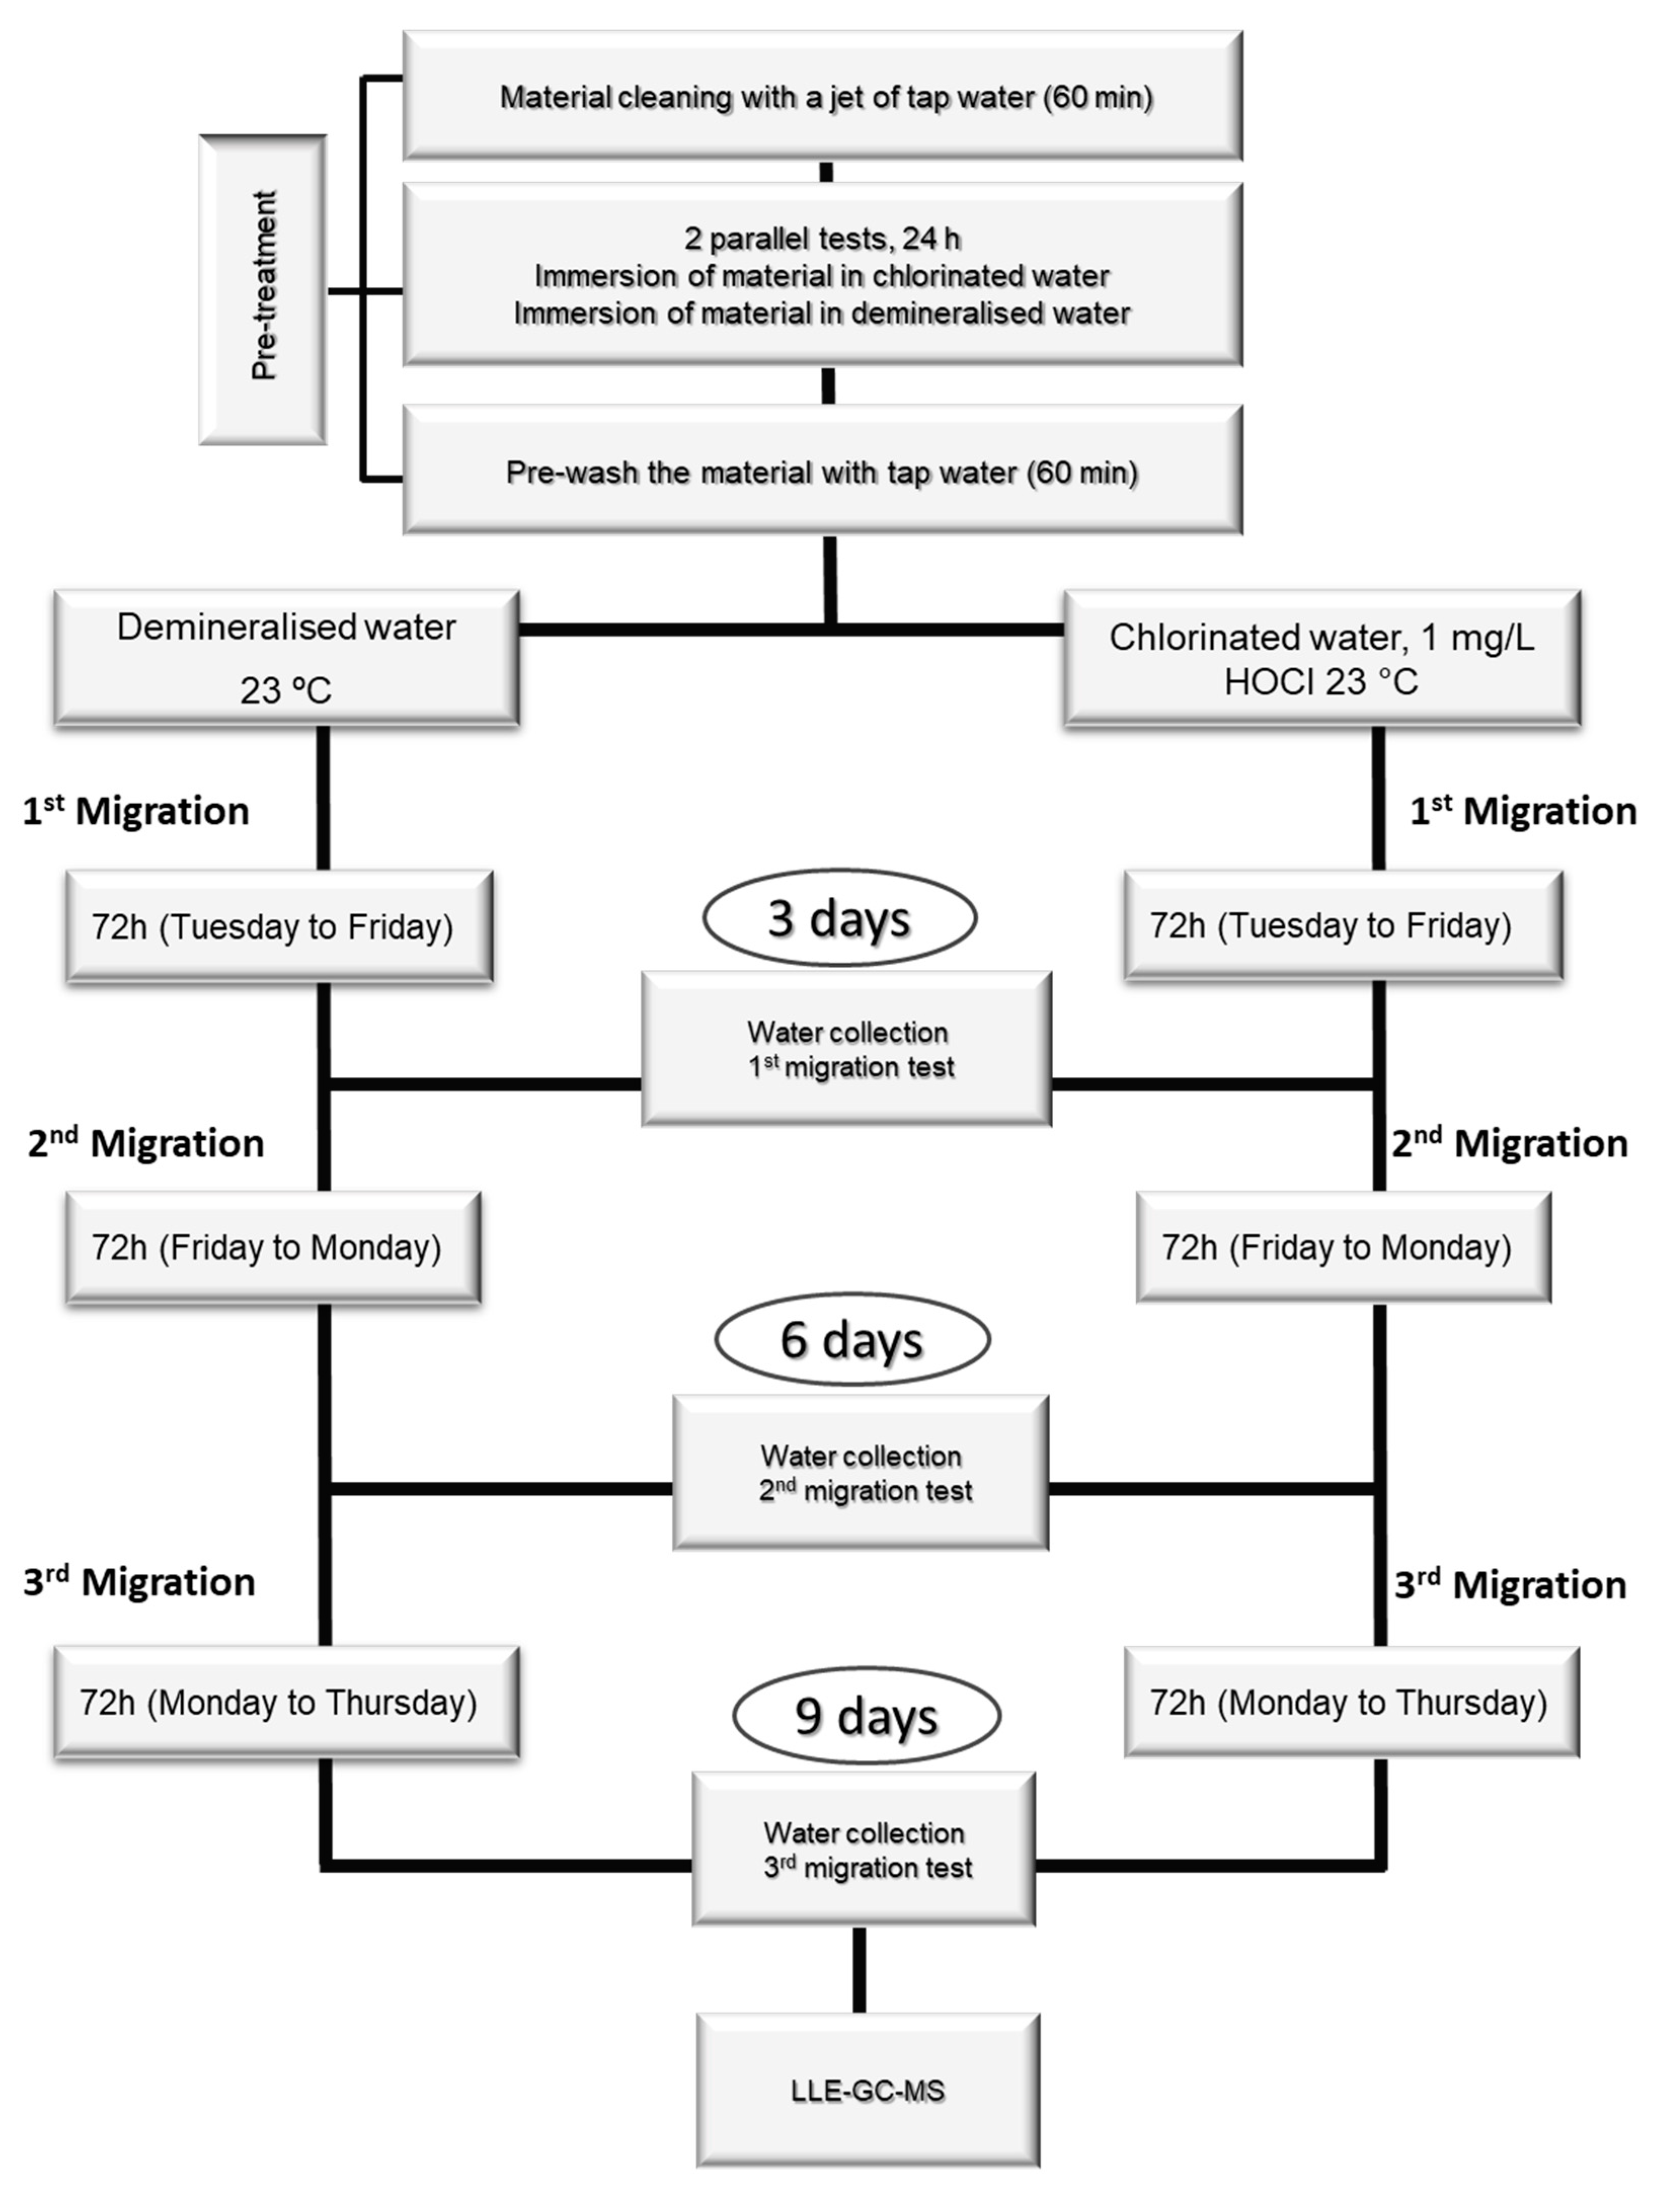

Table 1.
Linear range, limit of detection (LOD), and limit of quantification (LOQ) of NAs in water samples by GC-MS.
Table 1.
Linear range, limit of detection (LOD), and limit of quantification (LOQ) of NAs in water samples by GC-MS.
| NAs | N | Linear range (µg/L) |
r2 | CVm (%) | Mandel Test VT ≤ F(0.05;1;N-3) |
Calibration curve | Repeatability | ||
|---|---|---|---|---|---|---|---|---|---|
| LOD (µg/L) |
LOQ (µg/L) |
LOD (µg/L) |
LOQ (µg/L) |
||||||
| NDMA | 8 | 24 - 109 | 0.9999 | 0.39 | 0.064 < 6.61 | 0.7 | 2.3 | 0.09 | 0.30 |
| NMEA | 9 | 30 - 180 | 0.9998 | 0.90 | 0.218 < 5.99 | 2.3 | 7.6 | 0.08 | 0.27 |
| NDEA | 9 | 60 - 359 | 0.9997 | 1.12 | 0.835 < 5.99 | 5.6 | 18.8 | 0.07 | 0.22 |
| NDIPA | 9 | 35 - 208 | 0.9995 | 1.43 | 0.098 < 5.99 | 4.2 | 13.9 | 0.03 | 0.11 |
| MNBA | 9 | 16 - 96 | 0.9998 | 0.91 | 1.43 < 5.99 | 1.2 | 4.1 | 0.08 | 0.27 |
| NPYR | 6 | 65 - 193 | 0.9992 | 1.34 | 7.17 < 10.13 | 4.9 | 16.2 | 0.08 | 0.26 |
| NMOR | 6 | 45 - 157 | 0.9994 | 1.34 | 5.78 < 10.13 | 3.8 | 12.7 | 0.06 | 0.19 |
| NDPA | 6 | 24 - 72 | 0.9986 | 1.74 | 4.82 < 10.13 | 2.4 | 7.8 | 0.06 | 0.21 |
| NPIP | 9 | 50 - 300 | 0.9989 | 2.12 | 3.29 < 5.99 | 8.9 | 29.8 | 0.09 | 0.29 |
| ENBA | 8 | 10 - 45 | 0.9997 | 0.94 | 2.58 < 6.61 | 0.7 | 2.3 | 0.16 | 0.53 |
| NDBA | 7 | 60 - 208 | 0.9992 | 1.38 | 4.38 < 7.71 | 5.2 | 17.3 | 0.11 | 0.35 |
Table 2.
Precision under repeatability conditions for the first and last concentration levels of the working range of NAs by GC-MS.
Table 2.
Precision under repeatability conditions for the first and last concentration levels of the working range of NAs by GC-MS.
| NAs | Lower concentration | Higher concentration | ||
|---|---|---|---|---|
| C (µg/L) | RSD (%) | C (µg/L) | RSD (%) | |
| NDMA | 24.2 | 3.0 | 145 | 2.3 |
| NMEA | 30.0 | 2.7 | 180 | 0.80 |
| NDEA | 59.8 | 2.2 | 269.3 | 6.4 |
| NDIPA | 34.7 | 1.1 | 208.4 | 3.0 |
| MNBA | 16.0 | 2.7 | 96.0 | 4.3 |
| NPYR | 64.5 | 2.6 | 193.4 | 11 |
| NMOR | 44.7 | 1.9 | 201.2 | 5.3 |
| NDPA | 24.0 | 2.1 | 72.1 | 11 |
| NPIP | 50.0 | 2.9 | 225.1 | 6.2 |
| ENBA | 10.0 | 5.3 | 59.9 | 3.3 |
| NDBA | 59.5 | 3.5 | 208.2 | 4.8 |
Table 3.
Intermediate precision of NAs by GC-MS method (n=10).
| NAs | Lower concentration | Higher concentration | ||
|---|---|---|---|---|
| C (µg/L) | RSD (%) | C (µg/L) | RSD (%) | |
| NDMA | 24.2 | 3.0 | 145 | 2.3 |
| NMEA | 30.0 | 2.7 | 180 | 0.80 |
| NDEA | 59.8 | 2.2 | 269.3 | 6.4 |
| NDIPA | 34.7 | 1.1 | 208.4 | 3.0 |
| MNBA | 16.0 | 2.7 | 96.0 | 4.3 |
| NPYR | 64.5 | 2.6 | 193.4 | 11 |
| NMOR | 44.7 | 1.9 | 201.2 | 5.3 |
| NDPA | 24.0 | 2.1 | 72.1 | 11 |
| NPIP | 50.0 | 2.9 | 225.1 | 6.2 |
| ENBA | 10.0 | 5.3 | 59.9 | 3.3 |
| NDBA | 59.5 | 3.5 | 208.2 | 4.8 |
Table 4.
Recovery of NAs in ultrapure water and drinking water by LLE-GC-MS.
| NAs | C (µg/L) | Ultrapure Water (n=10) |
Drinking Water (n=29) |
||
|---|---|---|---|---|---|
| Rec (%) | RSD (%) | Rec (%) | RSD (%) | ||
| NDMA | 48.3 | 57 | 7.9 | 47 | 18.3 |
| NMEA | 60.0 | 59 | 7.7 | 62 | 9.4 |
| NDEA | 119.7 | 106 | 14.5 | 112 | 14.2 |
| NDIPA | 69.5 | 103 | 12.9 | 115 | 14.5 |
| MNBA | 32.0 | 94 | 7.8 | 108 | 18.7 |
| NPYR | 128.9 | 93 | 17.0 | 101 | 13.5 |
| NMOR | 89.4 | 83 | 12.5 | 83 | 12.8 |
| NDPA | 48.0 | 97 | 15.0 | 104 | 14.1 |
| NPIP | 100.0 | 103 | 13.4 | 115 | 13.9 |
| ENBA | 20.0 | 82 | 13.0 | 89 | 19.2 |
| NDBA | 119.0 | 103 | 13.4 | 125 | 11.6 |
Table 5.
The limit of quantification (LOQ) and method quantification limit (MQL) of NAs by LLE-GC-MS.
Table 5.
The limit of quantification (LOQ) and method quantification limit (MQL) of NAs by LLE-GC-MS.
| NAs | LOQ (µg/L) | MQL (µg/L) | MCTTap (µg/L) |
|---|---|---|---|
| NDMA | 0.0060 | 0.20 | 0.30 |
| NMEA | 0.0092 | ||
| NDEA | 0.033 | ||
| NDIPA | 0.0089 | ||
| MNBA | 0.0083 | ||
| NPYR | 0.033 | ||
| NMOR | 0.019 | ||
| NDPA | 0.012 | ||
| NPIP | 0.028 | ||
| ENBA | 0.0045 | ||
| NDBA | 0.038 |
Table 6.
Material parameters required for migration test calculation.
| Material | Surface area (dm2) |
N | Volume (dm2) |
S/V ratio (dm-1) |
Fc (dia.dm-1) |
|---|---|---|---|---|---|
| A | 18.35 | 4 | 4 | 4.6 | 1 |
| B | 22.25 | 4 | 4 | 5.6 | 1 |
| C | 19.20 | 4 | 4 | 4.8 | 0.01 |
| D | 6.41 | 4 | 5 | 5.1 | 1 |
N - number of test pieces used together in a migration; Fc – Conversion factor.
Table 7.
Concentration of NAs in chlorinated water (CW) and demineralized water (DW) in the migration waters of materials C and D analysed by LLE-GC-MS.
Table 7.
Concentration of NAs in chlorinated water (CW) and demineralized water (DW) in the migration waters of materials C and D analysed by LLE-GC-MS.
| Material | NAs | (µg/L) | |||||
|---|---|---|---|---|---|---|---|
| 1st Migration | 2nd Migration | 3rd Migration | |||||
| CW | DW | CW | DW | CW | DW | ||
| C | MNBA | 106 | 97 | 79 | 47 | 50 | 23 |
| NMOR | < LOQ | 57 | < LOQ | < LOQ | < LOQ | < LOQ | |
| NDPA | 76 | 30 | 51 | < LOQ | < LOQ | < LOQ | |
| ENBA | 267 | 99 | 142 | 73 | 58 | 39 | |
| D | MNBA | < LOQ | 21 | < LOQ | < LOQ | < LOQ | 16 |
| NDBA | < LOQ | < LOQ | 65 | < LOQ | < LOQ | < LOQ | |
Table 8.
Migration rate of NAs from materials in chlorinated (CW) and demineralized water (DW) of materials C and D analysed by LLE-GC-MS.
Table 8.
Migration rate of NAs from materials in chlorinated (CW) and demineralized water (DW) of materials C and D analysed by LLE-GC-MS.
| Material | NAs | Taxa de Migração (µg dm-2d-1) | CTap | ||||||
|---|---|---|---|---|---|---|---|---|---|
| 1st Migration | 2nd Migration | 3rd Migration | |||||||
| CW | DW | CW | DW | CW | DW | CW | DW | ||
| C | MNBA | 7.1 | 6.5 | 4.6 | 2.7 | 3.3 | 1.4 | 0.030 | 0.010 |
| NMOR | < LOQ | 3.9 | < LOQ | < LOQ | < LOQ | < LOQ | --- | --- | |
| NDPA | 5.3 | 1.9 | 3.3 | < LOQ | < LOQ | < LOQ | --- | --- | |
| ENBA | 18.6 | 6.9 | 9.9 | 5.1 | 4.0 | 2.7 | 0.040 | 0.030 | |
| D | MNBA | 1.4 | < LOQ | < LOQ | < LOQ | < LOQ | < LOQ | --- | --- |
| NDBA | < LOQ | < LOQ | 4.2 | < LOQ | < LOQ | < LOQ | --- | --- | |
Table 9.
Characteristics of the four organic materials (A, B, C e D) used in the migration tests.
| Parameter | Material | |||
|---|---|---|---|---|
| A | B | C | D | |
| Length (mm) | 150 | 158 | 150 | 209 |
| Width (mm) | 147 | 158 | 150 | 147 |
| Height/Thickness (mm) | 3 | 0 | 5 | 3 |
| Colour | Grey | White | Black | Beige |
| Opacity | Opaque | Glossy | Opaque | Glossy |
| Suggested use | Waterproof coating for waterworks, roofs, and bridge decks | Impermeable coating for drinking water tanks | High-strength sealant for applications in sewers and drinking water tanks | Biocomponent for the production of 100 %polyurea coatings |
Table 10.
Conditions of NAs analysis by GC-MS method.
| Nitrosamine | Retention time (min) | Time window (min) | Quantitation ion (m/z) | Confirmation ion (m/z) |
|---|---|---|---|---|
| NDMA | 10.13 | 9.5 – 12.99 | 42 | 74 |
| NMEA | 13.61 | 13 – 16.39 | 42 | 88 |
| NDEA | 16.70 | 16.40 – 20.99 | 42 | 102 |
| NDIPA | 21.88 | 21 – 23.14 | 43 | 70 |
| MNBA | 23.85 | 23.15 – 24.99 | 77 | 106 |
| NPYR | 23.90 | 41 | 100 | |
| NMOR | 24.01 | 56 | 86 | |
| NDPA | 24.14 | 43 | 70 | |
| NPIP | 25.66 | 25 – 30.99 | 55 | 114 |
| ENBA | 26.39 | 106 | 121 | |
| NDBA | 31.47 | 31 – 32.99 | 57 | 84 |
Disclaimer/Publisher’s Note: The statements, opinions and data contained in all publications are solely those of the individual author(s) and contributor(s) and not of MDPI and/or the editor(s). MDPI and/or the editor(s) disclaim responsibility for any injury to people or property resulting from any ideas, methods, instructions or products referred to in the content. |
© 2025 by the authors. Licensee MDPI, Basel, Switzerland. This article is an open access article distributed under the terms and conditions of the Creative Commons Attribution (CC BY) license (http://creativecommons.org/licenses/by/4.0/).
Copyright: This open access article is published under a Creative Commons CC BY 4.0 license, which permit the free download, distribution, and reuse, provided that the author and preprint are cited in any reuse.


