

Submitted:
28 April 2025
Posted:
28 April 2025
You are already at the latest version
Abstract
A key part in the empirical model is the ‘adequate chloride to trigger corrosion activation’, Ccrit. Although Ccrit has a wide distribution and has different distributions in different environments and concrete compositions, its use in modelling provides greater design flexibility, and improved confidence, compared to Deemed to Satisfy (DtS) rules included in most codes. Because of the limitations in DtS provisions, modelling provides more effective designs by incorporating specific criteria for a broad range of exposures, materials, and construction methods. The Bulletin will provide a range of potential Ccrit distributions for different situations and indicate paths for improving the precision of Ccrit distributions.
Keywords:
Concrete
; chloride
; corrosion
; modelling
; threshold
; activation
1. Introduction
DtS requirements for chloride exposures in national codes are typically quite limited. They generally don’t allow for variability in the key factors that define load and resistance for chloride induced corrosion, e.g. surface chloride level, chloride diffusion coefficient, critical chloride level and temperature. Durability design is intended to be conservative. That means the DtS requirements should be established to cater for the worst applicable national conditions, i.e. highest temperatures, severest chloride levels, worst chloride diffusion and worst critical chloride level. Hence, DtS requirements for most structures will be conservative, often highly so, yet history shows others historical experience can lead to disastrously inadequate DtS requirements when, although allowed, less performance materials are chosen. Because of the limitations in DtS provisions, modelling is seen as a way to more consistent designs using a broad range of materials and construction methods. Modelling may also be a way to provide a broader spectrum of DtS requirements where modelling is not an appropriate option.
From 1960-1980 it was increasingly recognized that the design life could be defined as initiation and propagation phases (T0+T1 model) [5] and that corrosion activation was triggered by the arrival of an adequate chloride content, i.e. a critical chloride threshold, Ccrit. From 1980-2005 empirical models to describe corrosion processes were developed and, towards the end of that period, variables were more properly described as statistical distributions rather than discrete numbers. From 2005 various researchers endeavored to more accurately describe these distributions, and a key one of those is Ccrit. In 2006 the Model Code for Service life design was published by fib, which includes a probabilistic performance-based approach for the design of structures prone to chloride-induced corrosion. This approach is then collected in the Model Code 20204 (MC Model) that allows all key factors of chloride-induced corrosion to be accounted for so that durability design can be tailored to project materials, exposures, and construction
2. Why is Durability Modelling Important to Design
It is essential to drastically reduce the environmental cost of construction as it is one of the major sources of greenhouse gas emitters, and the rate of construction is increasing, and serious climate change is already on us. It requires a step change in thinking, one that increases the life of our structures. Better tools to help select materials, life cycles that give optimum performance in terms of pollution, and more efficient use of resources are essential if we are not to fly blindly into this storm. Appropriate selection of cement systems, admixtures, rebar, concrete cover and mix design all have the potential to significantly increase the life of concrete structures, but we cannot optimize their use without better tools to predict life cycle performance.
Modelling has the potential to unlock the appropriate use of materials. Full probabilistic models are available, and are being further developed, but as yet input variables are far from well described. A large proportion of our infrastructure is in coastal regions and in areas where de-icing salts are used. Both lead to aggressive chloride environments and yet one of the biggest unknowns in our models is the appropriate Ccrit distribution to use in design. MC 2010 [4] provides no information on critical chloride level for concrete or steel. A 2010 CSIRO report [6] on climate change indicated a likely increase of up to 3.5% in chloride induced corrosion initiation around the coasts of Australia. So, both the extent of buildings in severe exposures and the proportion deteriorating is increasing. Clearly the proportion of structures in chloride environments that prematurely deteriorate needs to be drastically reduced.
3. Background and Work of fib WP 8.9.3
The scope of TG 8.9.3 is:
- discuss the subject of the corrosion onset due to chlorides and to update the knowledge through fib,
- gather information on corrosion resistant bars as means for avoidance of corrosion,
- derive revised design rules and recommended cover depths for the different types of bars,
- to make examples and case studies of application
- The objectives are:
- Provide background to the range of critical chloride levels that should be used in design
- Identify limitations of the critical chloride levels provided.
- Provide other corrosion protection design guidance that is critical to using the critical chloride levels (e.g. cracking, galvanic cells, exposures, pitting)
- Identify any issues with steel/galvanizing composition.
- Provide QA recommendations when using the materials discussed.
This section may be divided by subheadings. It should provide a concise and precise description of the experimental results, their interpretation, as well as the experimental conclusions that can be drawn.
4. What Is Meant by Ccrit
If a reproducible value of Ccrit is to be developed, then there needs to be a consistent definition. Regarding this, the group agreed that Ccrit can be defined as the concentration of chloride in concrete required to break down the passive layer (i.e., depassivate) of the reinforcement that may lead to corrosion initiation. Hence, to evaluate the critical chloride threshold, there are two critical issues: the detection of the depassivation time and the (immediate) measurement of the chloride content near the steel surface. Being the discussion of the latter out of the scope of the TG 8.9.3, it will not be considered in this paper. Regarding “depassivation”
Andrade [7] suggests “…depassivation is considered when in a delimited surface of steel (let’s say of 1 cm2) the corrosion current density is during a sustained period of time higher than 0.1-0.2 µA/cm2”. Even with a precise definition and a consistent method of measurement by polarisation resistance the authors found a high degree of scatter.
Apart from the measuring method it is also important to define Ccrit statistically, i.e.:
- For full probabilistic modelling purposes, it shall be defined as a distribution.
- Deterministic calculation, without partial factors, only yield results of known reliability (50% chance of corrosion at reliability of 0) when the mean value is used. A safe value for Ccrit and other variables could be used but that would be overly conservative.
- Partial factors developed will need to be based on a specific distribution for Ccrit.
The distribution for Ccrit of carbon steel in atmospheric zones is quoted by fib [1] as BetaD(0.60/0.15/0.02/2). 0.6 is the mean critical chloride level as Weight Percent Cement (WPC). 0.15 is the standard deviation and 0.02 and 0.2 are the maximum and minimum values corresponding to 0 and 1 in a Beta Distribution. This distribution has a 95% probability that Ccrit will exceed 0.38 WPC, a little different to 0.35 WPC for a normal distribution of the same mean and standard deviation.
This definition of Ccrit is easy to be applied in laboratory conditions where the corrosion behavior of the bar can be constantly monitored, through electrochemical measurements. For existing structures, constant monitoring is not usually performed, and it is less feasible. In research on structures, it might be convenient to define it in a different manner, considering a different method of measuring.
5. Methods of Measuring Ccrit
In the Bulletin only the general principles of measuring Ccrit are reviewed. Referring to research on structures, it might be convenient to define it as the chloride level when visible corrosion is seen on the reinforcement, when cracking occurs, when the potential is a certain value, or when the polarisation resistance becomes a certain number. All these methods would yield different results. Figure 1a from Papworth [8] shows a theoretical T0+T1 graph showing corrosion degree with time for concrete with a long propagation period. This could be representative of a dry coastal region which only have <30 rain days /year. Overlain is a graph of chloride concentration at the reinforcement depth with time (in blue color). The shape is typical of that to give a mean Ccrit of 0.6WPC when corrosion initiates. The intention is to relate the chloride level to the progress of corrosion.
Shown on this graph are potential points when different measurement methods might detect corrosion (A1 to A1’’’) and demonstrates why different measurement methods might lead to significant differences in measured Ccrit, particularly if methods based on visible concrete damage are included. Clearly if design life is to be assessed based on initiation plus propagation the onset of corrosion in relation to these periods is critical.
Figure 1a also shows various other important considerations in relation to detecting ongoing corrosion. Melchers [9] noted that corrosion might start (A) and then the reinforcement might permanently re-passivate (A2) or temporarily re-passivate (A3). The point here is that any method of measurement should not suggest corrosion before these points may have been reached. Andrade’s view is that the polarisation resistance method with a corrosion current set sufficiently high (A1’’ and A3’’) would achieve that goal.
In splash zones or wet coastal areas, the T0+T1 diagram might look like Figure 1b. Papworth [8] notes that these graphs show that the chloride ingress rate and corrosion rate are not directly linked as the latter is more dependent on moisture content than chloride content. That means that where the propagation period is long there will also be a high buildup of chlorides at the bar between initiation and first crack. Hence, Ccrit values obtained based on concrete damage (first crack) will be significantly higher than Ccrit values obtained by non-destructive testing. Conversely, where the propagation period is short the difference in Ccrit for any of the measurement method will be insignificant in terms of modelling errors.
In fib and EuroCode 2 “Corrosion (condition) limit state”, i.e. CLS, has been adopted. This CLS is in between the first depassivation and the appearance of a crack and has been by agreement (nominally) ascribed to a pit depth of 500 microns (and to a uniform corrosion of 50 microns).
This is achieved soon in the submerged or tidal exposures but may be long in aerial zones.
6. Carbon Steel
6.1. Historical Ccrit Values
A common discrete value quoted in the literature for Ccrit is 0.4 WPC. Generally, it is not noted what statistic this represents but it is consistent with distributions given in fib 34 [1] when considered as a characteristic value with 5-10% chance of structures corroding at this value, i.e. it is a safe design value. It has been reported that reinforcement in some structures show no signs of corrosion long after the 0.4 WPC Ccrit is reached. This may be largely because 95% of structures should show no corrosion at this chloride level. However, there are other reasons why the critical chloride level could be higher than that the current values in fib 34.
Gulikers [10] reviewed the critical chlorides giving in fib Bulletin’s 34 [1] and 76 [11] and those given in Duracrete [12]. The fib values were as proposed by Gehlen [13]. Originally values for the mean (0.5% WPC) and standard deviation (0.15%), came from the experimental work by Breit [14] on ‘lollipop’ samples. However, Gehlen, considered 0.5% too conservative/unrealistic for practice. Therefore, he increased the mean from 0.5% to 0.6% but maintained the same value for the standard deviation. The limits on the beta distribution are 0.2 and 2 WPC. Gehlen gave no further support or experimental evidence for the increase by 0.1% although various papers by authors he associated with suggest much higher values occur. The only limitation given for Ccrit is that it applies to mild steel only.
Gulikers [10] also notes Duracrete [12] had Ccrit distributions for different exposures and w/c as shown in Table 1. These were values based on visible concrete damage. This raises the question as to why different values were not published in fib for different concrete qualities and exposures. Given the low Ccrit for concrete with a w/c of 0.5, and that in practice concrete with a w/c ratio of 0.5 should not be used in marine concrete, it might be reasonable to propose Ccrit for splash zone for high performance and moderate performance concrete, coinciding with w/c ratios of 0.3-0.35 and 0.35-0.4, at a much higher mean value than currently given in fib Bulletin 34 [1].
Notably no values are given for coastal concrete.
Even before publication of fib Bulletin 34 [1] there had been extensive research on values for Ccrit. Since fib 34 there has been much more research. Yet, or maybe because, there has been no unifying research.
Among other older values, it is important to emphasize that Melchers [15] gives examples where chloride concentrations at the bar were much higher than fib Ccrit with no corrosion. This is consistent with other research where the chlorides needed for corrosion were much higher than those used by fib 34 [1]. This gave concern that using the Model with Ccrit might lead to overly conservative designs, and that chloride ingress may not be the most appropriate modelling approach.
The European perspective was very much on the need for far better guidance on the use of Ccrit now that modelling is finding wide usage amongst engineers with little research background. It was necessary to ensure designs were safe, but not overly conservative. However, there was still concern that factors other than chlorides at the bar were not adequately accounted for in determining if corrosion would occur.
One of the lead Ccrit researchers, Ueli Angst, in one paper [16] made within the work of RILEM TC 235, a review of factors at the steel concrete interface that affect Ccrit is given. Ueli et al. summarized these as:
- The degree to which steel is polished, the steel metallurgy, and the moisture content at the Steel: Concrete Interface (SCI) are by far the most dominant influencing characteristics.
- Cement type and w/b ratio have comparatively small effects.
- Corrosion at macroscopic interfacial voids depends on the moisture states, with partially filled voids representing the worst case.
- The relative degree of corrosion sometime after initiation can be affected by propagation as well as initiation. Reported advanced corrosion at bleed lenses, for example, are more a function of high propagation rates than low Ccrit.
In another [17], also with coworkers, it is proposed that rather than continuing to focus on corrosion as T0 + T1, with Ccrit related to T0, the corrosion process be considered as one continuum including initiation and propagation, but without proposing how to apply this concept, while the Condition Limit State previously adopted in Eurocode 2 is a practical approach.
The Bulletin draws the conclusion that it is not possible at this stage to provide a relationship between all the factors affecting Ccrit. The best that can be expected is to place limits of application on Ccrit distributions proposed. The lack of limits is seen as a flaw in the fib Bulletin 34 [1] Ccrit distribution. The Bulletin will give insight into the issues of developing Ccrit for different situations. Also the Bulletin, following MC2020, supports the incorporation of a certain propagation period to the nominal service life, that is the adoption of a new limit state of corrosion (CLS) that in certain exposure classes adds a propagation period because the expected corrosion rate is low and the pit depth is limited for a sustained period of time.
6.2. Recent Research on Ccrit
This adoption of the CLS was deeply discussed by an ad-hoc group when preparing MC2020, deciding to apply it not only to chloride induced corrosion, but also to carbonation and the other types of attack or damage. The concept has been defined as “Condition Limit State” and can be applied to other deterioration mechanisms. In the particular case of chloride attack, Andrade [Figure 1] showed that fib [1] criteria on Ccrit were supported by other authors and hence fib 34 could be used even though other distributions are found in the literature (Figure 1). In some cases, the reasons for the higher standard deviation values are unclear because they come from site measurements (Angst) where perhaps the concrete moisture content is variable, while in others it is known (Izquierdo <-200 mv) because they are the result of laboratory well controlled testing.
Conversely Angst [19] highlights three studies shown in red, three in yellow and two in blue (Figure 2) showing different clusters for higher Ccrit distributions. This suggest three studies cannot be randomly picked as agreeing and are therefore Ccrit should be supposed with a lower standard deviation. That is, even though higher Ccrit distributions may be used by engineers, the criteria published for general use must be a lower bound, i.e. fib [1] values.
6.3. Different Ccrit for Different Circumstances
TG 8.9.3 had considerable discussion on the fib [1] Ccrit distribution as discussed in Section 6. Papworth [8] considered how the wide distribution in fib [1] could be reasonably applied for all concrete. His Figure 4a shows five distributions based on a single contrived data set for Ccrit. The whole data set fits the distribution given in fib [1]. The other four distributions take a portion of the whole date set splitting the data into four sets potentially representing different qualities. The meaning of quality is deliberately not defined and could be aspects of the interface and/or the mix. This was so that an assessment of the influence of quality on Ccrit could be made by using the various distributions to assess the reliability of a structure where all the other inputs were held constant in a full probabilistic analysis (Figure 4b). It must be born in mind that these distributions are only for values making up the fib [1] Ccrit distribution. Higher distribution would give even higher reliability than shown here.
Figure 4b shows the fib 34 distribution gives a reliability of 1.4 at 100 years and this might be taken as just less than ideal where a target reliability of 1.5 would be required for before a first crack limit state, i.e. for example a minor increase in cover might be required. If the distribution represents concrete at the poor and high end of the quality spectrums the reliability was around 1.1 and 1.7 respectively. That represents a significant difference in cover required. As noted earlier there was already concern that the fib [1] Ccrit distribution underestimated the resistance to chloride in some situations and strengthened the idea that different distributions should be used for different qualities, if those qualities could be defined.
6.4. Application Limits for Ccrit
Possible Ccrit values were tabled, together with potential limitations of use, (Table 2) for TG 8.9.3 consideration.
Diffusion coefficient was included as a general measure of quality as it is a test likely to be required for chloride environments as a measure of chloride ingress rate. The requirement for testing on representative trial blocks and first pours was an attempt to ensure assessment was based on site concrete rather than laboratory samples. Voids and porosity were intended to give some measure of voidage at the SCI while steel composition and surface condition were an attempt to bring in other SCI properties.
Strong responses to the possible limits in Table 2 were:
- a)
- It is the SCI that is responsible for Ccrit and the measures in Table 2 mainly considered the concrete’s general quality, and they would not deal adequately with qualifying the interface.
- b)
- In terms of general concrete quality, the normal requirements for concrete for each exposure were adequate. No additional restrictions are required.
- c)
- Any measure for Ccrit needed to be based on the real as placed concrete and not laboratory samples.
On the other hand, an attempt to classify the concrete quality with respect to reinforcement corrosion is being made in CEN TC 104-Concrete related to the new EN-206 and it is based in classifying the concretes in function of their carbonation rate or chloride diffusion coefficient obtained in tests at short time, already standardized. The values of the rates of ingress are classified from lower to higher in “Exposure Resistance Classes (ERC)” that serve to specify the associated cover depths, that were calculated through different levels of service life models.
It is clear that the influencing factors has to be drawn from the SCI and proxy measures of concrete mix or insitu performance of the bulk concrete would not provide realistic limitations. A detailed report [20] on methods of characterizing the SCI outlines “current methods (laboratory or field-based) for characterizing local properties of the SCI that have been identified as governing factors affecting corrosion initiation. These properties include characteristics of the steel such as mill scale and rust layers, and characteristics of the concrete such as interfacial voids, microstructure and moisture content.” It notes various limitation for a full characterization of the SCI but more positively notes “established techniques are available for direct quantitative characterization of selected features, namely mill scale and rust layers on the steel surface, and the interfacial voids and microstructure of the cementitious matrix at the SCI.”
While SCI characterization is as yet imperfect some of the key aspects for which tests are available might at least be require additional tests when establishing Ccrit. These might include pH, Interface Voids, Potentials, Temperature, Relative Humidity.
6.5. The Influence of Cracks
The treatment of critical chloride in this report is focused on uncracked concrete. Corrosion of reinforcement at cracks is a subject in its own right. Typically design considers that corrosion at cracks in chloride exposures does not occur where the crack width is less than 0.3mm [21]. Activation may occur initially giving rapid corrosion rates but if the crack self-heals the corrosion stops as the bar passivates. However, this has not been related to chloride levels and the reason the bar stops corroding has not been fully identified.
6.6. Under Water Corrosion
The corrosion of steel in immersed concrete is not well understood. It is often stated that oxygen starvation of the cathodic areas in underwater concrete means corrosion is not an issue. Papworth [22] notes that this might not be the cause of the lack of corrosion. It might be that in pores saturated with highly alkaline seawater the high pH leads to a high critical chloride level consistent with Pourbaix. Various authors [23,24,25] report mean critical chloride levels of around 2% by weight cement in immersed zones compared to 0.6% by weight cement given in fib [1] for atmospheric zones. Also, this is deduced from the work in [19].
The chloride profiles of immersed seawater exposed structures differ to those of above water structure significantly. Browne [26] showed a flatter chloride profile for immersed concrete than splash zone concrete (Figure 3a). Even though the surface chloride in the underwater zone was less than half that in the splash zone the chloride level at 150mm deep was higher after 34 years. The chloride levels found by Walsh [27] after 60 years (Figure 3b) were virtually flat having reached a maximum at 9-12kg/m3.
The chloride profiles and critical chloride level are significant as they show the care required when applying the MC Model.
Walsh [27] reports that he examined sections from submerged piles in the laboratory and there was extensive localised corrosion on the face of many bars that faced the exposed surface (Figure 7a). The corrosion products had not caused spalling but had migrated away from the bar (Figure 7b). The resulting perimeter-averaged values for the corroding regions typically ranged from 5 μm/y to 35 μm/y and were randomly distributed and considered to occur at local concrete deficiencies. In Walsh’s piles corrosion was limited to 6% and 12% of the bar lengths in two piles. Walsh notes that Beaton’s results were similar.
The importance of this is that it shows that where concrete is locally deficient, such as at honeycombing, corrosion can occur, but the corrosion rate will be low. However, at honeycombed concrete corrosion initiation would be expected to occur in the early life and hence the corrosion rate would apply over virtually the whole design life. The corrosion rate can be taken to be 5-35 μm/y. Over a 160-year design life this would translate to 0.8-5.6mm averaged around the bar (i.e. thicker loss expected but only on one side) and apply in limited areas of honey combing. The corrosion will not result in spalling but in migration of iron ions away from the reinforcement.
Walsh[ [27] states “Consequently, if corrosion at a spot in the submerged region started relatively early in the life of the structure, e.g., as a result of a local concrete deficiency, that spot may tend to remain a relatively stable feature over a long period of time. Such a situation would be consistent with the field observations noted … where relatively small localized corroding regions were found to be surrounded by large amounts of non-corroding steel, much of which exhibited an undisturbed surface appearance.”
Although slow the corrosion in immersed zones may lead to significant localised corrosion over a 100 year design life. Because the corrosion rate will be slow, and the corrosion products are not expansive, this is not likely to be a structural issue for many decades. The Bulletin proposes that the Model is not the appropriate tool for immersed concrete analysis but rather an allowance for localised corrosion should be applied.
7. Galvanized Reinforcement
Galvanized reinforcement has been used in concrete for well over 50 years. Guides produced in 1970 [28] and 1981 [29] provide extensive information on field experience and laboratory tests that validates the use of galvanized reinforcement. Unfortunately, other research using accelerated tests inappropriately cast doubt on the performance benefit of using galvanized reinforcement in marine exposures.
Use of galvanized reinforcement in marine exposures is less extensive than it should be as many specifiers, even durability engineers, often reject its use due to the bad impressions created by inappropriate accelerated tests in the 1970’s. In 1979, the FHWA recommended against using galvanized reinforcement after a series of accelerated laboratory experiments questioned its ability to prevent corrosion. However, the agency rescinded this recommendation in 1983 [28]. There are many examples of hot dip galvanized (HDG)’s successful use in a wide range of exposures some of which are summarised () by Yeomans [30]. While these prove improved corrosion resistance the Ccrit values in some cases are suspected to be to poor galvanising.
An example of galvanised steels excellent performance is in Bermuda. Bermuda pioneered galvanized reinforcement use in hot saline environments for a number of critical structures in the 1950’s. This proved extremely successful. The 1953 Longbird bridge is a prime example. In 1981 [29] an assessment showed no deterioration of the galvanizing even though the chloride level at the reinforcement was 1.2 WPC, i.e. three times Ccrit often quoted for conventional reinforcement. The reduced maintenance cost of structures using galvanized reinforcement compared to conventional reinforcement led the Bermuda government to use galvanized reinforcement in all structures in a $300 million infrastructure program in the 1990’s [31].

Table 3.
Summary of Reported Data on Ccrit for Galvanised Reinforcement.
| Reference | As Reported Data | Calculated Ccrit (WPC) | |||
| Ccrit-HDG | Ccrit Ratio1 | Min. | Max. | Avg. | |
| Yeomans, 2004 | 1250ppm | 2.5 | 0.79 | ||
| Darwin et.al. 2009 | 2.57 lbs/cy | 1.58 | 0.40 | ||
| Shimida and Niski 1983 | - | 1 | 0.68 | ||
| Treadaway and Davis 1989 | - | <1 | <0.68 | ||
| Swarmy 1990 | - | 4-5 | 2.7 | 3.4 | 3.06 |
| Clemena and Virmani 2004 | - | 1 | 0.68 | ||
| Allan 2004 | 1-2 wt % cem. | - | 1.0 | 2.0 | 1.50 |
| Pianca and Schell 2005 | - | Approx. 1 | 0.68 | ||
| Broomfield 2007 | 1-2 wt % cem. | 2-5 | 1.50 | ||
| Matthews 2014 | 1 wt % cem. | 1.67 | 1.00 | ||
| Average | 1.68 | 1.14 | |||
Notes 1 Ccrit ratio is the ratio of Ccrit for HDG and Ccrit for carbon steel.
Table 1.
Ccrit-HDG for Concrete by Various Researchers.
| Author | Exposure | Time (yrs) | Binder | w/b | Detection | Ccrit-HDG |
| Yeomans [33] | Wet/Dry | 0.36 | OPC | 0.8 | EM | >0.17 |
| Yeomans [34] | Salt fog | 0.36 | OPC | 0.8 | EM | >0.15 |
| Rasheeduzzafar [35] | Outdoor | 7 | - | 0.45 | CVO | <0.60 |
| Darwin [36] | Wet/dry | - | - | 0.45 | EM | 0.43 |
| Maldonado [37] | Outdoor | 9 | OPC | 0.4-0.7 | EM | 0.3-0.7 |
| Bellezze [38] | Wet/Dry | 0.5 | OPC (low alkali) | 0.55 | EM | 1.36-4.02 |
The Bulletin is expected to recommend a Beta Distribution of (1.2,0.3,0.6,3.0) for Ccrit of HDG steel where quality is maintained at a high level. The 1.2 mean is twice that of carbon steel.
Table 2.
Papers Used to Define Ccrit-HDG.
| Author | Method | Ccrit |
| Lollini 2015 | Literature review | HDG Mean =1.2 SD=0.3 % wt cem. |
| Yeomans 2004 | Concrete tests. | Characteristic Black=0.4; HDG=1.0 |
| Srimahajariyaphong 2011 | HDG up to 2.3% wt cement | |
| Bertolini 2013 | 1.5-2.0 x that of black steel, i.e. mean 0.9-1.2 WPC |
8. Stainless Steel
Moser [39] notes alloys, e.g. Cr, Ni, Mo, and N, provide corrosion resistance by the formation of a highly stable passive film. In stainless steels, Cr additions lead to a chromium oxide (Cr2O3) passive film. If the passive film is broken down and corrosion pits nucleate, the presence of alloyed Ni, Mo, and N aid in re-passivation of the pits. Different alloying compositions defined for different grades of stainless-steel leads to stainless steel’s different levels of resistance to chloride induced passivation, i.e. different Ccrit’s.
While use of stainless steel may seem expensive, if used only in critical areas it may not add significantly to construction cost. This should be carefully evaluated, through a proper LCC analysis, to define the most suitable solution that on a one hand guarantees the durability requirement and on the other hand allows to save money. For example, its use in dowel bars may cost very little, where the likelihood and consequence of corrosion at bridge deck joints is high, makes their use almost obligatory. Electrical connection between stainless steel and carbon steel was shown, in various studies quoted by Perez-Quiroz [40], not to lead to galvanic corrosion, if the steels remained passive, a reasonable underlying premise for durability design as the propagation phase is unlikely to be significant in aggressive chloride environments.
More global use of stainless steel may also be appropriate where realistic modelling shows carbon steel will not give the required reliability. Moser [38] notes Progreso Pier, located on Mexico’s Yucatan Peninsula, built in 1939 with poor quality concrete and a cover thickness of 25 mm, is over 70 years old and remains in excellent condition although with some pits, while a companion pier built in 1979 with normal ferritic mild steel reinforcement had to be demolished due to corrosion damage after two decades of service.
The Bulletin refers to many other papers showing the high corrosion resistance of stainless steel including Lollini [41] and SHRP [42] as shown in Figure 5.
Based on the various research papers discussed in the Bulletin, Ccrit for the various stainless-steel grades has been proposed as shown in Table 3. These are the basis of recommendations in the Bulletin.
9. Steel Fibres
The T0+T1 model can be used to assess the design life of steel fibre reinforced concrete. However, because it takes only very little corrosion to make the fibre performance insignificant only T0 should be used in design.
Corrosion of the fibres does not cause spalling, and the structural damage is limited to loss off toughness over the section where the fibres have corroded, the design allows for a sacrificial thickness at the surface that is considered as unreinforced. The MC Model can be used to determine the sacrificial thickness based on the Ccrit for steel fibres.
Mangat [43,44] investigated the corrosion of fibres in the more corrosive marine exposures. He found that after 300 marine spray cycles low carbon steel fibre corroded at the surface and none of the fibre corroded when embedded in concrete, even though chloride levels were as high as 4x the often-quoted steel corrosion threshold of 0.4 wt.% cement. Nemeeger [45] showed that the corrosion of low carbon steel fibre in samples exposed to wet dry cycling in chloride infiltrated samples did not occur except within the thin carbonated surface zone. Dauberschmidt [46] considerations concluded that depending on the quality of the concrete to fibre interface the critical chloride content may be in the range of 3% chloride by weight of cement.
It is concluded that Ccrit for steel fibres is considerably higher than MC Model’s for carbon steel. Principle reasons postulated are:
- Each fibre is electrically discontinuous in general whereas reinforcement is interconnected. Hence macro cells are likely to be less significant with steel fibres. However pitting corrosion of fibres would quickly make the fibre redundant.
- With conventional reinforcement a porous interface between the reinforcement and concrete can lead to a low chloride activation level. This interface layer is generally absent with steel fibres.
In conventional reinforced concrete spalling at anchorages zones is an issue due to the loss of bond. The analogy in fibre reinforced concrete is that corrosion that separates the hooked or enlarged ends that form the fiber’s anchorage could mean the whole fibre is redundant. This is an important consideration at load transfer across cracks and joints.
10. Conclusions & Recommendations
The Ccrit for low carbon steel has a wide distribution due to the range of factors that effect it. The MC Model beta distribution, with a mean value of 0.6 wt. % binder. and standard deviation of 0.15 wt % binder for total chloride, or any other of the statistical distributions given in fib Bulletin 112 [48], should be used in probabilistic modelling when nothing else is known about the concrete. Modelers may decide to reduce the standard deviation or use a characteristic value with a safety factor, based on other information, but it has been shown that this range may occur within one structure and hence perceptions of bar/paste interface ‘quality’ may not be a good reason to vary it. If there is information that the pH is low it may be sensible to lower Ccrit but the distribution already allows that the competing effects of low pH and higher chloride binding mean the distribution applies where fly ash and slag are used. As it is shown Ccrit may be affected by exposure it might be reasonable to increase the mean value for coastal structures and reduce it for marine structures.
The MC Model distribution for Ccrit gives a lower characteristic value of around 0.35 wt. % binder. This is what many refer to as the critical chloride content when no distribution is considered. It is important to understand this is not a mean value. When used in the fib chloride model as a discrete value it is often considered to give a conservative design life, but the actual probability of failure will not be known. It may be better to use the mean value of 0.6 wt. % binder and other mean values for variables and know that the predicted design life has a 50% probability of failure. This may be a suitable probability for some structures (e.g. under a wharf).
At this stage there is no agreed method to establish the realistic/practical-along-time critical chloride content for a structure. It would be useful if agreement could be reached on the criteria to be used to determine corrosion activation as this would reduce the variability when measuring Ccrit.
The Bulletin is likely to recommend the Ccrit values shown in Table 4.
| 1 | Kosa K., 1988 " Corrosion of fibre reinforced concrete". PhD thesis, University of Michigan, Ann Arbour. |
Acknowledgments
The author thanks fib TG 8.8.3 members (Perdix, U. Angst, E.Bernhard, S. Burtscher, M. Gastaldi, J.Gullikers, M.Kurtay, G.Markeset, R. Newby, R. Pollai, J.Sanchez, F. Moro, M.Raupach, and A. Rahimi) on ‘Critical Chloride Content’ for their input to the discussions aimed at resolving this difficult topic. The views of the author expressed in this paper may differ to those of other committee members.
Abbreviations
The following abbreviations are used in this manuscript:
| Ccrit | Critical chloride level. The level at which reinforcement is depassivared. |
| CLS | Corrosion Limit State |
| DtS | Deemed to Satisfy |
| HDG | Hot Dipped Galvanized |
| SCI | Steel: Concrete Interface |
| WPC | Weight Percent Cement |
| µA/cm2 | Micro Amps per square centimeter |
| µm/y | Micro meters per year |
References
- fib Bulletin 34 “Model Code for Service Life Design.” fib, Lausanne, Switzerland, 2006.
- 1620; 2. ISO 16204 “Durability — Service life design of concrete structures” International Organisation for Standards, Geneva, Switzerland, 2012.
- EN 1992-1-1 “Eurocode 2: Design of Concrete Structures. 2023” European Committee for Standardisation.
- fib Model Code for Concrete Structures (2020)”. International Federation for Structural Concrete (fib) Switzerland. 2024.
- K.Tuutti. “Corrosion of Steel in Concrete”. Doctoral Thesis. KTH Royal Institute of Technology, Sweeden, 1982.
- CSIRO “State of the Climate”. CSIRO & Bureau of Meteorology Joint Report, CSIRO, Australia 2010.
- Andrade C., Garces P., Martinez I. “Galvanic currents and corrosion rates of reinforcements measured in cells simulating different pitting areas caused by chloride attack in sodium hydroxide.” Elsevier ‘Corrosion Science 50’ (2008) 2959-2964. [CrossRef]
- F.Papworth. “Modelling for improved durability design - Background to critical chloride level establishment and proposal for further refinement.” Concrete Institute of Australia, Concrete 2023, Perth.
- Melchers R.E. “Modelling durability of reinforced concrete structures.”Corrosion Engineering Science and Technology2020. [CrossRef]
- J.Gulikers. Communication to WP 8.9.3 “Overview of selected literature on Ccrit for interpretation and verification of fib 34-values.” 26 April 2023.
- fib Bulletin 76 “Benchmarking of deemed to satisfy provisions in standards” fib, Lausanne, Switzerland, 2015.
- Duracrete Final Technical Report “Probabilistic performance-based durability design of concrete structures – statistical quantification of the variables in the limit state functions.” Jan 2000.
- C.Gehlen PhD Thesis “Probabilistische Lebensdauerbemessung von Stahlbetonbauwerken Zuverlässigkeitsbetrachtungen zur wirksamen Vermeidung von Bewehrungskorrosion.” 2000.
- Breit, W. Critical chloride content - investigations of steel in alkaline chloride solutions; Kritischer Chloridgehalt - Untersuchungen an Stahl in chloridhaltigen alkalischen Loesungen. Germany: N. p., 1998.
- R.E.Melchers and I.A.Chaves “Reinforcement Corrosion in Marine Concretes—1: Initiation”. ACI Materials Journal, 2019.
- U.M. Angst, O.B. Isgor, C.M. Hansson et al “Beyond the chloride threshold concept for predicting corrosion of steel in concrete. Appl. Phys. Rev. 9, 011321, 2022.
- U.M. Angst (chair) “The effect of the steel–concrete interface on chloride induced corrosion initiation in concrete: a critical review by RILEM TC 262-SCI.” RILEM 2019. [CrossRef]
- U.M. Angst (chair) “The effect of the steel–concrete interface on chloride induced corrosion initiation in concrete: a critical review by RILEM TC 262-SCI.” RILEM 2019. [CrossRef]
- U.Angst, B. Elsener, C.K. Larsen, & O.Vennesland “Critical chloride content in reinforced concrete – A review.” Cement and Concrete Research 39 (2009) 1122-1138.
- Wong, Hong S.; Angst, Ueli M.; Geiker, Mette R.; Isgor, O. Burkan; Elsener, Bernhard ; Michel, Alexander; Cruz Alonso, Maria; Correia, Maria Joao; Pacheco, Jose; Gulikers, Joost; Zhao, Yuxi; Criado, Maria; Raupach, Michael; Sørensen, Henrik; François, Raoul; Mundra, Shishir ; Rasol, Mezgeen; Polder, Rob. “ Methods of characterizing the steel-concrete interface to enhance understanding of reinforcement corrosion: A critical review by RILEM TC 262-SCI.” Materials and Structures, 2022. [CrossRef]
- Bamforth P. CIRIA C766 “Control of cracking caused by restrained deformation in concrete.” CIRIA, London, 2018.
- F.Papworth “Durability design for concrete immersed in seawater or brine.” Australasian Corrosion Association Conference Nov 2018, Adelaide.
- P. Sandberg “Systematic collection of field data for service life prediction of concrete structures” Durability of Concrete in Saline Environment, CEMENTA, Danderyd, Sweden 1996.
- Izquierdo, D.; Alonso, C.; Andrade, C.; Castellote, M. Potentiostatic determination of chloride threshold values for rebar depassivation. Exp. Stat. Study-Electrochim. Acta 2004, 49, 2731–2739. [CrossRef]
- Pedeferri, Pietro (1996) Cathodic protection and cathodic prevention. Construction and Building Materials, 10. 391-402. [CrossRef]
- R.D. Browne., R.Blundell., P.L.J.Domone., F.Papworth., M.P.Geoghegan and A.F.Baker “Marine durability survey of the Tongue Sands Tower”. Concrete in the Oceans Technical Report No 5. Cement and Concrete Association. Slough 1980.
- M.Walsh & A.Sagues “Steel Corrosion in Submerged Concrete Structures - Part 2: Modelling of Corrosion Evolution and Control” Corrosion Vol 72 No 5, 2016.
- 1970; 28. Galvanized Reinforcement for Concrete” International Lead and Zinc Research Organisation Inc, New York 1970.
- 1981; 29. Galvanized Reinforcement for Concrete – II” International Lead and Zinc Research Organisation Inc, New York 1981.
- Yeomans S.R. “Galvanized Steel Reinforcement in Concrete.” Elsevier, Amsterdam, 2004.
- Allan N.D. “The Bermuda ExOutdoorperience: Leading the way on Galvanized Reinforcement” Yeomans S.R. ‘Galvanized Steel Reinforcement in Concrete’ Elsevier 2004.
- F.Lollini, M.Carsana, M.Gastaldi, E. Redaelli, L.Bertolini. “The challenge of the performance-based approach for the design of reinforced concrete structures in chloride bearing environment.” Construction and Building Materials 79 2016.
- Yeomans SR. Performance of black, galvanized, and epoxy-coated reinforcing steels in chloride-contaminated concrete. Corrosion 1994;50:72–81.
- Yeomans SR. Performance of black, galvanized, and epoxy-coated reinforcing steels in chloride-contaminated concrete. Corrosion 1994;50:72–81.
- Rasheeduzzafar A, Dakhil FH, Bader MA, Khan MM. Performance of corrosion.
- Darwin D, Browning JA, O’Reilly M, Xing L, Ji J. Critical chloride corrosion threshold of galvanized reinforcing bars. ACI Mater J 2009;106:176–83.
- L. Maldonado Chloride threshold for corrosion of galvanized reinforcement in concrete exposed in the Mexican Caribbean. Mater Corros 2009;60:536–9.
- Bellezze T, Malavolta M, Quaranta A, Ruffini N, Roventi G. Corrosion behaviour in concrete of three differently galvanized steel bars. Cement Concrete Comp 2006;28:246–55. [CrossRef]
- Moser R., Singh P., Khan L. Kurtis K. “Durability of Precast Prestressed Concrete Piles in Marine Environment, Part 1 & 2” Georgia Institute of Technology 2011 and 2012 respectively.
- Perez-Quiroz J.T., Teran J., Herrera M.J., Martinez M., Genesca J. “Assessment of stainless steel reinforcement for concrete structures rehabilitation.” Journal of Construction Steel Research. 2008. [CrossRef]
- Lollini F., Carsana M., Gastaldi M., Redaelli E. " Corrosion behavious of stainless steel in reinforced concrete.” Corrosion review 2018.
- SHRP2 Solutions Appendix C “Chloride threshold for Various Reinforcement Steel Types.”.
- Mangat P.S., Gurausamy K.1985 "Steel fibre reinforced concrete for marine applications". Proc. 4th International conference on behaviour of offshore structures, Delft, Netherlands.
- Mangat P.S., Gurusamy K. 1987 :Permissible crack widths in steel fibre reinforced marine concrete" Cement and concrete research pp 734-742 Vol 17 No 5.
- Nemegeer D., Vanbrabant J., Stang H., “Durability of steel fibre reinforced concrete” European Community Brite Euram III project Report.
- Dauberschmidt, C.T., 2005 "Investigations on the corrosion mechanisms of steel fibres in concrete containing chlorides" RWTH Aachen, Germany.
- Kosa K., 1988 " Corrosion of fibre reinforced concrete". PhD thesis, University of Michigan, Ann Arbour.
- 2020; 48. fib Bulletin 112,”fib Model Code 2020 complementary guidance on concrete durability” fib, Lausanne, Switzerland, 2006.
Figure 1.
Variations of T0+T1 Corrosion Model Incorporating Chloride Level at Reinforcement and Various Possible Depassivation Measurements.
Figure 1.
Variations of T0+T1 Corrosion Model Incorporating Chloride Level at Reinforcement and Various Possible Depassivation Measurements.
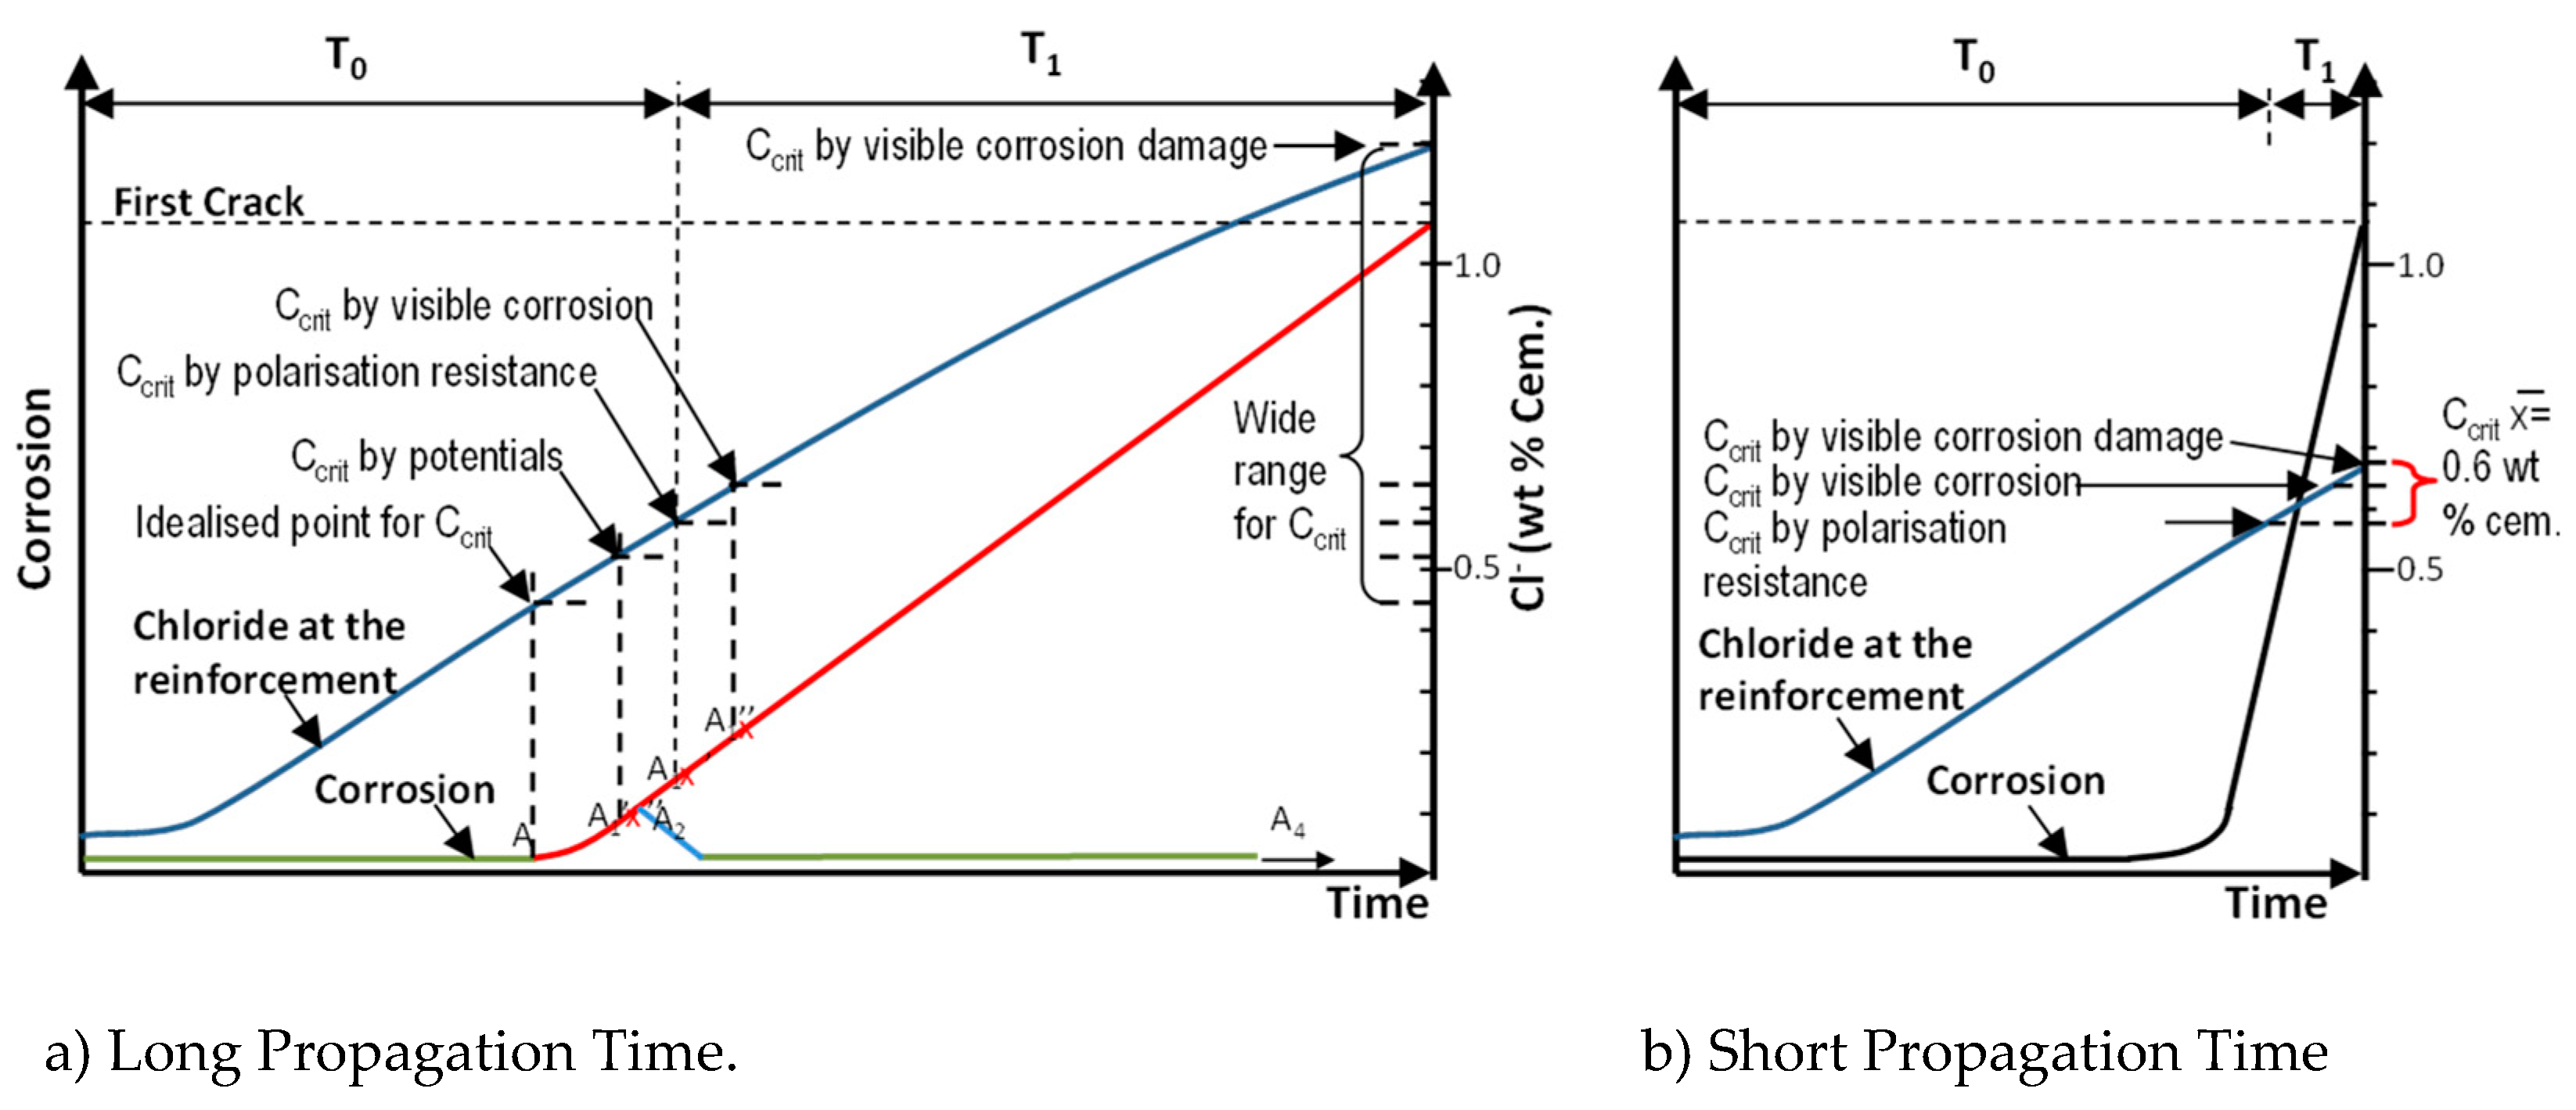
Figure 1.
Different Chloride Distributions by Different Researchers.
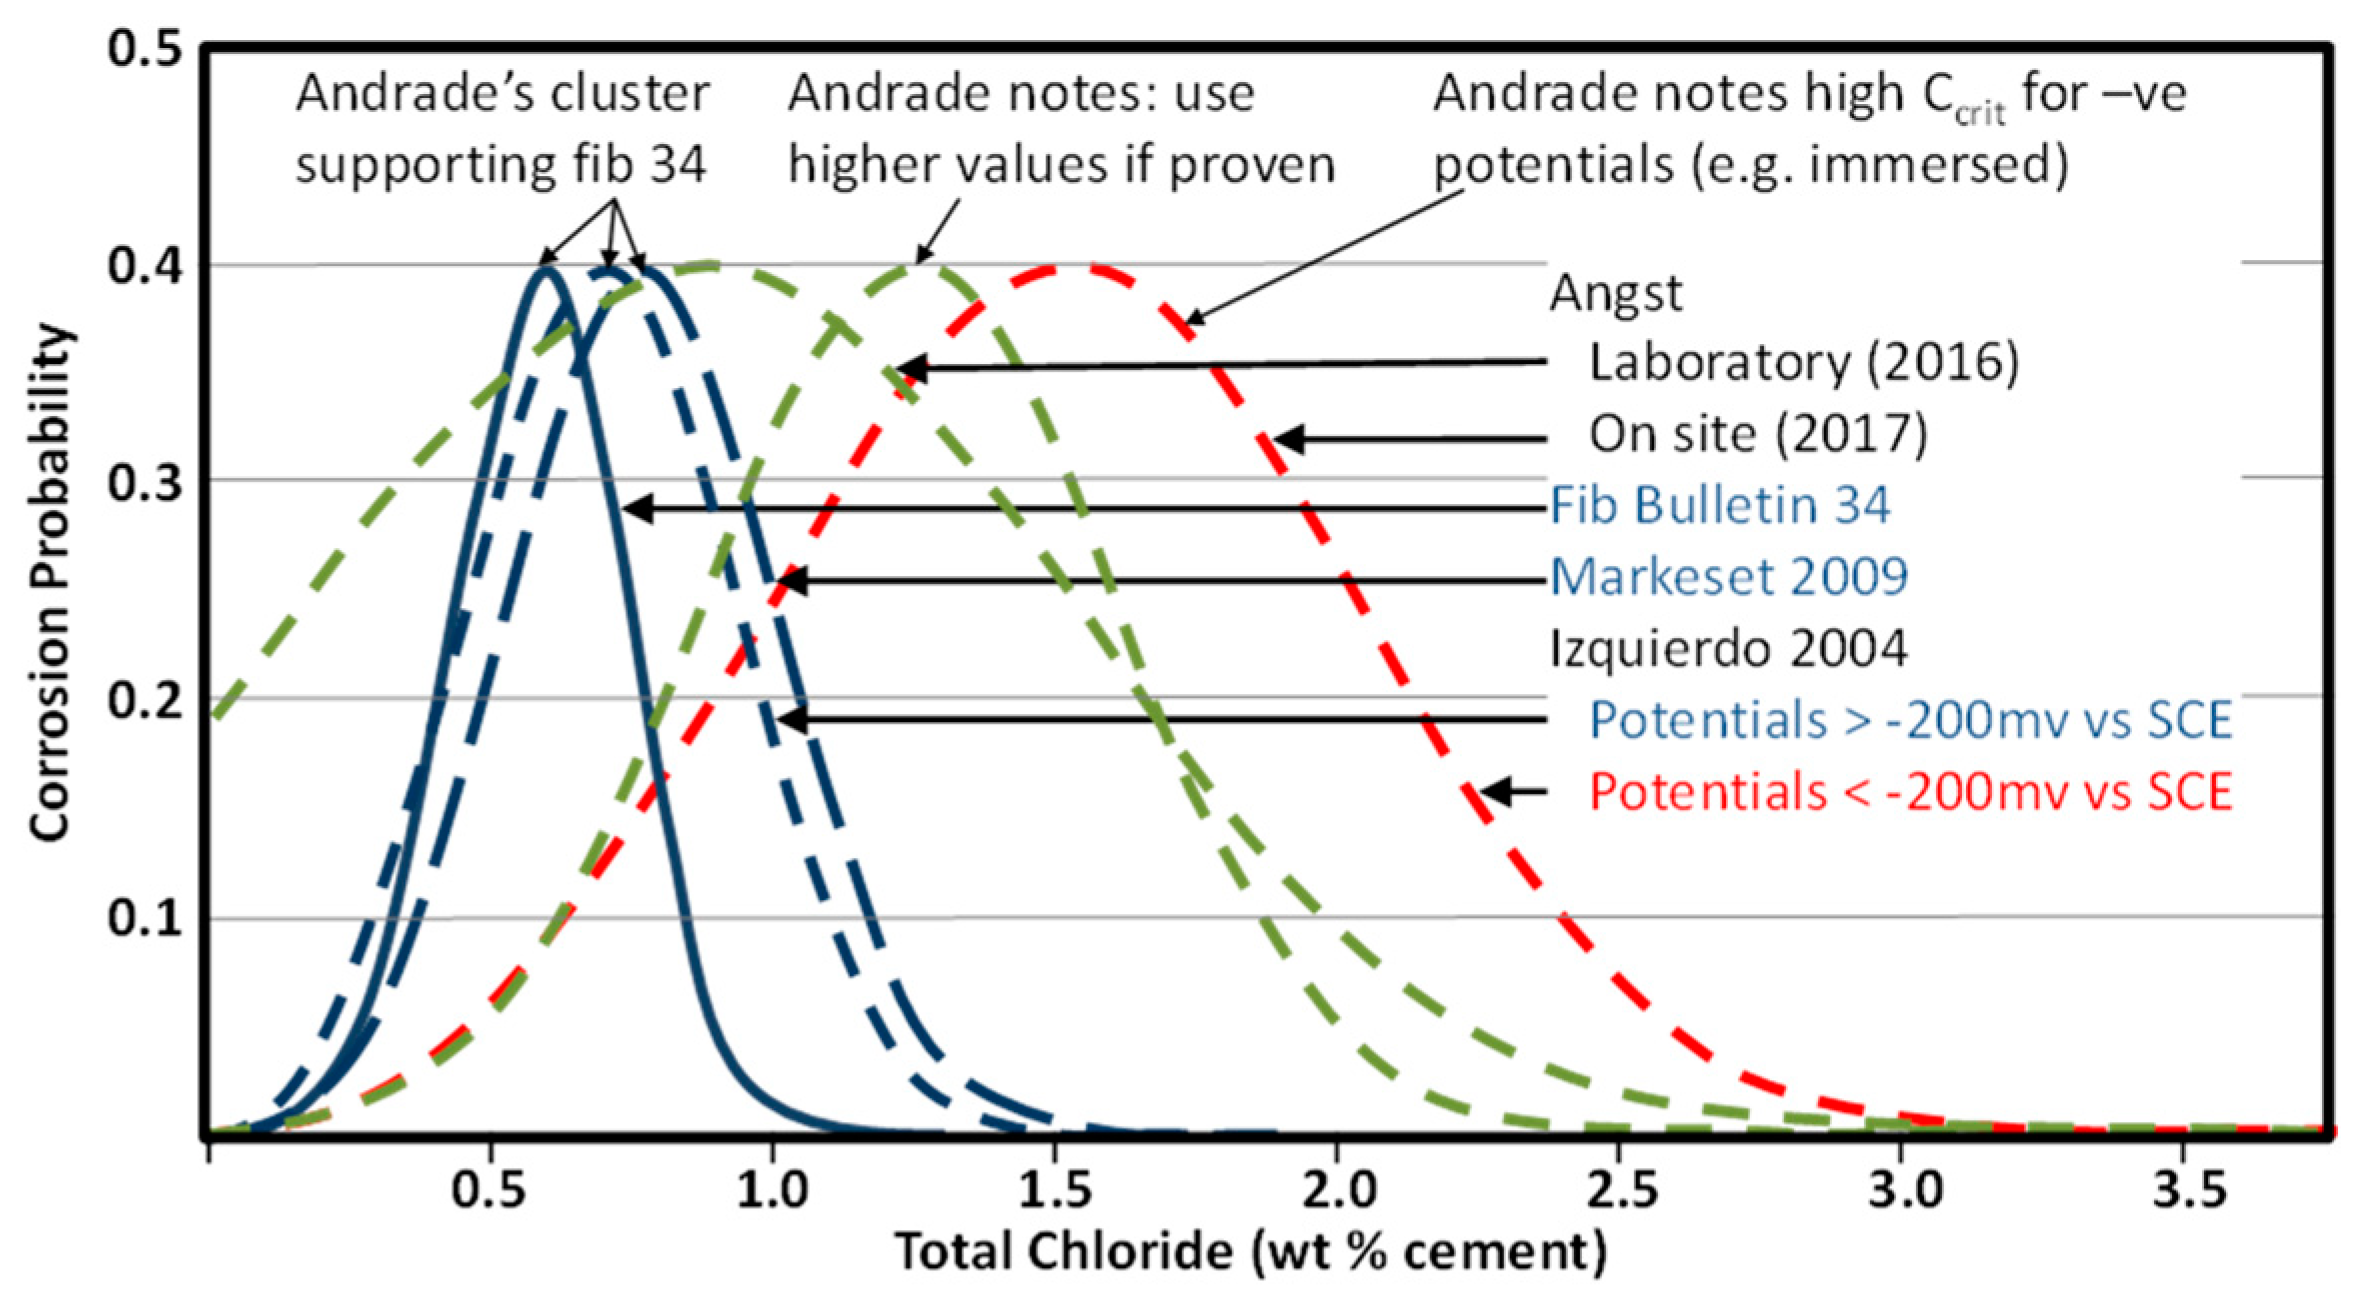
Figure 2.
Different Chloride Distributions Clusters not identifying Causes for Difference [19].
Figure 2.
Different Chloride Distributions Clusters not identifying Causes for Difference [19].
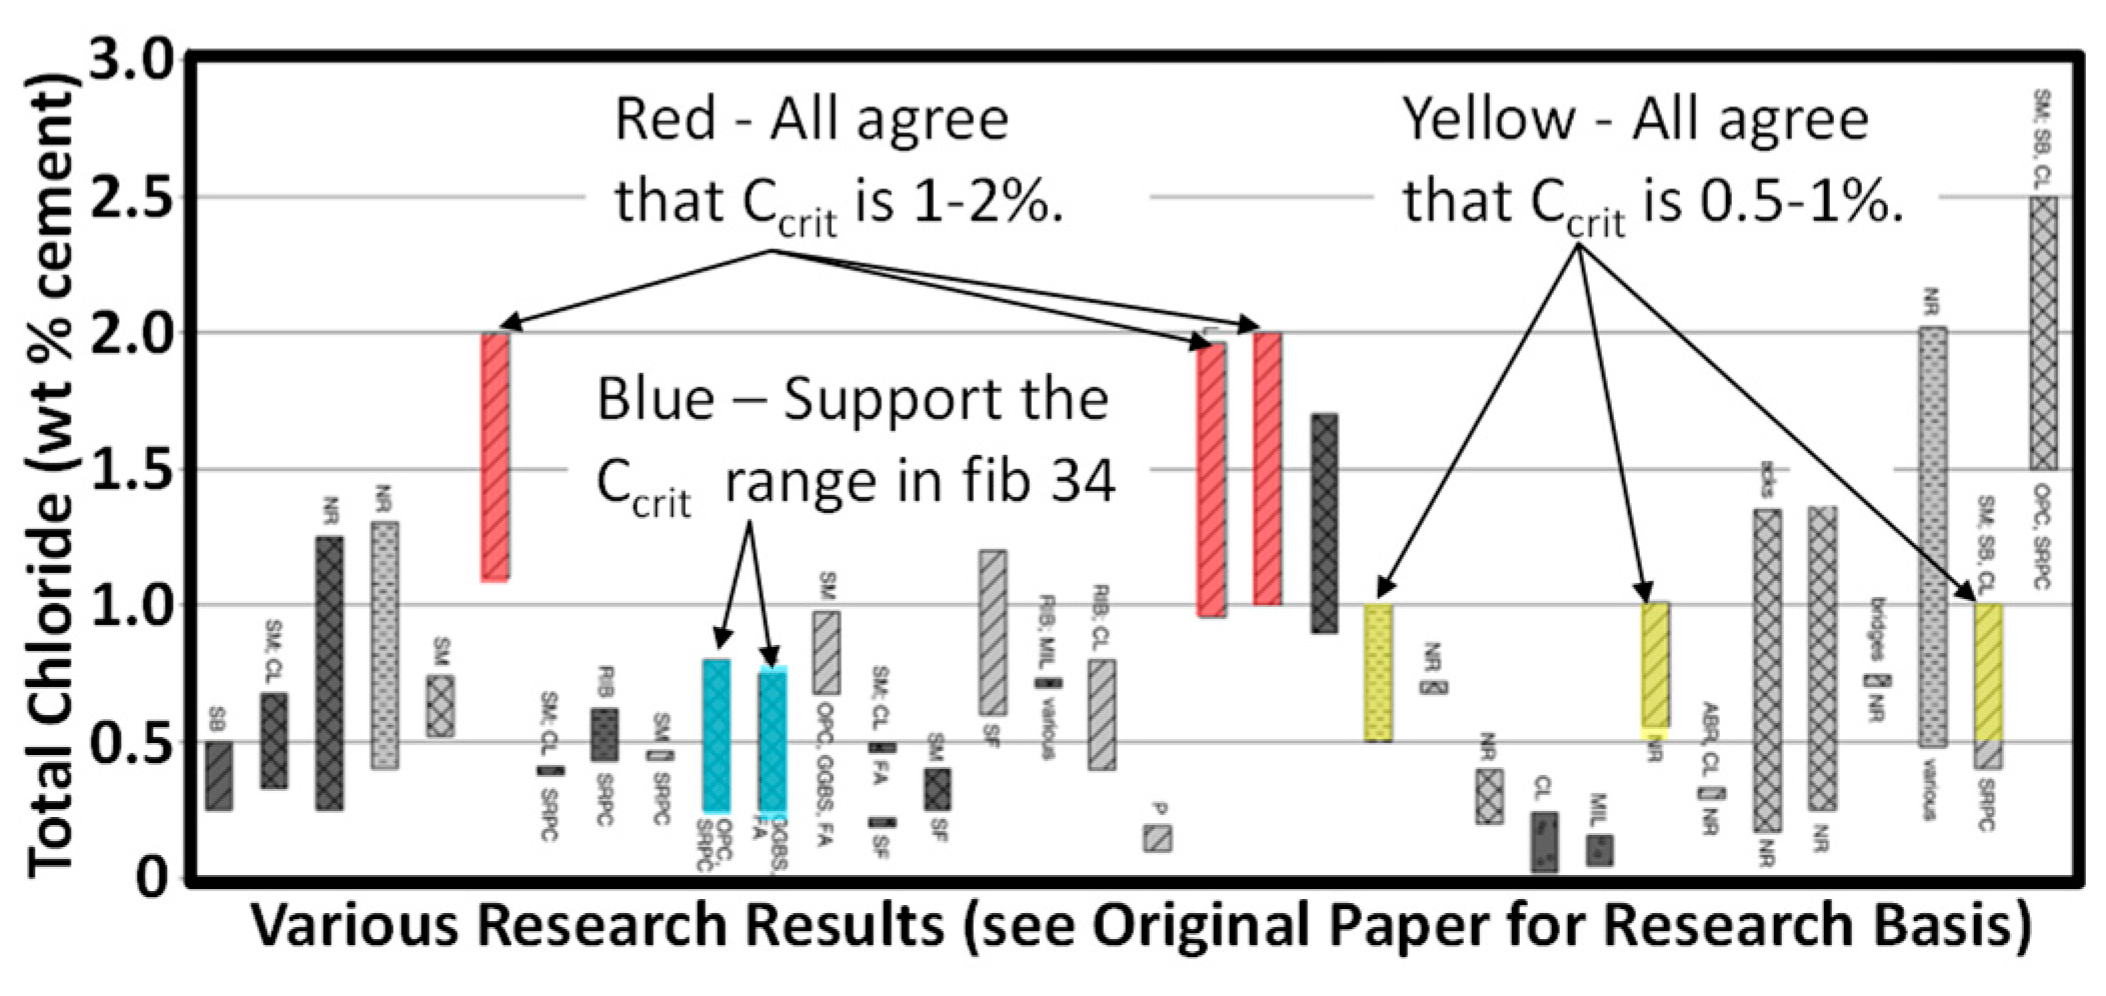
Figure 4.
Comparison of data giving fib's Ccrit with same data as 4 different quality concretes.
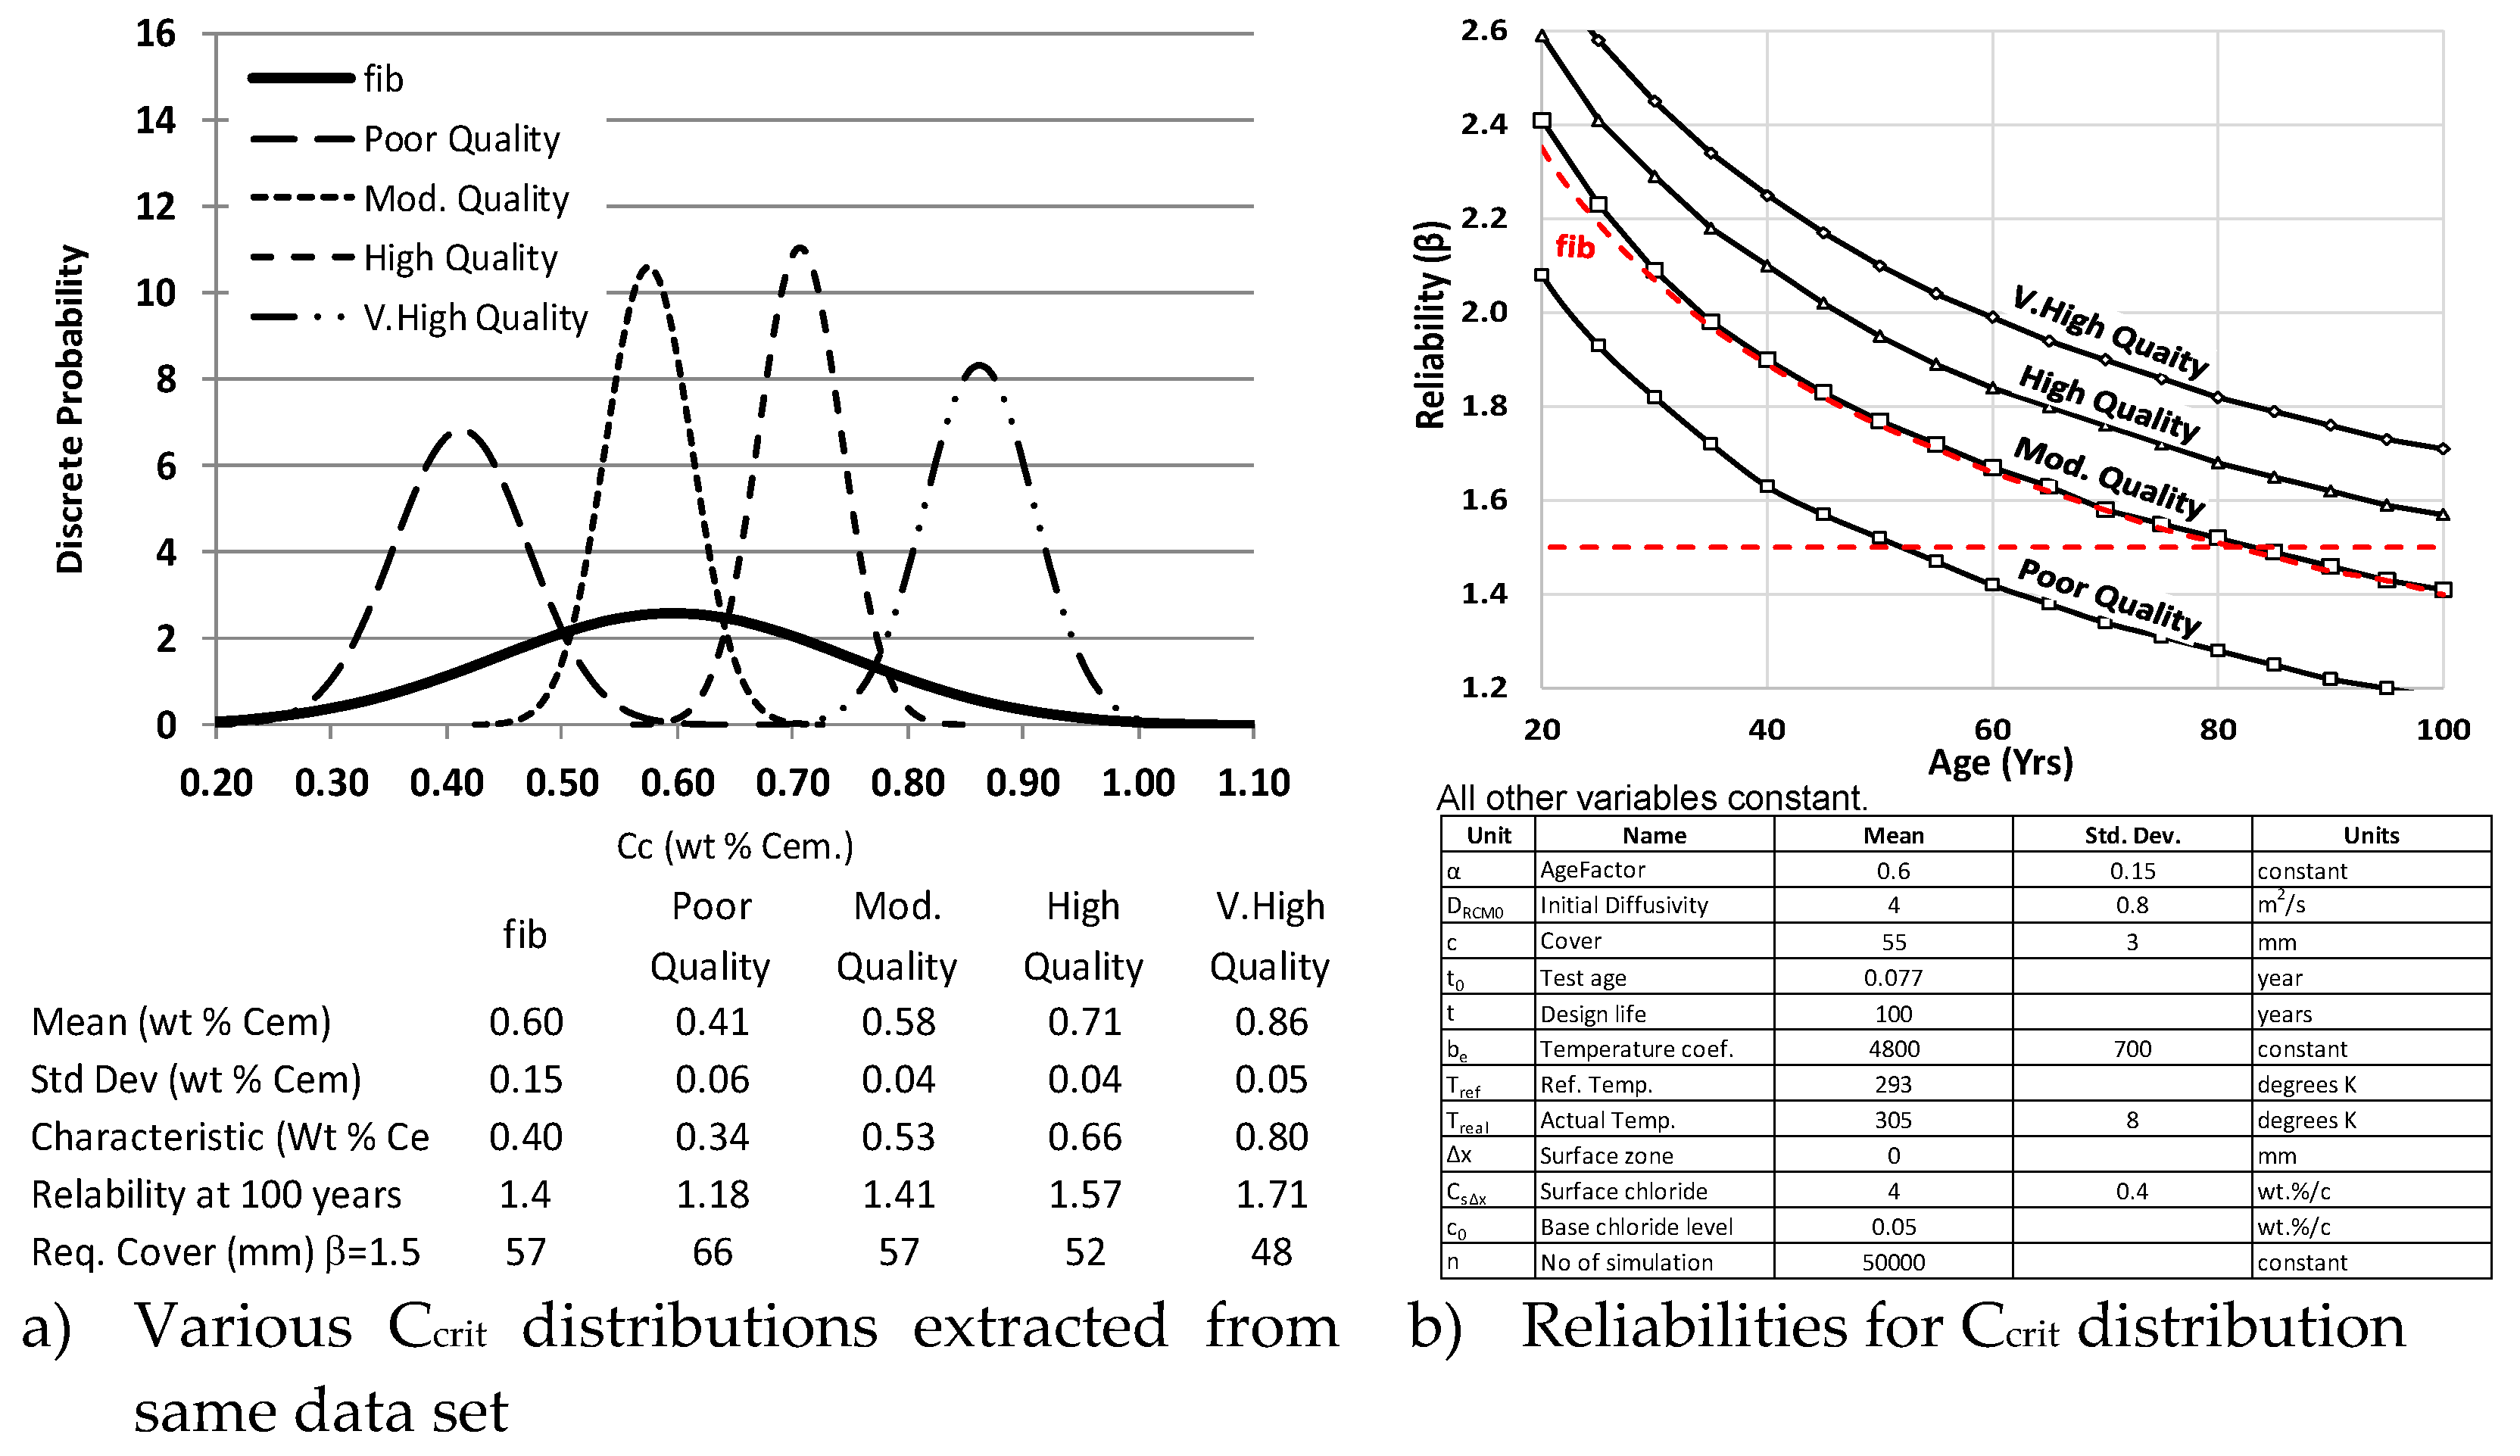
Figure 3.
Chloride Profiles for Immersed Concrete.
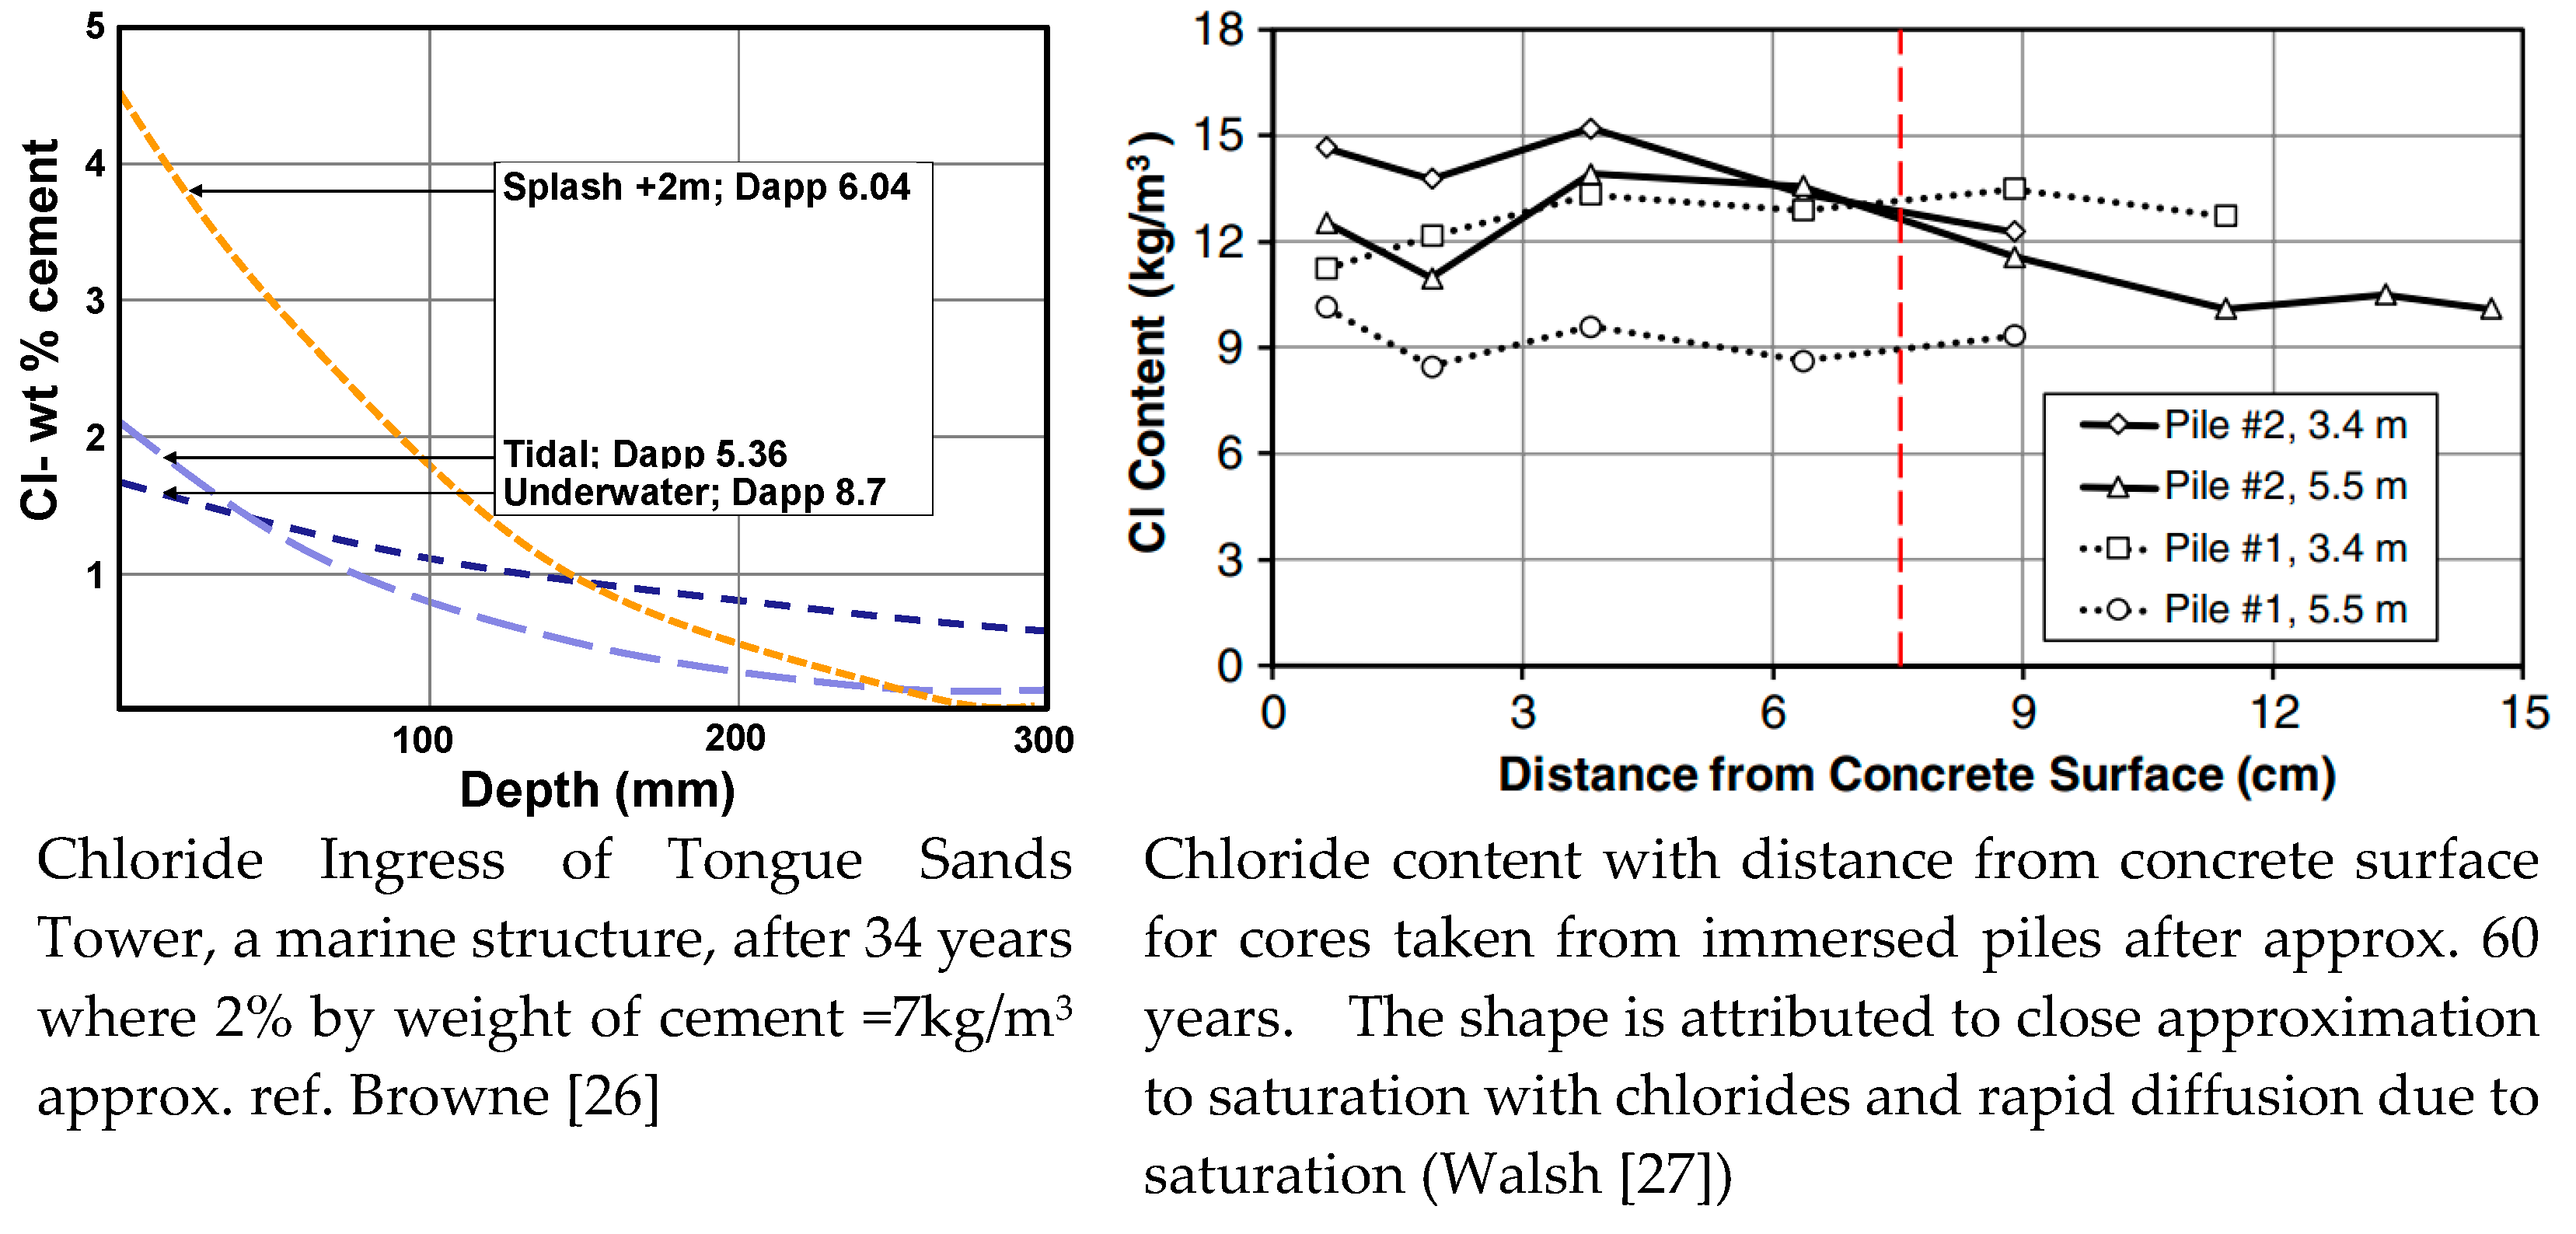
Figure 4.
Localised Corrosion and Corrosion Product Distribution in Underwater Structures.
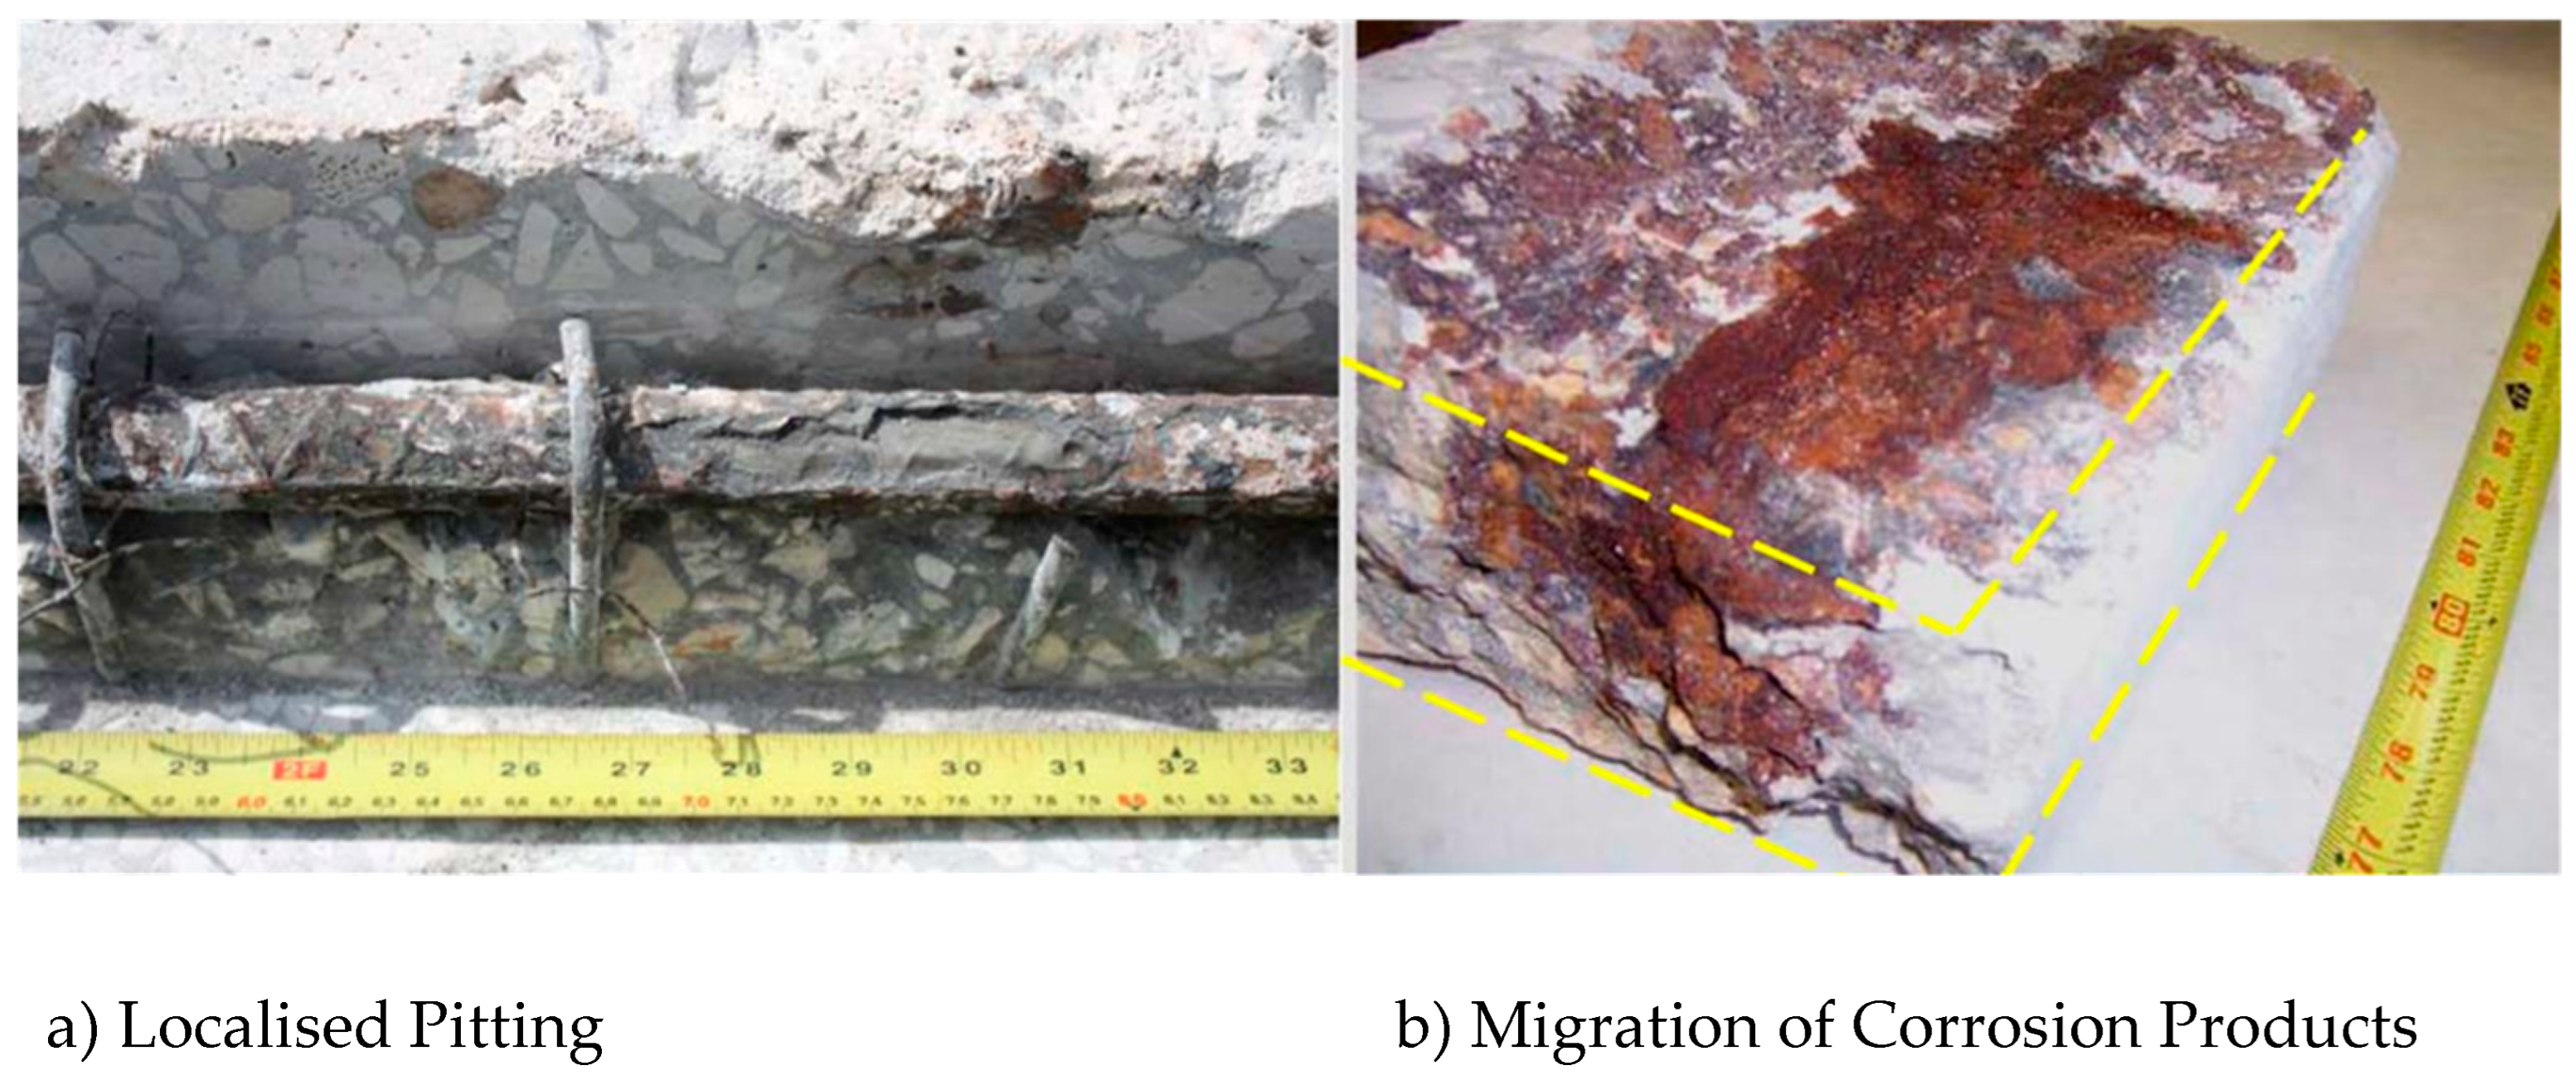
Figure 5.
Corrosion of Stainless Steel.
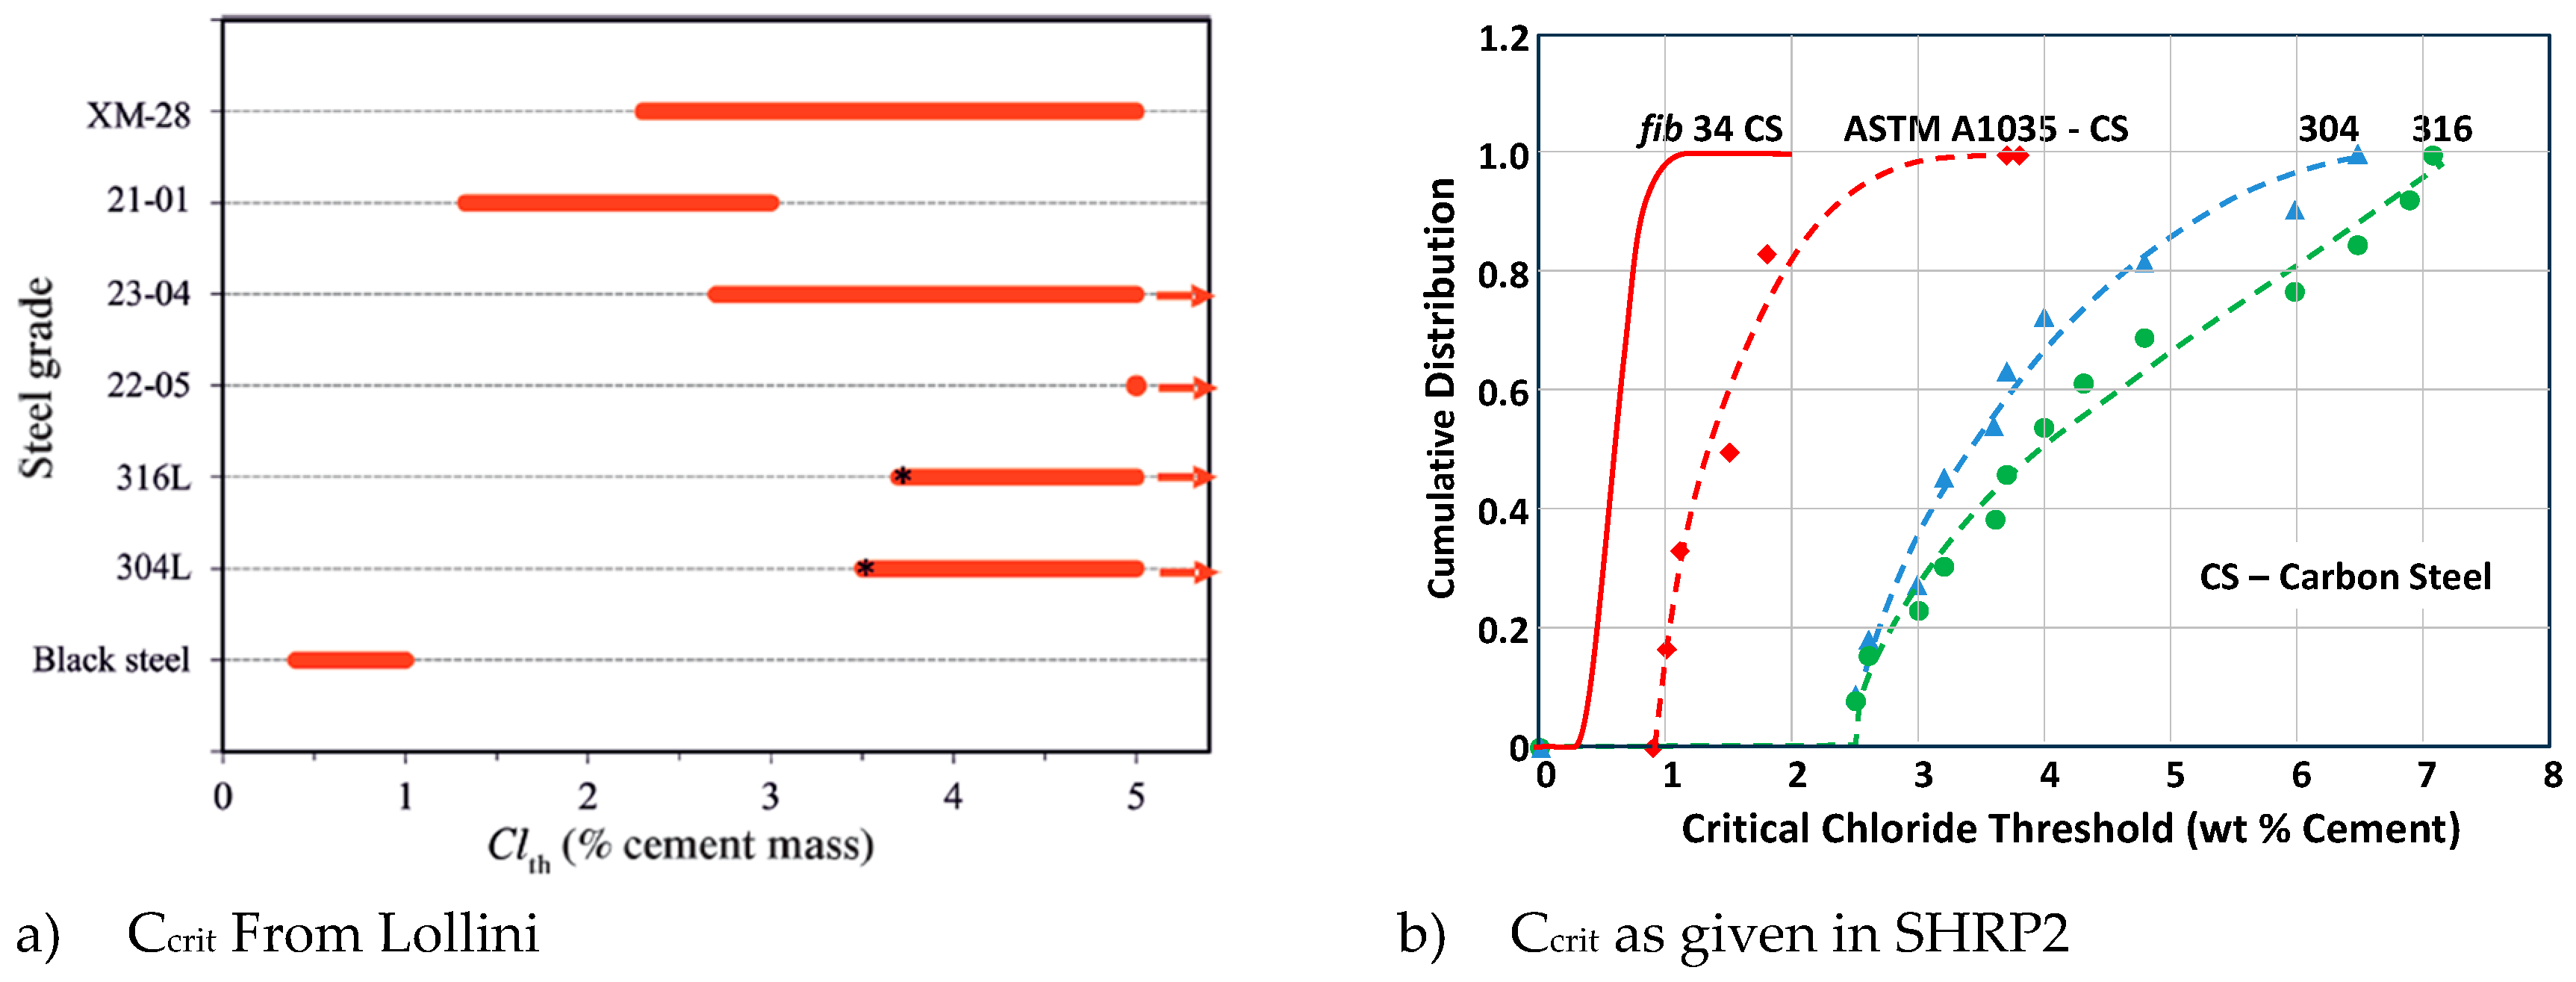
Table 1.
Ccrit From Duracrete R9 Based on Time to Concrete Damage.
| w/c | 0.3 | 0.4 | 0.5 |
| Submerged | μ=2.3; σ=0.2 | μ=2.3; σ=0.2 | μ=2.3; σ=0.2 |
| Splash/Tidal | μ=2.3; σ=0.2 | μ=2.3; σ=0.2 | μ=2.3; σ=0.2 |
Table 2.
Circular for TG8.9.3 Members on Ccrit and its Limitations.
| Moderate quality construction | High quality construction | |||||
| Exposure | Saturated | Splash | Atmos. | Saturated | Splash | Atmos. |
| Ccrit1 | Beta (1.9; 0.2; 1.0; 3.5) | Beta (0.7; 0.1; 0.2; 1.5) | Beta (1.5; 0.2; 1.0; 3.0) | Beta (2.2; 0.15; 0.2; 3.5) | Beta (0.8; 0.1; 0.4; 2.5) | Beta (1.8; 0.2; 1.0; 3.5) |
| Dc NT Build 443 (max) | < 4 x10-12m2/s | <2 x10-12m2/s | ||||
| Number of samples | ||||||
| Rep. trial block | 2 | 2 | ||||
| 1st Pour & ea 1000m3 | 1 | 1 | ||||
| w/c ratio (max) | 0.45 | 0.38 | ||||
| Voids | No abnormal voidage. | No abnormal voidage. | ||||
| Porosity | VPV cores <14% | VPV cores <13% | ||||
| Potential vs CuSO4 | <-300mv | N/A | <-300mv | N/A | ||
| Cover (min) | 40 | 50 | ||||
| Target Reliability | ≤1.5 for 1st crack | |||||
| RH | N/A | N/A | <65% | N/A | N/A | <65% |
| Cement | OPC>5% C3A including with SCM | |||||
| Steel composition | e.g. Sulphur; Nickle | |||||
| Steel surface condition | Mill scale only, no active corrosion | |||||
Table 3.
Grades of Stainless Steel.
| Stainless steel type | Grades | Crystal Structure | Corrosion Resistance | PREn Typical | Ccrit1 | |
| 50% | 10% | |||||
| Austenitic | 3042 | Face cantered Cubic gives high ductility | High due to 18%+ Cr and 8%+ Ni | 19 | 2.69 | 2.30 |
| 3162 | 27 | 3.12 | 2.79 | |||
| Ferritic | 430 | Body cantered cubic are more brittle like low carbon steel | Lower corrosion resistance as Cr is 12-16% with little Ni or Mo | 16 | - | - |
| Martensitic | 410 | As ferritic but high C leads to high strength and low Cr leads to lower corrosion resistance | 11 | - | - | |
| 420 | 12 | - | - | |||
| 440 | 18 | - | - | |||
| Duplex | 22052 | Dual Austenite and Ferite giving ductility and corrosion resistance | 37.0 | 4.78 | 3.93 | |
| Lean Duplex | 2001 | Lean grades similar to 2205 but lower cost as Ni and Mo reduced | 25 | 2.60 | 2.19 | |
| 2101 | 29 | |||||
| 2304 | 27 | 3.45 | 3.09 | |||
Notes: 1 Proposed by Andrade for Eurocodes for 10% and 50% probability of depassivation. 2 Types common for reinforced concrete.
Table 4.
TG 8.9.3 Recommended Lowest Ccrit Distributions.
|
Mean (μ) | Std Dev (σ) | a | b | Characteristic |
|
0.60 | 0.15 | 0.2 | 2 | 0.35 |
|
2.00 | 0.15 | 0 | 3 | 1.75 |
|
0.40 | 0.15 | 0 | 0.5 | 0.20 |
|
0.95 | 0.15 | 0 | 2 | 0.70 |
| |||||
|
4.00 | 2.00 | 0 | 5 | 0.70 |
|
7.00 | 2.00 | 0 | 9 | 3.70 |
|
2.00 | 0.15 | 0 | 3 | 1.75 |
|
0.95 | 0.15 | 0 | 2 | 0.70 |
Disclaimer/Publisher’s Note: The statements, opinions and data contained in all publications are solely those of the individual author(s) and contributor(s) and not of MDPI and/or the editor(s). MDPI and/or the editor(s) disclaim responsibility for any injury to people or property resulting from any ideas, methods, instructions or products referred to in the content. |
© 2025 by the authors. Licensee MDPI, Basel, Switzerland. This article is an open access article distributed under the terms and conditions of the Creative Commons Attribution (CC BY) license (http://creativecommons.org/licenses/by/4.0/).
Copyright: This open access article is published under a Creative Commons CC BY 4.0 license, which permit the free download, distribution, and reuse, provided that the author and preprint are cited in any reuse.


