

Submitted:
27 April 2025
Posted:
29 April 2025
You are already at the latest version
Abstract
Magnetic Pulse Welding (MPW) is a promising solid-state joining process that utilizes electromagnetic forces to create high-speed, impact-like collisions between two metal components. This welding technique is widely known for its ability to join dissimilar metals, including aluminium, steel, and copper, without the need for additional filler materials or fluxes. MPW offers several advantages, such as minimal heat input, no distortion or warping, and excellent joint strength and integrity. The process is highly efficient, with welding times typically ranging from microseconds to milliseconds, making it suitable for high-volume production applications, in sectors including automotive, aerospace, electronics, and various other industries where strong and reliable joints are required. It provides a cost-effective solution for joining lightweight materials, reducing weight and improving fuel efficiency in transportation systems. This contribution concerns an application for the automotive sector (Body In White) and in particular the welding of aluminium alloy and cold-rolled micro alloyed steels. One of the main aspect for MWP optimization is the determination of the process window that does not depend on the equipment used but rather on the parameters associated with the physical mechanisms of the process. It is demonstrated that process windows based on contact angle versus output voltage diagrams can be of interest for production use for a given component. The process windows based on the impact pressures versus the impact velocity for different impact angles, in addition to not depending on the equipment, allows to highlight other factors such as the pressure welding threshold for different temperatures in the impact zone, critical transition speeds for a straight or wavy interface, or for the jetting / no jetting effect. To determine these three impact parameters, relationships based on Buckingham's π theorem are a viable solution closed to reality. In addition, shear tests to determine the cohesion of the welded part were carried out. This allowed to add the mechanical resistance isovalues to the process window.
Keywords:
magnetic pulse welding
; weldability window
; steel
; aluminum
1. Introduction
The development of elements composed of dissimilar materials is booming. The automotive sector is one of the industries that shows the greatest interest, being able to benefit from the development of dissimilar joints, especially with regard to using lighter elements such as high-strength aluminum instead of heavier ones. Different companies have shown interest in replacing steel parts with another lighter component in the bodies and chassis, Body-in-white (BIW). Companies such as Honda and Fiat [1,2], bet on the replacement of BIW steel parts by aluminum alloys with adequate mechanical characteristics. By using these alloys, the overall weight of the vehicle is reduced, as well as fuel consumption and, therefore, harmful gases such as CO2 into the atmosphere. In addition to improve the environmental conditions, it allows compliance with the current and increasingly restrictive environmental legislation [3], both national and international.
The joining of dissimilar materials, including steel and aluminum, by welding has been studied in the last decade [1,4]. The challenges are linked to the differences in (i) melting temperature of aluminum (660°C) and iron (1538°C); (ii) densities (2.69 and 7.8 g/cm3 respectively for aluminum and iron) leading to macroscale segregation and poor mechanical properties of the joint [5,6]; (iii) thermal conductivity and rate of thermal expansion of aluminum and steel. Therefore, it is necessary to optimise accurately the process parameters to obtain an adequate union of both materials.
Techniques such as laser welding, ultrasonic welding and electromagnetic pulse welding offer the opportunity to control the joining process [1,7] and, therefore, to join these two materials, overcoming the difficulties that may arise. Likewise, the energy efficiency of these processes and the ability to automate make them a plausible solution for the automotive sector.
In the case of laser welding, a high-intensity beam is focused on a specific point, heating it up and producing a fusion of the materials. Lasers have a high power density and travel speed and low heat input, thus enabling welds to be made that would not be possible with other fusion methods.
Ultrasonic welding (USW) is a solid-state welding process that uses high-frequency mechanical vibrations to generate friction and heat between the faying surfaces of two materials, causing them to plastically deform and form a metallurgical bond. This process is particularly well-suited for joining dissimilar materials, such as aluminum and steel, due to its ability to produce sound welds without the need for filler materials or fusion. However, the process is limited to a maximum thickness of materials around 3 mm, and is best suited for joints with simple geometries, such as lap joints or spot welds [8].
Electromagnetic welding is a solid state process generated at high impact speed [9]. The pressure generated by the electromagnetic field is the reason for the formation of a solid state cold weld. The MPW process is free of emissions such as fumes, spatter and heat that are typically produced during conventional welding techniques. Due to these differences, this type of weld present advantages over conventional welding processes [10]:
- -
- It is possible to achieve welded joints of dissimilar materials, unlike fusion welding where the ability of these to be welded must be taken into account. In this way, materials such as titanium, aluminum and magnesium can be welded, even if their capacity to be welded is very low despite the fact that they are of great interest due to their mechanical properties.
- -
- There are no heat-affected zones (HAZ), so the materials maintain the original mechanical properties and this means that the resulting parts do not have fragile areas. However, galvanic coupling exists and the intermetallic compounds (IMCs) can act as a buffer between steel and aluminum. It is therefore important to be able to control the nature and thickness of these IMCs to maintain the mechanical properties while avoiding corrosion.
This welding process is also a green process or at least not harmful to the environment due to the fact that it does not emit any gas resulting from combustion in the process, which are common in fusion welding. However, it also has its limitations, such as:
- -
- Limit in the thickness of the plates or sheets that can be welded (≤ 6 mm).
- -
- The moving plate, which is driven against the other plate at high speed, must be electrically conductive and depending on this capacity, it will be necessary to apply more or less discharge energy to reach the weld. The electrical resistivity of the material in contact with the electromagnetic coil is one of the key parameters of the process. In general, the most prominent alloys in the automotive, aeronautical and biomedical sectors are materials with a high electrical resistivity, that is, not favorable for this process. The use of low electrical resistivity as aluminum or copper alloy pusher is then a solution.
The objective of this contribution is to define the process window of MPW independently of the geometry of the coil and of relative position of the components to weld. Usually, the process window of the MPW is reported in a discharge energy / impact angle diagram but which is specific to the equipment used for welding, the geometry of the inductor and the positioning of the parts to be welded in relation to the inductor. For that, it is necessary to rely on a physical approach to the process and highlight the quantities that will directly influence the quality of the weld. Different studies concerning MPW, explosion welding... have shown that for a weld to exist between two solid bodies it was necessary to exceed a threshold pressure. The impact pressure, associated with the impact velocity and the impact angle are therefore the parameters that will control the process.
1.1. Magnetic Pulse Welding Process
Solid state welding depends on the pressure generated between the elements to be welded. This pressure can be applied in different ways (mechanical, electromagnetic, explosive wave…). This study focuses on the application of pressure through an impact at high speed, caused in the particular case of MPW, by an electromagnetic pulse (Figure 1 and Figure 2) and applied to both flat and cylindrical parts [11,12].
To carry out electromagnetic impact welding, an electrical installation is required, made up of a bank of capacitors, an electromagnetic coil and an optional tooling to shape the material that has been accelerated against it [9,13] (Figure 2). It should be mentioned that the coils can have an infinite number of different shapes. They can be both flat and cylindrical, which allows significant flexibility when configuring the type of welding that is desired. The capacitor bank contains a transformer that adapts the low voltage electricity supply to a high voltage one to charge the capacitor bank.
The capacitor bank is connected to an electromagnetic coil and discharges through it a large current of a few kilo-Amps. This discharge creates an oscillating electromagnetic field (Figure 2) that in turn induces currents in the nearby conductive material (moving plate in the case of this project). The currents in the piece or moving material are those that when reacting with the oscillating electromagnetic field generate the Lorentz forces, responsible of the deformation of the piece. In the same way that Lorentz forces are generated, the material is also instantly heated by the Joule effect, but the sheet as a whole does not at any time approach the melting temperature or undergo any metallurgical transformation [14]. These forces generate a deformation at high speed, which causes the deformed part to impact with a very high amount of energy against the part to be welded, generating the welding.
1.2. Welded Interface
High speed impact welds have a permanent joint only a few microns wide [14]. The experimental research works developed in MPW have been mainly oriented to understand how the micrometer scale junction is generated. On the one hand, several studies [14,15] have suggested that the temperature generated at the interface due to the impact at high speeds and consequent pressure, was well below the melting temperature of the elements to be welded. On the other hand, the formation of intermetallic compounds has been considered unlikely, assuming that the welding has been induced by the impact pressure and totally ruling out the effect of heating.
A study led by Aizawa et al. [16] has found evidence of fusion and solidification at the interface of the two welded surfaces, in contradiction to the previous postulates. A very high temperature increase has been identified in the interface but, due to its instantaneous nature, it is not enough to spread throughout the part and its effect is located in the intermediate layer between the two welded sheets. The welding is considered to be due to the combination of magnetic pressure and heating by the Joule effect. The solid state reaction at the junction interface could induce the formation of intermetallic phases, with the observation of localized fused points at the junction interface not being common, nor being a prerequisite for the formation of intermetallic.
In impact welding, the interface area of the joint shows a wavy morphology, characterized by a pattern similar to “Velcro” where the two joined plates are mechanically interlocked (Figure 3). This wavy interface occurs with all impact methods. However, the length and amplitude of the waves tend to vary depending on the process by which the weld was performed. Psyk et al. [17] have associated the wave morphology of the junction with the process parameters: discharge energy and impact velocity.
The work developed by Lee et al. [18] in MPW joints of steel and aluminum alloys pointed out the existence of an intermediate layer at the interface of the joint. Research by other groups has again found the existence of an inhomogeneous layer at the weld interface [17]. Other researchers such as Zhang et al. [19] raised the existence of concentrations of intermetallic phases in the case of a wavy interface (Figure 4).
When a low energy discharge is realized for the welding operation, a thin phase of intermetallic is generated. When the energy level of the discharge is increased, the thickness of the intermetallic phase increases, resulting in the generation of cracks, voids and pores. Psyk et al. [17] presents results in which the existence of micro fractures is confirmed if the selected discharge energy level is too high.
1.3. Outstanding Parameters of the Process
The most important parameters when defining this process are the discharge energy, the space or gap between coil-sheet, and sheet-sheet, the magnetic pressure, the discharge pulse frequency, the skin depth, the impact velocity and the collision angle. The geometric parameters are defined in Figure 5.
1.3.1. Gap Between Joining Surfaces
The gap or distance between the surfaces to be welded is very important. In this space, the launched and moving material (the one closest to the coil) will increase its acceleration after being electromagnetically driven towards the surface against which it will impact and be welded. This parameter affects the collision conditions, the level of impact pressure generated in the same and, consequently, the formation of the weld. The higher this parameter, the greater the acceleration and impact pressure reached. The limiting aspect of the increase in gap resides in the ability to guide the material uniformly during the path between discharge and impact, being able to deflect the moving material and generate the weld in unwanted areas.
1.3.2. Overlap
The overlap is the distance the flyer overlaps with the coil. It is the part where the Laplace forces are generated and which is projected towards the other material to be welded or target material.
1.3.3. Cantilever
The cantilever is the free length of the flyer that determines the angle of impact.
1.3.4. Discharge Voltage or Energy
Regarding the discharge energy, a command console allows its adjustment and is a prominent input parameter. The discharged energy can be expressed as follows:
where E is the discharge energy (J), C total capacity of the generator (F), and U the discharge voltage (V).
This energy, stored in the capacitors, is channeled into the coil and is responsible for generating an electromagnetic field that is translated into a magnetic pulse in the sheet. The energy required depends on the materials to be welded. To obtain an equivalent bond level, the required level of energy to discharge will be lower for moving materials with low electrical resistivity. The use of an energy level below the threshold marked for each application and its corresponding specific conditions, will not generate enough momentum to achieve the joint between the materials. In the case in which the maximum threshold is exceeded, as mentioned above, the thickness of the intermetallic layer increases, generating defects such as cracks, pores and voids.
1.3.5. Discharge Pulse Frequency
Another very important parameter that defines how much the magnetic field created by the coil penetrates into the material to be accelerated, is the frequency of the discharge pulse. The pulse discharge frequency depends on the parameters of the electromagnetic circuit and varies between 10-200 KHz. However, it generally operates between 10 -20 KHz. The frequency is expressed as follows:
where f is the circuit frequency (kHz), Lt the total circuit inductance (H) and C the total generator capacitance (F).
High frequencies are generally recommended for high-strength materials. As a consequence, the pulse discharge frequency can be considered as a requirement for the configuration of the generator and in turn of the welding machine. In addition, increasing the frequency reduces the impulse time which increases the stresses on the material and consequently the dynamic response of the material leading to a collision of greater energy magnitude.
1.3.6. “Skin Depth”
The magnetic field creates eddy currents in the sheet closest to the coil. The depth to which the field penetrates is called "skin depth" (δ). The interaction of the eddy current with the magnetic field produces the Lorentz forces that accelerate the moving plate next to the coil against the fixed one, causing them to impact. Therefore, without this “skin depth” it would be impossible to carry out the welding. For an effective collision between both materials, the generated depth must be smaller than the thickness of the moving sheet. The lower the field penetration or "skin depth", the higher the energy efficiency of the collision generated. Equation 3 allows to quantify this depth:
where δ is the ”skin depth” (m), ρ the electrical resistivity of the material in contact with the coil (Ωm), f the pulse discharge frequency (Hz) and μ the flyer magnetic permeability (H/m).
1.3.7. Impact Velocity
This parameter depends on the discharge energy and the gap between surfaces. The force generated by the electromagnetic field accelerates the moving part towards the fixed part in the space between them. When dealing with very high energies, one also works with high speeds. These speeds are of great importance not only because of the momentum itself, but also because they create an air blast generated due to the fast launch of the material that cleans the surfaces to be welded and prepares the surface for joining. The oxides existing on the two surfaces to be welded are eliminated through the air blast and this cleaning of the surfaces creates a favorable condition to generate a permanent joint.
Shotri et al. [20] define a model linking the impact velocity with the geometrical parameters of the inductor (coil) and the process parameters from a dimensional analysis using the Buckingham π-theorem:
where ef and ρf are respectively the thickness (m) and the density of the flyer (kg/m3).
This dimensional analysis for the impact pressure and flyer impact velocity were developed, considering the effect of the related variables, and was employed due to the presence of several physical phenomena and their complex interactions, which cannot always be expressed by closed-form mechanistic relationships.
1.3.8. Impact Pressure
A unique aspect of high velocity deformation is that when two solid bodies collide with significant velocity, very high pressures are created [23]. The impact pressure developed when two semi-infinitely elastic bodies, called 1 and 2, collide at an impact velocity , is given by the equation:
where ρ is the density of the material and the longitudinal wave velocity [23] obtained by:
represents the Young's Modulus. Values of are of the order of 3.000 m/s for most structural materials. Even at moderate impact velocities, it is easy to develop pressures large enough to produce plastic deformation. But this relation means that the ratio Pi/Vi is always constant and does not depend on the collision angle or the welding parameters.
To consider that an magnetic pulse weld is successful, the maximum pressure must exceed a threshold [10], defined by the following expression:
where the Hugoniot Elastic Limit (HEL) is calculated as follows:
Being K the compressibility modulus, G the shear modulus, ν the Poisson’s coefficient and σyp the yield stress.
From the Buckingham π-theorem, Shotri et al. [20] define the following relation related the impact pressure with the geometrical parameters of the inductor and the process parameters:
where μf and τ are the magnetic permeability (H/m) and the damping constant (s-1) of the flyer; ec, wc, loc, lrc the thickness (m), width (m) and the active and non-active segments of the flat coil (m), and Lt the total inductance of the system (H). By using eq. 2 and eliminating Lt, the expression of Pi is:
where C is the capacity of the system (F).
1.3.9. Impact Angle
The impact angle is the angle that the materials form at the point of impact. The angle in Figure 5 is given as the value γ. At the point of contact, a shock wave is created in the two materials in the radial direction. This shock wave creates the previously mentioned jet of air that cleans the surface to be welded.
1.4. Process Window
To determine the welding parameters it is possible to build a weldability window that can be called a process window. If the machine, the tool, the assembly, the welding configuration and the materials to be welded are defined, this consists, for example, in finding, in the plane (discharge energy, gap) the points which make possible to carry out a consistent weld [24]. These weldability windows are generally obtained by means of numerous tests. While the practical value of these weldability windows is obvious, the fact remains that they are difficult to transfer from one configuration to another. In this context, it may be relevant to construct weldability zones that are functions only of the materials to be assembled and not of the welding configurations.
To construct these physical weldability windows, some authors use simplified analytical models from the explosion welding literature [1], while others attempt to determine them directly by means of tests [25]. Experimentally, it is very difficult to directly construct these magnetic pulse weldability windows. In fact, the impact angle and the impact velocity constantly change from the start to the end of the weld, unlike explosion welding, which allows welding conditions to be maintained by controlling the triggering of explosives.
To overcome this difficulty, Groche et al. [26] have proposed an experimental set-up that allows the velocity and impact angle of two material samples to be controlled and varied separately. More recently Lee et al. [18] proposed using 16 Photon Doppler Velocimetry (PDV) probes to directly measure the change of impact velocity and impact angle during collision welding.
Psyk [7] studied the influence of important adjustable process parameters on the impacting velocity and impacting angle of the joining partners in order to allow a target-oriented process and joint design based on welding windows, which refer to these collision parameters. Additionally, the influences of the adjustable process parameters on weld quality characterizing parameters were analysed. It can be concluded that although welding windows are a valuable tool for selecting reasonable ranges for the process parameters, detailed knowledge about the specific influence of the parameters is indispensable for designing an optimized process.
The bibliography agrees that the definition of the MPW process window is difficult to obtain and specific of the machine and the materials. Weldability depends on geometry parameters and is specific for each inductor design. However there is an interesting approach for the welding window, used in explosive welding (EXW), that shows the viability of the process as a function of the impact angle and the impact velocity (Figure 6) [27]. Although the exact same factors of wave formation or transition velocity do not apply for MPW, it is a useful tool to determine where the weld will take place.
Collision parameter based welding windows can be a powerful tool in the design of MPW processes because they are independent from the individual equipment or setup. It is the objective of this contribution to quantify welding windows for MPW based on the determination of impact pressure, impact velocity and impact angle. However, their use in practice is complicated, because collision parameters cannot be directly adjusted.
2. Materials and Methods
2.1. Materials
Typical materials from the automotive industry have been used: A6082-T6 aluminum alloy and HC420LA low-carbon steel. Their properties can be seen in Table 1 and Table 2.
The electromagnetic pulse welding tests have been carried out using lapping 50x25x1 mm steel and aluminum specimens. The tests were carried out at the Innovaltech platform in Saint Quentin, France. The equipment used is a 9Kv/25kJ (690F) PULSAR MPW system, which provides an impulse current between 250 and 550kA, a pseudo-frequency in the range of 16 to 18 kHz and an output voltage between 4 and 9 kV. This system is connected to the coil and to the clapping system in which the steel and aluminum plates that are going to be joined are located. A flat electromagnetic coil was designed for the experiments (Figure 7) due to the nature of the joint to be made. In order to isolate the current discharge through the coil from the metallic elements of the system, the electromagnetic coil is embedded in a block of G10, a laminated material made with fiberglass and epoxy resin whose most outstanding properties for the present application are high mechanical resistance and electrical insulation. This figure also shows the connections required by the coil for its connection to the capacitor bank and the actuator zone. This last area is where the moving plates are positioned and where the magnetic pulse will be generated.
2.2. Process Parameters
Figure 8 schematically shows the three stages that occur in a magnetic pulse welding operation. In the first place, there is the stage prior to the pulse where the assembly of the different elements of which the system is made up is carried out. In the lower part the electromagnetic coil will be located. Next, in our case, an AA 1100 aluminum alloy pushing plate is introduced with the same dimensions as the mobile plate or flyer, but with a lower electrical resistivity (2,99.10-8 Ωm compared to 0,038 .10-6 for the AA 6082 T6 alloy). The use of a pusher improves the energy efficiency of the pulses and its use is recommended for applications in which the energy levels required are high, approaching the maximum capacity of the capacitor bank. The limitation in these tests is set by the capacity of the capacitor bank and the use of the pusher in the tests has been necessary. The mobile elements of the experimental tests are the pusher and the mobile plate or flyer made of AA 6082 T6. The latter is defined as mobile because it has a lower weight than the steel one and through the same impulse, the impact speed to be reached will be greater. The HC420LA steel sheet is kept fixed by means of a mooring system.
The two mobile plates are placed on the electromagnetic coil and positioning gauges on the AA 6082 T6 plate (first step in Figure 8). The gauges, in addition to maintaining the necessary clearance or distance between the fixed HC 420 LA steel sheet and the AA 6082 T6 mobile sheet, fix the overlap between both sheets. The gap between the two sheets allows the moving sheet to be accelerated and a higher impact speed to be reached, which translates into a higher impact mechanical pressure.
The second stage of Figure 8 presents a state after the electromagnetic discharge. The pusher plate undergoes a repulsion with respect to the coil and pushes the AA 6082 T6 plate, accelerating it until it impacts against the fixed steel plate. This impact is what generates significant pressure and allows a solid-state union.
The third stage, final situation, reproduces the state of the system after the impact. The two sheets that have impacted have been permanently joined and the pusher returns to its original position on the electromagnetic coil.
Three main parameters have been studied: discharge energy, gap (distance between sheets) and overlap distance. To establish the process window, experiments have been carried out combining the different parameters (Table 3). Two kind of welding windows are proposed, in 2D and 3D diagrams: one based on process parameters (gap, overlap, mean energy or output voltage) and the other on collision parameters (pressure, velocity and impact angle). The collision angle has been calculated based on geometrical principles. Measurements with an optical device verified the calculations. The specimens have been cut and prepared for the metallographic analysis with an optical microscope.
The discharge energy, gap and the overlap between plates (Table 3) have been analyzed and impact parameters (pressure, velocity and angle) have been calculated from equations (1), (9) and (10).
2.3. Microstructure Analysis
Micrographic analyses by optical microscopy and/or scanning electron microscopy were carried out in order to highlight the type of adhesion between the two materials (straight or wavy), the presence of intermetallic compounds and to determine the length of the welded zone (Figure 9).
2.4. Weld Specific Energy Determination
In order to determine the specific adhesion energy of the weld, shear tests were performed using a device developed by Torregaray et al. [31] for material stacks (Figure 10). The specific adhesion energy is determined by integrating the tension force vs. displacement curve and is related to the area of the welded section. The welded area is measured using a Leica DCM 3D confocal microscope.
3. Results
The results of the tests carried out are reported in Table 4. Out of 136 trials, 73 resulted in successful welding (53.7% success rate). The success rate varies significantly with different combinations of process parameters.
3.1. Process Window Based on Output Voltage and Impact Angle
Smaller gaps (1 mm and 1.5 mm) generally result in more successful welds compared to larger gaps (2 mm, 2.5 mm, and 3 mm). For example, with a 1 mm gap, the success rate is higher compared to a 3 mm gap. Overlap values of 6 mm and 7 mm show better welding results compared to 8 mm. Consistent overlap seems to be crucial for successful welding. Cantilevered distances of 9 mm and 10 mm are more frequently associated with successful welds. The data suggests that a cantilevered distance of 11 mm is less effective. Higher voltages (8 kV, 8.5 kV, and 9 kV) generally result in more successful welds. Lower voltages (5.5 kV, 6 kV, and 6.5 kV) often lead to unsuccessful welds. Higher mean energy values (above 20 kJ) tend to result in successful welds. Lower mean energy values (below 15 kJ) often lead to unsuccessful welds.
For process parameters, the classical welding windows are done with two variables, collision angle, and output voltage or mean energy [1] (Figure 11). For this combination of stacks (HC420LA / A6082 T6), a typical zone exists where 100% of the samples are welded. A higher output voltage or mean energy is required for welding when the impact angle is low. Similarly, for low average energies and low impact angles, or for high average energies associated with high impact angles, the weld is not realized. This type of process window is dependent on the welding equipment used and therefore cannot be transposed to other MPW equipment or devices.
The combination of two parameters gives not real information about the weldability of this process, since different combinations of gap, overlap and cantilevered can give the same impact angle. A three parameters window, on the other hand, shows more information and narrows the useful parameters to continue the study of the process.
Figure 10 shows a 3D representation of the welded percentage obtained from the experiments which clearly points out the region where the combination of the three parameters (gap, overlap and mean energy) allows to reach 100% of welded samples. However, this type of process window is again dependent on the equipment used and cannot be transposed to equipment where the inductor has a different geometry, the LRC circuit has other characteristics... On the other hand, these parameters are directly programmed on the equipment and therefore easier to implement at the level of the process.
The 3D representation allows to point out different parameter combinations where the process is stable and reaches 100% of welded samples (black ellipses).
Bibliography does not mention overlap as a factor since most research is done in a whole overlap configuration. However, if the purpose of the weld is the use in BIW, a partial overlap is needed to take into account. The results show the importance of overlap in the consideration of the welding first requirement. An analysis of variance (ANOVA) has been made for both approaches (process parameters and impact parameters). The results for the process parameter approach point out the significance of the gap and the interactions between gap and overlap, gap and energy, and overlap and energy (Table 5). This confirms the importance of the three parameters and that the collision angle which takes into account the gap and the overlap is not sufficient to properly define the viability zones of the process since different combinations of gap and overlap can result in the same impact angle.

Table 5.
Analysis of Variance for the model with process parameters related to the results of weldability of HC420LA and A6082T6 stacks.
Table 5.
Analysis of Variance for the model with process parameters related to the results of weldability of HC420LA and A6082T6 stacks.
| Variable | Coefficient | Standard deviation | t Student | Confidence % | Risk % |
|---|---|---|---|---|---|
| Gap | 440,7042 | 79,7975 | 5,5228 | 100,00 | 0,00 |
| Overlap | -89,8196 | 24,7820 | -3,6244 | 99,92 | 0,08 |
| Gap*Output Voltage | -30,7584 | 8,2800 | -3,7148 | 99,94 | 0,06 |
| Overlap*Output Voltage | 24,2372 | 5,1067 | 4,7462 | 100,00 | 0,00 |
| Output Voltage2 | -7,4578 | 2,3220 | -3,2119 | 99,75 | 0,25 |
| Gap2 | -53,5699 | 10,5086 | -5,0977 | 100,00 | 0,00 |
| Overlap2 | -6,9997 | 3,1064 | -2,2534 | 97,05 | 2,95 |
| Source | Square sum | DoF | Mean squares | Fisher | Confidence % | Risk % |
| Regression | 173536,0837 | 7 | 24790,8691 | 27,3464 | 100,00 | 0,00 |
| Résiduals | 38075,0363 | 42 | 906,5485 | |||
| Total | 211611,1200 | 49 | 4318,5943 | |||
| Regression coefficient R= | 0,9056 | |||||
According to the Henry's or CHI2 tests, the distribution of the residuals is not significantly different from a normal law. That means that there are no other significant parameters for our model, and that the gap parameter, the interactions between gap and overlap, gap and mean energy and overlap and mean energy are the only parameters explaining the variations of the % welded.
3.2. Process Window Based on Physical Parameters
High impact pressures (above 4000 MPa) are generally associated with successful welds. High impact velocities (above 1000 m/s) tend to result in successful welds. Impact angles around 18.43° and 26.57° are more frequently associated with successful welds compared to 33.69° and 45°.
Refering to the works cited above and which are based on the physical bases of the MPW process, the parameters which really control the weld generation between the two materials are the impact pressure, the impact velocity and the impact angle. These parameters are independent to the process implemented to perform the MPW and therefore allow to define a window of the process independently of the MPW equipment used. The only problem is to link these three impact parameters to the different process parameters (gap, overlap, mean energy, frequency, voltage...).
They also allow to define different thresholds guaranteeing the quality of the weld: critical impact speed for a straight or wavy welded interface, threshold pressure to weld the two materials, critical impact velocity to obtain the jetting phenomenon, etc. (Figure 11).
In order to promote the phenomenon of jetting, the collision has to be subsonic compared to the speed of sound in the flyer material. In the case of A6082 T6, the sound speed in the material is around 3040 m/s. In all the tests, this value has not been overcome, that means that the condition of jetting, able to clean the surface of both materials, has been reached.
The waving morphology of the interface is also a characteristic of high impact welding processes. This is due to the transition of laminar to turbulent flow of the flyer material during the collision. Cowan [28] and Carpenter [29] have developed an analytical formula for explosive welding for determining this critical velocity Vc, by linking wave formation to fluid flow around an obstacle.
where Re trans is the critical Reynolds number for transitioning from a laminar to turbulent flow (~8.9 for aluminum alloys [28]), H is the Vickers hardness (46 HV at 400 °C for A6082 T6 used in this study), and ρ is the density (2700 kg/m3 for A6082 and 7800 kg/m3 for HC420LA). The flyer velocity overcomes a critical collision velocity required for a shear instability to develop for MPW [30]. The value obtained from the experiments and from the equation (11) are in agreement (1780 m/s). Figure 13 points out this difference of hydrodynamic regime for two conditions (noted condition 1 and condition 2 in Figure 13)where welding has been achieved around this critical velocity.
The optical micrographs of Figure 14 confirm this change from laminar (straight interface for condition 1) to turbulent flow (wavy interface for condition 2).
According to Kapil et al., the threshold pressure necessary for welding the two plates is defined by equations (6) and (7), and using data of Table 2, we can estimate this minimum pressure being 2400, 1320 and 650 MPa for temperature of the flyer in the impacted zone respectively of 200, 300 and 400ºC.
Kolsky [23] points out a linear relation of the impact pressure with the impact velocity (eq. 4) depending only on the characteristics of the two materials to be welded (density and speed of sound in each of them). Figure 10 confirms this trend with however the highlighting of the important role of the impact angle, with a Pi/Vi ratio which decreases when the impact angle increases (Table 6).
These different aspects are reported in the welding window of our experiments on Figure 13.
The three-dimensional process window considering the impact parameters is shown in Figure 15. Here again, two zones can be pointed out where the process is stable and 100% of welded samples (black ellipses) are successfully achieved.
The analysis of variance of the results confirms that the impact pressure, the impact velocity and the interaction between impact velocity and impact angle are the significant parameters of the process (Table 7). This confirms the results of the bibliography where it is specified that a minimum pressure is necessary to ensure welding, that a critical speed defines the type of interface obtained (straight or wavy) and highlights the importance of the impact velocity associated with the collision angle. The impact velocity necessary to generate sufficient impact pressure for welding is intrinsically related to the angle at which the collision occurs.
Table 7.
Analysis of Variance for the model with impact parameters related to the results of weldability of HC420LA and A6082T6 stacks.
Table 7.
Analysis of Variance for the model with impact parameters related to the results of weldability of HC420LA and A6082T6 stacks.
| Variable | Coefficient | Standard deviation | t Student | Confidence % | Risk % |
|---|---|---|---|---|---|
| Impact Pressure | -0,1945 | 0,0472 | -4,1211 | 99,98 | 0,02 |
| Impact Velocity | 5,8905 | 1,2237 | 4,8136 | 100,00 | 0,00 |
| Impact Angle | -71,0335 | 17,0303 | -4,1710 | 99,98 | 0,02 |
| Impact Pressure * Impact Angle | -0,0158 | 0,0036 | -4,4333 | 99,99 | 0,01 |
| Impact Velocity * Impact Angle | -0,1133 | 0,0263 | -4,2997 | 99,99 | 0,01 |
| Impact Pressure2 | 0,0000 | 0,0000 | 2,9856 | 99,52 | 0,48 |
| Impact Velocity2 | 0,0007 | 0,0002 | 3,6998 | 99,94 | 0,06 |
| Impact Angle2 | 1,3786 | 0,4313 | 3,1961 | 99,73 | 0,27 |
| Source | Square sum | Degree of Freedom | Mean squares | Fisher | Confidence% | Risk% |
| Regression | 167332,3338 | 8 | 20916,5417 | 22,4106 | 100,00 | 0,00 |
| Residuals | 37333,2262 | 40 | 933,3307 | |||
| Total | 204665,5600 | 48 | 4263,8658 | |||
| Regression coefficient R= | 0,9042 | |||||
According to the Henry's or CHI2 tests, the distribution of the residuals is not significantly different from a normal law, which means that there are no other significant parameters for our model, and that the impact pressure parameters, impact speed and impact or collision angle are the only parameters explaining the variations of the percentage of welded samples.
3.3. Process Window Including Adhesion Specific Energy of the Weld
Results are shown in Table 4. Isovalues of specific adhesion energy are pointed out in Figure 16 and Figure 18. They allow to determine the area of the output voltage/impact angle or the impact velocity/impact pressure/impact angle diagrams where the process is stable and robust.
After polishing and chemical etching to highlight the intermetallic compounds, micrographs are made by optical microscopy and the area occupied by the intermetallic compounds is measured by image analysis using ImageJ software. The results are given in Figure 19, Figure 20 and Figure 21.
Successful welds have a wide range of weld specific energy values, but higher values (above 150 kJ/m²) are more common in successful welds.
It is clear that the specific energy of the welded part depends on the amount of intermetallic compounds created during the process. The higher the quantity of intermetallic compounds (IMCs) at the interface the lower the weld specific energy (Figure 19).
However, the dependence of the level of IMCs with the output energy as mentioned by different researchers (Psyk et al. [17], Lee et al. [18], Zhang et al. [19]) is not so clear and seems to be related also to the impact angle as shown in Figure 20.
Concerning its dependence with the physical parameters of the process, it has been pointed out that a minimum concentration of IMCs is obtained for an impact velocity in the range of 500 to 1200 m/s, associated to an impact pressure between 3000 and 4000 MPa (Figure 21).
In the different micrographs of the welded zone (Figure 9), it also appears a higher concentration of IMCs with a wavy interface as reported by Zhang et al. [19].
The data suggests that higher impact pressures and velocities, along with optimal impact angles, result in thinner IMC layers, which are desirable for stronger welds. Higher output voltage and weld specific energy values also correlate with thinner IMC layers.
4. Conclusions
In this approach concerning the magnetic impact welding process, we have attempted to define the process window in two different ways.
The first approach is based on the use of process parameters (gap, overlap and mean energy or output voltage) and is perfectly suited for use in production. The impact angle versus mean energy or output voltage diagrams are able to define the process window for the equipment used. This diagram must be associated with a 3D diagram to define the parameters (gap and overlap) which are at the origin of the angle of impact. They highlight the importance of the overlap factor for all applications of this type, in particular in the automotive sector for Body In White (BIW) applications. On the other hand, the results cannot be transposed directly to other stack thicknesses or equipment where the geometry of the inductor, the LRC values and the frequency of the electromagnetic circuit are different.
The second approach is based on the use of impact parameters (velocity, pressure and angle of impact) which are the basis of the physics of the process. Using the relationships defined by Shotri et al. [19] from Buckingham's π theorem, these parameters can be determined independently of the dimensions of the parts to be welded, of the generator, of the LRC circuit and of the geometry of the inductor used. The process window, based on these parameters, can therefore be used regardless of the equipment. The 2D or 3D window from the impact pressure as a function of the impact velocity for different impact angle is therefore the right tool to understand the different mechanisms generating the weld. It allows to locate the threshold pressure as defined by the Hugoniot relation, the critical speed of change of type of weld (straight or wavy) from the Cowan and Carpenter relation, and to locate the subsonic speed limit associated with the phenomenon of jetting/no jetting.
The strength of the weld is strongly related to the content of IMCs generated during the process. Thinner IMCs generally correspond to higher weld specific energy. There is an inverse relationship between impact angle and weld specific energy. Higher angles generally result in lower weld energy
Higher impact velocities tend to produce thicker Intermetallic Compounds (IMCs).
For successful welding, the optimal process parameters include a gap of 1 mm to 1.5 mm, an overlap of 6 mm to 7 mm, a cantilevered distance of 9 mm to 10 mm, and a voltage of 8 kV to 9 kV.
Higher mean energy values (above 20 kJ) and weld specific energy values (above 150 kJ/m²) are crucial for successful welds.
In terms of physical parameters, the optimum conditions for a high weld specific energy associated to a probability of 100% or near of joining is obtained for an impact velocity between 900 and 1200 m/s, an impact pressure between 3000 and 4000 MPa and an impact angle in the range of 18 to 35°.
These conditions correspond to a Gap: of 1.5 to 2 mm, and an Output Voltage between 7.5 and 8.5 kV.
Welds consistently failed when the Gap distances exceeded 3 mm, the Output Voltage was below 5.5 kV and the Impact pressures were below 2000 MPa.
These findings suggest that controlling the impact angle, pressure and velocity is crucial for achieving optimal weld quality while minimizing IMCs formation. The trade-off between weld strength (indicated by specific energy) and IMCs thickness needs to be carefully balanced for optimal joint properties.
Further experiments should focus on refining the process parameters to achieve consistent welding results with thinner IMC layers. Additional analysis of the microstructure and mechanical properties of the welds can provide deeper insights into the welding process.
However, this analysis provides a comprehensive understanding of the magnetic pulse welding process for AA6082 T6 aluminum alloy with HC420LA steel, highlighting the critical factors that influence welding success and the formation of intermetallic compounds.
Author Contributions
Conceptualization, FAGM. and EIP.; methodology, FAGM, MBTC and EIP.; software, MARC.; validation, FAGM, MBTC, EIP, ATL; formal analysis, MARC and ATL; investigation, MARC, EIP, ATL and FAGM; resources, FAGM and MBTC; data curation, MARC, ATL and EIP; writing—original draft preparation, FAGM and EIP; writing—review and editing, MBTC and MARC; visualization FAGM; supervision, FAGM; project administration FAGM; funding acquisition, FAGM. All authors have read and agreed to the published version of the manuscript.
Funding
This research was funded by (1) the Department of Economic Development and Infrastructures of the Basque Government (Spain) through the EKOHEGAZ project, ELKARTEK program under grant nº KK-2021-00092 and KK-2023-00051; and (2) the Ministerio de Ciencia, Innovación y Universidades (Grant PID2023-146099OB-I00 funded by MCIU/AEI/10.13039/501100011033/FEDER, UE).
This work was carried out within the framework of the Joint Cross-Border Laboratory LTC AENIGME between the University of the Basque Country, the University of Bordeaux and Arts et Métiers Science and Technology, and the LTC Sarea network.
Data Availability Statement
Not applicable.
Acknowledgments
The authors want to thanks Nélida Rodriguez and Ibai Ojeda from the University of the Basque Country, and also Denis Jouaffre from the INNOVALTECH platform for their help and advices during the experimental phase.
Conflicts of Interest
The authors declare no conflict of interest.
References
- Gullino, A.; Matteis, P.; D’Aiuto, F. “Review of Aluminum-To-Steel Welding Technologies for Car-Body Applications”. Metals 9, 315 (2019). [CrossRef]
- Lu Y., Mayton, E., Song, H., Kimchi, M., Zhang, W., “Dissimilar metal joining of aluminum to steel by ultrasonic plus resistance spot welding - Microstructure and mechanical properties”, Materials & Design, vol 165, 107585 (2019). [CrossRef]
- “European Council adopts regulation on CO2 emissions from new passenger cars and vans”, disponible in: https://www.cde.ual.es/en/european-council-adopts-regulation-on-co2-emissions-from-new-passenger-cars-and-vans/ [last view: may 11th 2023].
- Shah, L. H., Ishak, M., “Review of Research Progress on Aluminum–Steel Dissimilar Welding”, Materials and Manufacturing Processes, vol. 29, 928-933 (2014). [CrossRef]
- Dong, H., Yang, L., Dong, C., Kou, S., “Arc joining of aluminum alloy to stainless steel with flux-cored Zn-based filler metal”, Materials Science & Engineering A, 527, 7151–7154 (2010). [CrossRef]
- Lee, K. J., Kumai, S., “Characterization of intermetallic compound layer formed at the weld interface of the defocused laser welded low carbon steel/6111 aluminum alloy lap joint”. Materials Transactions 47(4), 1178–1185 (2006). [CrossRef]
- Psyk, V., Scheffler, C., Linnemann, M., Landgrebe, D., “Process analysis for magnetic pulse welding of similar and dissimilar material sheet metal joints”, Procedia Engineering, vol 207, 353-358 (2017). [CrossRef]
- Zhang, C.; Li, H.; Liu, Q.; Huang, C.; Zhou, K. Ultrasonic Welding of Aluminum to Steel: A Review. Metals 2023, 13, 29. [Google Scholar] [CrossRef]
- El-Azab, A.; Garnich, M.; Kapoor, A. “Modeling of the electromagnetic forming of sheet metals: state-of-the-art and future needs”. Journal of Materials Processing Technology 142, 744–754 (2003). [CrossRef]
- Faes, K.; Kwee, I.; De Waele, W. Electromagnetic Pulse Welding of Tubular Products: Influence of Process Parameters and Workpiece Geometry on the Joint Characteristics and Investigation of Suitable Support Systems for the Target Tube. Metals 2019, 9(5), 514. [Google Scholar] [CrossRef]
- Kapil, A.; Sharm, A., Magnetic pulse welding: an efficient and environmentally friendly multi-material joining technique. Journal of Cleaner Production, Volume 100, 1 August 2015, Pages 35-58. 1 August. [CrossRef]
- Miranda, R. M.; Tomás, B.; Santosa, T. G.; Fernandes, N. Magnetic pulse welding on the cutting edge of industrial applications. Soldag. Insp. São Paulo, Vol. 19, Nº. 01, p.069-081, Jan/Mar 2014. [CrossRef]
- Kore, S.; Imbert, J.; Zhou, Z.; Worswick, M. Electromagnetic pulse welding of magnesium to aluminum sheets. Welding and Joining of Magnesium Alloys. 2010, 367-379. ISBN 9781845696924. [CrossRef]
- Sapanathan, T.; Raoelison, R. N.; Buiron, N.; Rachik, M. Magnetic Pulse Welding: An Innovative Joining. INTECH, 2016. [CrossRef]
- Shribman, V.; Tomer, Y. Magnetic pulse technology for improved tube joining and forming. 2006. Tube Pipe Technol. 91-95.
- Aizawa, T.; Matsuzawa, K.; Okogawa, K.; Ishibashi, M. Parallel seam welding of aluminum sheets by magnetic pulse welding method with collision between metal jets. 2014. Mater. Sci. Forum 767, 171-176. [CrossRef]
- Psyk, V.; Risch, D.; Kinsey, B.L.; Tekkaya, A.E.; Kleiner, M. Electromagnetic Forming: A review. 2011. Journal of Materials Processing Technololy. 211, 787-829. [CrossRef]
- Lee, K.J.; Kumai, S.; Arai, T.; Aizawa, T. 2007. Interfacial microstructure and strength of steel/aluminum alloy lap joint fabricated by magnetic pressure seam welding. Materials Science Engineering. 471, 95-101. [CrossRef]
- Zhang, P. Joining Enabled by High Velocity Deformation. 2009. The Ohio State University (Ph.D. thesis).
- Shotri, R.; Faes, K.; Racineux, G.; De, A. Analytical Estimation of Electromagnetic Pressure, Flyer Impact Velocity, and Welded Joint Length in Magnetic Pulse Welding. Metals 2022, 12, 276. [CrossRef]
- Lueg-Althoff, J.; Lorenz, A.; Gies, S.; Weddeling, C.; Goebel, G.; Tekkaya, A.E.; Beyer, E. Magnetic Pulse Welding by Electromagnetic Compression: Determination of the Impact Velocity. Adv. Mater. Res. 2014, 966–967, 489–499. [CrossRef]
- Hahn, M.; Weddeling, C.; Lueg-Althoff, J.; Tekkaya, A.E. Analytical approach for magnetic pulse welding of sheet connections. J. Mater. Process. Technol. 2016, 230, 131–142. [Google Scholar] [CrossRef]
- Kolsky H. Stress waves in solids. 2nd edition, Dover Publications, 1963. [CrossRef]
- Raoelison, R.N., Buiron, N., Rachik, M., Haye, D. and Franz, G. ‘Efficient welding conditions in magnetic pulse welding process’, J. Manuf., 2012, 14, 372-377. [CrossRef]
- Zhang, Y., Babu, S.S. and Daehn, G. S. ‘Impact Welding in a Variety of Geometric Configurations’, Proc. 4th Int. Conf. on ‘High Speed Forming’, Columbus, USA, March 2010, 97-107. 20 March.
- Groche, P., Wohletz, S., Brenneis, M., Pabst, C. and Resch F. ‘Joining by forming—A review on joint mechanisms, applications and future trends’, J. Mater. Process. Tech., 2014, 214, 1972-1994. [CrossRef]
- Explosive Welding of Metals and Its Application; Oxford University Press ,1982.
- G.R. Cowan, O.R. Bergmann, A.H. Holtzman, Mechanism of bond zone wave formation in explosion-clad metals, Metall. Mater. Trans. B Process Metall. Mater. Process. Sci. 2 (11) (1971) 3145–3155. [CrossRef]
- S.H. Carpenter, R.H. Wittman, Explosion welding, Annu. Rev.Mater. Sci. 5 (1) (1975), 177–199. [CrossRef]
- Ali Nassiri, Greg Chini, Brad Kinsey, Spatial stability analysis of emergent wavy interfacial patterns in magnetic pulsed welding, CIRP Annals,63/1, 2014, 245-248. [CrossRef]
- A. Torregaray , C. García, New procedure for the determination of shear stress–strain curves in sheet metal laminates, Materials and Design 30 (2009) 4570–4573. [CrossRef]
Figure 1.
Electromagnetic Pulse Welding MPW.
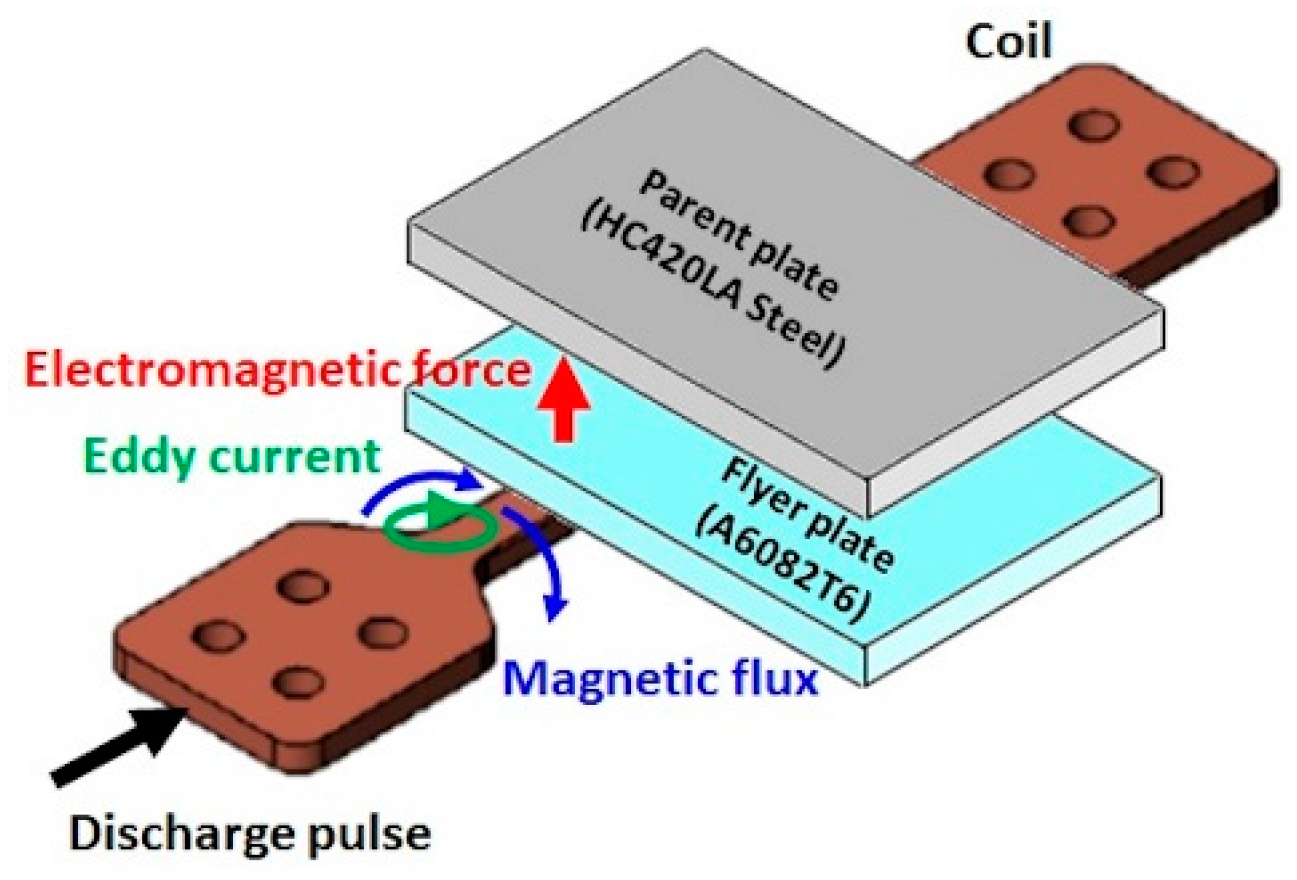
Figure 2.
Simplified graphical representation of MPW welding [10].
Figure 2.
Simplified graphical representation of MPW welding [10].
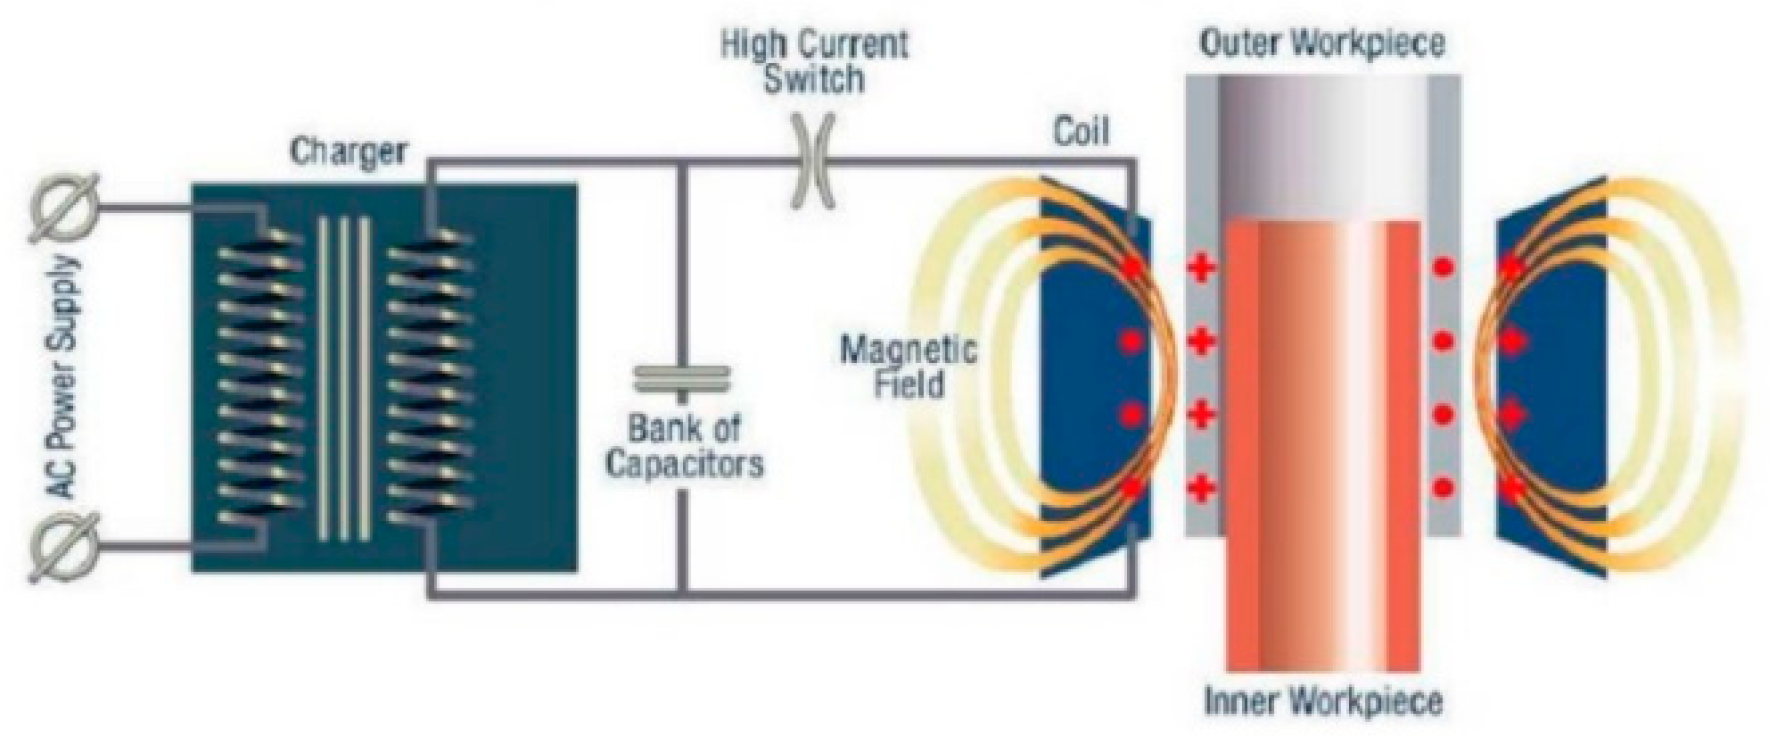
Figure 3.
Micrographs of the weld interfaces of (a) aluminum - aluminum, (b) copper-brass, (c) aluminum-steel, (d) aluminum-copper [9].
Figure 3.
Micrographs of the weld interfaces of (a) aluminum - aluminum, (b) copper-brass, (c) aluminum-steel, (d) aluminum-copper [9].
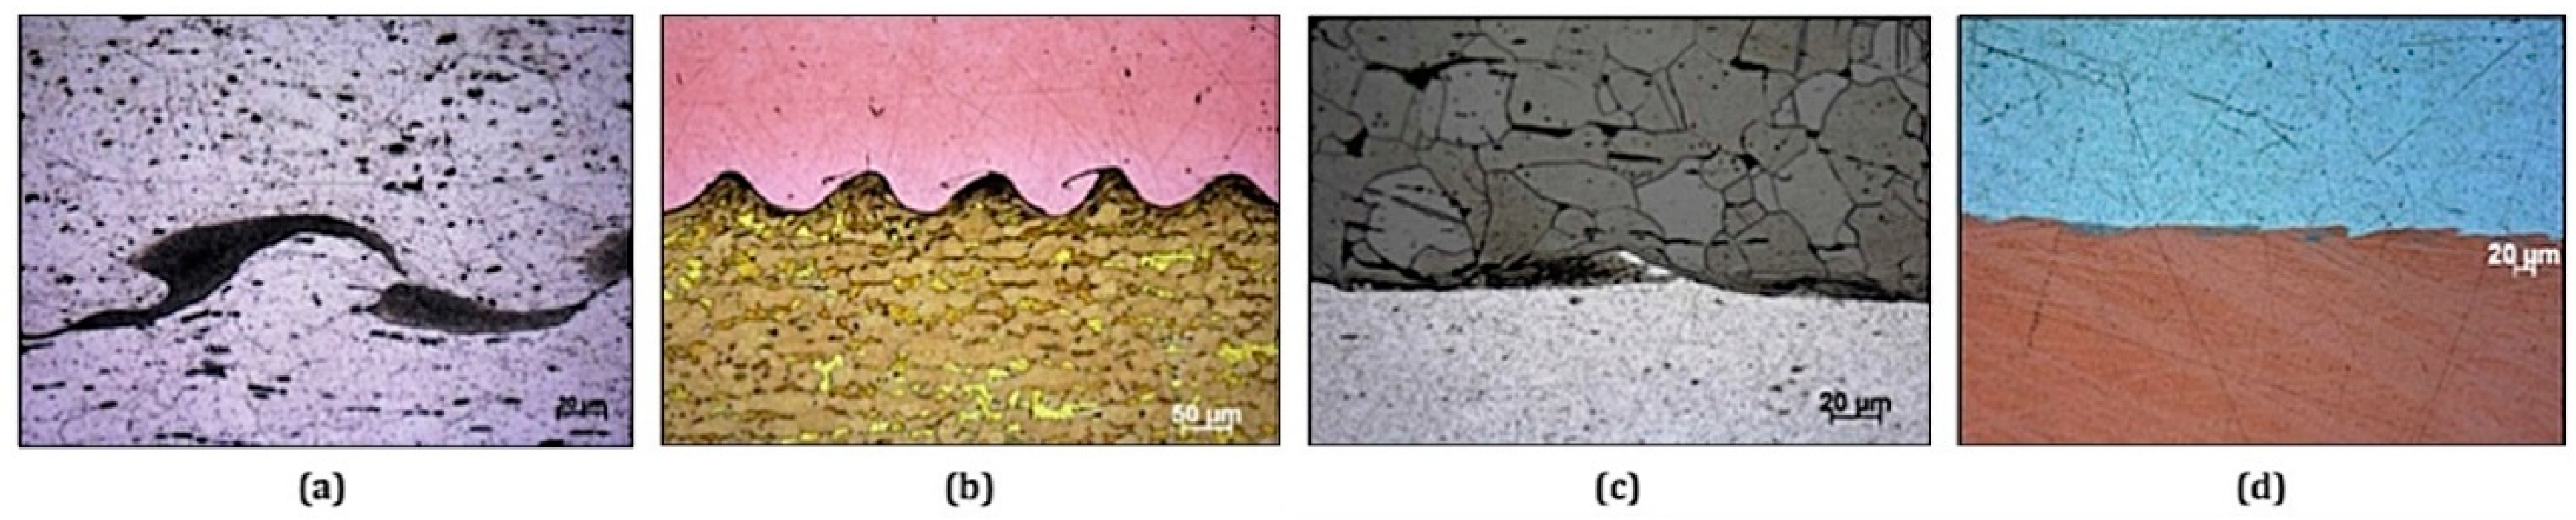
Figure 4.
Wavy interface morphology in MPW welding, between HC420LA steel and A6082T6 (intermetallics delimited in green).
Figure 4.
Wavy interface morphology in MPW welding, between HC420LA steel and A6082T6 (intermetallics delimited in green).
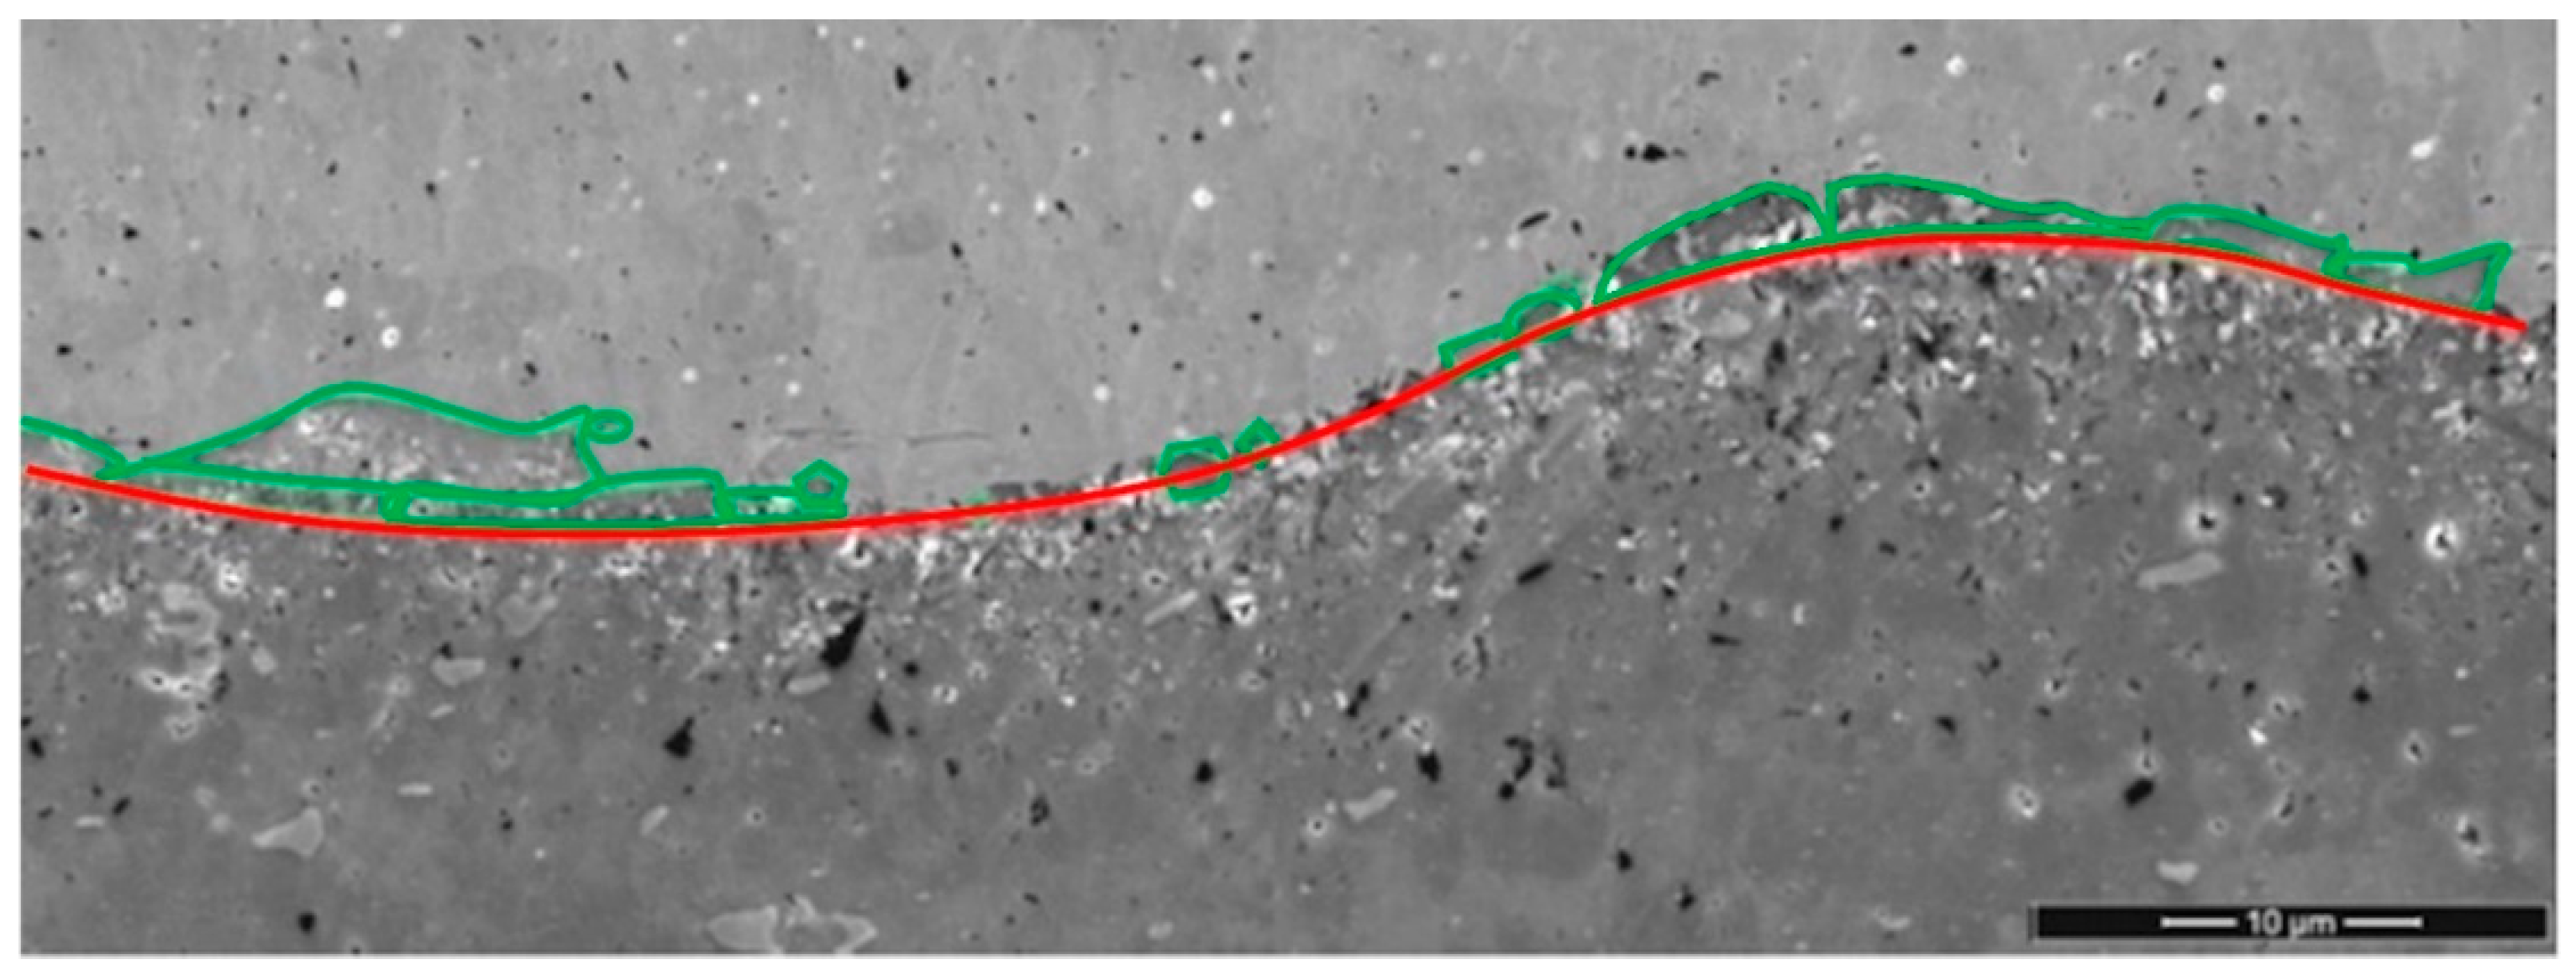
Figure 5.
Schematic representation of initial and final stage of the MPW process.

Figure 6.
Weldability window of explosive welding (EXW), showing the weld success based on the impact velocity vs. impact angle [27].
Figure 6.
Weldability window of explosive welding (EXW), showing the weld success based on the impact velocity vs. impact angle [27].
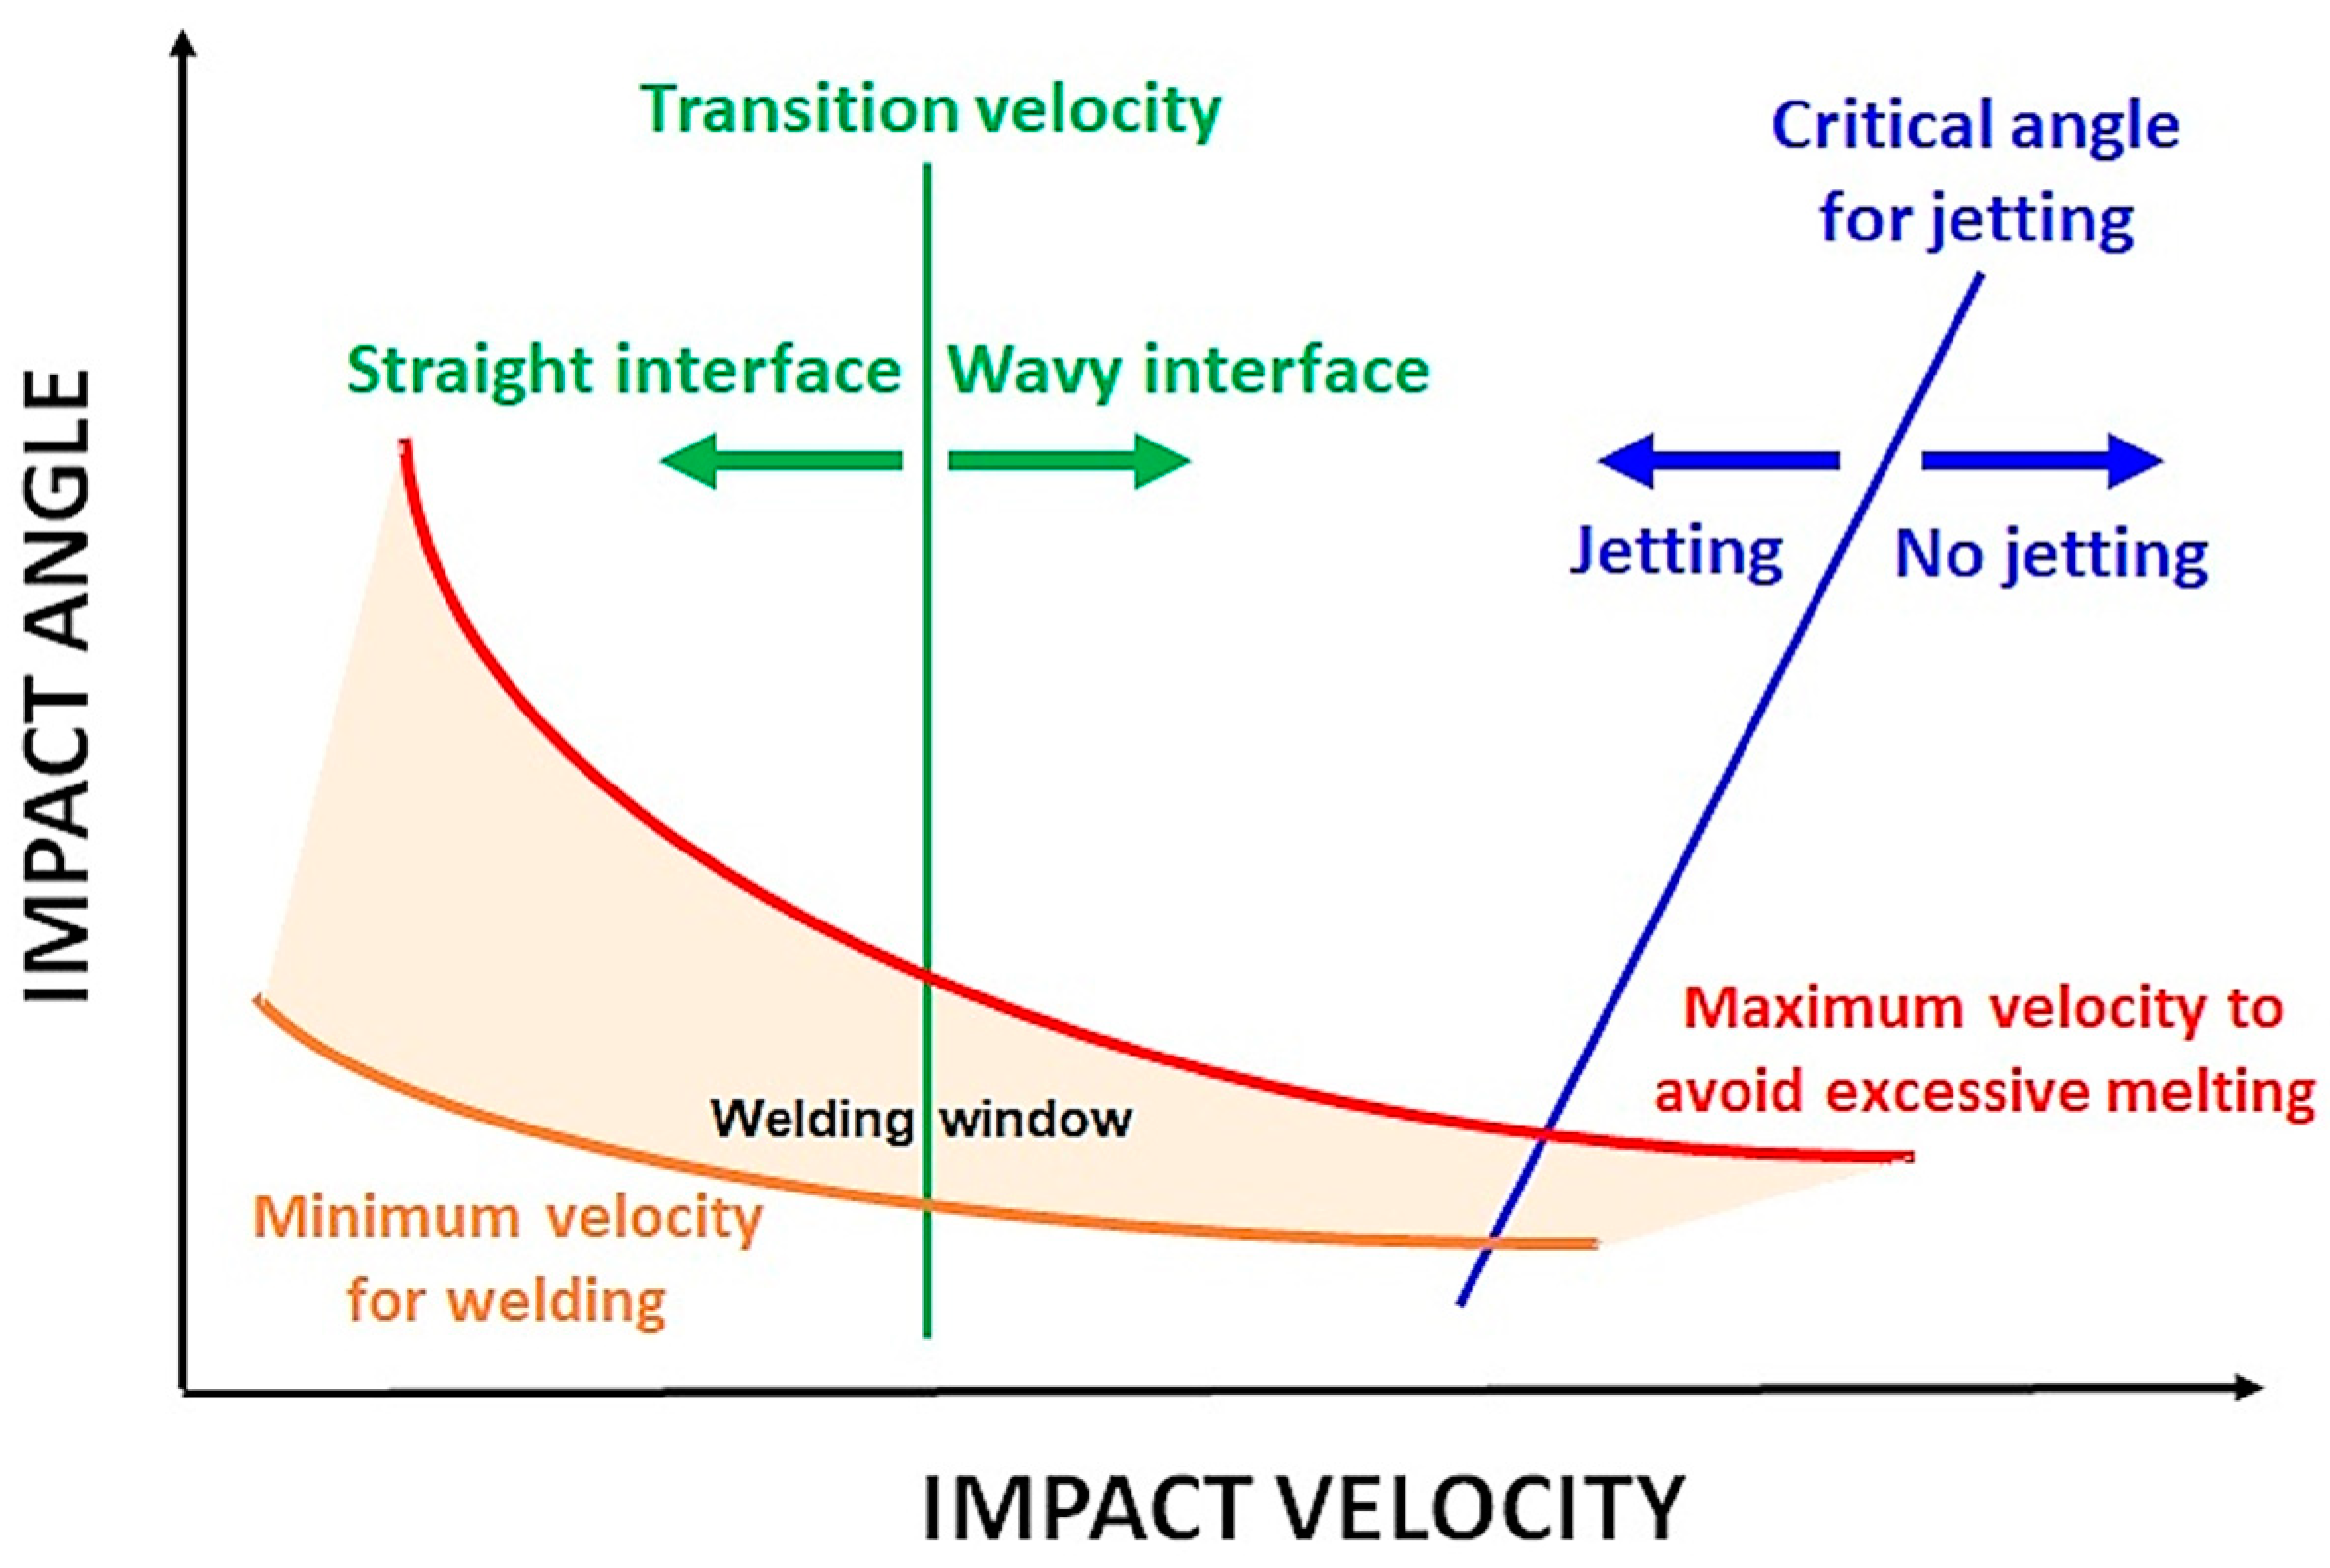
Figure 7.
Electromagnetic pulse welding coil position of Innovaltech MPW platform.
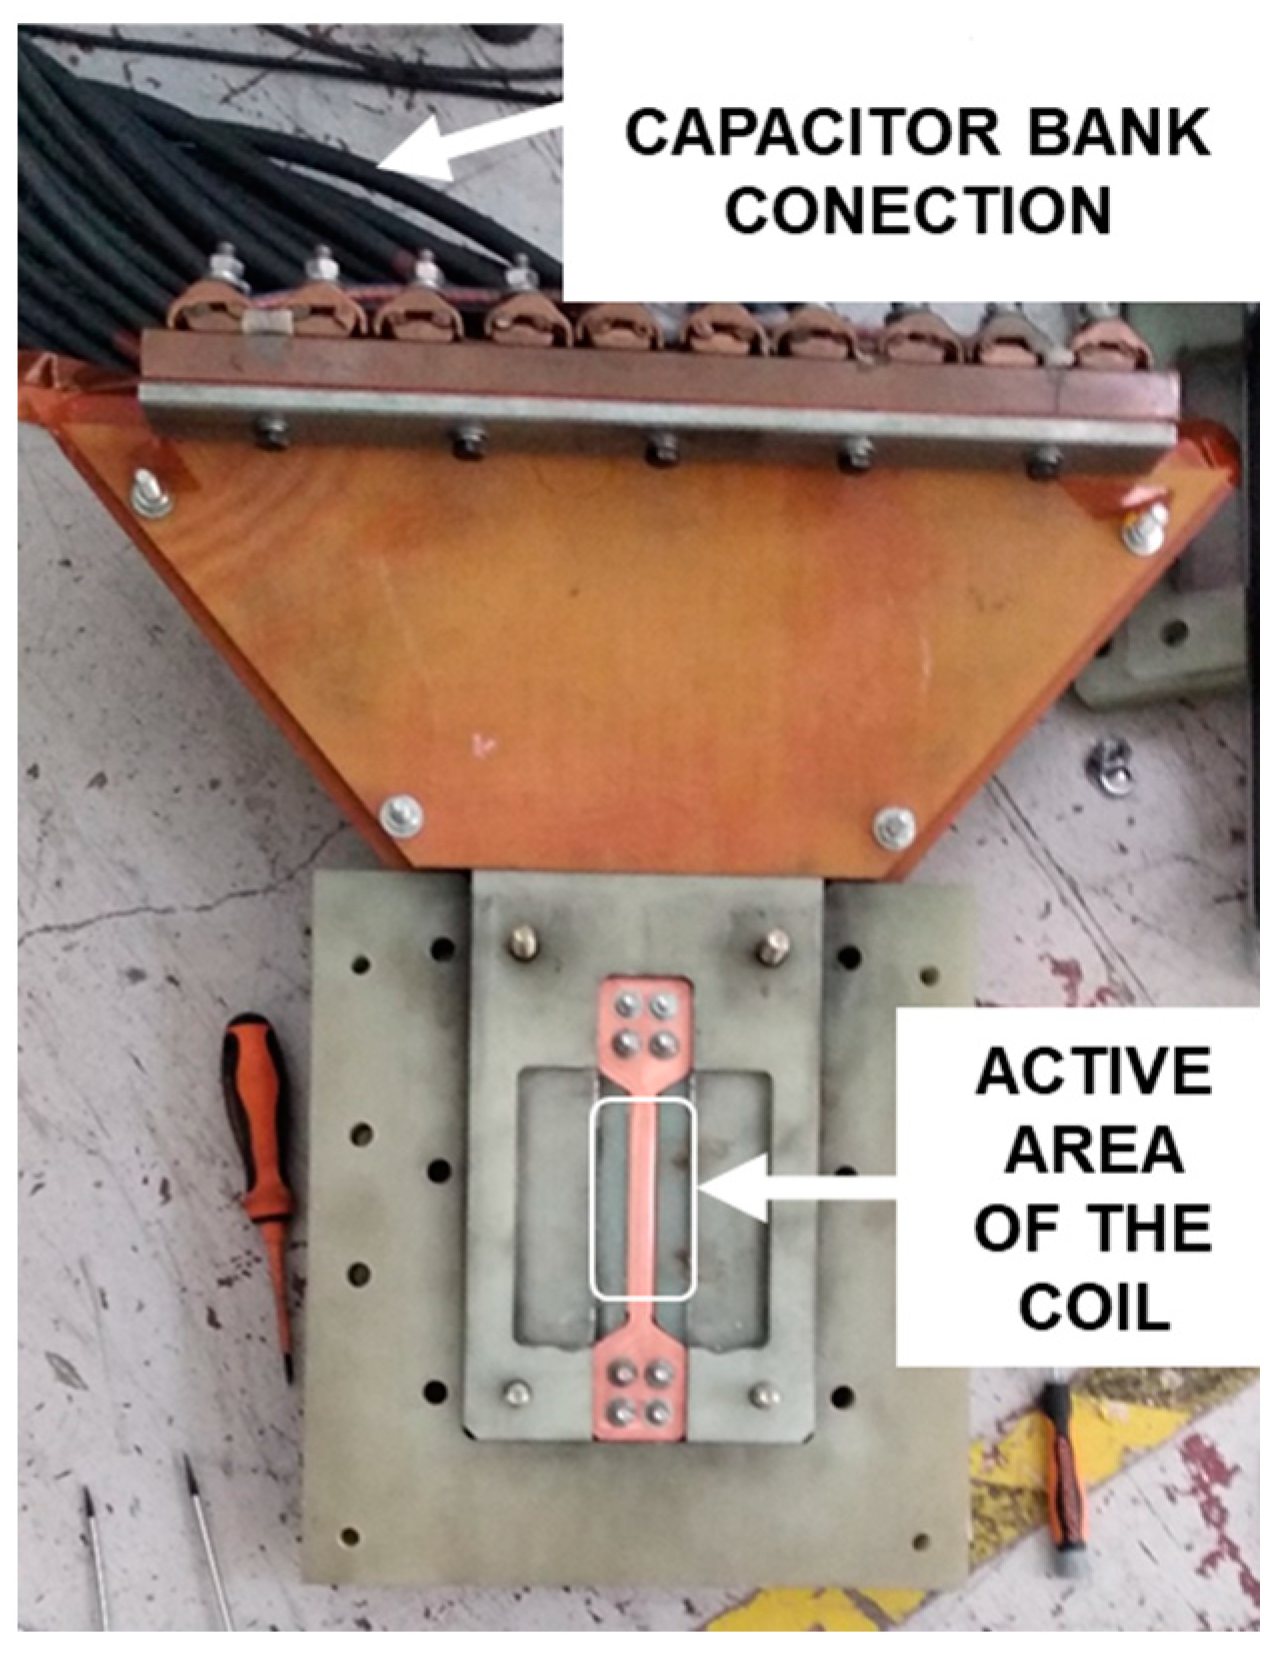
Figure 8.
Schematic representation of the MPW process for A6082T6 and HC420LA with aluminium driver.
Figure 8.
Schematic representation of the MPW process for A6082T6 and HC420LA with aluminium driver.

Figure 9.
Weld section of samples #16, #28 and #49 pointing out the IMCs generated during the MPW process (in yellow).
Figure 9.
Weld section of samples #16, #28 and #49 pointing out the IMCs generated during the MPW process (in yellow).
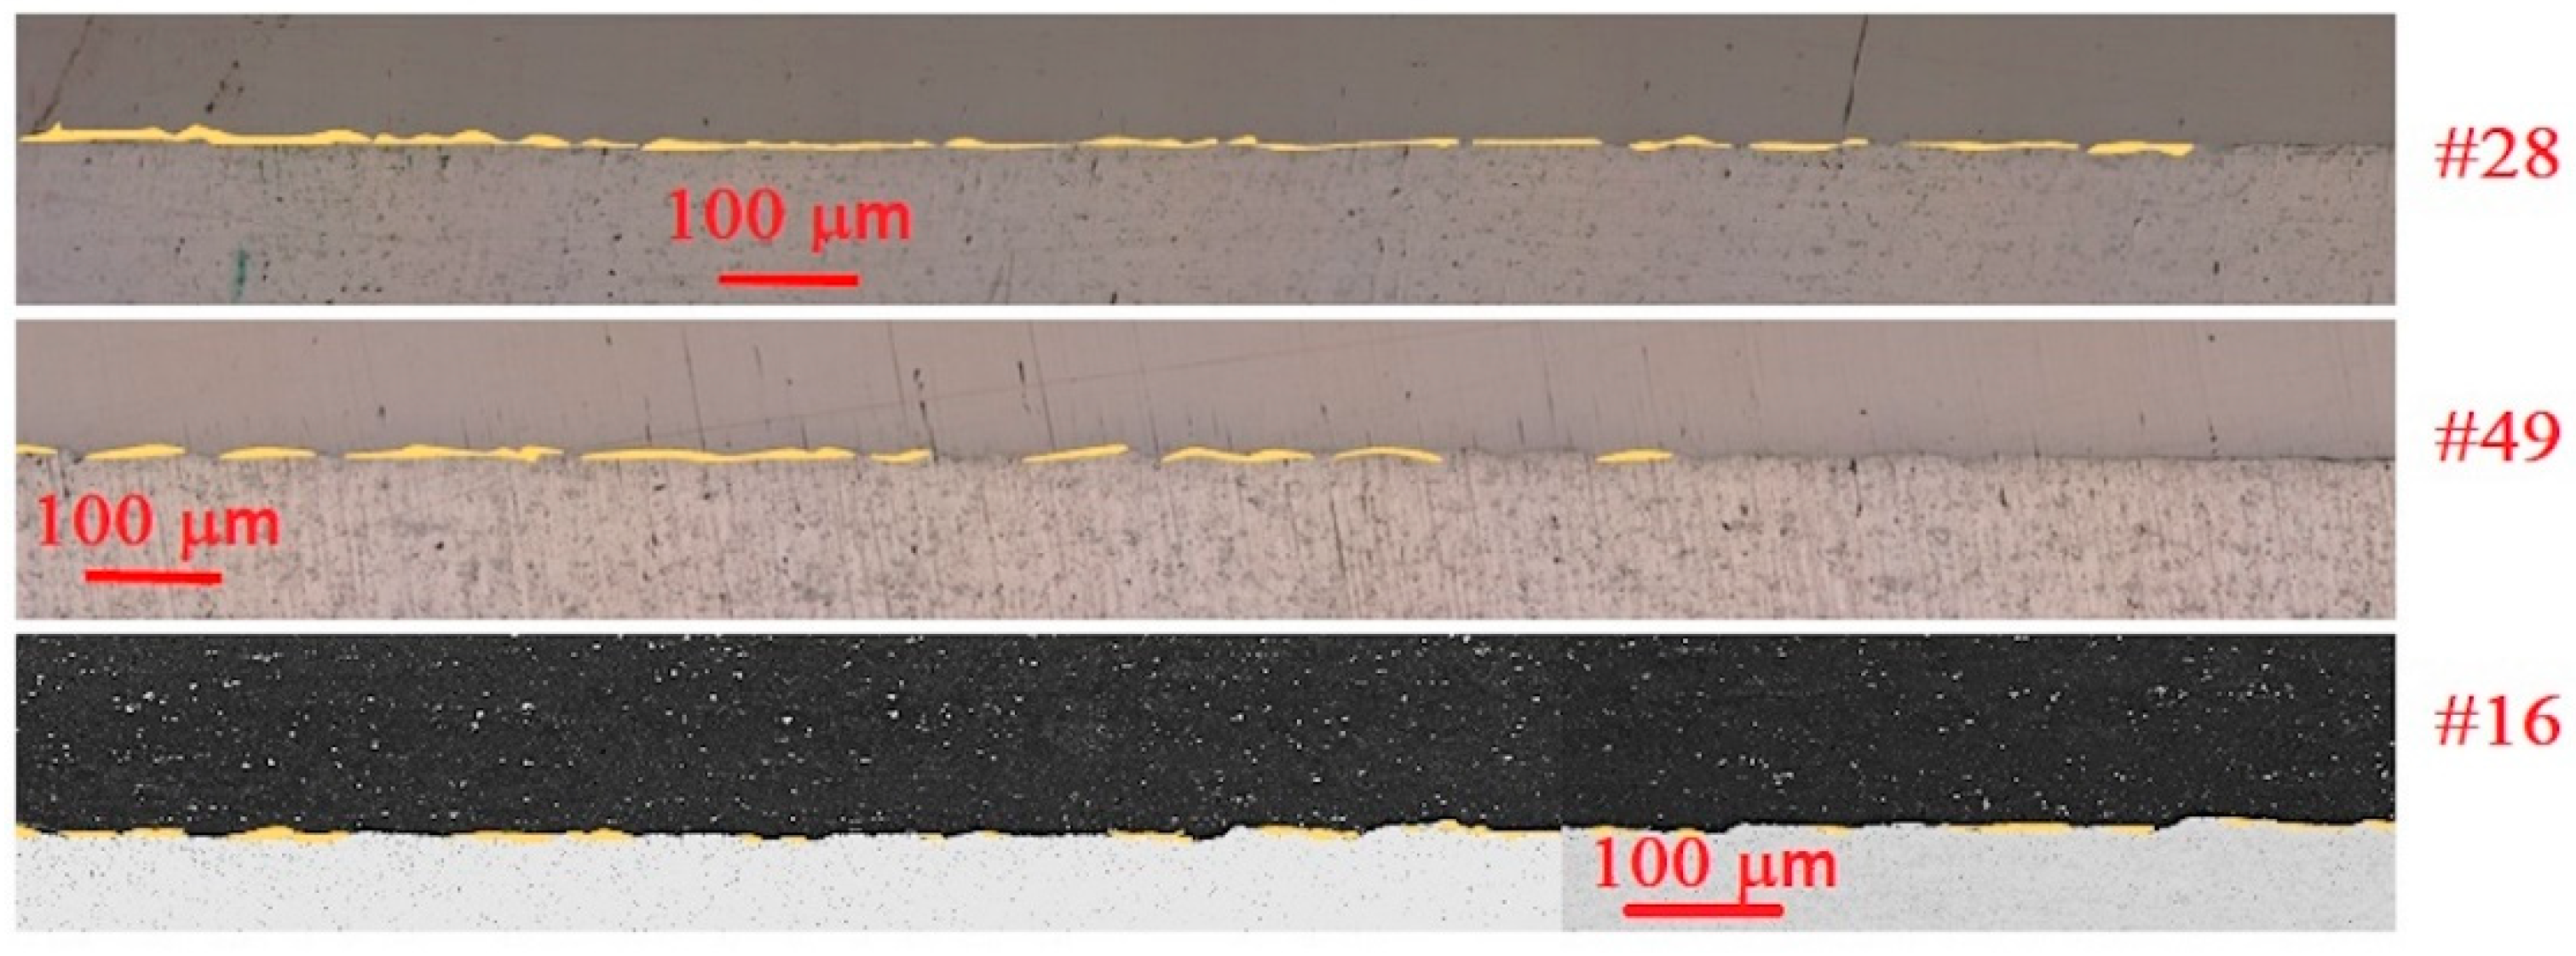
Figure 10.
(Upper left) Design of the shearing tooling. (Upper right) Section of the tooling showing the location of the sample. (Bottom left) Sample #16 after welding. (Bottom centre) Cutting of the sample to prepare the shearing probes. (Bottom right) Example of a shearing probe.
Figure 10.
(Upper left) Design of the shearing tooling. (Upper right) Section of the tooling showing the location of the sample. (Bottom left) Sample #16 after welding. (Bottom centre) Cutting of the sample to prepare the shearing probes. (Bottom right) Example of a shearing probe.
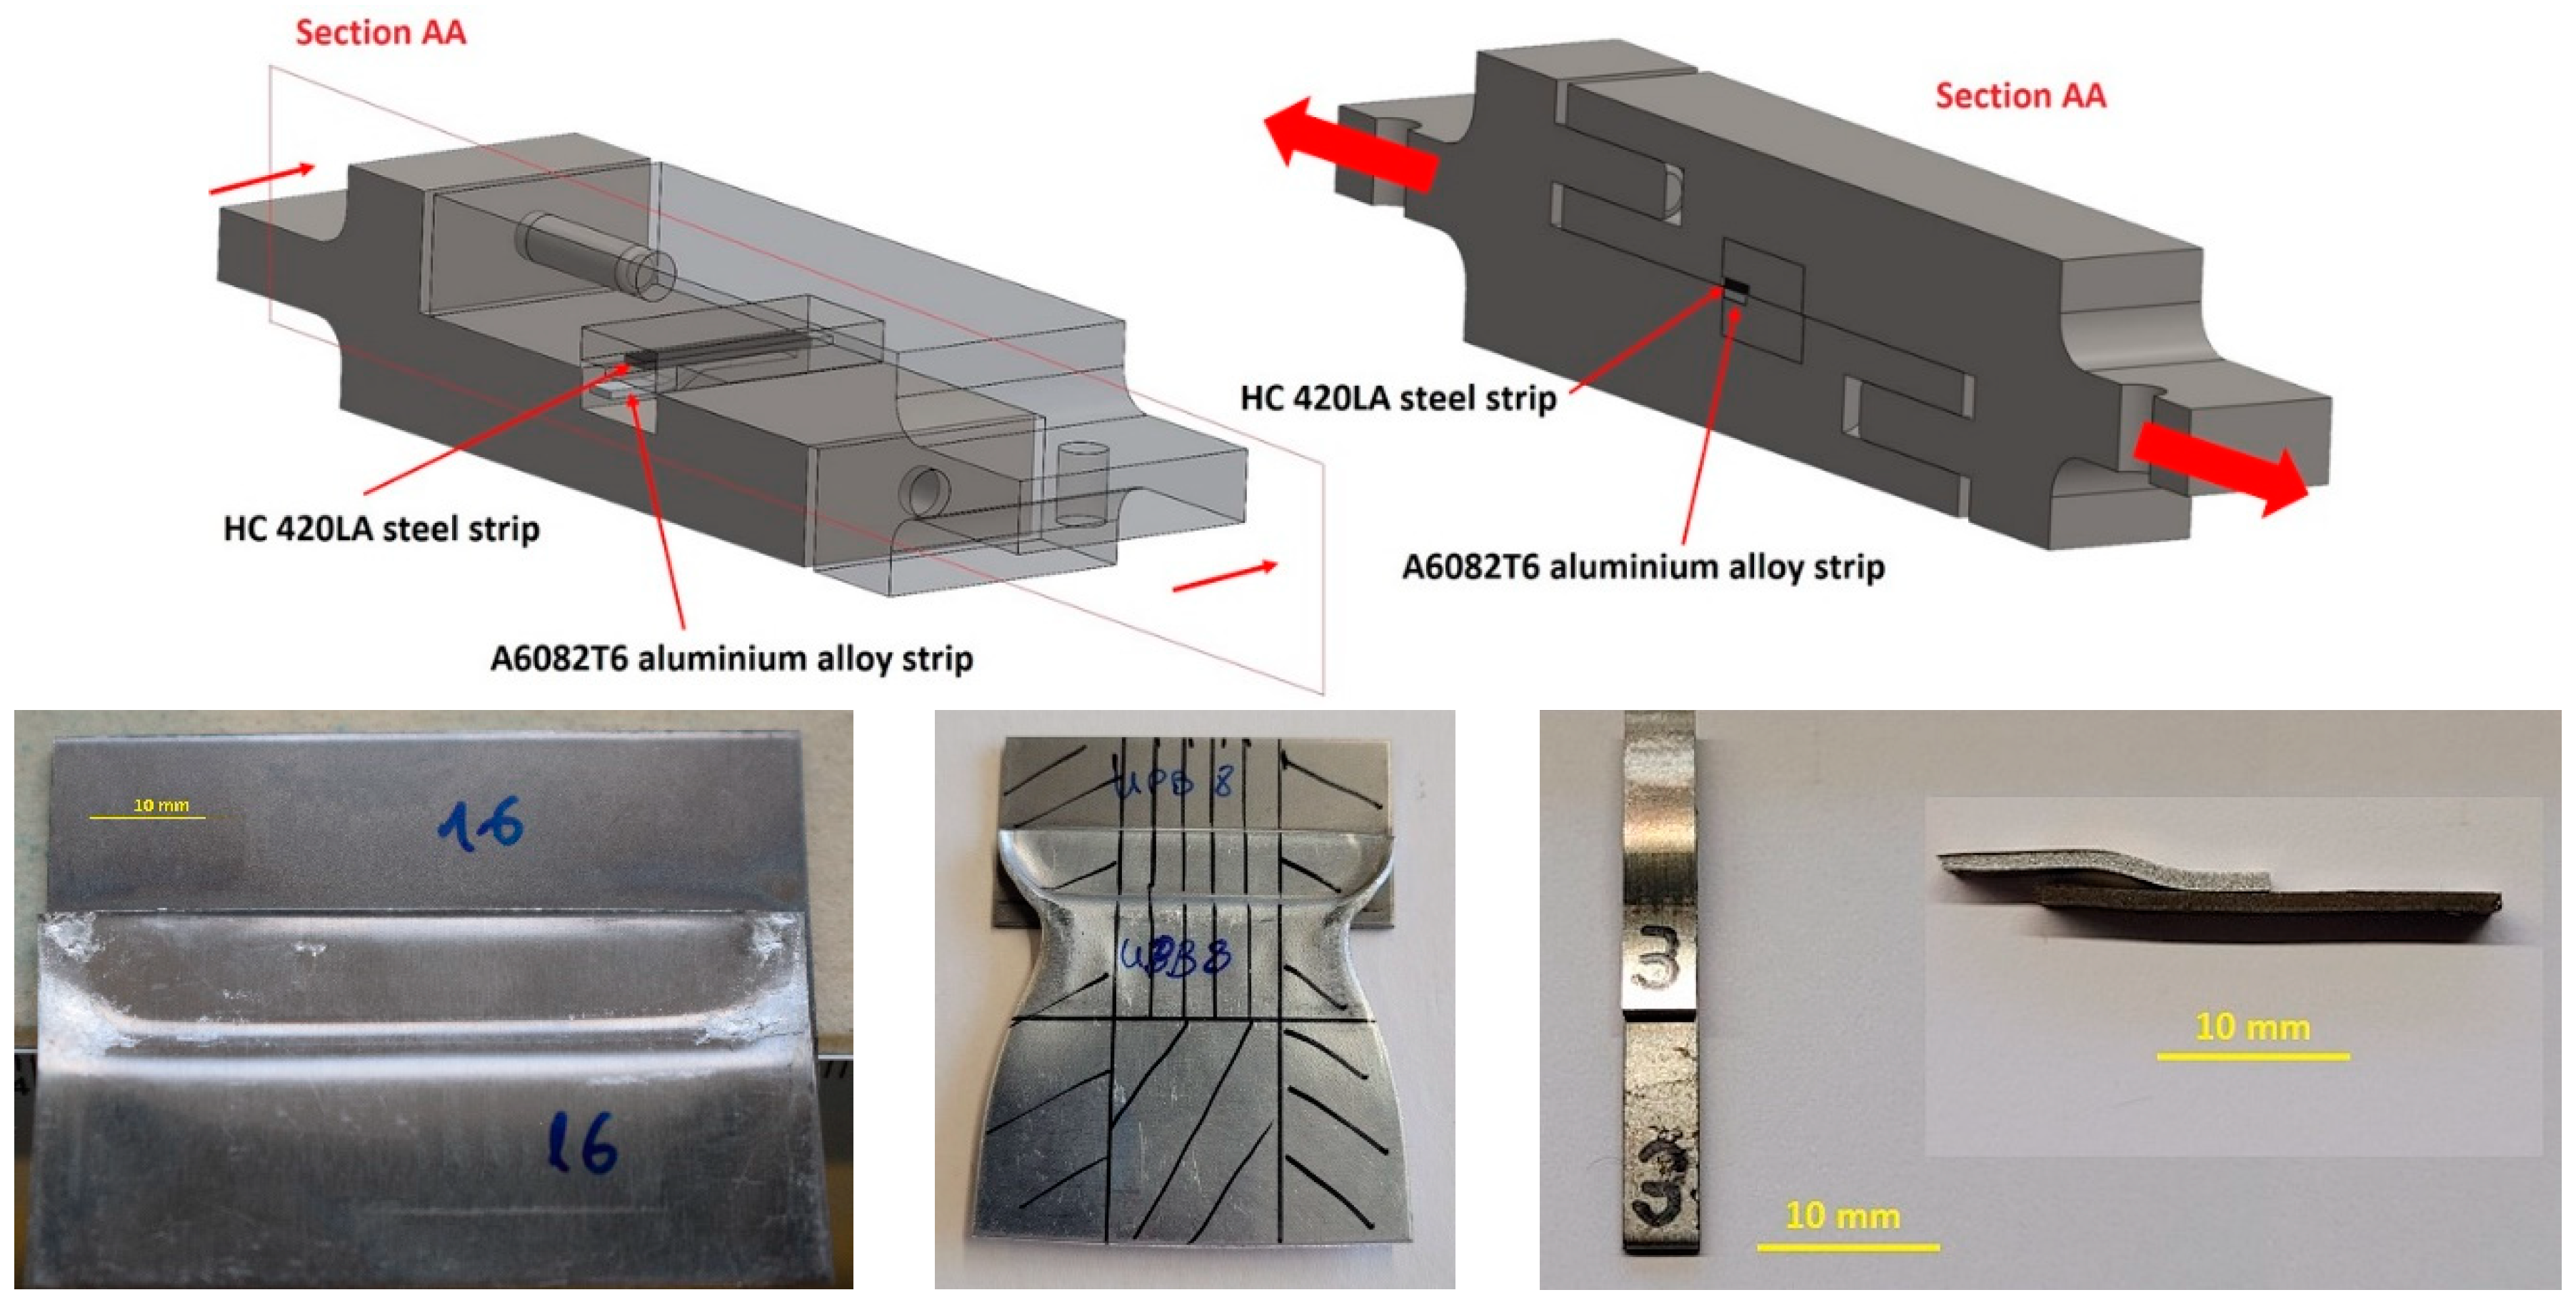
Figure 11.
Process window of MPW for HC420LA-6082 T6 stacks, considering the impact angle and the output voltage or the discharged energy.
Figure 11.
Process window of MPW for HC420LA-6082 T6 stacks, considering the impact angle and the output voltage or the discharged energy.
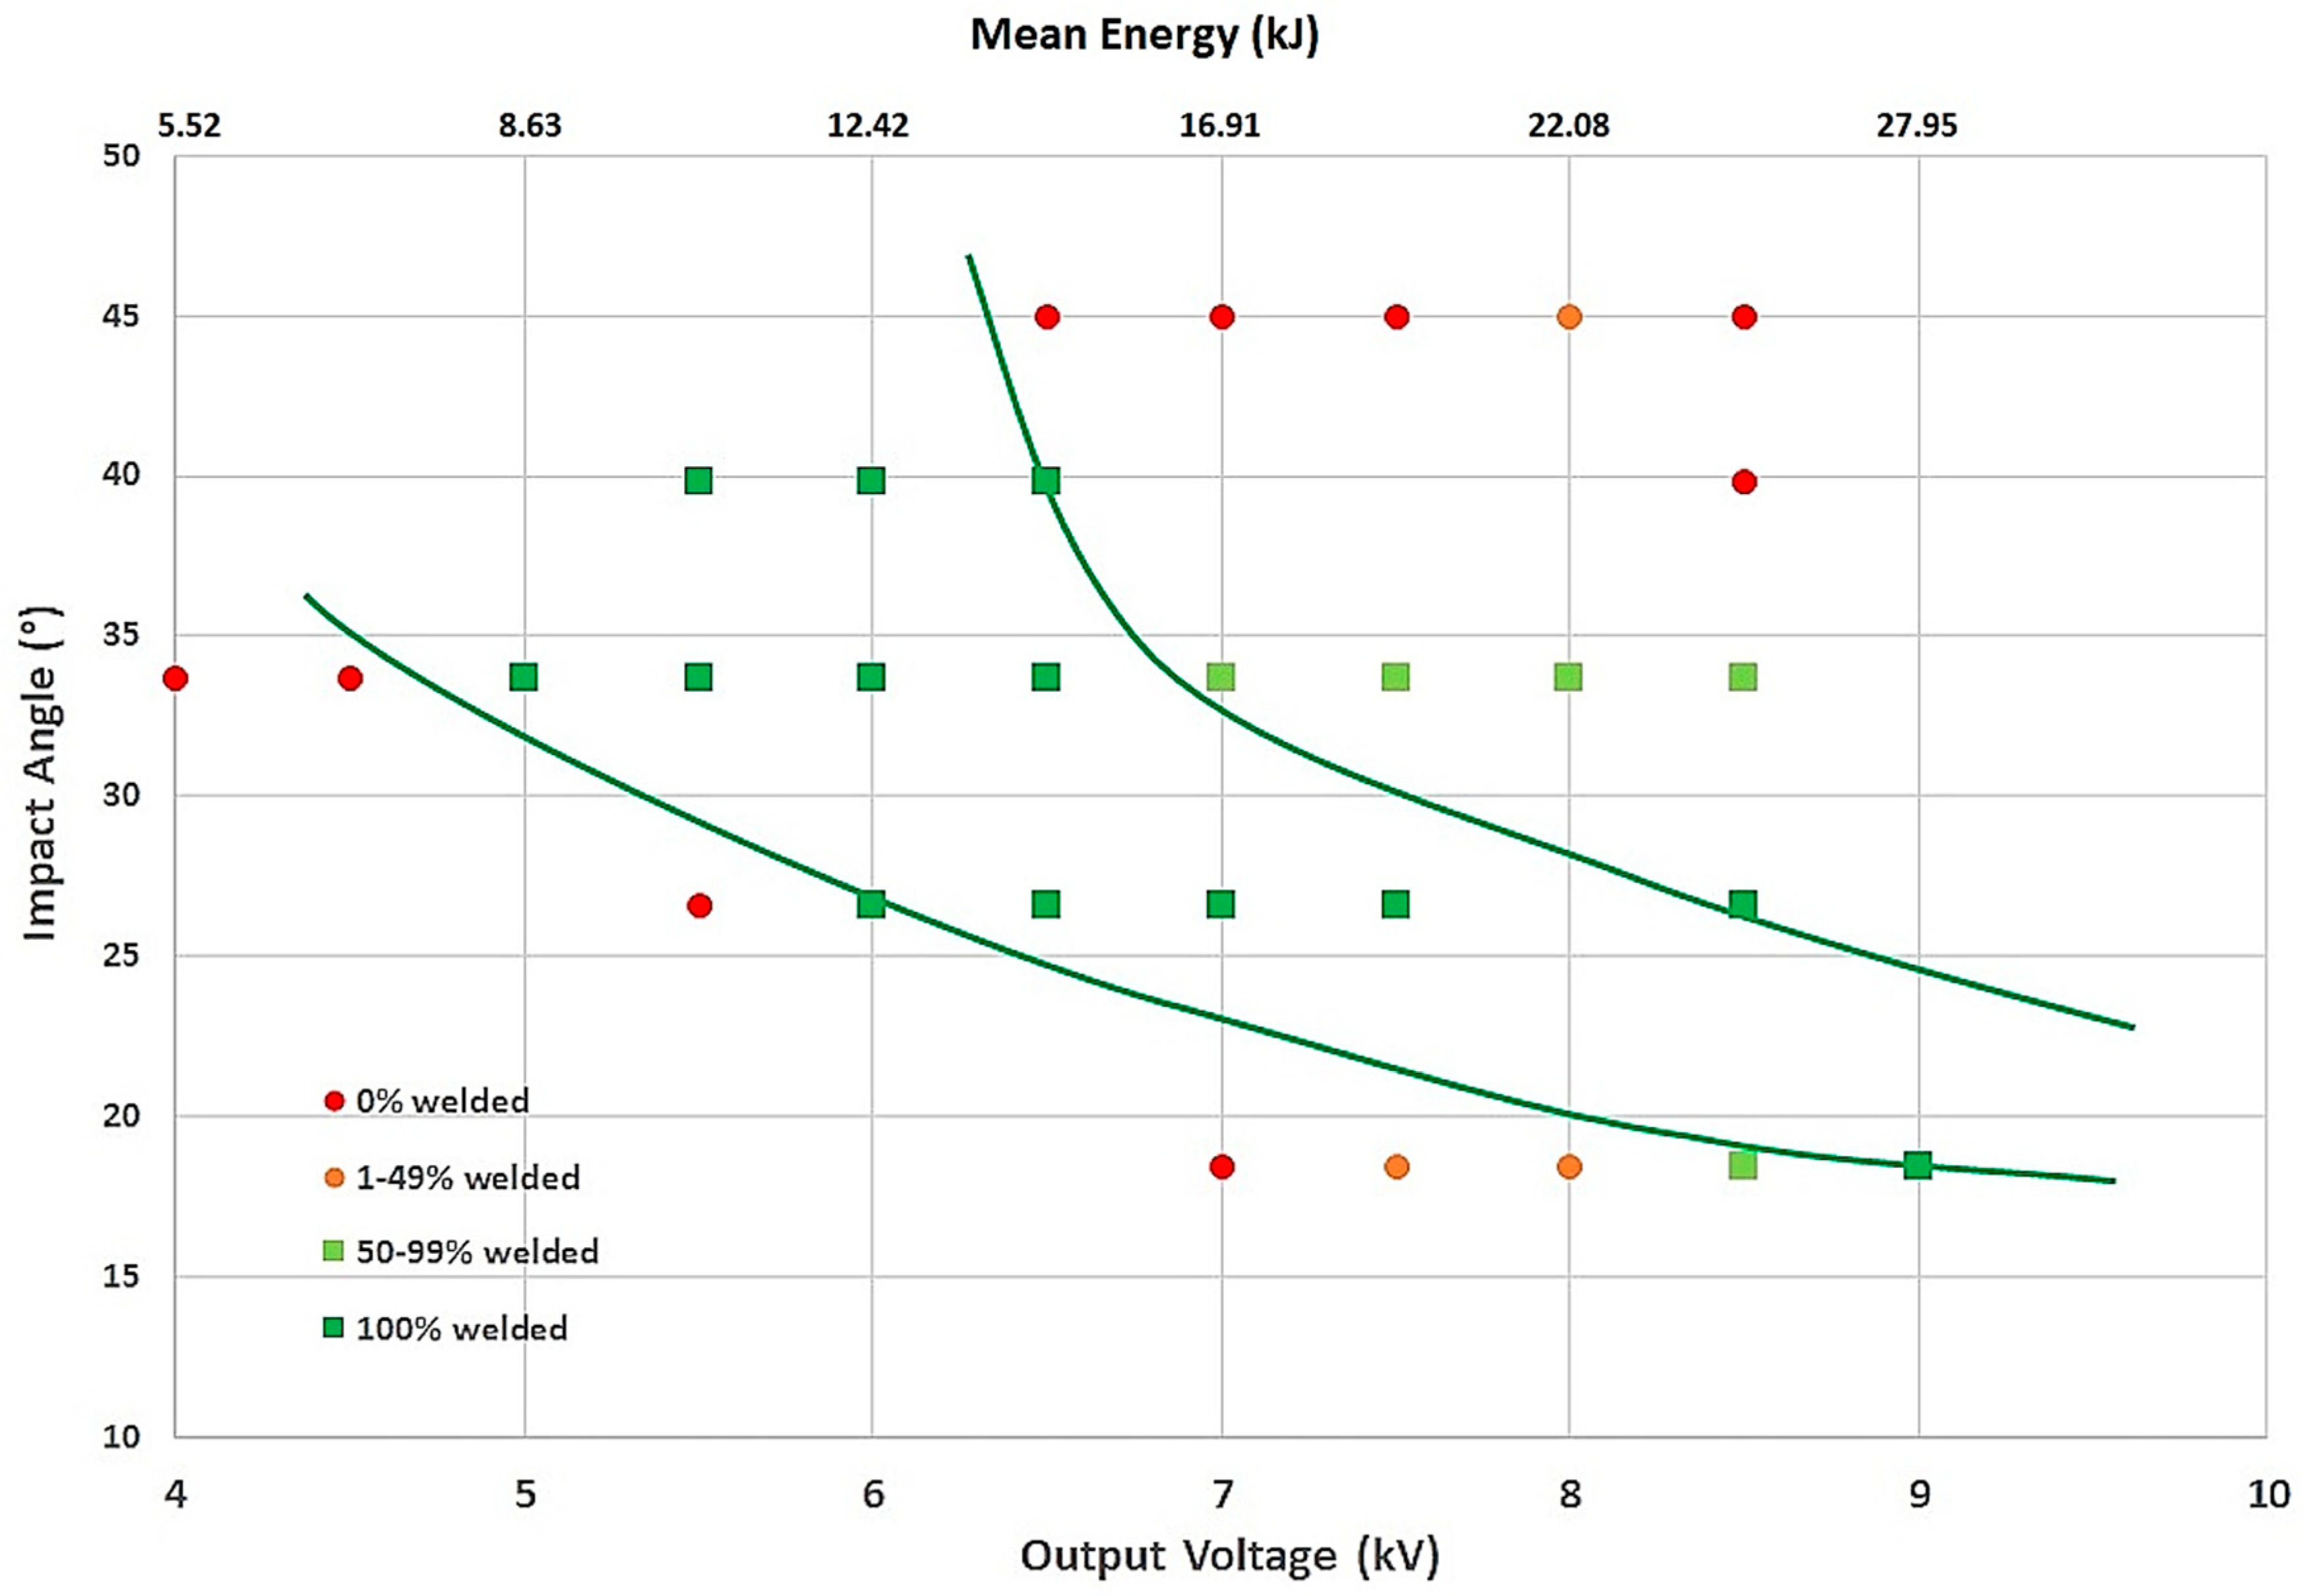
Figure 12.
HC420LA and A6082T6: 3D MPW Process Window (left) with process parameters and (right) isoresponse curves.
Figure 12.
HC420LA and A6082T6: 3D MPW Process Window (left) with process parameters and (right) isoresponse curves.
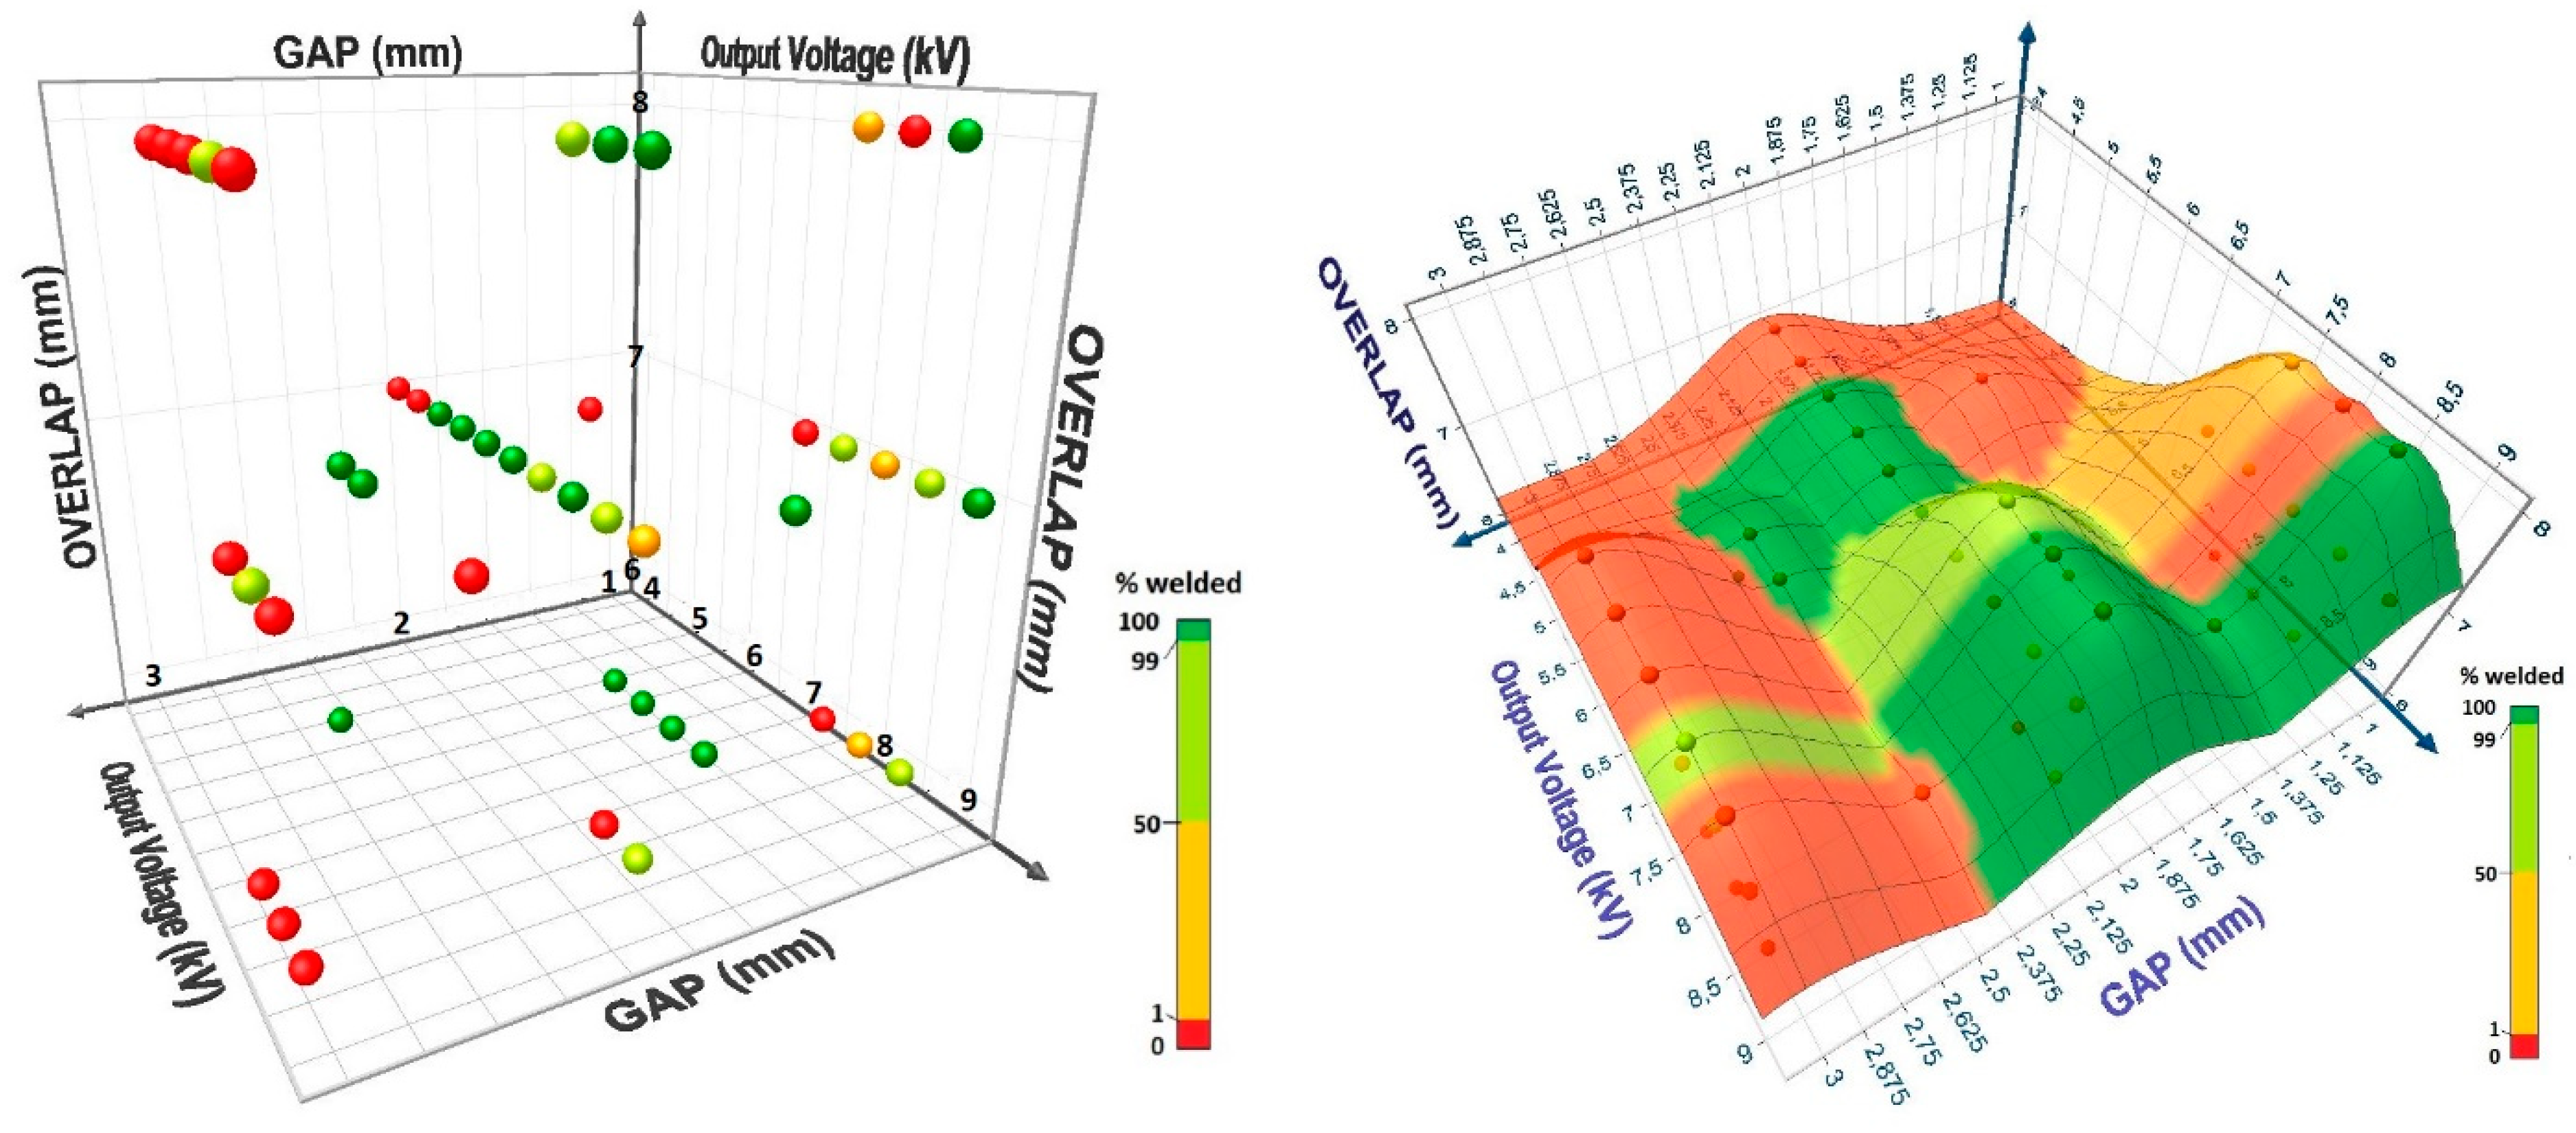
Figure 13.
2D MPW Process Window with impact parameters for HC420LA and A6082T6 stacks.
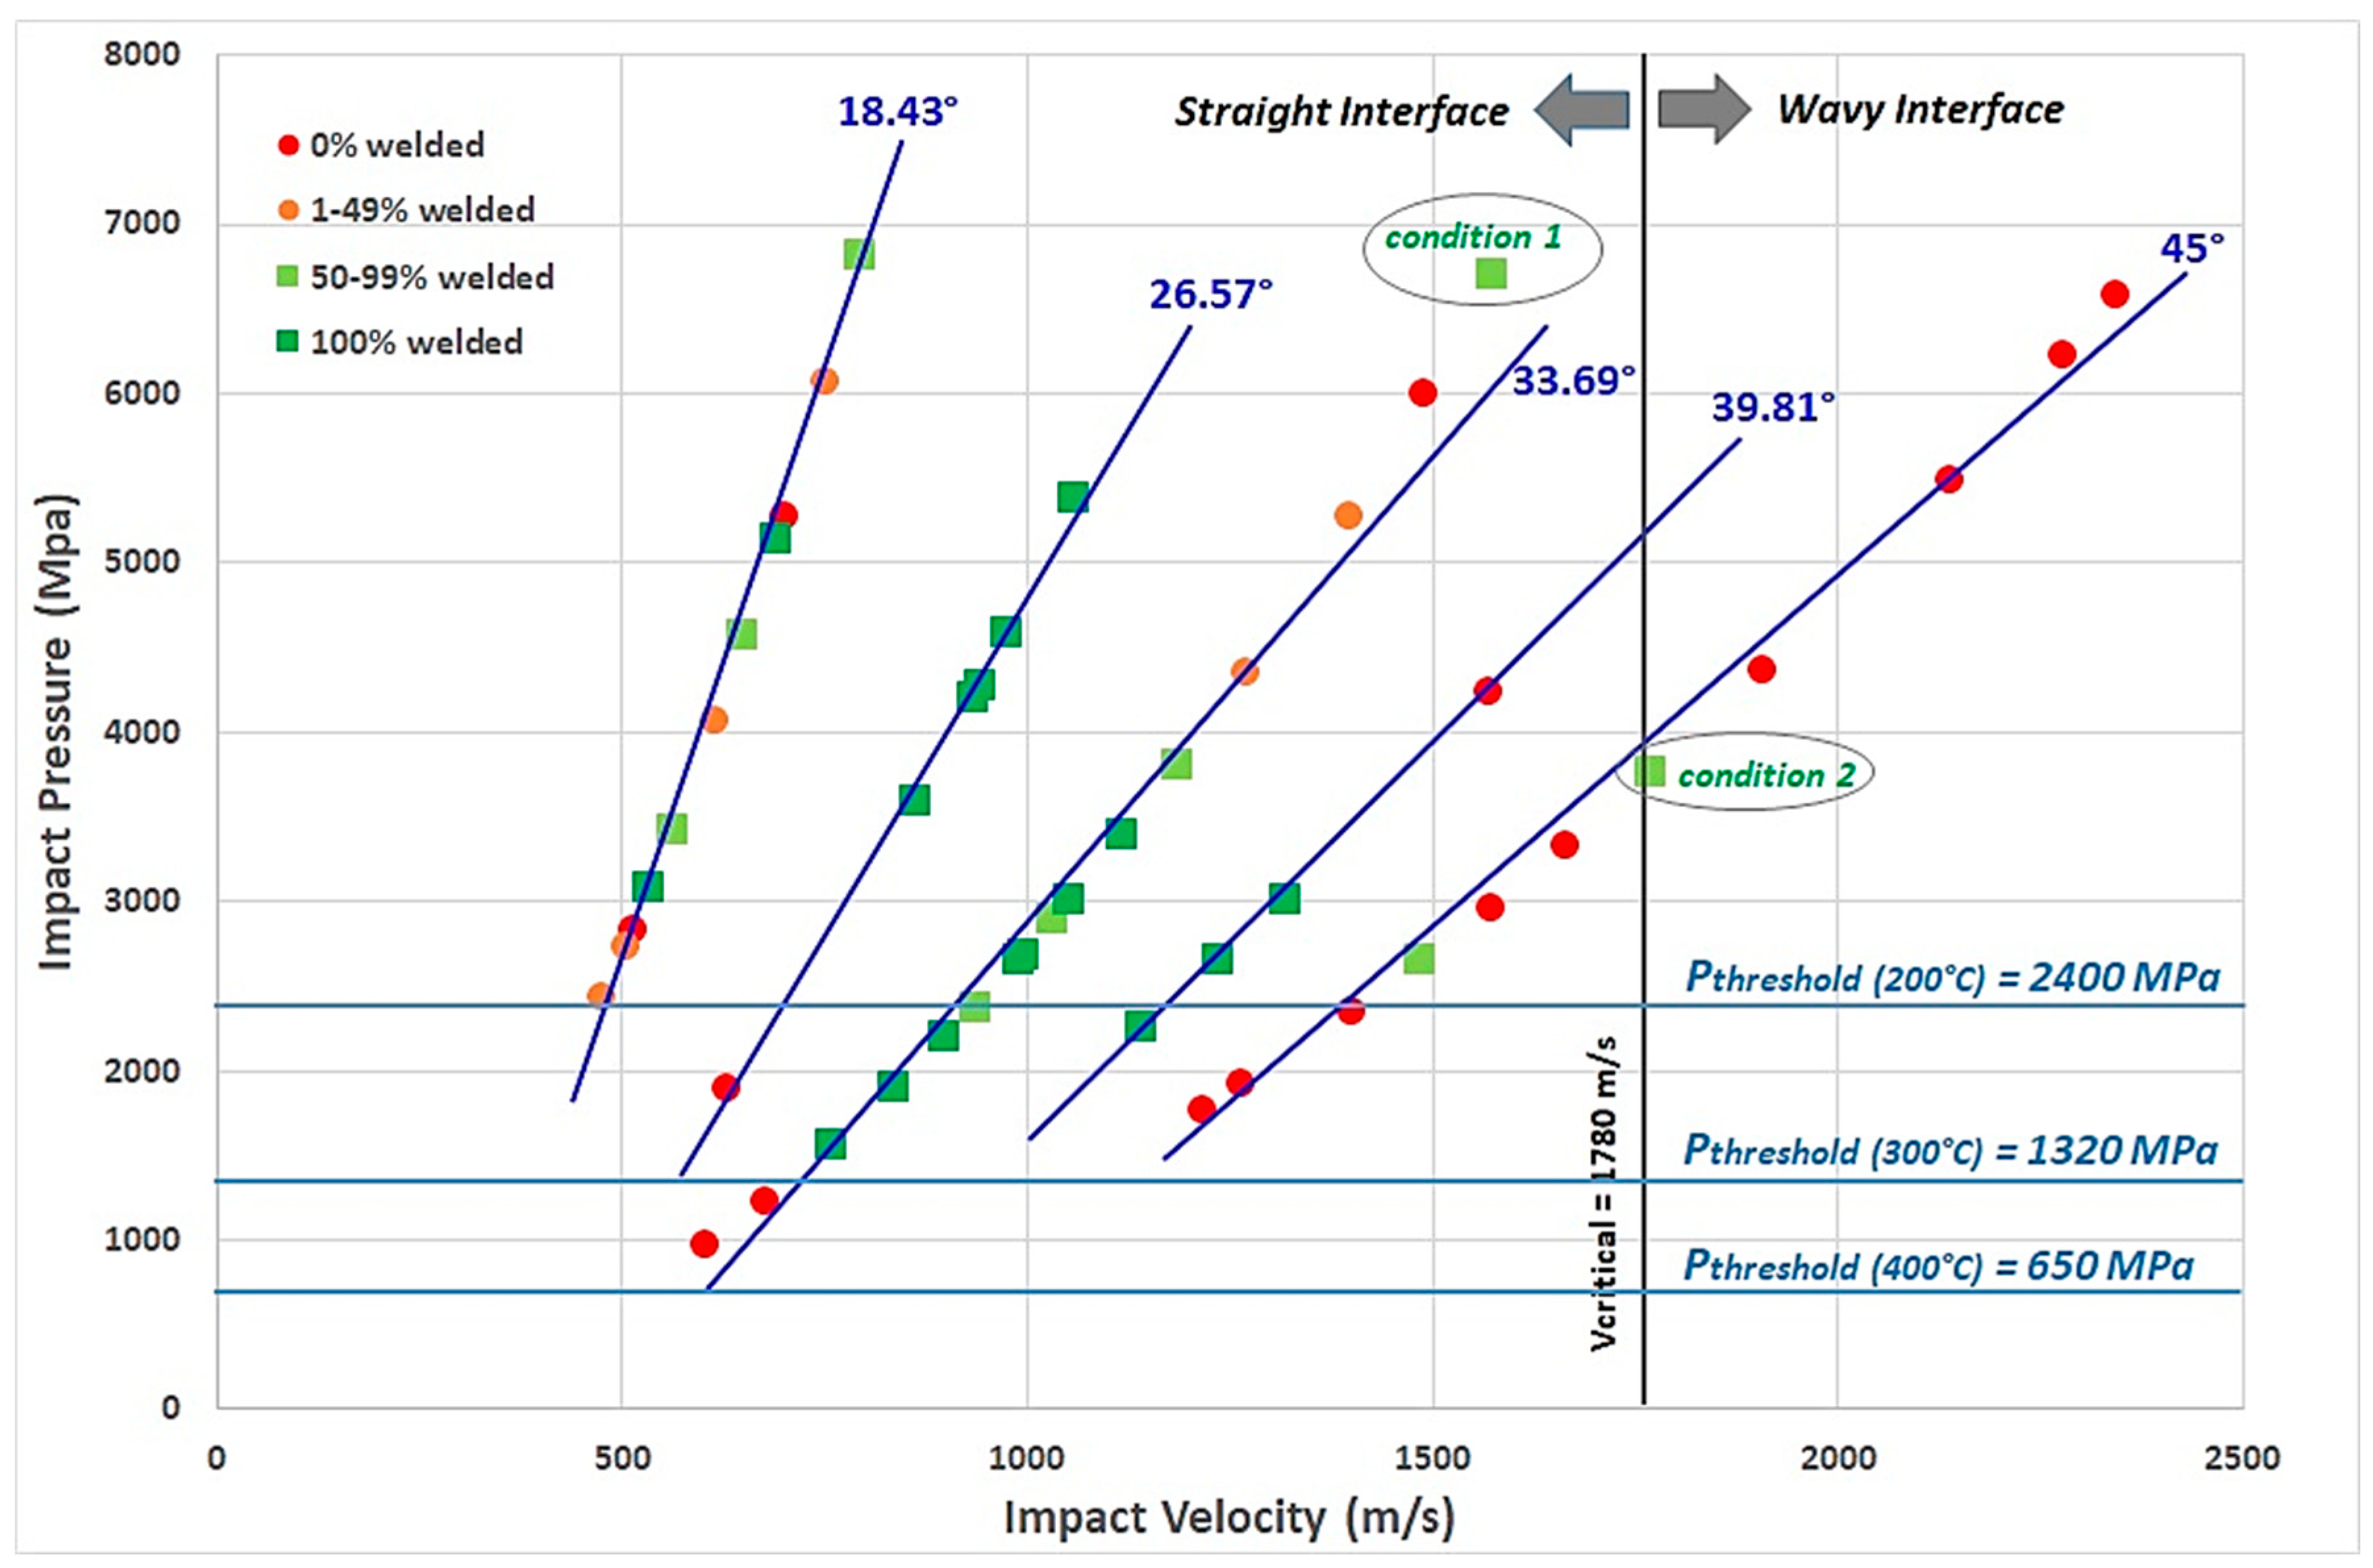
Figure 14.
(left) Straight interface for condition 1; (right) Wavy interface for condition 2.
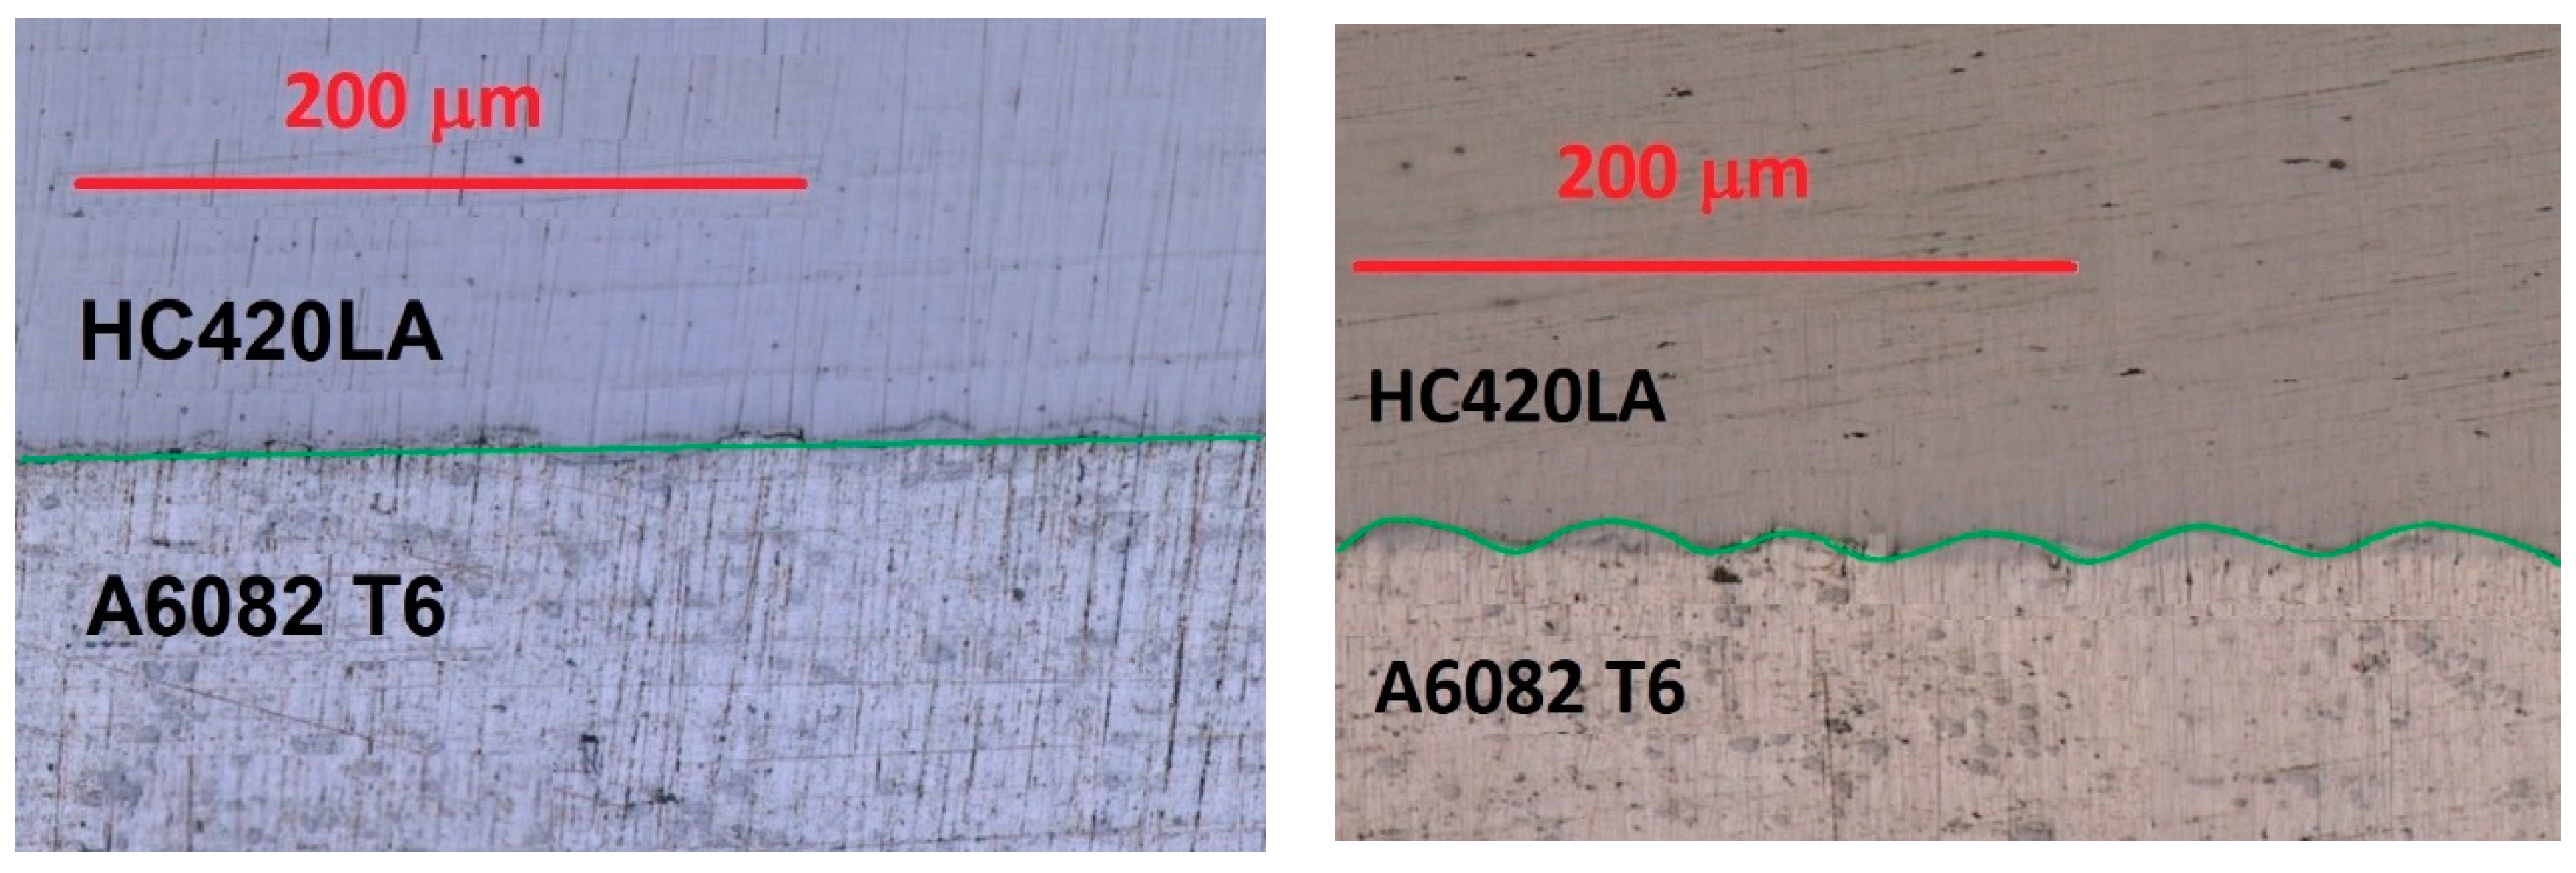
Figure 15.
HC420LA and A6082T6: 3D MPW Process Window: (left) with impact parameters and (right) isoresponse curves.
Figure 15.
HC420LA and A6082T6: 3D MPW Process Window: (left) with impact parameters and (right) isoresponse curves.
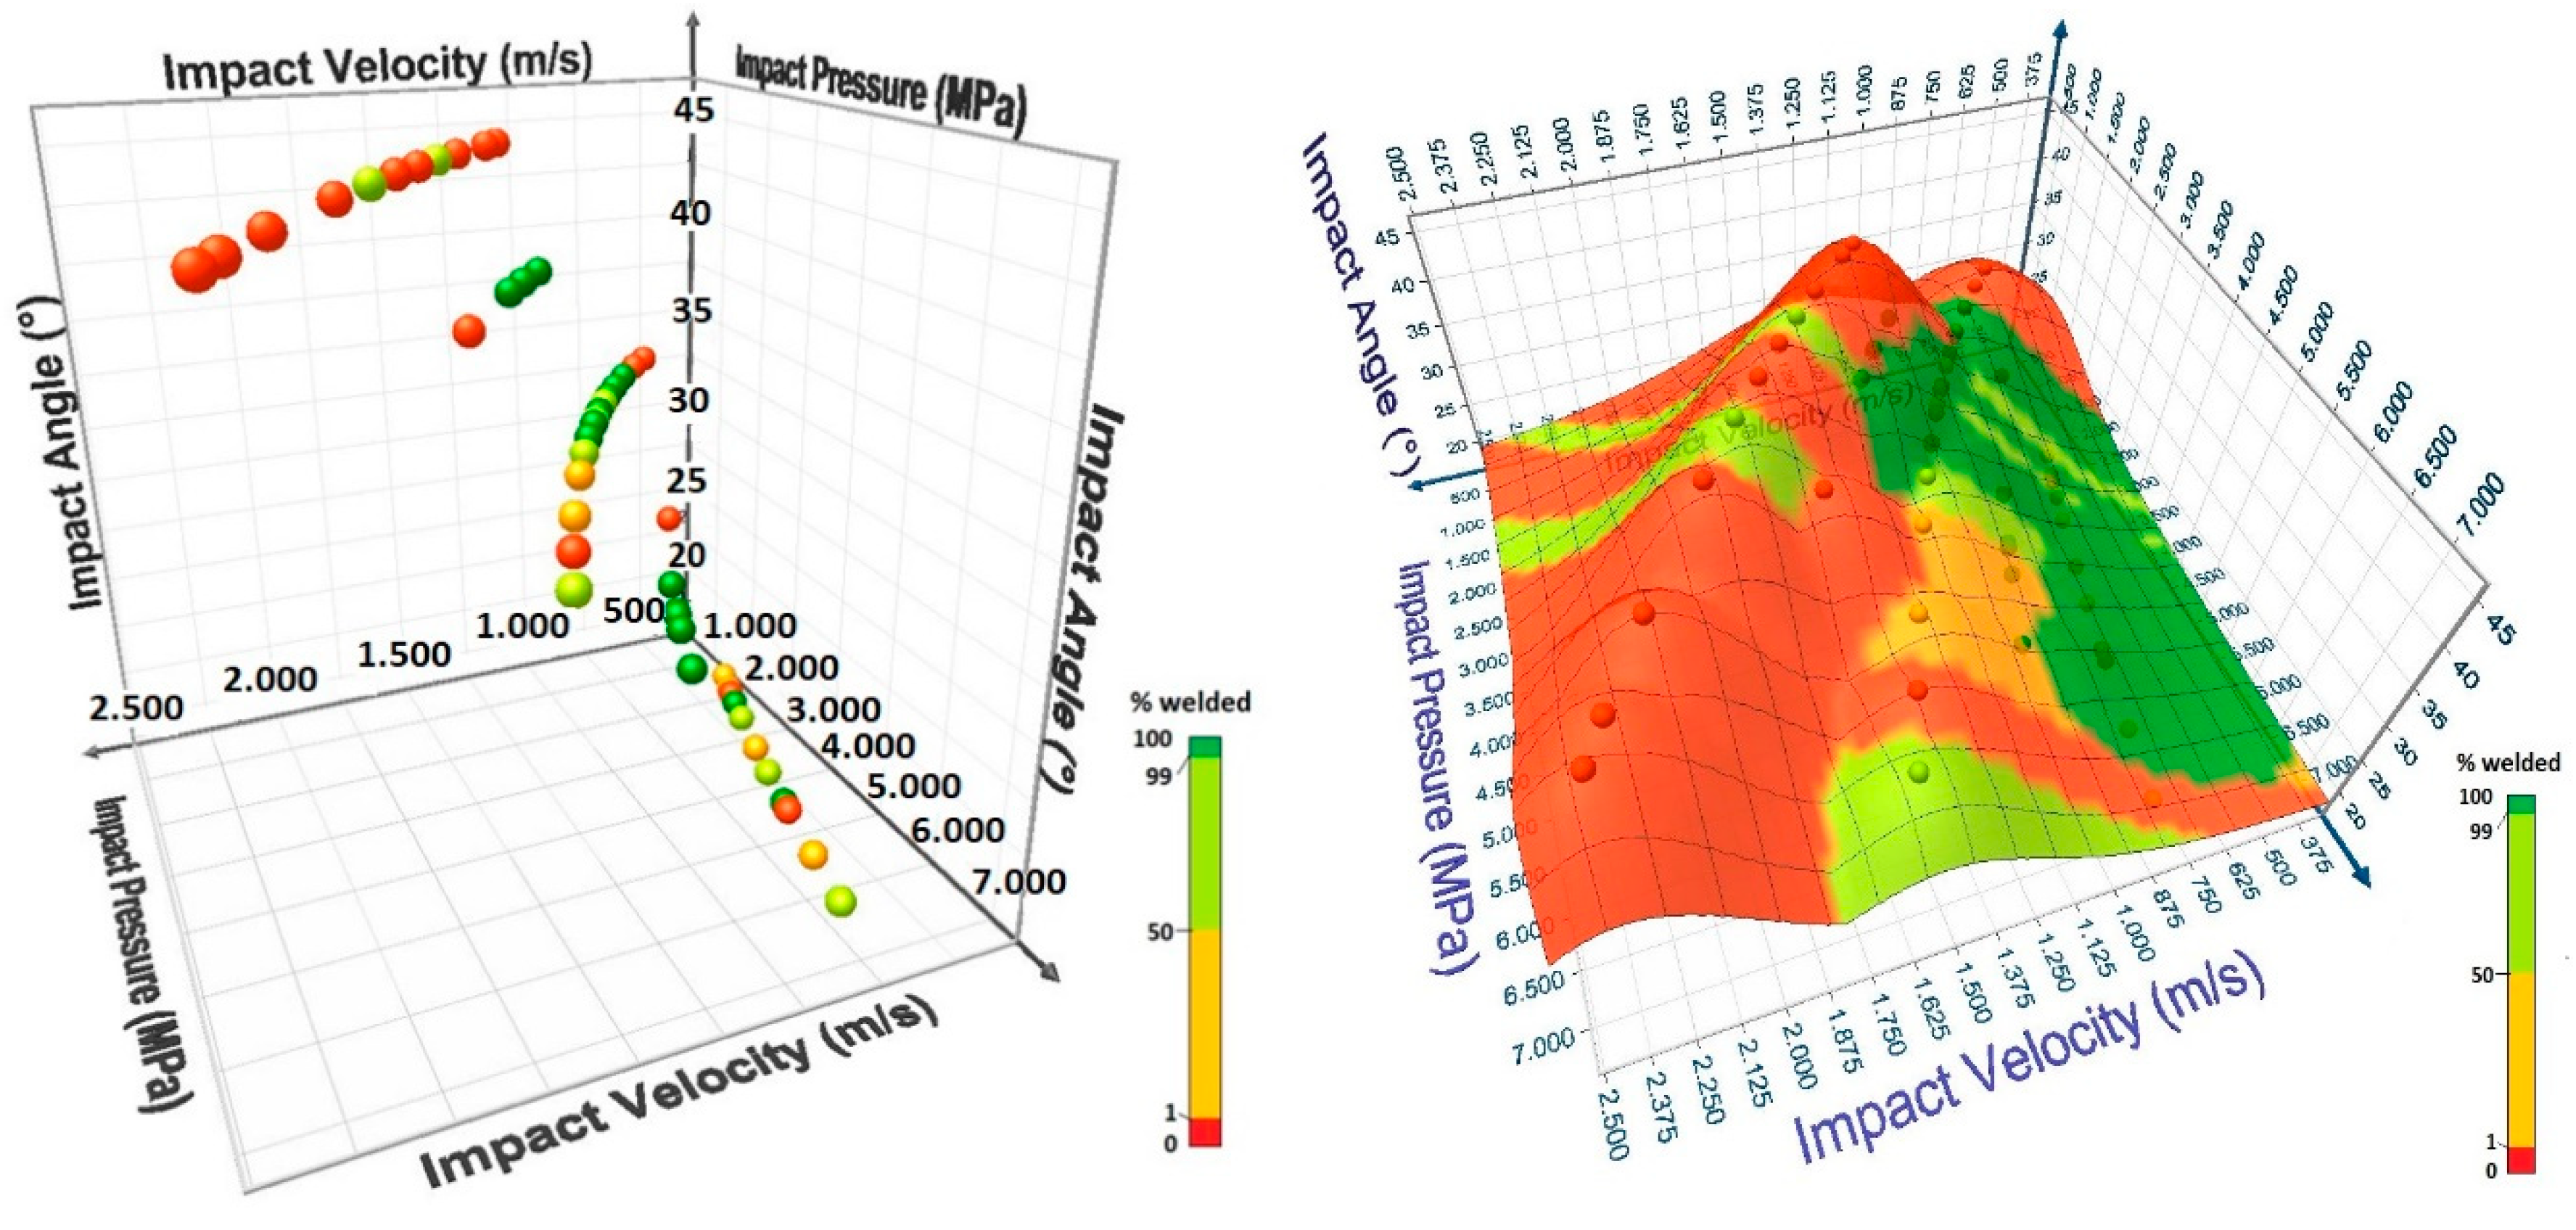
Figure 16.
Welding window with welding specific energy isovalues in process parameter conditions (Impact Angle versus Output Voltage).
Figure 16.
Welding window with welding specific energy isovalues in process parameter conditions (Impact Angle versus Output Voltage).
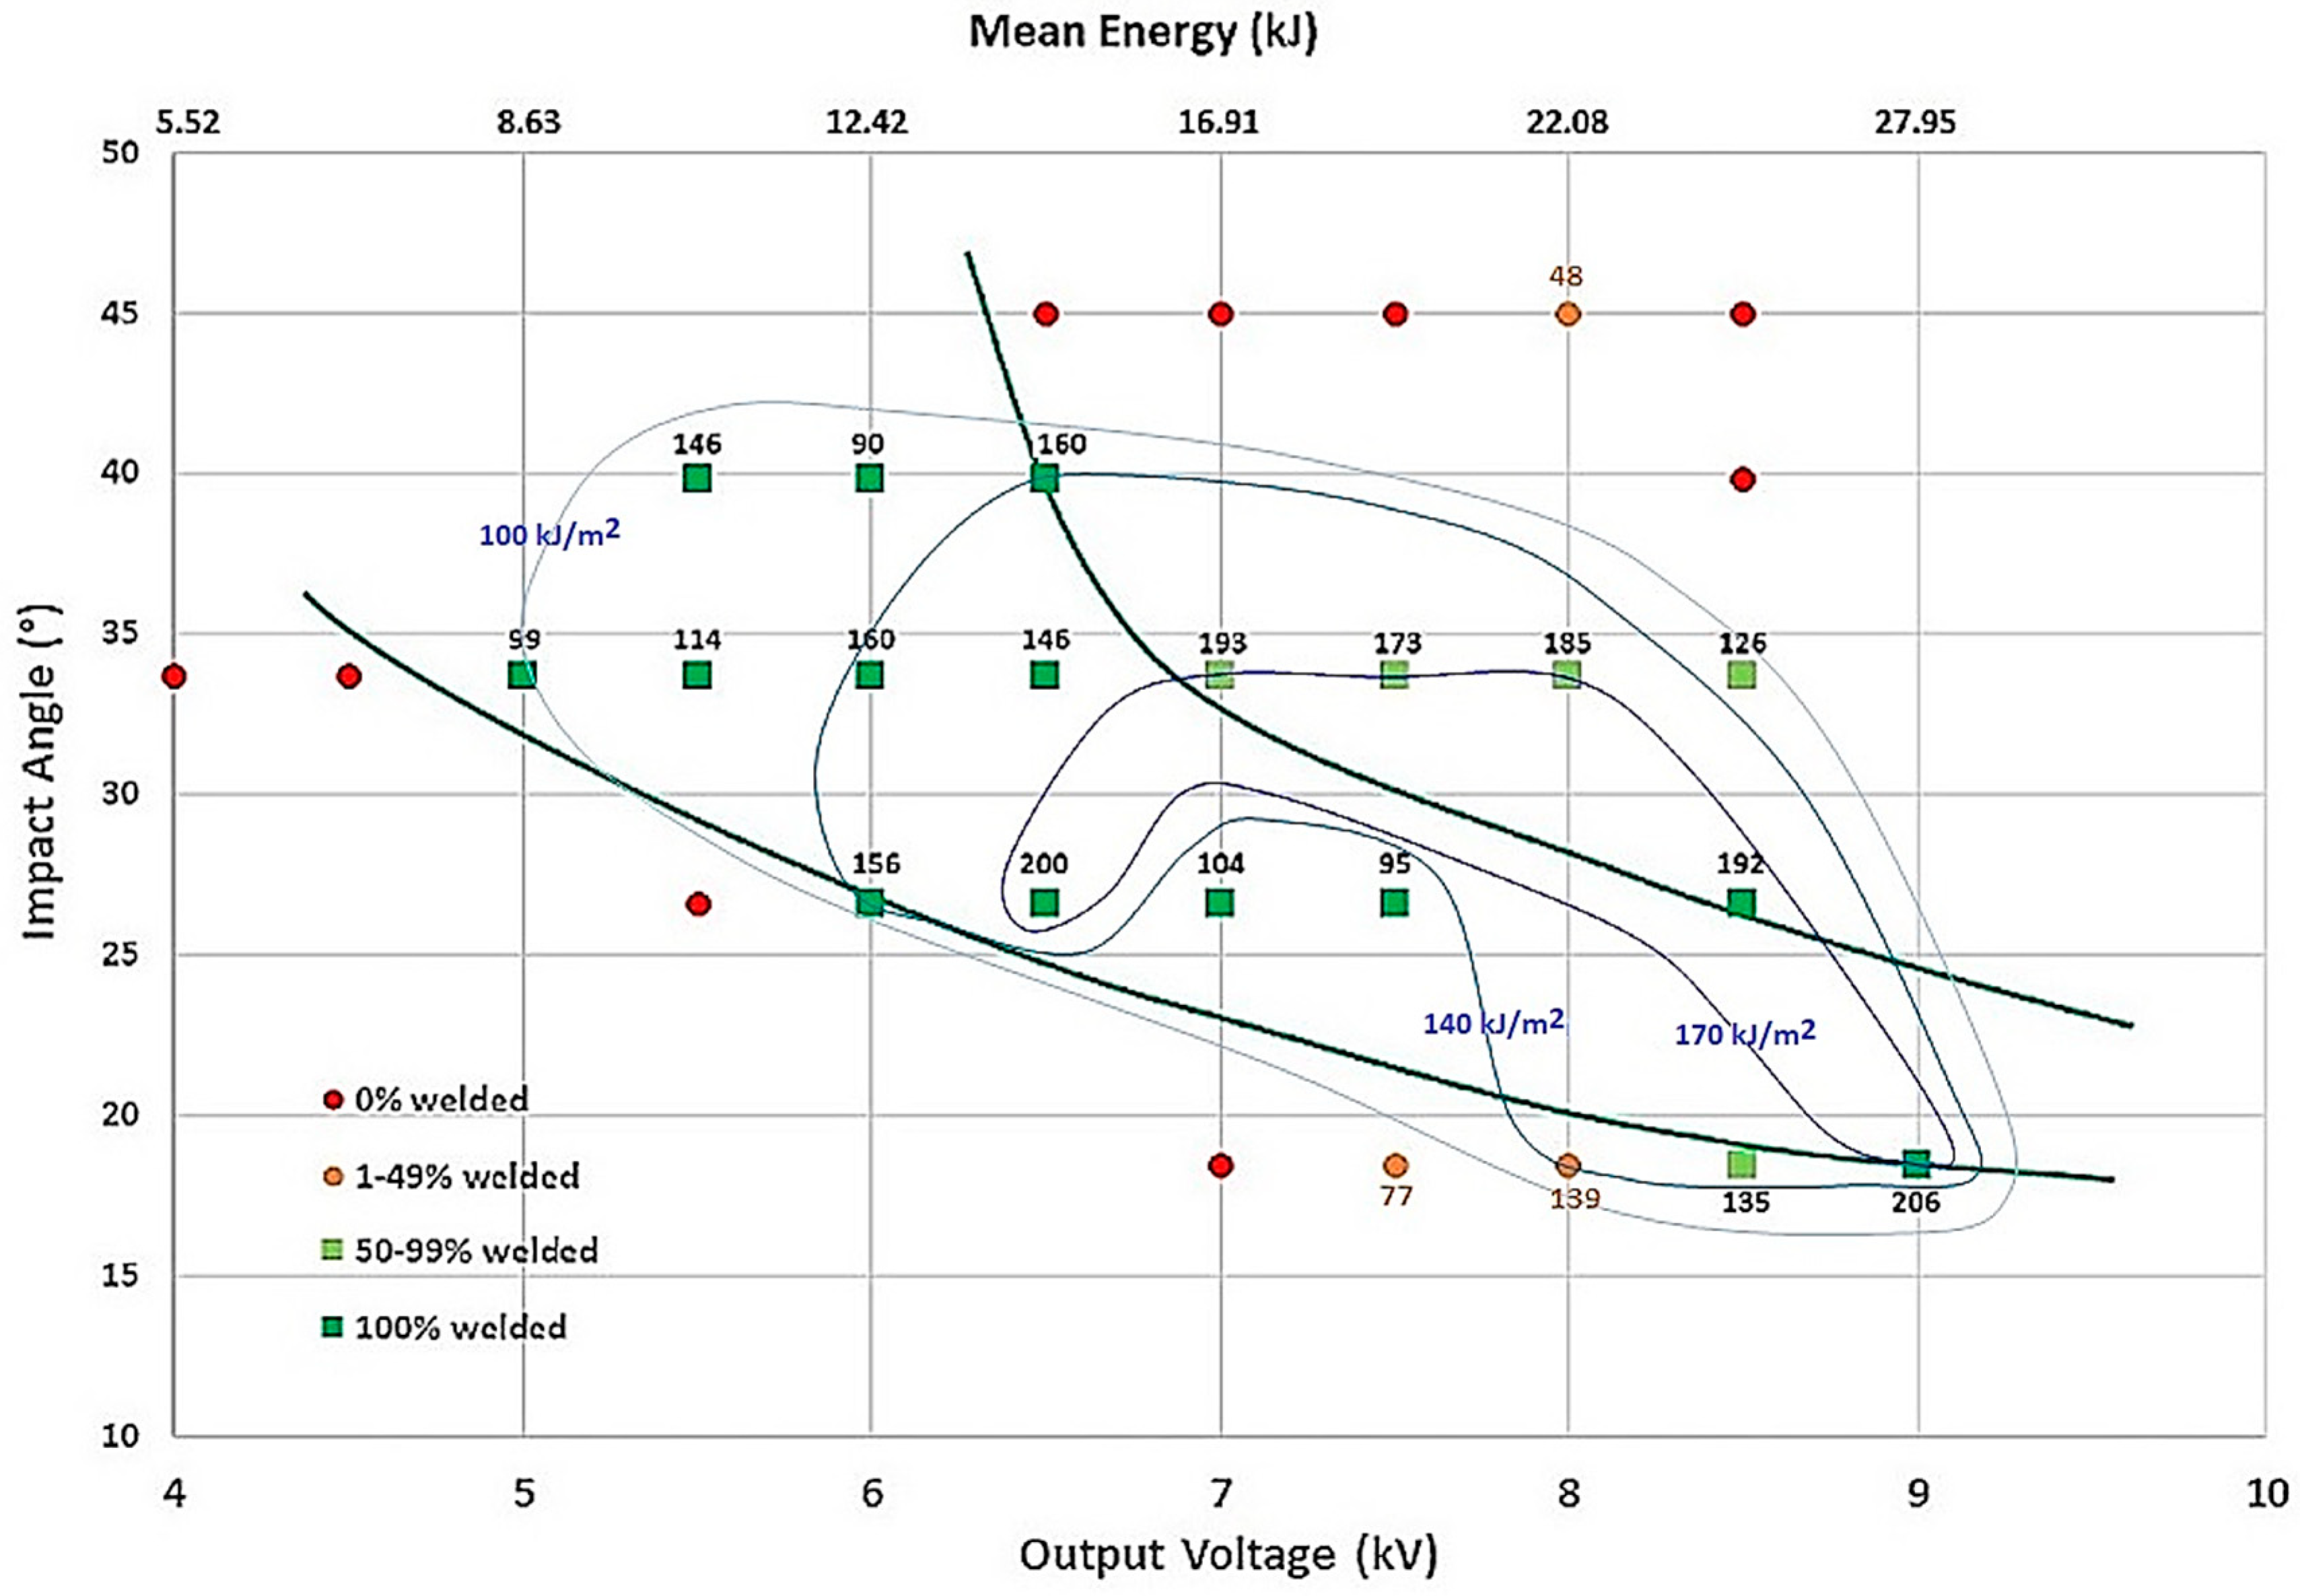
Figure 17.
Welding window with welding specific energy isovalues in physical process parameters (Impact Pressure versus Impact Velocity with Impact Angle).
Figure 17.
Welding window with welding specific energy isovalues in physical process parameters (Impact Pressure versus Impact Velocity with Impact Angle).
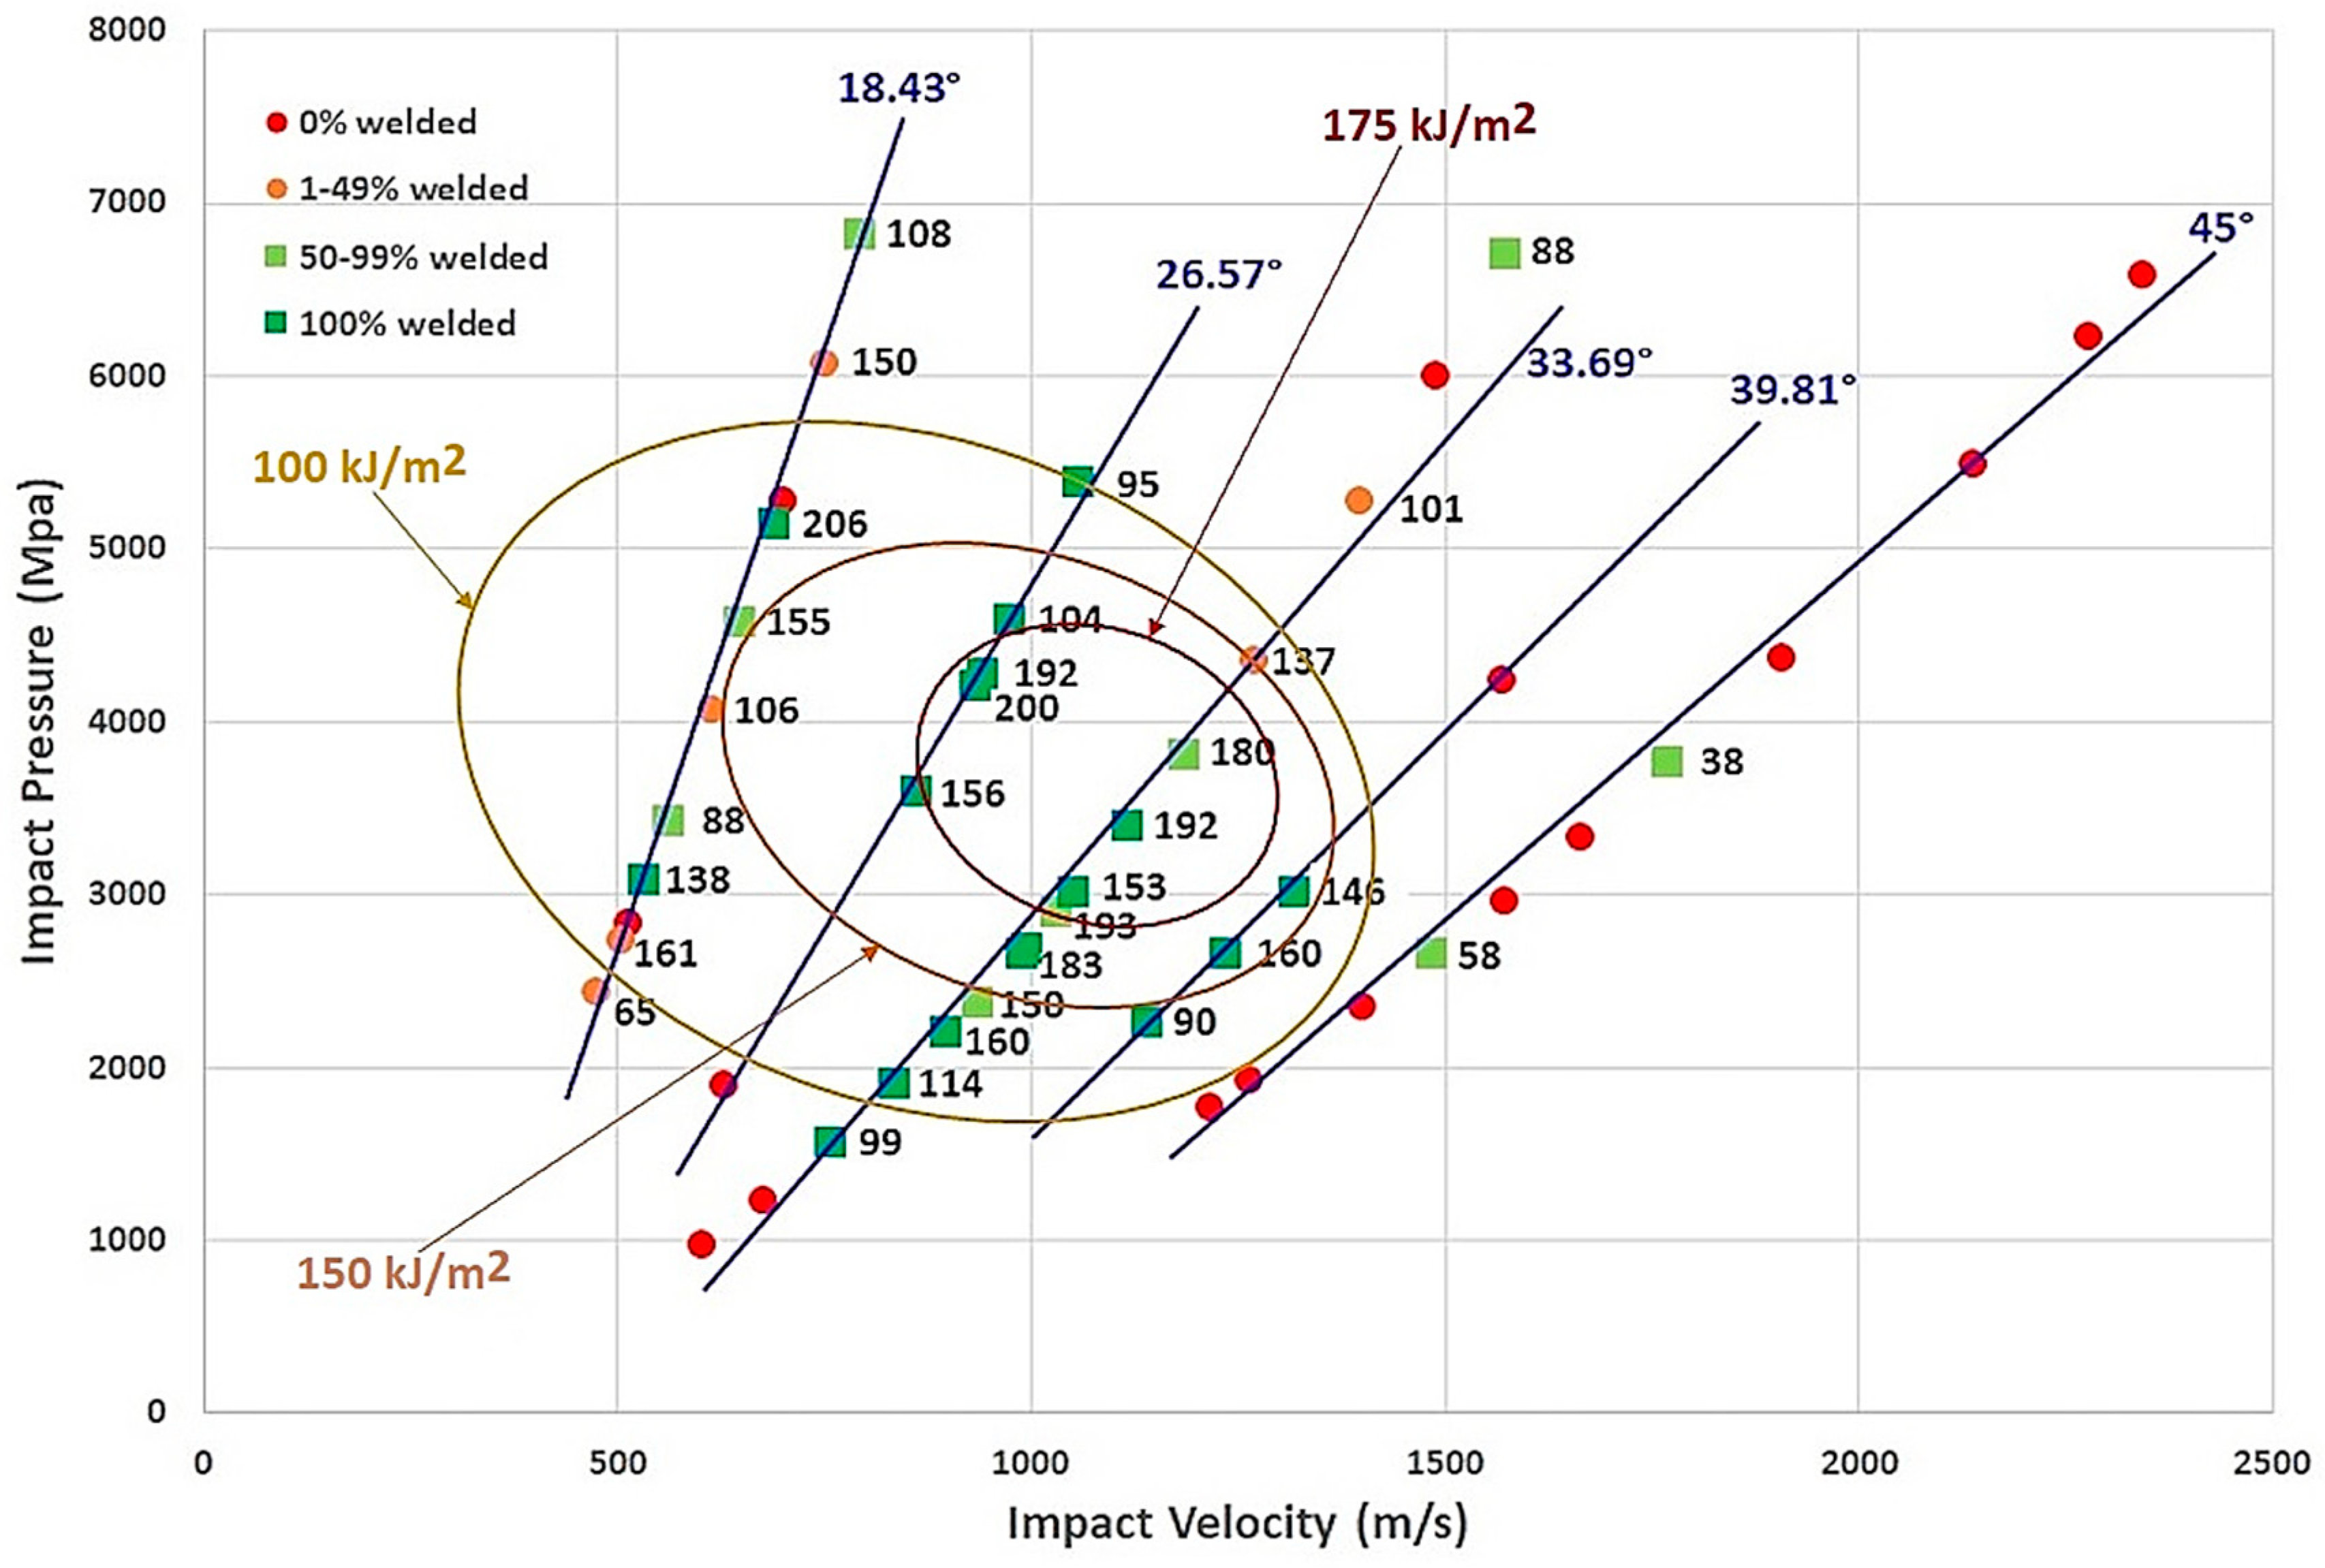
Figure 18.
3D views of weld specific energy isovalues for process parameters (left) and physical process parameters (right).
Figure 18.
3D views of weld specific energy isovalues for process parameters (left) and physical process parameters (right).
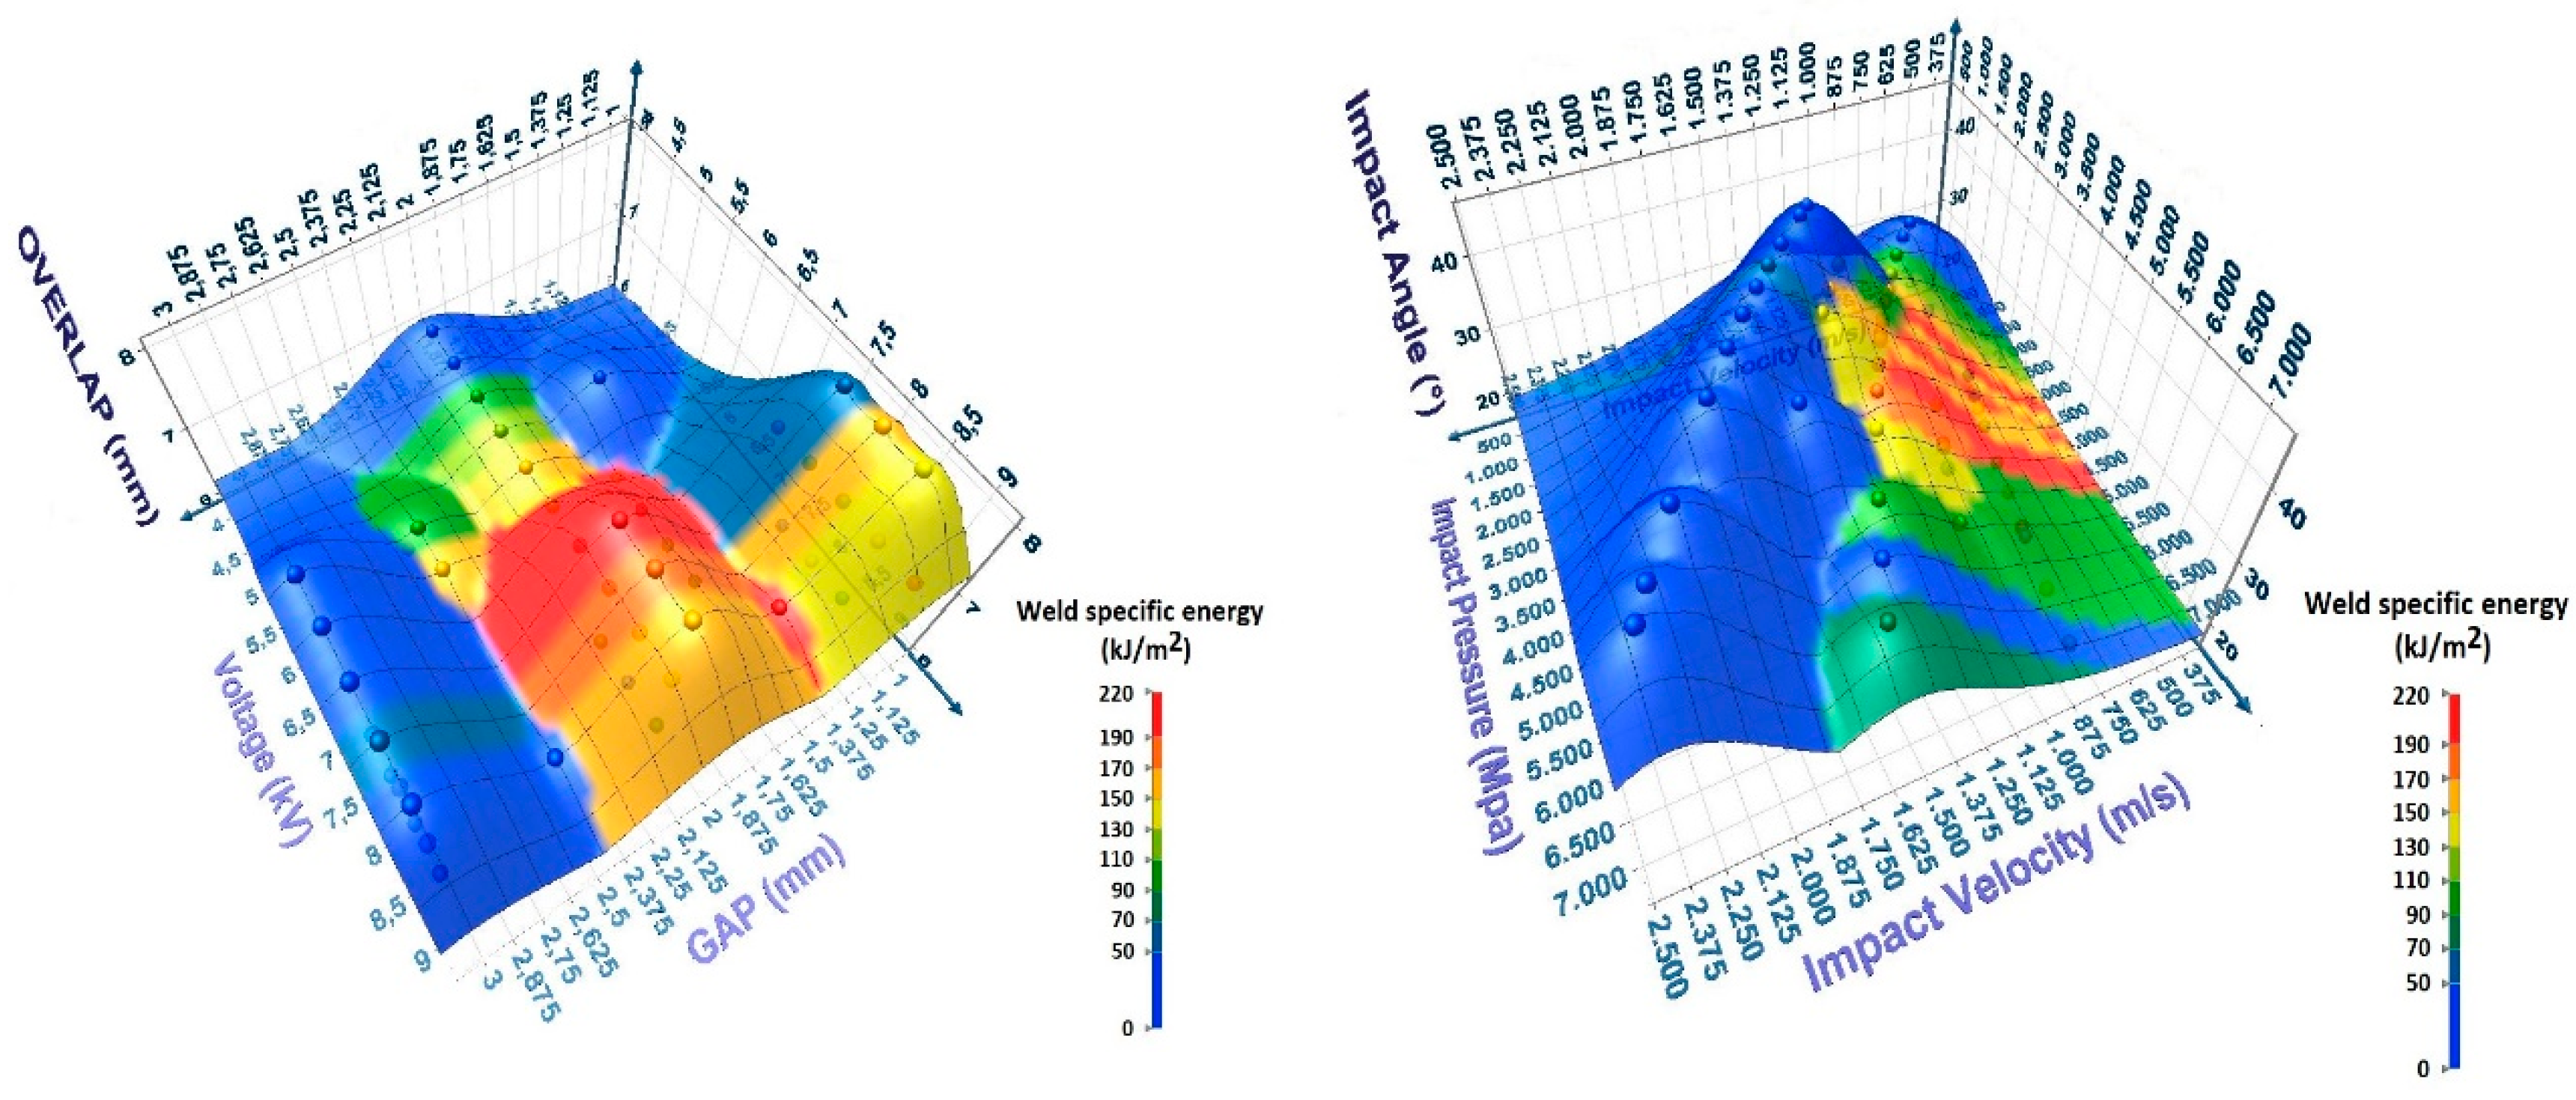
Figure 19.
Weld specific energy dependence with IMCs level.
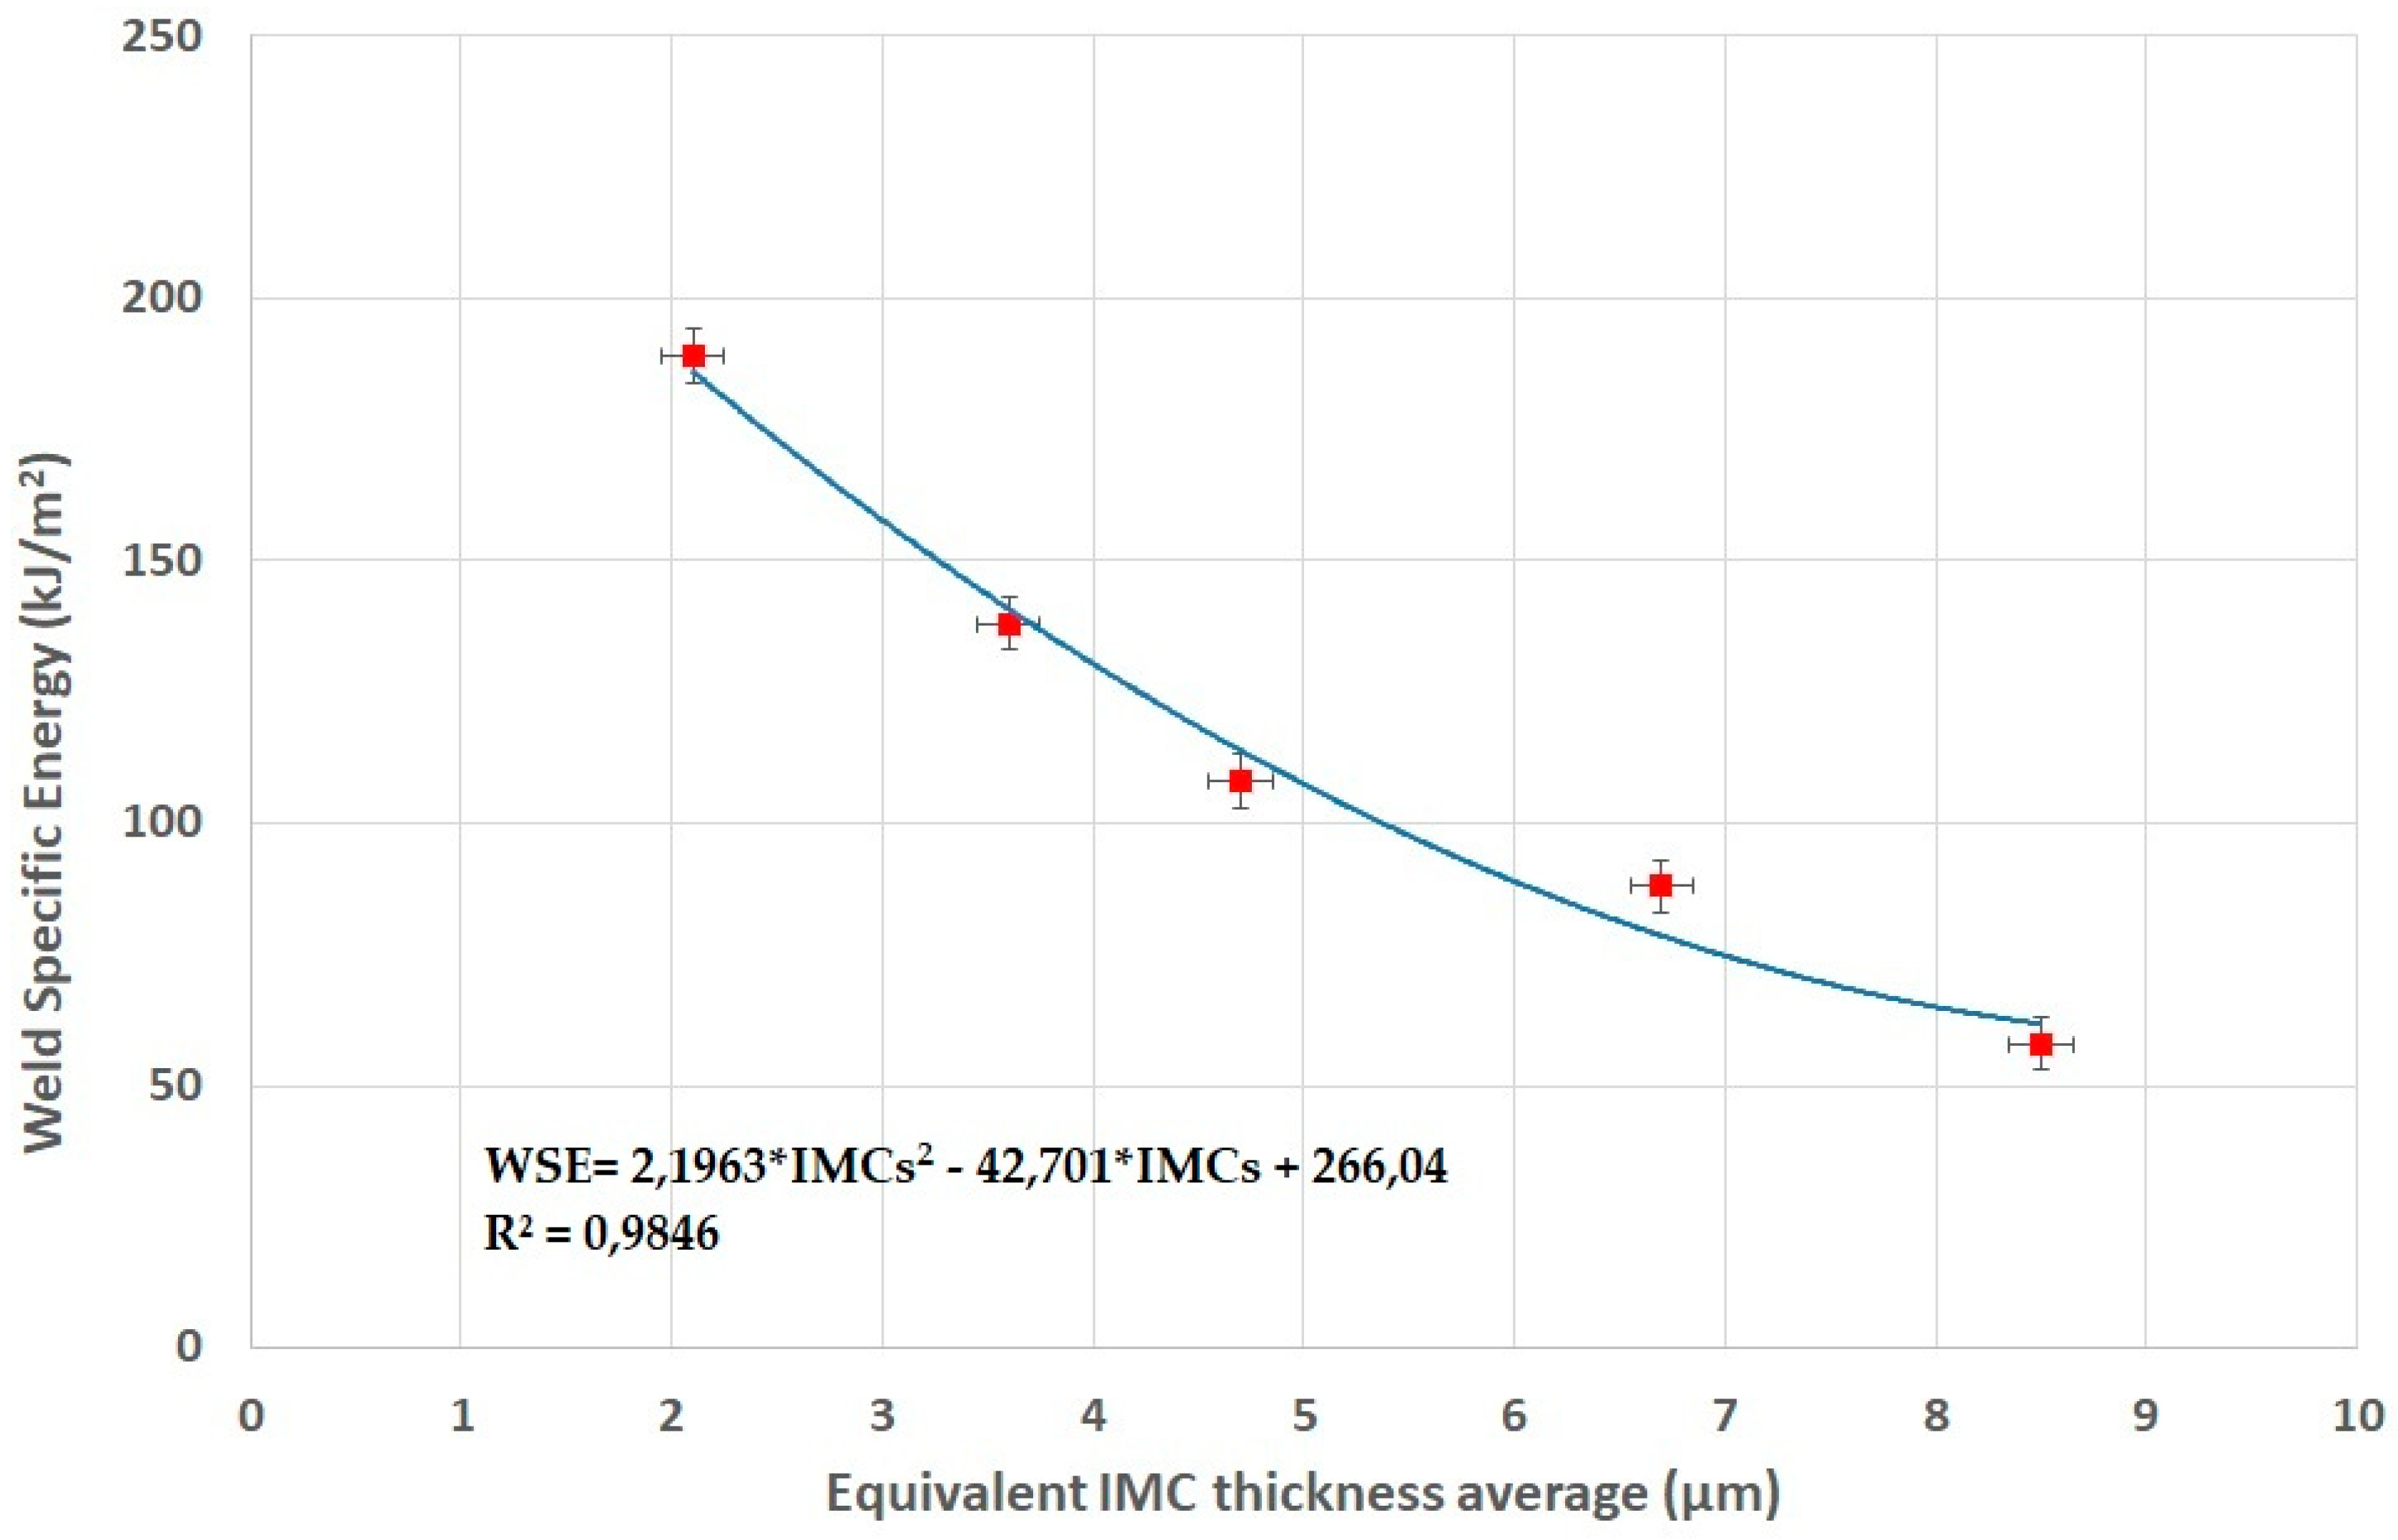
Figure 20.
(left) Dependence of IMCs content with Impact angle (red) and Output Voltage (blue). (Right) ) Dependence of IMCs content with Impact velocity (red) and Impact pressure (blue).
Figure 20.
(left) Dependence of IMCs content with Impact angle (red) and Output Voltage (blue). (Right) ) Dependence of IMCs content with Impact velocity (red) and Impact pressure (blue).
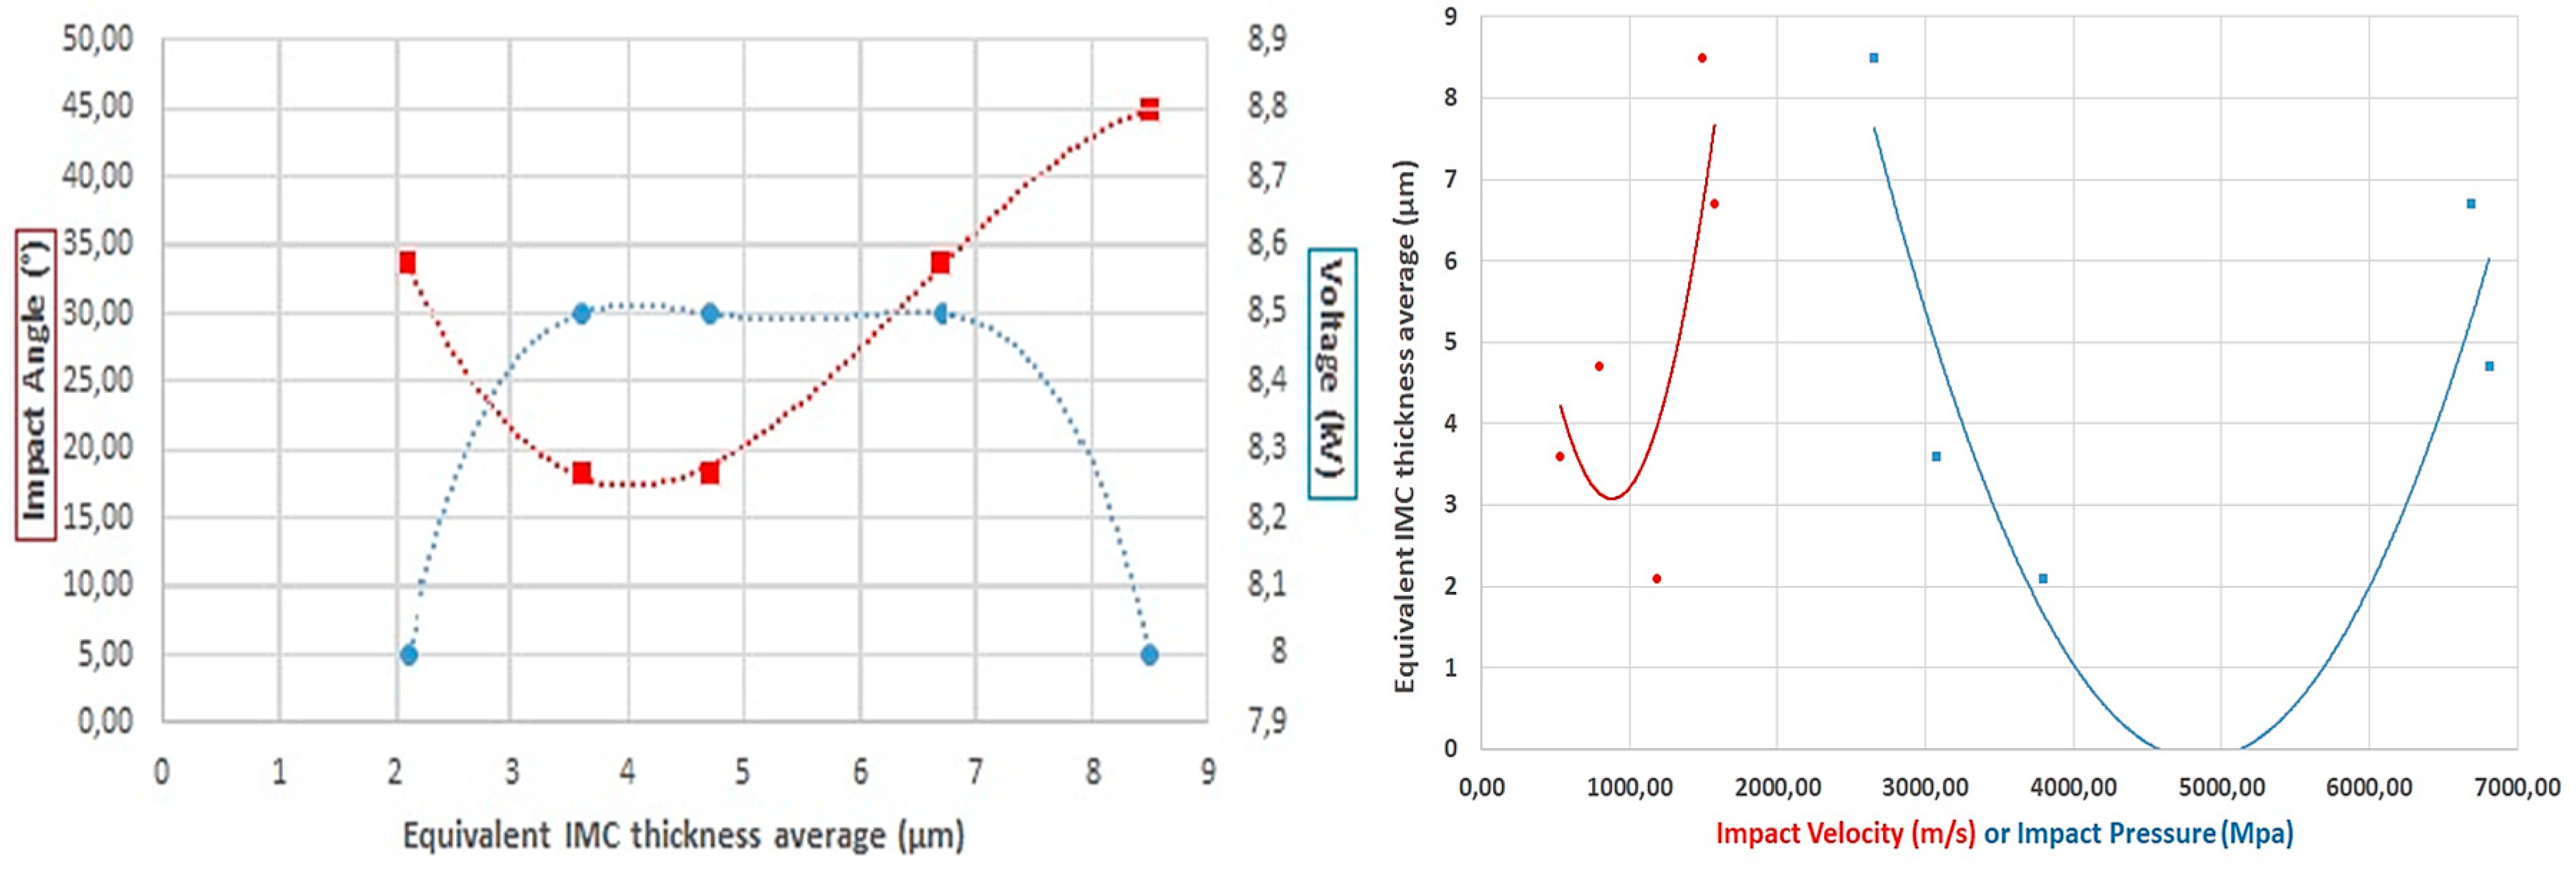
Table 1.
Chemical composition and properties of HC420LA steel [10].
Table 1.
Chemical composition and properties of HC420LA steel [10].
| C | Si | Mn | P | S | Al | Nb | Ti | ||
|---|---|---|---|---|---|---|---|---|---|
| % maximum and minimum by weight | 0-0,1 | 0-0,5 | 0-1,6 | 0-0,025 | 0-0,025 | 0-0,015 | 0-0,09 | 0-0,15 | |
| Ultimate Tensile Strength, | Yield Tensile Strength, | Elongation at Break | |||||||
| 470 - 590 MPa | 420 - 520 MPa | ≥ 17 % | |||||||
| Sound speed within the material | 3220 m/s | Density | 2700 kg/m3 | ||||||
Table 2.
Chemical composition and properties of A6082T6 [11].
Table 2.
Chemical composition and properties of A6082T6 [11].
| Si | Fe | Cu | Mn | Mg | Cr | Ti | Other | |
|---|---|---|---|---|---|---|---|---|
| % maximum and minimum by weight | 0,7-1,30 | 0-0,5 | 0-0,1 | 0,4-1,00 | 0,60-1,20 | 0-0,015 | 0-0,09 | 0-0,15 |
| Ultimate Tensile Strength | Yield Tensile Strength | Elongation at Break | State | |||||
| 290 MPa | 250 MPa | 10 % | T6 at 20ºC | |||||
| Yield Strength | 200ºC | 300ºC | 400ºC | |||||
| 240 MPa | 132 MPa | 65 MPa | ||||||
| Poisson’s coefficient | 0,33 | Density | 2700 kg/m3 | |||||
| Sound speed within the material | 3040 m/s | |||||||
Table 3.
DoE for pulse magnetic welding of A6082T6 and HC420LA stacks.
| Energy (kJ) | 5.52 | 6.99 | 8.03 | 10.44 | 12.42 | 14.58 | 16.91 | 19.41 | 22.08 | 24.93 | 27.95 |
| Gap (mm) | 1 | 1.5 | 2 | 2.5 | 3 | ||||||
| Overlap (mm) | 6 | 7 | 8 |
Table 4.
DoE results for pulse magnetic welding of A6082 T6 and HC420LA.
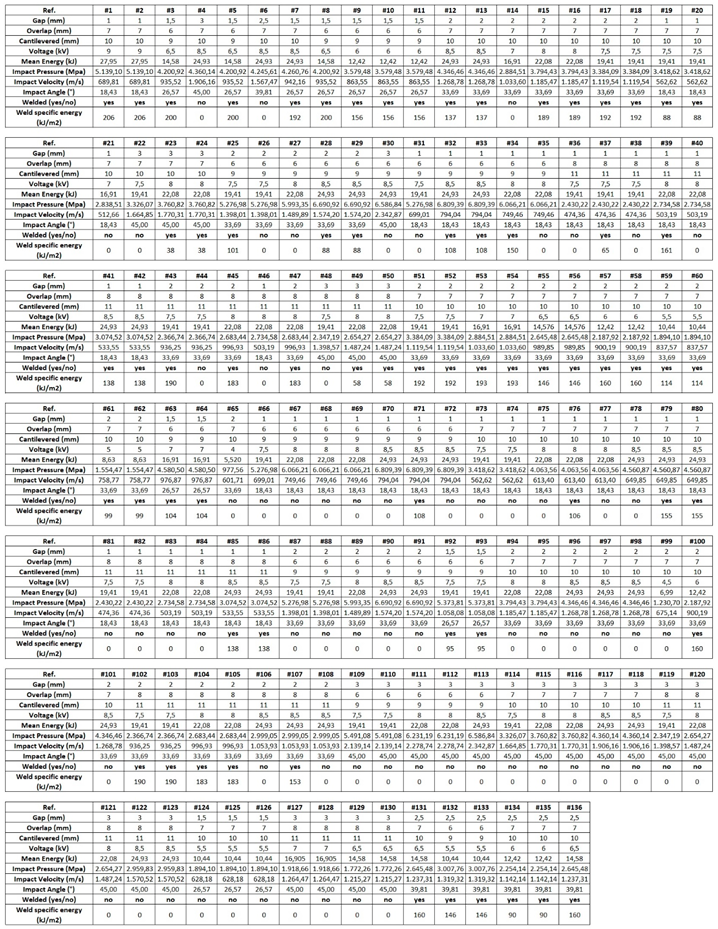 |
Table 6.
Relation between impact pressure, velocity and angle.
| Impact angle | 18,43° | 26,57° | 33,69° | 39,81° | 45° |
|---|---|---|---|---|---|
| Pi/Vi (N.s/m3) | 13.573.106 | 7.950.106 | 5.902.106 | 4.723.106 | 4.288.106 |
|
Pi/Vi = [28.895.tan2(γ) – 51.601.tan(γ) + 27.240].106 r² = 0,9845 | |||||
| Pi/Vi (N.s/m3) | 6,186.106 (from equation (4)) | ||||
Disclaimer/Publisher’s Note: The statements, opinions and data contained in all publications are solely those of the individual author(s) and contributor(s) and not of MDPI and/or the editor(s). MDPI and/or the editor(s) disclaim responsibility for any injury to people or property resulting from any ideas, methods, instructions or products referred to in the content. |
© 2025 by the authors. Licensee MDPI, Basel, Switzerland. This article is an open access article distributed under the terms and conditions of the Creative Commons Attribution (CC BY) license (http://creativecommons.org/licenses/by/4.0/).
Copyright: This open access article is published under a Creative Commons CC BY 4.0 license, which permit the free download, distribution, and reuse, provided that the author and preprint are cited in any reuse.


