Submitted:
27 April 2025
Posted:
29 April 2025
You are already at the latest version
Abstract
The use of technological devices by children has increased in recent years. This study aims to: Investigate the frequency and typology of its use and the possible socio-demographic factors associated; screen emotional behavior and sleeping difficulties and their possible associations with children’s attitudes towards technological devices. The study involved 134 children (52.2% males), with an average age of 7.86 years (SD = 2.02) and mainly their mothers (80.2%). Participants were given a series of self- and proxy-report questionnaires about the digital age, type of activities, hours of sleep, and their behavioral/emotional difficulties. Parents declared tablet as the device most used by children (49.8%), with average daily use time of 22.86 min (SD=33.62). Their digital starting age was on average 5.91 years (SD = 2.25) with mostly recreative activities (Mean=3.15; SD=0.72). The tablet time was significantly different by gender (t307.08 = -2.36; p = 0.019), with boys using longer mean time tanh girls (27.8 versus 18.22) and having more ADHD problems (t309.49 = - 3.13 p = 0.002; 2.68 versus 1.74). Parents declared on average 9.55 (SD = 0.55) hours of sleep per night for their children. A significant correlation was found between PC usage time and sleep hours (r = -0.13 p = 0.019). The frequency of tablet use was correlated with both the Behavioral Problems scale (r = 0.15 p = 0.010) and the ADHD scale (r = 0.11 p = 0.049). Based on these empirical results, preventive programmes and educational activities should be set up.
Keywords:
children
; technological devices
; behavioral problems
; emotional difficulties
; sleep
1. Introduction
The rapid advancement of digital technology has significantly transformed daily life, particularly among younger generations. Today’s children are immersed in a digital world where screen technologies, such as televisions, computers, tablets, and smartphones, play an integral role in their daily activities, influencing their cognitive, emotional, and social development. The increasing accessibility and widespread use of these digital devices raise important questions about their impact on children’s adaptation, behavior, and emotional well-being.
The concept of digital natives has been widely discussed in the literature to describe individuals who have grown up with digital technology as an intrinsic part of their environment [1]. Unlike digital immigrants, who had to adapt to technological advancements later in life, digital natives exhibit an intuitive familiarity with digital devices. Prensky later revised his perspective, emphasizing digital competence over generational distinctions [1]. The shift toward digital wisdom, as opposed to mere digital fluency, underscores the importance of fostering a conscious and responsible approach to the use of technology among young users [2].
According to data reported by Save the Children, in Italy approximately one in three children between the ages of 6 and 10 (32.6%) uses a smartphone every day, a trend that has been continuously increasing in recent years (in 2018-2019 it was 18.4%) and with a clear prevalence in the South and the Islands, where the share increases to 44.4%, more than 20 percentage points higher than 23.9% in the North [3]. In Italy, 73% of children and adolescents between 6 and 17 years of age use the internet every day and do so mainly through smartphones; 65.9% of children and adolescents use their cell phones every day. The age at which people own or use a smartphone is increasingly lower, with a significant increase after the pandemic: Children aged 6-10 who use their cell phones every day went from 17.4% to 27.6% between the two-year period 2018-19 and 2021-22.
As digital engagement becomes increasingly prevalent among children, researchers have sought to understand its developmental implications. The growing body of literature on the use of digital media among children highlights both the potential benefits and the associated risks. On the one hand, digital technologies have been shown to facilitate learning, creativity, and social connectivity. Research suggests that exposure to interactive digital media can enhance cognitive skills, support second language acquisition, and improve information processing skills [4]. In addition, digital tools are increasingly integrated into educational settings to improve engagement and retention of knowledge [5].
However, concerns have emerged regarding the potential negative effects of excessive use of digital media. Prolonged screen time has been associated with issues such as reduced sleep duration [6], increased risk of attention difficulties [7], and lower social and academic competencies [8]. Gender differences in digital engagement have also been observed, with boys generally engaging more in games and online purchases, while girls tend to use digital devices primarily for communication and social interaction [9]. Dworak et al. [10] found an association between excessive use of television and video games and emotional and behavioral symptoms. Sanders et al. [6] reported an association between less screen time and fewer externalizing, as well as internalizing, problems. Furthermore, the potential risks of exposure to the internet, including cyberbullying and privacy concerns, emphasize the need for parental mediation and digital literacy initiatives.
As digital technologies continue to evolve, further research is needed to develop strategies to optimize their benefits while minimizing risks. This study aims to contribute to the ongoing discourse by synthesizing current knowledge on digital participation in children, parental perspectives, and the broader implications for childhood development. The study objectives are to investigate the time and typology of use of digital devices, adaptation, emotional and behavioral difficulties in school-age children understanding possible gender or age differences and the influence of parental sociodemographic factors.
2. Materials and Methods
2.1. Participants
2.2. Procedure
The protocol was approved by the Psychology Ethics Committee of the University of Padua (protocol 4039). All subjects gave their written informed consent to participate in accordance with the Declaration of Helsinki. The consent was then scanned and sent to the study director for further administration. Once signed informed consent has been obtained, the link to the compilation was sent by email to children and their parents, which took place online through the LimeSurvey platform. The mean time to complete the questionnaires was about 25 min. The participants in this study were parents and children from Northeastern Italy who completed various questionnaires from 2017 to 2020 during Padua University courses at the Faculty of Psychology. Three different cohorts were combined for a total of 314 subjects. The questionnaires were filled out by parents of children aged 3-11 years old. Subsequently, the data collected were coded and entered into SPSS files for statistical analysis.
2.3. Instruments
2.3.1. Sociodemographic Questionnaire
This questionnaire allows you to collect useful information to understand the socioeconomic and cultural level of the family. It contains questions aimed at investigating the age, number of years of schooling, educational qualification and employment situation of the parent and partner, the age and sex of the child, the demographic data of the family (number of children, housing situation, economic situation).
2.3.2. Parent Questionnaire on Child Digital Experience (3-11 Years)
This is a questionnaire that the parent fills out and that allows you to understand what digital experience the child has acquired. It includes questions that investigate the frequency of use of each digital device and the type of activity performed. It also provides information related to the hours of sleep of children per night. The time range of the use of technical devices is transformed into minutes to compare these data with other variables.
2.3.3. Child Behavior Checklist – CBCL/6-18
CBCL/6-18 is a behavior assessment questionnaire that is part of Achenbach System of Empirically Based Assessment, ASEBA. It allows you to evaluate social skills and emotional-behavioral problems. For this research, only the skills scale was taken into consideration, which allows to detect the subjects' skills profile, derived from 20 items and divided into 3 scales: activity scale (assesses the quantity and quality of the child's participation in sports, hobbies, games and activities, the quantity and quality of the jobs and/or chores done and of friendships), sociability scale (assesses the child's ability to get along with others, play and work independently), school scale (assesses school functioning). Profile sheets were used for scoring, divided by sex, age and type of scale, which allow the raw scores to be transformed into T scores and allow comparison with normative data, derived from reference samples of the same age. The retest reliability for the skills scale is 0.90 and, while the internal consistency is supported by an alpha coefficient ranging from 0.63 to 0.79 [11].
2.3.4. Strengths and Weaknesses Questionnaire (SDQ-ITA, Version 4-10 Years for Parents and Teachers)
The Italian version of the “Strength and Difficulties Questionnaire – SDQ” by Goodman (1997) was used. The SDQ is a questionnaire composed of 25 items divided into five subscales: Hyperactivity, Conduct Disorders, Emotional Problems, Peer Relations, Prosocial Behaviors. The same questionnaire can be filled out by both teachers and parents and allows the individual to obtain many information about the child’s behavior. Ratings range from 0 (not true) to 1 (fairly true) to 2 (certainly true). For all scales, a higher score corresponds to a higher level of difficulty, with the exception of the Prosocial Behaviors scale, in which a high score indicates a significant presence of positive behaviors. The calibration of the SDQ-ITA was obtained on a sample of 528 elementary school students in the provinces of Vicenza and Venice. The SDQ demonstrated good psychometric properties, with a five-factor structure and good internal consistency of the five subscales (Cronbach's alpha between 0.73 and 0.89). The SDQ percentile scores are reported to allow the use of the questionnaire both as an information sheet on the psychological difficulties of students and as a screening tool for schools (to identify cases of behavioral and emotional difficulties) [12].
3. Results
3.1. Th Strating Digital Age and the Type of Use of Digital Devices
From the frequency distribution of the answers on the age of first use of technology it emerged that the average age at which the children in our sample began to use technology was 5.91 years (SD = 2.25). Children used a digital device for the first time mostly between the ages of six and seven (37.3%), 20.4% between the ages of eight and nine and 28.1% between the ages of three and five. A minority of children started before the age of two (9.3%) and only 4.8% between the ages of nine and eleven. The device most used by the children in the sample was the tablet (49.8%), followed by the smartphone (35.4%) and the Personal Computer (PC) (12.2%). The e-book reader was less used (2.6%).
The average time in minutes of daily use of the tablet was 22.86 (SD=33.62), of the smartphone 8.87 (SD=24.43), of the PC 15.68 (SD=26.38) and of the e-book 1.23 (SD=7.11).
The activities reported as frequently and most frequently performed by children with digital devices were recreational activities (M = 3.15; SD = 0.72, range: 1-5) such as listening to music (48.1%), watching TV/videos/cartoons (42.4%) and games for fun only (e.g. Angry Birds, Fruit Ninja, etc.) (39.2%). The least used were educational activities (28.7%); in fact, more than half of the children never used them.
3.2. Impact of Sociodemographic Variables on Technology Usage Time and Typology of Activities
A series of ANOVAS was performed on time children spent using digital devices at their age (grouped by age groups). The analysis showed a significant effect of the children's age on the frequency of tablet use (F3,307 = 2.85; p = 0.038), smartphone (F3,301 = 4.38; p = 0.005) and e-book (F3,308 = 6.05; p = 0.001), while there was no significant effect of the children's age on the frequency of PC use (Table 3). In particular, following the application of the post hoc analysis with the Bonferroni method (Table 4), it was observed that children in the 8-9 age group used the tablet significantly more than those in the 3-5 age group (p = 0.023); that children aged 10-11 years used the smartphone significantly more than both children in the 3-5 age group (p = 0.012) and those in the 6-7 age group (p = 0.046); finally, that older children used e-books significantly more than younger children (p = 0.009), but also than the other age groups examined.
The ANOVAS analyses showed a significant effect of children's age on recreational activities (F3,310 = 7.48; p = 0.0001) and on internet use (F3,310 = 9.99 p = 0.0001). Following the application of the post-hoc analysis with Bonferroni method, it was observed that younger children carried out recreational activities and used internet to a significantly lower extent than older children (Table 5).
A series of test T for independent samples was performed between the child gender variable and the variables relating to the time spent using technology and then between the child gender variable and the variables relating to the activities carried out with digital devices. Tablet use time was significantly different depending on gender (t = -2.36; df = 307.08; p = 0.019) and recreative (t = -2.95; df = 312; p = 0.003), creative activities (t = 2.10; df = 312; p = 0.0037) and photos (t = 3.84; df = 312; p = 0.0001) were run differently depending on gender. Figure 1 shows these results.
3.3. Associations Between Parental SES and Time and Typology of Use of Technological Devices
The use of tablet time by children was significantly associated with the schooling years of fathers (r = -0.21 p = 0.034), indicating that a higher educational qualification of father was associated with a lower use of tablet by the child, and vice versa. The schooling years of the father were also significantly associated with the performance of recreational activities with digital devices (r = -0.32 p=.001), so a higher educational qualification of the father corresponded to a lower use of recreational activities with digital devices by the child.
A significant effect of the family's economic situation on the time spent using the smartphone emerged (F2,302=2.94 p=0.054). Following the application of the post hoc analysis with the Bonferroni method, it can be observed that parents with a low perceived economic condition declared that their children used the smartphone more time than those with a medium economic condition (M=18.38 SD= 49.27 against M=7.62 SD=15.58).
3.4. Behavioral Difficulties and Adaptive Skills Along Children’s Sociodemographic Factors
A statistically significant difference was found for the ADHD scale by sex (t309.49 = - 3.13 p = 0.002), such that boys had higher scores on the ADHD scale than girls (M = 2.68 SD = 2.08 versus M = 2.01 SD = 1.74). Therefore, we can state that boys have difficulties with attention and hyperactivity difficulties more than girls. Furthermore, a statistically significant difference emerged between boys and girls also for the Prosocial Behaviors scale (t312 = 2.78 p = 0.010), such that girls had higher average scores in the prosocial behaviors scale than boys (M = 8.10 SD = 1.58 versus M = 7.65 SD = 1.53) (Figure 2).
An ANOVA analysis was performed to understand whether the child's age had a significant effect on the SDQ scales. The Behavioral Problems Scale differed significantly with age (F3,310 = 3.61; p = 0.014). After applying the posthoc analysis with the Bonferroni method, it was observed that children aged 3-5 years had significantly higher scores on the Behavioral Problems scale than those aged 10-11 years (mean difference = 0.72; p = 0.01); furthermore, it was seen that the children aged 6-7 years had higher scores in the Prosocial Behaviors scale than those aged 3-5 years (mean difference = 1.10; p = 0.002). This result indicates that as the age increases, behavioral problems decrease, and prosocial behaviors increase.
3.5. Associations Between Usage Time of Technical Devices and Psycho-Physical Health (Sleep and Behavioral Difficulties)
Parents declared on average 9.55 (SD = 0.55) hours of sleep per night in their children. Pearson correlations were performed to evaluate whether the use time of technological devices was significantly associated with hours of sleep. Identifying the frequencies related to the time of day in which there was greater use of digital devices, it emerged that children used technologies more in the late afternoon, approximately in the hours preceding dinner (69.1%), while 10.8% of them use them before going to sleep. A significant correlation was found between computer usage time and sleep hours (r = -0.13 p = 0.019), which indicated a decrease in sleep hours as the frequency of PC use increases, and vice versa, an increase in sleep hours as the frequency of computer use decreases.
To evaluate the level of adaptation of the children, parents were asked to complete the CBCL questionnaire, in the section related to the skill scale. The sample size is made up of 109 subjects; in fact, this cohort of participants belonged to an initial data collection related to the project and then this questionnaire was no longer administered. Three different skill scores emerged from the scoring, one for the Activity scale, one for the Sociality scale and one for the School scale; subsequently, an overall skill score was calculated and the cutoff levels adopting T scores conversion are reported in Figure 3.
Pearson correlations were performed between variables related to time spent using technology and activities carried out with digital devices and the scores of the CBCL competency scales (Activity scale, Sociability scale, School scale, Total score).
Sociability scale score was significantly correlated with both the frequency of smartphone use (r = -0.024 p = 0.016) and the frequency of PC use (r = - 0.33 p = 0.001), so that as the frequency of smartphone and PC use increases, the sociability scale score decreases, and vice versa. The frequency of tablet use had a significant association with the School scale score (r = - 0.24 p = 0.012), so a lower score on the school scale is associated with greater tablet use, and vice versa. Furthermore, it emerged that the frequency of tablet use was also significantly associated with the total CBCL score (r = -0.19 p = 0.048), so a higher total competency score corresponds to a lower frequency of tablet use, and vice versa.
The analysis of the difficulty scores of the children adopting SDQ showed that 93% of them are normal, being below the 80th percentile; 4.8% fall within the subclinical range, while 2.2% are considered clinical subjects as they are above the 90th percentile. Figure 4 shows the frequencies cutoff scores along the various SDQ scales.
The frequency of tablet use was positively correlated with both the Behavioral Problems scale (r = 0.15 p = 0.010) and the ADHD scale (r = 0.11 p = 0.049), indicating that a higher use of the tablet corresponds to greater behavioral, attention and hyperactivity difficulties, and vice versa. Furthermore, it emerged that the Behavioral Problems scale was also negatively correlated with the frequency of e-book use (r = -0.11 p = 0.049), indicating that a greater frequency of e-book use is associated with fewer behavioral problems, and vice versa.
4. Discussion
Today’s children live in an environment where technology is present in every aspect of their lives. According to the American Academy of Pediatrics (AAP) [13], children spend more time using digital devices than any other activity; therefore, some recommendations have been made regarding the use of technology by children, including limiting screen exposure to less than two hours per day [8,14]. This study was born from the intention of deepening the issues related to the use of digital tools by children and the connection between the use of technology and adaptation and emotional and behavioral difficulties of children.
The first objective was to investigate the use of digital devices by children, analyzing the average age at which they begin to use technologies, the digital device they prefer to use between PC, smartphones, tablets and e-books, the frequency of daily use for each technological tool and the type of activities they carry out most when using technologies. The results show that the average age at which children approach technology is around six years, lower than those shown in precedent studies where seven years is the age for the first use of the Internet [15] and ten years for the first ownership of a mobile phone [15,16]. The average age of first use is decreasing. Further analyses on future cohorts of children would compare these current results with the new data. In this study, the most used device by children is the tablet, followed by the smartphone and the computer, while the e-book is still little used. Therefore, it seems that the use of smaller and more portable devices, such as tablets and smartphones, is currently preferred to the use of the computer, used for DVD and videogames in past years [17]. A recent study in 2023 by Save the Children Association (32.6% between the ages of 6 and 10) confirms that the percentage of daily use of small portable devices detected in our study is higher [3].
The activities performed most frequently by children in this study are recreational, including listening to music, playing games for fun, and watching videos, TV, and cartoons on digital devices as reported in 2012 [17], even if among the activities that have increased are listening to music and using the camera to take photos or selfies, probably following the new trend of social networks and influencers.
The second objective was to understand whether the usage of technological devices was different depending on the gender or age of the child. Regarding the age of children, the results of this study agree with the literature which shows an increase in the time spent using digital devices as age increases [15]. Children's age is also found to be relevant for the performance of recreational activities and for the use of the Internet; specifically, older children (8-11 age group) perform recreational activities and use the Internet to a significantly greater extent than younger children (3-7 years). Regarding the gender of the children, on average, boys use technology more than girls; however, a significant difference is found only for the time spent using the tablet, so that boys spent more time in front of the tablet screen. Cannoni and colleagues [7] observe that parents favor the use of technology in their male children, and that there are the fathers who transmit the interest in the use of technology to their male children. Future studies could examine whether and how the use of digital devices by both parents affects their children's use of technology, and whether any gender differences in parents' use of digital tools affect their children's use. Specifically, the higher educational qualification of fathers and the high economic condition reduce tablet use time and recreational activities. The literature confirms this result explaining that parents with higher education and good economic condition exercise greater control over their children's use of technology, as they are more aware of the risks that come from it [18,19,20].
The third objective was to identify the possible associations between the use of technology devices and sleeping and behavioral difficulties. A decrease in sleep hours is recorded as the time spent using the computer during the day increased. These data are in line with the literature, which finds a negative association with sleep hours, not only for the use of video games, smartphones, and television, but also for the use of computers [21]. The same result is also reported by Twenge et al. [14], who found a significant association between the time spent using digital devices, both portable and non-portable, and sleep hours in children under ten years old.
Regarding the overall level of adaptation, children have a predominantly normal level, while approximately a quarter of the children are placed in the clinical range. With respect to technology use time, it has emerged that greater smartphone and computer use time is associated with poorer participation in extracurricular group activities, a smaller number of friends, and worse behavior toward significant others (parents, brothers/sisters, friends).). This result would seem to be in line with the two main theories that explain the correlation between technology use and social and relational aspects, whereby, on the one hand, spending time using technology occurs at the expense of time that could be spent on social activities, increasing the risk of social isolation or depression [22]; on the other hand, young people with real or perceived deficits in social skills tend to use technology more to compensate for their difficulties [23,24]. Furthermore, it emerges that children who make greater use of tablet also have lower academic performance and greater academic difficulties, in line with what Peas [8] reports on the use of entertainment media, which would have a negative effect on children's academic results, mainly because they are often used while doing homework.
With respect to the total behavioral and emotional difficulties, most children classified in the clinical range appear to have problems with peers, emotional symptoms and behavioral problems, while a small portion of children show symptoms of hyperactivity and inattention and problems in prosocial behavior. As children grow, behavioral problems decrease, and prosocial behaviors increase. With respect to the gender of the children, however, it is evident that boys have more symptoms of ADHD than girls, that have a greater presence of prosocial behaviors than boys. With respect to technology use time, it emerges that a higher use of the tablet corresponds to greater behavioral, attention and hyperactivity difficulties. This result is in line with the literature showing an association between externalizing symptoms, including inattention, hyperactivity and impulsivity, and high rates of technology use [22,25].
4.1. Strengths and Limits
This study involves a large and heterogeneous sample with respect to sociodemographic conditions, so it can be considered fairly representative of the population of interest. The sample, however, comes entirely from North-Eastern Italy, so it would be interesting to observe the same phenomenon also in relation to other areas of the Italian peninsula. The data collected are multiple and diverse; this allows us to relate numerous variables detected in the same sample, paving the way for various research alternatives.
Furthermore, the data collection is carried out over three years, thus allowing the comparison between the different cohorts that participated in the survey and the evaluation of how the same phenomenon changes over time. For this research, only questionnaires completed by parents are adopted, so it would be useful to compare our results with those obtained from the compilation of the same questionnaires by children, thus evaluating the degree of agreement between the answers given by parents and those given by children.
Since this is a rapidly evolving field, the literature available on this topic may already be out of date. Furthermore, much of the literature focuses on preschool children and adolescents; this has made it more difficult to find information on what is already in the literature for school-age children.
5. Conclusions
Future research studies could use the multiple data collected to relate other variables of interest, expand the number by involving other areas of Italy and compare these results with those obtained from the questionnaires filled out by the children.
These information and future studies could be informative to set up preventive and educational programmes for children, for parents and for teachers. The directions could be: attention to the time facing the screen, ameliorate the parental control and the ability of children to regulate their use not excluding other important social activities and improving the educative activities adopting technical devices.
Supplementary Materials
The following supporting information can be downloaded at the website of this paper posted on Preprints.org, the research data file has been submitted here.
Author Contributions
Conceptualization, M.T, S.B. and L.T.; methodology, M.T. and R.M.I.; formal analysis, M.T. and R.M.I.; investigation, M.T.; data curation, S.B. and L.T..; writing—original draft preparation, M.T..; writing—review and editing, R.M.I. and L.T.; project administration, M.T. and S.B. All authors have read and agreed to the published version of the manuscript.
Funding
This research received no external funding.
Institutional Review Board Statement
The study was conducted in accordance with the Declaration of Helsinki, and approved by the Psychology Ethics Committee, University of Padua (protocol 4039).
Informed Consent Statement
Informed consent was obtained from all subjects involved in the study.
Data Availability Statement
The research data have been submitted as supplementary material.
Conflicts of Interest
The authors declare no conflicts of interest.
References
- Prensky, M. Digital natives, digital immigrants Part 1. On the Horizon, 2001; 9. [Google Scholar]
- Rivoltella, P. C. Media digitali, apprendimento, formazione, 2015. http://www.webdiocesi.chiesacattolica.it/cci_ new/allegati/35539/Rivoltella_Media-digitali-apprendimento-formazione.pdf.
- De Marchi, V.; Pistono, D.; Pulcinelli, C. Tempi digitali: Atlante dell'infanzia (a rischio) in Italia 2023; Roma: Save the Children Italia, 2023. [Google Scholar]
- Wang, Y.; Sun, S.; Lei, W.; Toncar, M. Examining Beliefs and Attitudes toward Online Advertising among Chinese Consumers, DMIJ 2009, 3:52-66.
- Schiavo, G.; Mana, N.; Mich, O.; Arici, M. Tecnologie digitali e DSA, Iprase: Trento, Italy, 2016, https://goo.gl/5bFtzB.
- Sanders, W.; Parent, J.; Forehand, R.; Sullivan, A. D.; Jones, D. J. Parental perceptions of technology and technology-focused parenting: associations with youth screen time. Journal of applied developmental psychology 2016, 44, 28–38. [Google Scholar] [CrossRef] [PubMed]
- Cannoni, E. , Scalisi, T. G.; Giangrande, A. Indagine sui bambini di 5-6 anni che usano quotidianamente i dispositivi mobili in ambito familiare: Caratteristiche personali e contestuali e problematiche cognitive ed emotive. Rassegna di Psicologia. 2018, 35, 41–56. [Google Scholar]
- Peas, J. S. Positive and Negative Influences of Technology in Early Childhood Classrooms: A Qualitative Study. Doctoral dissertation, Northcentral University, 2019.
- Dempsey, S.; Lyons, S.; McCoy, S. Early mobile phone ownership: influencing the wellbeing of girls and boys in Ireland? Journal of Children and Media 2020, 14, 492–509. [Google Scholar] [CrossRef]
- Dworak, M.; Schierl, T.; Bruns, T.; Strüder, H. K. Impact of singular excessive computer game and television exposure on sleep patterns and memory performance of school-aged children. Pediatrics 2007, 120, 978–985. [Google Scholar] [CrossRef] [PubMed]
- Achenbach, T. M.; Rescorla, L. Manual for the ASEBA school-age forms & profiles: An integrated system of multi-informant assessment. Burlington, VT: Aseba, 2001.
- Marzocchi, G. M.; Di Pietro, M.; Vio, C.; Bassi, E.; Filoramo, G.; Salmaso, A. Il questionario SDQ Strengths and Difficulties Questionnaire: uno strumento per valutare difficoltà comportamentali ed emotive in età evolutiva. Difficoltà di apprendimento 2002, 8, 75–84. [Google Scholar]
- AAP,; Council on Communications and Media. Media and young minds. Pediatrics 2016, 138, e20162591. [Google Scholar] [CrossRef] [PubMed]
- Twenge, J. M.; Hisler, G. C.; Krizan, Z. Associations between screen time and sleep duration are primarily driven by portable electronic devices: Evidence from a population-based study of US children ages 0–17. Sleep medicine, 2019, 56, 211–218. [Google Scholar] [CrossRef] [PubMed]
- Mainardi, M.; Zgraggen, L. Minori e Internet: secondo studio SUPSI sull’uso delle tecnologie dell’informazione e della comunicazione e sui comportamenti nella rete di allievi e giovani studenti della Svizzera Italiana. SUPSI. 2012.
- Influence Central Kids & Tech: The Evolution of Today’s Digital Natives. 2016. http://on.wsj.
- Eurispes & Telefono Azzurro. Indagine conoscitiva sulla condizione dell’infanzia e dell’adolescenza in Italia 2012. Documento di sintesi. 2012.
- Pauwels, C.; Bauwens, J. : Vleugels, C. Cyberteens: de betekenis van ICT in het dagelijkse leven van Belgische tieners [Cyberteens: The relevance of ICT in daily life of Belgian teenagers]. Academic Press. 2008.
- Walrave, M.; Lenaerts, S.; Moor, D. Cyberrisks: confrontatie en omgang met risico‟s. In Cyberteens, cyberrisks & cybertools:tieners & ICT: risico’s & opportuniteiten. Gent: Academia Press. 2009: pp 123-190.
- Wang, R.; Bianchi, S. M.; Raley, S. B. Teenagers’ internet use and family rules: A research note. Journal of Marriage and Family, 2005, 67, 1249–1258. [Google Scholar] [CrossRef]
- Chahal, H.; Fung, C.; Kuhle, S.; Veugelers, P. J. Availability and night-time use of electronic entertainment and communication devices are associated with short sleep duration and obesity among Canadian children. Pediatric obesity, 2013, 8, 42–51. [Google Scholar] [CrossRef] [PubMed]
- George, M. J. , Russell, M. A., Piontak, J. R., Odgers, C. L. Concurrent and Subsequent Associations Between Daily Digital Technology Use and High-Risk Adolescents’ Mental Health Symptoms. Child. Dev. 2018, 89, 78–88. [Google Scholar] [CrossRef] [PubMed]
- Shapira, N. A.; Lessig, M. C.; Goldsmith, T. D.; Szabo, S. T.; Lazoritz, M.; Gold, M. S.; Stein, D. J. Problematic Internet use: Proposed classification and diagnostic criteria. Depression and Anxiety 2003, 17, 207–216. [Google Scholar] [CrossRef] [PubMed]
- Valkenburg, P. M.; Peter, J. Preadolescents' and adolescents' online communication and their closeness to friends. Developmental Psychology, 2007, 43, 267–277. [Google Scholar] [CrossRef] [PubMed]
- Bourchtein, E.; Langberg, J. M.; Cusick, C. N.; Breaux, R. P.; Smith, Z. R.; Becker, S. P. Featured Article: Technology Use and Sleep in Adolescents With and Without Attention-Deficit/Hyperactivity Disorder. Journal of pediatric psychology, 2019, 44, 517–526. [Google Scholar] [CrossRef] [PubMed]
Figure 1.
Comparison between boys and girls on the time spent and type of activities on digital devices.
Figure 1.
Comparison between boys and girls on the time spent and type of activities on digital devices.
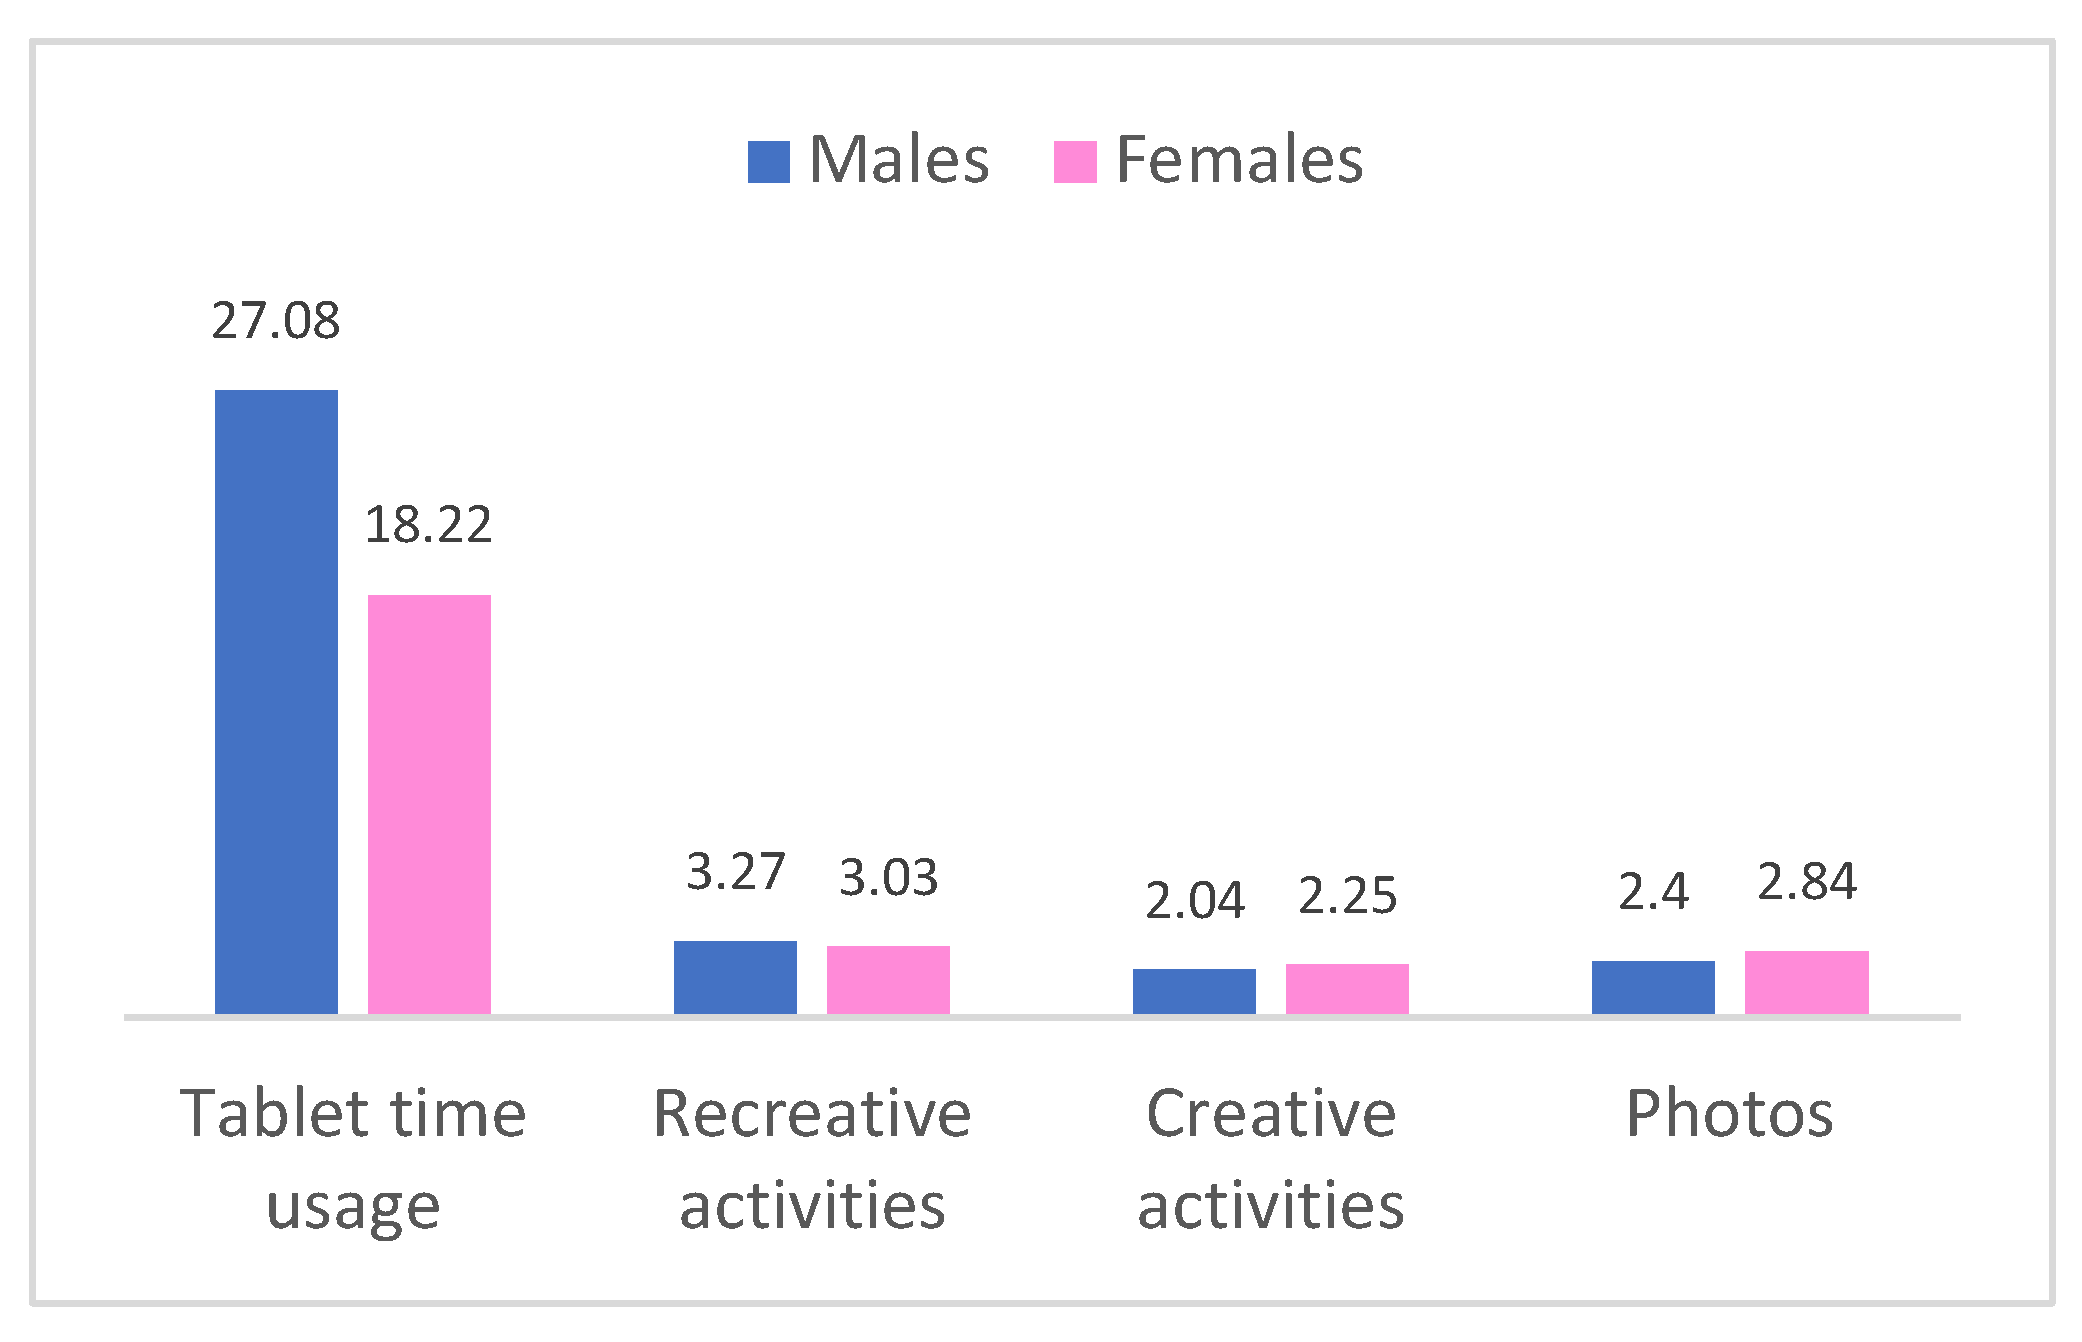
Figure 2.
Relative frequencies of the T-scores of the global SDQ and scales scores referred to the children in the sample.
Figure 2.
Relative frequencies of the T-scores of the global SDQ and scales scores referred to the children in the sample.
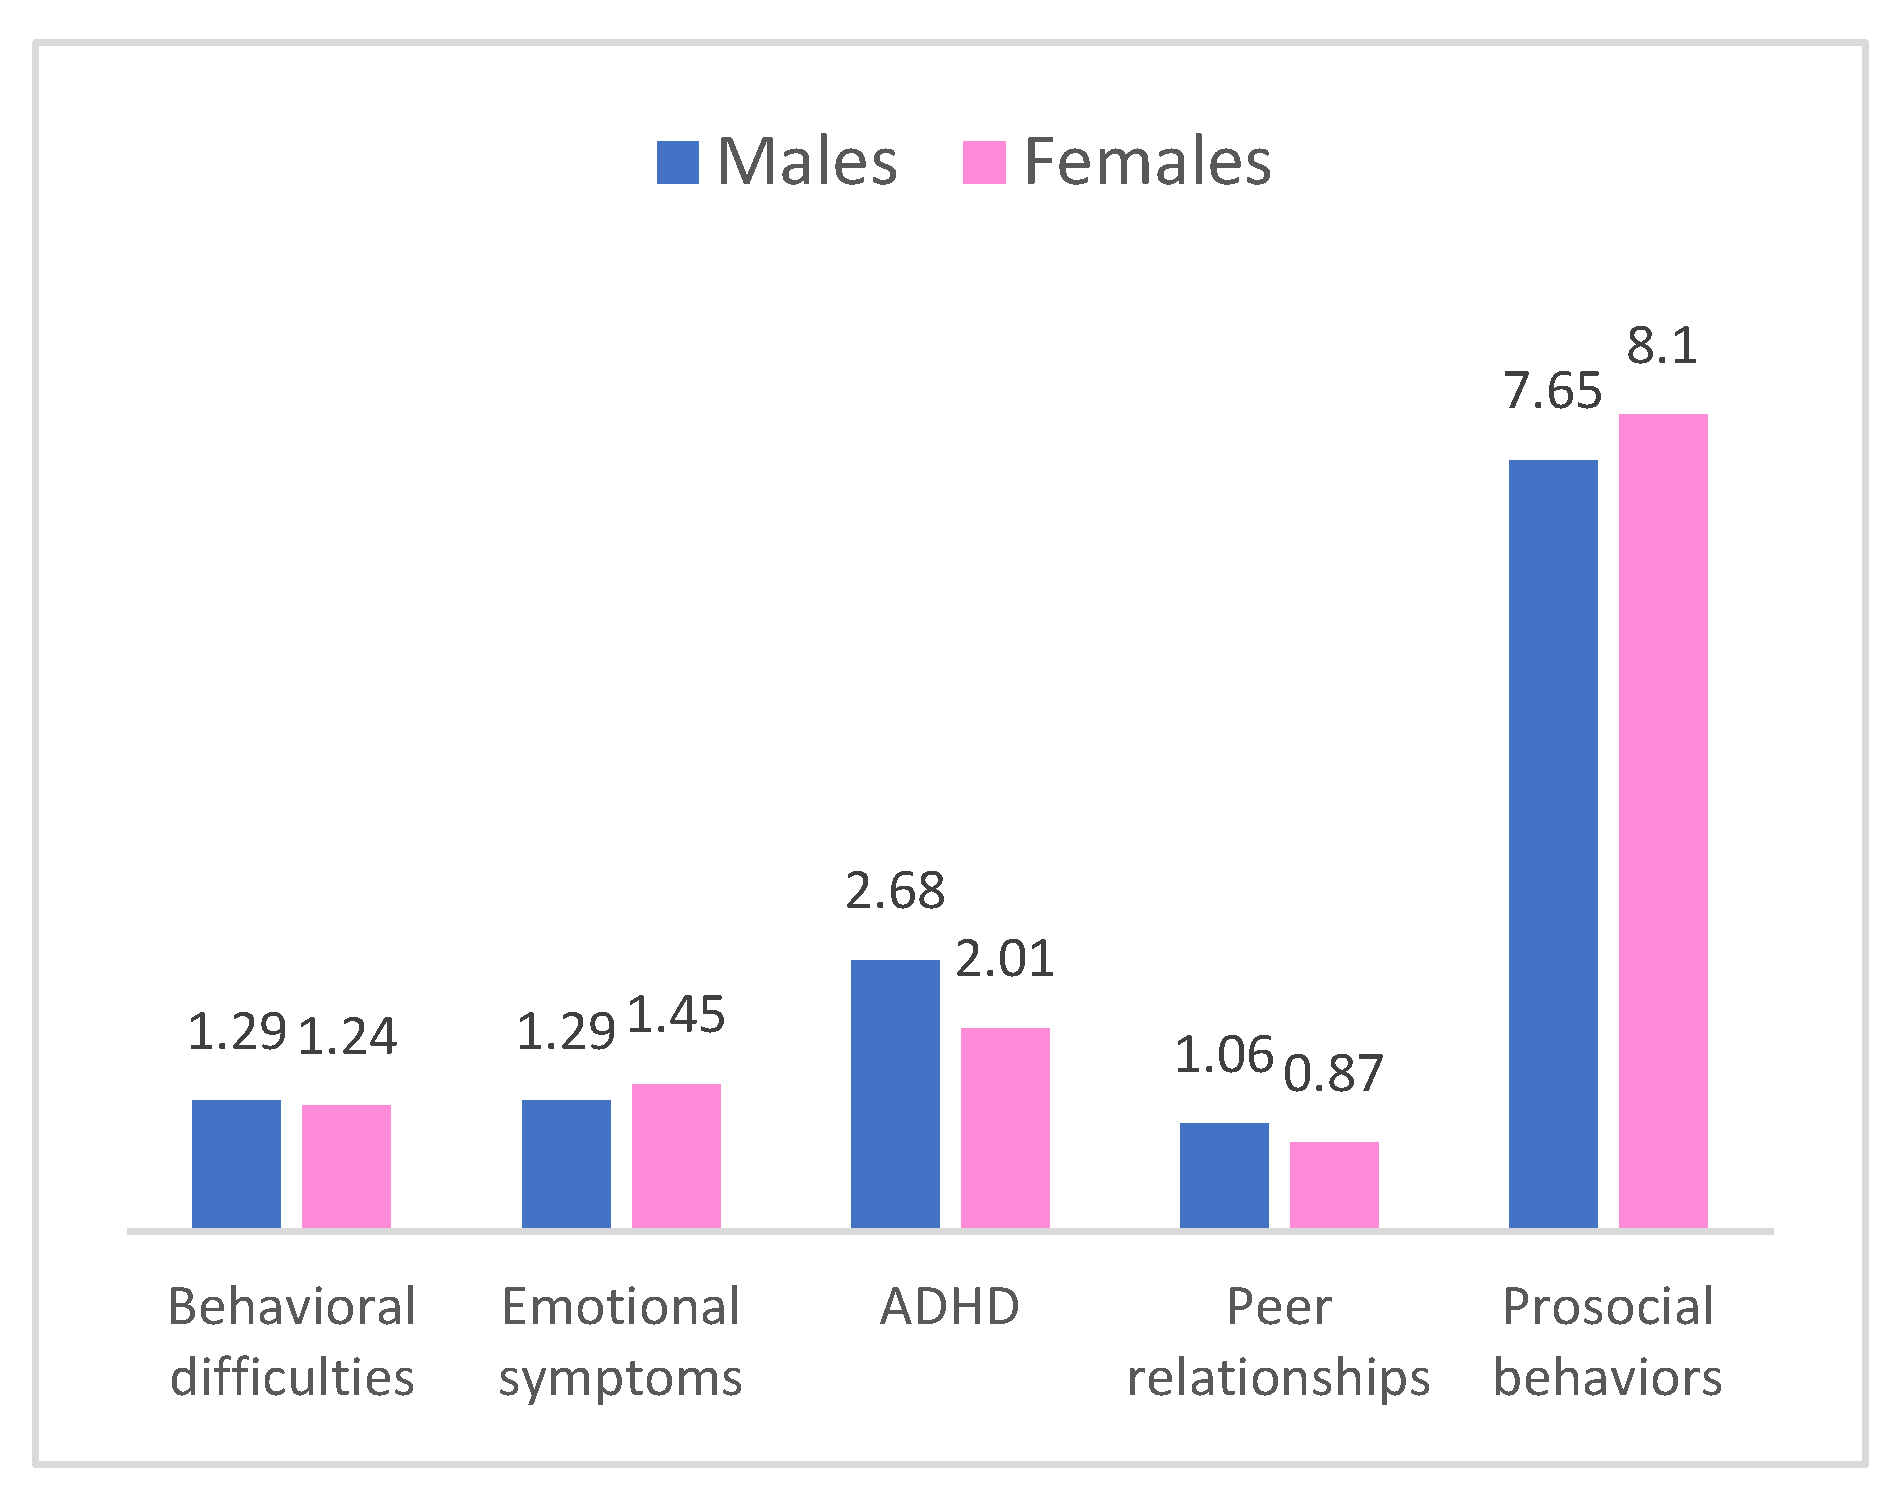
Figure 3.
Relative frequencies of T-scores of the CBCL Total score referred to the children in the sample.
Figure 3.
Relative frequencies of T-scores of the CBCL Total score referred to the children in the sample.
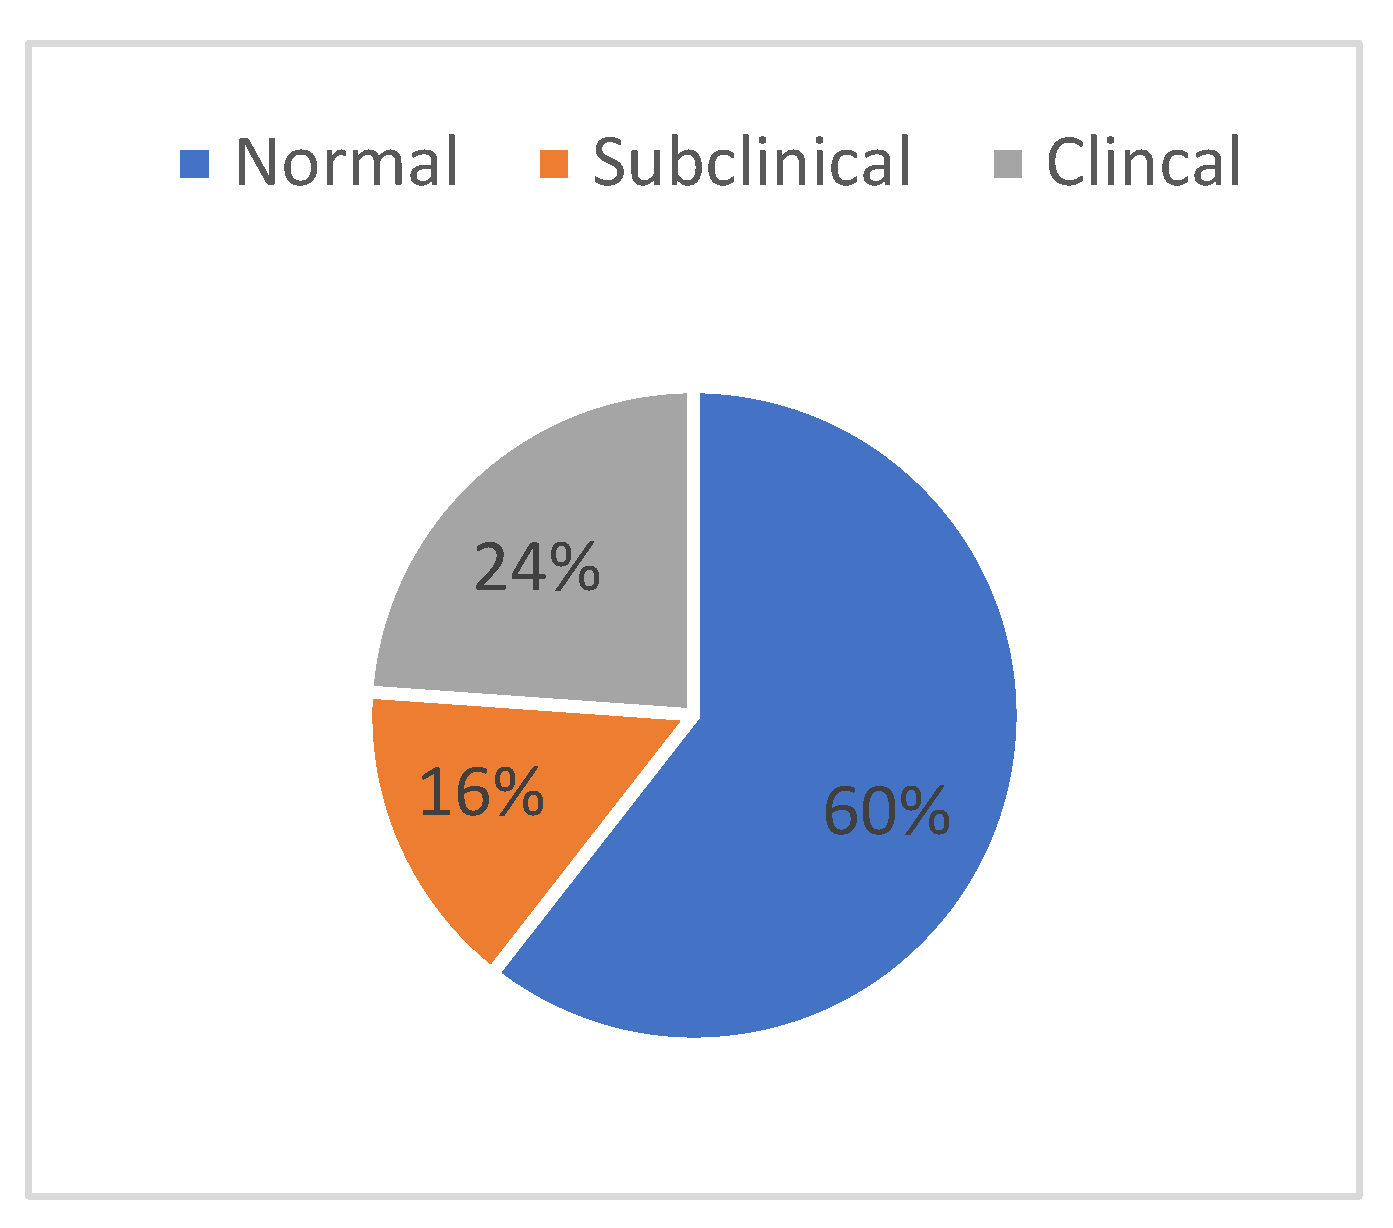
Figure 4.
Relative frequencies of the T-scores of the SDQ global and scales scores referred to the children in the sample.
Figure 4.
Relative frequencies of the T-scores of the SDQ global and scales scores referred to the children in the sample.
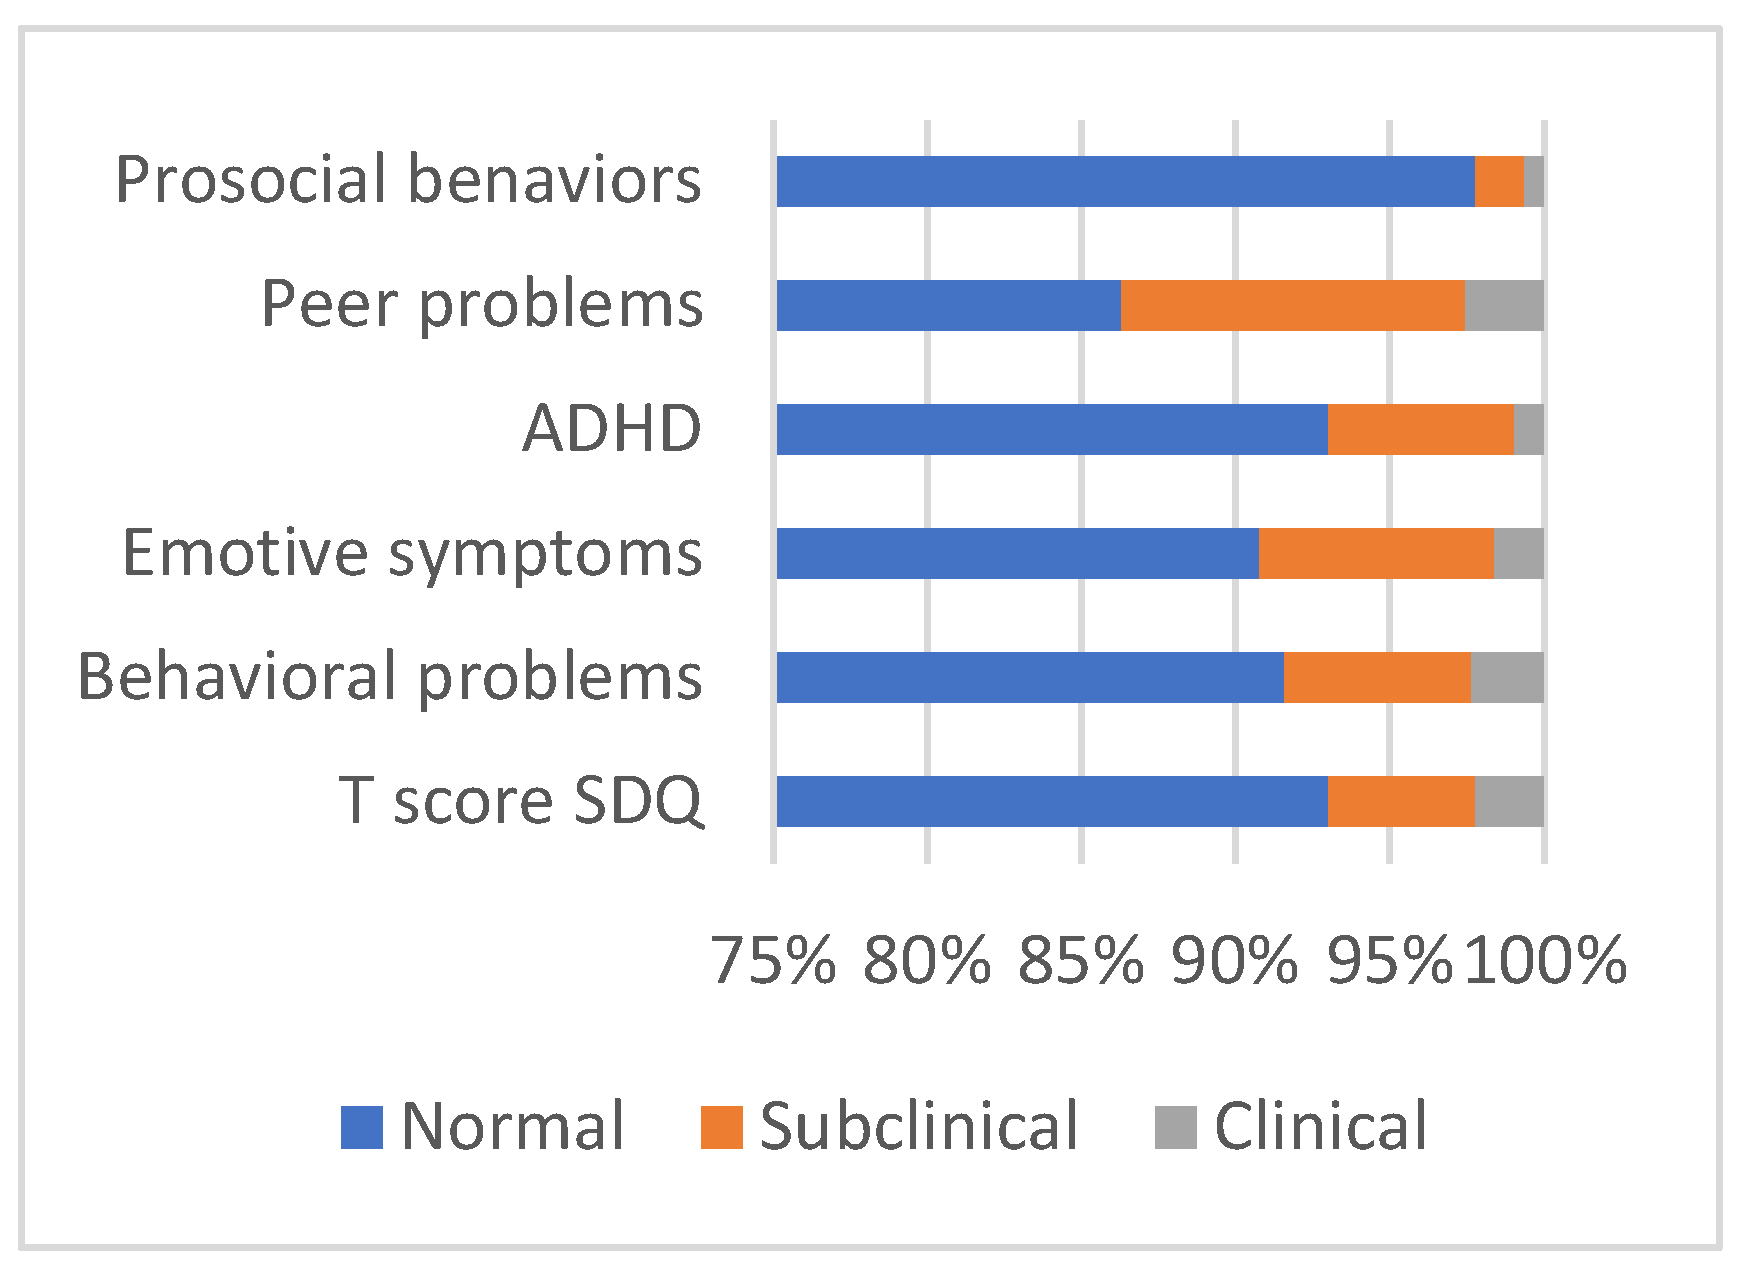

Table 1.
Sociodemographic information of children.
| Frequencies | % | |||
|---|---|---|---|---|
| Gender | Females Males Total |
150 164 314 |
47.8 52.2 100 |
|
| Age | 3-5 years 6-7 years 8-9 years 10-11 years Total |
76 90 71 77 314 |
24.2 28.7 22.6 24.5 100 |
|
| School | Pre-schooler 1 ͣ primariy school 2 ͣ primary school 3 ͣ primary school 4 ͣ primary school 5 ͣ primary school Total |
48 23 31 62 72 78 314 |
15.3 7.3 9.9 19,7 22.9 24.8 100 |
|
| Mean | SD | |||
| Child’s age | 7.86 | 2.02 | ||
Table 2.
Sociodemographic information of parents.
| Respondent parent | Partner | ||||
|---|---|---|---|---|---|
| Frequencies | % | Frequencies | % | ||
| Role | Mothers Fathers Total |
253 61 314 |
80.6 19.4 100 |
||
| Level of education | Primary school Secondary school 1st grade Secondary school 2 nd grade Degree 1st level Degree 2 nd level Post-degree Missing Total |
0 27 159 24 70 34 0 314 |
0 8.6 50.6 7.6 22.3 10.8 0 100 |
0 59 158 10 60 23 4 310 |
0 18.8 50.3 3.2 19.1 7.3 1.3 100 |
| Current job | Part-time Full-time Looking for a job Missing Total |
129 134 40 11 314 |
41.1 42.7 12.7 3.5 100 |
70 221 18 5 314 |
22.3 70.4 5.7 1.6 100 |
| Job hours/ week | 50 or more 40-49 30-39 20-29 10-19 0-9 Missing Total |
24 76 79 81 29 13 12 314 |
7,6 24,2 25,2 25,8 9,2 4,1 3,8 100 |
53 165 57 16 8 10 5 314 |
16,9 52,5 18,2 5,1 2,5 3,2 1,6 100 |
| N. siblings | 0 1 2 3 4 5 Missing Total |
75 108 103 15 12 1 0 314 |
23.9 34.4 32.8 4.8 3.8 0.3 0 100 |
||
| Perceived economic condition | Low Average High Total |
34 191 89 314 |
10.8 60.8 28.3 100 |
||
| Mean | SD | ||||
| Parental Age | 42.74 | 5.36 | |||
Table 3.
One-way ANOVA with DV the time spent on digital devices and IV the age of the children.
| F | df1 | df2 | p | |
|---|---|---|---|---|
| Tablet | 2.85 | 3 | 307 | 0.038 |
| Smartphone | 4.38 | 3 | 301 | 0.005 |
| PC | 1.48 | 3 | 307 | 0.220 |
| E-book reader | 6.05 | 3 | 308 | 0.001 |
Table 4.
Bonferroni post hoc test with DV the time spent on digital devices and IV the age groups of children.
Table 4.
Bonferroni post hoc test with DV the time spent on digital devices and IV the age groups of children.
| Age range A | Age range B | Usage Mean A | Usage Mean B |
Mean differences (A-B) |
p | |||
|---|---|---|---|---|---|---|---|---|
| M | SD | M | SD | |||||
| Tablet | 8-9 | 3-5 | 27.52 | 37.87 | 10.89 | 18.06 | 16.63* | .023 |
| Smartphone | 10-11 10-11 |
3-5 6-7 |
15.01 15.01 |
29.67 29.67 |
0.93 3.78 |
3.62 13.17 |
14.08* 11.23* |
.012 .046 |
| E-book | 10-11 10-11 10-11 |
3-5 6-7 8-9 |
4.14 4.14 4.14 |
13.47 13.47 13.47 |
0.00 0.12 0.45 |
0.00 0.90 2.85 |
4,14* 4.03* 3.69* |
.009 .005 .002 |
Table 5.
Bonferroni post hoc test with VD the type of activities on digital devices and VI the age groups of children.
Table 5.
Bonferroni post hoc test with VD the type of activities on digital devices and VI the age groups of children.
| Age range A |
Age range B |
Activities Mean A | Activities Mean B |
Mean differences (A-B) |
p | |||
|---|---|---|---|---|---|---|---|---|
| M | DS | M | DS | |||||
| Recreational activities | 8-9 10-11 10-11 |
3-5 3-5 6-7 |
3.22 3.38 3.38 |
0.72 0.71 0.71 |
2.84 2.84 2.96 |
0.66 0.66 0.70 |
0.38* 0.54* 0.41* |
.011 .000 .004 |
| Internet | 8-9 10-11 10-11 |
3-5 3-5 6-7 |
2.54 2.89 2.89 |
1.14 1.08 1.08 |
1.76 1.76 2.20 |
1.08 1.08 1.29 |
0.78* 1.10* 0.66* |
.001 .000 .006 |
Disclaimer/Publisher’s Note: The statements, opinions and data contained in all publications are solely those of the individual author(s) and contributor(s) and not of MDPI and/or the editor(s). MDPI and/or the editor(s) disclaim responsibility for any injury to people or property resulting from any ideas, methods, instructions or products referred to in the content. |
© 2025 by the authors. Licensee MDPI, Basel, Switzerland. This article is an open access article distributed under the terms and conditions of the Creative Commons Attribution (CC BY) license (http://creativecommons.org/licenses/by/4.0/).
Copyright: This open access article is published under a Creative Commons CC BY 4.0 license, which permit the free download, distribution, and reuse, provided that the author and preprint are cited in any reuse.


