Submitted:
26 April 2025
Posted:
28 April 2025
You are already at the latest version
Abstract
Glacier classification offers a structured framework for assessing and managing glacier resources, while understanding the responses of different glacier types to climate change is essential for revealing glaciological dynamics. In this study, we apply the China-specific Shi-Xie glacier classification system to systematically evaluate the transformation of extremely-continental, subcontinental, and maritime glaciers across China over the past four decades. Our results show a widespread rise in equilibrium line altitudes (ELAs), alongside complex changes in climatic and glaciological parameters. Notably, despite ongoing warming trends, nearly half of the glaciers experienced cooling at the ELA, and over two-thirds showed a decline in summer temperatures. Near-surface ice temperatures (20 m depth) were strongly consistent with changes in annual air temperature. Precipitation trends were regionally heterogeneous, yet around 70% of glaciers experienced stable or slightly increasing annual precipitation. In contrast, maritime glaciers particularly those in the southeastern regions such as the Hengduan Mountains exhibited marked decreases. Glacier velocities generally declined, with 90% of glaciers flowing at speeds below 50 meters per year. An analysis of classification threshold deviations reveals that glaciers in transitional zones frequently exhibit multi-indicator shifts. Extremely-continental glaciers near classification boundaries show signs of shifting toward warmer, wetter subcontinental conditions, while maritime glaciers tend to evolve toward drier, colder subcontinental characteristics. These findings offer new insights into the differentiated responses and ongoing transformation of glacier types in China under climate change.
Keywords:
Chinese glacier change
; glacier classification
; glacier transform
; continental glacier
; maritime glacier
1. Introduction
China hosts the largest number and total volume of glaciers at mid- and low latitudes globally [1]. These glaciers are concentrated on the Tibetan Plateau (TP) and its surrounding mountain ranges, including the Himalayas, Kunlun Mountains, Karakoram, Tien Shan, Hengduan Mountains, Qilian Mountains, and Altai Mountains. They provide crucial meltwater to downstream regions and contribute to the scenic landscapes, both of which are essential for the socio-economic development of cities in China's arid and semi-arid areas [2,3]. Spanning a vast geographic area, Chinese glaciers exhibit considerable spatial variability in hypsography, morphology, and ice flow dynamics. They are influenced by distinct atmospheric circulations, governed by the Indian monsoon and westerlies, with limited contributions from the East Asian monsoon [4]. Over the past two decades, climate change has driven significant glacier retreat [5], mass loss [6,7], surface velocity slowdown [8], and an increase in extreme geohazards, including large volume detachments [9,10,11] and glacial lake outburst floods [12,13,14]. These changes exhibit considerable spatial and temporal heterogeneity [5,15], driven largely by the diverse characteristics of glaciers and the varying patterns of climate change across China. To better understand these variations, a classification system is crucial for examining the distinct responses of glacier types to climate change. However, few studies have investigated Chinese glacier changes through a classification-based approach, limiting insights into the climate-induced impacts on specific glacier categories.
Glaciers have been categorized based on geographical distribution (e.g. Himalayan or Arctic type), source of nourishment (e.g. central firn cap or dendritic glacier system), thermal distribution (e.g. cold or polythermal type), climatic zone (tropical or continental type), and morphology (e.g. valley glacier or ice cap) [16]. These classification systems are widely used in glaciology for diverse studies. Given the extensive distribution of Chinese glaciers across various climatic zones and mountain ranges, Shi and Xie developed a classification system, referred to hereafter as the Shi-Xie classification, based on climatic and geophysical criteria [17]. This system categorizes glaciers into three types: extremely-continental, subcontinental and maritime. The Shi-Xie classification, subsequently refined with more detailed quantifications by later researchers [18,19,20], has been widely applied in textbooks [20], tourism development [21], and the guidance of typical glacier monitoring programs [22]. This classification is extensively used in both Chinese and HMA glaciological studies [23,24,25]. However, existing studies have largely focused on glacier type characteristics and the application of classification schemes, while lacking long-term, regional-scale assessments of glacier type transitions. Therefore, assessing changes in different glacier types within this classification over multiple periods is crucial. Such an assessment would enhance our understanding of two key aspects: whether glacier changes cause deviations from established criteria thresholds and whether glacier types transition into others.
This study assesses changes in different glacier types in China, based on the criteria defined by the Shi-Xie classification, over the past four decades. We focus on glaciers located at the boundaries between different types, as these are likely to experience rapid change and respond quickly to environmental shifts. Using climate reanalysis data, remote sensing data, and numerical models, we calculate the classification criteria. We then investigate the spatio-temporal changes of these criteria for individual glaciers and examine potential transitions between glacier types over the study period. This paper is structured as follows: First, we describe the study area and the investigated glaciers. Second, we detail the multi-source datasets used and the methods employed for climate data downscaling, equilibrium line altitude (ELA) modeling, and near-surface ice temperature modeling. Third, we analyze the results of the spatio-temporal changes in each criterion over the periods 1981-2000 and 2001-2020. Finally, we discuss the mechanisms driving the observed glacier changes and present our conclusions.
2. Study Glaciers
Chinese glaciers are distributed across the HMA regions, which include the Altai, Tien Shan, Pamir, Karakoram, Kunlun Mountains, Qilian Mountains, Himalaya, inner TP, southern and eastern TP and Hengduan Mountains. According to the second Chinese Glacier Inventory (hereafter CGI2), the total glacier area was approximately 43,087 km2 [1]. Extremely-continental, subcontinental, and maritime glaciers make up 32%, 46%, and 22%, respectively, of the total glacier area. To better understand the glacier type changes over the past four decades, we selected representative glaciers for detailed analysis based on the following criteria. First, all three glacier types should be included to ensure comprehensive representation. Second, glaciers from various mountains should be chosen to capture the diversity of climate regimes and glacier characteristics. Third, glaciers should be valley types with areas ranging from 10 to 40 km2, excluding surging glaciers. Lastly, glaciers should be situated at the boundaries of the three Chinese glacier types to capture the likely temporal variability of glacier characteristics. Ultimately, 80 glaciers were selected (Figure 1, Table S1). Among these selected glaciers, six have relatively long-term and comprehensive observations and are used to calibrate and validate our calculated glacier criteria (Figure 1, Table S2).
3. Data and Methods
3.1. Shi-Xie Classification Method
The Materials and Methods should be described with sufficient details to allow others to replicate and build on the published results. Please note that the publication of your manuscript implicates that you must make all materials, data, computer code, and protocols associated with the publication available to readers. Please disclose at the submission stage any restrictions on the availability of materials or information. New methods and protocols should be described in detail while well-established methods can be briefly described and appropriately cited. In this section, we describe the data and methods used to assess the changes in Chinese glaciers based on the Shi-Xie classification [17,26]. This classification system divides glaciers into extremely-continental (EXT), subcontinental (SUB), and maritime (MAR) types using five key glaciological and climatological criteria. These criteria include: (1) the annual mean temperature at the ELA (Ta), (2) the annual total precipitation at the ELA (Pa), (3) the summer mean temperature (June-August) at the ELA (Ts), (4) the annual mean ice temperature at a depth of 20 meters at the ELA (T20) and (5) the maximum velocity along the glacier centerline (v). Each glacier is classified according to specific thresholds as listed in Table 1, which collectively reflect its climatic and dynamic conditions.
3.2. Glacier Outlines
We selected representative Chinese glaciers based on the criteria described in Section 2, using the CGI2 as our primary dataset. The Randolph Glacier Inventory Version 6.0 (RGI 6.0) was not used for selection purposes because it lacks information on glacier national affiliation and omits some glaciers located in China. To extract the main centerlines of the selected glaciers, we utilized the publicly available global glacier centerline dataset generated by the Open Global Glacier Model (OGGM) [27], which is based on RGI 6.0. Fortunately, the Chinese glaciers we selected from CGI2 are also included in RGI 6.0, allowing for cross-referencing between the two datasets. By matching each glacier in CGI2 with its corresponding RGI ID, we extracted the main centerline for each glacier. These centerlines were subsequently used to sample surface elevation and glacier surface velocity along the glacier flowlines. In addition, the boundaries of different glacier types defined in the Shi-Xie classification scheme were manually digitized based on the map provided in [26].
3.3. DEMs
DEMs are used to derive the elevation of grid cells in the reanalysis dataset and to determine the ELAs. The elevation data for the reanalysis grid is obtained from SRTM30_PLUS, a global topography and bathymetry dataset with a spatial resolution of 30 arc seconds (approximately 1 km) [28]. SRTM30_PLUS was developed using multiple data sources, with land topography derived from SRTM and ICESat data. The ELA is computed by the Open Global Glacier Model (OGGM) through surface mass balance modelling [29]. For this purpose, we configured OGGM to use the SRTM V4.1 DEM with a spatial resolution of 90 m to derive the ELA.
3.4. Equilibrium Line Altitude
ELA is the altitude on a glacier where ablation equals to accumulation for the year. According to the classification criteria outlined in Table 1, ELA plays a crucial role in deriving the basic glaciological and climatological characteristics in Shi-Xie classification. We calculate the ELAs over the period 1980-2019 by modelling the annual mass balance using the OGGM[29]. OGGM utilizes the temperature-index method to model the surface mass balance with climate forcing inputs from GSWP3-W5E5 (see Section 3.4) [30]. To derive the ELA in a hydrological year, we first model the monthly mass balance along the glacier elevation bands. The surface mass balance in each elevation band z and month i is calculated as follows:
where is the monthly solid precipitation, are the degree-day factors for ice or snow, is the monthly temperature, and is the threshold temperature above which ice melt is assumed to occur (here set to -1°C). The surface air temperatures at different elevation bands were extrapolated using a constant monthly lapse rate -6.5 K km-1. The ELA is then determined at the altitude where the annual surface mass balance equals zero [29].
3.5. Meteorological Data at ELA
Meteorological data are essential for deriving glaciological and climatological indices in Shi-Xie classification. In this study, we extract 2 m air temperature and precipitation from the ERA5-Land climate reanalysis dataset. ERA5-Land provides higher spatial resolution (9 km grid) and temporal resolution (up to hourly) on a global scale, offering advantages over ERA5 and ERA-Interim [31]. Many studies have evaluated the performance of ERA5-Land in the HMA mountain regions, finding that it effectively captures the spatio-temporal patterns and extremes of temperature and precipitation [32,33,34].
For surface mass balance modeling and ELA calculation, OGGM uses the bias-adjusted ERA5 reanalysis data, specifically the GSWP3-W5E5 dataset, as its standard climate input. This dataset combines W5E5 data with homogenized GSWP3 data, providing global coverage at a 0.5° spatial resolution [30,35]. The high resolution and robust bias correction of GSWP3-W5E5, particularly for extreme values, make it well-suited for accurately modeling glacier surface mass balance.
To calculate the 2 m air temperature () and precipitation () at the ELA of each glacier, we use the ERA5-Land monthly averaged data spanning the period from 1980 to 2020. The closest ERA5-Land grid cell to each glacier's centroid is referred to as the reference grid, serving as the basis for these calculations. We first extract the time series of 2m temperature at the reference grid cell (). The elevation of the reference grid () is then determined by masking the SRTM30_PLUS DEM. Assuming a constant lapse rate () of -6.5 K km-1, is computed through linear interpolation as
calculation follows the interpolation method proposed by Huss and Hock [36]. We calculate the precipitation gradient using a linear regression method based on precipitation and elevation data from the Level-7 sub-basins of Hydro BASINS [37] ( Figure S1). We use the following equation to convert the relative precipitation gradient (; unit: % per 100 m):
where is the absolute precipitation gradient (unit: mm per 100 m), is the average precipitation over the basins [38]. is calculated as:
where is the precipitation at the reference grid cell, and is a correction factor to account for potential biases in the precipitation data.
3.6. Near-Surface Ice Temperature
The near-surface ice temperature (0-20 m depth) is influenced by the atmosphere and associated heat-water transport process. To estimate the long-term impacts of climate change on near-surface thermal state at the ELA, we only consider the heat conduction process and assume that the ice temperature at 20 m depth (T20) does not fluctuate with seasonal atmosphere change. A one-dimensional heat conduction model is used to simulate the near-surface temperature:
where T is the ice temperature, t is the time, k is the thermal conductivity of ice, ρ is the ice density, and cp is the specific heat capacity of ice. Equation (5) is numerically solved using the finite difference method. We first assume the initial ice column temperature at the ELA is isothermal and equals to the annual mean surface air temperature of last year. The basal boundary condition is set to zero heat flux. We then use the daily ERA5-Land air temperature to force this one-dimensional temperature model over the hydrological year. We take the modelled to represent the near-surface thermal state at the ELA.
3.7. Glacier Surface Velocities
Glacier surface velocities are the sum of contributions from both ice deformation and basal sliding. Monitoring the long-term changes in surface glacier velocity can enhance our understanding of glacier dynamics and their evolution. Due to logistics challenge and remoteness, glacier velocity measurements in China are restricted to a few glaciers and are not continuous both in space and in time [39]. Benefiting from achievements in remote sensing techniques, a few global-scale glacier velocity products are now publicly available [40,41,42]. We use the long-term time series of ITS_LIVE (Inter-Mission Time Series of Land Ice Velocity and Elevation) product to derive the velocities of individual glaciers. The ITS_LIVE offers high-resolution measurements of glacier and ice sheet surface velocities with data spanning from 1985 to 2018. It uses the auto-RIFT processing chain to derive glacier velocities from Landsat 4, 5, 7, and 8 satellite imagery. In this study, we use the yearly ITS_LIVE velocity dataset (240 m horizontal resolution) over the period 1985-2018. From this dataset, we extract the maximum flow speeds for each glacier along its centerline. These glacier centerlines were generated by OGGM using the method proposed by [43].
4. Results
4.1. Calibration and Validation
Precipitation in mountainous regions is spatially heterogeneous due to rugged topography and is less well-constrained because of sparse rain gauge data. To address this, we calibrated the parameters and used in our precipitation interpolation method, using observed precipitation data from six glaciers (see Table 2). The results show that the adjustment factor ranges from 0.60 to 1.15, with higher values observed for maritime glaciers, such as the PL4 and HLG glaciers, compared to other glaciers. The precipitation gradient varies from -3.4%/100 m to 4.5%/100 m, reflecting significant spatial variability. Notably, is negative for maritime glaciers and positive for continental glaciers. For the subsequent analysis, we used the average value derived from these six glaciers for precipitation interpolation. A sensitivity analysis of the impact of on the derived glacier criteria in the Shi-Xie classification is provided in Section 5.
The ELA is critical for calculating key criteria (e.g., Ta) in the Shi-Xie classification. To validate the modelled ELAs from OGGM, we compared them with observed ELAs from Chinese glaciers. Observed ELA data for calibration were obtained from six representative glaciers across different glacier types and regions (Table S3). As shown in Figure 2, the modelled ELAs generally agree well with the observations. Some deviations may stem from uncertainties in the reanalysis climate data, downscaling methods, and degree-day factors. Despite these discrepancies, the modelled ELAs offer a reliable foundation for deriving the criteria used in the Shi-Xie classification.
In addition to validating the modelled ELAs, we compared the calculated glacier criteria at the ELA, including Ta, Pa, Ts, and T20, with available observations. Figure 3 showed generally strong agreement with observations. For most of the criteria, the correlation was high, with R2 values ranging from 0.61 to 0.92. The strongest correlations were observed for Ts and T20, indicating that the calculated values closely match the observed data. Despite some variability, particularly in Ta, the overall results demonstrate the reliability of the calculated criteria used in the Shi-Xie classification framework.
4.2. Spatiotemporal Distribution of ELAs and Glacier Criteria
We assessed the spatial distributions of the classification criteria for the periods 1982-2000 and 2001-2019, and compared their temporal changes between these two periods. Although the ELA is not an indicator in the Shi-Xie classification, it is essential for deriving the other criteria. Therefore, we present its spatio-temporal distributions alongside the other measures.
4.2.1. Distribution over the Period 1982-2000
- ELA
The spatial distributions of ELAs and the five classification criteria for the study glaciers during the period 1982-2000 are shown in Figure 4a. The ELA distribution exhibited zonality both latitudinally and longitudinally. Overall, ELAs decreased from the Himalayas to the Altai Mountains, with values ranging from 6138 m to 3247 m, while they increased from the eastern periphery of the TP toward its inner regions and the western Himalayas, with values ranging from 4800 m to 6100 m. The lowest ELAs were found in the Tien Shan and Altai Mountains, where the mean value was approximately 4,000 m. Other regions with relatively low ELAs included the Pamir, Karakoram, Kunlun Mountains, Qilian Mountains, Hengduan Mountains, and eastern TP. The highest ELAs were concentrated in the inner TP and the Himalayas, with values generally around 6000 m.
The ELAs of extremely-continental glaciers were the highest among the three glacier types, with a mean of 5459 m. In comparison, the mean ELAs for the subcontinental and maritime types were 5125 m and 5302 m, respectively. Each glacier type exhibited substantial ELA variability across its wide geographical range. Subcontinental glaciers, which span the largest geographical area from the Himalayas to the Altai Mountains, showed the greatest variability, with ELAs ranging from 3247 m to 6138 m and a standard deviation of 811 m. Maritime glaciers, primarily located in the eastern Himalayas, southern and eastern TP, and Hengduan Mountains, exhibited the lowest variability, with a standard deviation of 372 m. The ELAs of extremely-continental glaciers generally increased toward the inner TP, reaching a maximum of 6137 m.
- 2.
- Annual mean temperature at ELA (Ta)
The distribution of Ta (Figure 4b) shows that the highest Ta values were found in the southeastern part of the study region, including the Hengduan Mountains, eastern Himalayas, and southern and eastern TP, where glaciers were predominantly maritime. In contrast, the lowest Ta values were observed in the Pamir, Karakoram, and Kunlun Mountains. The eastern and central Himalayas, as well as the Tien Shan, also exhibited relatively high Ta values. Glaciers in the inner TP displayed moderate Ta values compared to other regions.
When compared to the thresholds of Ta for individual glacier types, we found that more than one-third of the glaciers shifted from their respective thresholds, with 14 glaciers exceeding and 14 glaciers falling below their thresholds. The glaciers with Ta values below their corresponding thresholds were primarily maritime (9 glaciers) and subcontinental types (5 glaciers), concentrated in the Karakoram and the southeastern part of the study region, including the Nyainqentanglha, Hengduan Mountains, and eastern Himalayas. In contrast, the glaciers with Ta values exceeding their thresholds were mostly extremely-continental (12 glaciers, more than 85%) and two subcontinental glaciers. These extremely-continental glaciers were located in the inner TP, Kunlun Mountains, Pamir, and Qilian Mountains, while the two subcontinental glaciers exceeding the threshold were dispersed across the eastern Tien Shan and eastern Himalayas.
- 3.
- Summer mean temperature at ELA (Ts)
The spatial pattern of Ts (Figure 4c) closely resembled that of the annual mean temperature Ta (Figure 4b). Over 60% of glaciers had a summer mean temperature above 0°C (Ts>0℃), spanning various regions of China and encompassing different glacier types. Almost all maritime glaciers (13 out of 16) exhibited Ts>0℃. Similarly, nearly all subcontinental glaciers in the Tien Shan and Altai Mountains had Ts>0℃. Extremely-continental glaciers with Ts>0℃ were predominantly located at the boundary between extremely-continental and subcontinental glacier types. In contrast, extremely-continental glaciers with Ts<0℃ were mainly concentrated in the Kunlun Mountains, inner TP, and Pamir. Subcontinental glaciers with Ts<0℃ were primarily located in the Karakoram and Himalayas.
Compared to the Ts thresholds in the Shi-Xie classification, we found that more than one-third of the glaciers had Ts values surpassing their respective thresholds (28 glaciers), while 19% had Ts values falling below the thresholds (15 glaciers). The remaining 46% of glaciers (37 glaciers) stayed within their corresponding threshold limits. Among the glaciers whose Ts values went above the threshold values, the majority were extremely-continental glaciers (79%), predominantly located in the inner TP and Kunlun Mountains. For glaciers with Ts values below the specified thresholds, 80% were subcontinental glaciers, mainly found in the Himalayas and Karakoram, with only 3 maritime glaciers and no extremely-continental glaciers.
- 4.
- Annual precipitation at ELA (Pa)
Figure 4d shows the spatial distribution of Pa, which exhibits a distinctly polarized pattern. Pa values were generally above 1100 mm in Hengduan Mountains, with extreme values exceeding 2000 mm, while in the western Kunlun Mountains, they were less than 400 mm. High Pa values (>900 mm) were concentrated in the southeastern part of China's glacierized regions, including the Hengduan Mountains, eastern Himalayas, and Nyainqentanglha, where glaciers were predominantly of the maritime type. In contrast, regions with low precipitation (<400 mm) were found in the Kunlun Mountains, inner TP, Karakoram, western Himalayas, and Qilian Mountains, where glaciers were primarily of the extremely-continental type.
During the period 1982-2000, the Pa values of 70% of the glaciers (56 out of 80) remained stable within their respective thresholds. Approximately 13% of glaciers exhibited increasing precipitation trends, with Pa values surpassing their corresponding thresholds. These glaciers were mainly located in the inner TP, with a few scattered in the Himalayas, Kunlun Mountains, Qilian Mountains, and Tien Shan. Meanwhile, 17% of glaciers showed a decrease in Pa, with values falling below their threshold limits. These glaciers were primarily subcontinental types, located in the Karakoram, western Himalayas, Qilian Mountains, and Tien Shan.
- 5.
- Annual mean 20m ice temperature (T20)
The spatial pattern of T20 over the period 1981-2000 closely mirrors that of Ta (Figure 4e). High T20 areas were concentrated in the southeastern part of the study region, coinciding with regions of high Ta. In contrast, low T20 values were found mainly in the Karakoram, Kunlun Mountains, and Pamir mountains, which are among the colder glacierized regions in China.
When comparing T20 values to the thresholds for each glacier type, we observed that the changes in T20 were not consistent with those in Ta. Approximately 42.5% of glaciers remained stable within their respective T20 thresholds, primarily located in the inner TP, Kunlun Mountains, Tien Shan, and Himalayas, and mostly belonging to the extremely-continental type. Around 45% of glaciers experienced a decrease in ice temperature, falling below their respective T20 thresholds. These glaciers were primarily located outside the extremely-continental glacier zone. All maritime glaciers and 60% of subcontinental glaciers had T20 values below their thresholds. Only about 12.5% of glaciers (10 out of 80) surpassed their T20 thresholds and became warmer; these were all extremely-continental glaciers located in the Kunlun Mountains, Pamir, inner TP, and Qilian Mountains.
- 6.
- Maximum glacier surface velocity (v)
Figure 4f illustrates the spatial distribution of v along glacier centerlines. Overall, glacier surface velocities across the study region were generally slow, with nearly 90% of glaciers having velocities below 50 m a-1. Regions with faster glacier flow were primarily concentrated in the maritime zone, particularly in the Hengduan and Nyainqentanglha mountains. In other mountainous areas, glacier surface velocities exhibited heterogeneous patterns.
When compared to the velocity thresholds defined in the Shi-Xie classification, most glacierized regions (85% of glaciers) experienced significant slowdowns, falling below the thresholds for their respective glacier types during the period 1981-2000. Only about 15% of glaciers remained stable within their thresholds, and these were scattered across all three glacier types. Notably, no glaciers exhibited speedup during this period.
4.2.2. Distribution over the Period 2001-2019
Figure 5 shows the spatial distributions of ELAs and classification criteria for the period 2001-2019. The ELAs of all glaciers increased during this period by 21-205 m compared with the period 1982-2000 (Figure 4a).
The values of the criteria at the ELA vary dynamically as the ELA itself shifts in response to environmental changes. As the ELAs rises, the 2m air temperature at the ELAs decreases due to the adiabatic lapse rate, which partially offsets the effects of climate warming. Consequently, the criteria Ta, Ts, and T20 for 2001-2019 (Figure 5b, c, and e) show similar positive or negative variations relative to the classification thresholds as those for 1982-2000 (Figure 4b, c, and e). For the annual precipitation averaged over 2001-2019, it shows significant increase partially due to the ELAs rise (Figure 5d and Figure 4d). However, the spatial pattern of Pa also exhibits comparable increases or decreases relative to the classification thresholds, consistent with those observed for the period 1982-2000. When compared to the thresholds of surface velocity (v), the spatial pattern of v during the period 2001-2019 was similar to that observed in 1982-2000 (Figure 5f and Figure 4f). Most glaciers experienced a slowdown, with their velocities falling below the respective thresholds. Only seven glaciers maintained stable velocities within their thresholds, while two subcontinental glaciers in the Kunlun Mountains exhibited acceleration, surpassing their threshold values.
4.2.3. Changes Between the Two Periods
We further analyzed the differences in the ELA and the five classification criteria between the periods 2001-2019 and 1982-2000 (Figure 6). Glaciers in the Qilian Mountains, Karakoram, and western Himalayas experienced higher ELA increases (>90 m) compared to other regions, whereas glaciers in the western Kunlun Mountains, southern, and eastern Tibetan Plateau showed relatively smaller increases (<50 m) among the investigated glaciers. This spatial heterogeneity in ELA rise is particularly pronounced in the Karakoram region, where the large ELA increase is also associated with corresponding decreases in air temperature at the ELA.
The difference map of the annual mean 2m air temperature at the ELA (ΔTa) (Figure 6b) reveals that 46.25% of glaciers (37 out of 80) experienced colder conditions at the ELA (ΔTa < -0.1℃) during 2001-2019 compared to 1982-2000. These glaciers, spanning various mountain ranges and glacier types, were primarily distributed in the Himalayas, inner TP, and Qilian Mountains. Among them, 84% were classified as continental glaciers. On average, the ELA of these glaciers rose by 92.4 m relative to the earlier period. In contrast, 12.5% of glaciers (10 out of 80) exhibited warmer conditions at the ELA (ΔTa > +0.1℃). These glaciers were mainly located in the western Kunlun Mountains and Tien Shan. The mean ELA of these glaciers increased by 58.5 m during 2001-2019 compared to 1982-2000. Meanwhile, more than 40% of glaciers showed relatively stable Ta values, with absolute ΔTa changes of less than 0.1℃. These glaciers were predominantly found in the southeastern glacierized regions, including Nyainqentanglha, Hengduan Mountains, and the eastern Himalayas, as well as the Pamir-Karakoram-Kunlun Mountains regions. For this group, the mean ELA rose by 70.7 m between the two periods.
The temporal variation of Ts between the two periods reveals that 67.5% of glaciers experienced a decrease in summer mean temperature at the ELA (ΔTs < -0.1℃), while 12.5% experienced an increase (ΔTs > +0.1℃), with average changes of -0.40°C and +0.25°C, respectively (Figure 6c). In contrast, 20% of glaciers exhibited relatively stable summer temperatures, with changes ranging from -0.1°C to +0.1°C. These glaciers were sparsely distributed, with a mean ELA rise of 71.7 m. Glaciers in the Himalayas, Karakoram, Pamir, most of the inner TP, and many maritime glaciers showed a decrease in Ts, with a mean ELA rise of 81.6 m compared to the previous period. In contrast, glaciers in the Tien Shan, Qilian Mountains, and eastern Kunlun Mountains experienced an increase in Ts, with an average ELA rise of 78.3 m.
The analysis of precipitation changes (ΔPa) at the ELA between the periods 2001-2019 and 1982-2000 reveals a notable divergence in the response of glaciers (Figure 6d). About 27.5% of glaciers experienced a decrease in precipitation (ΔPa < 0 mm), with most of these glaciers being maritime types and some located from the Pamir to the western Himalayas. The pronounced precipitation decrease occurred in the Hengduan Mountains with a mean ΔPa of -288.7 mm. In contrast, 72.5% of glaciers exhibited an increase in precipitation at the ELA (ΔPa > 0 mm) compared to the earlier period, and the precipitation increase was less than 100 mm. Despite the differing precipitation trends, the mean ELA rise was similar for both groups: 79.1 m for glaciers with increased precipitation and 79.4 m for those with decreased precipitation.
The temporal variation of the 20 m ice temperature at the ELA between the two periods (ΔT20) ranged from -0.75℃ to 0.49℃ (Figure 6e). The spatial patterns of ΔT20 and ΔTa were largely similar, except for a small subset of glaciers (11 out of 80) (Figure 6b and e). These glaciers exhibited an increasing trend in near-surface ice temperature (ΔT20 > 0) compared to the decreasing trend in annual mean 2 m air temperature (ΔTa < 0) between the two periods. Such glaciers were sparsely distributed across Chinese glacierized regions, with a relatively higher concentration among maritime glaciers.
Figure 6f shows the velocity differences of individual glaciers between the two periods. Approximately 44.3% of glaciers showed positive changes (Δv > 0), while 55.7% exhibited negative changes (Δv < 0). Using a threshold of ±1.6 m a-1 to account for uncertainties in satellite-derived surface velocities [8], glaciers were classified as experiencing speedup (Δv > +1.6 m a-1), slowdown (Δv < +1.6 m a-1), or stable flow (|Δv |≤1.6 m a-1). We revealed that 46.8% of glaciers underwent slowdown, 35.5% experienced speedup, and 17.7% maintained a stable flow state during 2001–2019 compared to 1982–2000. Accelerated glaciers were primarily located in the Kunlun Mountains, characterized as extremely-continental, and in southeastern glacierized regions, including the Hengduan Mountains, Nyainqentanglha, and eastern Himalayas, which were predominantly maritime. The decelerated glaciers were broadly distributed across Chinese glacierized regions, whereas the stable glaciers were sparse and lacked a clear geographical concentration.
4.3. Threshold-Based Transitions in Glacier Types
Figure 7 illustrates the spatial distribution of glaciers deviating from classification thresholds during the periods 1982-2000 and 2001-2019. The overall pattern remains relatively consistent across both periods. Glaciers with the highest number of deviations are primarily concentrated in the Karakoram, western Kunlun Mountains, Qilian Mountains, and maritime glacierized regions. In contrast, only two glaciers in the first period and one in the second remained entirely within the classification thresholds, all of which belong to the extremely-continental type. Notably, glaciers with all five classification criteria exceeding the thresholds are clustered in the Karakoram and western Kunlun Mountains, underscoring these regions as key transition zones. Glaciers in the Tien Shan and inner TP show relatively fewer deviations from the thresholds, while those at the boundaries between glacier types exhibit a marked increase in classification deviations.
Among extremely-continental glaciers, those along the Kunlun-Qilian transect and in the Gangdise and Tanggula Mountains near the subcontinental boundary exhibit more than three criteria exceeding the classification threshold. The former group primarily deviates in Ta, Ts, Pa and T20, while the latter mainly in Ta and Ts. Additionally, glaciers in these regions generally have lower surface velocities than the extremely-continental glacier threshold. Among subcontinental glaciers, those in the Karakoram region have all five criteria below the threshold, closely resembling extremely-continental glaciers. In contrast, glaciers in the Tien Shan and Altai Mountains typically deviate in two criteria (T20 and v) are lower, while Ts is higher than the threshold reflecting distinct differences in thermal and dynamic characteristics. Maritime glaciers near the subcontinental boundary in the eastern Himalayas and southern and eastern TP predominantly show (Pa, T20, and v) below the threshold, indicating similarities with subcontinental glaciers. Similarly, glaciers in the Hengduan Mountains tend to have three criteria (Ta, T20, and v), falling below the threshold, suggesting a shift toward more continental characteristics.
5. Discussion
5.1. Drivers of Glacier Criteria Changes
Changes in glacier classification criteria across China from 1982 to 2019 reveal emerging tendencies toward glacier type transitions. Glacier classification is governed by climatic, thermal, and dynamic factors, and their temporal changes should be interpreted in the context of changes in large-scale circulation systems, regional climate regimes, glacier morphology like topography and glacier dynamic processes.
ELA plays a pivotal role in glacier classification, as four of the five criteria in the Shi-Xie scheme are defined at the equilibrium line. Under sustained glacier mass loss, ELA across China's glacierized regions has exhibited a rising trend [6,44], with a marked acceleration after 2000. This rise is primarily driven by enhanced ablation due to rising air temperatures and reduced solid precipitation [45]. However, the rate and spatial pattern of ELA changes vary across glacier types. For continental glaciers, ELA rise is mainly linked to decreased precipitation resulting from weakened westerlies and monsoonal activity [46]. For maritime glaciers, the mass loss and resulted ELA rise after 2000 were mainly caused by the decreased solid precipitation ratio and precipitation amount during the monsoon season [47]. The magnitude of ELA rise is a direct indicator of glacier sensitivity to climate forcing [48,49]. Moderate increases suggest a relatively balanced adjustment to environmental change, whereas sharp rises may indicate an accelerated, and possibly unsustainable, glacier response. Since four criteria in the Shi-Xie scheme are defined at the ELA, any shift in ELA due to climatic forcing directly propagates through the classification system, particularly through temperature-based indicators shaped by vertical lapse rates.
The observed ELA shifts thus highlight the underlying climatic drivers shaping glacier environments. Beyond direct warming effects, glacier climate indicators are influenced by atmospheric circulation patterns, regional topography, and elevation dependent feedbacks. While global warming has elevated air temperatures across glacierized regions, temperature changes at the ELA are further modulated by lapse rates and glacier elevation [50,51]. Due to the elevation dependent warming and the vertical shift of the ELA [52], more than half of China's glaciers exhibit decreasing mean annual and summer temperatures, despite the general warming trend. Precipitation patterns across the Tibetan Plateau reflect a warm-wet shift, shaped by the interplay of monsoonal systems, westerlies, and local circulation [53,54]. In the eastern semi-arid to semi-humid regions, increased precipitation has enhanced glacier accumulation. Conversely, in maritime glacier regions, weakened Indian monsoons and reduced moisture transport have led to precipitation declines and diminished mass input. However, in some areas such as the Kunlun and Qilian Mountains, local circulation adjustments have slightly increased precipitation, promoting a transition toward subcontinental glacier characteristics [55]. Overall, maritime glaciers are characterized by high temperatures and abundant precipitation, with mass balance primarily sustained by snowfall. Extremely-continental glaciers remain cold and arid, with low ablation rates and high thermal stability. Subcontinental glaciers, influenced by both westerlies and monsoons, display complex responses to climatic regime shifts, reflecting their transitional nature.
In this study, the 20 m ice temperature is simulated based on conductive heat transfer and is primarily controlled by surface air temperature at the ELA [56,57]. Assuming constant mean annual air temperature, an upward shift in the ELA effectively leads to lower air temperatures at that altitude due to lapse rate effects, resulting in a corresponding decline in the modeled 20 m ice temperature. This cooling mechanism is particularly evident in regions with rapidly rising ELAs, such as the Himalayas, Hengduan Mountains, and southeastern Tibetan Plateau. In contrast, regions like the Kunlun and Qilian Mountains, where ELA elevation is relatively stable or warming is more pronounced, exhibit increasing ice temperatures. Overall, changes in 20 m ice temperature reflect the combined influence of ELA variability and regional climate trends. Notably, in maritime glacier regions with frequent ELA fluctuations, significant cooling at glacier margins suggests an ongoing thermal transition toward subcontinental glacier characteristics.
Glaciers of different types have generally experienced a reduction in surface velocity, with mean flow speeds falling below their respective dynamic thresholds. This slowdown is primarily caused by glacier thinning, which reduces ice thickness and subsequently lowers gravitational driving stress, weakening overall glacier dynamics [58,59,60]. Since 2000, glaciers in the high mountain regions of Asia have shown a widespread and persistent deceleration. The decline in driving stress, largely controlled by changes in surface slope and ice thickness, is especially evident in areas with pronounced thinning [8]. Maritime glaciers, influenced by high precipitation and relatively warm ice temperatures under monsoonal climates, still maintain relatively high velocities in some regions. However, accelerated surface melting has led to rapid thinning, which in turn causes significant reductions in flow speed. In contrast, continental glaciers located in cold and arid regions with low precipitation and basal temperatures exhibit low deformation capacity. These glaciers continue to slow due to limited sliding and internally rigid thermal conditions.
5.2. Limitations
While this study provides a comprehensive assessment of glacier transformations in China, several limitations should be acknowledged. These include uncertainties in ELA estimation due to limited observational data, potential biases in climate inputs from ERA5-Land reanalysis, and spatial and temporal gaps in glacier velocity datasets. Additionally, the small number of reference glaciers used for calibration and validation may affect the representativeness of our findings.
ELA is a key glaciological variable for deriving classification criteria in the Shi-Xie scheme. However, due to the limited availability of mass balance measurements, observed ELA data exist for only a few glaciers. To address this, we rely on surface mass balance modeling using OGGM to estimate ELA. Although the modeled ELAs were calibrated and validated using geodetic mass balance data, assessing their performance across different glacierized regions in China remains challenging due to regional variations in glacier-climate interactions.
The ERA5-Land reanalysis dataset is essential for calculating the climatological and thermal indicators in the Shi-Xie scheme. Despite its high spatial resolution (9 km), temperature and precipitation estimates remain uncertain in glacierized regions with complex topography and large elevation ranges. Furthermore, the downscaling method introduces additional uncertainties. We applied a constant lapse rate, however, lapse rates vary both spatially and temporally. Although we incorporated precipitation gradient parameters that differ across catchments, they may still fail to fully capture the localized variability of mountain precipitation.
Glacier surface velocity data (ITS_LIVE, 240 m resolution) spans from 1985 to 2018, but its temporal coverage does not fully align with the climate dataset, which may introduce uncertainties in the analysis of glacier velocity-climate relationships. Additionally, ITS_LIVE has spatial data gaps, such as missing velocity data in the Altai Mountains, limiting its applicability in certain regions. Another source of uncertainty arises from the estimation of ice temperature at 20 m depth, which only accounts for conductive heat transfer while neglecting more complex thermal processes, such as latent heat release from meltwater refreezing, which can influence near-surface ice temperature.
This study relies on measurements from only six glaciers, which may limit the spatial representativeness of our assessment, particularly regarding the diversity of glacier types. Future research should integrate a broader range of in situ measurements, satellite observations, and model simulations (such as modeled ELA) to improve calibration and validation. Expanding the dataset will enhance the robustness of our assessment and provide a more comprehensive understanding of glacier transformations in China.
6. Conclusions
This study provides a comprehensive assessment of the spatial and temporal changes in ELA and five glacier classification-related criteria for representative glaciers across China during from 1982 to 2019. The results reveal regionally distinct glacier responses and evolving classification tendencies under climate change.
Overall, ELAs have risen across China, with the most significant increases observed in the Qilian Mountains, Karakoram, and western Himalayas. Despite ongoing warming, the altitude-induced cooling effect has led to declining air temperatures at the ELA for approximately 50% of the studied glaciers and summer temperature declines for 67.5%. Near-surface ice temperatures exhibit strong consistency with the observed changes in annual air temperature. Precipitation trends at the ELA show strong regional heterogeneity. While approximately 70% of glaciers experienced stable or slightly increasing annual precipitation, maritime glaciers, particularly those in southeastern regions, e.g., Hengduan Mountains, experienced significant decreases. 90% of the studied glaciers flow at speeds below 50 m·a⁻¹, indicating a widespread slowdown.
Glaciers near classification boundaries, particularly in the Karakoram, Qilian, and Hengduan Mountains, frequently exhibited multiple criteria deviations from their individual thresholds. Among extremely-continental glaciers, the proportion exceeding classification thresholds rose by ~55% (from 31 to 48 glaciers), reflecting a shift toward subcontinental characteristics. In contrast, deviations in maritime glaciers declined by ~18% (from 49 to 40 glaciers), suggesting improved classification stability, though some retained subcontinental tendencies.
These findings highlight the critical role of regional climate variability in reshaping glacier characteristics and classification stability across China. By quantifying ELA shifts and threshold deviations, this study provides a baseline for predicting future glacier changes, with important implications for water resource management and climate adaptation strategies in vulnerable mountain regions.
Supplementary Materials
The following supporting information can be downloaded at: https://www.mdpi.com. Table S1: Basic information of 80 sample glaciers; Table S2: Basic information of six glaciers used for calibration and validation; Table S3: Sources of partial indicator observation data and ELA data; Figure S1: Precipitation gradient distribution in Level-7 basin.
Author Contributions
Conceptualization, Y.W. and T.L.; methodology, Y.W. and T.L.; writing—review and editing, Y.W., T.L., B.H., H.A., L.W. and W.S.; visualization, Y.W. and T.L. All authors have read and agreed to the published version of the manuscript.
Funding
This research was supported by the Young Doctoral Program Start-up Fund of Shandong Normal University, the Shandong Provincial Natural Science Foundation (Grant No. ZR2023QD078), and the National Natural Science Foundation of China (Grant No. 42271134).
Data Availability Statement
The RGI 6.0 glacier inventory is available at https://www.glims.org/RGI/randolph60.html (accessed on 1 December 2024). ERA5-Land reanalysis data can be accessed through the Copernicus Climate Data Store. The ITS_LIVE dataset can be accessed at https://nsidc.org/apps/itslive (accessed on 1 December 2024). The SRTM30_PLUS topography dataset is available at http://topex.ucsd.edu/WWW_html/srtm30_plus.html (accessed on 1 December 2024). OGGM-derived glacier centerline data are available from https://cluster.klima.uni-bremen.de/~oggm/assets/oggm_v1.4/centerlines_shapes (accessed on 1 December 2024).
Acknowledgments
We would like to thank Professor Jiawen Ren for his advices regarding the classification criteria.
Conflicts of Interest
The authors declare no conflicts of interest.
References
- Guo, Wanqin, Shiyin Liu, Junli Xu, Lizong Wu, Donghui Shangguan, Xiaojun Yao, Junfeng Wei, Weijia Bao, Pengchun Yu, Qiao Liu, and Zongli Jiang. "The Second Chinese Glacier Inventory: Data, Methods and Results." Journal of Glaciology 61, no. 226 (2015): 357-72.
- Kang, Ersi, Chaohai Liu, Zichu Xie, Xin Li, and Yongping Shen. "Assessment of Glacier Water Resources Based on the Glacier Inventory of China." Annals of Glaciology 50, no. 53 (2009): 104-10.
- Xiao, Cunde, Shijin Wang, and Dahe Qin. "A Preliminary Study of Cryosphere Service Function and Value Evaluation." Advances in Climate Change Research 6, no. 3 (2015): 181–87. [CrossRef]
- Yao, Tandong, Lonnie Thompson, Wei Yang, Wusheng Yu, Yang Gao, Xuejun Guo, Xiaoxin Yang, Keqin Duan, Huabiao Zhao, Baiqing Xu, Jiancheng Pu, Anxin Lu, Yang Xiang, Dambaru B. Kattel, and Daniel Joswiak. "Different Glacier Status with Atmospheric Circulations in Tibetan Plateau and Surroundings." Nature Climate Change 2, no. 9 (2012): 663-67. [CrossRef]
- Wang, Ninglian, Tandong Yao, Baiqing Xu, An'an Chen, and Weicai Wang. "Spatiotemporal Pattern, Trend, and Influence of Glacier Change in Tibetan Plateau and Surroundings under Global Warming." Bulletin of Chinese Academy of Sciences 34, no. 11 (2019): 1220–32.
- Shean, David E., Shashank Bhushan, Paul Montesano, David R. Rounce, Anthony Arendt, and Batuhan Osmanoglu. "A Systematic, Regional Assessment of High Mountain Asia Glacier Mass Balance." Frontiers in Earth Science 7 (2020). [CrossRef]
- Hugonnet, Romain, Robert McNabb, Etienne Berthier, Brian Menounos, Christopher Nuth, Luc Girod, Daniel Farinotti, Matthias Huss, Ines Dussaillant, Fanny Brun, and Andreas Kääb. "Accelerated Global Glacier Mass Loss in the Early Twenty-First Century." Nature 592, no. 7856 (2021): 726-31. [CrossRef]
- Dehecq, Amaury, Noel Gourmelen, Alex S. Gardner, Fanny Brun, Daniel Goldberg, Peter W. Nienow, Etienne Berthier, Christian Vincent, Patrick Wagnon, and Emmanuel Trouvé. "Twenty-First Century Glacier Slowdown Driven by Mass Loss in High Mountain Asia." Nature Geoscience 12, no. 1 (2019): 22–27. [CrossRef]
- Kääb, Andreas, Silvan Leinss, Adrien Gilbert, Yves Bühler, Simon Gascoin, Stephen G. Evans, Perry Bartelt, Etienne Berthier, Fanny Brun, Wei-An Chao, Daniel Farinotti, Florent Gimbert, Wanqin Guo, Christian Huggel, Jeffrey S. Kargel, Gregory J. Leonard, Lide Tian, Désirée Treichler, and Tandong Yao. "Massive Collapse of Two Glaciers in Western Tibet in 2016 after Surge-Like Instability." Nature Geoscience 11, no. 2 (2018): 114–20. [CrossRef]
- Yao, Tandong, Wusheng Yu, Guangjian Wu, Baiqing Xu, Wei Yang, Huabiao Zhao, Weicai Wang, Shenghai Li, Ninglian Wang, Zhongqin Li, Shiyin Liu, and Chao You. "Glacier Anomalies and Relevant Disaster Risks on the Tibetan Plateau and Surroundings." Science Bulletin 64, no. 27 (2019): 2770-82. [CrossRef]
- An, Baosheng, Weicai Wang, Wei Yang, Guangjian Wu, Yanhong Guo, Haifeng Zhu, Yang Gao, Ling Bai, Fan Zhang, Chen Zeng, Lei Wang, Jing Zhou, Xin Li, Jia Li, Zhijun Zhao, Yingying Chen, Jingshi Liu, Jiule Li, Zhongyan Wang, Wenfeng Chen, and Tandong Yao. "Process, Mechanisms, and Early Warning of Glacier Collapse-Induced River Blocking Disasters in the Yarlung Tsangpo Grand Canyon, Southeastern Tibetan Plateau." Science of The Total Environment 816 (2022): 151652-52. [CrossRef]
- Zheng, Guoxiong, Simon Keith Allen, Anming Bao, Juan Antonio Ballesteros-Cánovas, Matthias Huss, Guoqing Zhang, Junli Li, Ye Yuan, Liangliang Jiang, Tao Yu, Wenfeng Chen, and Markus Stoffel. "Increasing Risk of Glacial Lake Outburst Floods from Future Third Pole Deglaciation." Nature Climate Change 11, no. 5 (2021): 411–17. [CrossRef]
- Zhang, Taigang, Weicai Wang, Baosheng An, and Lele Wei. "Enhanced Glacial Lake Activity Threatens Numerous Communities and Infrastructure in the Third Pole." Nature Communications 14, no. 1 (2023): 8250. [CrossRef]
- Zhang, Guoqing, Jonathan L. Carrivick, Adam Emmer, Dan H. Shugar, Georg Veh, Xue Wang, Celeste Labedz, Martin Mergili, Nico Mölg, Matthias Huss, Simon Allen, Shin Sugiyama, and Natalie Lützow. "Characteristics and Changes of Glacial Lakes and Outburst Floods." Nature Reviews Earth & Environment 5, no. 6 (2024): 447-62. [CrossRef]
- Su, Bo, Cunde Xiao, Deliang Chen, Yi Huang, Yanjun Che, Hongyu Zhao, Mingbo Zou, Rong Guo, Xuejia Wang, Xin Li, Wanqin Guo, Shiyin Liu, and Tandong Yao. "Glacier Change in China over Past Decades: Spatiotemporal Patterns and Influencing Factors." Earth-Science Reviews 226 (2022): 103926-26. [CrossRef]
- Hagg, Wilfried. Glaciology and Glacial Geomorphology: Springer Berlin, Heidelberg, 2022.
- Shi, Yafeng, and Zichu Xie. "Fundamental Characteristics of Modern Glaciers in China." Acta Geographica Sinica 30, no. 3 (1964): 183-213.
- Lai, Zuming, and Maohuan Huang. "The Fuzzy Cluster Analysis of Glaciers in China." Science Bulletin 33, no. 16 (1988): 1250-53.
- Shi, Yafeng, and Shiyin Liu. "Estimation on the Response of Glaciers in China to the Global Warming in the 21st Century." Science Bulletin 45 (2000): 434-38. [CrossRef]
- Qin, Dahe, Tandong Yao, Yongjian Ding, and Jiawen Ren. Introduction to Cryospheric Science, Springer Geography. Singapore: Springer, 2021.
- Wu, Guanghe, and Yongping Shen. "Glaciers Tourism Resources in China and Their Development." Journal of Glaciology and Geocryology 29, no. 4 (2007): 664-67.
- Li, Zhongqin, Feiteng Wang, Huilin Li, Chunhai Xu, Puyu Wang, Ping Zhou, and Xiaoying Yue. "Science and Long-Term Monitoring of Continental-Type Glaciers in Arid Region in China." Bulletin of Chinese Academy of Sciences 33, no. 12 (2018): 1381-90.
- Ohno, Hiroyuki, Tetsuo Ohata, and Keiji Higuchi. "The Influence of Humidity on the Ablation of Continental-Type Glaciers." Annals of Glaciology 16 (1992): 107-14.
- Fujita, Koji, Yutaka Ageta, Pu Jianchen, and Yao Tandong. "Mass Balance of Xiao Dongkemadi Glacier on the Central Tibetan Plateau from 1989 to 1995." Annals of Glaciology 31 (2000): 159-63. [CrossRef]
- Bolch, T., T. Yao, S. Kang, M. F. Buchroithner, D. Scherer, F. Maussion, E. Huintjes, and C. Schneider. "A Glacier Inventory for the Western Nyainqentanglha Range and the Nam Co Basin, Tibet, and Glacier Changes 1976–2009." The Cryosphere 4, no. 3 (2010): 419–33.
- Shi, Yafeng. Concise Glacier Inventory of China. Shanghai: Shanghai Popular Science Press, 2005.
- Maussion, F., A. Butenko, N. Champollion, M. Dusch, J. Eis, K. Fourteau, P. Gregor, A. H. Jarosch, J. Landmann, F. Oesterle, B. Recinos, T. Rothenpieler, A. Vlug, C. T. Wild, and B. Marzeion. "The Open Global Glacier Model (Oggm) V1.1." Geoscientific Model Development 12, no. 3 (2019): 909–31-09–31. [CrossRef]
- Becker, J. J., D. T. Sandwell, W. H. F. Smith, J. Braud, B. Binder, J. Depner, D. Fabre, J. Factor, S. Ingalls, S. H. Kim, R. Ladner, K. Marks, S. Nelson, A. Pharaoh, R. Trimmer, J. Von Rosenberg, G. Wallace, and P. Weatherall. "Global Bathymetry and Elevation Data at 30 Arc Seconds Resolution: Srtm30_Plus." Marine Geodesy 32, no. 4 (2009): 355-71. [CrossRef]
- Maussion, F., A. Butenko, N. Champollion, M. Dusch, J. Eis, K. Fourteau, P. Gregor, A. H. Jarosch, J. Landmann, F. Oesterle, B. Recinos, T. Rothenpieler, A. Vlug, C. T. Wild, and B. Marzeion. "The Open Global Glacier Model (Oggm) V1.1." Geoscientific Model Development 12, no. 3 (2019): 909–31. [CrossRef]
- Lange, Stefan, Christoph Menz, Stephanie Gleixner, Marco Cucchi, Graham P. Weedon, Alessandro Amici, Nicolas Bellouin, Hannes Müller Schmied, Hans Hersbach, Carlo Buontempo, and Chiara Cagnazzo. "Wfde5 over Land Merged with Era5 over the Ocean (W5e5 V2.0)." ISIMIP Repository, 2021.
- Muñoz-Sabater, J., E. Dutra, A. Agustí-Panareda, C. Albergel, G. Arduini, G. Balsamo, S. Boussetta, M. Choulga, S. Harrigan, H. Hersbach, B. Martens, D. G. Miralles, M. Piles, N. J. Rodríguez-Fernández, E. Zsoter, C. Buontempo, and J. N. Thépaut. "Era5-Land: A State-of-the-Art Global Reanalysis Dataset for Land Applications." Earth Syst. Sci. Data 13, no. 9 (2021): 4349-83.
- Chen, Yingying, Shankar Sharma, Xu Zhou, Kun Yang, Xin Li, Xiaolei Niu, Xin Hu, and Nitesh Khadka. "Spatial Performance of Multiple Reanalysis Precipitation Datasets on the Southern Slope of Central Himalaya." Atmospheric Research (2020): 105365-65. [CrossRef]
- Li, Yanzhao, Xiang Qin, Yushuo Liu, Zizhen Jin, Jun Liu, Lihui Wang, and Jizu Chen. "Evaluation of Long-Term and High-Resolution Gridded Precipitation and Temperature Products in the Qilian Mountains, Qinghai–Tibet Plateau." Frontiers in Environmental Science 10 (2022).
- Zhao, Peng, Zhibin He, Dengke Ma, and Wen Wang. "Evaluation of Era5-Land Reanalysis Datasets for Extreme Temperatures in the Qilian Mountains of China." Frontiers in Ecology and Evolution 11 (2023). [CrossRef]
- Cucchi, M., G. P. Weedon, A. Amici, N. Bellouin, S. Lange, H. Müller Schmied, H. Hersbach, and C. Buontempo. "Wfde5: Bias-Adjusted Era5 Reanalysis Data for Impact Studies." Earth Syst. Sci. Data 12, no. 3 (2020): 2097-120. [CrossRef]
- Huss, Matthias, and Regine Hock. "A New Model for Global Glacier Change and Sea-Level Rise." Frontiers in Earth Science 3 (2015). [CrossRef]
- Lehner, Bernhard, and Günther Grill. "Global River Hydrography and Network Routing: Baseline Data and New Approaches to Study the World's Large River Systems." Hydrological Processes 27, no. 15 (2013): 2171-86. [CrossRef]
- Jiang, Yaozhi, Kun Yang, Hua Yang, Hui Lu, Yingying Chen, Xu Zhou, Jing Sun, Yuan Yang, and Yan Wang. "Characterizing Basin-Scale Precipitation Gradients in the Third Pole Region Using a High-Resolution Atmospheric Simulation-Based Dataset." Hydrology and Earth System Sciences 26, no. 17 (2022): 4587-601. [CrossRef]
- Jing, Zhefan, Zaiming Zhou, and Li Liu. "Progress of the Research on Glacier Velocities in China." Journal of Glaciology and Geocryology 32, no. 4 (2010): 749-54.
- Gardner, A. S., M. A. Fahnestock, and T. A. Scambos. "Its_Live Regional Glacier and Ice Sheet Surface Velocities: Version 1." National Snow and Ice Data Center, 2019.
- Friedl, P., T. Seehaus, and M. Braun. "Global Time Series and Temporal Mosaics of Glacier Surface Velocities Derived from Sentinel-1 Data." Earth System Science Data 13, no. 10 (2021): 4653–75. [CrossRef]
- Millan, Romain, Jérémie Mouginot, Antoine Rabatel, and Mathieu Morlighem. "Ice Velocity and Thickness of the World's Glaciers." Nature Geoscience 15, no. 2 (2022): 124–29-24–29. [CrossRef]
- Kienholz, C., J. L. Rich, A. A. Arendt, and R. Hock. "A New Method for Deriving Glacier Centerlines Applied to Glaciers in Alaska and Northwest Canada." The Cryosphere 8, no. 2 (2014): 503-19. [CrossRef]
- Duan, Keqin, Tandong Yao, Ninglian Wang, Peihong Shi, and Yali Meng. "Changes in Equilibrium-Line Altitude and Implications for Glacier Evolution in the Asian High Mountains in the 21st Century." Science China Earth Sciences 65, no. 7 (2022): 1308-16. [CrossRef]
- Yao, Tandong, Tobias Bolch, Deliang Chen, Jing Gao, Walter Immerzeel, Shilong Piao, Fengge Su, Lonnie Thompson, Yoshihide Wada, Lei Wang, Tao Wang, Guangjian Wu, Baiqing Xu, Wei Yang, Guoqing Zhang, and Ping Zhao. "The Imbalance of the Asian Water Tower." Nature Reviews Earth & Environment 3, no. 10 (2022): 618-32. [CrossRef]
- Wang, Rongjun, Shiyin Liu, Donghui Shangguan, Valentina Radić, and Yong Zhang. "Spatial Heterogeneity in Glacier Mass-Balance Sensitivity across High Mountain Asia." Water 11, no. 4 (2019): 776. [CrossRef]
- Jouberton, Achille, Thomas E Shaw, Evan Miles, Michael McCarthy, Stefan Fugger, Shaoting Ren, Amaury Dehecq, Wei Yang, and Francesca Pellicciotti. "Warming-Induced Monsoon Precipitation Phase Change Intensifies Glacier Mass Loss in the Southeastern Tibetan Plateau." Proceedings of the National Academy of Sciences 119, no. 37 (2022): e2109796119. [CrossRef]
- Arndt, Anselm, and Christoph Schneider. "Spatial Pattern of Glacier Mass Balance Sensitivity to Atmospheric Forcing in High Mountain Asia." Journal of Glaciology 69, no. 278 (2023): 1616-33. [CrossRef]
- Rounce, David R, Regine Hock, and David E Shean. "Glacier Mass Change in High Mountain Asia through 2100 Using the Open-Source Python Glacier Evolution Model (Pygem)." Frontiers in Earth Science 7 (2020): 331. [CrossRef]
- Zhang, Cen, Da-He Qin, and Pan-Mao Zhai. "Amplification of Warming on the Tibetan Plateau." Advances in Climate Change Research 14, no. 4 (2023): 493-501. [CrossRef]
- Sagredo, Esteban A, Summer Rupper, and Thomas V Lowell. "Sensitivities of the Equilibrium Line Altitude to Temperature and Precipitation Changes Along the Andes." Quaternary Research 81, no. 2 (2014): 355-66. [CrossRef]
- Zhang, Hongbo, WW Immerzeel, Fan Zhang, Remco J de Kok, Deliang Chen, and Wei Yan. "Snow Cover Persistence Reverses the Altitudinal Patterns of Warming above and Below 5000 M on the Tibetan Plateau." Science of The Total Environment 803 (2022): 149889. [CrossRef]
- Huang, L, J Chen, K Yang, Y Yang, W Huang, X Zhang, and F Chen. "The Northern Boundary of the Asian Summer Monsoon and Division of Westerlies and Monsoon Regimes over the Tibetan Plateau in Present-Day 66.4 (2023): 882-893." Science China Earth Sciences 66, no. 4 (2023): 882-93. [CrossRef]
- Yu, Yifeng, Qinglong You, Yuqing Zhang, Zheng Jin, Shichang Kang, and Panmao Zhai. "Integrated Warm-Wet Trends over the Tibetan Plateau in Recent Decades." Journal of Hydrology 639 (2024). [CrossRef]
- Johnson, Eric, and Summer Rupper. "An Examination of Physical Processes That Trigger the Albedo-Feedback on Glacier Surfaces and Implications for Regional Glacier Mass Balance across High Mountain Asia." Frontiers in Earth Science 8 (2020): 129. [CrossRef]
- Huang, Maohuan;, and Yafeng Shi. "Progress in the Study on Basic Features of Glaciers in China in the Last Thirty Years." Journal of Glaciology and Geocryology 10, no. 3 (1988): 228-37.
- Paul, Frank, Tobias Bolch, Andreas Kääb, Thomas Nagler, Christopher Nuth, Killian Scharrer, Andrew Shepherd, Tazio Strozzi, Francesca Ticconi, Rakesh Bhambri, Etienne Berthier, Suzanne Bevan, Noel Gourmelen, Torborg Heid, Seongsu Jeong, Matthias Kunz, Tom Rune Lauknes, Adrian Luckman, John Peter Merryman Boncori, Geir Moholdt, Alan Muir, Julia Neelmeijer, Melanie Rankl, Jeffrey VanLooy, and Thomas Van Niel. "The Glaciers Climate Change Initiative: Methods for Creating Glacier Area, Elevation Change and Velocity Products." Remote Sensing of Environment 162 (2015): 408-26.
- Cuffey, Kurt M, and William Stanley Bryce Paterson. The Physics of Glaciers: Academic Press, 2010.
- Nanni, Ugo, Dirk Scherler, Francois Ayoub, Romain Millan, Frederic Herman, and Jean-Philippe Avouac. "Climatic Control on Seasonal Variations in Mountain Glacier Surface Velocity." The Cryosphere 17, no. 4 (2023): 1567-83.
- Wallis, Benjamin J., Anna E. Hogg, J. Melchior van Wessem, Benjamin J. Davison, and Michiel R. van den Broeke. "Widespread Seasonal Speed-up of West Antarctic Peninsula Glaciers from 2014 to 2021." Nature Geoscience 16 (2023): 231-37. [CrossRef]
Figure 1.
Distribution of three different types of glaciers in China. Glacier outlines are indicated by blue polygons. Gray outlines indicate the HMA subregions located in China. The representative extremely-continental (EXT), subcontinental (SUB), and maritime (MAR) glaciers are highlighted in yellow, blue, and red, respectively. The background image is the USGS GTOPO30 DEM. The inset shows the location of glacierized regions in China.
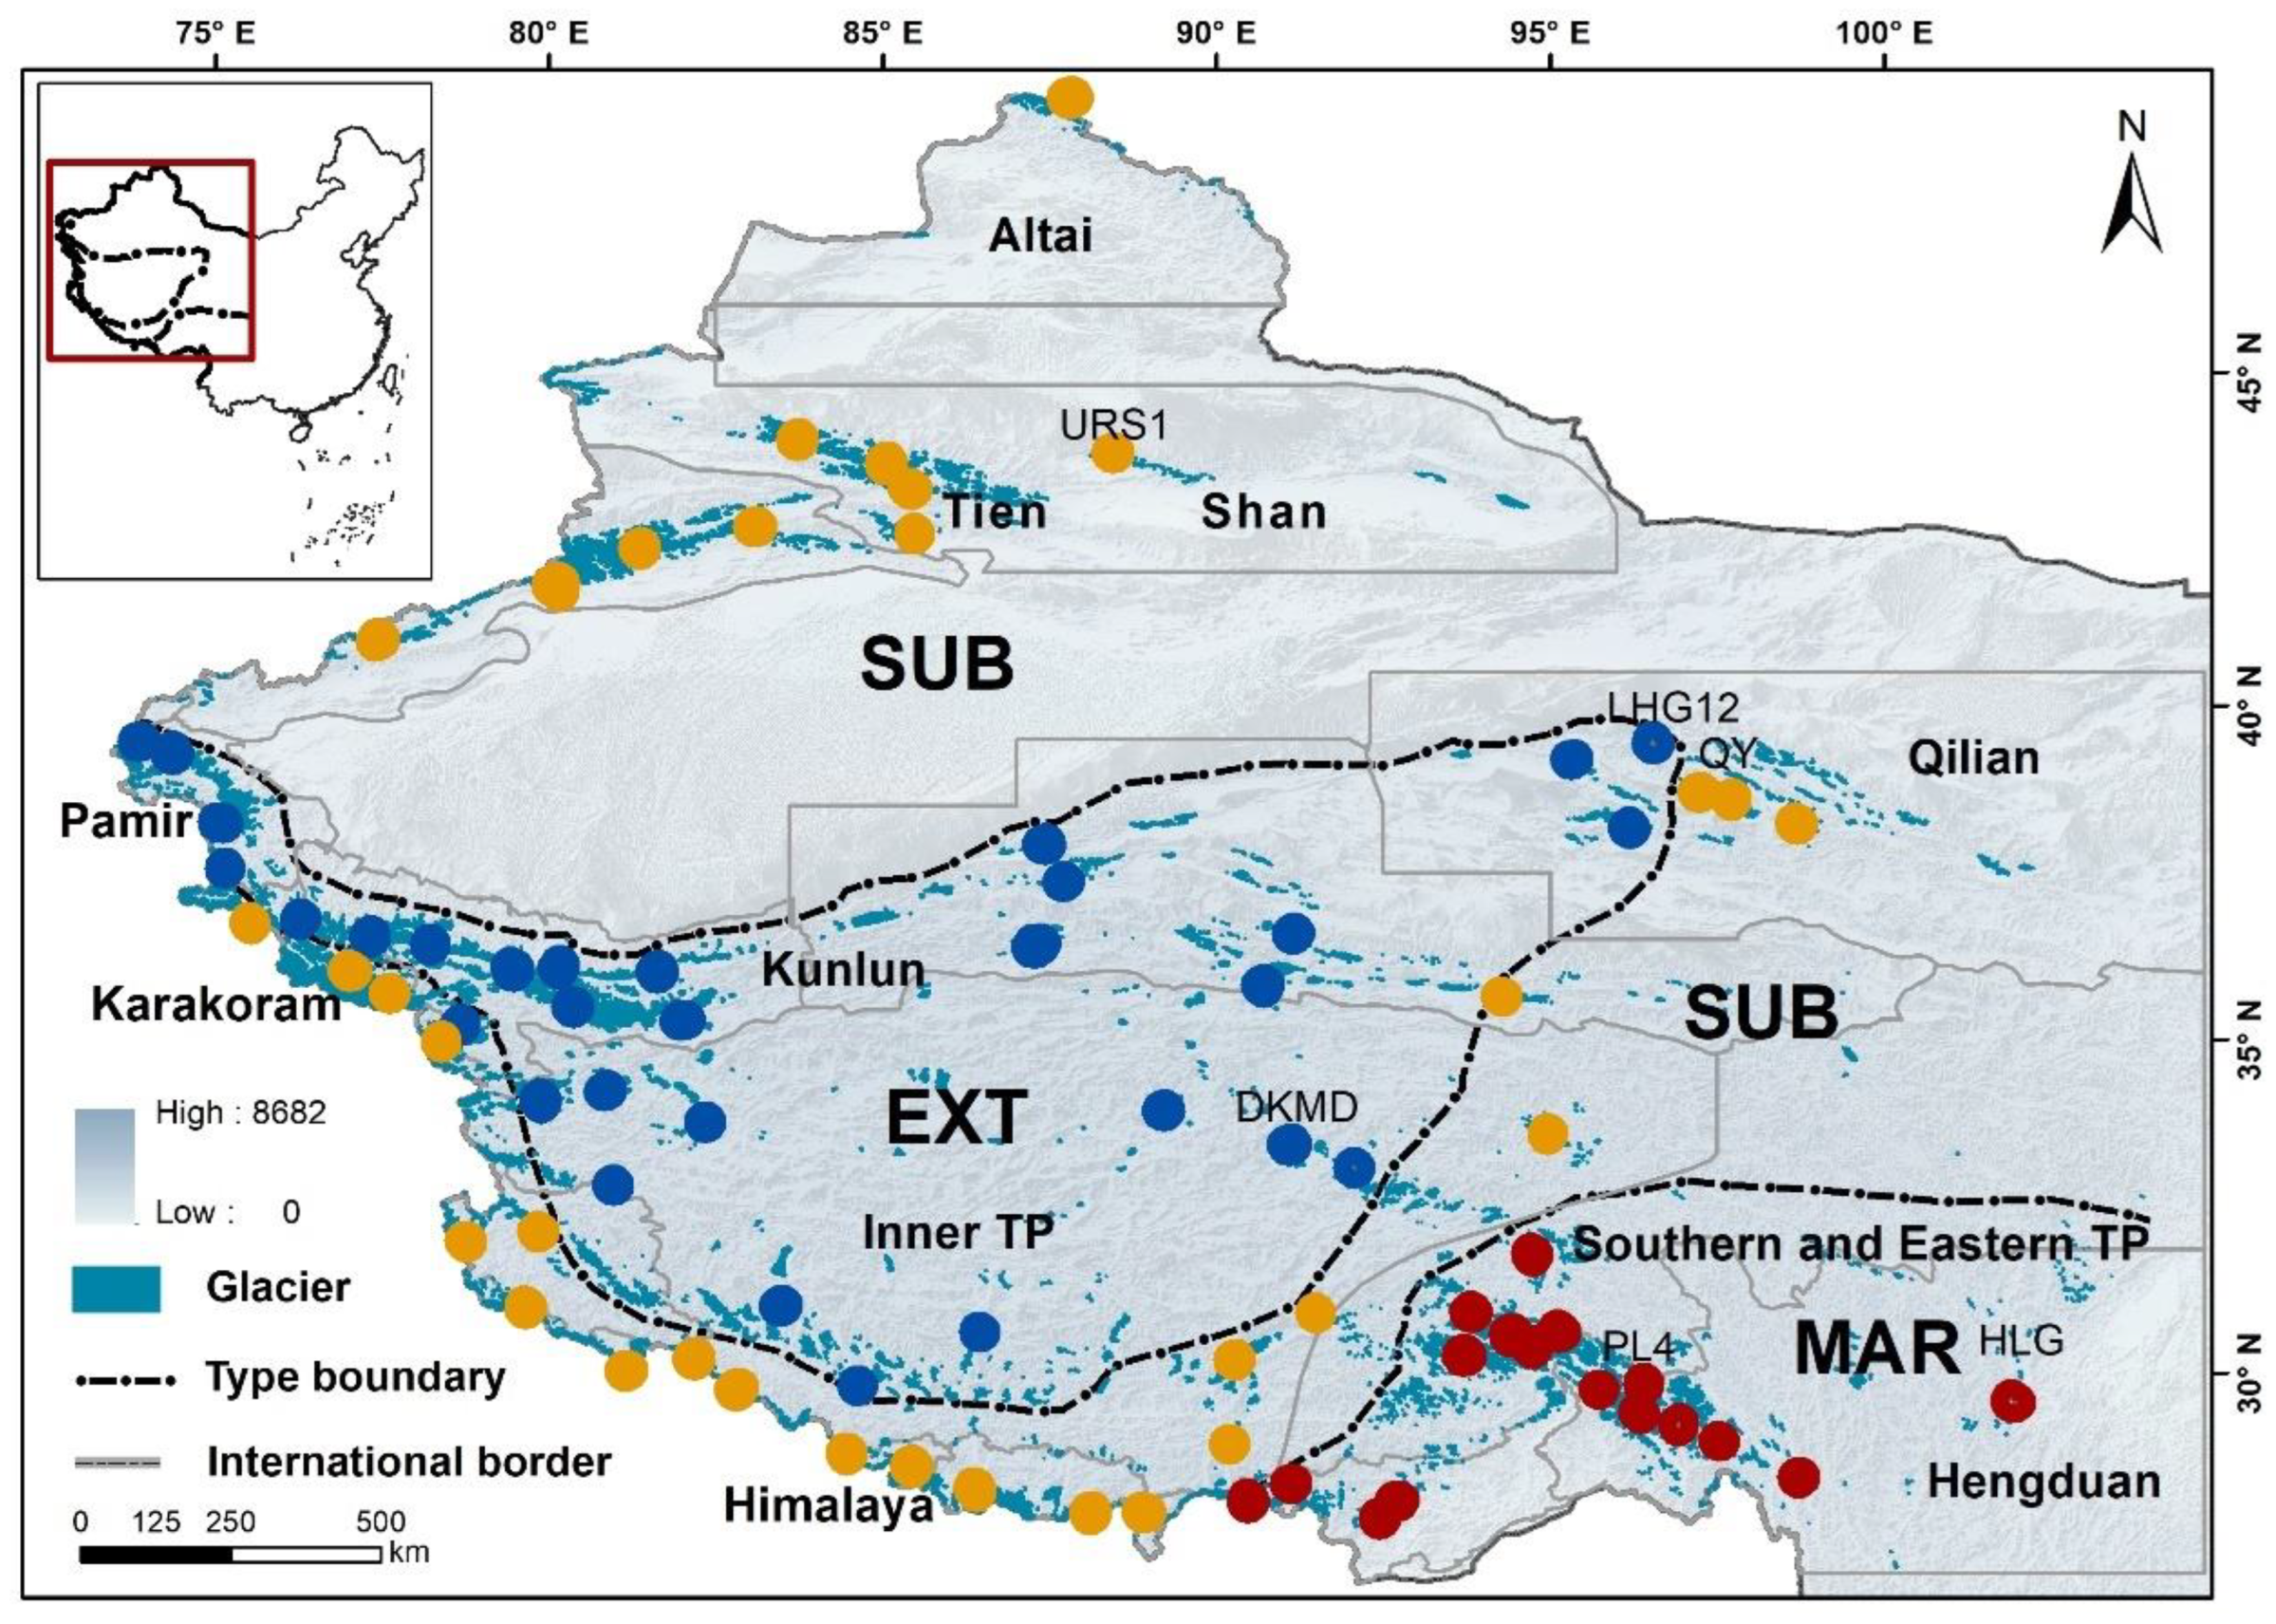
Figure 2.
The linear regression of modelled ELA and observed ELA.
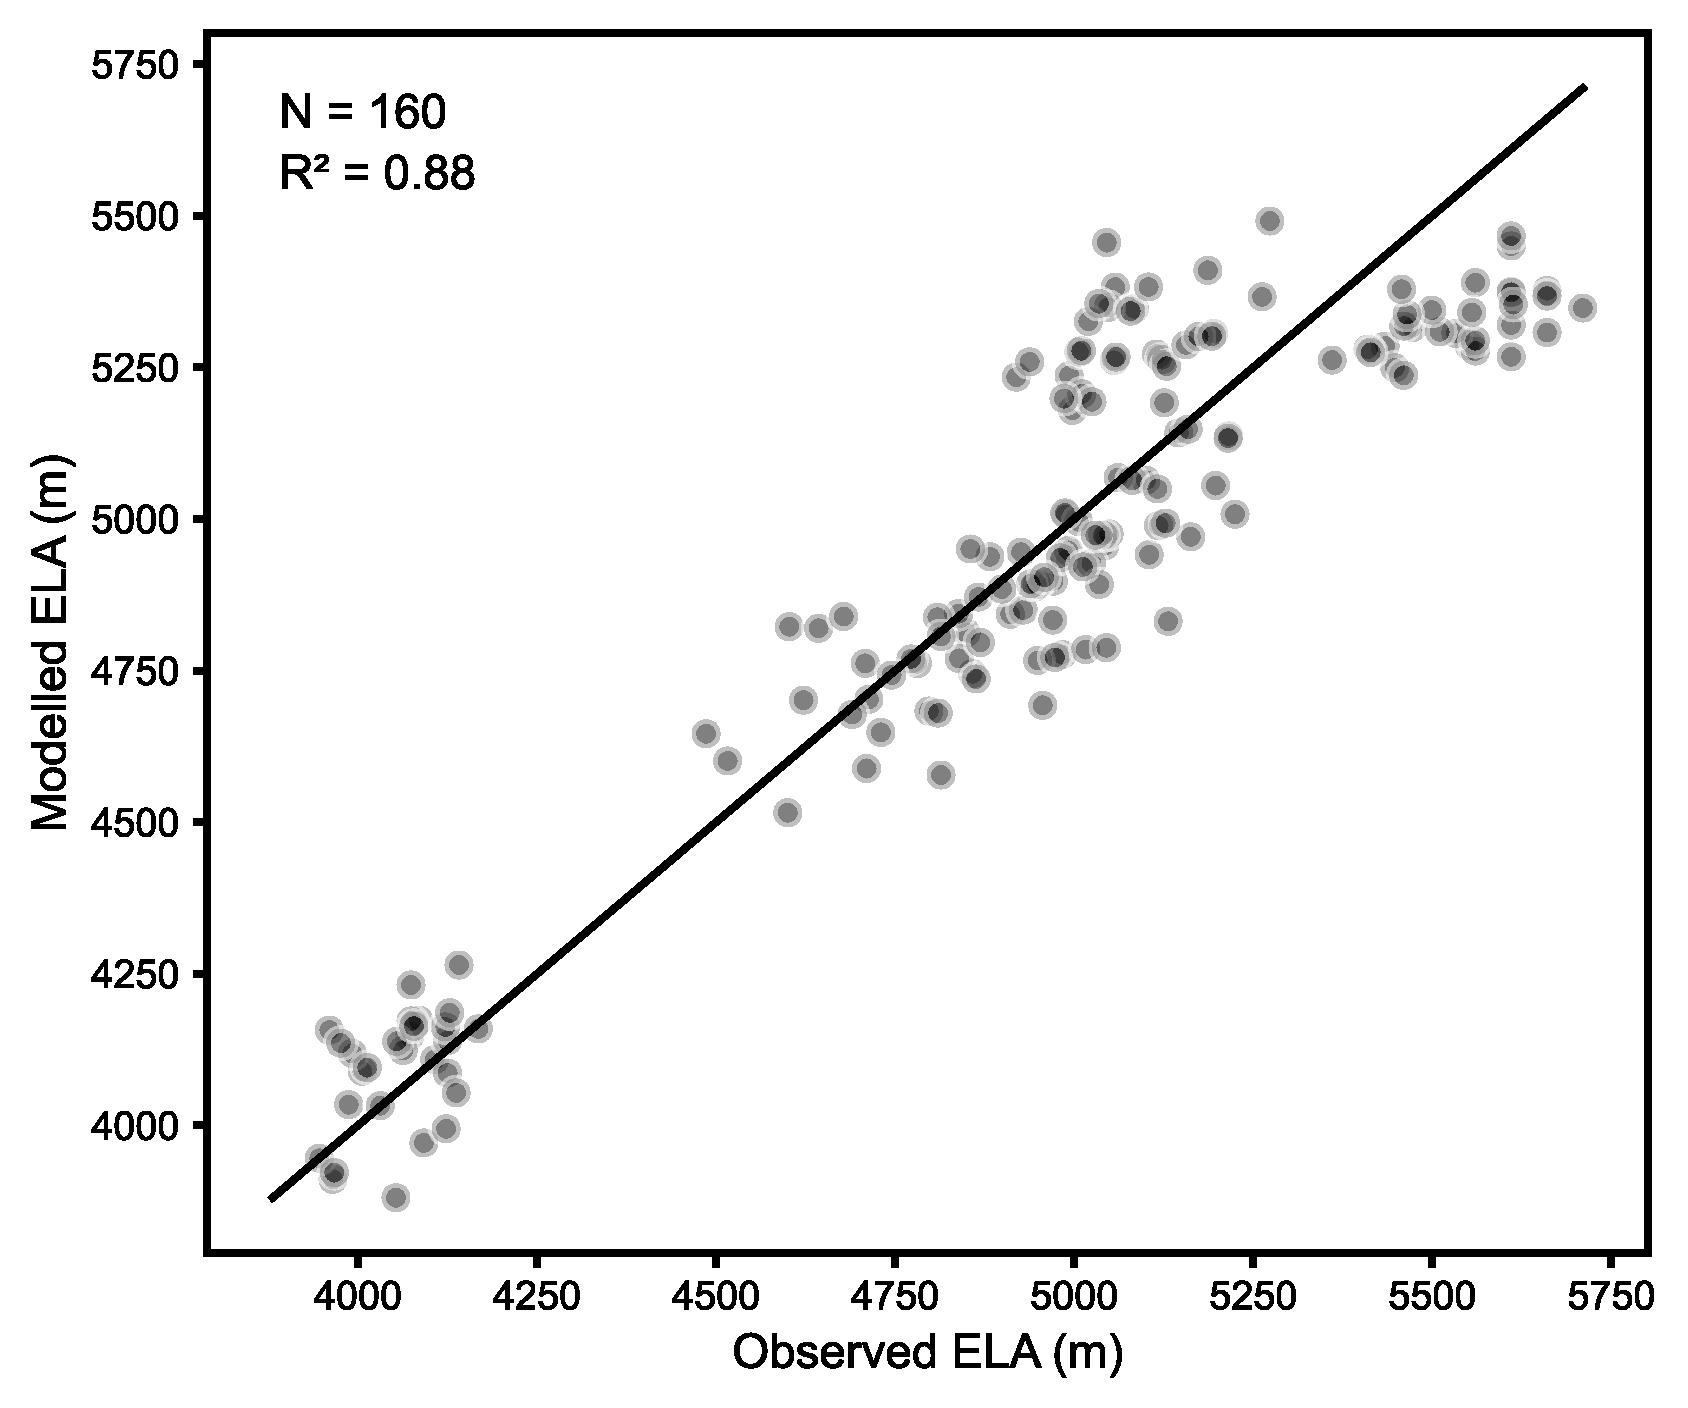
Figure 3.
Validation of glacier criteria against observations. (a) Ta, (b) Ts, (c) Pa, and (d) T20.
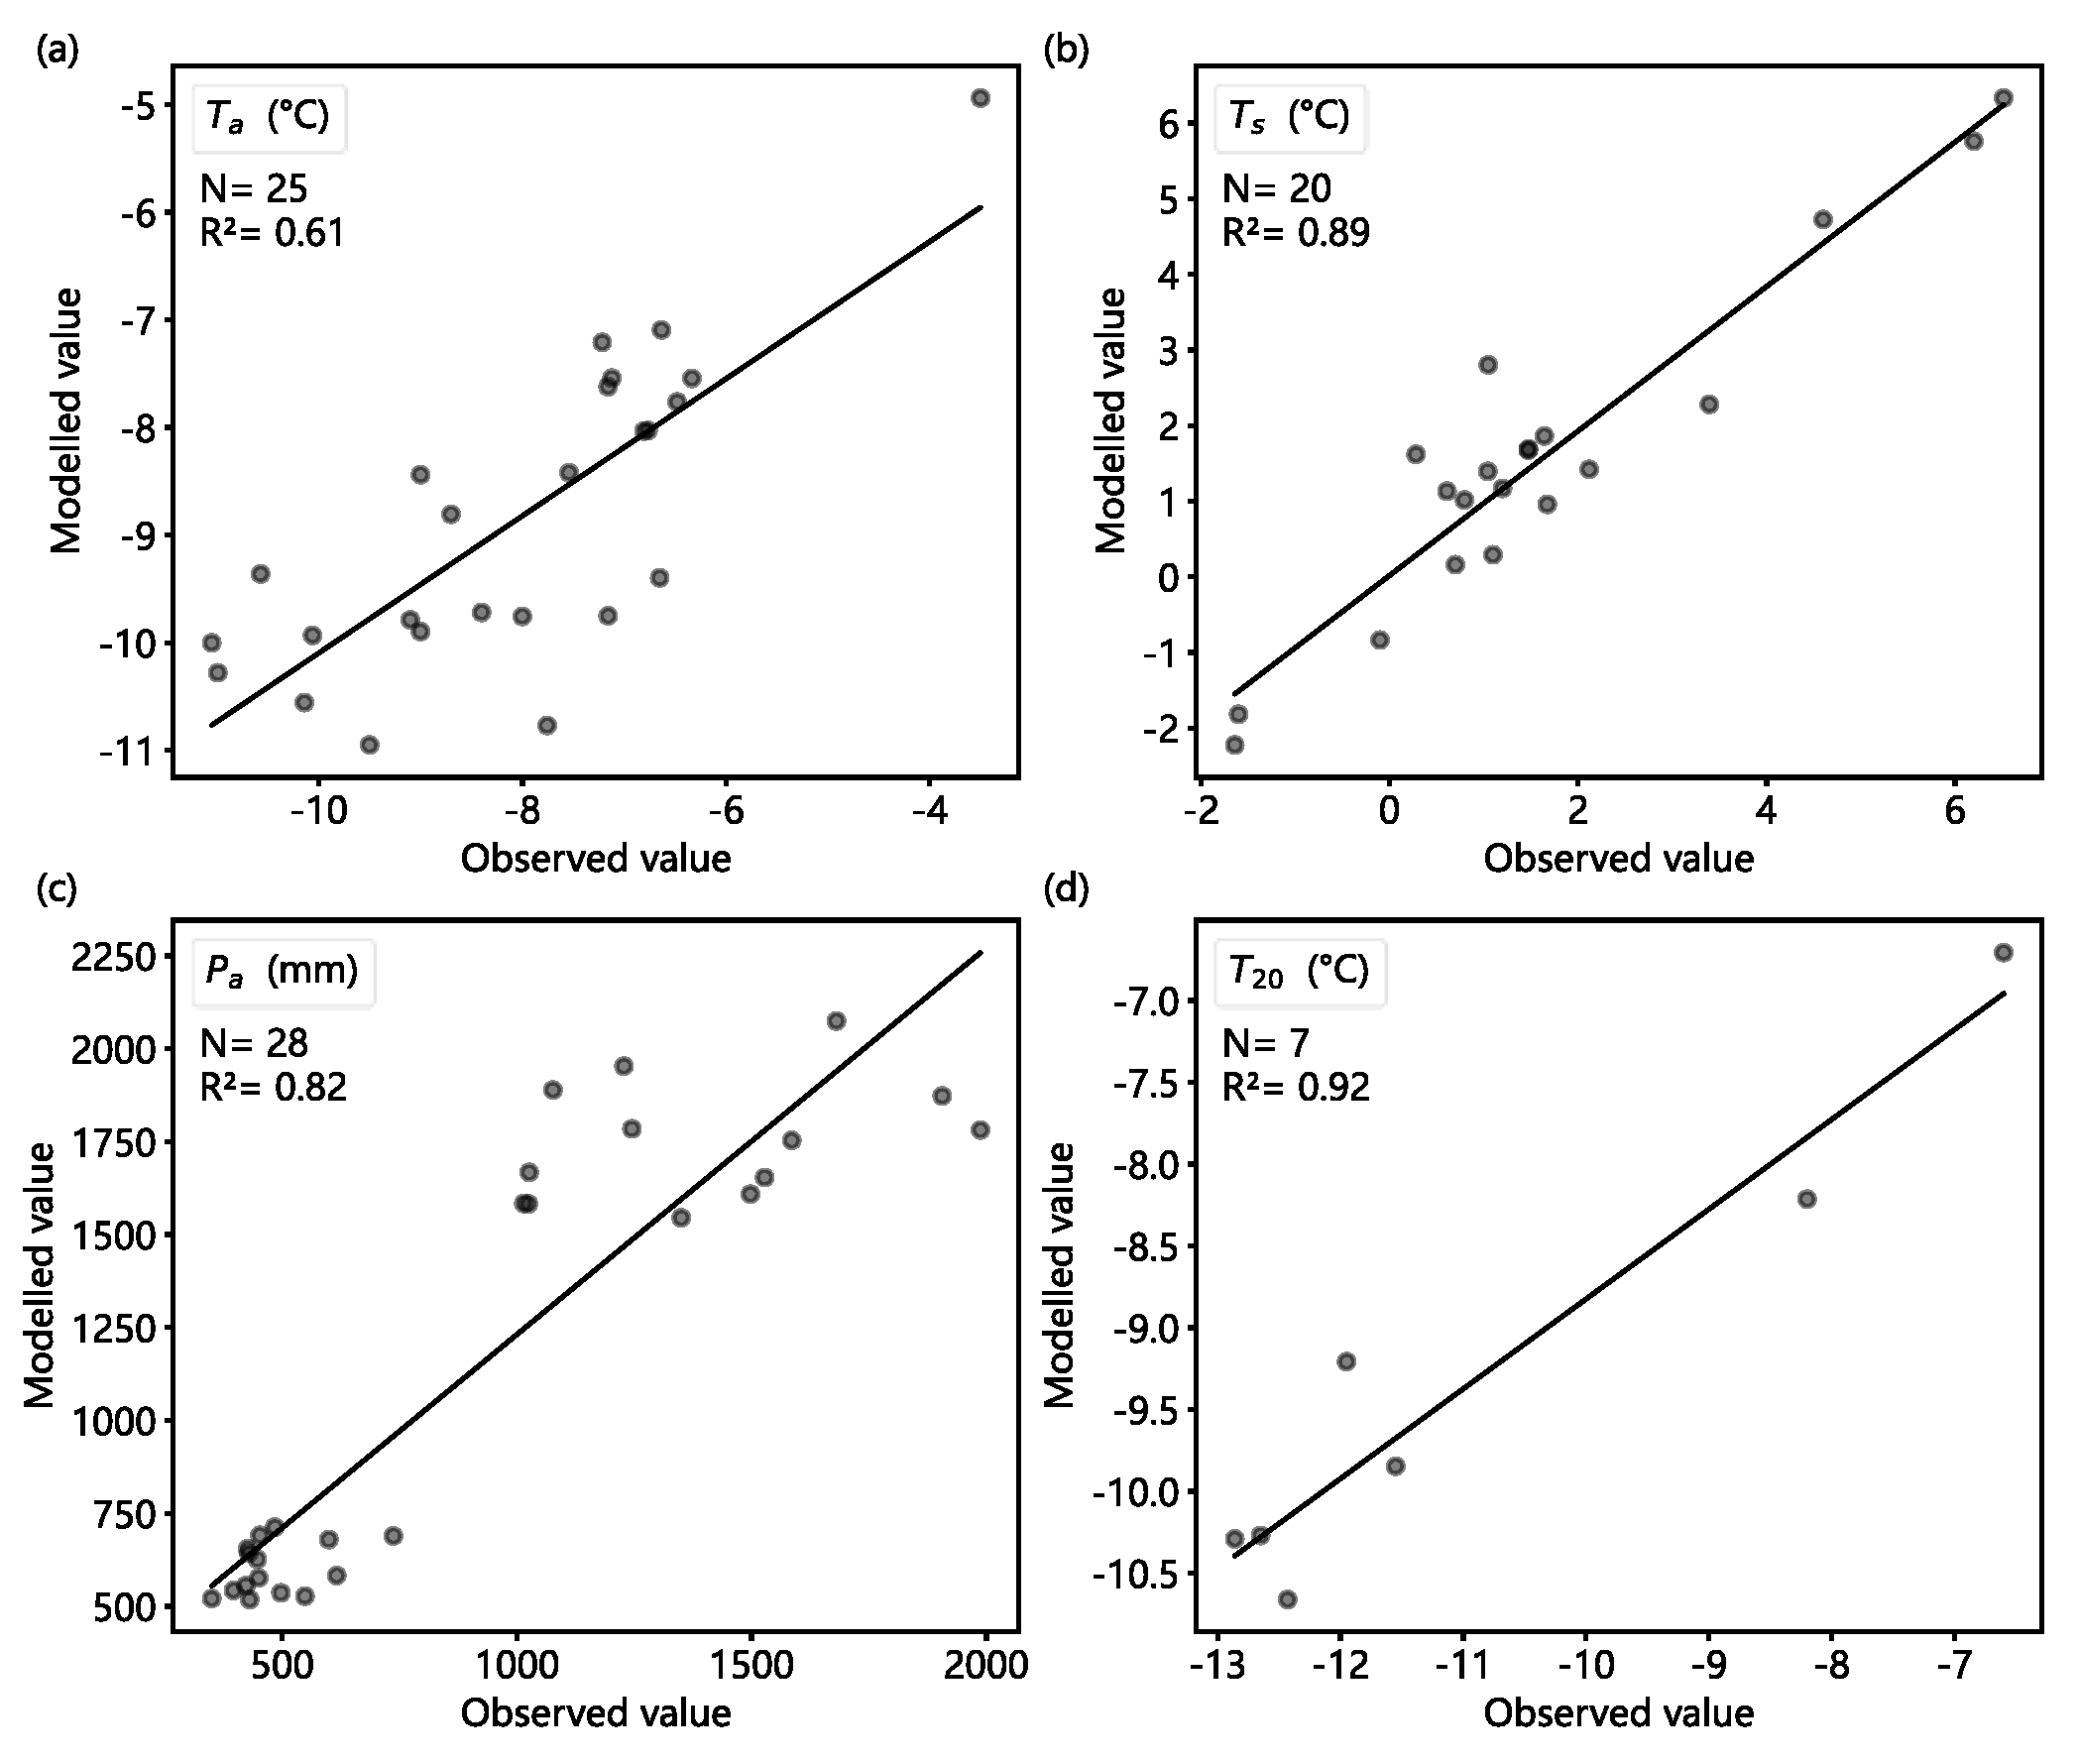
Figure 4.
Distribution of ELAs and classification criteria over the period 1982-2000. (a) ELA, (b) Ta, (c) Ts, (d) Pa, (e) T20, (f) v. Circles indicate that there are no changes in individual glacier criteria relative to the threshold of their corresponding glacier type. Upper triangles indicate that the criterion values for individual glaciers exceed the thresholds of their respective glacier types, while lower triangles indicate that the criterion values fall below these thresholds. The square in panel (f) indicates glaciers with no velocity data.
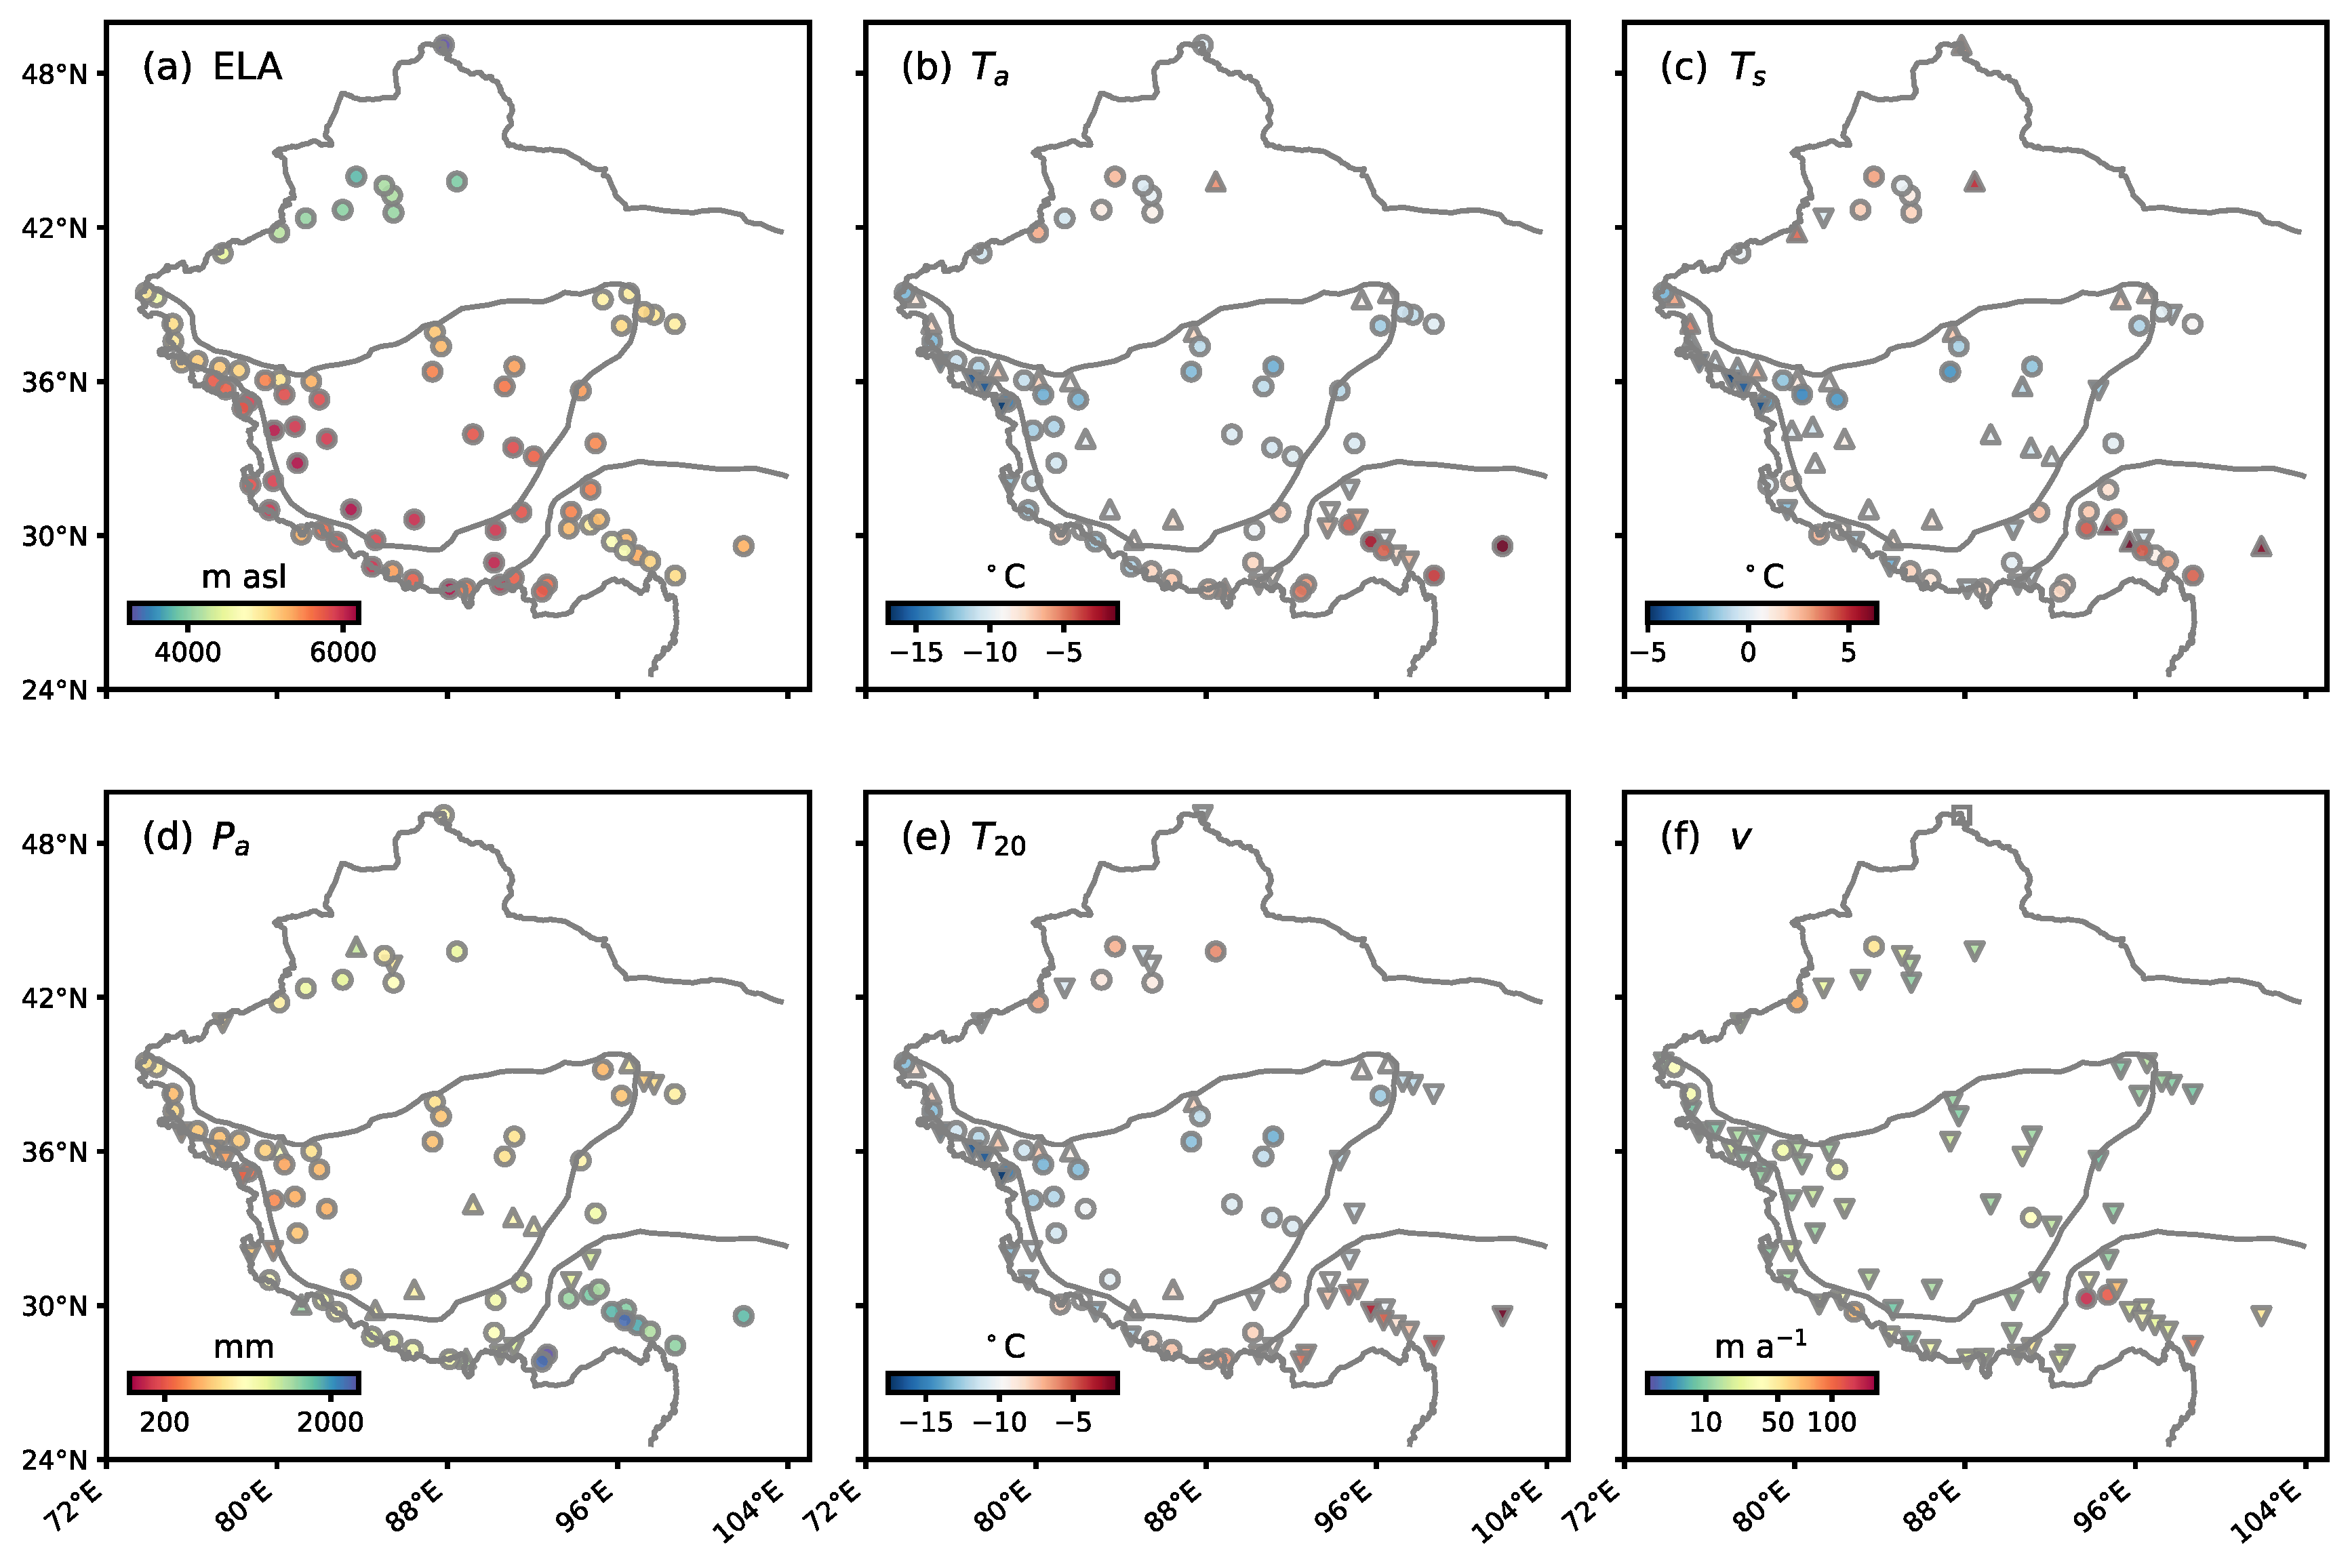
Figure 5.
Same as Figure 4, but for the period 2001-2019. The colorbar scale for each panel matches that of the corresponding panel in Figure 4.
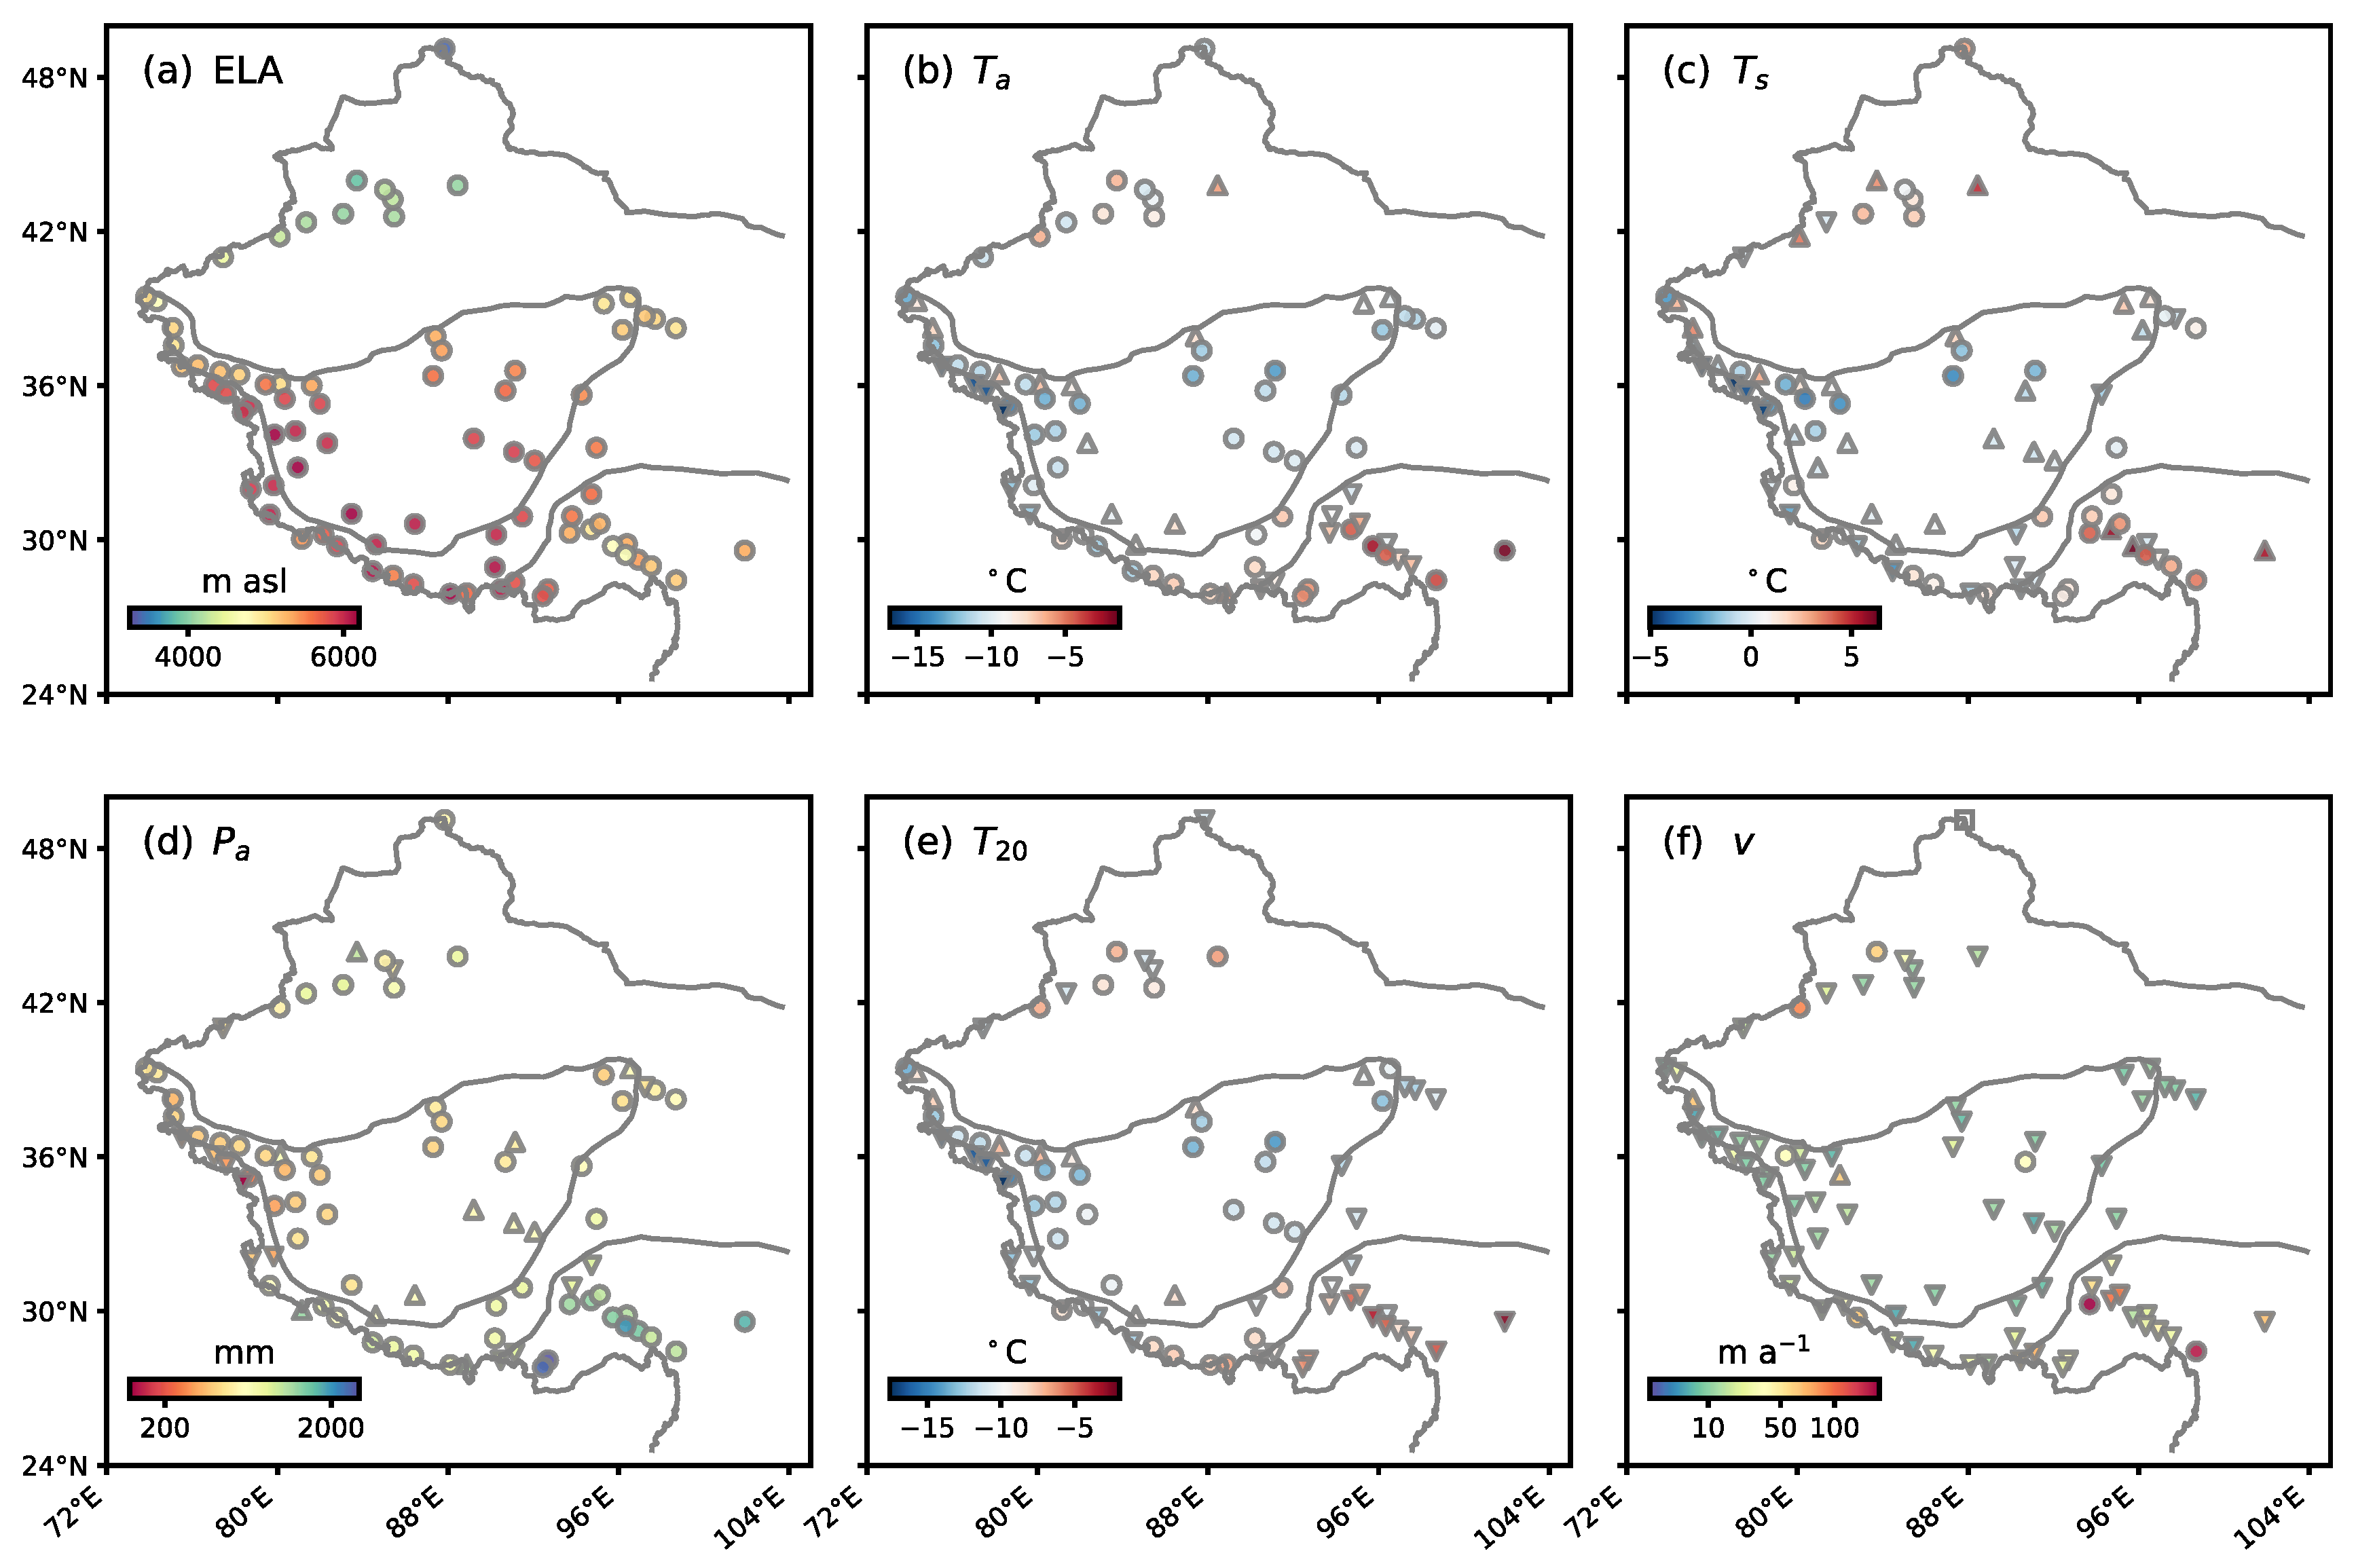
Figure 6.
Difference maps of ELA and classification criteria between the periods 2001-2019 and 1982-2000. (a) ΔELA, (b) ΔTa, (c) ΔTs, (d) ΔPa, (e) ΔT20, (f) Δv. Upper (lower) triangles indicate that the differences are positive (negative). The square in panel (f) indicates no velocity data for this glacier. Ta, (c) Ts, (d) Pa, (e) T20, (f) v.
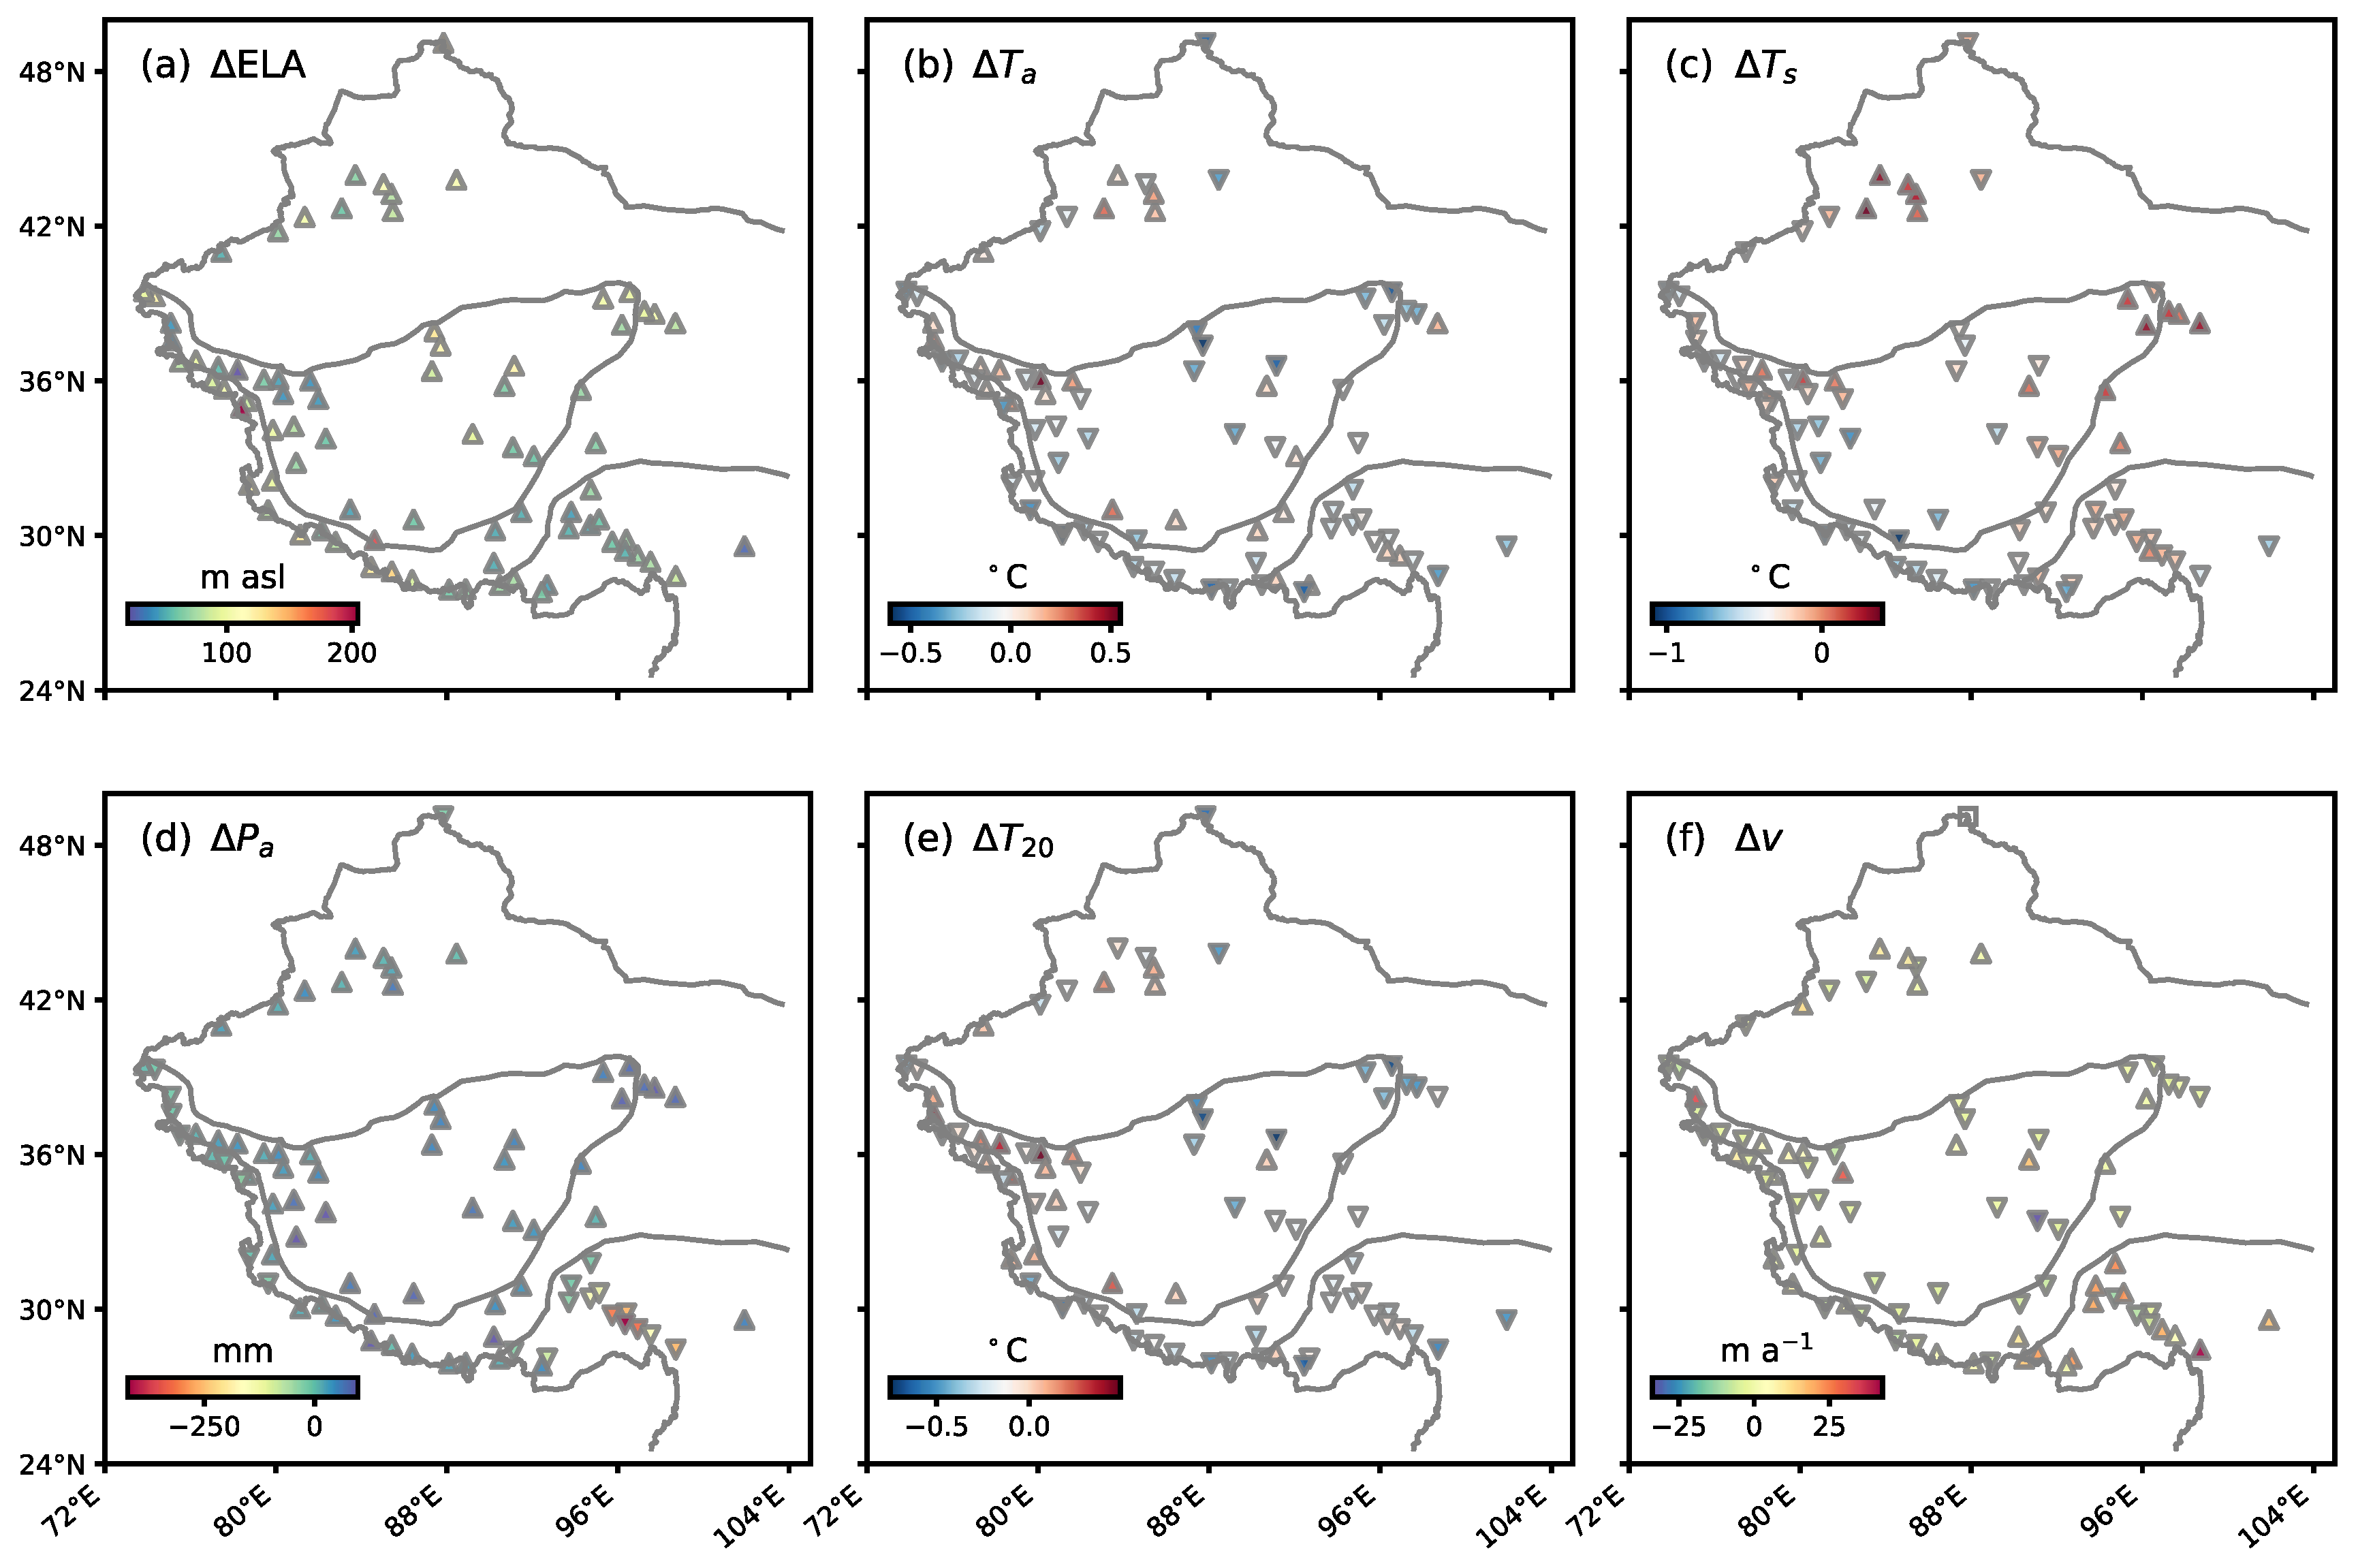
Figure 7.
Number of criteria deviating from the classification thresholds across two time periods. (a) 1982-2000. (b) 2001-2019.
Figure 7.
Number of criteria deviating from the classification thresholds across two time periods. (a) 1982-2000. (b) 2001-2019.
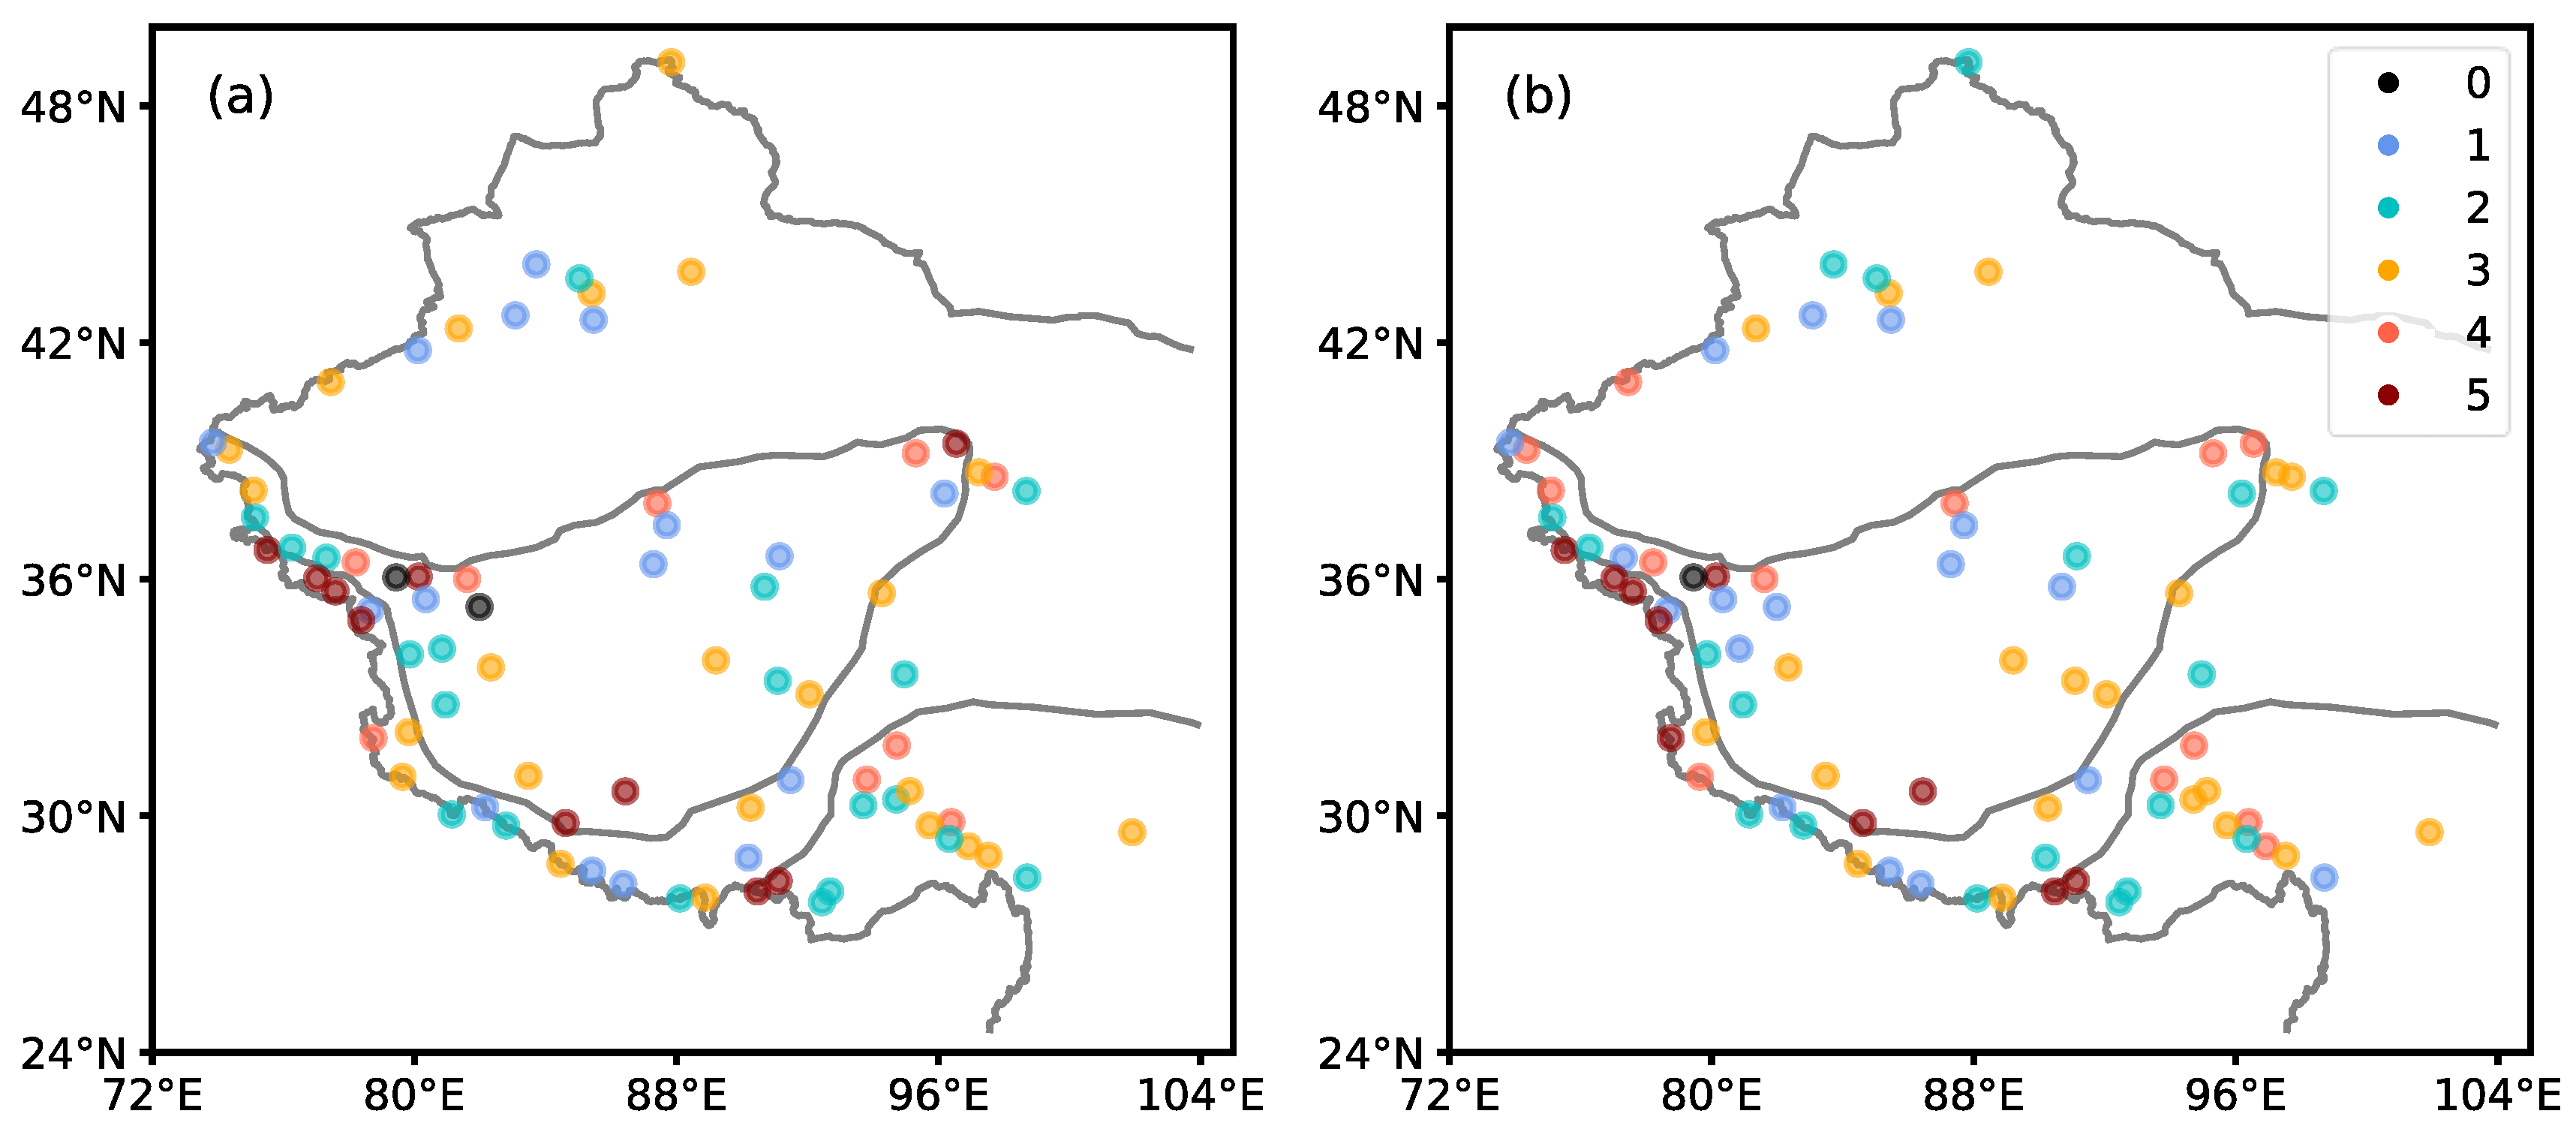

Table 1.
The Shi-Xie glacier classification scheme.
| Type | Ta (°C) | Ts (°C) | Pa (mm) | T20 (°C) | v (m a-1) |
|---|---|---|---|---|---|
| EXT | <-10 | <-1 | 200 - 500 | <-10 | 30 - 50 |
| SUB | -12 ~ -6 | 0 ~ 3 | 500 - 1000 | -10 ~ -1 | 50 - 100 |
| MAR | >-6 | 1 ~ 5 | 1000 - 3000 | -1 ~ 0 | >100 |
Variable definitions: Ta = annual mean temperature at the ELA; Ts = summer mean temperature at the ELA; Pa = annual precipitation at the ELA; T20 = 20 m depth ice temperature at the ELA; v = maximum ice surface velocity along the centerline.
Table 2.
Calibration of precipitation interpolation parameters based on measurements from six glaciers.
Table 2.
Calibration of precipitation interpolation parameters based on measurements from six glaciers.
| Glacier | Altitude | Time period | ||
|---|---|---|---|---|
| LHG12 | 0.76 | 4.5% /100 m | 4500 m | 2010-2015 |
| DKMD | 0.82 | 1.4% /100 m | 4600 m | 2008-2010 |
| QY | 0.61 | 2.4% /100 m | 4870 m | 2008-2012 |
| URS1 | 0.60 | 4.1% /100 m | 3700 m | 2002-2004 |
| PL4 | 1.15 | -1.9% /100 m | 4600 m | 2008-2018 |
| HLG | 0.79 | -3.4% /100 m | 3500 m | 1980 and 2000 |
LHG12=Laohugou Glacier No.12, DKMD=Dongkemadi Glacier, QY=Qiyi Glacier, URS1=Urumqi River Source Glacier No.1, PL4=Parlung Glacier No.4, HLG=Hailuogou Glacier.
Disclaimer/Publisher’s Note: The statements, opinions and data contained in all publications are solely those of the individual author(s) and contributor(s) and not of MDPI and/or the editor(s). MDPI and/or the editor(s) disclaim responsibility for any injury to people or property resulting from any ideas, methods, instructions or products referred to in the content. |
© 2025 by the authors. Licensee MDPI, Basel, Switzerland. This article is an open access article distributed under the terms and conditions of the Creative Commons Attribution (CC BY) license (http://creativecommons.org/licenses/by/4.0/).
Copyright: This open access article is published under a Creative Commons CC BY 4.0 license, which permit the free download, distribution, and reuse, provided that the author and preprint are cited in any reuse.


