
Submitted:
27 April 2025
Posted:
29 April 2025
You are already at the latest version
Abstract
Introduction. Every day, people around the world purchase food from traditional markets. However, improper food handling and limitations in market structures may result in foodborne disease. This study assessed the decision-making of consumers and vendors in traditional markets to identify opportunities to reduce foodborne contamination and exposure.
Methods. A cross-sectional survey of food safety knowledge, attitudes, and practices (KAP) of 150 consumers and 150 vendors was conducted in Sidama, Ethiopia in July-August 2022. Descriptive statistics were used to summarize demographics and KAP, and the Poverty Probability Index for socioeconomic status.
Results. Women consumers were primary deciders for what food to buy. 26% for vendors and 19% for consumers lived below $3.20/day. Consumers choose to purchase food based on price, food quality, vendor personality, and food safety (assessed using visual and sensory cues). Vendors were unconcerned about foodborne disease (73%), and attributed business success to food quality, their personality, and offering discounts.
Conclusions. Salience and demand for food quality as well as trust relationships could be leveraged as business incentives for vendors to adopt food safety practices and for consumers to increase their preference for safer food and ability to identify it.
Keywords:
food safety
; knowledge
; attitudes
; and practices (KAP)
; behavior change
; traditional markets
; LMIC
; Ethiopia
; EatSafe
; feed the future
; foodborne disease (FBD)
1. Introduction
As Ethiopia transitions from a low-income country to a lower- middle income country, it is experiencing rapid economic, demographic, and dietary changes. Despite these changes, the country continues to have a limited ability to control foodborne disease due to a lack of food safety legislation, enforcement capacity, and funding [1,2,3,4]. Global estimates of heath burden support this assertion: the Food Epidemiology Reference Group, a working group of the World Health Organization, found that the African region that includes Ethiopia had the second-highest per capita burden of foodborne disease (FBD) in disability-adjusted life years, with most of the burden being due to diarrheal disease agents [5].
In Ethiopia, traditional markets – the open-air markets where people regularly buy and sell nutritious foods including fresh vegetables and animal-source foods – often lack hygiene and other infrastructure, and are largely unregulated by food safety authorities [6]. Market vendors lack safe food handling skills and consumers have little representation in advocacy associations [2,7]. These factors heighten the risk of foodborne disease. As such, traditional markets represent an important opportunity for intervention to improve food safety.
The US Agency for International Development (USAID) Feed the Future EatSafe (Evidence and Action Towards Safe, Nutritious Food) program tested interventions to improve food safety by leveraging consumer demand for safe food, with a focus on nutritious foods sold in traditional markets. EatSafe in Ethiopia focused on fresh vegetables as a key component of healthy diversified diets, in particular three foods they are commonly sold and eaten in the community [8]: kale, tomatoes, and lettuce. However, these commodities can be associated with foodborne disease [10]. EatSafe identified foodborne hazards, including Salmonella spp., in samples of fresh vegetables (tomatoes, lettuce, and kale) purchased from traditional markets in the region [9], highlighting the need for food safety improvements. Of the samples collected, 35% were found positive for generic E. coli, and 7% for Salmonella. Levels varied by vegetable, with kale having the highest prevalence followed by lettuce and tomatoes.
As part of EatSafe’s intervention design, the present study was conducted to understand consumers’ drivers of food purchasing choices and market vendors’ drivers of food safety practices, including demographics, knowledge, attitudes, and practices (KAP) relevant to interventions to improve food safety via behavior change. Results from this study can be used to inform the design of food safety interventions in traditional markets.
2. Materials and Methods
A cross-sectional survey was conducted in a mid-sized urban area in the Sidama region (South-western Ethiopia) in July-August 2022. The urban area was selected based on relevance to the Feed the Future program, the target foods being widely consumed, the city being large enough to have multiple markets, and the city having sufficient security to allow for the work to take place safely. Ethical approval for the study was received from the Sidama National Regional Health Bureau Public Health Institute Institutional Review Board (Number: DFI/3744/1).
Surveys were conducted with consumers and vendors from the study market. Respondent quotas (i.e., gender for consumers; gender and commodity sold for vendors) were determined using the preliminary estimates of total market size. A convenience sample of 150 respondents from each group was recruited. Consumers were enrolled at different locations in the market over multiple days and times, by approaching all consumers who were seen purchasing the target commodities or as they exited the market, in proportions based on gender quotas (65% women and 35% men, based on preliminary observations). Vendors were enrolled according to commodity and gender quotas matching the respective proportion of all market vendors (observed counts: 87% women and 13% men vendors; 15% kale, 76% tomato, 10% lettuce), modified by enrolling all male vendors (22 men out of 150, 15%). Once they agreed to participate, both consumers and vendors could choose to be interviewed immediately or schedule the interview for a later day.
Consumers were eligible to participate in the study if they were over 18 years of age, had primary or shared responsibility for purchasing food for their household, and shop for at least one key commodity in the target market at least once a month on average. Vendors were eligible to participate in the study if they were over 18 years of age, were a primary vendor in the shop, and regularly perform key vending operations, and sold at least one of the key commodities (lettuce, tomatoes or kale) at the target market at least one day per week for the past three months. One vendor per business was enrolled. Informed consent was obtained verbally at enrollment and confirmed at the start of the questionnaire.
The consumer and vendor surveys included information on demographics; market behaviors; perception and attitudes about food safety and gender; and sources of food safety information (Supplementary Information 5.1 and 5.2). Surveys were administered in face-to-face interviews by trained enumerators in either Amharic, Sidama, Wolayita, or English. Data were collected and validated using SurveyCTO software (Dobility, Inc. https://www.surveycto.com), with the data entry interface programmed in Amharic and English.
The sample size for each of the two groups, 150, was calculated to be able to estimate a prevalence of 0.5 (50%) for a belief or practice with a confidence level of 95% and a margin of error (i.e. target precision of the prevalence estimate) of 8% [11].
Statistical analyses were conducted using Stata release 17 [12]. Visualizations were produced using R version 4.2.0 for Windows [13]. Descriptive statistics were used to describe participatant demographics; market behaviors; perception and attitudes about food safety and gender; and sources of food safety information. The mean and standard deviation (SD) of numeric variables was calculated. The proportion for categorical variables was calculated. T-tests were used to compare means between genders (men and women) for numeric data. Fisher’s exact tests were used to determine significant differences in proportional responses by gender to all categorical variables with binary answer options. Chi-square tests were used to evaluate the gender-based differences for categorical variables with more than two answer options and assess differences in proportions across sub-groups. Results are summarized across all vendors (N=150) or consumers (N=150) unless otherwise stated. They include both genders unless results were different between men and women.
An Ethiopia-specific Poverty Probability Inex (PPI) was used as an indicator of socio-economic status (SES; Supplementary Information 5.3) [14]. The PPI is based on ten indicators of wealth/poverty. In the original version of the Ethiopia PPI Scorecard, the final question was about the number of machetes (gejera) owned. As this question was identified as potentially sensitive by GAIN staff and implementation partners, a new Scorecard was developed and calibrated in coordination with Innovations for Poverty Action (IPA), the developers of PPI. For each responder, the PPI is scored on a 100-point scale, where higher values indicate higher SES (Supplementary Information 5.3). PPI values were converted to probabilities of poverty using tables provided by the PPI developers. Two poverty lines were used: the Ethiopia National Poverty Line (NPL) and the international poverty line of $3.20/day developed by the World Bank.
Potential outliers, for each continuous variable in the dataset, were identified using the z-score, or standard score, i.e. the number of standard deviations a given data point lies above or below the mean, calculated by taking each observation minus the mean and dividing the result by the standard deviation. Observations with an absolute value of the z-score greater than 3 were considered potential outliers, following a previously validated approach [15], and assessed considering the study context. For example, answers of “100” for the number of suppliers a vendor has were omitted from the analysis, for this variable only.
3. Results
3.1. Respondent demographics
A total of 300 respondents, 150 consumers and 150 vendors, were interviewed (Table 1).
Among vendors, most (93%) respondents were the owner of the shop. Over half of interviewed consumers and vendors (67% and 58%, respectively), were head of their household. Nearly all surveyed individuals had access to electricity (98% vendors and 99% consumers respectively). To characterize the socioeconomic status of respondents, EatSafe used variables related to household assets to compute the Poverty Probability Index (PPI) using the international poverty line of $3.20/day, and a specific Ethiopian national poverty line (Ethiopia NPL) of 7,184 ETB/day. At the $3.20/day poverty line (Figure 1A), the mean probability of poverty was 28% and 34%, for consumers and vendors, respectively (±14% SD; median 25%, IQR: 16%-35%). Using the Ethiopian NPL, estimates were lower: 11% and 16% for consumers and vendors, respectively (±10% SD; median 13%, IQR: 8%-20%; Figure 1B). These percentages correspond to the proportion of the population estimated to be living in poverty. While a substantial proportion of the population would be considered impoverished according to the international $3.20/day poverty line, the proportion of the population considered impoverished by national standards is much lower. There was no difference observed across gender, but the probability of poverty was significantly higher for vendors than consumers across both lines (p<0.0001).
3.2. Consumer survey
This section reviews consumer behaviors and attitudes that can inform the design of food safety and nutrition interventions. These include food-related gender roles in the household; food shopping patterns at the market; key characteristics that consumers seek when deciding which food to buy and which vendors to buy from; signals/cues used to identify unsafe food; interactions and communications with vendors; beliefs or perceptions related to food safety in the market.
3.2.1. Food Purchasing Motivations and Behaviors
Within their households, the majority of respondents had primary responsibility for going to buy food, as expected since they were recruited at the market (73%; 44% women and 29% men). Women were the primary decision maker for what food is purchased (57%). Shoppers primarily purchase plant-source food at this market (Table 2).
Most consumers purchase food from a local traditional market (89%), compared to other locations like a supermarket (4%). The main reason that the study respondents visit the target market is due to its convenient location (67%). Study respondents were satisfied with the market (85%) as well as overall vendor options (84%). Over half (57%) of respondents felt secure at the market (i.e., physical or personal safety, “not being worried about harassment, theft, or assault”), and 18% felt somewhat secure.
Most respondents had been shopping at the study market for more than three years (91%). Of consumers, 74% visited once a week, and 21% visited more than once a week. The times that study respondents most frequently visit the market are in the morning between 8 AM – 12 PM (36%), or in the early afternoon between 2 PM – 5 PM (29%). During a typical shopping trip, respondents report having plenty of time (81%) to shop and visit around 4 vendors (SD ± 2) per visit. Consumers generally know what they need (80%) and most do not keep a written shopping list (only 32% do). The main purpose for visiting the market is to buy food (93%) instead of other activities such as talking to friends (6%). Additionally, most consumers reported never talking to other customers about food purchasing decisions (37%). Bartering with vendors at the market was not common (25%).
Consumers choose a vendor from whom to buy based on food quality, price, vendor personality, and perceived safety of the food (Figure 2). Regularly buying food from the same vendor is common, and consumers repeatedly visit the same shops, particularly for vegetable purchasing (52%). Of the consumers that compare vendors (77%, N=116), at least sometimes they compare vendors of leafy greens and tomatoes (65% and 77% respectively), but much less for other commodities (35% for roots/tubers, 29% for legumes, and 4%-9% for grains, poultry, eggs, or milk/dairy products). Consumers compare about 3 vendors before deciding to purchase, suggesting a desire to compare options.
Half of interviewed consumers were satisfied with the food bought at the market, while about one-third were very satisfied. Additionally, half were completely satisfied with the healthiness of their household food. The most important attributes used to select food items were freshness (74%), safety (10%), nutritional content/healthiness (6%), and price (5%). When consumers were asked about the most important attributes of food for their small children (< five years old), answers differed: freshness (52%), safety (15%), healthiness/nutritional content (13%), and balanced or varied diet (7%). For the majority of households, children under five years old never or only occasionally consume the same food as the rest of the household (56%, N=62).
3.2.2. Food Safety Knowledge, Awareness, and Attitudes
Respondents defined “food safety” in a variety of ways. Overall, the top five definitions of food safety consumers gave included maintaining the cleanliness of the food; healthfulness/nutritional value of food; maintaining the quality of the food; food that has not spoiled; and food free of germs and bacteria. Individuals stated that signs of unsafe food include spoilage or rotting (31%), changes in flavor (12%), changes in texture (11%), or infestation by pests or insects (8%).
About half of consumers did not believe that individuals could get sick from eating kale, lettuce, and/or tomatoes (Table 3). Overall, consumers believe that vendors sell safe food, but they acknowledged there were differences in food safety between vendors.
Only 9% (N=14) consumers reported having had a foodborne illness in the year prior to the interview. The foodborne diseases (FBDs) individuals were most concerned about included diseases caused by microbial pathogens (e.g., typhoid fever, amoebas).
3.2.3. Food Safety Choices and Behaviors
Overall, food quality and price were the most important attributes that consumers look for when deciding which vendor to buy from, while food safety was reported less often (Figure 2). In addition, for most consumers market cleanliness was not a reason for choosing which market to buy from (76%). Over half (58%) of respondents had neutral opinions about market cleanliness, perceiving the market as “not too clean but not too dirty.” The reasons the remaining respondents gave for the market being very dirty or dirty (24%; N=123) included waste, improper disposal of leftovers, mud, and vendors not cleaning their area after selling products.
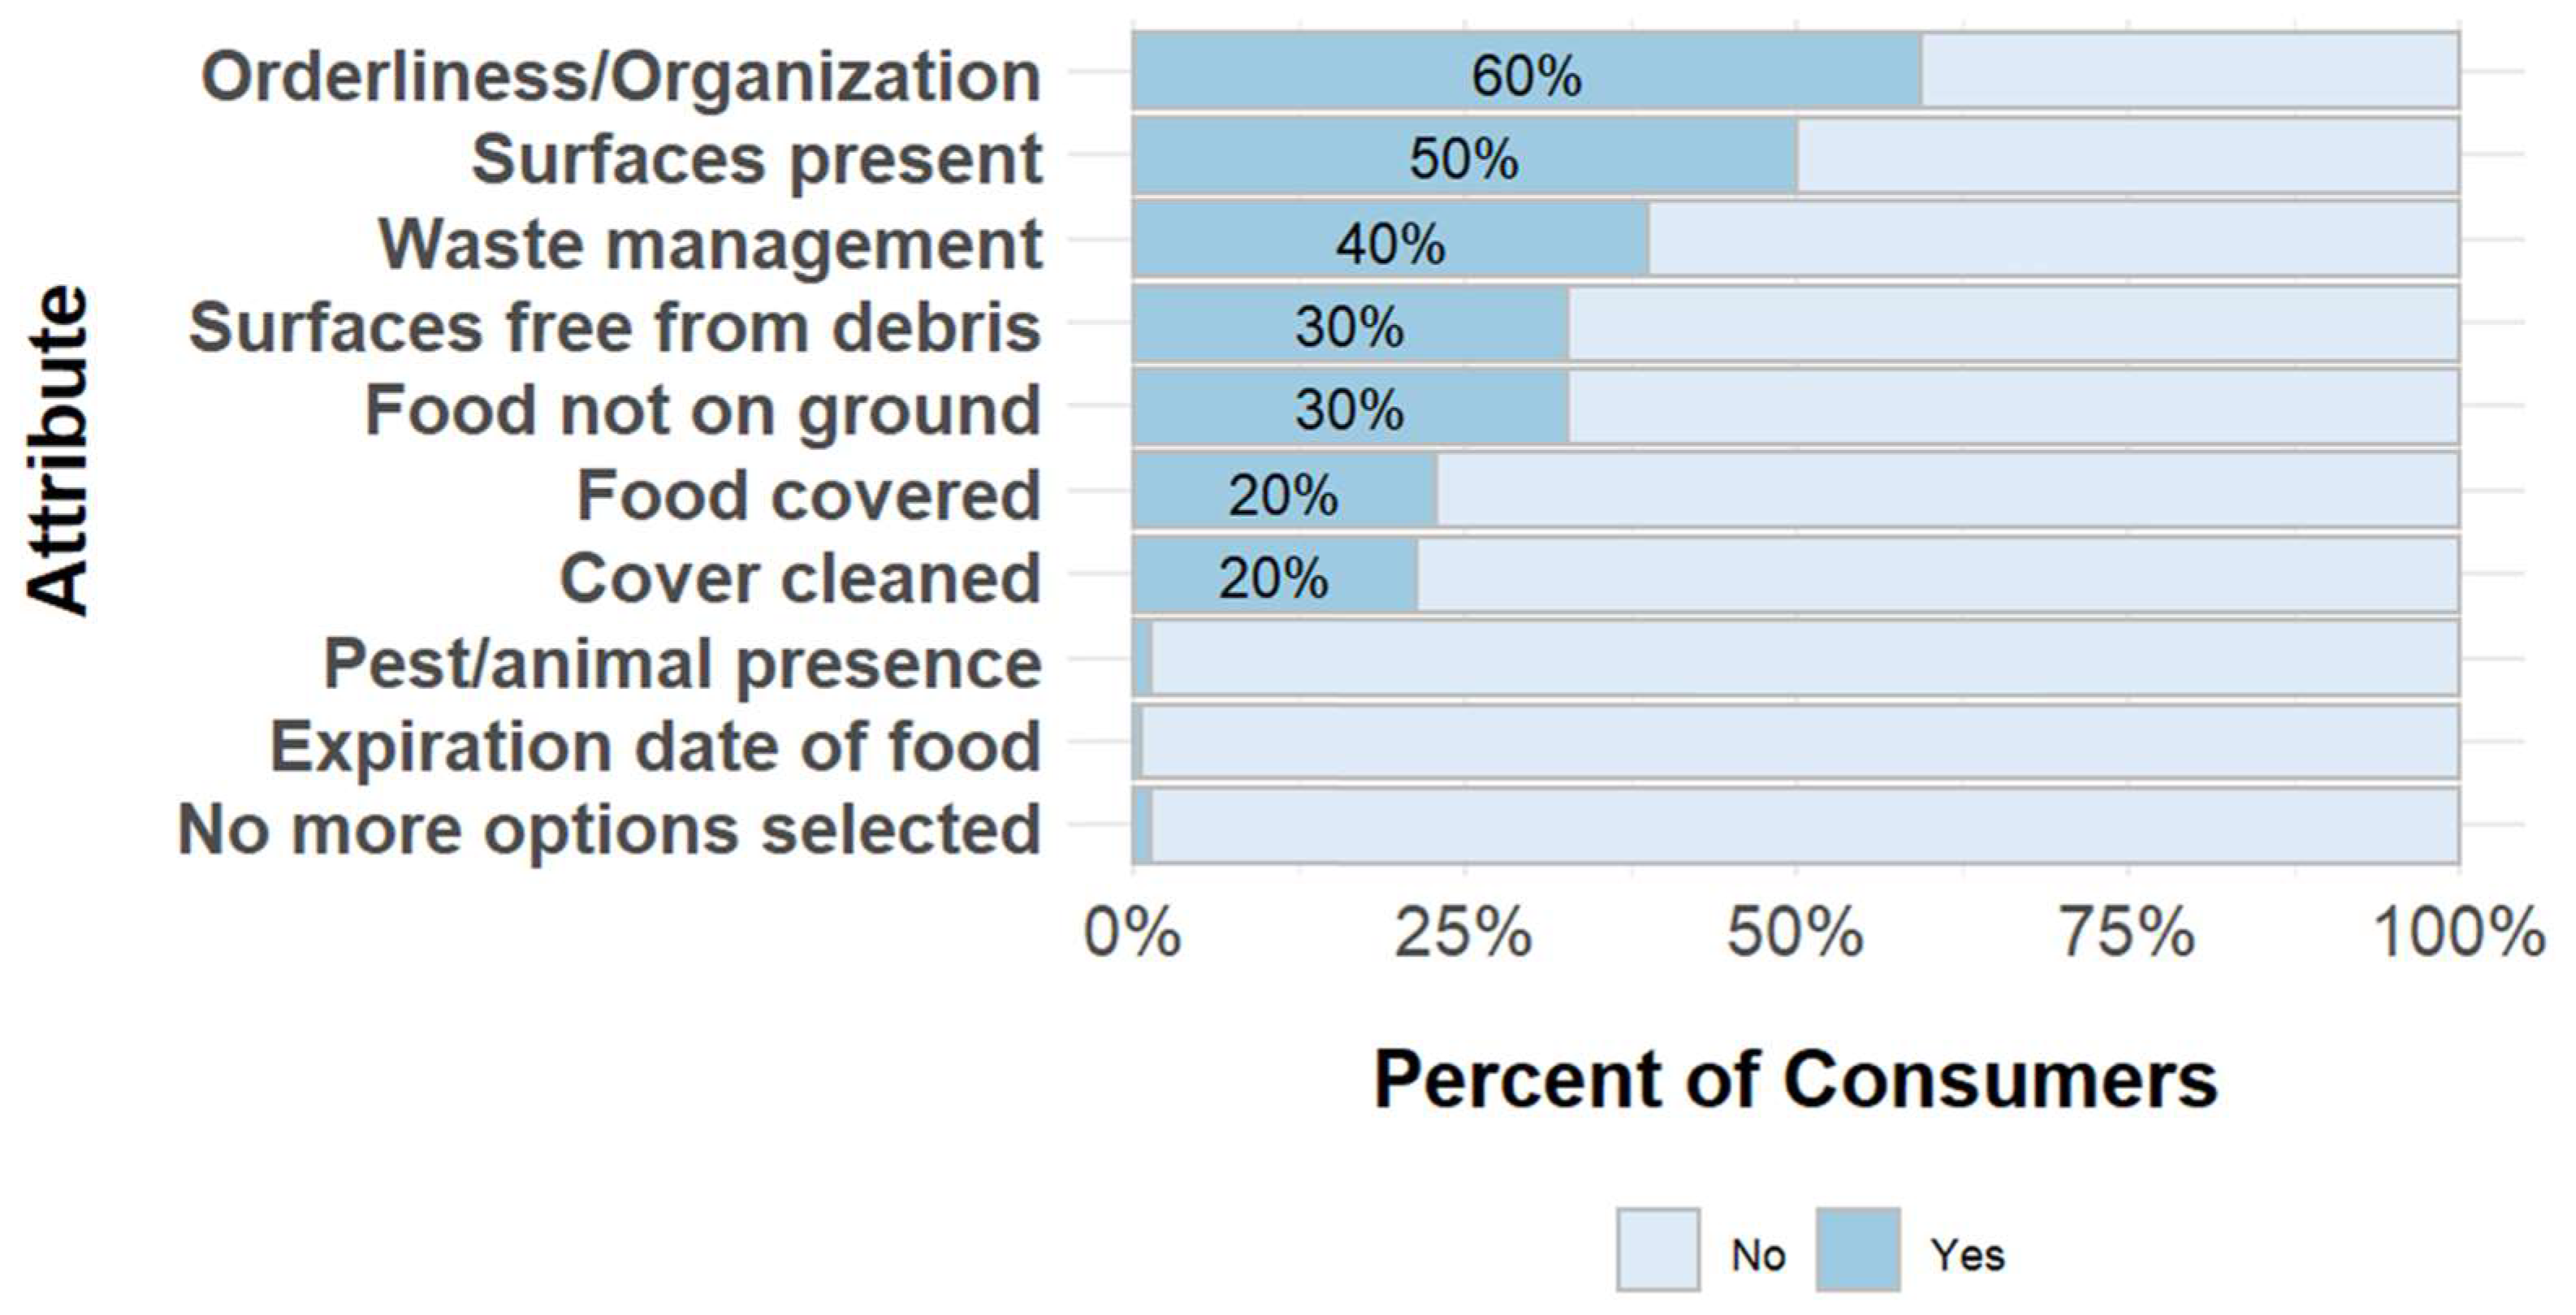
However, consumers did feel it was important that vendors had good personal hygiene (97% stated it was highly or very highly important). Consumers evaluate cleanliness or hygiene of a vendor by their orderliness or organization, open surfaces on a vendors’ counter, and if these surfaces are clean (Figure 4). Actions that consumers stated that vendors can take to improve food safety included procuring good quality product and maintaining its quality (37%), and cleaning the area in and around their shop (28%). When asked in an open-ended fashion, nearly all consumers (99%) mentioned at least one attribute they use to assess hygiene behaviors of vendors in managing their shop. Attributes included that vendors take care of their shop (shop cleanliness), knowing where the produce came from, and knowing how the produce is/was handled.
Figure 3.
Factors consumers consider when evaluating vendors’ cleanliness.
A majority of respondents stated they would not purchase a food item if they were unsure about its safety (76%). Consumers would prefer to buy from vendors with a food safety certificate or license, if one was available (Table 3).
Consumers mainly express the demand for specific food products or attributes through purchase choices, and sometimes through verbal communication. For example, while most consumers reported they have never stopped buying from a particular vendor (53%), 39% said they occasionally or sometimes do stop. The most common reasons for stopping to purchase from a vendor included food quality, price, and the vendor-customer relationship. Most consumers (76%) reported never talking to a vendor about food quality. Of the remaining 24% (N=36) who discussed food quality with vendors, 64% were likely to initiate conversations about food safety. When discussing particular items with vendors, tomatoes and leafy greens were most often discussed (86% and 67%, respectively; N=36). Most consumers (71%) never complained to vegetable vendors about their food purchases. Of the remaining 29% (N=44), characteristics discussed during a complaint included options for different varieties of products, blemishes, and sizes and shapes, all ranging from 32%-41%. These findings suggest a minority of consumers are comfortable voicing their concerns to vendors.
Consumers noted they adopt some risk reduction measures at home during food preparation. For instance, nearly all respondents (99%) wash kale. Additionally, kale is rarely eaten raw, as 63% cook or boil it before eating.
3.2.3. Food Information Sources and Media Use
Most consumers reported owning a cell phone (95%). Among those that own a cell phone, 57% have a basic or feature phone and 61% a smartphone. All men surveyed personally owned a mobile phone, while 8% of the women did not (p-value=0.05, Fisher’s exact two-sided test). The mean number of cellphones in their households was 2.6 (SD ± 1.6). Most individuals owned a television (79%), while slightly fewer owned a radio (61%).
About half of surveyed consumers have access to the internet, primarily accessed via smartphones (96%, N=63 of 66). The internet was accessed primarily at home (82%, N=54 of 66). Facebook (88%), Telegram (68%) and YouTube (53%) are the most regularly used social media platforms by the those that have internet access (N=66).
Consumers trust medical professionals (92%) to provide reliable information on health issues. If they wanted to obtain information on food safety, consumers would consult medical professionals (67%), friends or family (63%), food packaging or labels (47%), experts on media (33%), and internet/social media (29%; Table 4).
A majority of consumers (90%) reported that they had no specific issues they would like to know regarding food in the last year. Questions that the remaining respondents had about whether a certain food was safe or unsafe to eat included: “How do worms form in the stomach?”, “What causes food to spoil or become contaminated?”, “What are the agents that contaminate foods?”, “What causes typhoid?”, “How do you achieve a balanced diet?”, “How safe are packaged foods?”. Of those who sought out information to answer these questions (N=6), all spoke to medical professionals, while two of the six additionally reviewed newspapers, television or radio, and one searched on the internet.
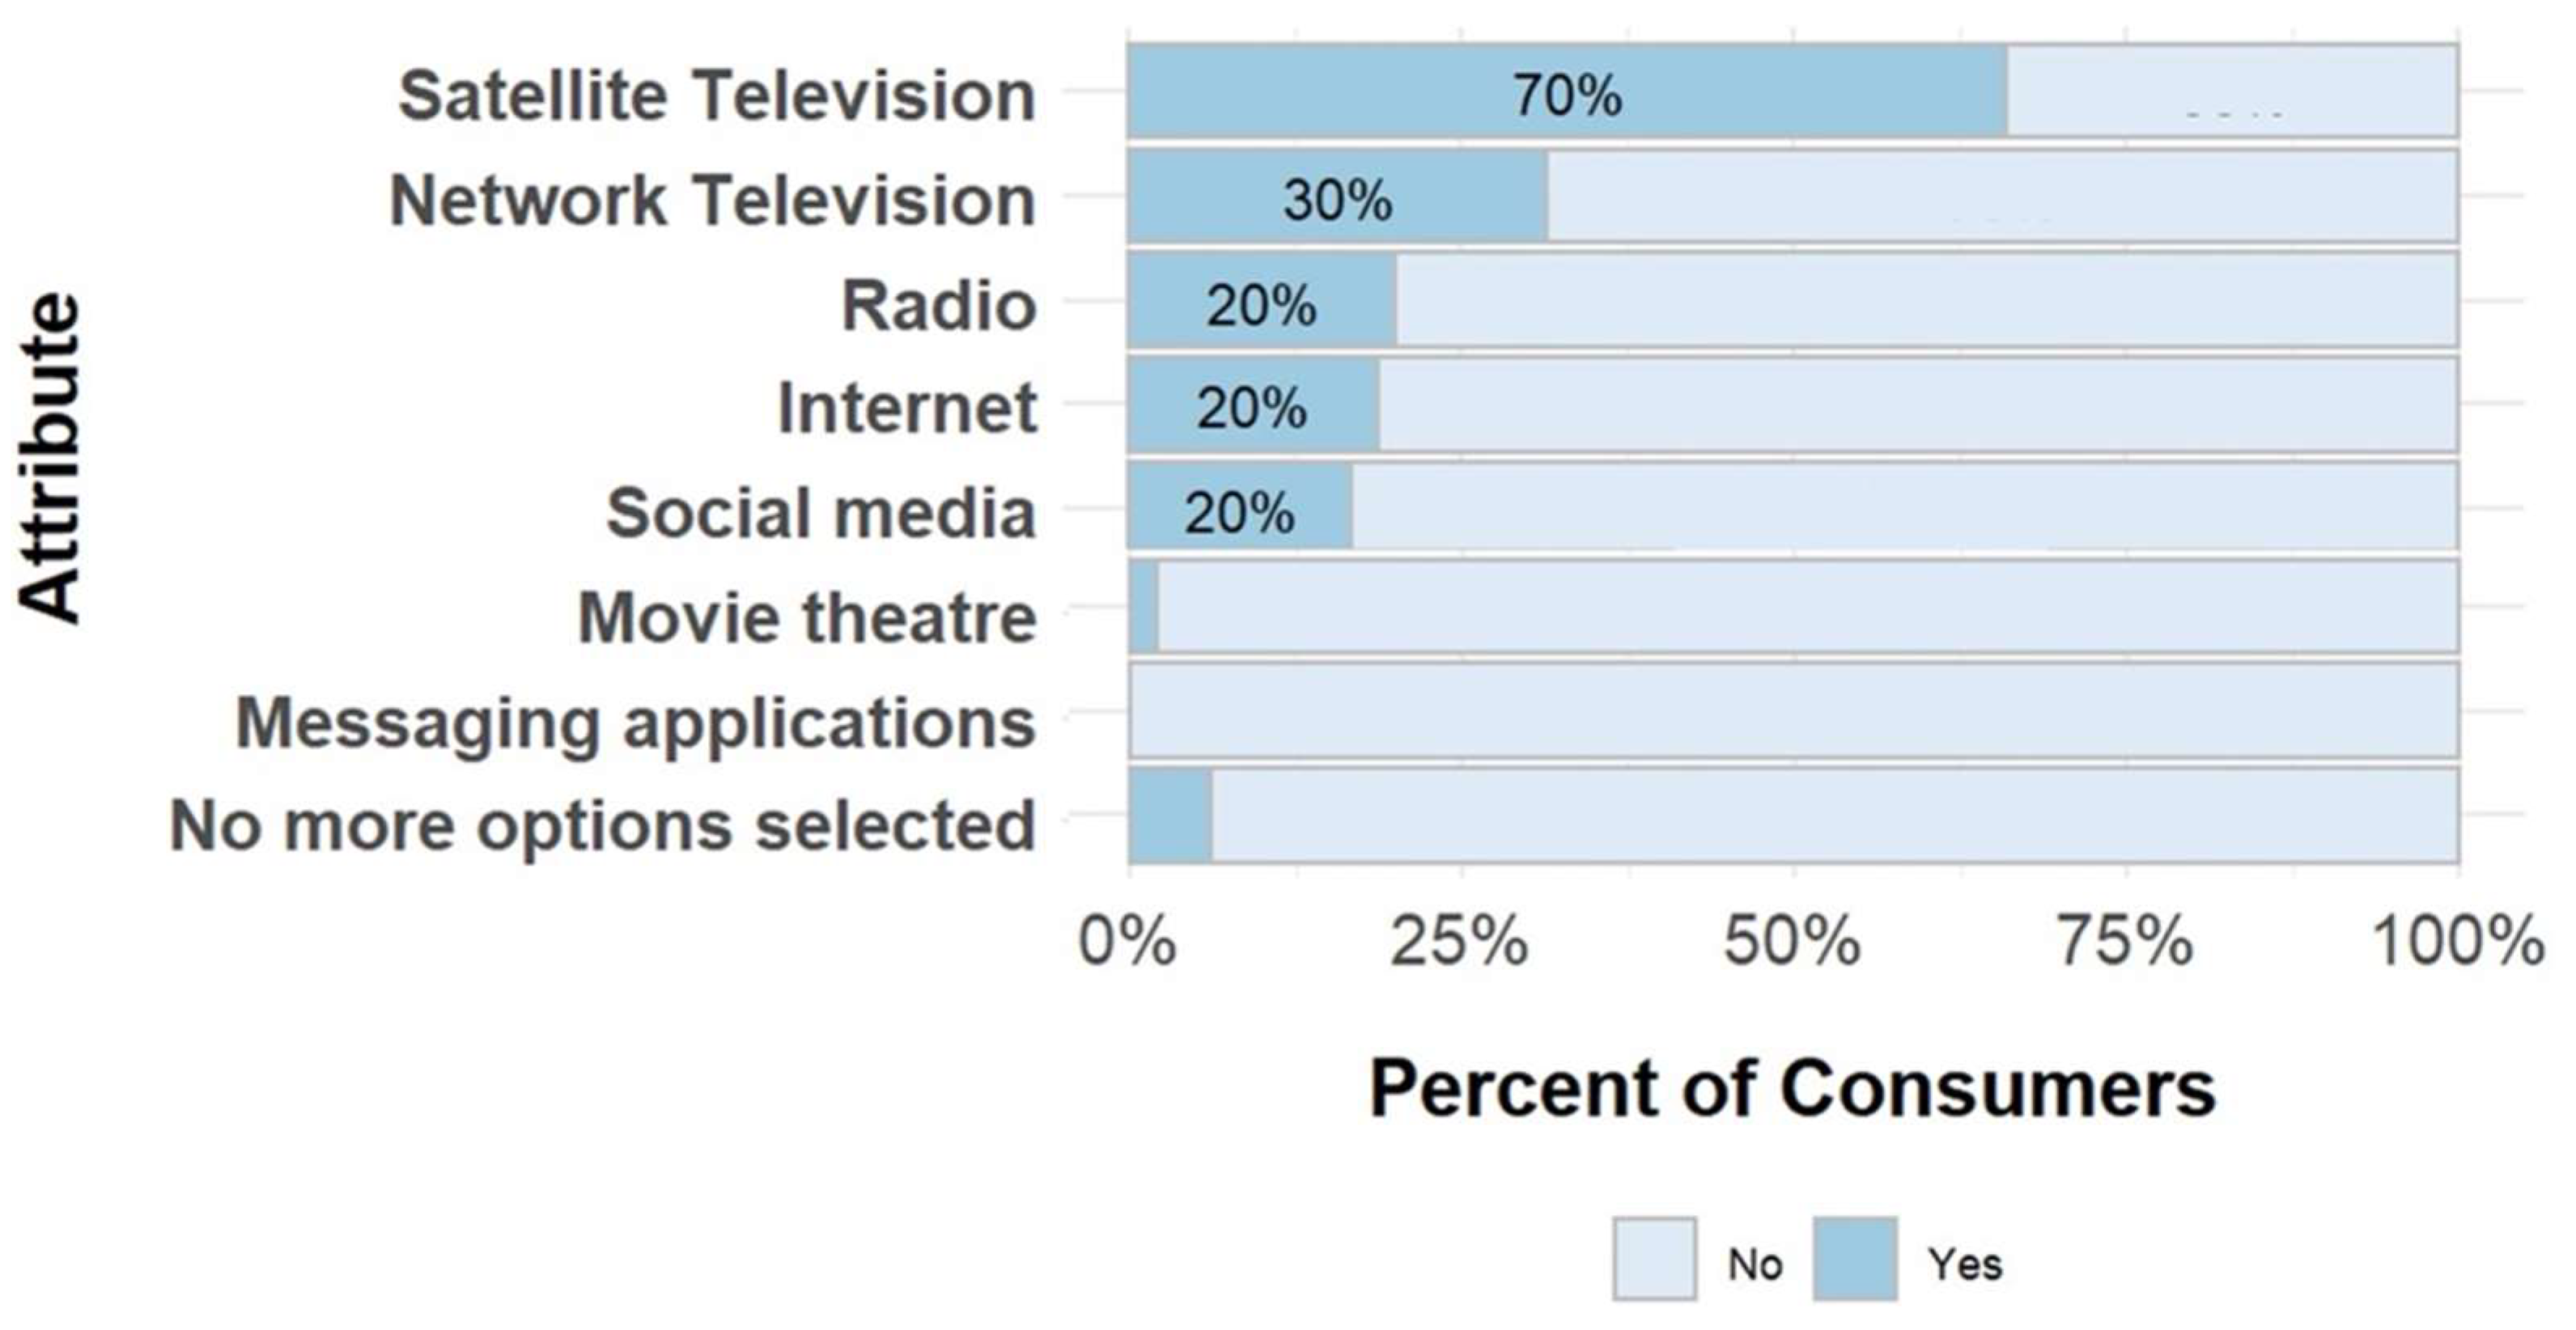
Consumers use different media channels for entertainment purposes (Figure 4). Satellite TV was the most frequently mentioned media type (70%), followed by network TV (30%) and radio (20%) – all of which were used daily.
Figure 4.
Source of media used for entertainment for consumers.
3.3. Vendor Survey
This section reviews vendor behaviors and attitudes that can inform the design of food safety interventions. This includes what products vendors sell; how vendors choose suppliers; how often vendors purchase new batches of food; actions that vendors take to promote purchasing of their products; communication among vendors and consumers; reasons vendors think customers complain; cleaning practices of vendors; where unsold food is kept; what sources of media vendors use.
3.3.1. General Food Vending Practices
Most of the vendors surveyed did not own land (93%), cultivate any food crops (94%) or own livestock (84%). The majority (95%) did not produce the commodities they sold in the market. Three quarters of vendors sold tomatoes, while 18% sold kale and 10% sold lettuce. Half of vendors (58%) changed the commodities they sold by season. The primary reason for this was due to the quality of the food varying during rainy (June, July, and August) and dry seasons (December, January, and February; reported by 35% of vendors).
On average, vendors source food from nine suppliers although this number varied (SD ± 23). Vendors predominantly purchase food from wholesalers (89%), and these vendors often (78% of the time SD ± 28) repeatedly purchase from the same wholesaler(s). Vendors chose suppliers by their price, food quality, food cleanliness/safety, and how suppliers treat them (Figure 5). If they wanted to change suppliers, most respondents (81%) indicated that they could do so.
Vendors reported getting new batches of kale daily (26%, N=7 of 27), lettuce two days per week (47%, N=7 of 15), and tomatoes three times per week (33%, N=37 of 114). Vendors generally bring food to the market themselves (75%). Women had suppliers bring food to their shop more often than men (27%, N=34 of 128 and 9%, N=2 of 22 respectively) which potentially reflects differences in access to equipment or a vehicle to transport products. There was a significant difference between how women and men bring food to the market (p-value = 0.01, chi-square test).
Most vendors are satisfied with their experience selling at the market (79%) and feel that they are physically safe when selling food at the market (81%). Most shops consisted of a tarp on the floor (40%) or a wood structure (25%). On average, vendors have been selling at this market for 8.1 years (SD ± 7.0) with women (Mean=8.5, SD ± 7.0) having been vendors at this market for more time on average than men (Mean=6.0, SD ± 6.7). This difference is significant (p-value < 0.05, t-test). All vendors surveyed only sell produce at the target market. Additionally, working at the shop is the primary income-generating activity for most vendors (97%) and there generally are no additional staff working at the shop (76%). Most shops are open year-round (98%). Per day, vendors on average sell to 9 customers (SD ± 10) with an average of 4 customers being regular customers (SD ± 3). Men were found to sell to more customers (14) on average than women (9, p-value = 0.01, t-test). Vendors perceive that the reasons that customers choose to purchase food from their shop include the quality of the food, their personality, and giving discounts on their products. Many vendors report using only one or two actions to promote consumer purchasing of their products, including discounting the prices of their products, treating customers politely, and having quality food (Figure 6).
Overall, vendors felt supported by other vendors. If vendors need help doing something in their shop, they trust other vendors will help them (58%). Reasons that a vendor did not trust that other vendors would help them included vendors acting independently and the negative perception of asking for help.
3.3.2. Food Safety Knowledge, Awareness, and Attitudes
Overall, vendors thought that the market was moderately clean (Mean=3.3 on a 5-point scale, SD ± 0.9). Of the 21 vendors that rated the market as dirty or very dirty, improper waste disposal and rain were most frequently mentioned as primary reasons.
Vendors are generally not worried about foodborne disease (73%). Only 7% indicated they were worried about bacteria. While vendors generally do not perceive foods as risky, they desired information on the topic. Several vendors expressed interest in learning more about bacteria and how negative health effects such as diarrhea can be related to contaminated food. Only 3% of vendors reported that they or someone in their household experienced a foodborne illness in the last year, compared to 9% of consumers.
3.3.3. Food Safety Choices and Behaviors
Vendors felt confident in their ability to find suppliers that sell high quality food and choose safe foods from these suppliers – as “agree” and “strongly agree” comprised >90% for all responses. Most vendors (62%) also said that they would spend more time and money selecting safer foods. The variation in answers was slightly greater amongst women than men, with women having a wider range of answers (Table 5).
Vendors are satisfied with their current suppliers (Median: 5.0, SD ± 0.8) due to the quality, price, and cleanliness of the food that they sell. Suppliers and vendors care about the quality, price, and safety of food. Vendors noted several visual cues to identify signs that a batch of food may be unsafe, including signs of rotting or spoiling, or vendors’ unhygienic practices.
Vendors agree that customers tell them when they are satisfied with the food they provide (Median 4.0, SD ± 0.6). Men reported that customers tell them they are satisfied with the food they provide more often than women (Median for men: 4.5, SD ± 0.5; Median for women: 4.0, SD ± 0.6).
Verbal communication on food attributes is uncommon. Vendors reported that customers infrequently or never ask where their food comes from (92%). Vendors generally do not have conversations about the safety of the food that they sell with consumers (61%). The quality or variety of tomatoes is most discussed (45%). Out of the vendors that had customers complain, the most common complaints were about quality, shelf life, price, and taste of their products. A small number of vendors stated that they have heard customers complain about their food making a customer or household member sick (Figure 7). Similarly, vendors reported that they do not often or never have conversations with suppliers about food safety and quality (82%).
Nearly all (97%) of vendors agreed or strongly agreed that they were proud of the quality of the food they sold, and most 79% were satisfied with overall shop operations. Vendors had varied answers related to whether there were specific rules for preserving food safety and shop cleanliness: while over half of those surveyed agreed with these statements, about one-third disagreed (Table 6).
Nearly all vendors (97%) reported not having made changes to the structure of their shop structure or the way they sell food in the past year, but they have taken actions to keep food safe. In the past year, vendors obtained towels, knives, umbrellas, and fly whisks to keep food safe. Vendors reported to sweep/clean their shop daily (58%) as well as washing the food that they sell daily (19%). On average, vendors said that they wash their hands 3.3 times per day (SD ± 1.9). Additional actions vendors perform to keep food safe include using a fly whisk to get flies off of food (15%), cleaning food with a cloth (12%), and covering food from the sun with a shade or a polypropylene fabric (12%).
Unsold food is generally kept at the shop for the next day (90%; Figure 8). The majority of the vendors surveyed did not have a refrigerator in their household (83%, N=125 of 150). Alternative ways vendors stored food include covering it or putting it in a crate.
3.3.4. Information Sources and Media Use
The households of most vendors own at least one cell phone (97%), a television (70%), a satellite dish (69%), and a radio (58%). Of the vendors surveyed, 73% of vendors owned at least one mobile (non-smart) phone and 18% owned a smartphone.
The majority (91%) of the vendors surveyed do not have access to the internet. Of those that do, a smartphone was the most frequently mentioned device respondents utilize to access the internet (86%, N=12 of 14 who have access to internet) followed by mobile tablet and desktop computer (7%, N=1 of 14 each). Among the social media platforms, most of the vendors regularly use Facebook and Telegram (64%, N=9 of 14 and 64%, N=9 of 14 respectively). The most common media channel vendors use for entertainment include network and satellite television (74% and 33% respectively).
Of the vendors who watch network or normal television, most vendors watch it daily (87%, N=97 of 111). In contrast, of the vendors who watch satellite television, some watch it daily (41%), but a larger percentage watch it two or three times a week (47%). When asked about the types of entertainment content viewed, vendors most frequently mentioned TV series or soap operas (76%). Women (63%) sought out this content more than men (13%).
Vendors trust medical professionals to provide reliable information about health issues (95%). To determine the safety of food, vendors would predominantly consult friends or family (70%) and medical professionals (71%).
4. Discussion
This study revealed important factors to consider for the design of food safety interventions applicable to consumers and vendors in traditional markets, and possibly other informal food environments and supply chains in Ethiopia.
Consumers are loyal customers, as many of them have been shopping at the market for more than three years. Consumers’ choice of which vendor to purchase from within the market are influenced by food quality, safety, price, and personality of the vendor. Because consumers commonly buy food from a particular preferred vendor, but at least sometimes compare vendors, interventions could leverage these relationships. Vendors could see an incentive to improve their food safety practices, either by being favored by consumers that compare shops (or when they do) and/or by enhancing trusted relationships with regular customers. For this incentive to be a driver of vendors’ behavior change, consumers need to perceive the improvements, value them, and reward them by patronage or increasing the vendor’s reputation in the community.
Food safety, on its own, is usually not a factor of primary salience for consumers when selecting a vendor and buying food. Price and perceived quality (which may indirectly include safety attributes) are primary purchase factors that both consumers and vendors agree upon. Other studies in markets and with street food vendors confirm this trend in multiple geographies [16,17,18]. Although perceived food safety is not commonly reported as an explicit purchase factor, other characteristics such as shop neatness and vendor trustworthiness may implicitly be associated with food safety practices and could be leveraged in tandem with more explicit food safety cues to direct consumer preferences [17,19,20].
Vendors and consumers have different opinions on the safety of food sold at the market. Vendors felt confident in their ability to find suppliers that sell high quality food and to choose safe foods from suppliers, while consumers stated that differences exist in the safety of foods sold by different vendors. When specifically prompted about assessing food safety and shop hygiene, consumers primarily rely on visual cues. An opportunity exists to enhance the visibility of these cues (or introduce new ones) and increase the perceived association between cues and benefits for the consumer. For instance, food safety practices could be made visible or highlighted to catch consumers’ attention, for example via colorful tools (e.g. cleaning rags, waste bins, washable surfaces, aprons), shop or food brands, or food labels. This strategy has been tested by EatSafe and other programs [21,22,23].
Price is a key factor that influences consumers’ food purchasing decisions when selecting a market, a vendor, and food. Interventions to increase food safety need to be sensitive to price thresholds and consumers’ willingness to pay for food of different quality. This is particularly important for low SES households that need to prioritize nutrition security. Since most low-income consumers are generally not willing or able to pay a premium for safer food [24,25], cost and price increases should be minimized, or -possibly- managed for a combination of attributes that consumers value (e.g. food quality, convenience, bulk discounts). The literature on willingness-to-pay for safer food is rapidly evolving, also pointing to circumstances where it might be leveraged as an incentive [26,27,28,29]. Education programs might increase awareness of the cost of foodborne illness (e.g. loss of income, cost of medical interventions), as a way to increase consumers’ willingness to pay for safer food. However, price is likely to remain a top purchase choice factor, and financial considerations for different consumer segments need to be considered. Even in cases where some food price increase may be workable, safeguards to mitigate the unintended consequence of such increases should be included in program design.
The cost of interventions for vendors also needs to be carefully considered. For many vendors, selling food at the market is their main livelihood. Ideally, interventions would result in minimal costs to the vendor while attracting more customers, thus increasing sales. This would incentivize individual vendors to continue implementing safe food practices and potentially motivate other vendors to adopt them. Competition among vendors seems to be accepted, suggesting there could be a role for interventions focusing on individual stalls/vendors. However, market-based programs involving many or all vendors could also leverage values of collaboration and equity. For example, structural improvements or services such as provision of potable water, waste management, or raised stalls could be more efficiently secured, and potentially more easily accepted, via collective investments. Vendor demand and willingness to invest in such market-wide improvements, while unlikely to be motivated by food safety alone, could be driven by other business incentives (e.g. better consumer access to their stall, better working conditions, less food spoilage and waste). Food safety design could then be embedded in these upgrades. However, investing in improvements that benefit all vendors might reduce incentives for individual vendors to “stand out” from the competitors by investing in their stall. The balance, to different extents, of competitive and collaborative dynamics among vendors has been observed in other contexts [19,30,31] and warrants further attention. Additionally, interventions should be aware of whether vendors are licensed to sell products in the market, as their official vs. unofficial status could influence vendors’ willingness to participate in activities, costs incurred, and dynamics among vendors and financial considerations need to be accounted for so that potential operating cost increases do not penalize vendors who adopt improved practices.
There seems to be a role for information sharing on food safety and foodborne illness, to increase motivation and inform purchasing and vending decisions. Consumers generally did not believe that individuals can become sick from consuming kale, lettuce, or tomatoes. Similarly, vendors were not generally concerned about foodborne diseases. In practice, proper sourcing and handling of fresh vegetables are crucial to prevent foodborne disease [10,32]. At the same time, both vendors and consumers expressed an interest in learning more about how negative health effects such as diarrhea can be related to contaminated food. These findings highlight a gap in risk awareness as well as some demand for information. Increasing the salience of both the positive impacts of food safety and the negative impacts of FBD may be important when trying to motivate consumers to explicitly pay attention to food safety cues while shopping. For vendors, awareness of how potential customer reactions to becoming sick from the food they sell could damage their reputation may provide an incentive to adopt improved practices, especially if illness can be traced back to their shop, if the cause is considered to be under the vendor’s control, and if this occurrence is not just a low-likelihood hypothetical. Even so, awareness or information are generally not sufficient to lead to action without either an emotional reward and/or a rational incentive; these behavior drivers need to be accounted for in interventions [8,18]. In alternative to (or in parallel with) explicit food safety messaging, it may be possible to embed food safety cues and objectives within broader characteristics that are already salient and important to consumers, such as food quality (e.g., high quality food should also be clean, free of flies, with its surface unbroken) or a vendor’s trustworthiness (e.g., a trustworthy vendor keeps their shop clean, tidy, without pests).
As one category of incentives, logistical problems affecting vendors’ could be leveraged to increase their capacity and self-efficacy for safe food handling. For instance, unsold product and storage are common concerns for vendors. Some vendors store food overnight in the market and try to sell it the next day. Unsold food could be a potential food safety concern depending on how it is stored. Additionally, many vendors find it sometimes difficult to keep their shop clean. Supporting vendors in solving these issues would likely result in food safety benefits.
It is important to understand how information is shared and received. Both consumers and vendors in this study rarely, if ever, talk about food quality and safety during market transactions, suggesting verbal communication is not a common way to express demand. Vendors also do not commonly discuss food quality or safety with their suppliers. At the same time, vendors perceive their fellow vendors as collaborative and available to help each other if there is need, suggesting openness to interaction. When asked where they obtain information about food safety, both groups stated they would consult family and friends as well as medical professionals. The important role of community and family members in sharing food safety information was also noted in other contexts [20]. Interventions could leverage these communication channels to increase the salience of and demand for improved food safety practices.
Gender considerations should be accounted for in interventions. While most survey answers were not significantly different between women and men, for both consumers and vendors, important differences in roles and social norms emerged. Most fresh vegetable vendors at the market are women. Women vendors on average have been vending at the market for a longer time. Women and men have different ways of transporting food to the market, with women having suppliers bring food to their shop more commonly than men. Women are also primarily responsible for food preparation in the household, which can mean higher familiarity with the nuances of food quality and safety, and with handling practices. As a consequence, behavior change targets, motivators, and channels may need to be different between women and men.
This study has limitations that should be considered when interpreting the results. First, it is a cross-sectional survey conducted in one market in a mid-size city in the Sidama region in Ethiopia, which may limit the generalizability of findings. However, similar results were found in a study conducted by the research team in Nigeria [35]. In addition, structured surveys have limits in the range and nuance of questions that can be effectively answered in a short time. EatSafe conducted additional qualitative in-depth interviews and targeted behavioral research to complement findings of the study presented here, and more comprehensively inform intervention decisions [18,36,37]. These activities confirmed and strengthened the findings reported here.
While it was not a primary focus of this study, it is important to highlight the role of market infrastructure in the choice of effective interventions. Respondents reported several infrastructure issues that can play a key role in the safety of foods sold at the market, including drainage and flooding, mud, improper waste disposal, and lack of potable water. Infrastructure has been highlighted as a key gap to improving food safety in market settings by several other studies [30,38] and need to be addressed in tandem with behavior change and its drivers.
5. Conclusions
Results of this survey demonstrate that vendors and consumers in traditional markets are motivated to sell and buy safe food products. What cues are considered signs of acceptable safety and the dominance of other decision factors may limit actions consistent with increased safety. Nevertheless, opportunities exist to increase food safety through vendors’ and consumers’ behaviors and attitudes around safe food handling and purchasing. Key aspects to consider, highlighted in this study, include:
- Consumers’ purchase choice drivers (in this case, food quality and price), as well as vendors’ awareness of what consumers look for;
- Cues or signs of food safety used by consumers (and possibly vendors), and ideally tiers of desirability/acceptability; cues may be specific to food safety or merge with other overlapping characteristics (e.g. freshness, quality, healthiness);
- Vendor’s needs, grievances, and aspirations for their shop and the market;
- Competition and collaboration dynamics among vendors, also considering market governance and oversight from local public entities;
- Gender roles, and whether intervention pathways or content should differ between genders (and possibly other population segments);
- Current practices, especially those that could be reinforced, made easier, or slightly modified to potentially yield public health benefits;
- Costs of implementing new practices, and implications on food prices, in tandem with consumers’ willingness to pay for specific perceived benefits;
- Trusted sources of information, including media channels.
Formative research tools on food safety KAPs, including quantitative and qualitative approaches, have been developed in several studies [18,20,39,40], but there is no consensus on what their focus should be. Importantly, past studies have focused on practices and knowledge. However, behavior drivers such as motivations and incentives, self-efficacy, beliefs, and interpersonal dynamics (here under the “attitudes” label) are crucial to engender sustained behavior change and deserve more attention. Novel tools such as the EatSafe rapid market assessment [41,42] can be particularly helpful where key information on KAP and market operations needs to be obtained with minimal time and resources. Improvements in food safety KAP tools, including in the broader context of food environments [43,44], can strengthen theories of change, identify strong incentives, and help align interventions to social norms, including gender roles. This can increase the relevance of the intervention to participants and their ability to include a new behavior into established mental models and routines.
Supplementary Materials
The following supporting information can be downloaded at the website of this paper posted on Preprints.org. Supplemental Information 1: Consumer Questionnaire. Supplemental Information 2: Vendor Questionnaire. Supplemental Information 3: Ethiopia-specific PPI indicators and scores.
Acknowledgements
This study was made possible through support provided by Feed The Future through the United States Agency for International Development (USAID), under the terms of the EatSafe Cooperative Agreement No. 7200AA19CA00010. The opinions expressed herein are those of the authors and do not necessarily reflect the views of USAID or the United States Government. The authors wish to thank Anthony Wenndt, Nwando Onuigbo-Chatta, Eva Monterrosa, and Stella Nordhagen for their input in initial versions of the protocol; Caroline Smith DeWaal, Richard Pluke, and Abigail Reich for review of earlier versions of this manuscript or the report on which it is based; and Ipsos for data collection.
References
- Jaffee S, Henson S, Unnevehr L, Grace D, Cassou E. The safe food imperative: Accelerating progress in low-and middle-income countries. The World Bank; 2018.
- Global Alliance for Improved Nutrition (GAIN). Review of Food Safety Policy and Legislation in Ethiopia. EatSafe: Evidence and Action Towards Safe, Nutritious Food; 2022 Jan. Available: https://www.gainhealth.org/sites/default/files/publications/documents/Review%20of%20Food%20Safety%20Policy%20in%20Ethiopia.pdf.
- Grace, D. Food Safety in Low and Middle Income Countries. IJERPH. 2015;12: 10490–10507. [CrossRef]
- Ayalew, H. Review on food safety system: Ethiopian perspective. Afr J Food Sci. 2013;7: 431–440. [CrossRef]
- Havelaar AH, Kirk MD, Torgerson PR, Gibb HJ, Hald T, Lake RJ, et al. World Health Organization Global Estimates and Regional Comparisons of the Burden of Foodborne Disease in 2010. von Seidlein L, editor. PLoS Med. 2015;12: e1001923. [CrossRef]
- Roesel K, Grace D. Food safety and informal markets: Animal products in sub-Saharan Africa. Routledge; 2014.
- Nordhagen S, Hagos S, Gebremedhin G, Lee J. Vendor capacity and incentives to supply safer food: a perspective from urban Ethiopia. Food Sec. 2025 [cited 26 Mar 2025]. [CrossRef]
- Global Alliance for Improved Nutrition (GAIN). EatSafe Learnings from Phase I Research in Hawassa, Ethiopia. EatSafe: Evidence and Action Towards Safe, Nutritious Food; 2023 Feb. Available: https://www.gainhealth.org/sites/default/files/publications/documents/EatSafe-Learnings-from-Phase-I-Research-in-Ethiopia.pdf.
- Global Alliance for Improved Nutrition (GAIN). Food Safety Hazards and Risk Associated with Fresh Vegetables: Assessment from a Traditional Market in Southern Ethiopia. EatSafe: Evidence and Action Towards Safe, Nutritious Food; 2023. Available: https://www.gainhealth.org/sites/default/files/publications/documents/Food_Safety_Hazards_Risk_Fresh_Vegetables_%20Traditional_Market_Southern_Ethiopia.pdf.
- Global Alliance for Improved Nutrition (GAIN). Literature Review on Foodborne Disease Hazards in Food and Beverages in Ethiopia. EatSafe: Evidence and Action Towards Safe, Nutritious Food; 2022 Mar. Available: https://www.gainhealth.org/sites/default/files/publications/documents/Literature%20Review%20on%20Foodborne%20Disease%20Hazards%20in%20Foods%20and%20Beverages%20in%20Ethiopia.pdf.
- Hsieh FY, Liu AA. Adequacy of sample size in health studies. Stanley Lemeshow, David W. Hosmer Jr., Janelle Klar and Stephen K. Lwanga published on behalf of WHO by Wiley, Chichester, 1990. No. of pages: xii + 233. Price:£D17.50. Statistics in Medicine. 1990;9: 1382–1382. [CrossRef]
- StataCorp. Stata Statistical Software: Release 17. College Station, TX: StataCorp LLC; 2021.
- Team, RC. R: A language and environment for statistical computing. R Foundation for Statistical Computing, Vienna, Austria. https://www.R-project.org/. 2022. Available: https://www.R-project.org/.
- Poverty Probability Index. Ethiopia. In: PPI [Internet]. 2020 [cited 6 Oct 2022]. Available: https://www.povertyindex.org/country/ethiopia.
- Misra S, Li H, He J. Machine learning for subsurface characterization. Cambridge, MA: Gulf Professional Publishing, an imprint of Elsevier; 2020.
- Jaffee S, Henson S. Promoting Food Safety in the Informal Markets of Low and Middle-Income Countries: The Need for a Rethink. Food Protection Trends. 2024;44: 376–382.
- Rheinländer T, Olsen M, Bakang JA, Takyi H, Konradsen F, Samuelsen H. Keeping up appearances: perceptions of street food safety in urban Kumasi, Ghana. J Urban Health. 2008;85: 952–964. [CrossRef]
- Nordhagen S, Hagos S, Gebremedhin G, Lee J. Understanding consumer beliefs and choices related to food safety: a qualitative study in urban Ethiopia. Public Health Nutr. 27: e239. [CrossRef]
- Nordhagen S, Lee J, Onuigbo-Chatta N, Okoruwa A, Monterrosa E, Lambertini E, et al. “Sometimes You Get Good Ones, and Sometimes You Get Not-so-Good Ones”: Vendors’ and Consumers’ Strategies to Identify and Mitigate Food Safety Risks in Urban Nigeria. Foods. 2022;11: 201. [CrossRef]
- Isanovic S, Constantinides SV, Frongillo EA, Bhandari S, Samin S, Kenney E, et al. How Perspectives on Food Safety of Vendors and Consumers Translate into Food-Choice Behaviors in 6 African and Asian Countries. Curr Dev Nutr. 2023;7: 100015. [CrossRef]
- Leveraging Consumer Demand to Drive Food Safety Improvements in Traditional Markets: FTF EatSafe’s Research & Implementation Results. In: GAIN [Internet]. [cited 28 Feb 2025]. Available: https://www.gainhealth.org/resources/reports-and-publications/leveraging-consumer-demand-drive-food-safety-improvements.
- Noor AYM, Toiba H, Setiawan B, Wahib Muhaimin A, Nurjannah N. Indonesian Consumers’ Preferences and Willingness to Pay for Certified Vegetables: A Choice-Based Conjoint Approach. Journal of International Food & Agribusiness Marketing. 2024;36: 617–642. [CrossRef]
- Hoffmann V, Moser CM, Herrman TJ. Demand for Aflatoxin-Safe Maize in Kenya: Dynamic Response to Price and Advertising. American Journal of Agricultural Economics. 2021;103: 275–295. [CrossRef]
- Owusu-Sekyere E, Owusu V, Jordaan H. Consumer preferences and willingness to pay for beef food safety assurance labels in the Kumasi Metropolis and Sunyani Municipality of Ghana. Food Control. 2014;46: 152–159. [CrossRef]
- Alimi BA, Oyeyinka AT, Olohungbebe LO. Socio-economic characteristics and willingness of consumers to pay for the safety of fura de nunu in Ilorin, Nigeria. Quality Assurance and Safety of Crops & Foods. 2016;8: 81–86. [CrossRef]
- Wongprawmas R, Canavari M. Consumers’ willingness-to-pay for food safety labels in an emerging market: The case of fresh produce in Thailand. Food Policy. 2017;69: 25–34. [CrossRef]
- Alphonce R, Alfnes F. Consumer willingness to pay for food safety in Tanzania: an incentive-aligned conjoint analysis. International Journal of Consumer Studies. 2012;36: 394–400. [CrossRef]
- Alimi BA, Workneh TS. Consumer awareness and willingness to pay for safety of street foods in developing countries: a review. International Journal of Consumer Studies. 2016;40: 242–248. [CrossRef]
- Vuong H, Pannell D, Schilizzi S, Burton M. Vietnamese consumers’ willingness to pay for improved food safety for vegetables and pork. Australian Journal of Agricultural and Resource Economics. 2024;68: 948–972. [CrossRef]
- Zhong S, Werner C. The hidden strength of small business: Social networks and wet market vendors in China. Economic Anthropology. 2025;12: e12323. [CrossRef]
- Nordhagen S, Lee J, Monterrosa E, Onuigbo-Chatta N, Okoruwa A, Lambertini E, et al. Where supply and demand meet: how consumer and vendor interactions create a market, a Nigerian example. Food Sec. 2023 [cited 8 Sep 2023]. [CrossRef]
- Osafo R, Balali GI, Amissah-Reynolds PK, Gyapong F, Addy R, Nyarko AA, et al. Microbial and Parasitic Contamination of Vegetables in Developing Countries and Their Food Safety Guidelines. Journal of Food Quality. 2022;2022: e4141914. [CrossRef]
- Osei-Kwasi H, Mohindra A, Booth A, Laar A, Wanjohi M, Graham F, et al. Factors influencing dietary behaviours in urban food environments in Africa: a systematic mapping review. Public Health Nutr. 2020;23: 2584–2601. [CrossRef]
- UNICEF, editor. Children, food and nutrition. New York, NY: UNICEF; 2019.
- Global Alliance for Improved Nutrition (GAIN). Food Safety Attitudes and Practices in Traditional Markets in Nigeria: A Quantitative Formative Assessment. EatSafe: Evidence and Action Towards Safe, Nutritious Food; 2022 Apr.
- Food Safety Perceptions and Practices in Ethiopia: A Focused Ethnographic Study. In: GAIN [Internet]. [cited 28 Feb 2025]. Available: https://www.gainhealth.org/resources/reports-and-publications/food-safety-perceptions-and-practices-ethiopia-focused.
- Global Alliance for Improved Nutrition (GAIN). Evaluation of Consumer and Vendor Behaviors in a Traditional Food Market in Hawassa, Ethiopia. EatSafe: Evidence and Action Towards Safe, Nutritious Food; 2022 Sep. Available: https://www.gainhealth.org/sites/default/files/publications/documents/Evaluation%20of%20Consumer%20and%20Vendor%20Behaviors%20in%20a%20Traditional%20Food%20Market%20in%20Hawassa%2C%20Ethiopia.pdf.
- Ghatak S, Srinivas K, Milton AAP, Priya GB, Das S, Lindahl JF. Limiting the spillover of zoonotic pathogens from traditional food markets in developing countries and a new market design for risk-proofing. Epidemiol Health. 2023;45: e2023097. [CrossRef]
- Lazaro J, Kapute F, Holm RH. Food safety policies and practices in public spaces: The urban water, sanitation, and hygiene environment for fresh fish sold from individual vendors in Mzuzu, Malawi. Food Science & Nutrition. 2019;7: 2986–2994. [CrossRef]
- Global Alliance for Improved Nutrition (GAIN). Qualitative Behavioral Research in Traditional Markets in Kebbi State, Nigeria. EatSafe: Evidence and Action Towards Safe, Nutritious Food; 2022 Jul. Available: https://www.gainhealth.org/resources/reports-and-publications/qualitative-behavioral-research-traditional-food-markets-kebbi.
- Rapid Market Assessment Tool for Food Safety In Traditional Markets. In: GAIN [Internet]. [cited 28 Feb 2025]. Available: https://www.gainhealth.org/resources/reports-and-publications/rapid-market-assessment-tool-food-safety-traditional-markets.
- Market Assessment Tools for Traditional Markets. In: GAIN [Internet]. [cited 28 Feb 2025]. Available: https://www.gainhealth.org/resources/reports-and-publications/market-assessment-tools-traditional-markets.
- USAID Advancing Nutrition. Methods, Tools, and Metrics for Evaluating Market Food Environments in Low-and Middle-Income Countries. Arlington, VA, USA: USAID Advancing Nutrition; 2021.
- Turner C, Kalamatianou S, Drewnowski A, Kulkarni B, Kinra S, Kadiyala S. Food Environment Research in Low- and Middle-Income Countries: A Systematic Scoping Review. Adv Nutr. 2020;11: 387–397. [CrossRef]
Figure 1.
Probability of poverty according to (A) international $3.20/day poverty line; (B) Ethiopia-specific NPL Red points correspond to group mean probability of poverty. Asterisks signify statistical significance with p ≤ 0.0001.
Figure 1.
Probability of poverty according to (A) international $3.20/day poverty line; (B) Ethiopia-specific NPL Red points correspond to group mean probability of poverty. Asterisks signify statistical significance with p ≤ 0.0001.
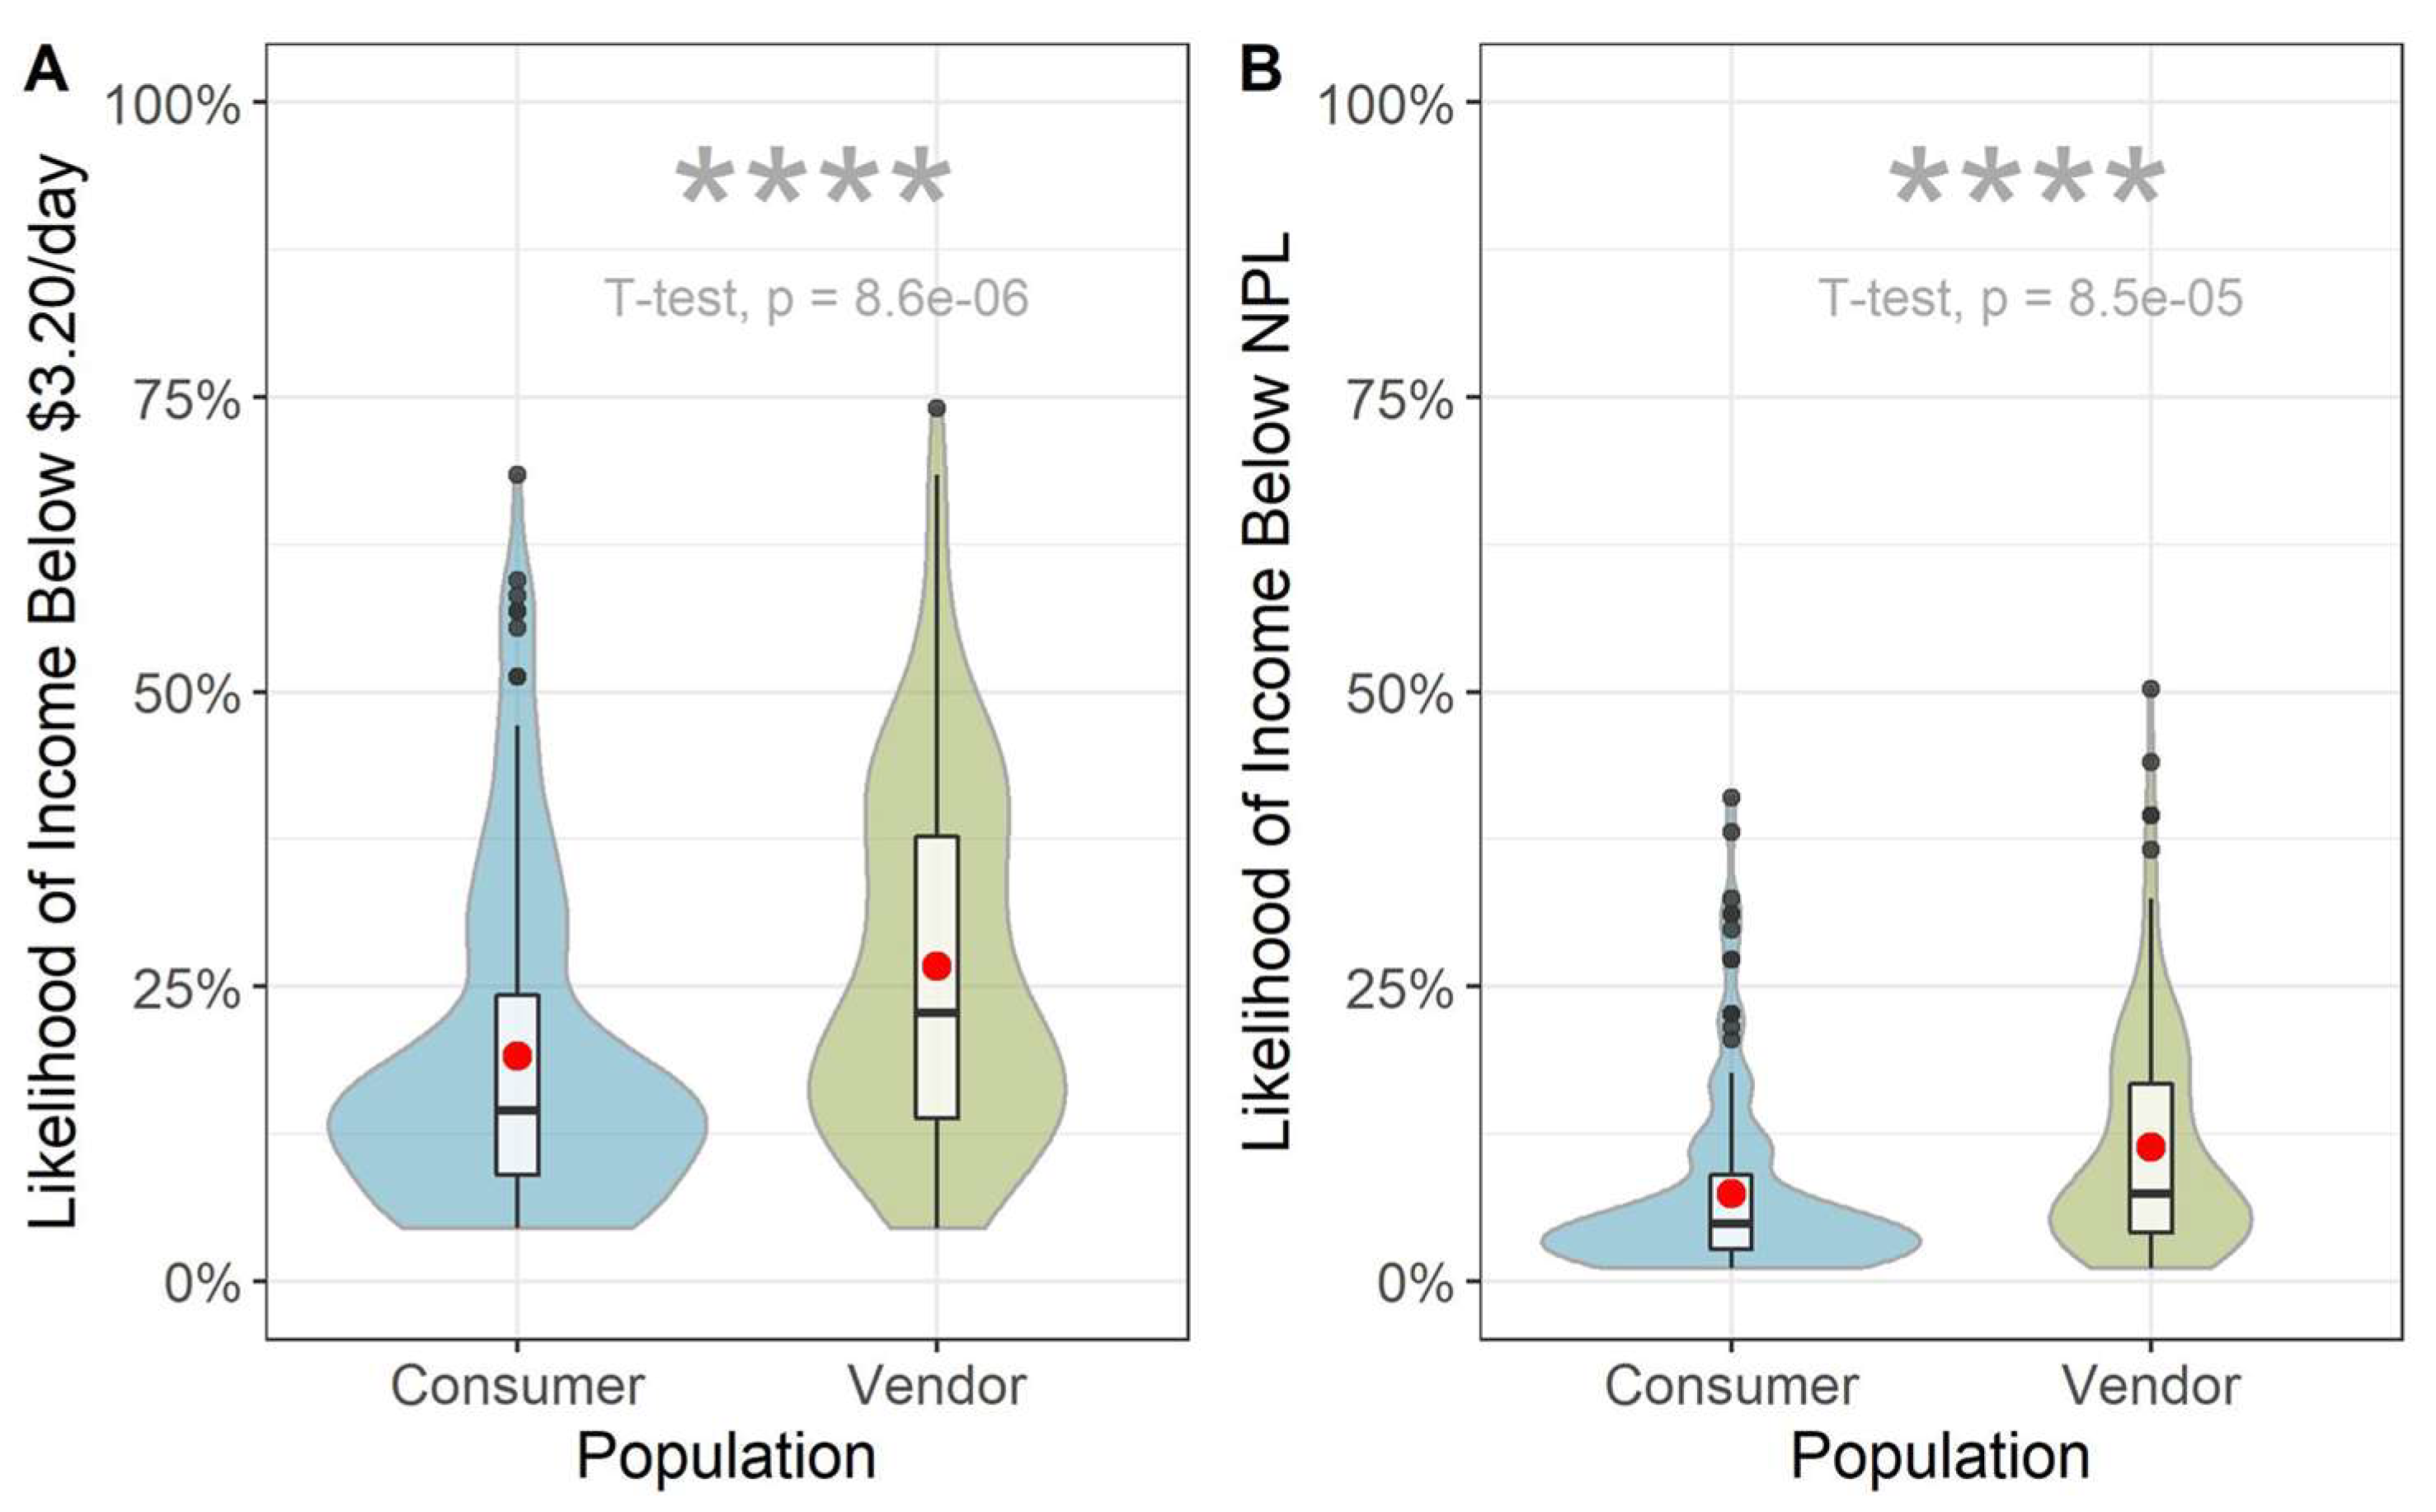
Figure 2.
Reasons consumers choose to purchase food from a particular vendor. (This question gave the option for respondents to provide three answers. Answers were recorded in the order of being mentioned. “First choice” means that this attribute was mentioned first.).
Figure 2.
Reasons consumers choose to purchase food from a particular vendor. (This question gave the option for respondents to provide three answers. Answers were recorded in the order of being mentioned. “First choice” means that this attribute was mentioned first.).
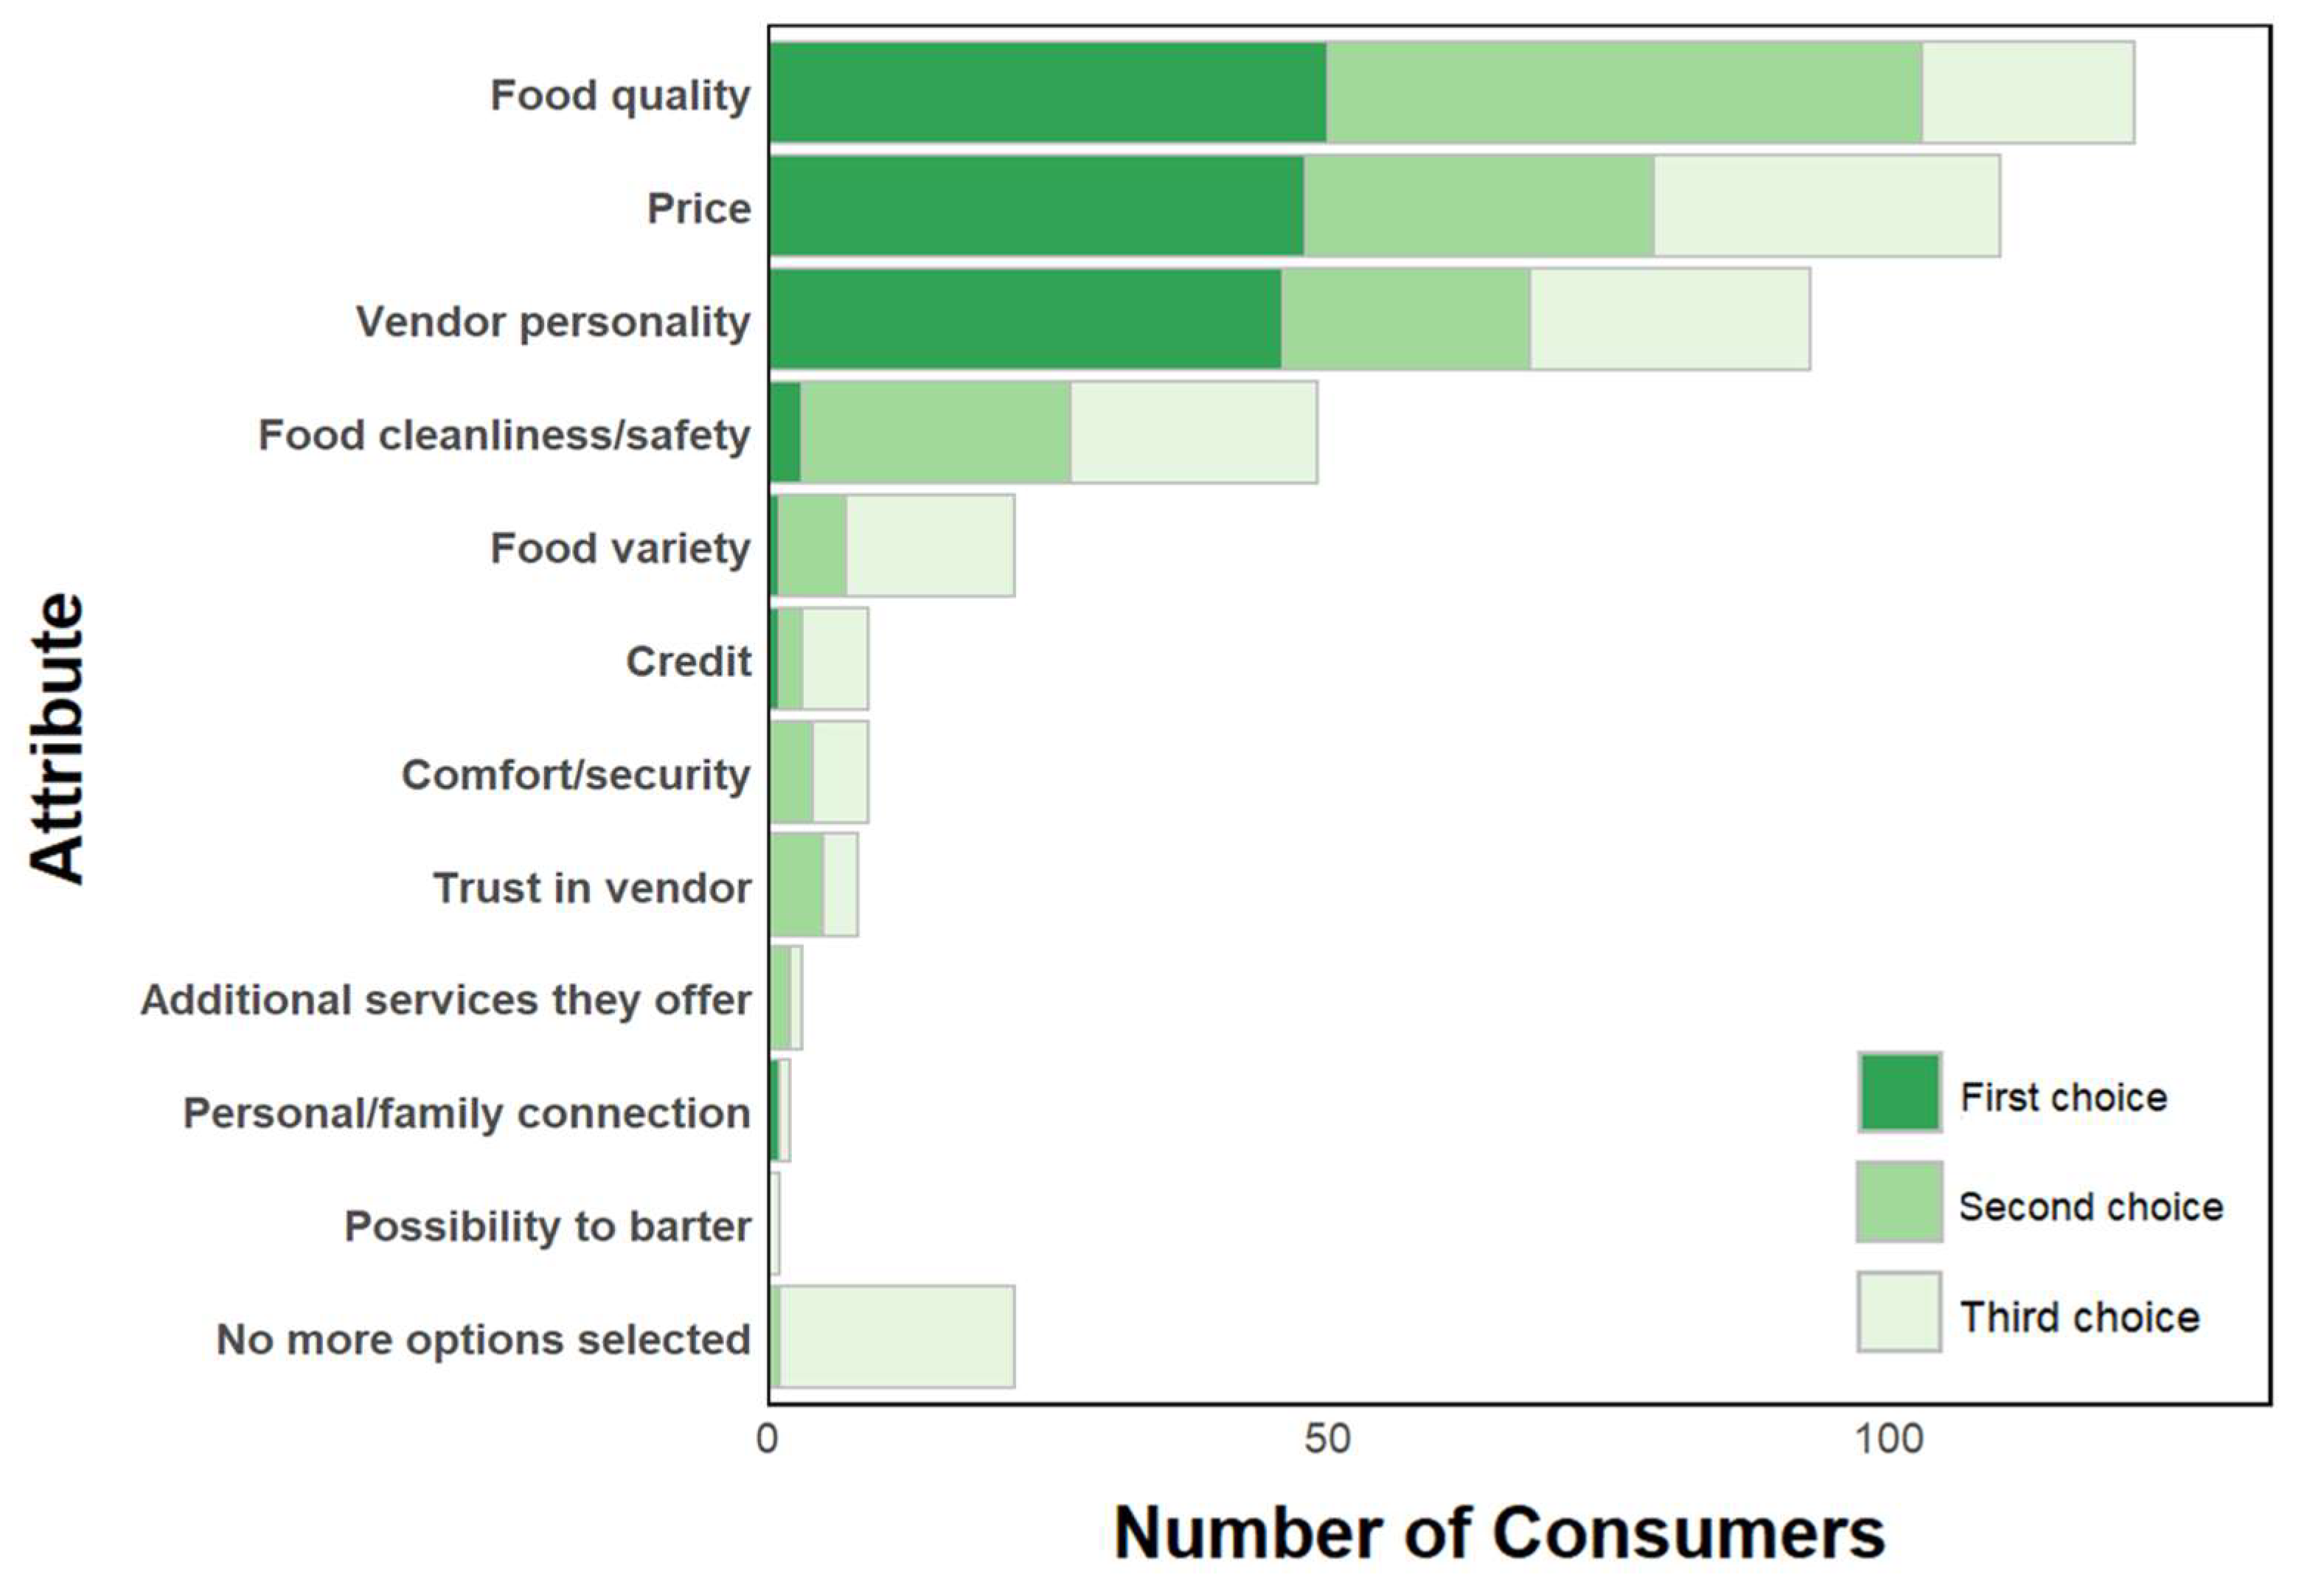
Figure 5.
Reasons that vendors purchase food from a particular supplier.
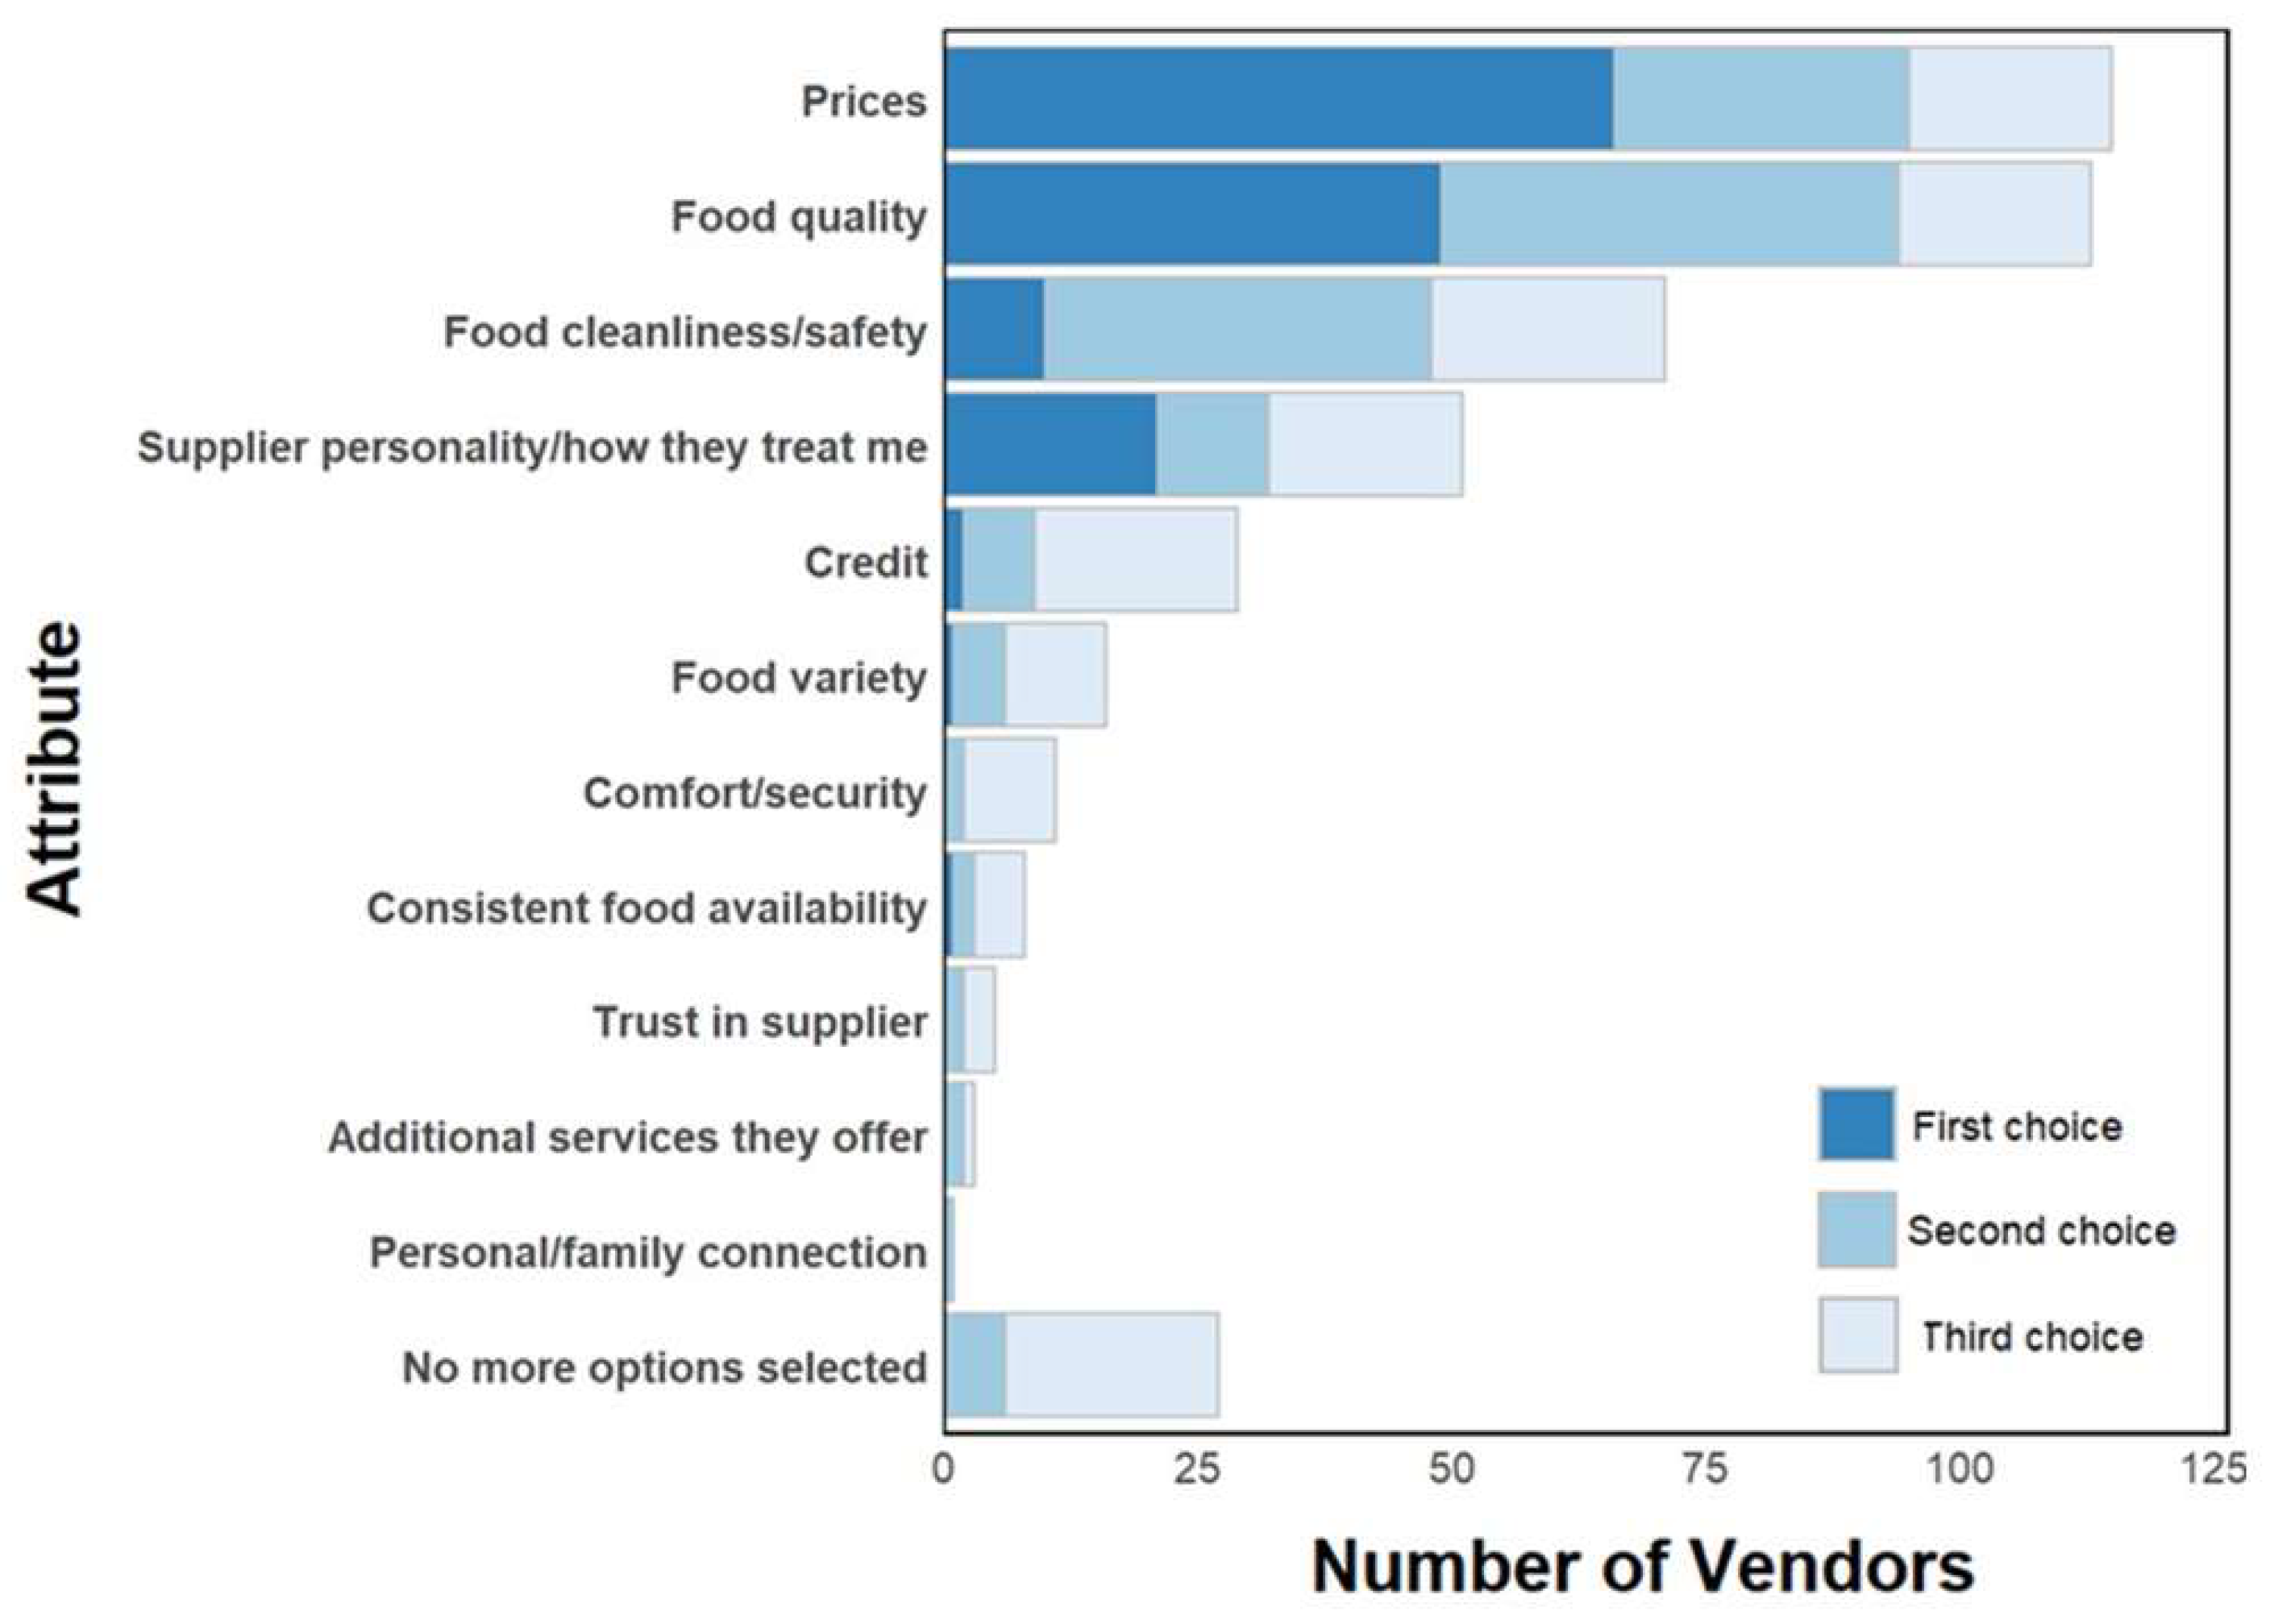
Figure 6.
Actions that vendors take to promote purchasing.
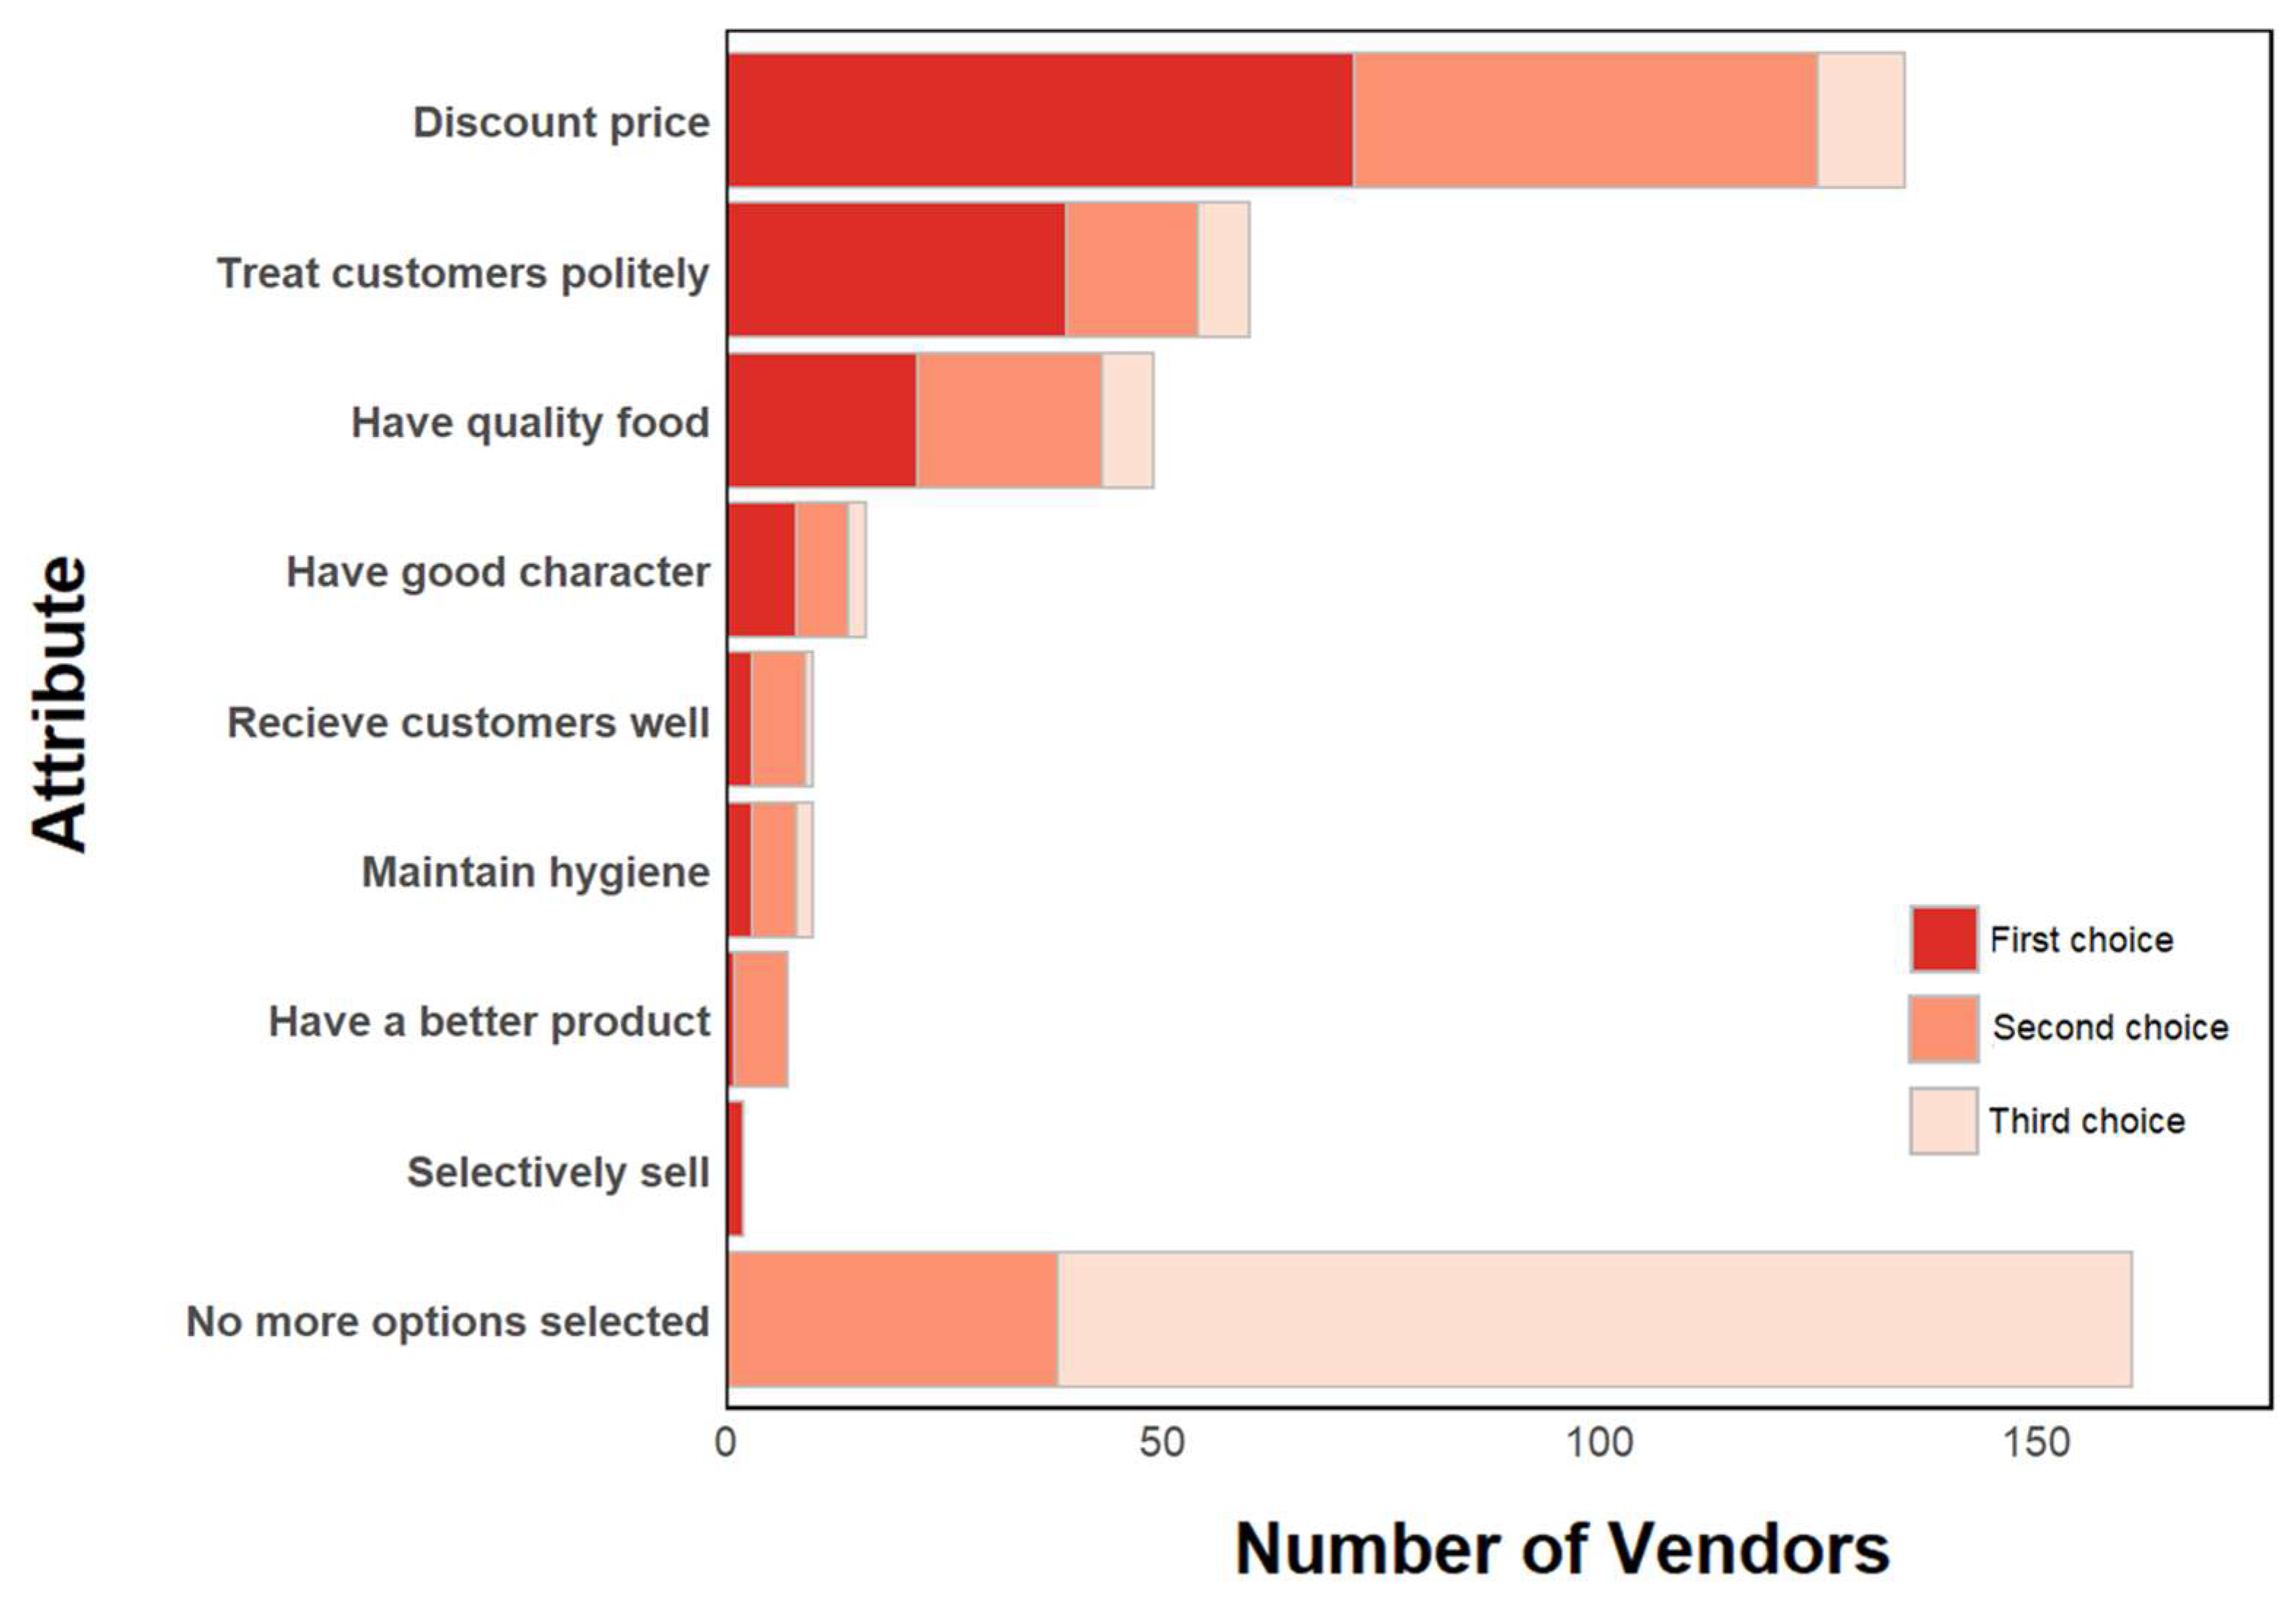
Figure 7.
Vendors perception of customer complaints.
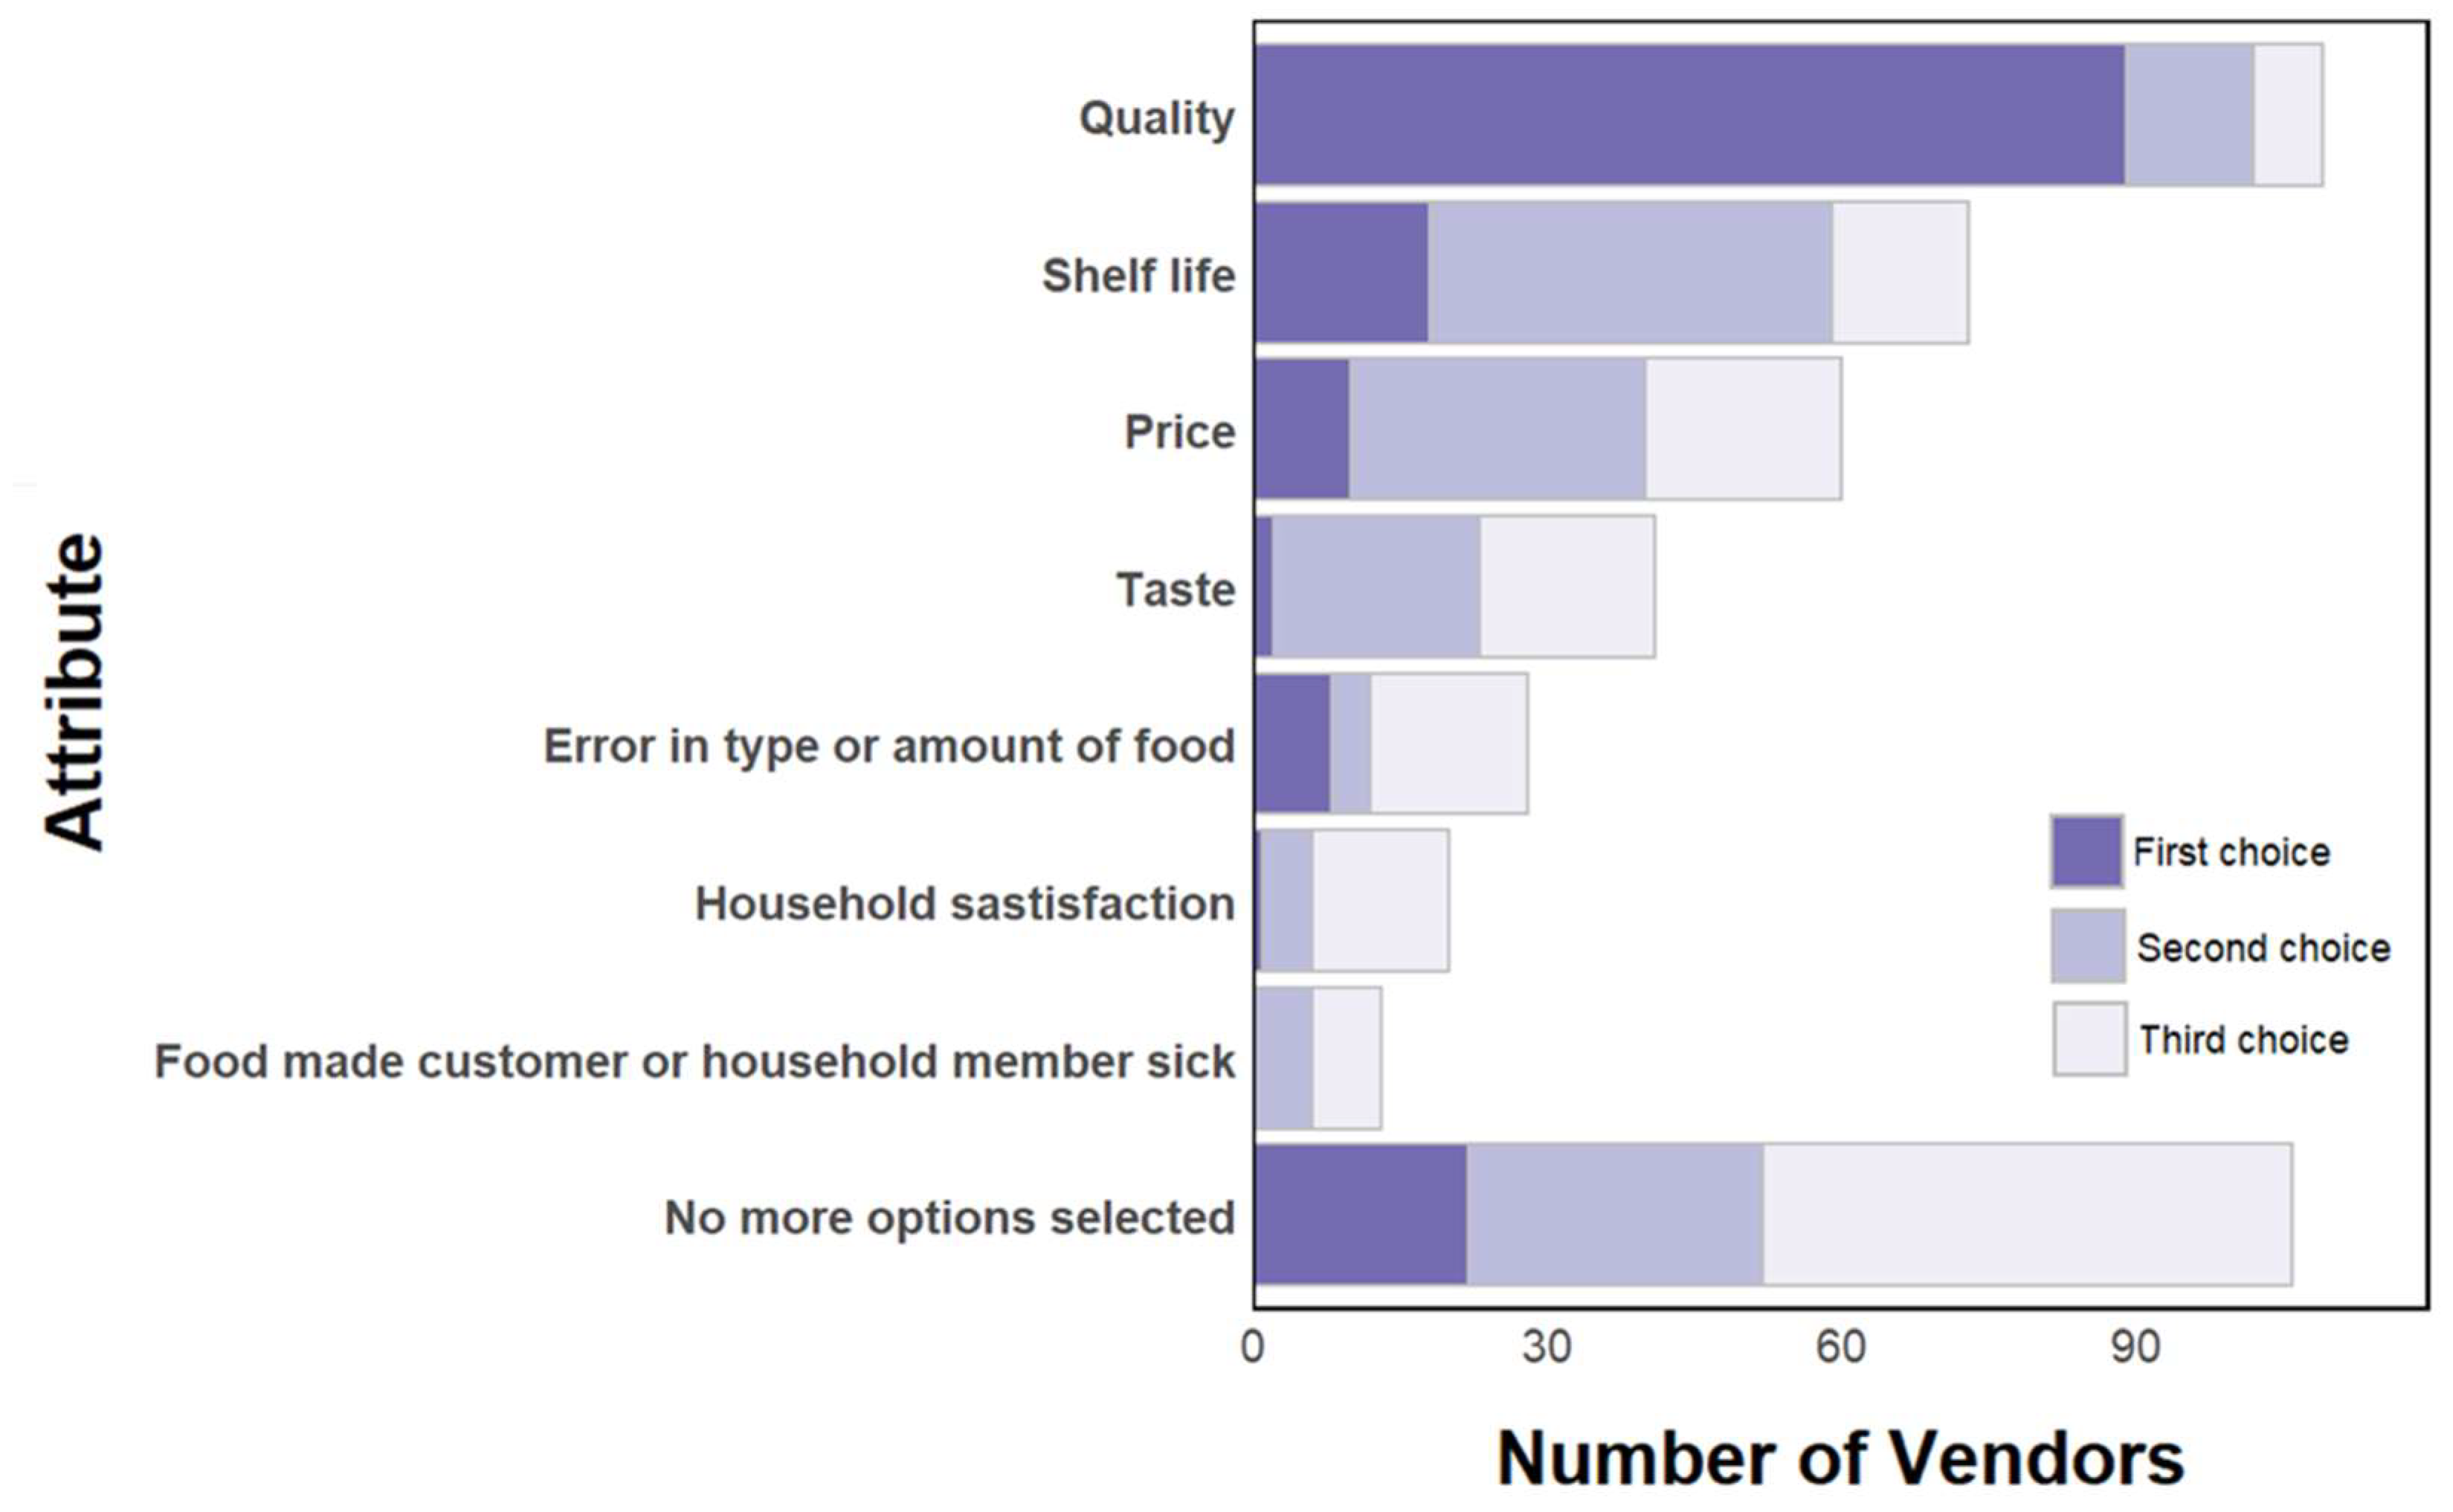
Figure 8.
Actions vegetable vendors take with unsold food.
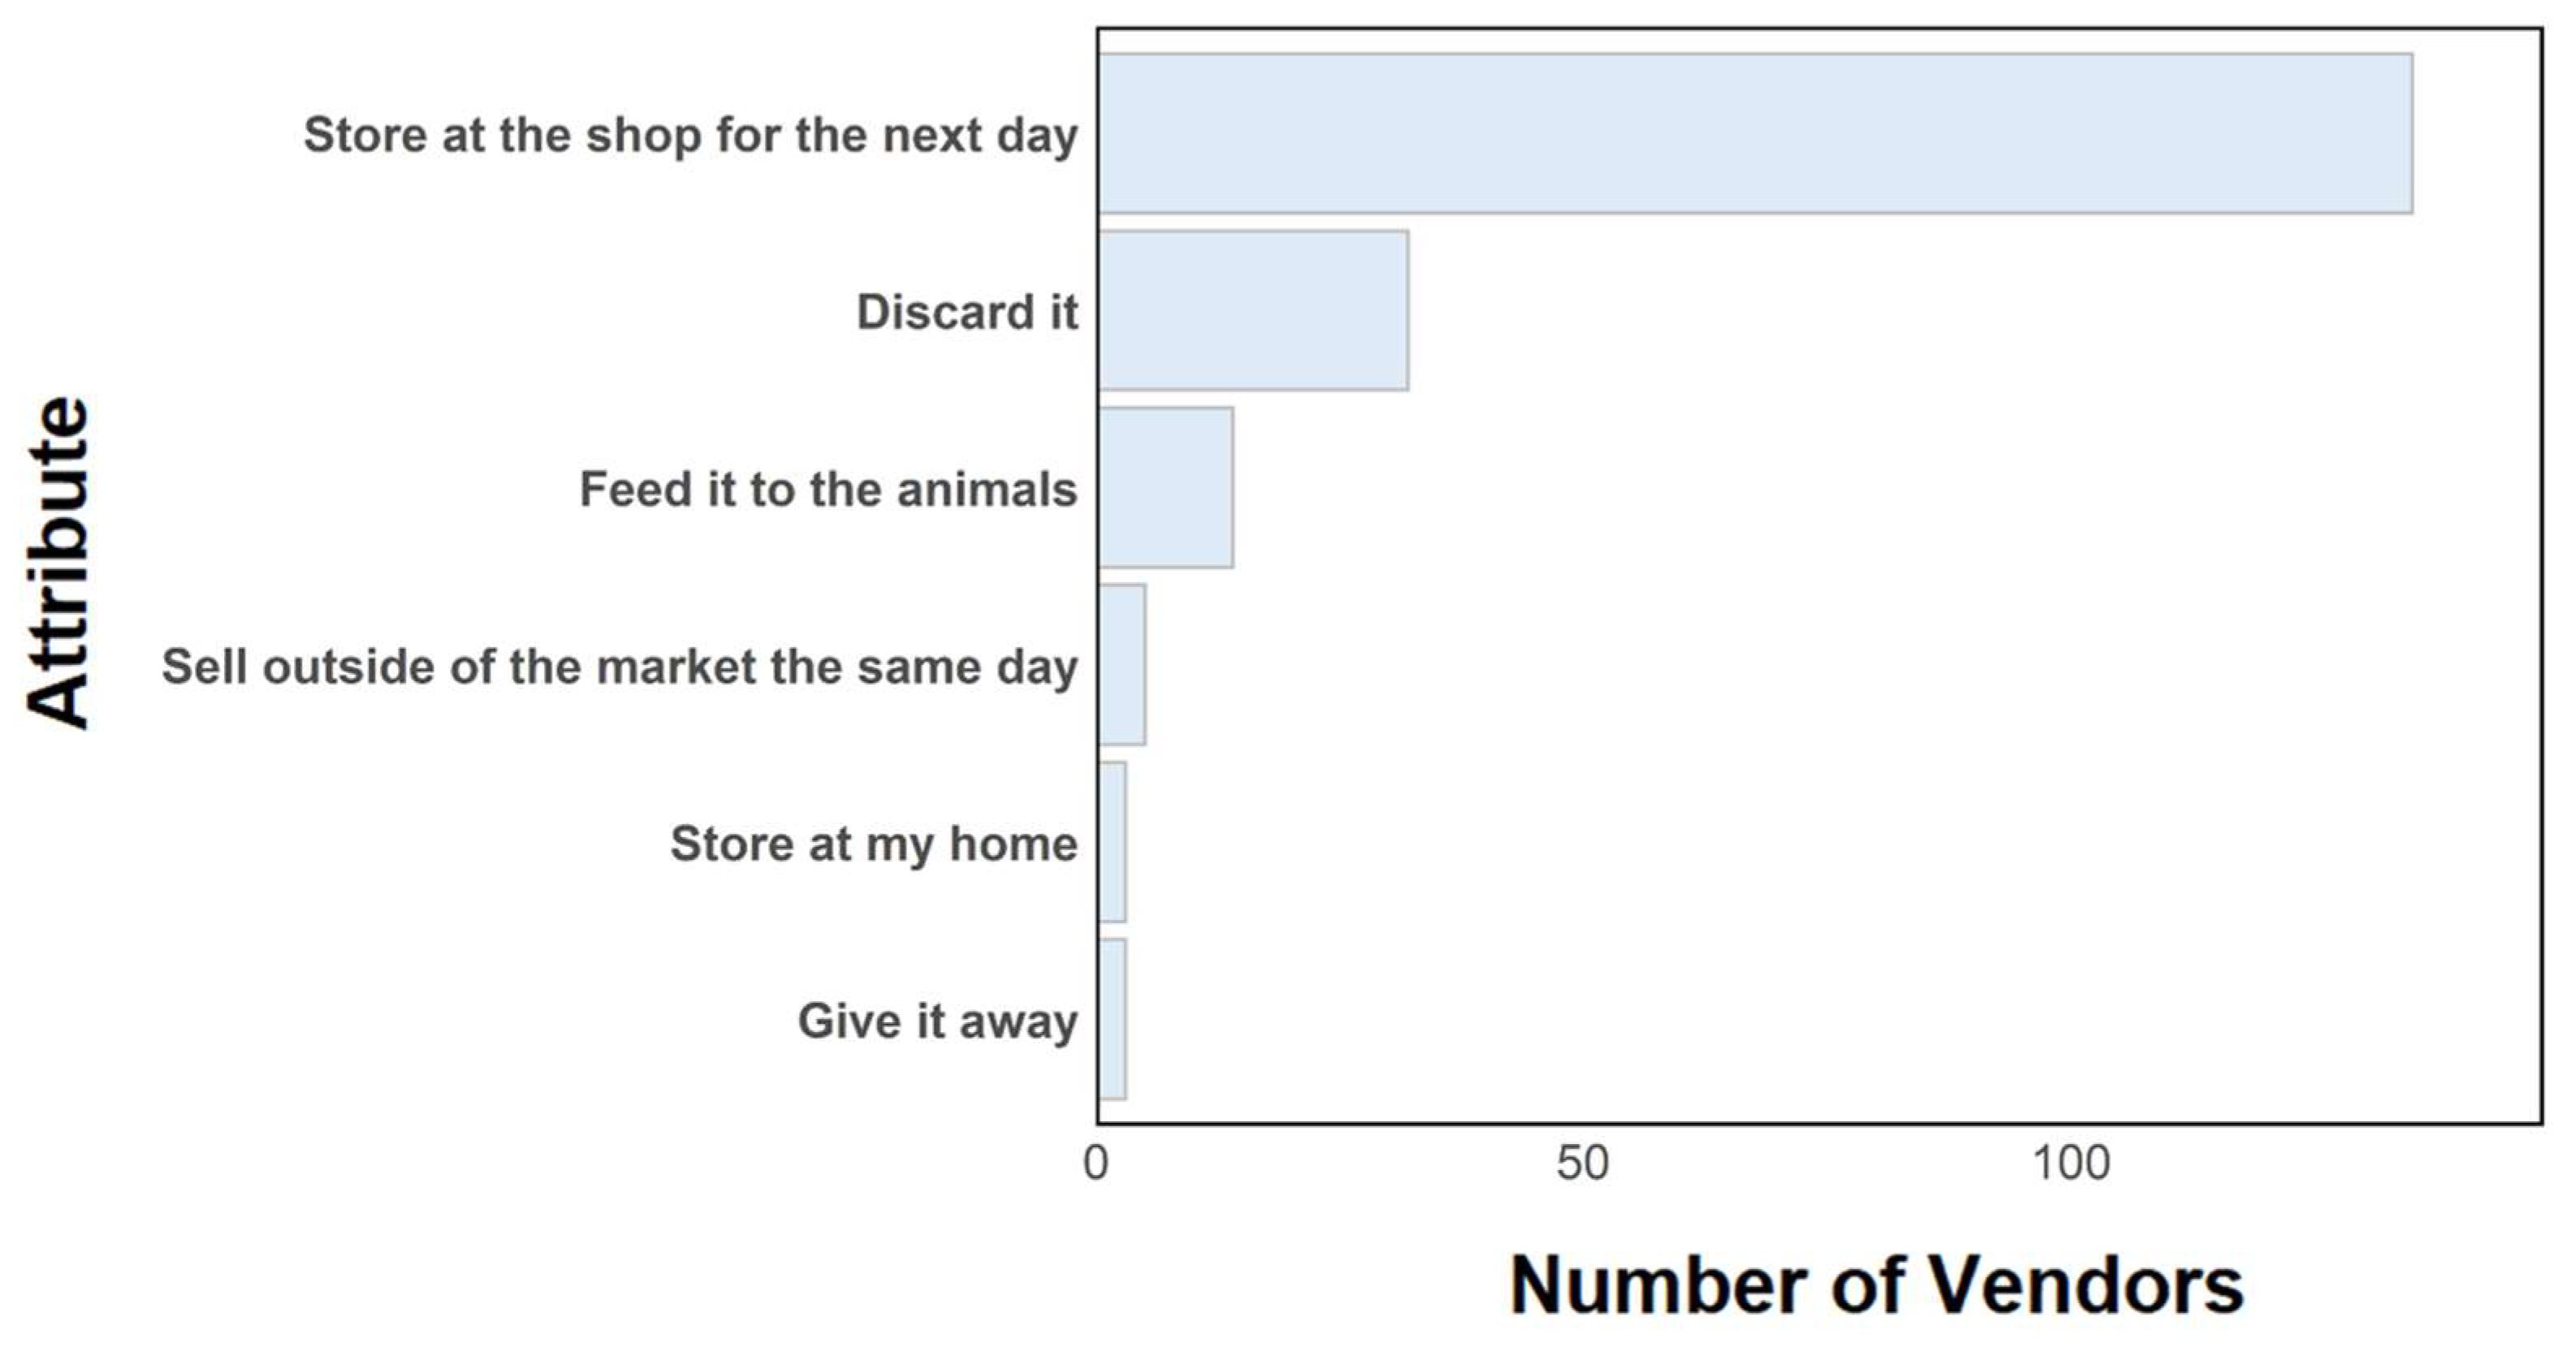

Table 1.
Consumer and Vendor Demographics.
| Characteristic | Category | Demographics | |
|
Vendors (N=150) |
Consumers (N=150) |
||
| Mean (SD) | Mean (SD) | ||
| Number of household residents | 5.1 (2) | 4.7 (2.1) | |
| Number of household residents <5 years of age | 0.6 (0.8) | 0.5 (0.7) | |
| Age (years) | 30.5 (11) | 32 (10) | |
| N (%) | N (%) | ||
| Sex | Men | 22 (15 %) | 52 (35 %) |
| Women | 128 (85 %) | 98 (65 %) | |
| Marital Status | Married | 109 (73 %) | 94 (63 %) |
| Not married | 32 (21 %) | 47 (31 %) | |
| Education1 | Divorced | 3 (2 %) | 4 (3 %) |
| Widowed | 6 (4 %) | 5 (3 %) | |
| Primary (0 - 4th Grade) | 32 (21 %) | 12 (8 %) | |
| Secondary (5th Grade - 12th grade) | 94 (63 %) | 78 (52 %) | |
| Post-secondary | 5 (3 %) | 44 (29 %) | |
| Post-secondary (tvet)2 | 4 (3 %) | 9 (6 %) | |
| Never attended school (illiterate) | 12 (8 %) | 3 (2 %) | |
| Language3 | Amharic | 87 (58 %) | 118 (79 %) |
| Sidama | 6 (4 %) | 12 (8 %) | |
| Wolayita | 55 (37 %) | 16 (11 %) | |
1 Note: Seven respondents are excluded from the table and described here instead. Two respondents (N=1 each consumer and vendor) indicated they only had kindergarten, nursery, or pre-school education. One consumer indicated they had informal education (i.e., they can read and write but have never attended any school). Four respondents (N=2 each consumer and vendors) had non-regular education (e.g., adult literacy program, satellite schooling, or religious education). 2 TVET refers to technical and vocational education and training. 3 Six respondents’ primary language were Kenbatigna (N=1 each consumer and vendor), Guragegna (N=1 each consumer and vendor), Oromifa (N=1 consumer), and sign language (N=1 consumer).
Table 2.
Consumers’ purchasing behaviors.
| Responses | Responses, by Gender | |||
| Foods1 | N | % 1 |
Men N (%) 2 |
Women N (%) 2 |
| Tomatoes | 139 | 93% | 49 (35%) | 90 (65%) |
| Leafy greens | 126 | 84% | 38 (30%) | 88 (70%) |
| Roots/tubers | 80 | 53% | 26 (33%) | 54 (68%) |
| Legumes | 66 | 44% | 19 (29%) | 47 (71%) |
| Eggs | 25 | 17% | 7 (28%) | 18 (72%) |
| Poultry | 21 | 14% | 6 (29%) | 15 (71%) |
| Grains | 17 | 11% | 1 (6%) | 16 (94%) |
| Milk or Dairy Products | 9 | 6% | 0 (0%) | 9 (6%) |
1 Fish was not purchased at the market by any of the individuals surveyed as there is a separate fish market in the city. Total percentages reflect the full sample size (N=150). 2 Percentages by gender reflect the sample (N) per commodity, which varied, as respondents could skip questions or provide multiple answers per question.
Table 3.
Consumer perceptions related to food safety.
| Perception | Agreement | ||||
| Strongly Disagree | Disagree | Neither | Agree | Strongly Agree | |
| People get sick from eating kale | 19% | 55% | 10% | 15% | 1% |
| People get sick from eating lettuce | 15% | 61% | 11% | 13% | 1% |
| People get sick from eating tomatoes | 15% | 47% | 13% | 23% | 2% |
| Food safety differs between vendors | 3% | 10% | 11% | 65% | 10% |
| Trust that vendors sell safe food | 3% | 15% | 10% | 63% | 9% |
| Prefer to buy from vendors that have a food safety certification or license (if available) | 6% | 28% | 5% | 49% | 13% |
Table 4.
Consumers’ trusted sources of information on food safety.
| Media | Responses | Responses, by Gender | ||
| N | % 1 | Men, N (%) 2 | Women, N (%) 2 | |
| Medical professional (doctor/nurse) | 100 | 67% | 34 (34%) | 66 (66%) |
| Friends or family | 94 | 63% | 35 (37%) | 59 (63%) |
| Food packaging / labels | 71 | 47% | 27 (38%) | 44 (62%) |
| Experts on radio or TV | 50 | 33% | 22 (44%) | 28 (56%) |
| Internet / social media | 44 | 29% | 16 (36%) | 28 (64%) |
| Journalists (newspaper) / show hosts (TV/radio) | 24 | 16% | 12 (50%) | 12 (50%) |
| Local religious leader | 15 | 10% | 6 (40%) | 9 (60%) |
| A famous person you like | 9 | 6% | 6 (67%) | 3 (33%) |
| Government agencies | 4 | 3% | 1 (25%) | 3 (75%) |
1 Total percentages reflect the full sample size (N=150). 2 Percentages by gender reflect the sample (N) per commodity, which varied, as respondents could skip questions or provide multiple answers per question.
Table 5.
Vendor choices of supplier related to food safety (N=150).
| Perception | Agreement | ||||
| Strongly Disagree | Disagree | Neither | Agree | Strongly Agree | |
| Can find suppliers that sell high quality foods | 2% | 4% | 3% | 66% | 25% |
| Knowing how to choose safe foods | 1% | 1% | 1% | 65% | 33% |
| Will spend a bit more time selecting safer foods | 1% | 3% | 4% | 62% | 31% |
| Will spend a bit more money selecting safer foods | 0% | 2% | 3% | 62% | 33% |
Table 6.
Vendor satisfaction with different aspects of operations in their shop (N=150).
| Perception | Agreement | ||||
| Strongly Disagree | Disagree | Neither1 | Agree | Strongly Agree | |
| Proud of the quality of the food sold | 2% | 1% | 1% | 58% | 39% |
| Satisfied with shop operations | 3% | 10% | 8% | 52% | 27% |
| Rules for preserving food quality/safety exist | 15% | 21% | 10% | 45% | 9% |
| Rules for keeping the shop clean exist | 14% | 23% | 7% | 45% | 11% |
| It is sometimes difficult to keep the shop clean | 13% | 35% | 3% | 39% | 11% |
1 “Neither agree nor disagree” was the middle category in the agreement scale.
Disclaimer/Publisher’s Note: The statements, opinions and data contained in all publications are solely those of the individual author(s) and contributor(s) and not of MDPI and/or the editor(s). MDPI and/or the editor(s) disclaim responsibility for any injury to people or property resulting from any ideas, methods, instructions or products referred to in the content. |
© 2025 by the authors. Licensee MDPI, Basel, Switzerland. This article is an open access article distributed under the terms and conditions of the Creative Commons Attribution (CC BY) license (http://creativecommons.org/licenses/by/4.0/).
Copyright: This open access article is published under a Creative Commons CC BY 4.0 license, which permit the free download, distribution, and reuse, provided that the author and preprint are cited in any reuse.


