
Submitted:
25 April 2025
Posted:
28 April 2025
You are already at the latest version
Abstract
This paper describes the modelling of key health indicators of frail individuals through non-invasive sensors located in their environment and wearable devices. First, the primary care personnel present the following key health indicators to monitor based on daily activity: correct sleep patterns, excretion control, physical mobility, and caregiver social interaction. Next, a minimally invasive and low-cost sensing architecture is described, which collects indoor localisation and physical activity metrics from wearables and environmental sensors at home. The health outcomes are modelled using knowledge graphs that allow the description of control variables and their relationship with data streams through indicators. Fuzzy logic enables the description of these indicators using temporal terms defined by health professionals linguistically. The results include a case study deployed in a real-world environment, which showcases activity pattern data modelled by knowledge graphs and fuzzy logic in a highly interpretable way.
Keywords:
fuzzy temporal logic
; knowledge graph
; health indicators
; frail individuals
1. Introduction
The burgeoning field of ambient assisted living, driven by the proliferation of non-invasive sensors and wearable devices [1], offers unprecedented opportunities to improve the quality of life of vulnerable populations, particularly frail individuals [2]. These technologies enable continuous monitoring of health parameters, facilitating early detection of potential issues, and promoting proactive care [3]. However, the sheer volume of data generated by these sensor systems requires sophisticated processing techniques to extract meaningful insights, as highlighted by recent surveys; translating raw sensor data into clinically relevant information remains a significant challenge [4,5]. This challenge is further compounded by the need for robust models and knowledge representation structures to enable effective information processing and generate richer higher-level information from sensors [6].
Effective representation of human activities through semantic models, as extensively explored in previous works [7,8,9], forms a cornerstone to achieve nuanced contextual understanding within ambient assisted living (AAL) environments. This semantic layer allows systems not only to recognise discrete actions, but also to infer higher-level goals, intentions, and complex behavioural patterns over time, which is crucial for providing genuinely personalised and proactive support rather than merely reactive alerts. However, translating these semantic insights into practical AAL systems faces significant hurdles. A major one is the development of a truly generic user model, one that is adaptable to various individuals with varying routines, preferences, and health statuses, but sophisticated enough to effectively integrate continuous behavioural modelling and real-time monitoring. Achieving this generality while maintaining personalization remains a significant research challenge, as models must capture both common human behavioural structures and individual idiosyncrasies.
Furthermore, the need for precise, clinically validated definitions of health indicators introduces another layer of complexity [10]. Simply monitoring activity levels is insufficient for the supervision of health professionals, which requires the need to provide explanations [11]; translating raw sensor data or recognised activities into meaningful metrics related to well-being, functional capacity, risk assessment, or progression of specific conditions requires robust definitions grounded in professional clinical expertise [12,13]. Without such rigorous definitions, the indicators derived may lack clinical relevance or, worse, lead to misinterpretations of a user’s health status. Although data-driven methods, particularly machine learning, offer powerful tools for pattern recognition and prediction within AAL, they have substantial limitations [14]. The requirement for large, meticulously labelled datasets for training supervised models incurs significant financial and logistical costs. Data acquisition and annotation are resource intensive, particularly in fragile home environments or clinical settings involving vulnerable individuals [15].
Beyond cost implications, many state-of-the-art data-driven approaches often culminate in ’black-box’ models [16,17]. Their internal workings can be opaque, making it difficult to understand why a particular prediction or classification (e.g., identifying a specific behaviour or health alert) was made [16]. This inherent lack of transparency and interpretability poses a critical barrier to adoption in healthcare, where trust, accountability, and the ability of healthcare personnel to validate, override, or understand the reasoning of the system are paramount for effective control and intervention [18]. Related specifically to the integration challenges mentioned above regarding the semantic representation of activities [8,9], the difficulty in creating robust Generic User Models is further compounded by the practical challenge of ensuring that behavioural modelling and monitoring algorithms consistently and accurately utilise the dynamic input generated by the user model itself, closing the loop between semantic understanding and actionable monitoring [19].
This paper proposes a novel knowledge-based approach to modelling Key Health Indicators [20] for frail individuals by generating linguistic descriptions of relevant information obtained from non-invasive environmental sensors and wearable devices [21]. Specifically, we focus on modelling key health indicators defined by primary care professionals: correct sleep patterns, excretion control, physical mobility, and caregiver social interaction. Utilising Fuzzy Logic (FL) [22] and Knowledge Graphs (KG)[23], we aim to bridge the gap between raw sensor data and clinically actionable knowledge. To address knowledge representation requirements, we use KG, which represent the relationships between linguistic protoforms [5,24] and data streams through linguistically defined indicators [25]. Using the collection and fuzzy processing of sensor data from minimally invasive sensors and wearables, we derive metrics related to home location and physical activity [26]. These metrics are then used to construct Knowledge Graphs, which represent the relationships between control variables and data streams through linguistically defined indicators. In line with the emphasis of the National Institutes of Health on personalised care [27], we develop a system capable of generating interpretable summaries of these key health indicators. This presents an architecture that automatically synchronises with sensor data and provides a user-friendly visualisation for retrieving daily summaries of key health indicators. By means of a case study in real environments, we show how indicators can be used to identify patterns and evaluate user behaviour, potentially leading to the early detection of health deterioration.
The remainder of this paper is organised as follows. Section 2 details the Knowledge Graph and the fuzzy logic model used to generate linguistic summaries of the key indicators of health. Section 3 describes the sensor system and data acquisition process with a real-world case study that illustrates the system’s performance. Finally, Section 4 concludes the paper with a summary of the findings and future directions.
2. Materials and Methods
This section details the methodology employed to model key health indicators of frail individuals using non-invasive sensors and knowledge graphs. We aim to translate raw sensor data into clinically meaningful insights through a knowledge-based approach that encompasses knowledge graph representation, sensor architecture, and fuzzy logic modelling. The following subsections elaborate on each of these components.
- Knowledge Graph Model of Health Indicators: We construct hierarchical knowledge graphs to model critical health indicators: sleep patterns, excretion control 1, physical mobility, and social interaction. These graphs represent indicators as nodes, with edges that define relationships with control variables derived from sensor data. This structured approach allows us to integrate clinical knowledge with quantitative data, providing a comprehensive view of health status.
- Sensor Architecture for Data Acquisition: A minimally invasive sensing architecture is implemented, combining wearable devices and ambient sensors. Wearable devices track physical activity and sleep, while ambient sensors provide indoor localisation and activity data. This integration ensures a holistic view of daily activity patterns, prioritising user comfort and long-term adherence.
- Fuzzy Logic modelling of Linguistic Protoforms: Fuzzy logic bridges the gap between sensor data and clinical language. Temporal and linguistic terms used by healthcare professionals are modelled using membership functions, enabling the system to reason with imprecise and subjective information. This approach ensures that the system’s output is clinically relevant and interpretable.
2.1. Knowledge Graph Representation of Key Health Indicators
This subsection details the application of Knowledge Graphs as a linguistic model representation for key health indicators. We take advantage of the inherent flexibility of KGs to capture and reason with the inherent vagueness and uncertainty associated with health data.
In this context, a Knowledge Graph is formally defined as a directed, labelled graph , where:
- V is a set of nodes (vertices) that represent entities or concepts related to health indicators. These entities are not merely static data points but are imbued with linguistic meaning, facilitating human-like reasoning.
- E is a set of edges that represent the relationships between these entities. Each edge is an ordered pair where .
- L is a set of labels associated with both the nodes and edges, providing semantic context.
The KG represents the semantic structure of health information, enabling the integration of diverse data sources and the representation of complex relationships. Under this approach, nodes/entities within the KG are inherently linked to linguistic protoforms. These protoforms, as abstract linguistic templates that compose semantic structures, enable the representation of health indicators in a way that aligns with natural language understanding. Specifically:
- Each node/entity is associated with a protoform that captures its underlying semantic structure.
-
These protoforms are instantiated with specific values derived from:
- −
- Terms: Linguistic variables representing ranges or categories of health indicators (e.g. "active mobility", "adequate sleep time").
- −
- Temporal Restrictions: Time-based constraints or patterns associated with health indicators (e.g., low physical activity "while daytime").
- −
- Location Restrictions: Location-based constraints or patterns associated with user activity (e.g., sleep activity levels "in the living room").
- −
- Quantifiers: Linguistic terms represent relative or absolute quantities, allowing the manipulation of linguistic concepts. They can be modelled under crisp or fuzzy approaches (e.g., "adequate number of excretions", "most of sleeping time").
- −
- Sensors: Data collected from ambient and wearable devices or other sensing technologies, providing quantitative measurements (e.g. "steps", "deep sleep", "presence in livingroom").
- This connection to protoforms allows the KG to reason with the semantic meaning of health data, not just its numerical values.
Also, the relationships (edges) connecting nodes in the KG can be aggregated using fuzzy logic operators, specifically t-norms and co-norms. This approach acknowledges the inherent uncertainty and vagueness in health data.
- Relationships between nodes are assigned degrees of membership, reflecting the strength or certainty of the connection.
- Fuzzy norms. T-norms and Co-norms (e.g., minimum, product) are used to represent conjunctive and disjunctive relationships, respectively.
- By applying these operators, the KG can perform fuzzy inference, combining evidence from multiple relationships to derive conclusions about health indicators. This allows for a more robust and flexible representation of complex health patterns.
In summary, this subsection demonstrates how a knowledge graph, coupled with linguistic protoforms and fuzzy logic operators, provides a powerful framework for representing and reasoning with key health indicators.
2.2. Sensor Architecture for Data Acquisition
To collect relevant health-related metrics in a non-intrusive and privacy-preserving manner, we designed a heterogeneous sensor architecture that integrates environmental and wearable sensors. The main goal is to sense indoor location and activity data with minimal disruption to users’ daily routines while preserving contextual integrity and ensuring data confidentiality. Indoor localisation is achieved primarily using Ultra-Wideband (UWB) sensors. These sensors are deployed throughout the living environment in strategically selected locations. The architecture follows a two-way ranging protocol, where fixed anchors act as responders, and user-worn tags function as initiators. In this configuration, the responder nodes periodically send polling requests, and the initiators reply, allowing accurate calculation of distances via time-of-flight. To measure the social proximity between the caregiver and the patient, the tag worn by the caregiver is configured in dual-role mode, allowing it to operate both as an initiator and a responder. In addition to the localisation system, the environment is equipped with motion sensors and light sensors. These sensors are installed in areas of low or no natural light, such as bathrooms or aisles, offering a redundant presence detection mechanism. The presence of motion and light changes in such spaces provides greater confidence in the inference of room occupancy, thus improving the robustness of activity monitoring. In addition, a smartwatch continuously records the heart rate, step count, and sleep quality parameters of the patient. This wearable device contributes fine-grained temporal data on physiological and mobility-related variables.
All sensors are connected to a fog processing node that collects data periodically and stores them locally, ensuring that the raw data remain within the domestic environment. This first local strategy respects privacy concerns and aligns with ethical standards for data protection in health-related contexts. Only aggregated or pre-processed data is later transmitted to higher-level components for semantic modelling using KG and fuzzy logic. The complete architecture is illustrated in Figure 1, showing the integration of UWB tags, environmental sensors, and smartwatches, along with their data flow to the edge processing unit.
This modular and privacy-conscious system ensures minimally invasive monitoring of daily activities and health-related indicators in frail individuals living in assisted environments. The data acquired through this sensing infrastructure serves as the basis for generating fuzzy linguistic representations of health indicators, discussed in the next section.
2.3. Fuzzy Logic Modelling of Linguistic Protoforms for Sensor Data
In this section, we describe the methodology by which sensor data are transformed into linguistic protoforms for entity representation in the KG. This section subsequently elaborates on the formal definition of sensor streams and the applied fuzzy-linguistic approach. A sensor stream , originating from the sensor s, is represented as a sequence of measurements . Each measurement corresponds to a time stamp , within the observation interval , where denotes a time step.
Using a fuzzy linguistic approach, as detailed in [29], we transform the sensor data stream into a linguistically interpretable representation by associating fuzzy terms v with sensor measurements. The membership function quantifies the degree of membership for each measurement relative to the term v. Consequently, given the sensor stream and a set of linguistic terms v, a fuzzy data stream is generated. We propose a set of spatio-temporal protoforms for modelling linguistic templates characterised by the following structure:
where Q, V, and T are placeholders for linguistic terms that serve as identifiers:
- V designates the fuzzy data stream derived from sensor or location sources.
- T, an optional element, specifies a Fuzzy Temporal Window (FTW) , within which the fuzzy data streams are aggregated, represented as . The projection of a fuzzy temporal window T with a fuzzy data stream is achieved through a membership function associated with the FTW, which is derived from the temporal displacement , where , measuring the interval from a present time to the preceding timestamps within the data stream. For every timestamp , we compute the combined membership degrees of the terms, considering the fuzzy temporal influence, utilizing t-norm and co-norm operations:where the choice of t-conorms (max-min, weighted average = ) is determined by the specific semantic context. In Figure 2, we describe the projection of an FTW with a fuzzy data stream.
- L, also optional, acts as a location filter to compute the spatial interaction in the environment [21].
- Q, also optional, acts as a quantifier to filter and modulate the degree of aggregation of .
Thus, a protoform produces a new fuzzy data stream, where the degree of membership for each timestamp reflects the temporal relevance of the source data stream within the defined temporal window, adjusted by the fuzzy quantifier and the location of the user. Therefore, we observe that the evaluation of terms and indicators within KG entities occurs continuously over time. Next, we employ fuzzy inference rules to dynamically construct and refine the edges within a Knowledge Graph (KG). These rules are crucial for aggregating and interpreting relationships between KG entities by combining fuzzy linguistic protoforms, thereby enabling the creation of novel semantically rich connections. In this framework, an inferred protoform is generated based on the relationships between connected protoforms and the edges that link them. This inference process is expressed using the rule structure to compute the degree of the protoform :
In Figure 2, we detail how the antecedent describes the relationships between the existing protoforms and their connecting edges, while the consequent generates the inferred protoform . Crucially, the aggregation process within the antecedent leverages user-defined fuzzy t-conorms (max, min, dot, or other custom operators) that are tailored to the specific semantic context of each relationship, allowing for flexible and nuanced interpretations of the input data. So, inferred protoforms are derived from the aggregation of lower-level information, such as sensor stream data, and are used to represent higher-level abstractions, such as key health indicators.
3. Case Study
To validate the proposed sensing architecture and the knowledge-based approach for modelling health indicators, a real-world deployment was carried out at the home of a 95-year-old individual residing in the city of Granada, Spain. The participant was referred through the Health Center of La Caleta in Granada, part of the Andalusian Health Service. Informed consent was obtained from both the patient and the primary caregiver before data collection, following ethical and privacy protocols. The individual presents significant mobility limitations, which require the use of a walker, but retains the ability to move independently within the home. Formal care is provided throughout the day, including nighttime hours, with a professional caregiver during the day and an informal caregiver at night. The resident does not prepare meals and spends most of the day in the living room, occasionally moving to the bedroom and bathroom. Other rooms, such as the kitchen or secondary spaces, are rarely visited. The living environment is approximately 90 square metres and has been adapted to facilitate indoor movement and daily routines. Figure 3 shows the home floor plan, indicating the position of the different types of sensors and providing views of the real environment.
3.1. Real-Home Deployment
The sensor deployment was conducted in the participant’s home, covering key areas of activity. A total of six UWB tags (©Estimote) were installed to allow accurate indoor localisation. These were distributed as follows: two in the living room, two in the bedroom, one in the hallway, and one in the bathroom. Two wearable UWB tags were used: one assigned to the patient (configured as initiator) and one to the caregiver (configured in dual role mode, supporting both initiator and responder functionalities) (see Figure 4A).
To complement the localisation data, additional sensors were installed:
- A motion sensor and a flush sensor (both Aqara) in the bathroom, providing cross-validation for presence and flush detection (see Figure 4B).
- A smart plug to monitor energy consumption (TP-Link) in the bedroom lamp (see Figure 4C). Another smart plug in the living room to monitor the use of the TV.
- The patient wore a smart watch (Amazfit Bip U Pro) (see Figure 4D) that collected physiological and activity-related data, including heart rate, step count, and sleep quality, including periods of deep, normal, and light sleep.
All sensors were connected to a local fog processing unit, implemented on a Raspberry Pi 4 Model B+, which collected and pre-processed heterogeneous data streams. This unit ensured temporal synchronisation, data harmonisation, and local storage, forming a secure and efficient bridge to the higher-level semantic modelling components.
3.2. Fuzzy Inference in KG for Sleep Pattern Evaluation
This section introduces the fuzzy inference model developed to assess the quality of sleep patterns in frail individuals based on sensor-derived signals. The model combines behavioural, spatial, and temporal indicators within a hierarchical fuzzy decision framework that encodes domain knowledge into interpretable health indicators. As illustrated in Figure 5, the conceptual structure is formalised as a fuzzy knowledge graph, allowing inference of uncertain and noisy sleep behaviours in real-world contexts.
Input Data Sources
The model processes a set of raw data streams obtained from two main sources: a wearable smartwatch and an in-home UWB positioning system. The smartwatch records the annotations of the sleep stage minute by minute, providing categorical labels that distinguish between light sleep, normal sleep, and deep sleep. These discrete stages are used to generate continuous fuzzy signals that reflect the quality and depth of sleep over time. In parallel, spatial context is inferred through the UWB-based localisation system, which estimates user position by computing distances between a wearable tag and fixed anchors deployed in the home. A binary categorical stream is generated from these data, indicating whether the individual is located in the bedroom at each minute (1) or not (0). This spatial stream is aligned with the sleep annotations to capture whether the recorded sleep activity occurs in the appropriate environment.
Knowledge Graph
Primary care healthcare professionals defined the KG to formalise key indicators of health. In this section, we detail the dimension of the correct sleep pattern. This model is represented as a hierarchical fuzzy decision structure that captures the clinical semantics of healthy sleep patterns. It integrates the main aspects identified by the medical team: total duration of sleep, continuity and depth of sleep, location of sleep, and temporal alignment with nighttime hours. The corresponding logic was encoded as a set of fuzzy logic operators and rules that map these conditions to a composite health indicator according to Section 2.1. The structure of this model is illustrated in Figure 5, where each node corresponds to a fuzzy condition or aggregated protoform used in the inference process. The structure is composed of the following subbranches of protoforms:
- +) SA: Adequate sleep time
- SA1: Most of the sleeping at night. Evaluates whether most of the sleeping time occurs during the night window and combines quantity (Q), temporality (T), and value streams (V).
- SA2: Sleeping quantity. Assesses if the total sleep time falls between 6–8 hours per day. Fuzzy weighted by value (V) and time window (T).
- +) SB: Quality of sleep
- SB1: Sleeping is normal or deep. Measures if the majority of sleep is spent in normal or deep stages and uses value (V), quantity (Q), and temporal alignment (T)
- SB2: Sleep in the bedroom Assesses whether sleep occurs predominantly in the bedroom and relies on value (V), localisation (L), and quantity (Q).
The following equations define the fuzzy inference process based on the knowledge graph, combining the input data streams to evaluate the adequacy and quality of sleep, producing a composite health indicator for assessing sleep patterns in frail individuals. Please, note that the membership degree of fuzzy terms is described by means of trapezoidal functions [21].
Figure 6 displays the temporal evolution over three consecutive days of four key health indicators derived from the fuzzy inference system designed to evaluate sleep patterns. The plot illustrates three intermediate indicators—Most sleep night per day (SA1: evaluate the dominance of sleep at night), adequate sleep time (SA2: assessing 6-8h duration), and Bedroom sleep per day (SB2: assessing sleep location) — in addition to the final composite indicator correct sleep pattern (SAB: combining adequacy and quality of sleep time), highlighted by the shaded area.
Clear sleep-wake cycles are evident. A possible daytime sleep period on day 1 probably involved naps outside the bedroom (for example, sofa), indicated by low most sleep nights per day and variable bedroom sleep per day despite increasing correct sleep and adequate sleep time. In contrast, the first two nights show concurrent high values across all metrics, representing consolidated, highly rated "correct" sleep occurring at night, for adequate duration, and primarily within the bedroom. The third night differs significantly; while the sleep timing was appropriate (highest sleep nights per day), the overall correct sleep indicator remained low. This coincides with reduced adequate sleep time and lower or more variable bedroom sleep per day (suggesting periods of sleep outside the bedroom), indicating that insufficient duration and potential non-bedroom sleep contributed to this night’s poor overall rating. The graph thus reveals variability in the assessed sleep quality and location over the three nights, with the third night being less optimal.
3.3. Fuzzy Inference in KG for Excretion Control
This section presents the fuzzy inference model used to assess the regularity and appropriateness of excretion routines. The structure, shown in Figure 7, combines semantic reasoning and fuzzy logic to model behavioural expectations regarding toileting habits in older adults, with a focus on daytime and nighttime patterns.
Input Data Sources
The inference model receives as input a set of raw data streams collected from ambient sensors installed in the bathroom environment. These include a binary signal indicating toilet flush activation, a motion-based presence signal detecting user activity in the space, and a categorical localisation stream that identifies whether the individual is located within the toilet area at each time point. This spatial signal is derived from proximity to the UWB anchors and encoded as a binary value: 1 if the user is detected in the toilet area, and 0 otherwise. These three data streams are fused to form a composite fuzzy data stream, which represents the inferred occurrence of a toileting event within a bounded temporal window based on flush, motion, and location.
Knowledge Graph
The KG was developed in collaboration with healthcare professionals to reflect realistic excretion routines to assess whether the individual demonstrates healthy excretion control patterns. The hierarchical fuzzy structure integrates frequency, timing, and spatial-temporal alignment of behaviour and produces a composite health indicator. The structure consists of:
- +) SA: Daily excretions
- Captures regularity and frequency of bathroom visits throughout the day aggregating value (V) and time-based frequency (T) over the full day.
- Defined as healthy when the total number of inferred excretion episodes is between 3 and 5 per day.
- +) SB: Night excretions
- Evaluates bathroom visits during the night calculated using a fuzzy combination of value (V) and temporal indicator (T) restricted to nighttime hours.
- Considered healthy if the number of visits ranges between 0 and 2.
- +) S1: Excretion detection
- Core detection mechanism combining: flush events, presence in the toilet, and localisation in the toilet room.
- Fuzzy temporal aggregation is applied over short intervals (2 to 4 minutes) to infer likely excretion episodes.
- Outputs a time-aligned indicator that feeds into both the SA and SB branches.
The following equations define the fuzzy inference process based on the knowledge graph, combining the input data streams to evaluate the adequacy of excretions producing a composite health indicator for assessing excretion control patterns in frail individuals.
Figure 8 presents the three-day temporal evolution of fuzzy health indicators for excretion control: the adequacy of daytime patterns (SA: wc day adequate), nighttime patterns (SB: wc night adequate), and an overall composite score (SAB: wc adequate, shaded area). The nighttime adequacy indicator remained stable throughout the period, suggesting a consistently appropriate frequency of toilet use during the night (likely 0-2 visits/night). In contrast, daytime adequacy varied significantly. On day 1, the daytime indicator remained at zero, implying an insufficient number of excretion episodes (below the 3-5 target range), resulting in a low overall composite score despite the adequate nighttime pattern. However, on days 2 and 3, the daytime indicator progressively increased to high levels, signifying the achievement of the target frequency. This successful daytime routine consequently drove the overall composite score to high levels of adequacy over the last two days. In summary, the figure suggests consistently healthy nighttime excretion patterns along with a variable daytime frequency, with insufficient daytime episodes observed only on the first day according to the fuzzy evaluation model.
3.4. Fuzzy Inference in KG for Physical Mobility
This section presents the fuzzy inference model used to assess physical inactivity in daily life, focusing on the behavioural patterns associated with sedentary lifestyles. The fuzzy model, shown in Figure 9, integrates data from movement and localisation sensors to evaluate mobility, walking habits, and time spent outside the home. The semantic structure allows for an interpretable and human-understandable evaluation of the behavioural risks associated with disuse.
Input Data Sources
The model receives input from two primary sensor streams: step count data, captured continuously via a wearable device that detects step-based motion using inertial sensors to construct fuzzy indicators of activity volume and walking sessions, and localisation data, provided by the UWB positioning system, which estimates the user’s real-time position within the home by indicating each minute whether the person is outside the home (1) or indoors (0), based on their distance to fixed anchors placed throughout the residence.
Knowledge Graph
KG was developed in conjunction with health professionals to identify clinically relevant signs of physical mobility. KG formalises expectations around mobility and encourages patterns associated with healthy ageing, such as consistent walking and outdoor exposure. The fuzzy inference process aggregates multiple behavioural signals into a single health indicator. The KG structure is composed of the following branches:
- +) SA: Physical activity
- SA1: Active mobility. Assesses whether an adequate number of steps is taken each day and combines quantity (Q), temporality (T), and step count values (V).
- SA2: Walking consecutive. Evaluates whether walking sessions include at least one sustained period of approximately 30 minutes. Derived from continuous step activity patterns, weighted by time (T) and value (V).
- +) SB: Most activity outdoor
- Checks whether most activity occurs outside the home environment. Using location data (L), step values (V), and quantity (Q) to infer whether physical activity occurs predominantly in outdoor settings.
- Considered relevant to prevent the sedentary routines commonly associated with indoor confinement.
- +) SB: Physical mobility
- Aggregates quantity and location using fuzzy temporal indicators. The model balances beneficial closeness with potential overdependence, providing a complete interpretation of daily caregiver engagement.
The following equations define the fuzzy inference process based on the knowledge graph, combining the input data streams to evaluate the adequacy of physical activity, producing a composite health indicator to assess disuse control patterns in frail individuals.
Figure 10 shows the three-day evolution of the physical mobility indicators derived from the fuzzy system, including physical activity (SA), walking per day outdoors (SB) and the final physical mobility indicator (SAB, highlighted). A key observation is the consistently moderate to low level of the SA indicator, suggesting insufficient daily steps or sustained walking throughout the period. Although this baseline activity level limits the maximum achievable use control score (SAB), the daily fluctuations observed in SAB are mainly driven by significant variations in SB. Periods of substantial outdoor activity, particularly evident during the afternoons and evenings of day 2 and day 3, correspond to the highest peaks in overall physical mobility. In contrast, times with limited outdoor activity result in lower overall scores, as seen notably during most of day 1. Therefore, the graph indicates that although the general activity volume restricts the overall score, the degree of outdoor engagement significantly modulates the daily assessment of physical mobility.
3.5. Fuzzy Inference in KG for Adequate Caregiver Interaction
This section describes a fuzzy inference model designed to assess the presence of a caregiver at home, using spatial-temporal proximity data. The model captures the balance between supportive presence and respect for privacy, which are key components of healthy caregiving dynamics. The structure, shown in Figure 11, integrates social distance and location data to evaluate closeness and autonomy in the interaction between caregiver and patient.
This model enables automatic detection of caregiving styles that promote safety and emotional well-being without compromising autonomy, helping to identify imbalanced patterns such as neglect or over-involvement.
Input Data Sources
The model is based on sensor data collected from the UWB localisation system installed throughout the home, which tracks the positions of both the care recipient and the caregiver via wearable tags. This setup provides minute-by-minute location data for the care recipient as a binary stream per room (presence = 1, absence = 0), as well as continuous distance estimates between the two individuals in metres. These distance readings are used to derive social proximity patterns throughout the day. In addition, motion sensor data in each room indicate local activity levels, supporting the detection of active presence and filtering out spurious readings caused by stationary tags.
Knowledge Graph
Informed by discussions with care professionals, the fuzzy KG formalises two key aspects of caregiver presence: emotional closeness and respect for personal boundaries. The model outputs an overall adequacy score based on the following hierarchical indicators.
+) SA: Closeness
- The social distance is tracked and compared against a fuzzy threshold (for example, within 1 to 2 metres for at least 30 minutes/day).
- Includes temporal coverage (T), quantity of interactions (Q), and value assessment (V) of proximity episodes.
- +) SB: Privacy
- Based on the detection of caregiver presence in specific rooms (e.g., bedroom, bathroom) where autonomy is expected.
- Uses spatial location (L) and value (V) indicators to assess appropriateness of room-sharing patterns.
- +) SAB: Presence of caregiver
- Aggregates both positive (company) and negative (dependence) contributions using fuzzy temporal indicators. The model balances beneficial closeness with potential over-dependence, providing a complete interpretation of daily caregiver engagement.
The following equations define the fuzzy inference process based on the knowledge graph, combining the input data streams to evaluate the caregiver’s presence, producing a composite indicator that reflects both beneficial company and the risk of overdependence in frail individuals.
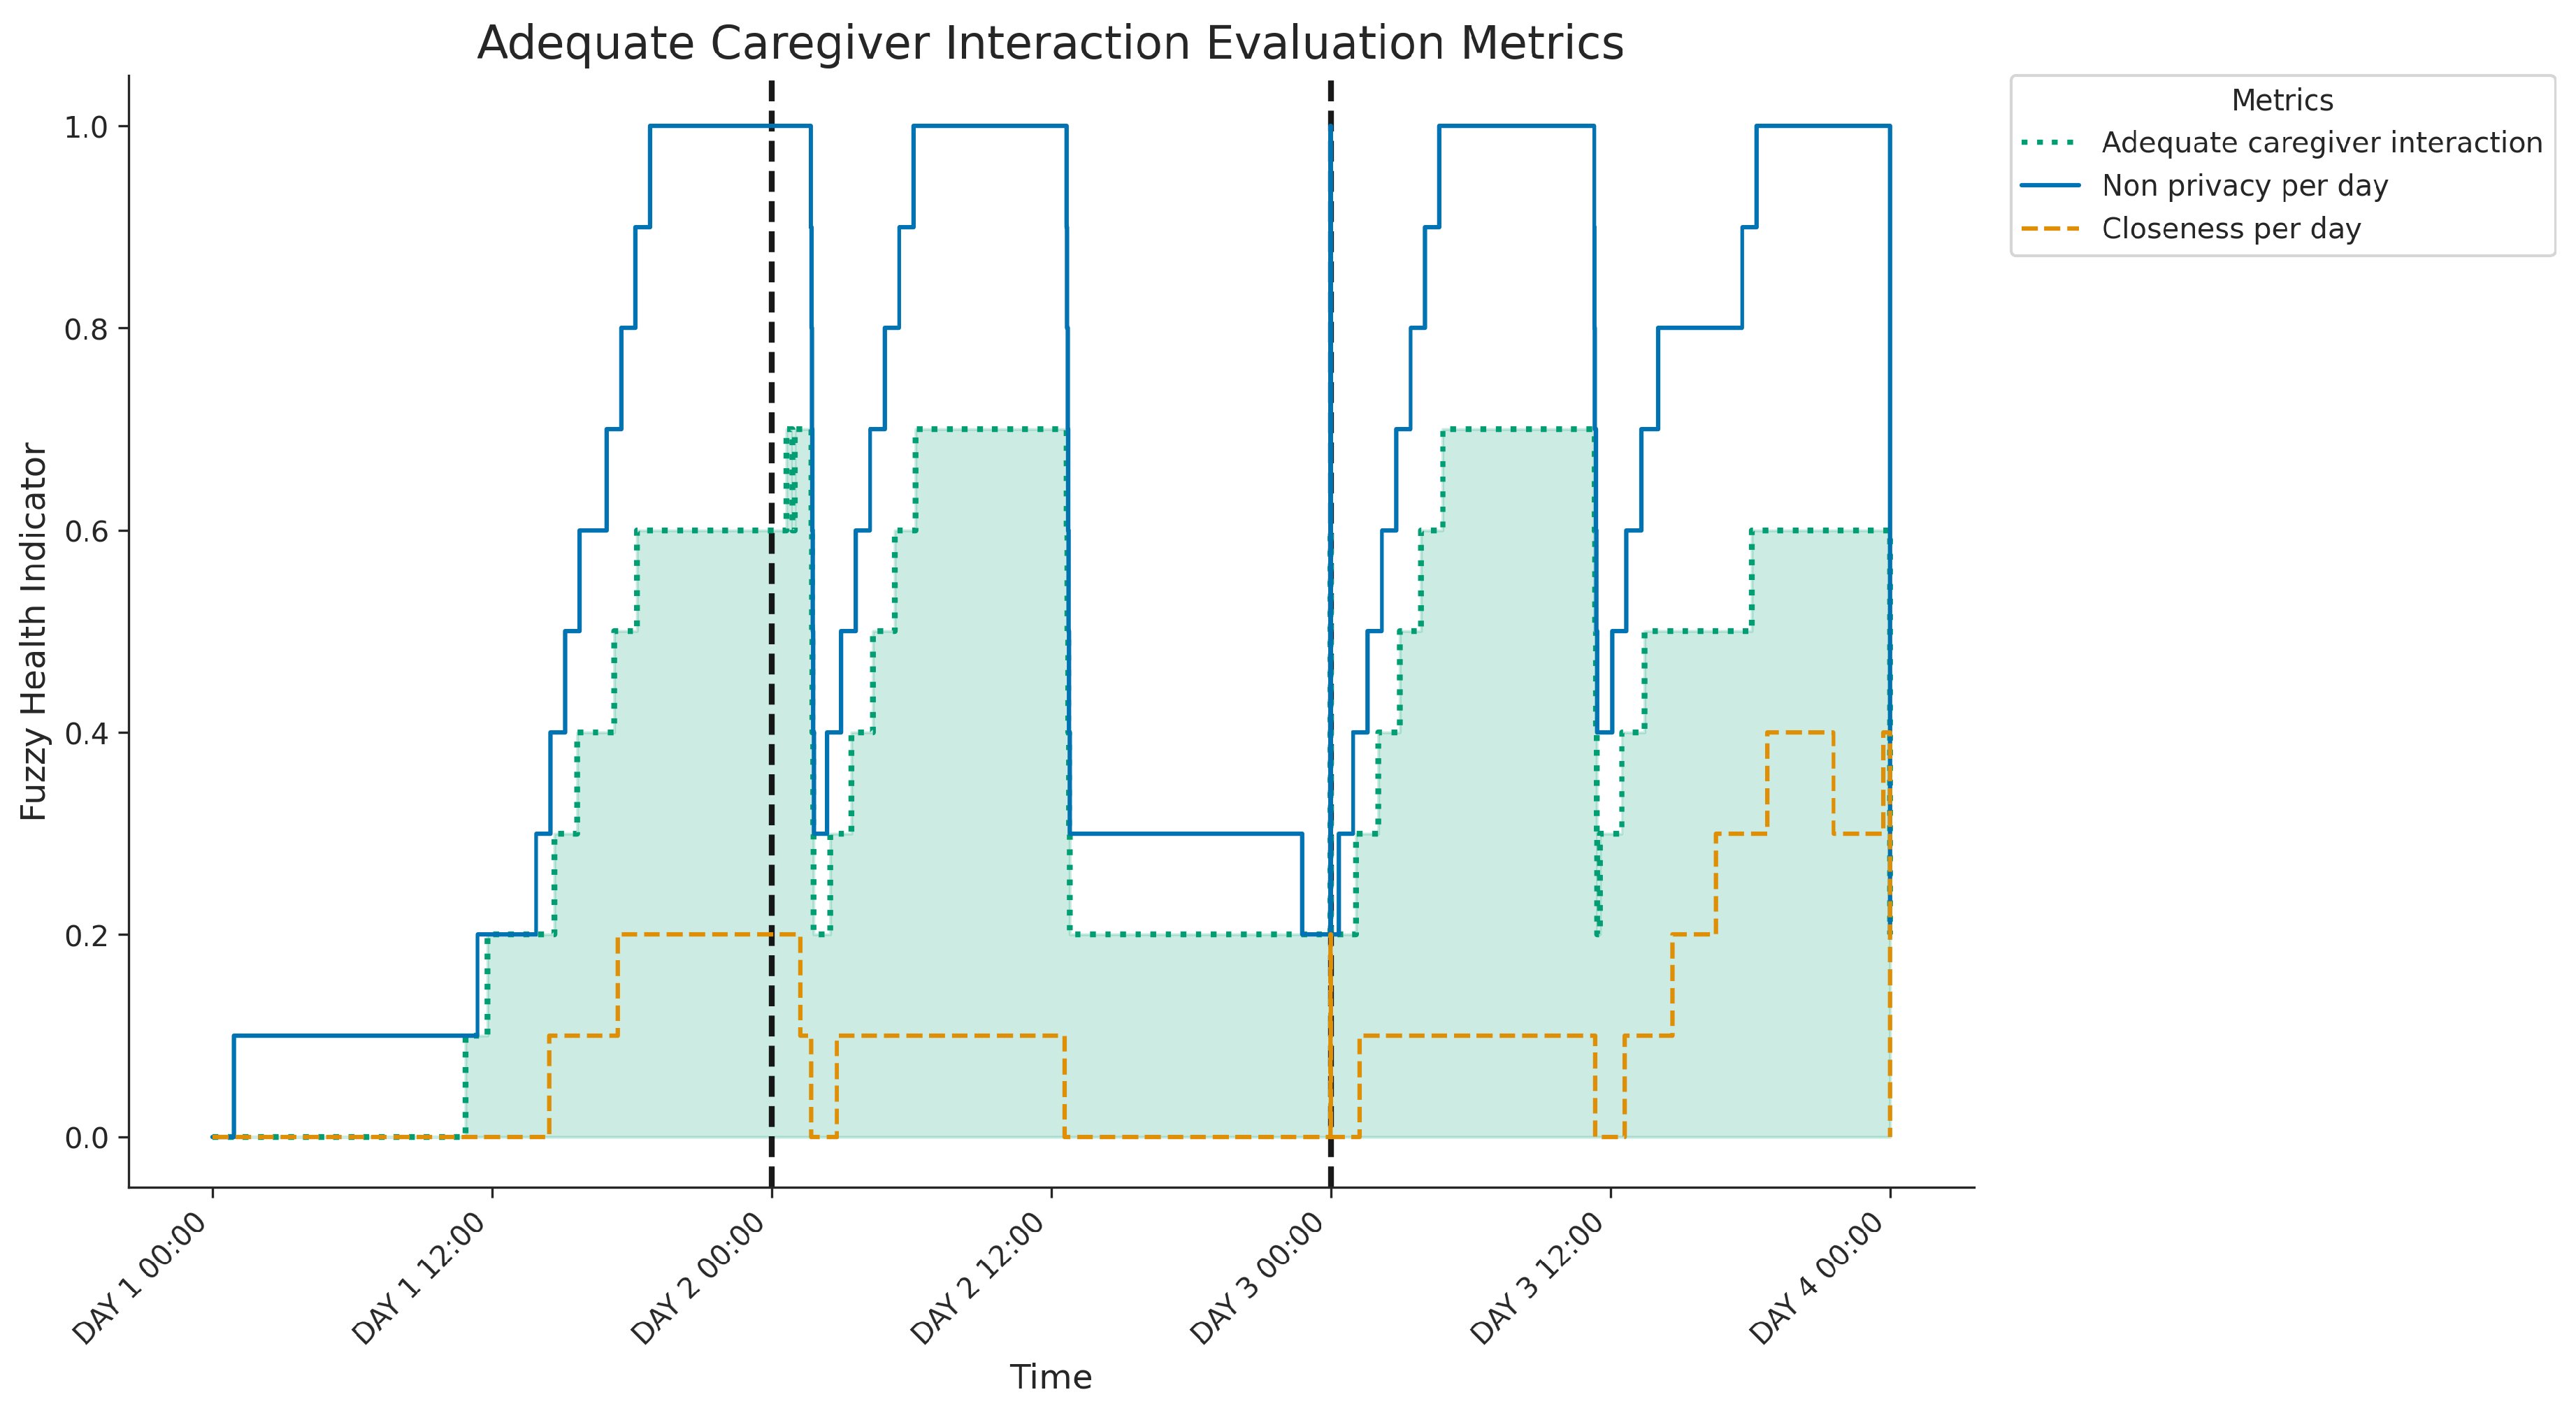
Figure 12 shows the three-day evolution of caregiver interaction metrics: Closeness per day (SA branch, assessing proximity), Non privacy per day (SB branch, assessing proximity within private rooms) and the overall Adequate caregiver interaction caregiver (SAB, highlighted). Both the closeness (SA) and non-privacy (SB) indicators exhibit daily variations, typically increasing from lower morning levels to significantly higher values during the afternoons and evenings; notably, the non-privacy score (SB) reaches very high levels during these peak periods on days 2 and 3, indicating frequent caregiver presence in private rooms during close interactions. The composite Adequate interaction caregiver score (SAB) reflects these combined patterns, achieving its highest values when both the SA and SB indicators are elevated. Analysing daily patterns reveals distinct differences: Day 1 shows moderate levels of combined closeness and co-location in private spaces, primarily during the afternoon and evening. In contrast, Days 2 and 3 show significantly more intense and prolonged periods of such combined interactions during similar times of the day, resulting in considerably higher peaks in the overall interaction caregiver score compared to the first day.
4. Conclusions
This work addressed the challenge of interpreting sensor data for frail individuals by developing a framework integrating Knowledge Graphs (KG) and Fuzzy Logic (FL). Our approach successfully models key health indicators: sleep patterns, excretion control, physical mobility, and caregiver interaction -defined by clinicians, using noninvasive sensors. KGs provide semantic structure, while FL handles the inherent vagueness in sensor data and linguistic clinical terms, effectively bridging the gap between raw data and actionable knowledge. Validation through a real-world case study with a participant in Granada, Spain, confirmed the system’s feasibility. Using minimally invasive sensors (wearable and environmental), our KG and FL models generated daily interpretable summaries reflecting complex behavioural patterns relevant to clinical evaluation, such as sleep quality/location, excretion frequency, mobility including outdoor time and caregiver proximity. This demonstrates the potential to evaluate health status in an understandable way.
In conclusion, this research presents an interpretable knowledge-based monitoring approach that integrates clinical expertise, offering advantages over opaque data-driven methods for personalised care and early detection. Future work should expand the range of indicators (e.g., nutrition, medication adherence, potential cognitive markers), refine existing models through broader clinical validation, and enhance explainability with natural language summaries derived from the KG/FL reasoning. Further research could involve larger longitudinal studies to assess generalisability and reliability, integration with clinical alert systems, dynamic adaptation of the KG based on the evolution of user health, and exploration of hybrid models that combine the strengths of KG/FL with machine learning techniques.
Abbreviations
The following abbreviations are used in this manuscript:
| AAL | Ambient Assisted Living |
| FL | Fuzzy Logic |
| FTW | Fuzzy Temporal Window |
| KG | Knowledge Graph |
| TLA | Three letter acronym |
| UWB | Ultra-Wideband |
Institutional Review Board Statement
The study was conducted in accordance with the Declaration of Helsinki, and approved by the Institutional Review Board (or Ethics Committee) of Comité de Ética de Investigación del Distrito de Granada Metropolitano (12/19/2024).
Informed Consent Statement
Written informed consent has been obtained from the patient to publish this article.
Data Availability Statement
All raw data and Python notebooks generated and analysed during this study are available in the public GitHub repository: https://github.com/AuroraPR/Fuzzy-Health-KPI
Acknowledgments
This contribution has been funded by the Spanish Institute of Health ISCIII through the project DTS21-00047 and by the University of Granada through the project ’Detection of Sports Activities Using IoT Devices’ (6324) of the Office of Technology Transfer (OTRI).
Conflicts of Interest
The authors declare no conflicts of interest.
References
- Cicirelli, G.; Marani, R.; Petitti, A.; Milella, A.; D’orazio, T. Ambient assisted living: a review of technologies, methodologies and future perspectives for healthy aging of population. Sensors 2021, 21, 3549. [Google Scholar] [CrossRef] [PubMed]
- Perandrés-Gómez, A.; Merdeces Párraga-Vico, M.; Díaz-Jiménez, D.; Medina-Quero, J.; Polo-Rodríguez, A. Impact of Training Programmes in Digital Skills to Reduce Unwanted Loneliness in Older Andalusian Women. In Proceedings of the Italian Forum of Ambient Assisted Living. Springer, 2024, pp. 431–440. [CrossRef]
- Rehan, H. Enhancing Early Detection and Management of Chronic Diseases With AI-Driven Predictive Analytics on Healthcare Cloud Platforms. Journal of AI-Assisted Scientific Discovery 2024, 4, 1–38. [Google Scholar]
- Rehman, A.; Naz, S.; Razzak, I. Leveraging big data analytics in healthcare enhancement: trends, challenges and opportunities. Multimedia Systems 2022, 28, 1339–1371. [Google Scholar] [CrossRef]
- Peláez-Aguilera, M.D.; Espinilla, M.; Fernandez Olmo, M.R.; Medina, J.; et al. Fuzzy linguistic protoforms to summarize heart rate streams of patients with ischemic heart disease. Complexity 2019, 2019. [Google Scholar] [CrossRef]
- Wang, J.; Zhang, Q.; Shi, F.; Li, D.; Cai, Y.; Wang, J.; Li, B.; Wang, X.; Zhang, Z.; Zheng, C. Knowledge graph embedding model with attention-based high-low level features interaction convolutional network. Information Processing & Management 2023, 60, 103350. [Google Scholar]
- Arrotta, L.; Civitarese, G.; Bettini, C. Dexar: Deep explainable sensor-based activity recognition in smart-home environments. Proceedings of the ACM on Interactive, Mobile, Wearable and Ubiquitous Technologies 2022, 6, 1–30. [Google Scholar] [CrossRef]
- Salguero, A.G.; Espinilla, M.; Delatorre, P.; Medina, J. Using ontologies for the online recognition of activities of daily living. Sensors 2018, 18, 1202. [Google Scholar] [CrossRef] [PubMed]
- Chen, L.; Nugent, C.; Okeyo, G. An ontology-based hybrid approach to activity modeling for smart homes. IEEE Transactions on human-machine systems 2013, 44, 92–105. [Google Scholar] [CrossRef]
- Abidi, S.S.R.; Abidi, S.R. Intelligent health data analytics: a convergence of artificial intelligence and big data. In Proceedings of the Healthcare management forum. SAGE Publications Sage CA: Los Angeles, CA, 2019, Vol. 32, pp. 178–182. [CrossRef]
- Liaw, W.; Kakadiaris, I.A. Primary care artificial intelligence: a branch hiding in plain sight. Annals of family medicine 2020, 18, 194. [Google Scholar] [CrossRef] [PubMed]
- Polo-Rodríguez, A.; Romero-Sanchez, J.; Fernández-García, E.; Paloma-Castro, O.; Porcel-Gálvez, A.M.; Medina-Quero, J. Review on internet of things for innovation in nursing process-a pubmed-based search. In Proceedings of the International Conference on Ubiquitous Computing and Ambient Intelligence. Springer, 2023, pp. 57–70. [CrossRef]
- Lloyd, R.C. Quality health care: a guide to developing and using indicators; Jones & Bartlett Learning, 2019.
- Lockhart, J.W.; Weiss, G.M. Limitations with activity recognition methodology & data sets. In Proceedings of the Proceedings of the 2014 ACM international joint conference on pervasive and ubiquitous computing: adjunct publication, 2014, pp. 747–756. [CrossRef]
- Anguita-Molina, M.Á.; Cardoso, P.J.; Rodrigues, J.M.; Medina-Quero, J.; Polo-Rodríguez, A. Multi-Occupancy Activity Recognition Based on Deep Learning Models Fusing UWB Localisation Heatmaps and Nearby-Sensor Interaction. IEEE Internet of Things Journal 2025. [Google Scholar] [CrossRef]
- Loh, H.W.; Ooi, C.P.; Seoni, S.; Barua, P.D.; Molinari, F.; Acharya, U.R. Application of explainable artificial intelligence for healthcare: A systematic review of the last decade (2011–2022). Computer methods and programs in biomedicine 2022, 226, 107161. [Google Scholar] [CrossRef] [PubMed]
- Wan, S.; Guan, S.; Tang, Y. Advancing bridge structural health monitoring: Insights into knowledge-driven and data-driven approaches. Journal of Data Science and Intelligent Systems 2024, 2, 129–140. [Google Scholar] [CrossRef]
- Hernandez, N.; Castro, L.; Medina-Quero, J.; Favela, J.; Michán, L.; Mortenson, W.B. Scoping review of healthcare literature on mobile, wearable, and textile sensing technology for continuous monitoring. Journal of healthcare informatics research 2021, 1–30. [Google Scholar] [CrossRef] [PubMed]
- Adewoyin, O.; Wesson, J.; Vogts, D. User modelling to support behavioural modelling in smart environments. In Proceedings of the 2022 3rd International Conference on Next Generation Computing Applications (NextComp). IEEE, 2022, pp. 1–6. [CrossRef]
- Abdel-Razik, M.S.M.; Rizk, H.I.; Zein, M.M.; Abdel-Megeid, S.M.E.S.; Abd El Fatah, S.A. Promoting the culture of key performance indicators (KPIs) among primary health care staff at health district level: An intervention study. Evaluation and Program Planning 2023, 96, 102188. [Google Scholar] [CrossRef] [PubMed]
- Polo-Rodriguez, A.; Cavallo, F.; Nugent, C.; Medina-Quero, J. Human activity mining in multi-occupancy contexts based on nearby interaction under a fuzzy approach. Internet of Things 2024, 25, 101018. [Google Scholar] [CrossRef]
- Gürsel, G. Healthcare, uncertainty, and fuzzy logic. Digital Medicine 2016, 2, 101–112. [Google Scholar] [CrossRef]
- Chen, X.; Hu, Z.; Sun, Y. Fuzzy logic based logical query answering on knowledge graphs. In Proceedings of the Proceedings of the AAAI Conference on Artificial Intelligence, 2022, Vol. 36, pp. 3939–3948.
- Fontenla-Seco, Y.; Bugarin, A.; Lama, M. Fuzzy temporal protoforms for the quantitative description of processes in natural language. In Proceedings of the 2021 IEEE International Conference on Fuzzy Systems (FUZZ-IEEE). IEEE, 2021, pp. 1–6. [CrossRef]
- Bugarin, A.; Marín, N.; Sánchez, D.; Trivino, G. Fuzzy knowledge representation for linguistic description of time series. In Proceedings of the 2015 Conference of the International Fuzzy Systems Association and the European Society for Fuzzy Logic and Technology (IFSA-EUSFLAT-15). Atlantis Press, 2015, pp. 1346–1353. [CrossRef]
- Martínez-Cruz, C.; Quero, J.M.; Serrano, J.M.; Gramajo, S. Monwatch: A fuzzy application to monitor the user behavior using wearable trackers. In Proceedings of the 2020 IEEE International Conference on Fuzzy Systems (FUZZ-IEEE). IEEE, 2020, pp. 1–8. [CrossRef]
- Johnson, K.B.; Wei, W.Q.; Weeraratne, D.; Frisse, M.E.; Misulis, K.; Rhee, K.; Zhao, J.; Snowdon, J.L. Precision medicine, AI, and the future of personalized health care. Clinical and translational science 2021, 14, 86–93. [Google Scholar] [CrossRef] [PubMed]
- Medina, J.; Martinez, L.; Espinilla, M. Subscribing to fuzzy temporal aggregation of heterogeneous sensor streams in real-time distributed environments. International Journal of Communication Systems 2017, 30, e3238. [Google Scholar] [CrossRef]
- Medina, J.; Espinilla, M.; Zafra, D.; Martínez, L.; Nugent, C. Fuzzy fog computing: A linguistic approach for knowledge inference in wearable devices. In Proceedings of the Ubiquitous Computing and Ambient Intelligence: 11th International Conference, UCAmI 2017, Philadelphia, PA, USA, November 7–10, 2017, Proceedings. Springer, 2017, pp. 473–485. [CrossRef]
| 1 | In this work, we use the term ’excretion control’ as a general category; however, in clinical practice, it is more common to refer specifically to urinary and fecal control. It is important to note that in patients with incontinence who use absorbent products, data collection through environmental sensors may present limitations that should be considered. |
Figure 1.
Sensor architecture for indoor monitoring, integrating UWB-based localization, environmental sensing, and wearable devices for caregiver and patient. All data streams are collected locally for health indicator modeling.
Figure 1.
Sensor architecture for indoor monitoring, integrating UWB-based localization, environmental sensing, and wearable devices for caregiver and patient. All data streams are collected locally for health indicator modeling.
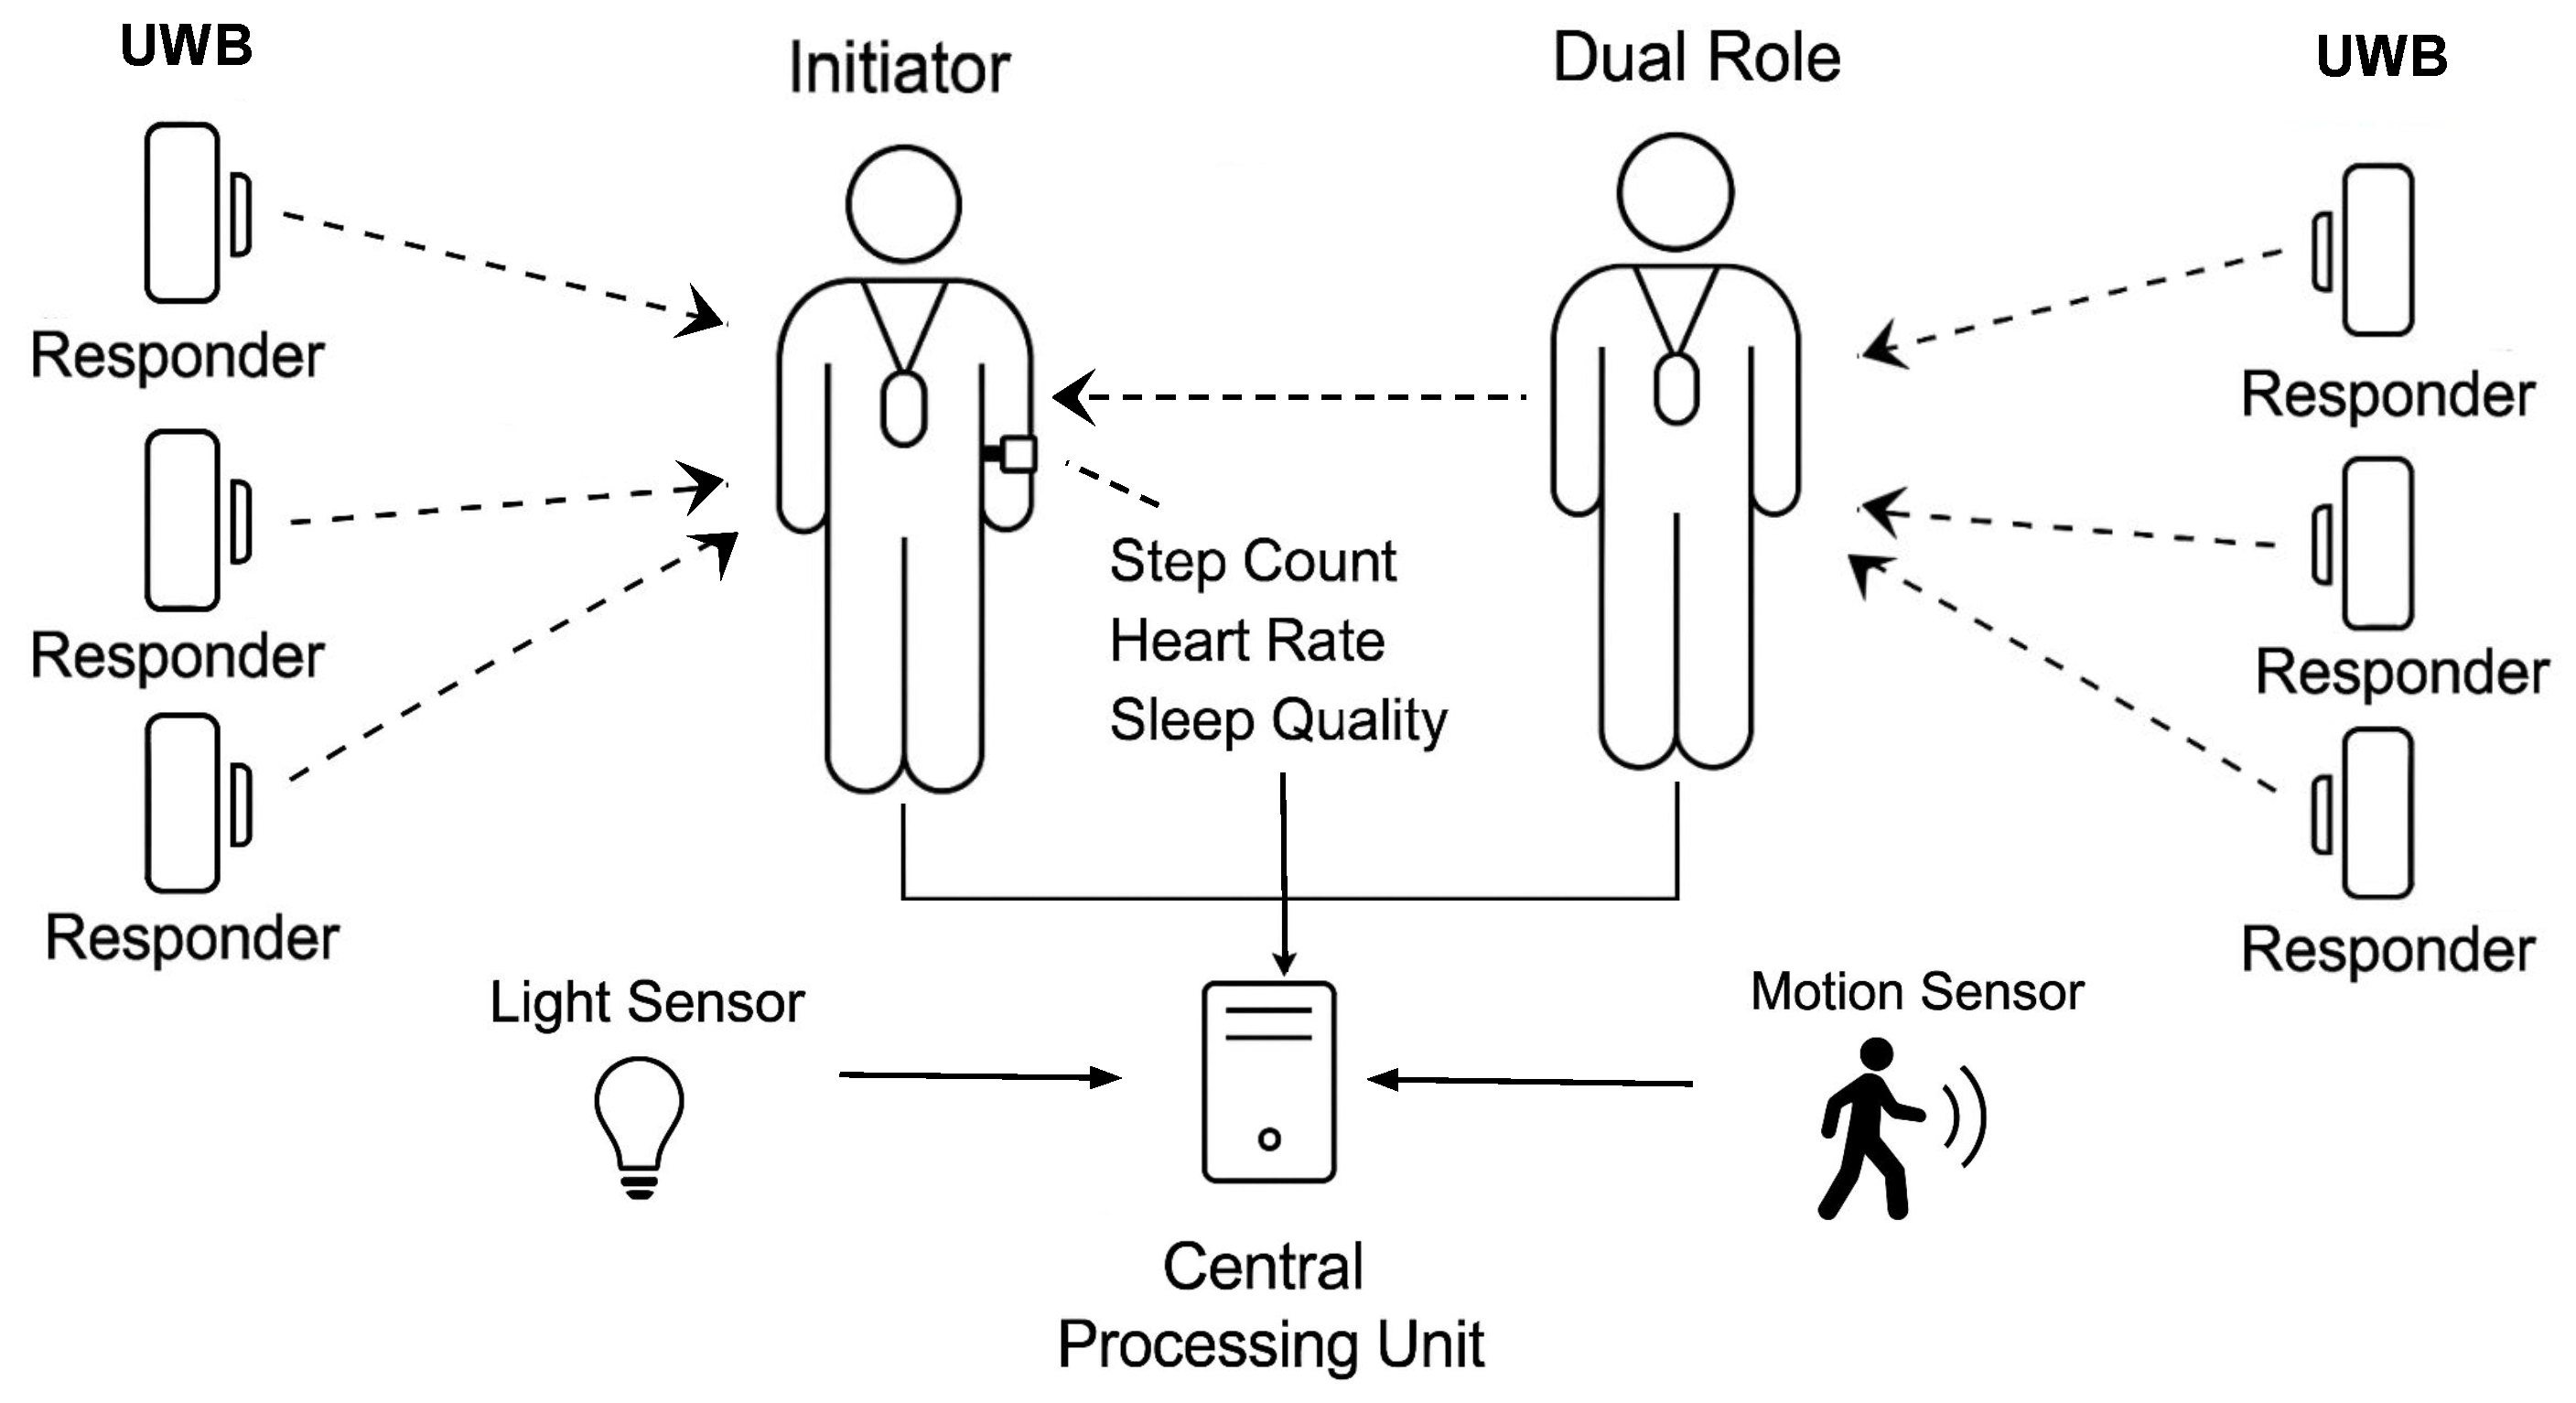
Figure 2.
A) Projection of a fuzzy temporal windows in a fuzzy data stream, and B) inference of protoforms in the knowledge graph.
Figure 2.
A) Projection of a fuzzy temporal windows in a fuzzy data stream, and B) inference of protoforms in the knowledge graph.
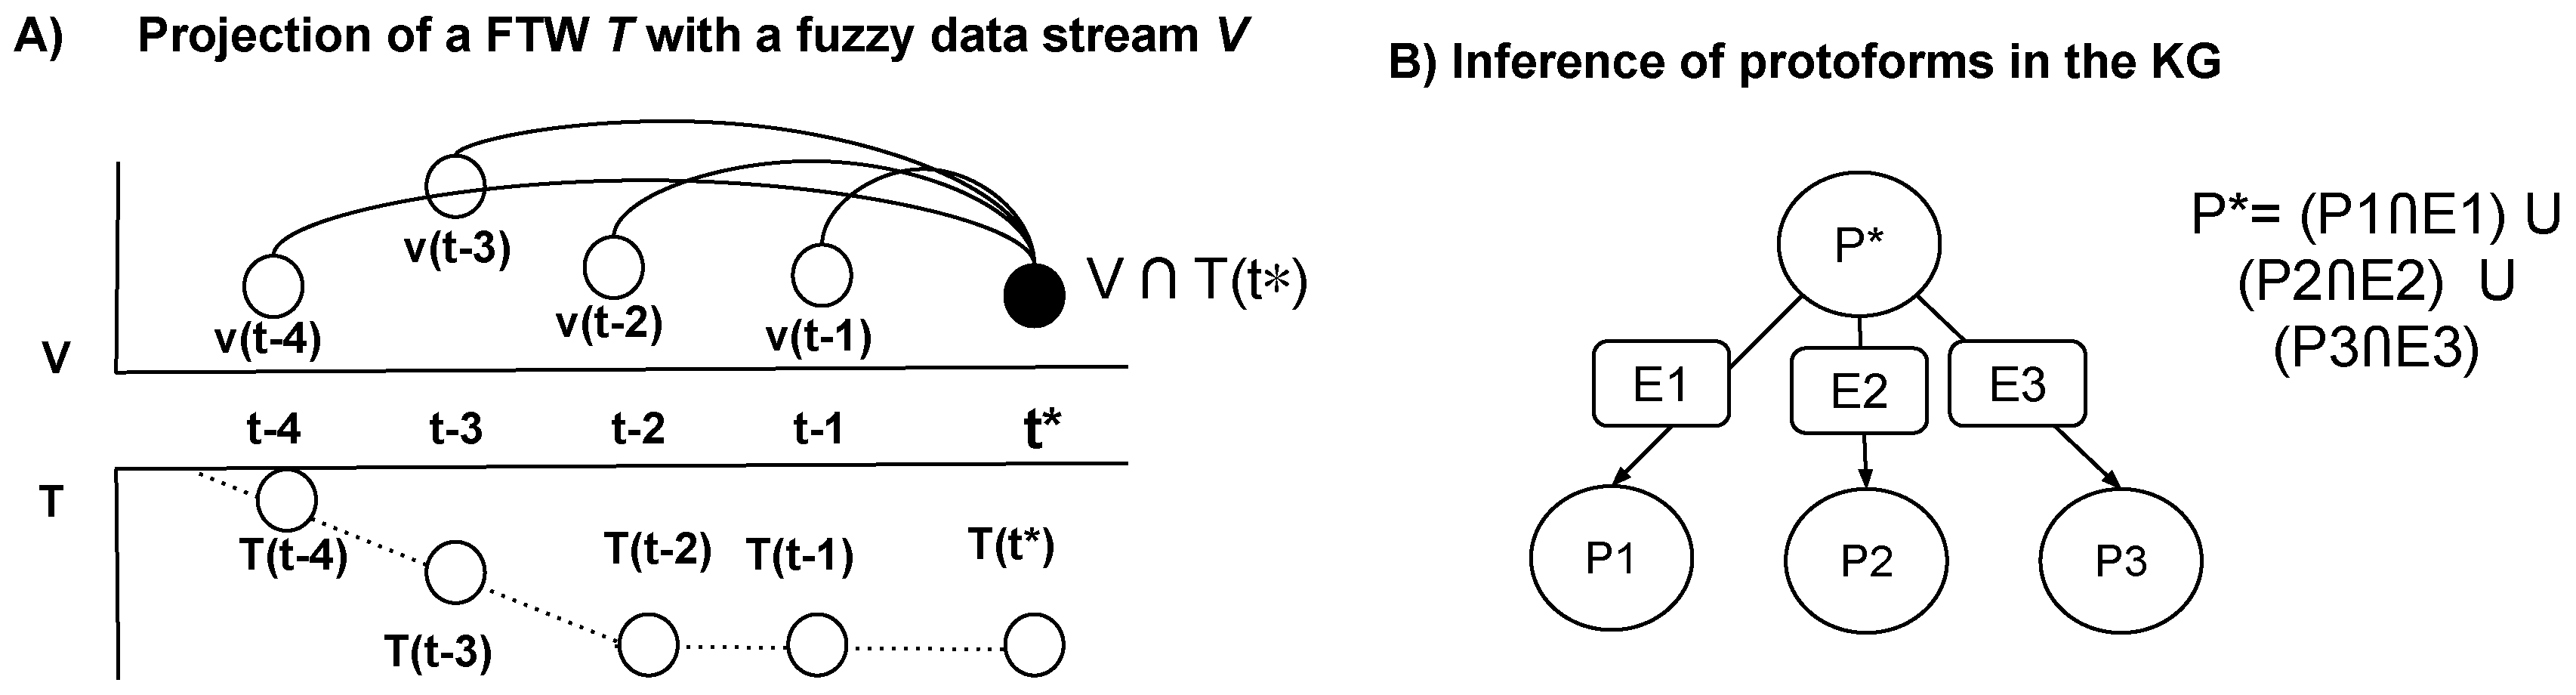
Figure 3.
Participant’s home layout and environment. Left: Floor plan showing the location of UWB anchors (maroon circles) and binary/consumption sensors (green circles) in the monitored rooms (living room, bedroom, hallway, bathroom). Right: Photographs of the real environment in the bedroom (top) and bathroom (bottom).
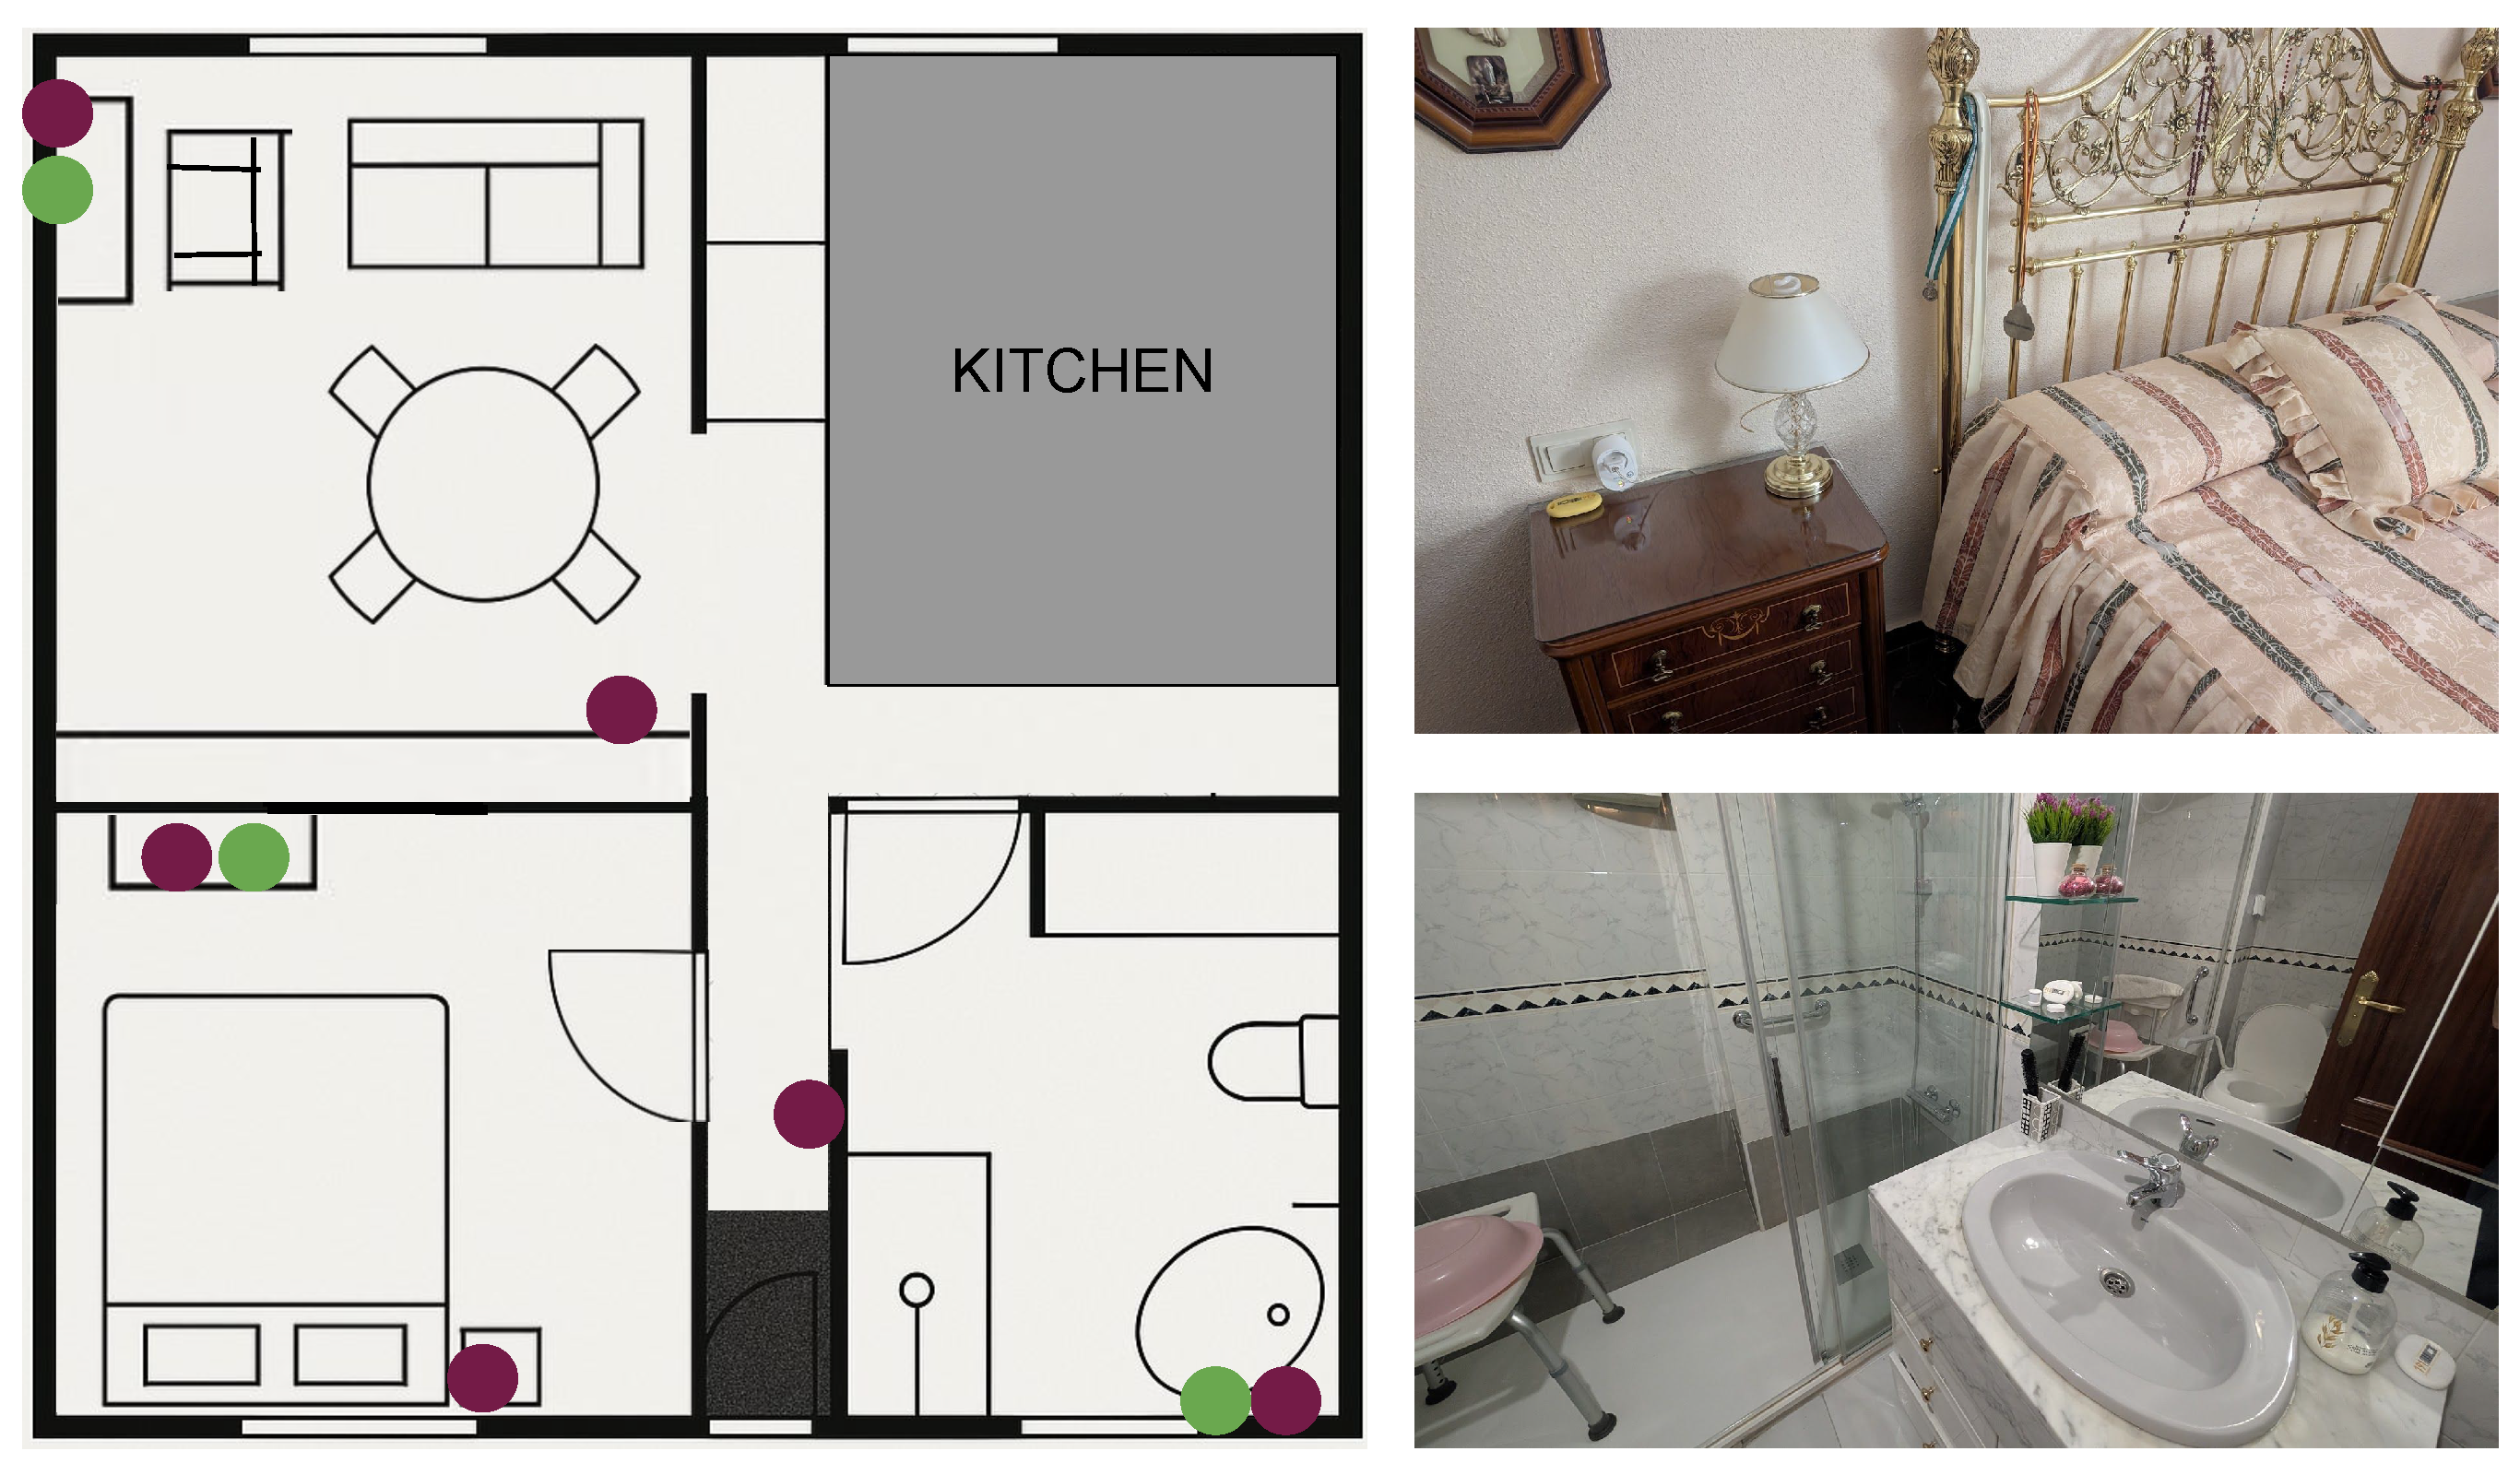
Figure 4.
Overview of the deployed sensor devices: (A) Wearable UWB tag (Estimote), (B) Motion and flush sensors (Aqara) in the bathroom, (C) Smart plug (TP-Link) and fixed UWB tag (Estimote), (D) Smartwatch (Amazfit Bip U Pro) worn by the participant.
Figure 4.
Overview of the deployed sensor devices: (A) Wearable UWB tag (Estimote), (B) Motion and flush sensors (Aqara) in the bathroom, (C) Smart plug (TP-Link) and fixed UWB tag (Estimote), (D) Smartwatch (Amazfit Bip U Pro) worn by the participant.
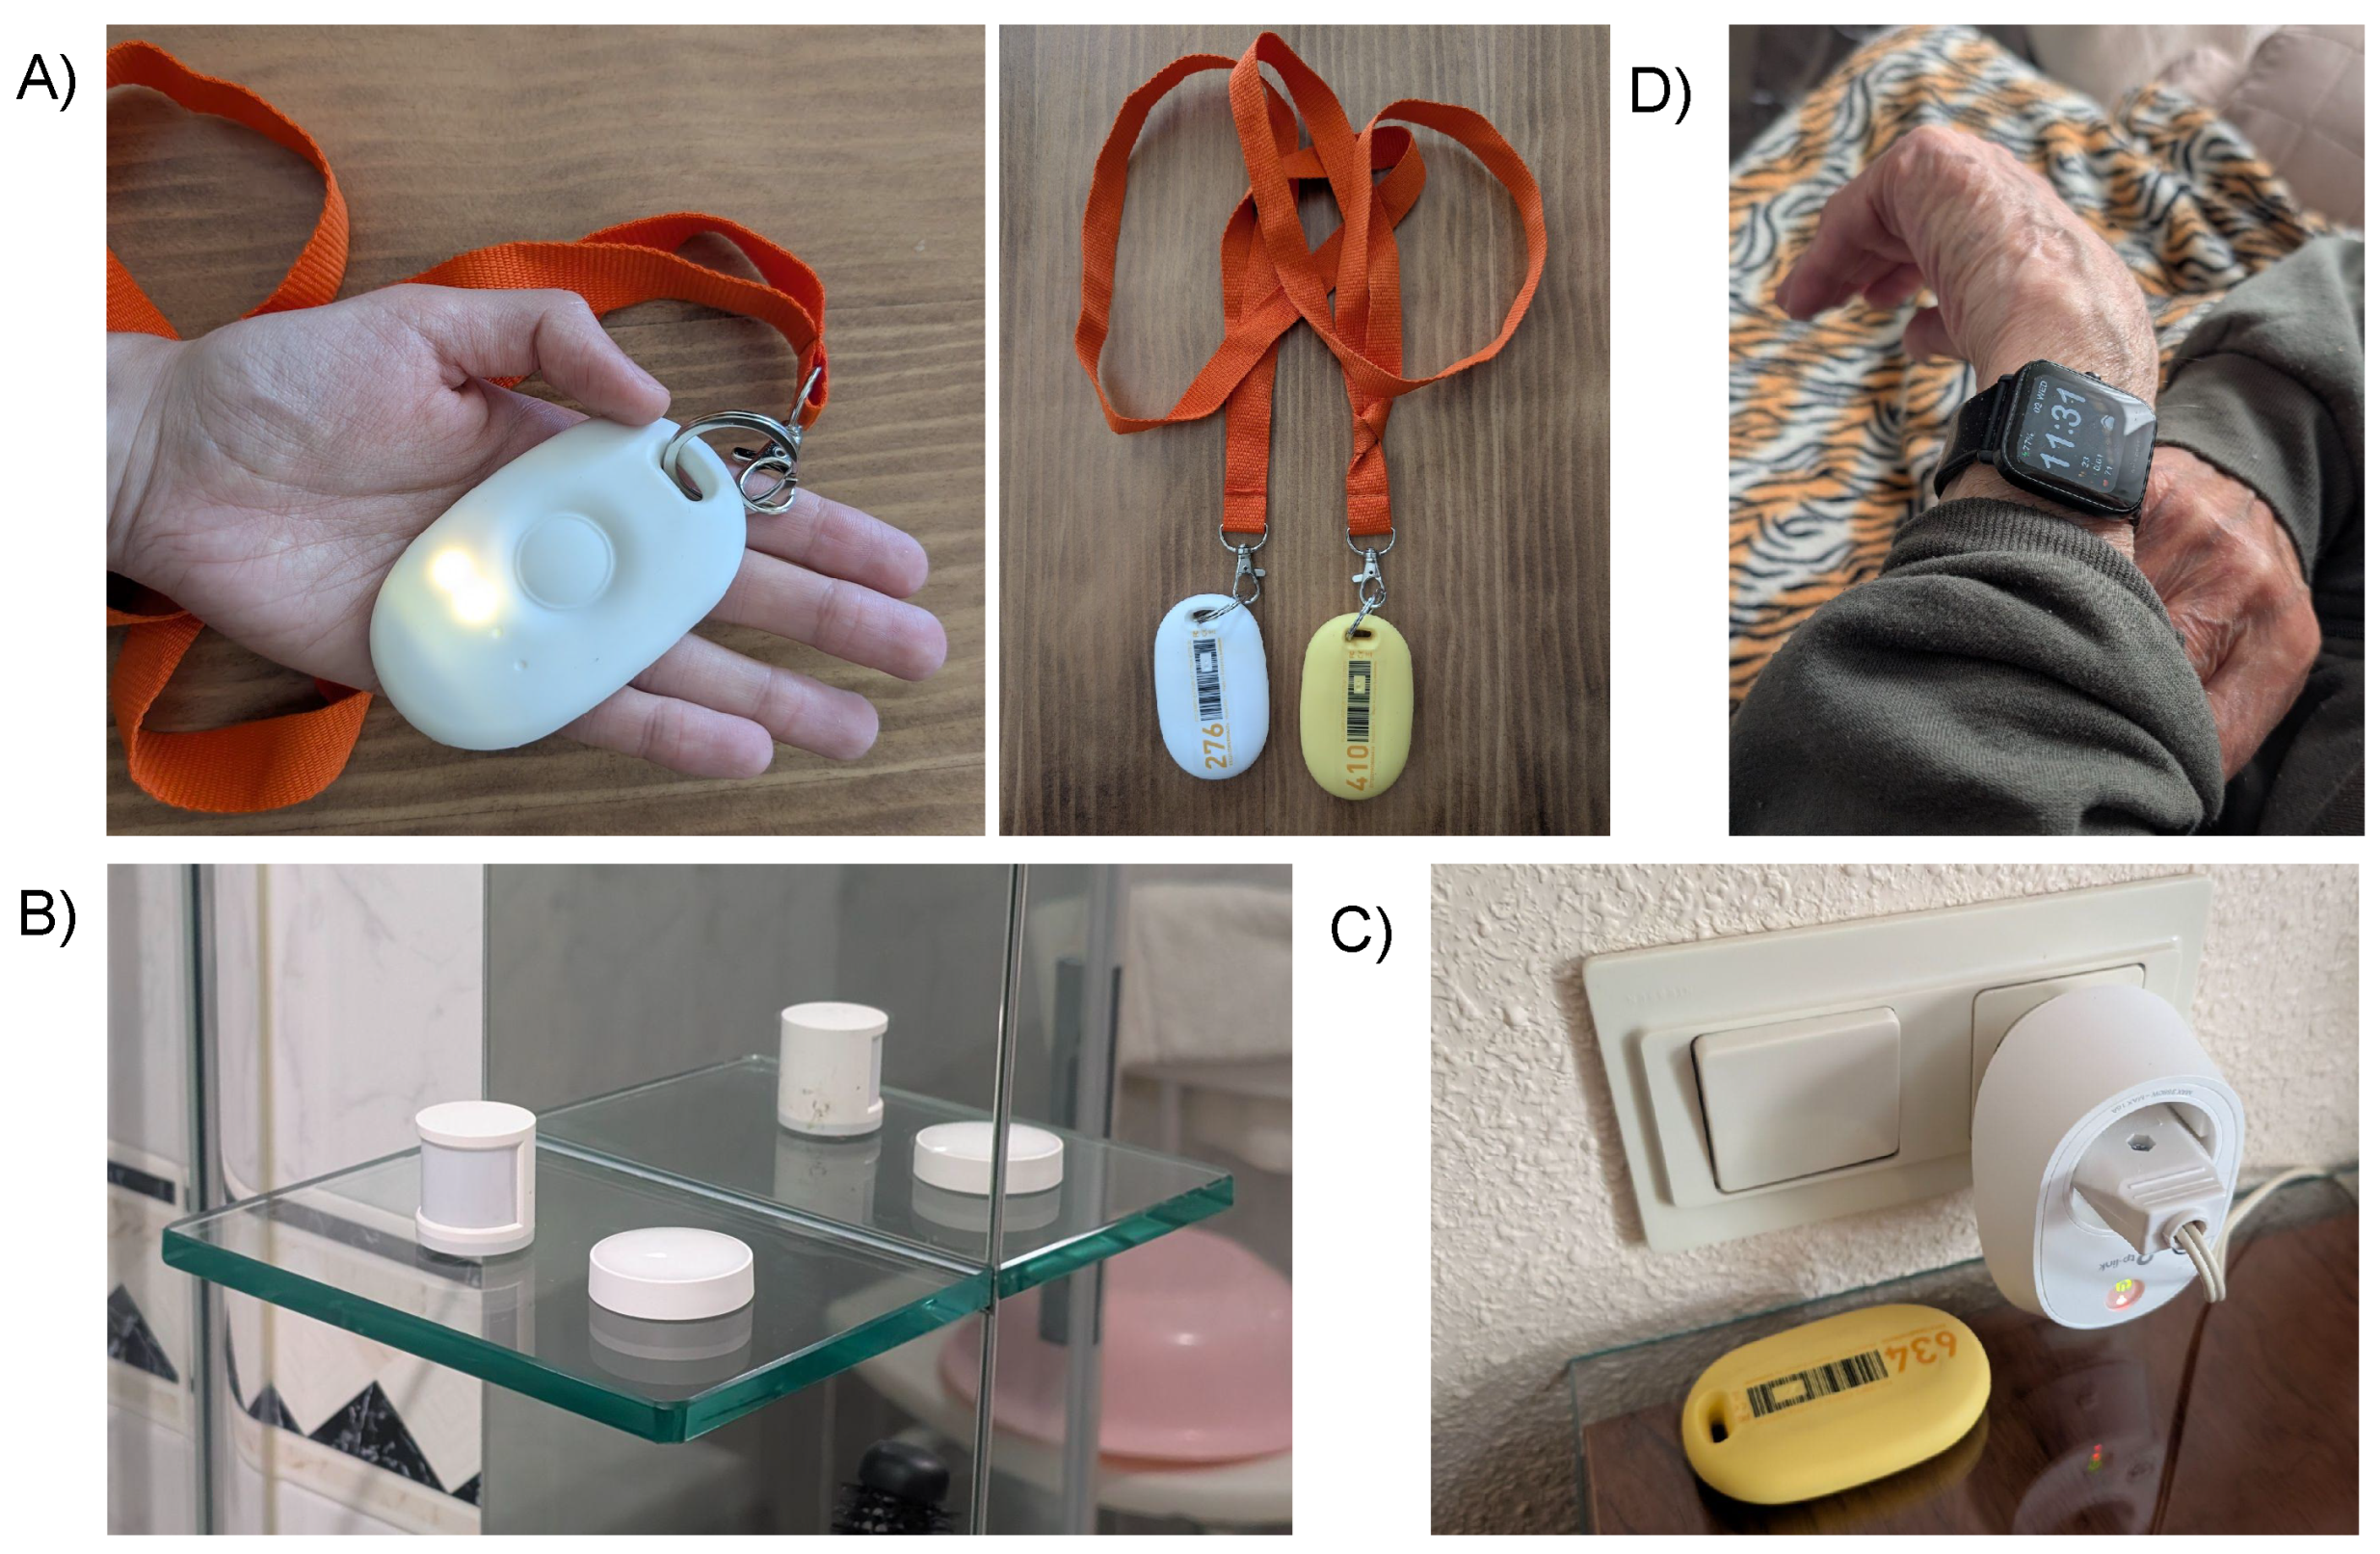
Figure 5.
Fuzzy knowledge graph for evaluating correct sleep patterns. The model integrates two main dimensions—adequate sleep time and quality of sleep—through indicators such as quantity, timing, sleep depth, and location.
Figure 5.
Fuzzy knowledge graph for evaluating correct sleep patterns. The model integrates two main dimensions—adequate sleep time and quality of sleep—through indicators such as quantity, timing, sleep depth, and location.
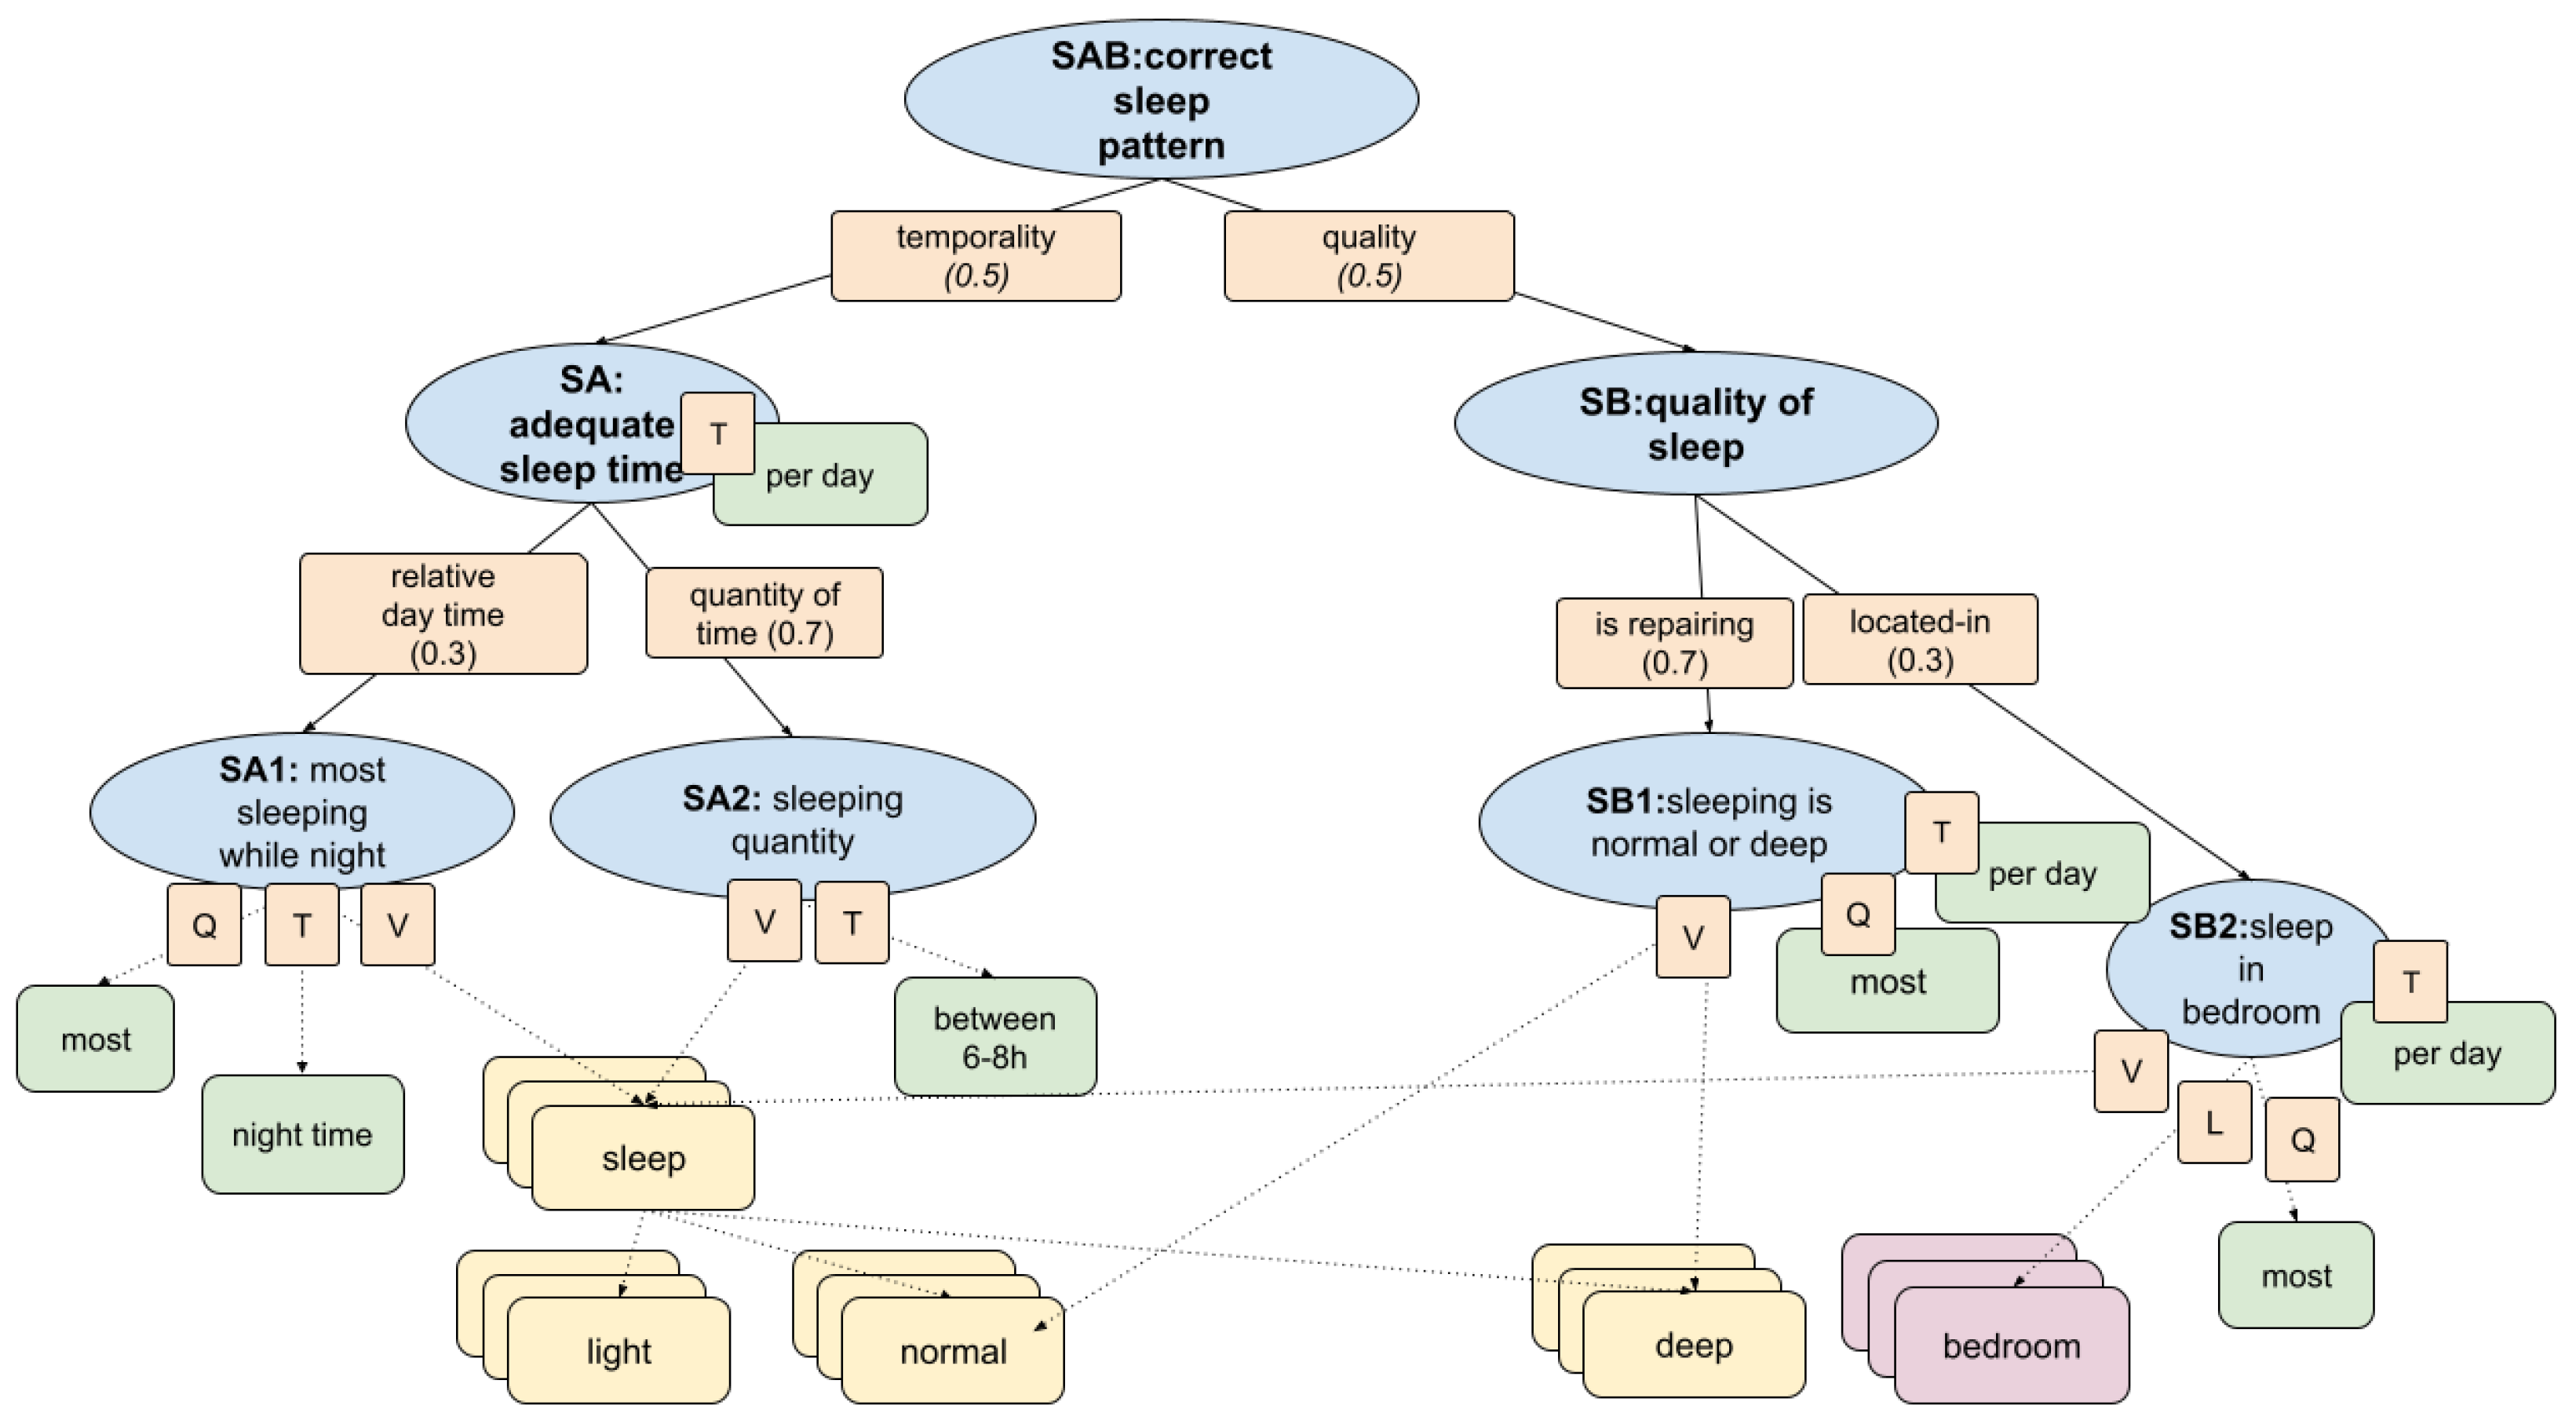
Figure 6.
Three-day evolution of sleep metrics showing components and the final Correct sleep indicator (highlighted). The first two nights indicate well-rated sleep, contrasting with the third night’s low Correct sleep score, which coincides with reduced sleep duration and potential sleep outside the bedroom.
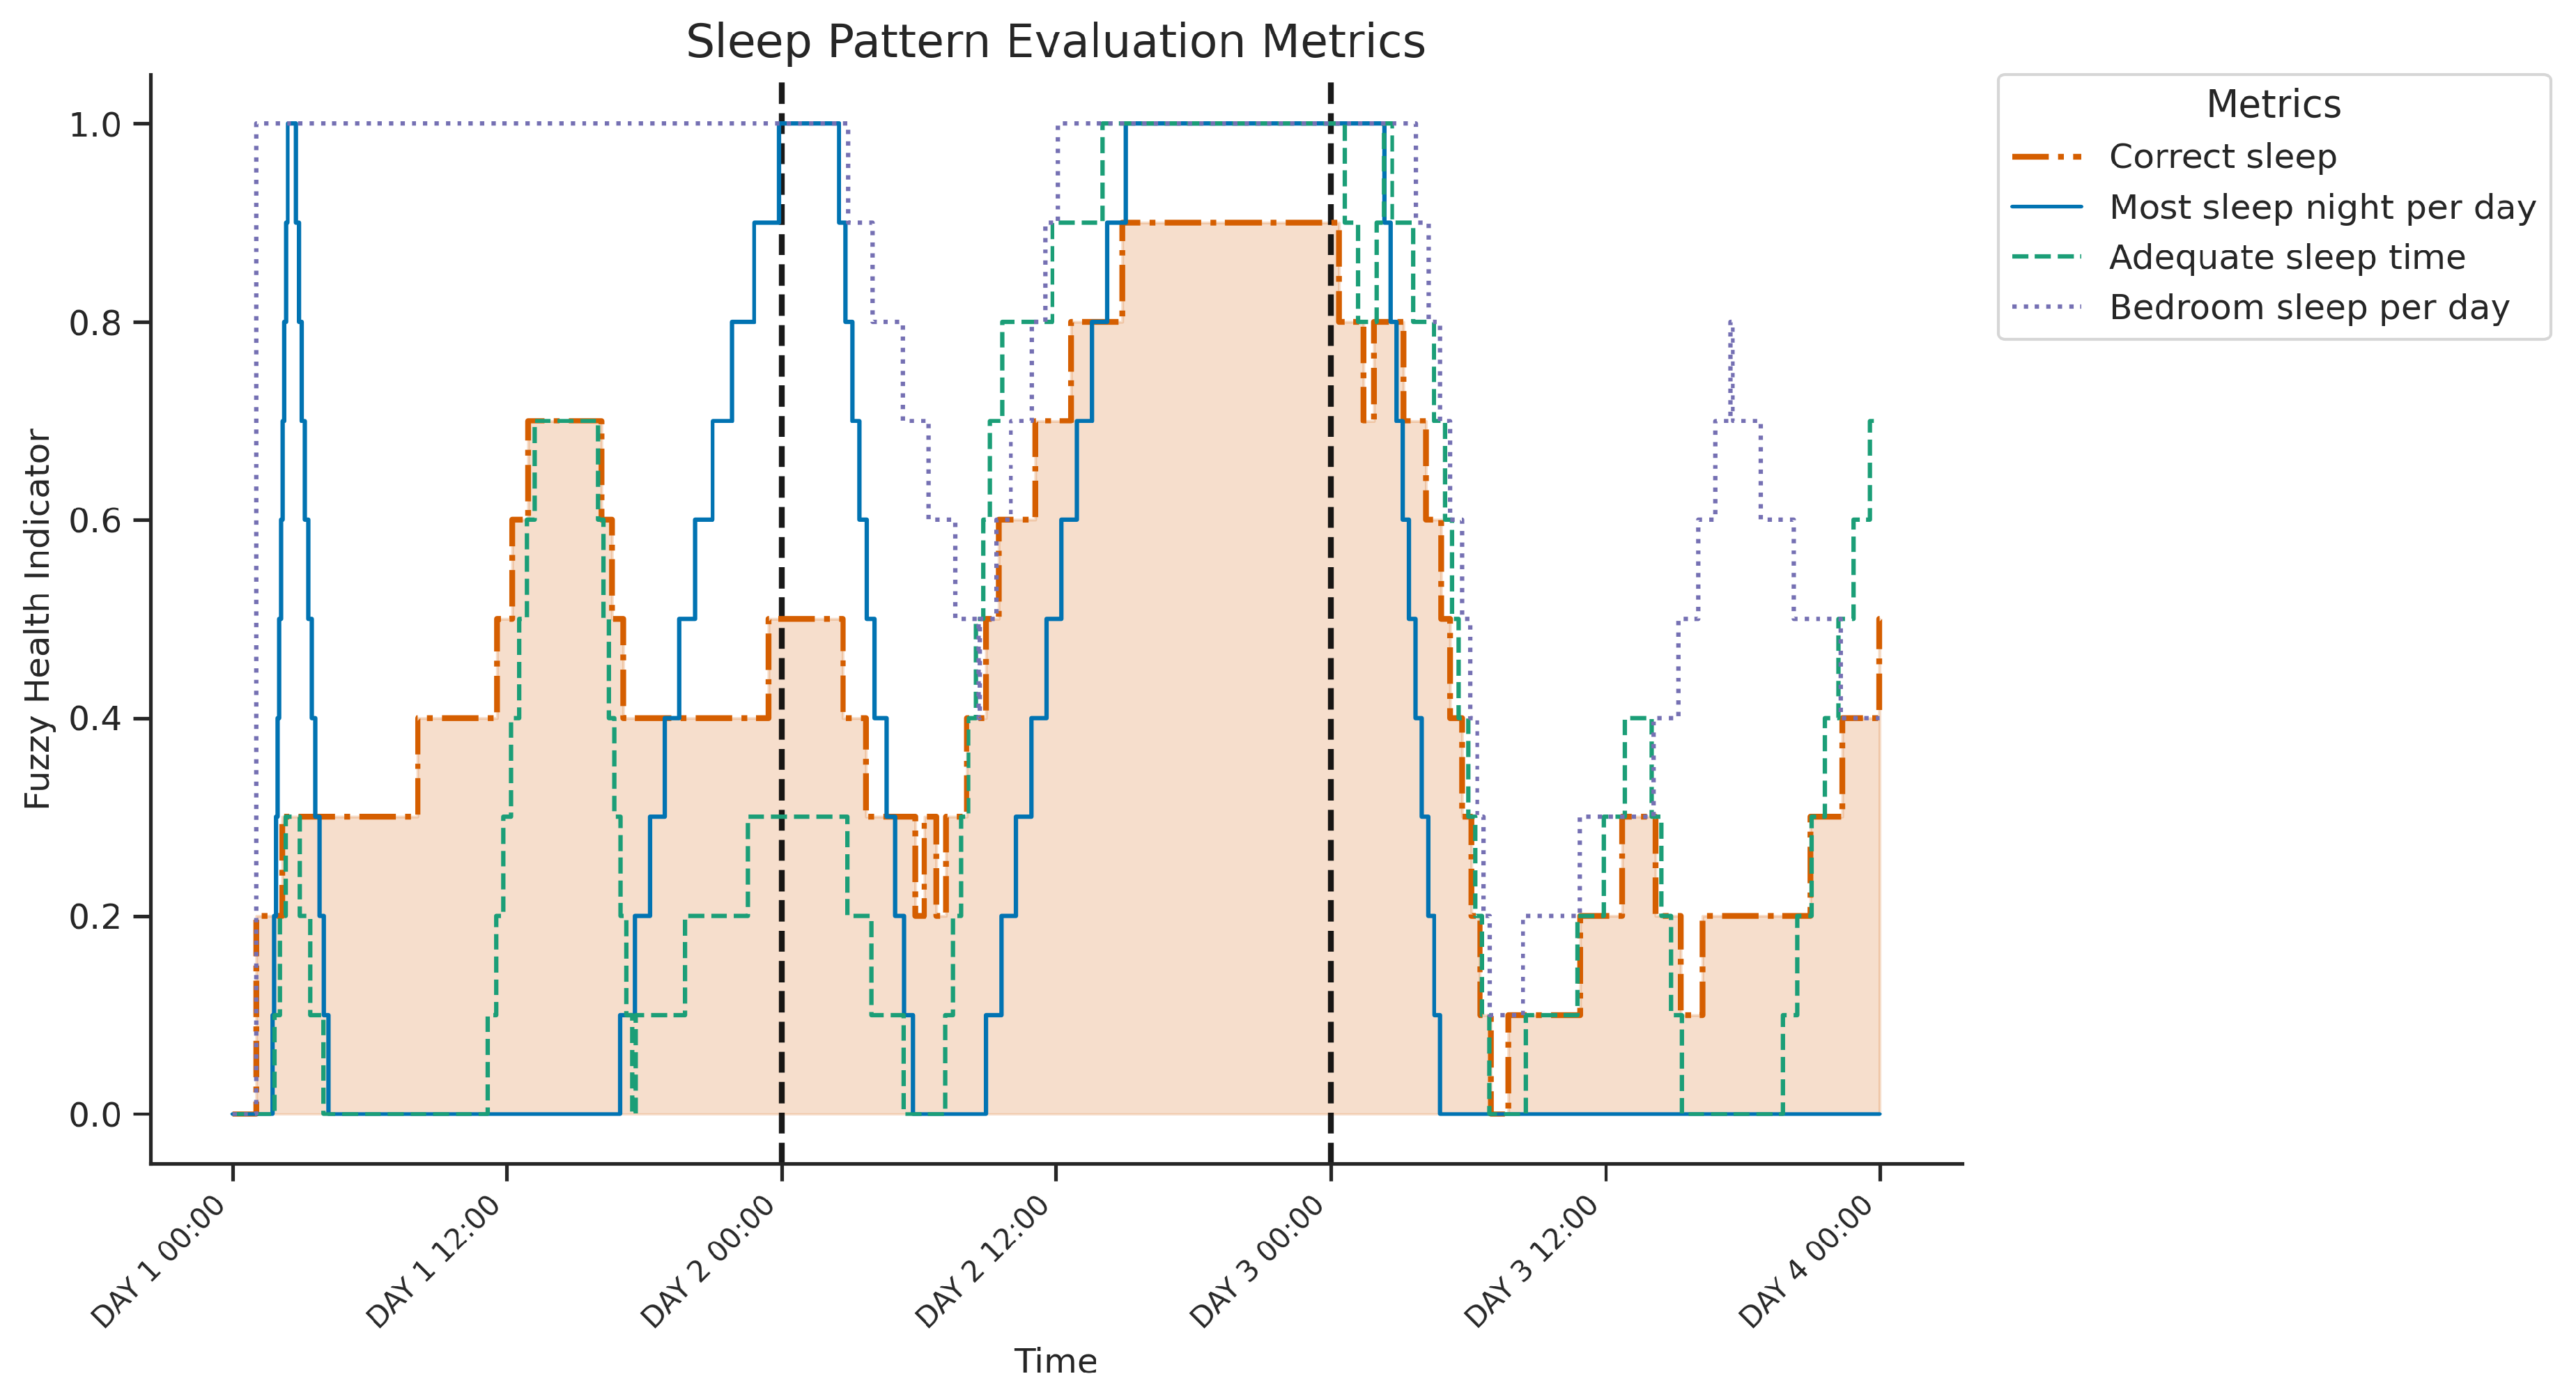
Figure 7.
Fuzzy knowledge graph for assessing excretion control. Day and night excretion patterns are evaluated through frequency and timing indicators, integrating sensor-based detection using motion, toilet usage, and flush events.
Figure 7.
Fuzzy knowledge graph for assessing excretion control. Day and night excretion patterns are evaluated through frequency and timing indicators, integrating sensor-based detection using motion, toilet usage, and flush events.
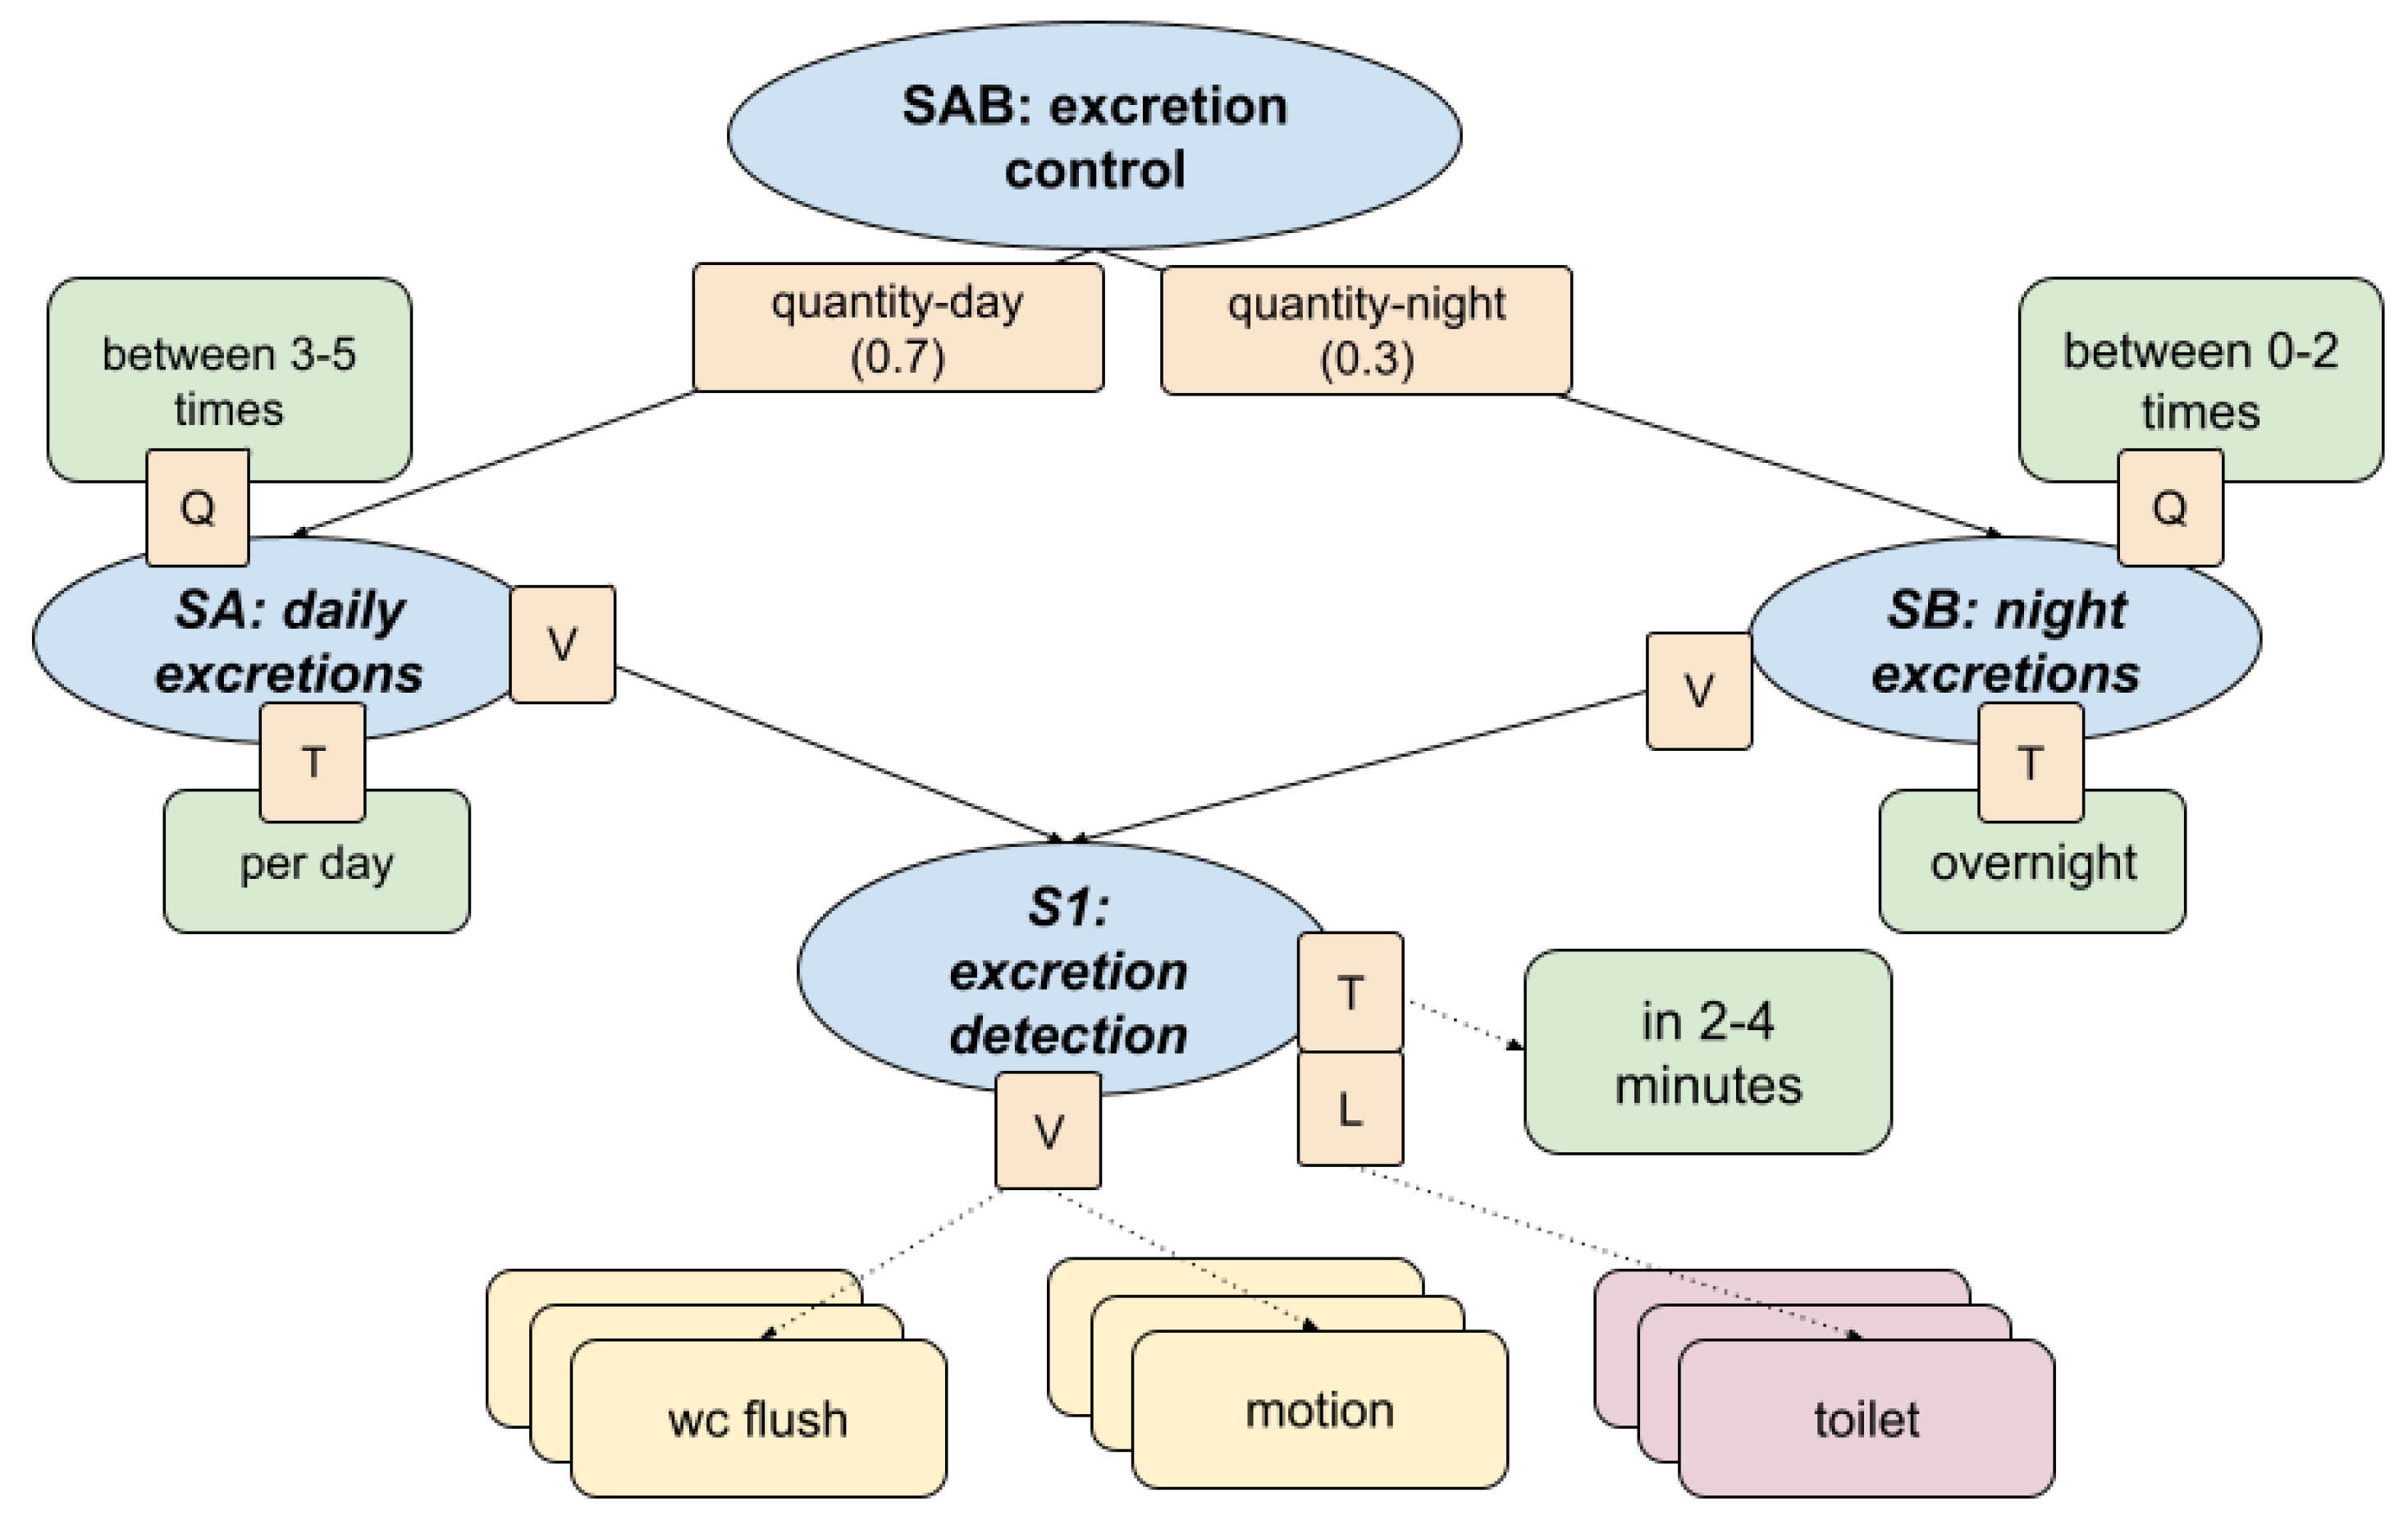
Figure 8.
Three-day evolution of excretion control metrics showing components and the final wc adequate indicator (highlighted). Days 2 and 3 indicate well-rated excretion control, contrasting with Day 1’s low overall score, which coincides with insufficient daytime excretion frequency while nighttime frequency remained adequate.

Figure 9.
Fuzzy knowledge graph for assessing physical mobility. The main dimension of physical activity is decomposed into active mobility and walking patterns, integrating step counts, durations, and spatial data to determine whether most activity occurs outdoors.
Figure 9.
Fuzzy knowledge graph for assessing physical mobility. The main dimension of physical activity is decomposed into active mobility and walking patterns, integrating step counts, durations, and spatial data to determine whether most activity occurs outdoors.
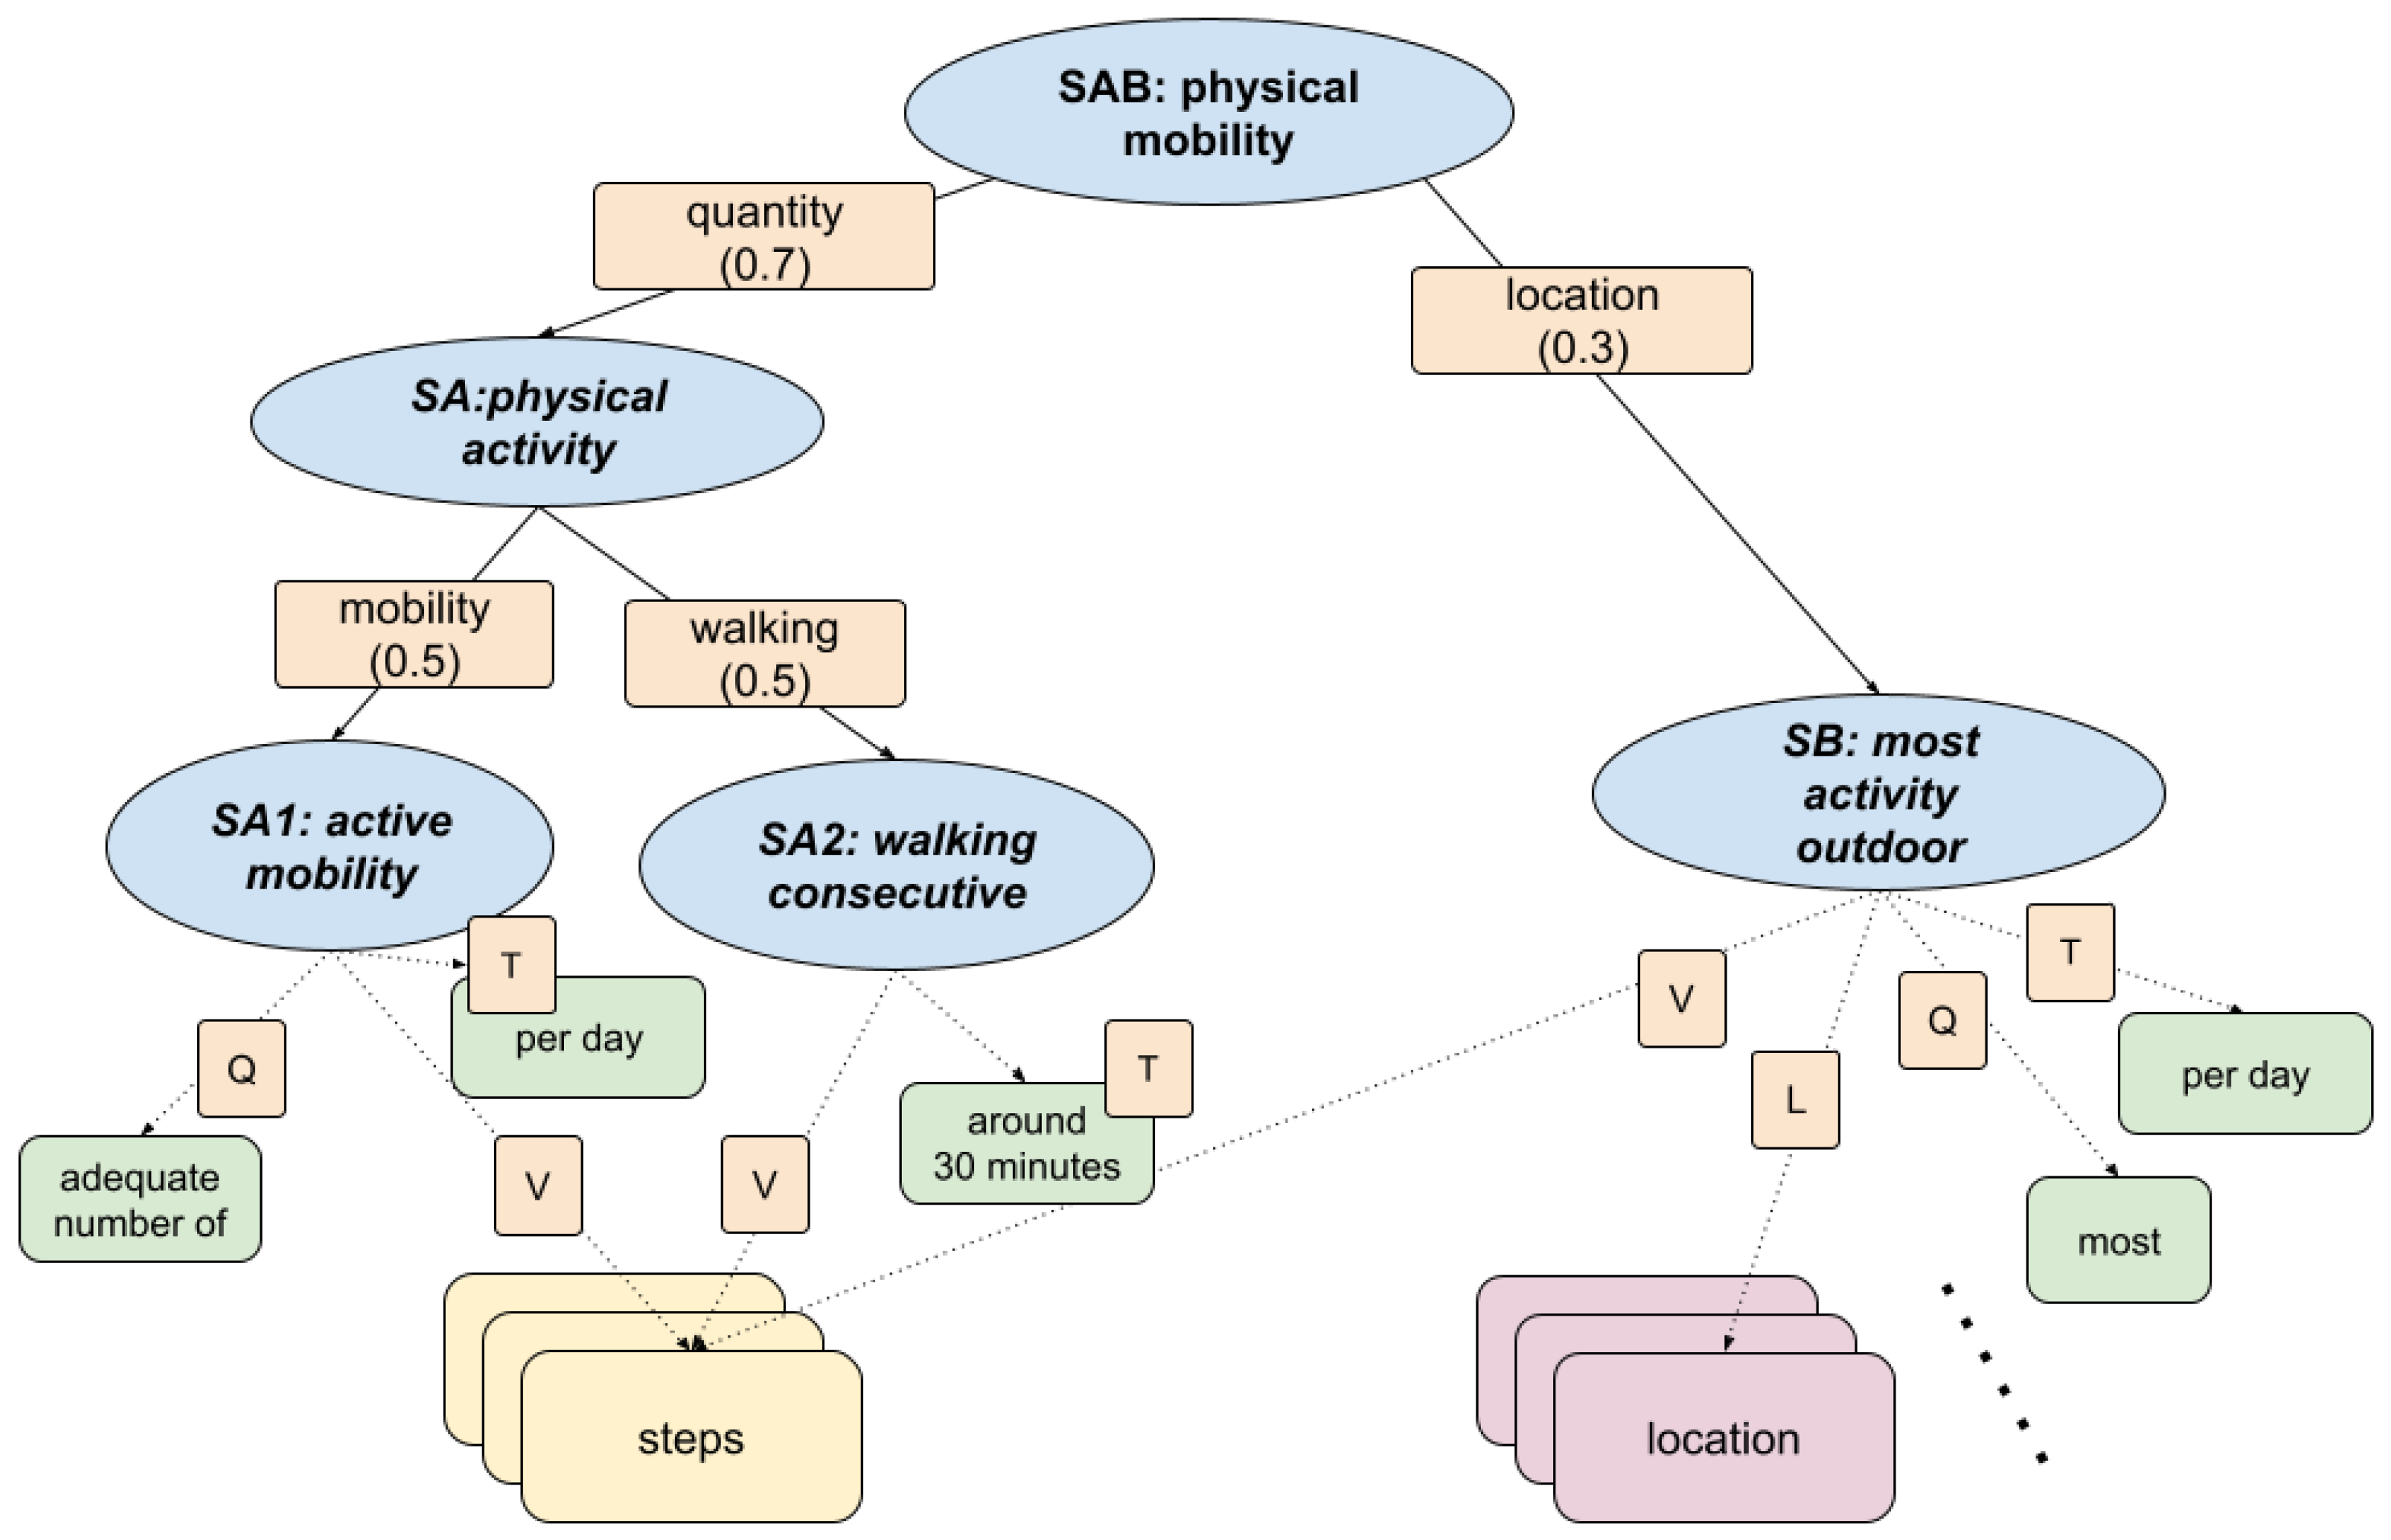
Figure 10.
Evolution of three-day of physical mobility indicators and the final Physical mobility indicator (highlighted). The overall score is limited by consistently low physical activity, but varies daily based on levels of outdoor activity.
Figure 10.
Evolution of three-day of physical mobility indicators and the final Physical mobility indicator (highlighted). The overall score is limited by consistently low physical activity, but varies daily based on levels of outdoor activity.
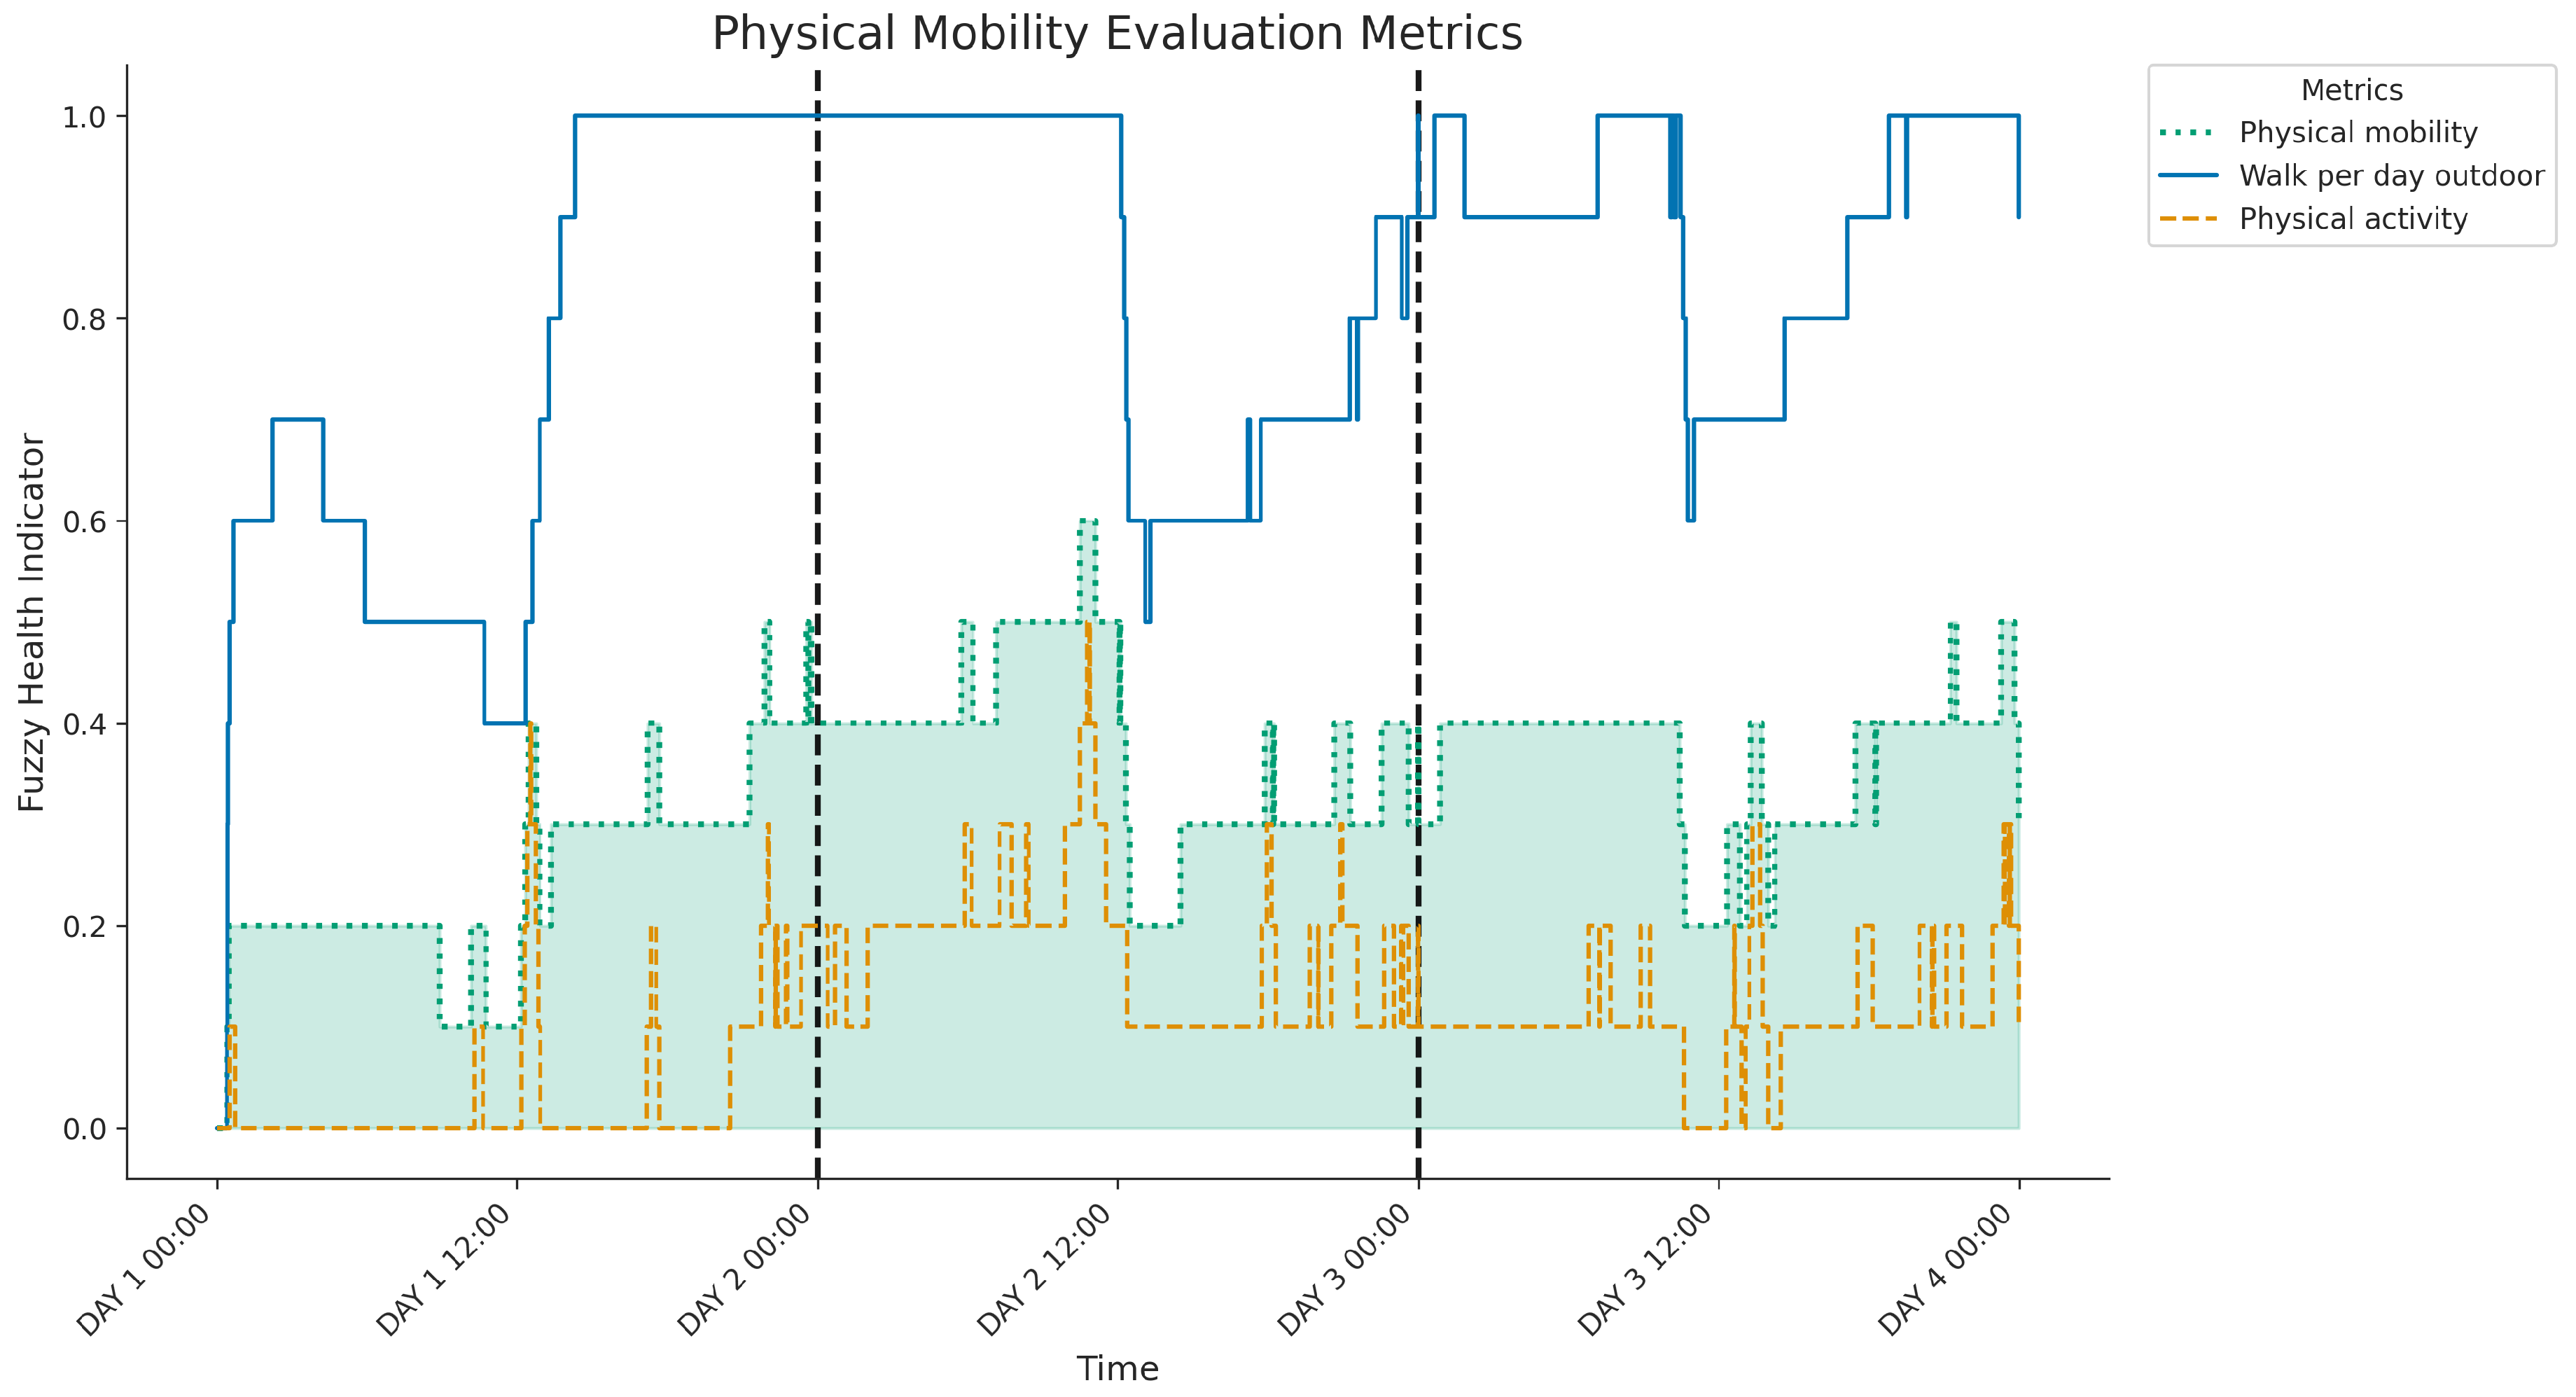
Figure 11.
Fuzzy knowledge graph for assessing caregiver presence and interaction. Two main dimensions—closeness and privacy—are integrated using spatial and proximity indicators.
Figure 11.
Fuzzy knowledge graph for assessing caregiver presence and interaction. Two main dimensions—closeness and privacy—are integrated using spatial and proximity indicators.
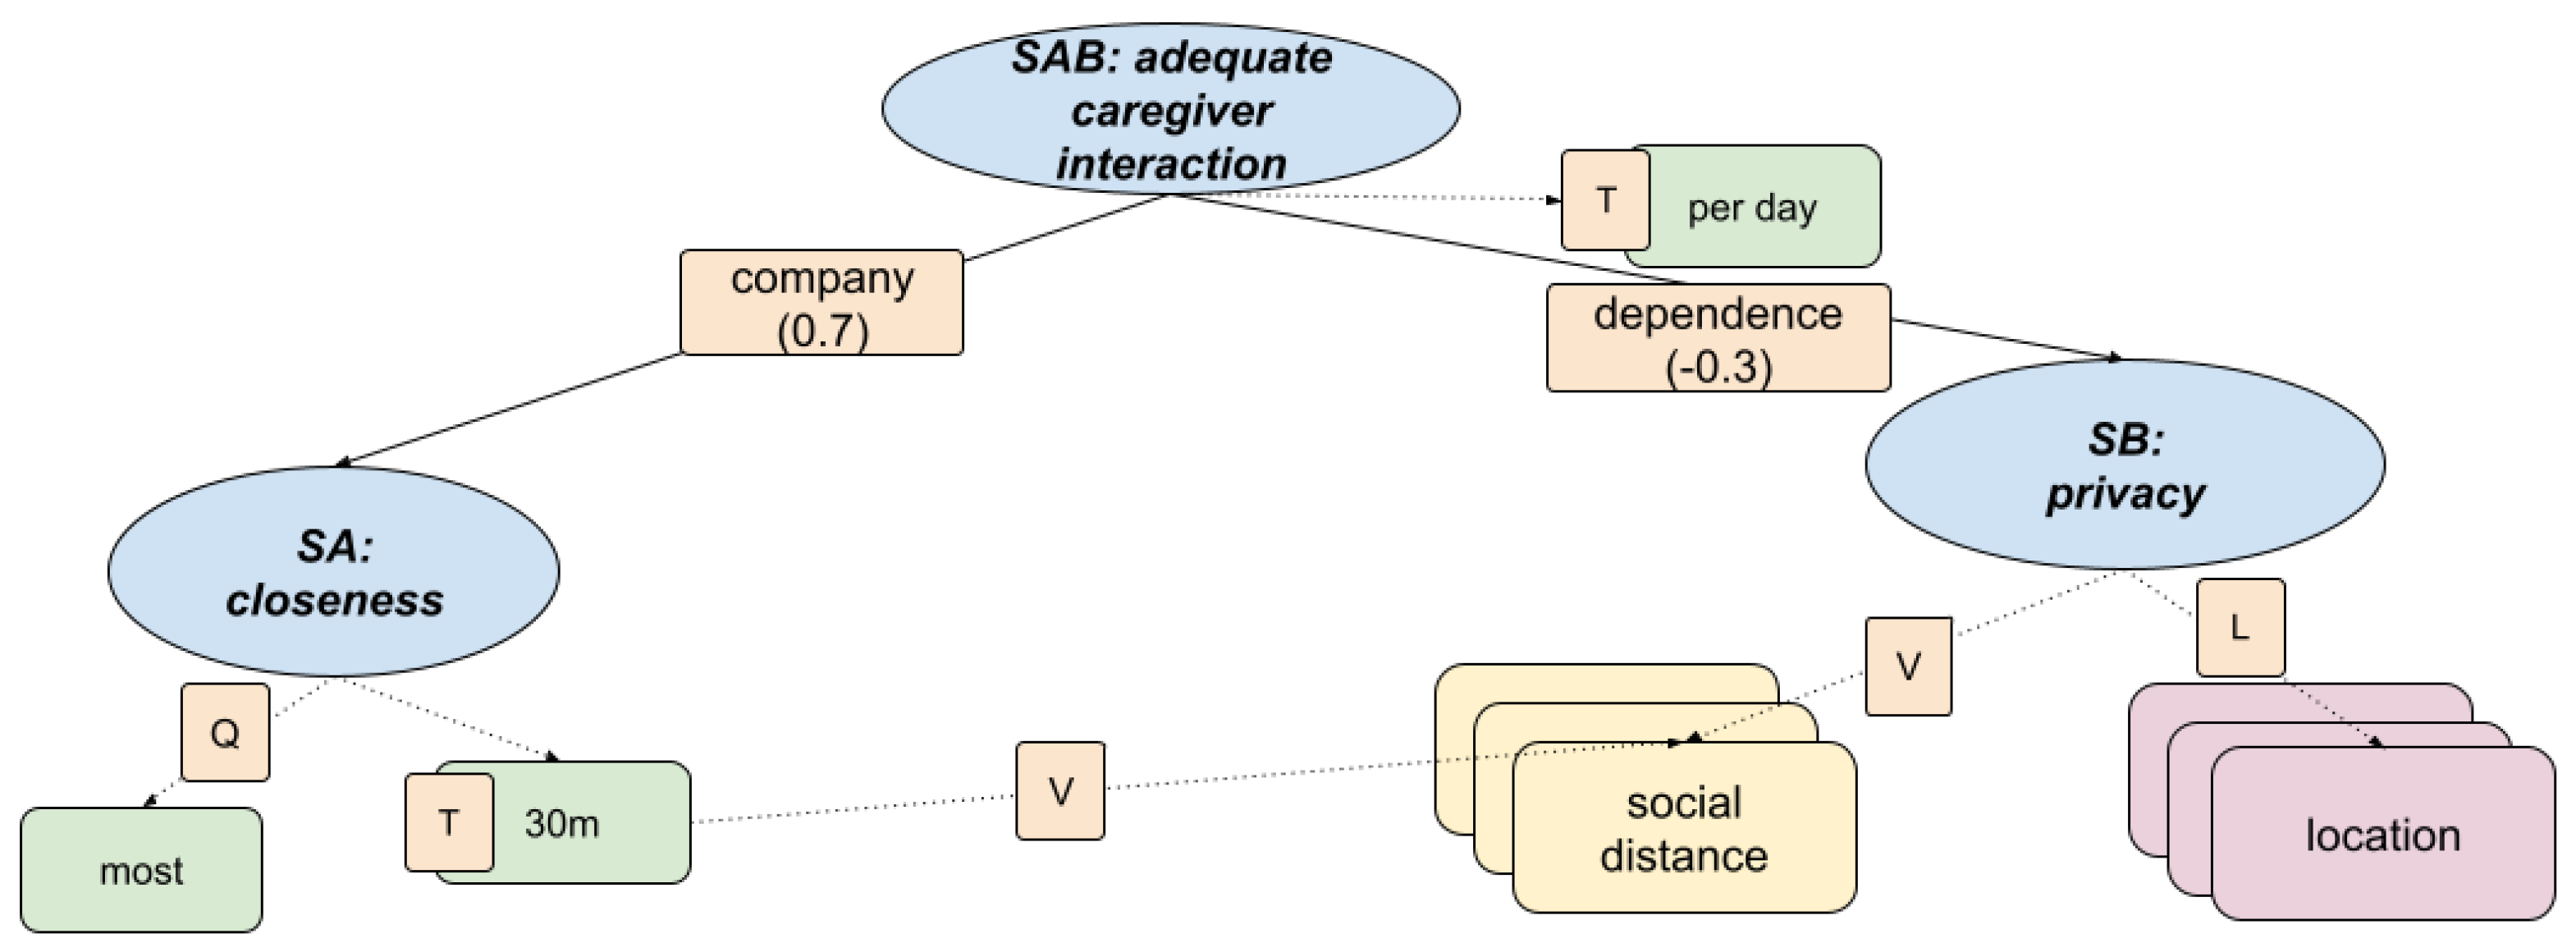
Figure 12.
Three-day evolution of caregiver presence metrics, showing components and the final Adequate caregiver interaction indicator (highlighted). The overall score reflects daily interaction intensity, peaking significantly higher on Days 2 and 3 compared to Day 1, coinciding with periods of elevated combined closeness and presence in private spaces.
Disclaimer/Publisher’s Note: The statements, opinions and data contained in all publications are solely those of the individual author(s) and contributor(s) and not of MDPI and/or the editor(s). MDPI and/or the editor(s) disclaim responsibility for any injury to people or property resulting from any ideas, methods, instructions or products referred to in the content. |
© 2025 by the authors. Licensee MDPI, Basel, Switzerland. This article is an open access article distributed under the terms and conditions of the Creative Commons Attribution (CC BY) license (http://creativecommons.org/licenses/by/4.0/).
Copyright: This open access article is published under a Creative Commons CC BY 4.0 license, which permit the free download, distribution, and reuse, provided that the author and preprint are cited in any reuse.


