
Submitted:
18 March 2025
Posted:
19 March 2025
You are already at the latest version
Abstract
(1) Background and objective: Mobility is crucial for healthy aging, and its loss significantly impacts the quality of life, healthcare costs, and mortality among older adults. Clinical mobility assessment methods, though precise, are resource-intensive and economically impractical and most of the existing solutions for automatic detection of mobility anomalies are either obtrusive, or improper for long time monitoring. This study explores the feasibility of using non-intrusive, low-cost binary sensors for continuous, remote detection of mobility anomalies in older adults, aiming to identify both sudden mobility events and gradual mobility loss. (2) Method: The study utilized publicly available datasets (CASAS Aruba and HH120) containing annotated activity data recorded from binary sensors installed in residential environments. After data preprocessing—including filtering irrelevant sensor events and aggregation into behaviorally meaningful places (BMPs)—a time series forecasting model (Prophet) was used to predict normal mobility patterns. A fuzzy inference module analyzed deviations between observed and predicted sensor data to determine the probability of mobility anomalies. (3) Results: The system effectively identified periods of prolonged inactivity indicative of potential falls or other mobility disruptions. Preliminary evaluation indicated a detection rate of approximately 77–81% for point mobility anomalies, with a false positive rate ranging from 12–16%. Additionally, the approach successfully detected simulated gradual declines in mobility (1% per day reduction), evidenced by statistically significant regression trends in activity levels over time. (4) Conclusion: The study argues that non-intrusive binary sensors, combined with lightweight forecasting models and fuzzy inference, may provide a practical and scalable solution for detecting mobility anomalies in older adults. Although performance can be further enhanced through improved data preprocessing, predictive modeling, and anomaly threshold tuning, the proposed system effectively addresses key limitations of existing mobility assessment approaches.
Keywords:
mobility loss
; binary sensors
; anomaly detection
; time series forecasting
; behaviorally meaningful places
1. Introduction
1.1. Background of This Study
Broadly defined as “one’s ability to move independently around their environment” [1], mobility is crucial for healthy aging and for the wellbeing of the elderly [2]. Limited mobility is an important predictor of hospitalization incidence, disability and mortality, leading to a significant increase in medical expenses and a decrease in quality of life [3].
Limitations in mobility increase with age, affecting 35% of people aged 70 and the majority of those over 85 [4].
Mobility is influenced by a range of interconnected factors. As people age, their physical abilities gradually decline. Changes in gait, balance, strength, and overall muscle function—often associated with conditions like sarcopenia—can significantly impact mobility. Beyond these physical changes, neuromuscular alterations also contribute to mobility decline. The loss of motor units, a reduction in muscle fiber size, and disruptions in nerve-muscle communication all make movement more challenging over time. At the same time, cognitive function plays an equally important role. Executive function, processing speed, and attention are essential for coordinated movement, and research suggests that cognitive decline can often predict mobility deterioration [5].
Psychological factors further influence mobility, particularly the fear of falling. When individuals become overly cautious due to this fear, they may limit their activities, unintentionally accelerating the decline in their mobility. Physical inactivity not only contributes to muscle weakening but also increases other health risks, further accelerating mobility loss.
In older adults, once mobility limitations occur, reversing them is difficult or even impossible. Therefore, early detection of mobility anomalies is crucial for effective care management and the planning of preventive interventions.
Various instruments have been developed to assess mobility in controlled clinical settings, including the Short Physical Performance Battery (SPPB), Timed Up and Go Test (TUG), Chair Rise Test (CRT), and gait analysis [6,7]. Although these tools provide valuable data, they are typically administered during periodic clinical visits and require specialized equipment and trained personnel. As a result, they may not capture day-to-day fluctuations in mobility or be practical for large-scale, continuous monitoring.
On the other hand, as the global population ages, conventional in-person mobility assessments may become a bottleneck due to limited healthcare resources and the need for specialized personnel. An automated system could ease this strain by enabling remote monitoring and early detection of mobility issues. Whether utilizing wearable sensors, computer vision, or smart home devices, such systems can continuously track mobility in everyday settings. By constantly analyzing movement patterns, they can detect subtle changes or deviations from an individual’s baseline, potentially signaling the onset of a mobility disorder or an increased risk of falls.
1.2. Brief Review of the Existing Solutions for Mobility Anomaly Detection
Recent technological advancements opened the way for a range of innovative solutions in the field of automated mobility monitoring. For example, the progress in sensor technology has enabled the creation of compact and accurate wearable devices. These devices can measure a variety of parameters—including acceleration, orientation, step count, blood pressure and oxygen saturation—and are designed to be seamlessly integrated into everyday clothing or accessories [8,9,10]. In parallel, video cameras along with sophisticated computer vision algorithms are now capable of monitoring gait and other movements [11,12]. When combined with the Internet of Things (IoT), these sensors can transmit real-time data to cloud-based platforms, for analysis. Furthermore, artificial intelligence (AI) and machine learning algorithms play a crucial role in processing the vast amounts of data generated [13,14]. These systems can detect patterns and anomalies that may indicate emerging mobility issues including falls [15,16], and over time, machine learning models become increasingly adept at recognizing subtle deviations from an individual’s typical movement patterns [17,18,19].
Starting from the general definition of anomalies as “patterns in data that do not conform to an expected or well-defined notion of normal behavior” [20], it is important to recognize that detecting such deviations in smart homes depends on the data collected from various sensors. Consequently, existing solutions for mobility anomaly detection can be logically categorized by the type of sensors used—namely, wearable, ambient, and video sensors—each offering a distinct perspective on resident mobility and behavior.
Alternatively, existing solutions can be classified according to the specific facet of mobility anomaly they target. For instance, while many studies focus on fall detection, others are designed to identify prolonged immobility or detect changes in gait. Based on a brief, nonsystematic review of the literature, Table 1 summarizes some of the the most frequently addressed mobility anomalies, the sensor types employed, and the corresponding references.
Data in Table 1 makes it evident that no single sensor can capture every facet of mobility anomaly. Each sensor type has its strengths and limitations, often stemming from the nature of the data it produces. For instance, video sensors (e.g., RGB or depth cameras) generally provide highly detailed information about a person’s posture, movements, and even facial expressions—making them valuable for tasks like fine-grained gait analysis or precise fall detection. However, these sensors are also intrusive, raising privacy and ethical concerns, and often require significant computational resources to process video streams in real time.
In contrast, binary sensors, like passive infrared sensors (PIR), door contacts or pressure/force sensors in floors or insoles tend to be far less intrusive, yet, the data they provide is much coarser; for example, PIR sensors merely detect presence or absence of motion, while force sensors can register weight shifts without capturing detailed limb movements. This more abstract level of information can suffice for broad anomaly detection (e.g., detecting a lack of movement over time), but it may be insufficient for identifying subtle changes in gait or for distinguishing between a genuine fall and a person sitting abruptly.
Likewise, wearable sensors such as accelerometers and gyroscopes capture continuous, individualized data on movement dynamics, but they depend on user compliance (e.g., remembering to wear the device) and can sometimes be uncomfortable or inconvenient for older adults. Even among these wearable solutions, battery life, data accuracy, and signal drift can pose additional challenges.
Hence, the choice of solution for mobility anomaly detection is not merely about technical feasibility; it also involves practical, ethical, and user-related considerations.
Pavel et al. in [46] identified the following essential constraints and design principles for such systems:
- Economical Feasibility – The system should be affordable for at-risk individuals (e.g., seniors and their families) or covered by the healthcare financing system to ensure accessibility.
- Scalability – It should be cost-effective and capable of being deployed widely to benefit large populations.
- Unobtrusiveness – The monitoring should be as transparent as possible to the individual. Ideally, no wearable or carried devices should be required, relying instead on passive sensors or cameras.
- Continuity of Sensing – The system should collect data frequently or continuously to track patient-specific trends and enable just-in-time interventions.
- Usability – The system should be easy to install, operate, and maintain, requiring minimal effort. It should have features like portability, long battery life, and self-calibration.
- Adaptability – The system must adjust to individual users, various locations, and changing environmental conditions.
- Self-Checking – It should have the capability to monitor and assess its own performance for reliability.
- High Sensitivity and Specificity (Low False Alarms) – Accuracy is critical to avoid excessive false alarms while maintaining effective monitoring and event detection.
- Privacy and Security – The system must ensure the security and privacy of both individuals and care teams. This includes authentication, data sharing policies, and protection against unauthorized access.
- Workflow Integration – The system must seamlessly integrate into provider and caregiver workflows without creating additional burdens.
In what concerns the actual methods for anomaly detection, a variety of taxonomies have been proposed (see [20,47]), but regardless of different sensor-based and anomaly-specific classifications, it is useful to look at how anomaly detection itself is conceptually structured. Anomaly detection methods generally follow three main steps:
- Defining the norm (i.e., characterizing what “normal” mobility looks like),
- Estimating deviations from that norm (using measures such as distances, probabilities, or reconstruction errors),
- Determining a decision threshold (fixed or dynamically adapted) that marks the boundary between normal and abnormal behavior.
We synthesized in Figure 1 the methods commonly used in each of these steps.
1.3. Objective of This Study
While binary sensors inherently lack the fine-grained detail necessary to capture subtle nuances in gait and balance, their low cost, unobtrusiveness, and ease of deployment for continuous, long-term monitoring present a compelling case for their use. Empirical evidence suggests that these sensors can reliably detect critical mobility anomalies, such as prolonged periods of inactivity that may indicate falls or rapid declines in mobility, as well as sudden shifts in the living space occupancy that disrupt established activity patterns.
In this context, the objective of the present study is to explore the feasibility, usability and adaptability of a solution for long-term monitoring and detection of mobility loss based exclusively on non-intrusive, low-cost, binary sensors, compatible with nearly any living space and offering maximum usability and adaptability.
2. Method and Datasets
2.1. Assumptions
The first assumption underpinning this study is that human mobility is, to a certain extent, predictable. This premise is supported by the seminal work [48], which demonstrated that the theoretical upper limit of predictability for outdoor human mobility is as high as 93%, and by the findings reported in [49], who predicted the next sensor event in the context of indoor mobility tracking with an accuracy of 79-82% in single-resident households.
It is likely that prediction accuracy in real-life applications is lower than the figures cited above, owing to individual variability, sensor noise, and inherent randomness. Nonetheless, human daily activities exhibit significant regularity, which can be learned and predicted, and can serve as a baseline for anomaly detection algorithms.
The second assumption underlying this study is that even a gradual decline in mobility can be detected by monitoring daily activity levels. Studies using in-home sensor networks have demonstrated that reduced daily movements—such as fewer room transitions and longer periods of inactivity—often correlate with declines in clinical measures of mobility. For example, the authors of [50] monitored seniors’ activity over extended periods and found that decreases in sensor-recorded activity were associated with lower scores on standardized assessments of instrumental activities of daily living (IADL), a proxy for functional mobility.
2.2. Datasets and Preprocessing
To assess the feasibility of the solutions proposed in this study, we employed two publicly available datasets—specifically, the Aruba and HH120 testbeds from the CASAS dataset [51]. Both testbeds use binary sensors for monitoring the activity of a single resident and feature partial annotations. Aruba dataset contains data recorded over a period of 220 days, while HH120 contains data for only 64 days of monitoring. The raw data are provided as a text file, with each line representing a sensor event structured as follows:
For the Aruba testbed: Timestamp, Sensor_ID, Sensor_Event, Activity
For the HH120 testbed: Timestamp, Sensor_ID, Location, Sensor_Event, Activity
Data from temperature and light sensors, not directly related with the mobility of the resident were filtered out from the raw dataset during the preprocessing phase. Additionally, at this stage, we filtered out all OFF-type events recorded by the motion sensors and all CLOSE-type events recorded by the door contact sensors. To mitigate sensor noise, if two successive events recorded by a given sensor were separated by less than one minute, we eliminated the second event in the sequence. Finally, we considered one-hour time intervals and counted the events recorded by each sensor within each interval. This resulted in a CSV file with the following structure:
Date, Hour, Events_count_M001, Events_count_M002, …, Events_count_D003
2.3. An Abstraction of the Residential Space
In our previous works [42,52], we argued that, when describing residential living space, a distinction should be made between ‘locations’ and ‘places’, where places are defined as locations imbued with meaning by users, according to their needs, preferences, habits, or values. Rather than being mere physical coordinates, places are shaped by human activity and the intentional decisions behind why people occupy them and for how long. Building on this idea, residential living spaces can be abstracted as a collection of behaviorally meaningful places (BMPs)—such as the living room, bedroom, kitchen, bathroom, and circulation areas - each reflecting the user's daily activities and routines. By omitting details like the particular layout of the living space, the arrangement of furniture and appliances, and the precise positioning of sensors—this model establishes a framework for monitoring the activities of daily life (ADLs) in nearly any residential setting.
With this abstraction, the set of sensors associated with a specific BMPs can be treated as a single compound sensor reporting all the events recorded in the respective place. For example, for the sensor layout in the Aruba house from the CASAS dataset, we defined five BMPs and assigned the sensors as shown in Figure 2.
If {Pi} is the set of sensor events recorded in the place Pi, and {Sj} is the set of events generated by sensor Sj, then:
| {P1} = {M001} ∪ {M002} ∪ {M003} ∪ {M005} ∪ {M006 ∪ {M007} ∪ {M023} ∪ {M024} | (1) |
| {P2} = {M004} ∪ {M029} ∪ {M031} | |
| {P3} = {M014} ∪ {M015} ∪ {M017} ∪ {M018} ∪ {M019} | |
| {P4} = {M009} ∪ {M010} ∪ {M012} ∪ {M013} ∪ {M025} ∪ {M026} ∪ {M027} ∪ {M028} | |
| {P5} = {D001} ∪ {D002} ∪ {D003} ∪ {D004} ∪ {M008} ∪ {M011} ∪ {M021} ∪ {M022} ∪ {M030} |
Similarly, for the HH120 testbed the sensor-to_BMP assignemnt is:
| {P1} = {M009} ∪ {M010} ∪ {M011} ∪ {MA016} | (2) |
| {P2} = {M008} ∪ {M018} | |
| {P3} = {MA017} | |
| {P4} = {M003} ∪ {M004} ∪ {M005} ∪ {M006} ∪ {M007} ∪ {M026} ∪ {MA015} | |
| {P5} = {D002} ∪ {D004} ∪ {M001} ∪ {M002} ∪ {M011} |
2.4. Encoding the Activity Starting from Sensor Data
Considering that all sensors have binary output, if is the cardinal of the set of events {Pi} recorded in the place Pi within a specified time slice tk, then the overall activity in the entire space is described by a vector in a 5-dimensional space
and the intensity level of the activity (AL) can be estimated by the L2 norm of this vector:
For simplicity, we defined the duration of the time slices, tk, as one hour. The successive values of A(tk) constitute a time series that synthesizes the spatiotemporal distribution of the monitored individual's activity over the entire observation period.
2.5. Detecting Mobility Loss
The data processing flow for detecting mobility loss is shown in Figure 3.
Having the data on the spatiotemporal activity of the monitored person structured as a time series A(t1), A(t2), … A(tn), it is possible to forecast values of the series for the next time slice PA(tn+1). By comparing these values with the observed data for the respective time interval OA(tn+1), for example by means of the Euclidean distance:
we get a measure of the deviation of the current distribution of activities across BMPs from the learned activity routine. Since we are only interested in potential mobility loss, i.e. deviations towards lower intensities of activities, we compute the observed activity level OAL as:
where AL is calculated with (3) and HAL is the average of the values of AL for the corresponding hour of the day across the entire training dataset. Using OAL and Dist as input variables, we implemented a simple fuzzy reasoning module with three fuzzy domains and linear membership functions as shown in Figure 4.
The output of this modules is the probability of a mobility anomaly (PA), estimated according to the rule base shown in Table 2.
If PA is higher than a tunable threshold, an alert flag is set.
Algorithm 1 listed below synthesizes the entire data processing workflow for detecting sudden mobility loss.
| Algorithm 1. Data processing workflow for detecting point mobility anomalies |
| BEGIN |
| // === Step 1: Data Preprocessing === |
| // Load raw sensor data (each record: Timestamp, Sensor_ID, Sensor_Event, etc.) |
| raw_data ← LOAD_SENSOR_DATA("raw_sensor_file.txt") |
| // Filter out sensors not related to mobility (e.g., temperature, light) |
| filtered_data ← FILTER(raw_data, sensor_type NOT IN {"temperature", "light"}) |
| // Remove unwanted events: |
| // - Exclude OFF events for motion sensors. |
| // - Exclude CLOSE events for door sensors. |
| filtered_data ← FILTER(filtered_data, |
| (sensor_category = "motion" AND event_type ≠ "OFF") AND |
| (sensor_category = "door" AND event_type ≠ "CLOSE")) |
| // Mitigate sensor noise: |
| // For each sensor, if two successive events occur within 60 seconds, remove the second. |
| debounced_data ← DEBOUNCE(filtered_data, time_threshold = 60 seconds) |
| // Aggregate events: |
| // Count the number of events per sensor in one-hour intervals. |
| hourly_counts ← AGGREGATE(debounced_data, interval = "1 hour") |
| // === Step 2: Abstract Residential Space into Behaviorally Meaningful Places (BMPs) === |
| // Define sensor-to-BMP mappings: |
| BMP1_sensors ← {M001, M002, M003, M005, M006, M007, M023, M024} |
| BMP2_sensors ← {M004, M029, M031} |
| BMP3_sensors ← {M014, M015, M017, M018, M019} |
| BMP4_sensors ← {M009, M010, M012, M013, M025, M026, M027, M028} |
| BMP5_sensors ← {D001, D002, D003, D004, M008, M011, M021, M022, M030} |
| // For each time interval, sum events per BMP. |
| FOR each time_interval IN hourly_counts DO |
| P1 ← SUM_EVENTS(hourly_counts[time_interval], sensors IN BMP1_sensors) |
| P2 ← SUM_EVENTS(hourly_counts[time_interval], sensors IN BMP2_sensors) |
| P3 ← SUM_EVENTS(hourly_counts[time_interval], sensors IN BMP3_sensors) |
| P4 ← SUM_EVENTS(hourly_counts[time_interval], sensors IN BMP4_sensors) |
| P5 ← SUM_EVENTS(hourly_counts[time_interval], sensors IN BMP5_sensors) |
| // Construct the activity vector A(tk) for this interval |
| activity_vector[time_interval] ← [P1, P2, P3, P4, P5] |
| END FOR |
| // === Step 3: Encode Activity Level === |
| // Compute the overall activity level (AL) as the L2 norm of the activity vector. |
| FOR each time_interval IN activity_vector DO |
| AL[time_interval] ← SQRT( (P1)^2 + (P2)^2 + (P3)^2 + (P4)^2 + (P5)^2 ) |
| END FOR |
| // === Step 4: Predict and Compare Activity for Mobility Loss Detection === |
| // Assume a predictive model is available, trained on historical activity data. |
| FOR each new time interval t DO |
| // Predict the activity vector for the next interval |
| predicted_vector ← PREDICT_ACTIVITY(activity_vector, current_time = t) |
| // Retrieve the observed activity vector for the next interval |
| observed_vector ← activity_vector[t + 1] |
| // Compute Euclidean distance (Dist) between predicted and observed vectors |
| Dist ← SQRT( SUM( (observed_vector[i] - predicted_vector[i])^2 for i = 1 to 5 ) ) |
| // Compute Observed Activity Level ratio (OAL) |
| // HAL is the historical average AL for the corresponding hour (from training data) |
| HAL ← HISTORICAL_AVERAGE_AL(hour = t + 1) |
| OAL ← AL[t + 1] / HAL |
| // === Step 5: Fuzzy Inference for Mobility Anomaly === |
| // Use OAL and Dist as input to a fuzzy reasoning module. |
| // The module applies linear membership functions (LOW, MEDIUM, HIGH) and a rule base. |
| PA ← FUZZY_INFERENCE_MODULE(OAL, Dist) |
| // Output the estimated probability of mobility anomaly for this interval |
| OUTPUT(time = t + 1, anomaly_probability = PA) |
| IF (PA>ALERT_THRESHOLD) THEN ALERT_FLAG=TRUE |
| END FOR |
| END |
To detect gradual mobility loss, we employed a statistical approach: we first computed the daily average of the values of AL given by (4), then performed a linear regression on these averaged values over a 21-day period, and analyzed the slope of the regression line.
3. Results
3.1. Selecting the Forecasting Model
Time-series forecasting is a well-established research field with many solutions reporting remarkable forecasting accuracy [53,54]. However, the precision of the predictions often comes at a cost in terms of computational load and an increased risk of overfitting, and additionally requires large training datasets. Therefore, in order to identify a lightweight forecasting model aligned with the usability and adaptability requirements stated above, and suitable for the selected datasets, we evaluated several models recognized in existing studies as effective for relatively short time series namely: Seasonal Autoregressive Integrated Moving Average (SARIMA), Support Vector Regression (SVR), Vector Autoregression (VAR), Random Forest (RF), and Prophet. For this purpose, we computed the Root Mean Squared Error (RMSE) of the forecasts across the entire test dataset. The results are shown in Table 3.
Considering these results and the requirement for minimal tuning when switching between datasets, we selected Prophet as the forecasting model. See Figure 5 for an illustration of the performances of the selected model.
3.2. Detecting Point Mobility Anomalies
The datasets utilized in this study were generated by monitoring healthy individuals and thus inherently lack anomalies. Nevertheless, given that these datasets are annotated, it is possible to precisely identify intervals characterized by reduced activity, corresponding either to temporary absences from home (outings) or to relaxation periods explicitly marked in annotations.
By selecting an appropriate threshold for anomaly probability (e.g., PA > 0.7), the proposed system can effectively detect these inactivity periods as point mobility anomalies. To evaluate the capability of our proposed method to detect such anomalies, we examined the Aruba test dataset over a period of 21 days, identifying 60 instances of inactivity lasting longer than one hour. Similarly, within the HH120 dataset, during an identical timeframe of 21 days, we found 36 periods of inactivity exceeding one hour.
Nighttime sleep intervals were excluded from the analysis. The results of this evaluation are presented in Table 4, where TP (True Positives) is the number of actual anomalies correctly detected, FN (False Negatives) is the number of actual anomalies that were missed by the detector, FP (False Positives) is the number of normal instances incorrectly flagged as anomalies, and TN (True Negatives) is the number of normal instances correctly identified as non-anomalous. With these values, we computed:
3.3. Detecting Gradual Decline in Mobility
To assess the capability of the described system in detecting gradual loss of mobility, we calculated the daily mean of hourly activity intensity values (AL) using equation (4) over a period of 21 days. Subsequently, we applied a daily percentage reduction of 1% to the Daily Activity Level (DAL) values. A scatter plot of DAL values across the 21-day interval was generated, followed by performing linear regression analysis on the plotted points. The slope of the regression line was then highlighted to illustrate the mobility trend (see Figure 6).
Besides the slope of the trend line, the system displays additional regression parameters, such as the coefficient of determination R2, and the p-value that provide insight into the magnitude and the statistical significance of the observed mobility decline.
4. Discussion
The results of this study support the feasibility of a long-term monitoring system for detecting mobility anomalies in older adults using exclusively binary sensors. Such a system offers several key advantages—including low cost, unobtrusiveness, adaptability, and scalability—that are crucial for widespread adoption in real-life scenarios.
Although the system’s performance in detecting point anomalies is modest compared to solutions based on video sensors or wearables, there is considerable potential for improvement in the following areas:
- The number and placement of sensors have a major influence on system performance. Interestingly, the presence of additional sensors in the Aruba testbed did not necessarily lead to better detection outcomes. In fact, when sensors within a single BMP reported a high number of events per hour, challenging spikes were created that proved difficult to predict, thereby reducing the overall predictive accuracy as measured by RMSE. Additional filtering methods during the preprocessing phase could mitigate these spikes, reduce sensor noise, and consequently improve predictive accuracy. Nevertheless, a minimal redundancy in sensor count is beneficial, as it ensures remarkable robustness against sensor faults. During testing, we removed one sensor from each BMP without noticeably affecting anomaly detection accuracy.
- Prediction accuracy is critical for overall system performance, thus the selection of the Prophet model not definitive. The Prophet model does demonstrate strong performance in capturing daily and weekly seasonality and robustness in handling outliers. However, alternative predictive models capable of managing multivariate inputs might yield even better results.
- Although the observed detection rate for point mobility anomalies (prolonged inactivity) was modest (approximately 77–81%), it is important to note that the system outputs a probability of anomaly (PA) rather than a simple binary flag. The tunable threshold for PA significantly influences detection performance. For example, lowering the anomaly probability threshold from 0.7 to 0.65 increased the detection rate to approximately 92% for the Aruba dataset, albeit with a concurrent rise in the false positive rate to about 20%. Proper tuning, tailored to the specific routine of the monitored individual and the sensor distribution, ensures an optimal trade-off between detection sensitivity and false positive rate.
- Another area with considerable potential for improvement is the fuzzy inference system employed in this study. The current configuration is the simplest possible, comprising only three fuzzy domains with linear membership functions and minimal tuning. Introducing additional fuzzy domains and personalized tuning for specific individuals is likely to yield enhanced anomaly detection outcomes.
- The selection of a one-hour time interval for constructing time series from sensor events is arbitrary and directly influences the system's latency. Future research should examine the impact of opting for shorter time intervals. Alternatively, the possibility of defining variable-length “behaviorally significant time intervals” (e.g., sleep time, morning routine, peak activity period, daytime rest, etc.) could be investigated.
The limitations listed above can be relatively easily overcome, and the proposed system remains noteworthy as it provides a unified framework for detecting both point anomalies and gradual declines in mobility.
5. Conclusions
This study addresses the growing need for smart home-based health monitoring solutions by defining a scalable, economical, and non-intrusive approach for detecting mobility loss in older adults. The proposed method, which combines binary sensors with a lightweight forecasting model, offers an efficient solution to overcome the limitations associated with periodic clinical assessments.
Future work should focus on refining the anomaly detection algorithms to enhance specificity, possibly by integrating contextual data, adopting more sophisticated fuzzy inference mechanisms, or exploring alternative forecasting models that leverage multivariate inputs. Additionally, real-world deployment trials involving diverse older populations are necessary to validate the system's effectiveness and user acceptability in everyday living environments. The potential integration of complementary sensor modalities, such as wearables for occasional calibration or advanced deep learning methods for improved forecasting accuracy, should also be considered.
Author Contributions
Conceptualization, I.S. and A.C.; methodology, E.P. and A.I.; software, A.I., C.A. and P.I.; validation, I.S. and E.P.; data curation, A.C. and A.I.; writing—original draft preparation, I.S.; writing—review and editing, E.P. and A.C.; visualization, A.I. and C.A.; supervision, I.S. All authors have read and agreed to the published version of the manuscript.
Funding
This research received no external funding.
Institutional Review Board Statement
Not applicable.
Data Availability Statement
The data presented in this study were derived from the following resources available in the public domain: CASAS Activity Recognition Datasets. Available online: https://data.casas.wsu.edu/download/ (retrieved 08 January 2025).
Conflicts of Interest
The authors declare no conflicts of interest.
References
- Mitchell, J.A.; Johnson-Lawrence, V.; Williams, E.-D.G.; Thorpe, R. Characterizing Mobility Limitations Among Older African American Men. Journal of the National Medical Association 2018, 110, 190–196. [Google Scholar] [CrossRef] [PubMed]
- Chua, C.S.W.; Lim, W.M.; Teh, P.-L. An Aging and Values-Driven Theory of Mobility. Activities, Adaptation & Aging 2023, 47, 397–413. [Google Scholar] [CrossRef]
- Hardy, S.E.; Kang, Y.; Studenski, S.A.; Degenholtz, H.B. Ability to Walk 1/4 Mile Predicts Subsequent Disability, Mortality, and Health Care Costs. J GEN INTERN MED 2011, 26, 130–135. [Google Scholar] [CrossRef] [PubMed]
- Freiberger, E.; Sieber, C.C.; Kob, R. Mobility in Older Community-Dwelling Persons: A Narrative Review. Front. Physiol. 2020, 11, 881. [Google Scholar] [CrossRef]
- Demnitz, N.; Hogan, D.B.; Dawes, H.; Johansen-Berg, H.; Ebmeier, K.P.; Poulin, M.J.; Sexton, C.E. Cognition and Mobility Show a Global Association in Middle- and Late-Adulthood: Analyses from the Canadian Longitudinal Study on Aging. Gait & Posture 2018, 64, 238–243. [Google Scholar] [CrossRef]
- Chung, J.; Demiris, G.; Thompson, H.J. Instruments to Assess Mobility Limitation in Community-Dwelling Older Adults: A Systematic Review. Journal of Aging and Physical Activity 2015, 23, 298–313. [Google Scholar] [CrossRef] [PubMed]
- Braun, T.; Thiel, C.; Peter, R.S.; Bahns, C.; Büchele, G.; Rapp, K.; Becker, C.; Grüneberg, C. Association of Clinical Outcome Assessments of Mobility Capacity and Incident Disability in Community-Dwelling Older Adults - a Systematic Review and Meta-Analysis. Preprint 2022. [Google Scholar] [CrossRef]
- Stavropoulos, T.G.; Papastergiou, A.; Mpaltadoros, L.; Nikolopoulos, S.; Kompatsiaris, I. IoT Wearable Sensors and Devices in Elderly Care: A Literature Review. Sensors 2020, 20, 2826. [Google Scholar] [CrossRef]
- Javaid, M.; Haleem, A.; Rab, S.; Pratap Singh, R.; Suman, R. Sensors for Daily Life: A Review. Sensors International 2021, 2, 100121. [Google Scholar] [CrossRef]
- Liu, Z.; Kong, J.; Qu, M.; Zhao, G.; Zhang, C. Progress in Data Acquisition of Wearable Sensors. Biosensors 2022, 12, 889. [Google Scholar] [CrossRef]
- Salcedo, E. Computer Vision-Based Gait Recognition on the Edge: A Survey on Feature Representations, Models, and Architectures. J. Imaging 2024, 10, 326. [Google Scholar] [CrossRef]
- Chen, B.; Chen, C.; Hu, J.; Sayeed, Z.; Qi, J.; Darwiche, H.F.; Little, B.E.; Lou, S.; Darwish, M.; Foote, C.; et al. Computer Vision and Machine Learning-Based Gait Pattern Recognition for Flat Fall Prediction. Sensors 2022, 22, 7960. [Google Scholar] [CrossRef] [PubMed]
- Cantone, A.A.; Esposito, M.; Perillo, F.P.; Romano, M.; Sebillo, M.; Vitiello, G. Enhancing Elderly Health Monitoring: Achieving Autonomous and Secure Living through the Integration of Artificial Intelligence, Autonomous Robots, and Sensors. Electronics 2023, 12, 3918. [Google Scholar] [CrossRef]
- Facchinetti, G.; Petrucci, G.; Albanesi, B.; De Marinis, M.G.; Piredda, M. Can Smart Home Technologies Help Older Adults Manage Their Chronic Condition? A Systematic Literature Review. IJERPH 2023, 20, 1205. [Google Scholar] [CrossRef] [PubMed]
- Vaiyapuri, T.; Lydia, E.L.; Sikkandar, M.Y.; Díaz, V.G.; Pustokhina, I.V.; Pustokhin, D.A. Internet of Things and Deep Learning Enabled Elderly Fall Detection Model for Smart Homecare. IEEE Access 2021, 9, 113879–113888. [Google Scholar] [CrossRef]
- Gharghan, S.K.; Hashim, H.A. A Comprehensive Review of Elderly Fall Detection Using Wireless Communication and Artificial Intelligence Techniques. Measurement 2024, 226, 114186. [Google Scholar] [CrossRef]
- Figueiredo, J.; Carvalho, S.P.; Goncalve, D.; Moreno, J.C.; Santos, C.P. Daily Locomotion Recognition and Prediction: A Kinematic Data-Based Machine Learning Approach. IEEE Access 2020, 8, 33250–33262. [Google Scholar] [CrossRef]
- Mennella, C.; Maniscalco, U.; Pietro, G.D.; Esposito, M. A Deep Learning System to Monitor and Assess Rehabilitation Exercises in Home-Based Remote and Unsupervised Conditions. Computers in Biology and Medicine 2023, 166, 107485. [Google Scholar] [CrossRef]
- Gonçalves, C.; Lopes, J.M.; Moccia, S.; Berardini, D.; Migliorelli, L.; Santos, C.P. Deep Learning-Based Approaches for Human Motion Decoding in Smart Walkers for Rehabilitation. Expert Systems with Applications 2023, 228, 120288. [Google Scholar] [CrossRef]
- Chandola, V.; Banerjee, A.; Kumar, V. Anomaly Detection: A Survey. ACM Comput. Surv. 2009, 41, 1–58. [Google Scholar] [CrossRef]
- Momin, M.S.; Sufian, A.; Barman, D.; Dutta, P.; Dong, M.; Leo, M. In-Home Older Adults’ Activity Pattern Monitoring Using Depth Sensors: A Review. Sensors 2022, 22, 9067. [Google Scholar] [CrossRef] [PubMed]
- Fayad, M.; Hachani, M.-Y.; Ghoumid, K.; Mostefaoui, A.; Chouali, S.; Picaud, F.; Herlem, G.; Lajoie, I.; Yahiaoui, R. Fall Detection Approaches for Monitoring Elderly HealthCare Using Kinect Technology: A Survey. Applied Sciences 2023, 13, 10352. [Google Scholar] [CrossRef]
- Casilari, E.; Álvarez-Marco, M.; García-Lagos, F. A Study of the Use of Gyroscope Measurements in Wearable Fall Detection Systems. Symmetry 2020, 12, 649. [Google Scholar] [CrossRef]
- Liu, Z. Detecting Falls Through Convolutional Neural Networks Using Infrared Sensor and Accelerometer. In Proceedings of the 2023 IEEE 20th International Conference on Smart Communities: Improving Quality of Life using AI, Robotics and IoT (HONET), Boca Raton, FL, USA, 4 December 4 2023; IEEE: Boca Raton, FL, USA; pp. 152–155. [Google Scholar]
- Tao, S.; Kudo, M.; Nonaka, H. Privacy-Preserved Behavior Analysis and Fall Detection by an Infrared Ceiling Sensor Network. Sensors 2012, 12, 16920–16936. [Google Scholar] [CrossRef]
- Wu, L.; Huang, C.; Zhao, S.; Li, J.; Zhao, J.; Cui, Z.; Yu, Z.; Xu, Y.; Zhang, M. Robust Fall Detection in Video Surveillance Based on Weakly Supervised Learning. Neural Networks 2023, 163, 286–297. [Google Scholar] [CrossRef]
- Yagi, K.; Sugiura, Y.; Hasegawa, K.; Saito, H. Gait Measurement at Home Using a Single RGB Camera. Gait & Posture 2020, 76, 136–140. [Google Scholar] [CrossRef]
- Chakraborty, G.; Dendou, T. Analysis of Foot-Pressure Data to Classify Mobility Pattern. International Journal on Smart Sensing and Intelligent Systems 2014, 7, 1–6. [Google Scholar] [CrossRef]
- Scherf, L.; Kirchbuchner, F.; Von Wilmsdorff, J.; Fu, B.; Braun, A.; Kuijper, A. Step by Step: Early Detection of Diseases Using an Intelligent Floor. In Ambient Intelligence; Lecture Notes in Computer Science; Kameas, A., Stathis, K., Eds.; Springer International Publishing: Cham, 2018; Volume 11249, pp. 131–146. ISBN 978-3-030-03061-2. [Google Scholar]
- Yu, F.; Zheng, J.; Yu, L.; Zhang, R.; He, H.; Zhu, Z.; Zhang, Y. Adjustable Method for Real-Time Gait Pattern Detection Based on Ground Reaction Forces Using Force Sensitive Resistors and Statistical Analysis of Constant False Alarm Rate. Sensors 2018, 18, 3764. [Google Scholar] [CrossRef]
- Lin, Q.; Zhao, W.; Wang, W. Detecting Dementia-Related Wandering Locomotion of Elders by Leveraging Active Infrared Sensors. JCC 2018, 06, 94–105. [Google Scholar] [CrossRef]
- Cheng, C.; Yang, H. Multi-Scale Graph Modeling and Analysis of Locomotion Dynamics towards Sensor-Based Dementia Assessment. IISE Transactions on Healthcare Systems Engineering 2019, 9, 95–102. [Google Scholar] [CrossRef]
- Batista, E.; Borras, F.; Casino, F.; Solanas, A. A Study on the Detection of Wandering Patterns in Human Trajectories. In Proceedings of the 2015 6th International Conference on Information, Intelligence, Systems and Applications (IISA), Corfu, Greece, July 2015; IEEE, 2015; pp. 1–6. [Google Scholar]
- Lin, Q.; Zhang, D.; Huang, X.; Ni, H.; Zhou, X. Detecting Wandering Behavior Based on GPS Traces for Elders with Dementia. In Proceedings of the 2012 12th International Conference on Control Automation Robotics & Vision (ICARCV), Guangzhou, China, December 2012; IEEE, 2012; pp. 672–677. [Google Scholar]
- Dentamaro, V.; Gattulli, V.; Impedovo, D.; Manca, F. Human Activity Recognition with Smartphone-Integrated Sensors: A Survey. Expert Systems with Applications 2024, 246, 123143. [Google Scholar] [CrossRef]
- Sadri, A. Mining Changes in Mobility Patterns from Smartphone Data. In Proceedings of the 2016 IEEE International Conference on Pervasive Computing and Communication Workshops (PerCom Workshops), Sydney, Australia, March 2016; IEEE, 2016; pp. 1–3. [Google Scholar]
- Bieber, G.; Luthardt, A.; Peter, C.; Urban, B. The Hearing Trousers Pocket: Activity Recognition by Alternative Sensors. In Proceedings of the Proceedings of the 4th International Conference on Pervasive Technologies Related to Assistive Environments, Heraklion Crete Greece, 25 May 2011; ACM, 2011; pp. 1–6. [Google Scholar]
- Novak, M.; Binas, M.; Jakab, F. Unobtrusive Anomaly Detection in Presence of Elderly in a Smart-Home Environment. In Proceedings of the 2012 ELEKTRO, Rajeck Teplice, Slovakia, May 2012; IEEE, 2012; pp. 341–344. [Google Scholar]
- Eisa, S.; Moreira, A. A Behaviour Monitoring System (BMS) for Ambient Assisted Living. Sensors 2017, 17, 1946. [Google Scholar] [CrossRef] [PubMed]
- Moshtaghi, M.; Zukerman, I.; Russell, R.A. Statistical Models for Unobtrusively Detecting Abnormal Periods of Inactivity in Older Adults. User Model User-Adap Inter 2015, 25, 231–265. [Google Scholar] [CrossRef]
- Wilhelm, S.; Wahl, F. Emergency Detection in Smart Homes Using Inactivity Score for Handling Uncertain Sensor Data. Sensors 2024, 24, 6583. [Google Scholar] [CrossRef] [PubMed]
- Susnea, I.; Pecheanu, E.; Sandu, C.; Cocu, A. A Scalable Solution to Detect Behavior Changes of Elderly People Living Alone. Applied Sciences 2021, 12, 235. [Google Scholar] [CrossRef]
- Muurling, M.; Au-Yeung, W.-T.M.; Beattie, Z.; Wu, C.-Y.; Dodge, H.; Rodrigues, N.K.; Gothard, S.; Silbert, L.C.; Barnes, L.L.; Steele, J.S.; et al. Differences in Life Space Activity Patterns Between Older Adults With Mild Cognitive Impairment Living Alone or as a Couple: Cohort Study Using Passive Activity Sensing. JMIR Aging 2023, 6, e45876. [Google Scholar] [CrossRef]
- Alcalá, J.; Ureña, J.; Hernández, Á.; Gualda, D. Assessing Human Activity in Elderly People Using Non-Intrusive Load Monitoring. Sensors 2017, 17, 351. [Google Scholar] [CrossRef]
- Turimov Mustapoevich, D.; Kim, W. Machine Learning Applications in Sarcopenia Detection and Management: A Comprehensive Survey. Healthcare 2023, 11, 2483. [Google Scholar] [CrossRef]
- Pavel, M.; Jimison, H.B.; Wactlar, H.D.; Hayes, T.L.; Barkis, W.; Skapik, J.; Kaye, J. The Role of Technology and Engineering Models in Transforming Healthcare. IEEE Rev. Biomed. Eng. 2013, 6, 156–177. [Google Scholar] [CrossRef]
- Fährmann, D.; Martín, L.; Sánchez, L.; Damer, N. Anomaly Detection in Smart Environments: A Comprehensive Survey. IEEE Access 2024, 12, 64006–64049. [Google Scholar] [CrossRef]
- Song, C.; Qu, Z.; Blumm, N.; Barabási, A.-L. Limits of Predictability in Human Mobility. Science 2010, 327, 1018–1021. [Google Scholar] [CrossRef] [PubMed]
- Wang, T.; Cook, D.J.; Fischer, T.R. The Indoor Predictability of Human Mobility: Estimating Mobility With Smart Home Sensors. IEEE Trans. Emerg. Topics Comput. 2023, 11, 182–193. [Google Scholar] [CrossRef] [PubMed]
- Alberdi Aramendi, A.; Weakley, A.; Aztiria Goenaga, A.; Schmitter-Edgecombe, M.; Cook, D.J. Automatic Assessment of Functional Health Decline in Older Adults Based on Smart Home Data. Journal of Biomedical Informatics 2018, 81, 119–130. [Google Scholar] [CrossRef]
- CASAS - Center for Advanced Studies in Adaptive Systems, Washington State University Activity Recognition Datasets. Available online: https://data.casas.wsu.edu/download/ (accessed on 24 February 2025).Susnea, I.; Dumitriu, L.; Talmaciu, M.; Pecheanu, E.; Munteanu, D. Unobtrusive Monitoring the Daily Activity Routine of Elderly People Living Alone, with Low-Cost Binary Sensors. Sensors 2019, 19, 2264. [CrossRef]
- Susnea, I.; Dumitriu, L.; Talmaciu, M.; Pecheanu, E.; Munteanu, D. Unobtrusive Monitoring the Daily Activity Routine of Elderly People Living Alone, with Low-Cost Binary Sensors. Sensors 2019, 19, 2264. [Google Scholar] [CrossRef]
- Schmidl, S.; Wenig, P.; Papenbrock, T. Anomaly Detection in Time Series: A Comprehensive Evaluation. Proc. VLDB Endow. 2022, 15, 1779–1797. [Google Scholar] [CrossRef]
- Blázquez-García, A.; Conde, A.; Mori, U.; Lozano, J.A. A Review on Outlier/Anomaly Detection in Time Series Data. ACM Comput. Surv. 2022, 54, 1–33. [Google Scholar] [CrossRef]
Figure 1.
A framework for analysing the anomaly detection methods.
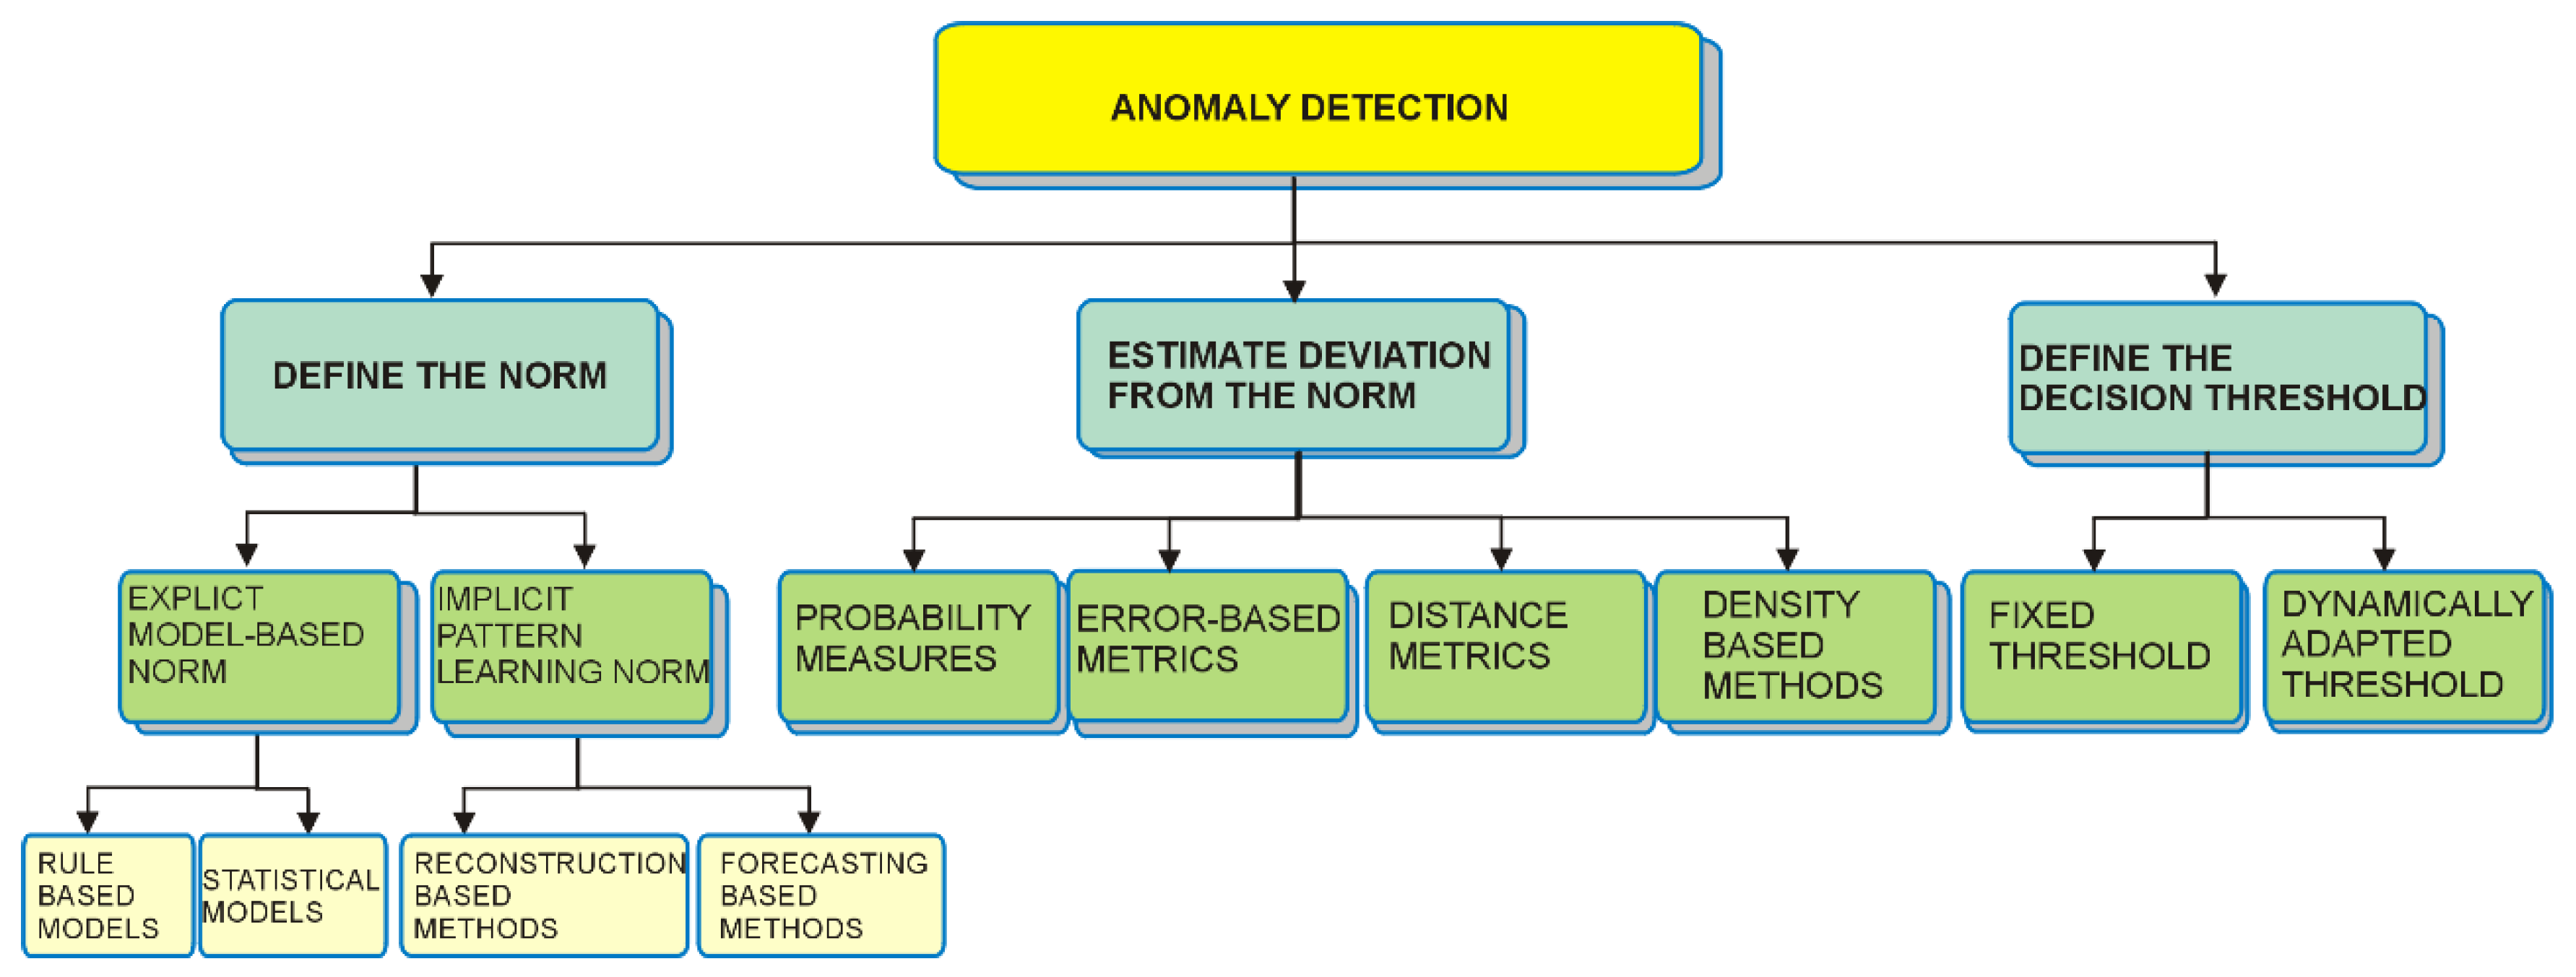
Figure 2.
Floorplan with sensor layout and the assignment of sensors to BMPs in Aruba testbed from the CASAS dataset. Mxxx are PIR motion detectors and Dxxx are magnetic door contacts.
Figure 2.
Floorplan with sensor layout and the assignment of sensors to BMPs in Aruba testbed from the CASAS dataset. Mxxx are PIR motion detectors and Dxxx are magnetic door contacts.
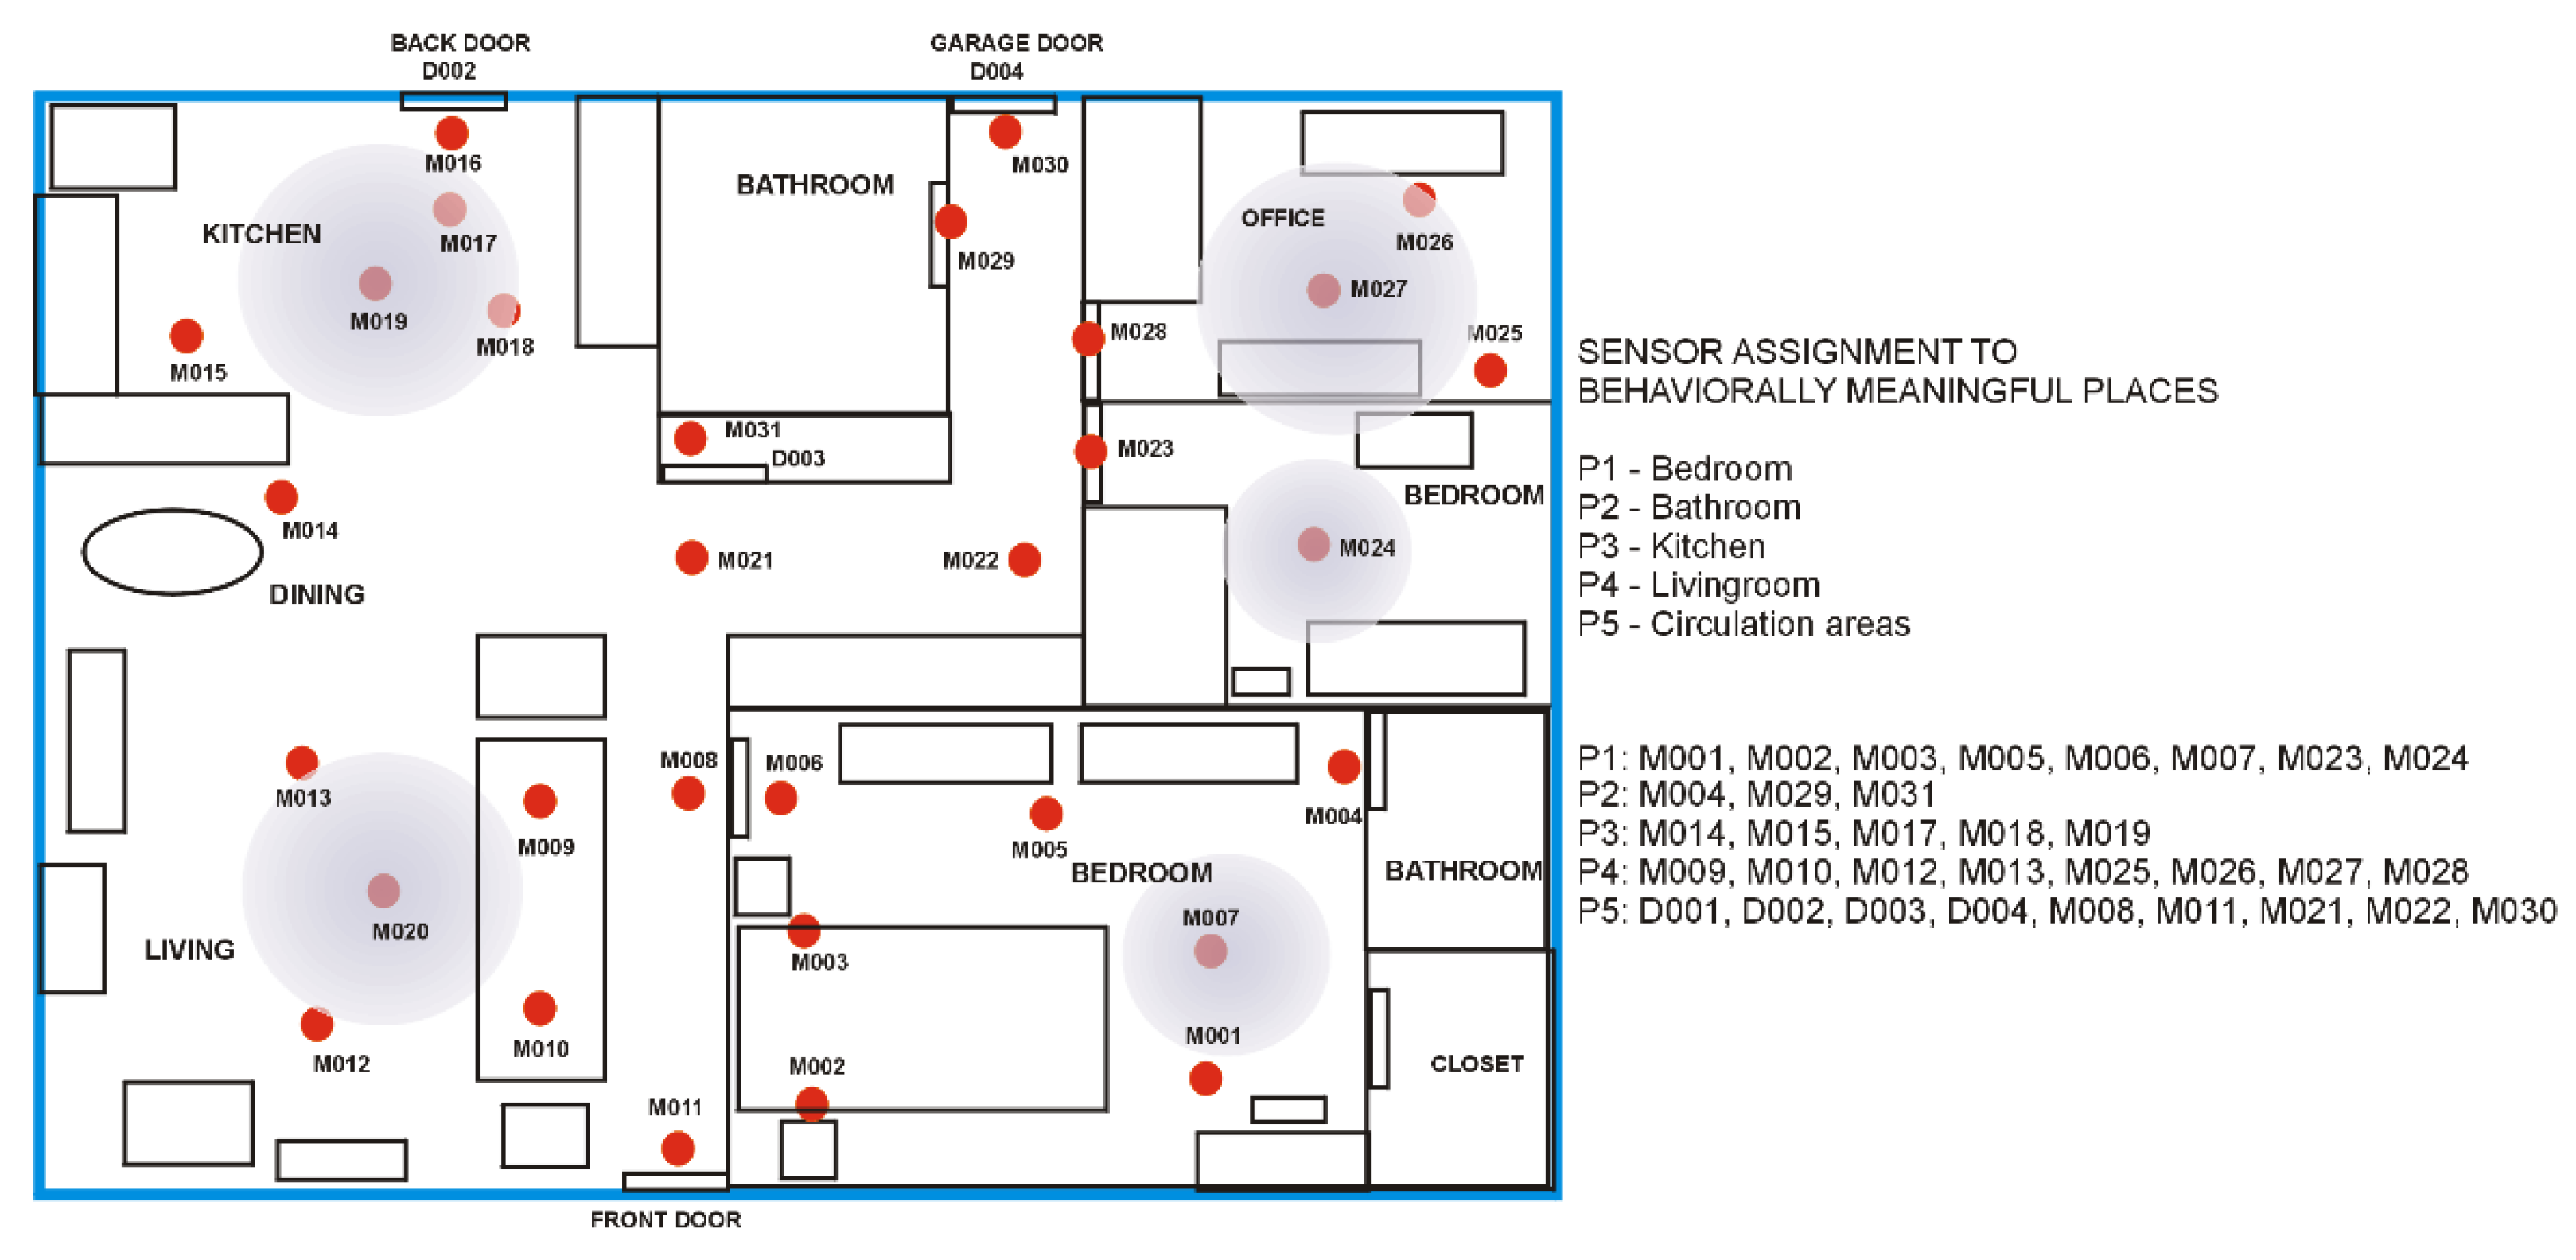
Figure 3.
Data processing flow for detecting mobility loss according to the proposed method.
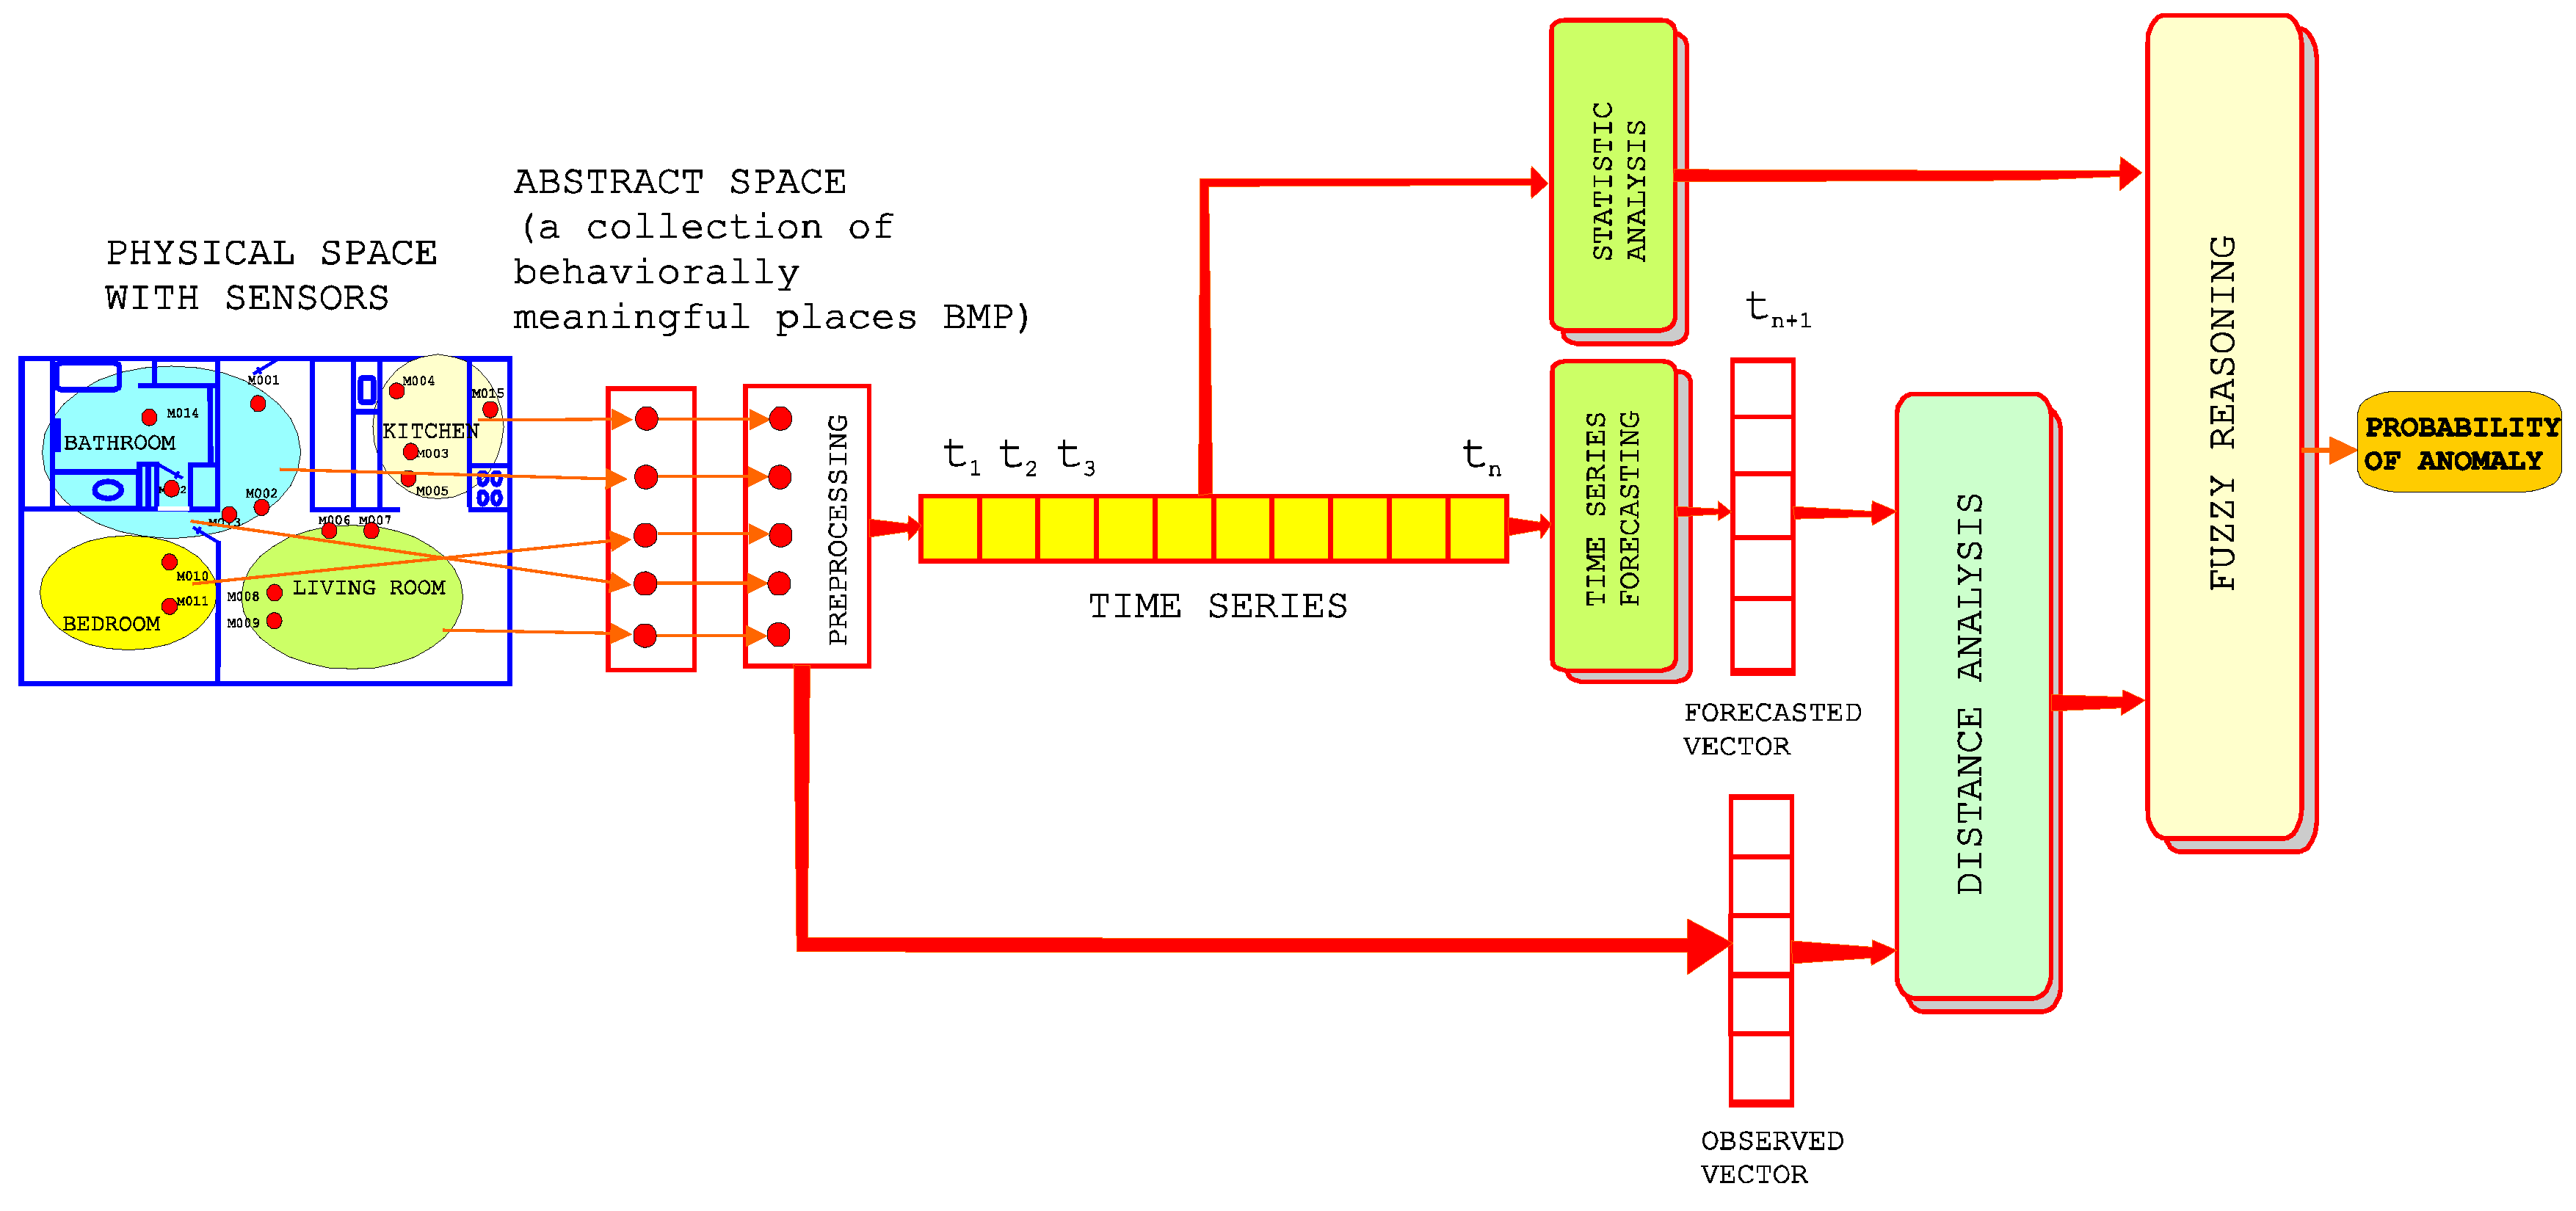
Figure 4.
Fuzzy domains and membership functions for OAL and Dist.
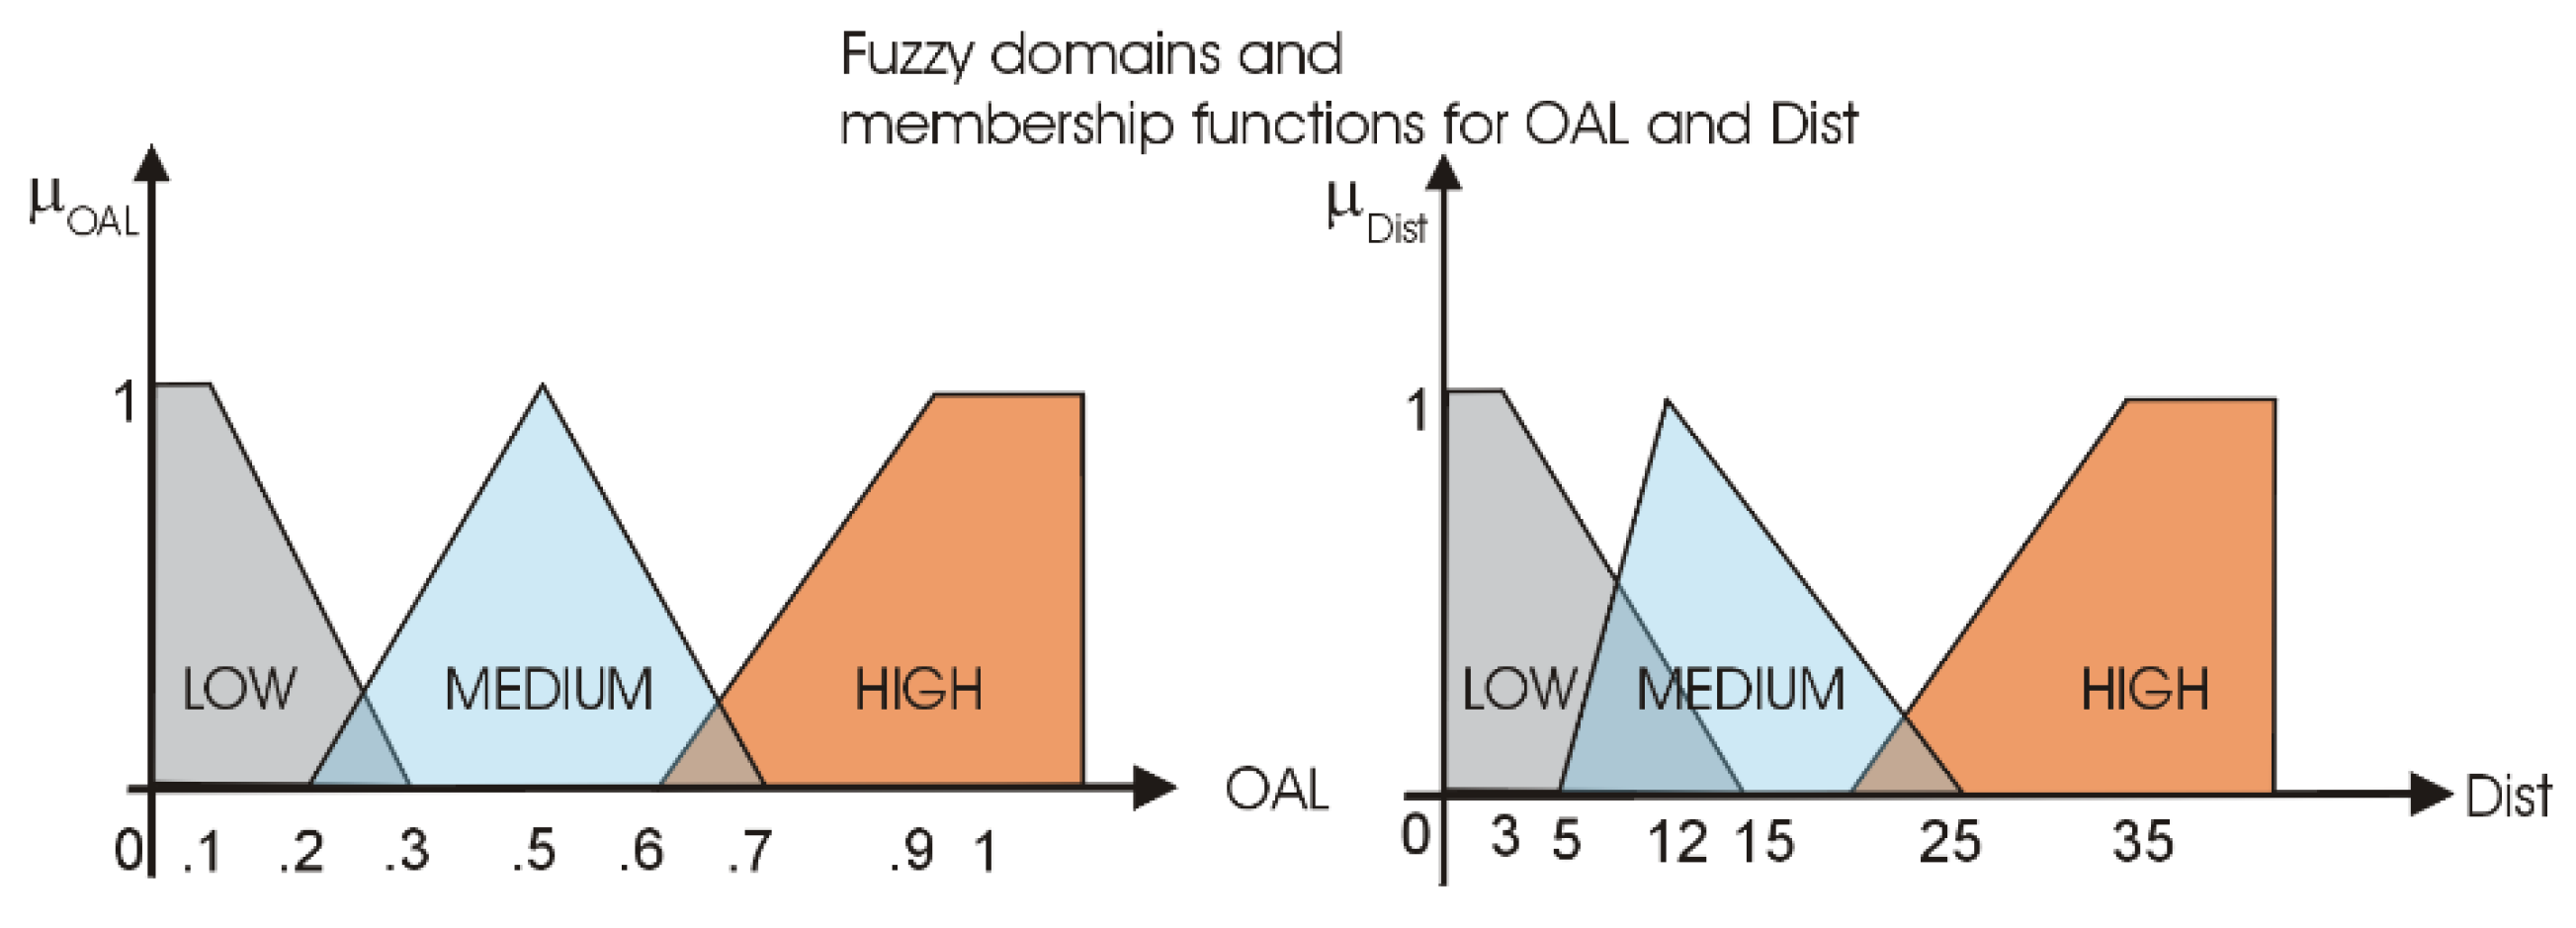
Figure 6.
Linear regression of the data on the daily activity levels for the past 21 days with a simulated mobility loss of 1% per day (a) with Aruba dataset, (b) with HH1210 dataset.
Figure 6.
Linear regression of the data on the daily activity levels for the past 21 days with a simulated mobility loss of 1% per day (a) with Aruba dataset, (b) with HH1210 dataset.
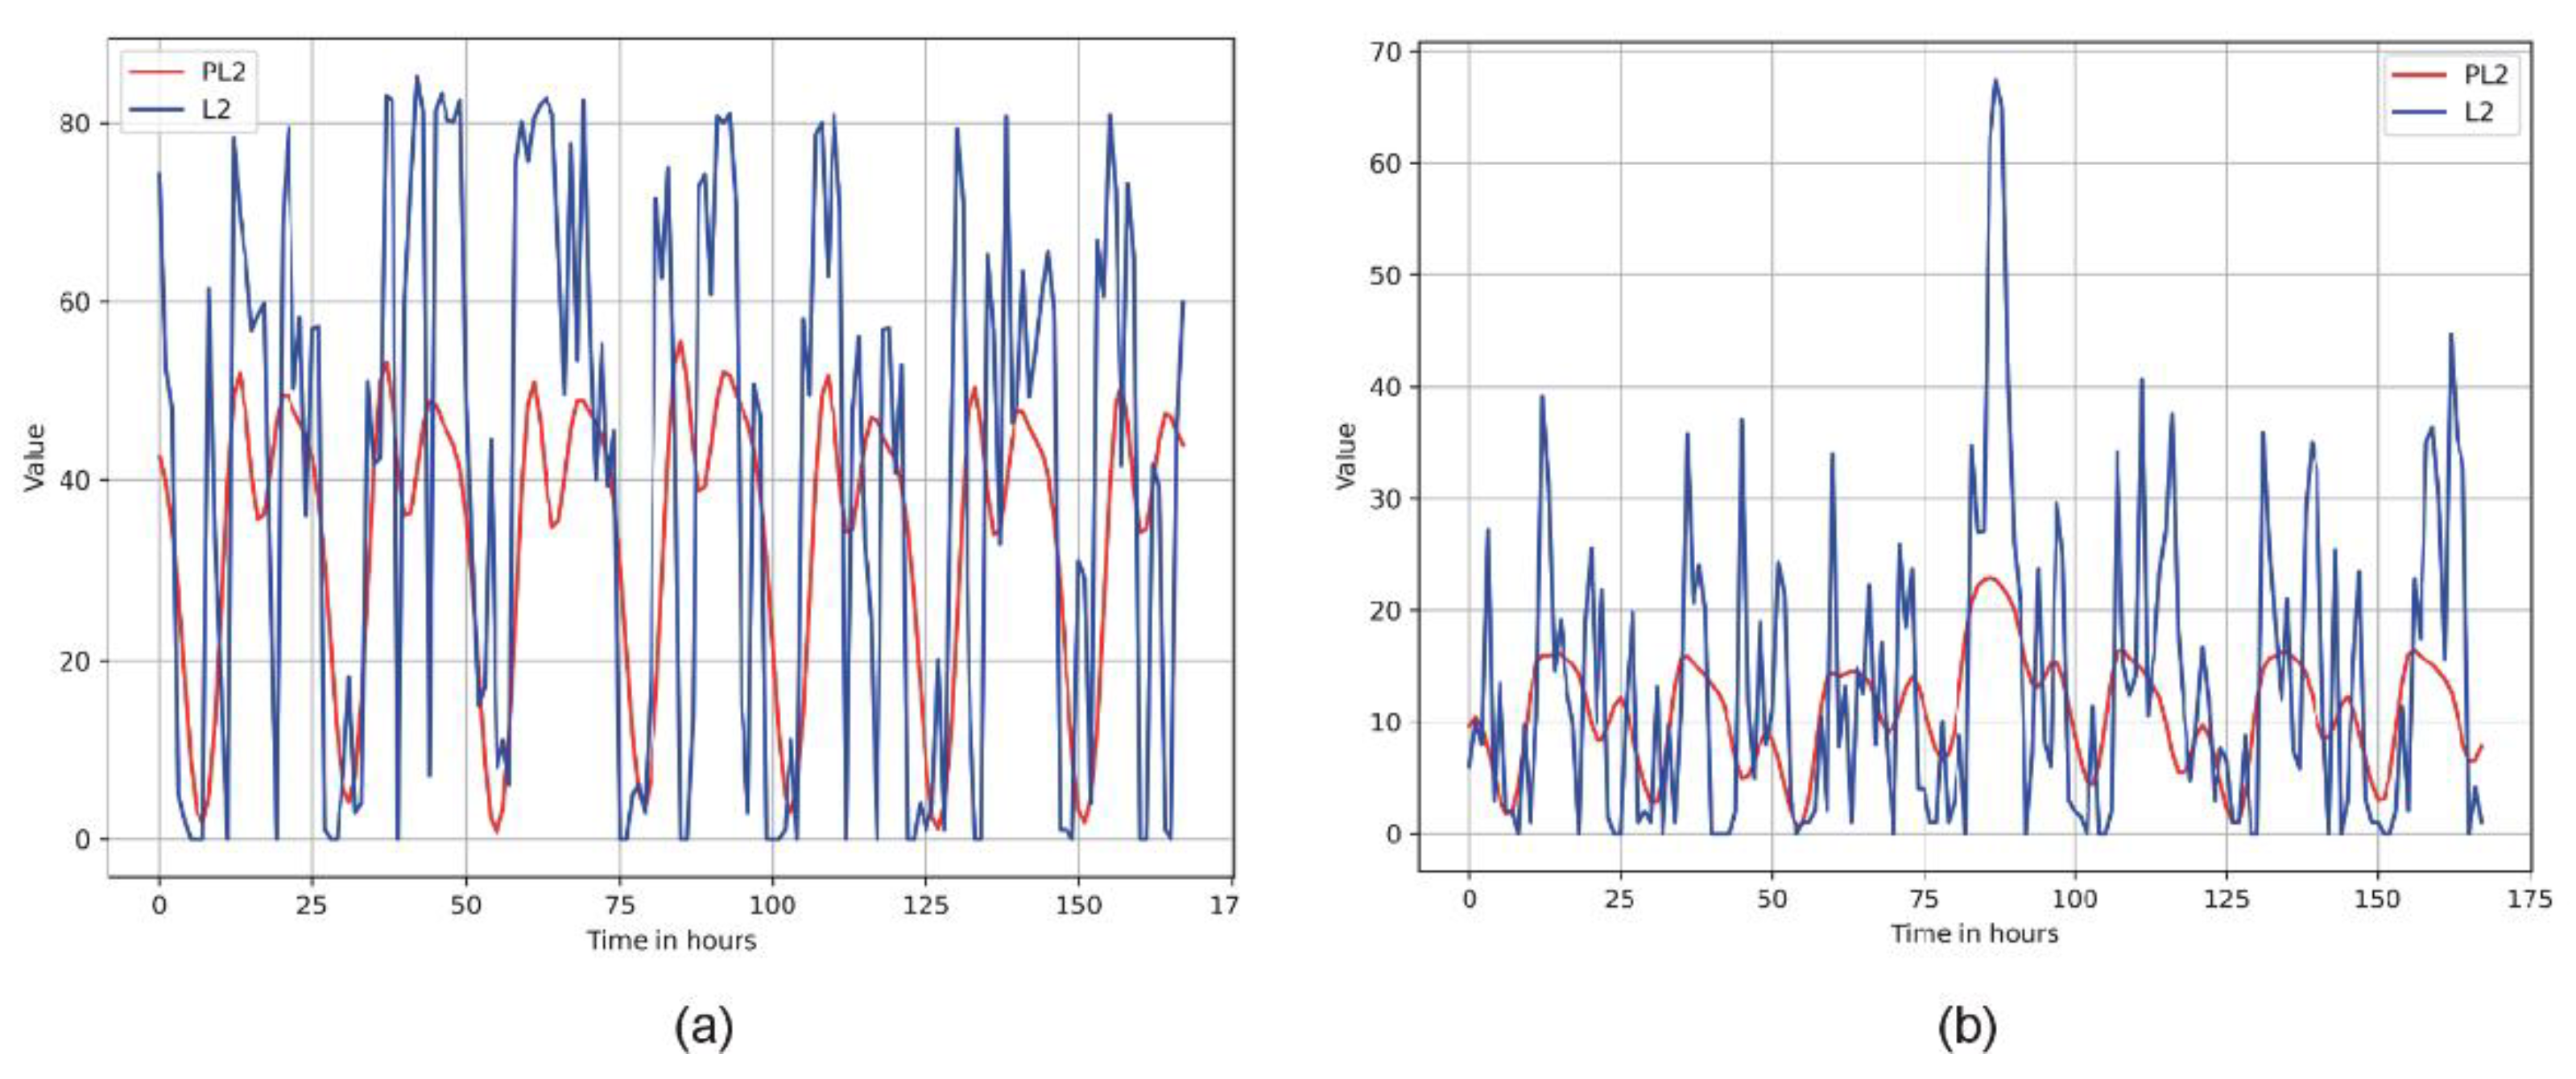
Figure 5.
Plot of the observed values of L2 (Euclidean norm of the activity vector) versus PL2 (Euclidean norm of the vector containing the forecasted components of the activity vector) (a) for the Aruba dataset (b) for HH120 dataset.
Figure 5.
Plot of the observed values of L2 (Euclidean norm of the activity vector) versus PL2 (Euclidean norm of the vector containing the forecasted components of the activity vector) (a) for the Aruba dataset (b) for HH120 dataset.
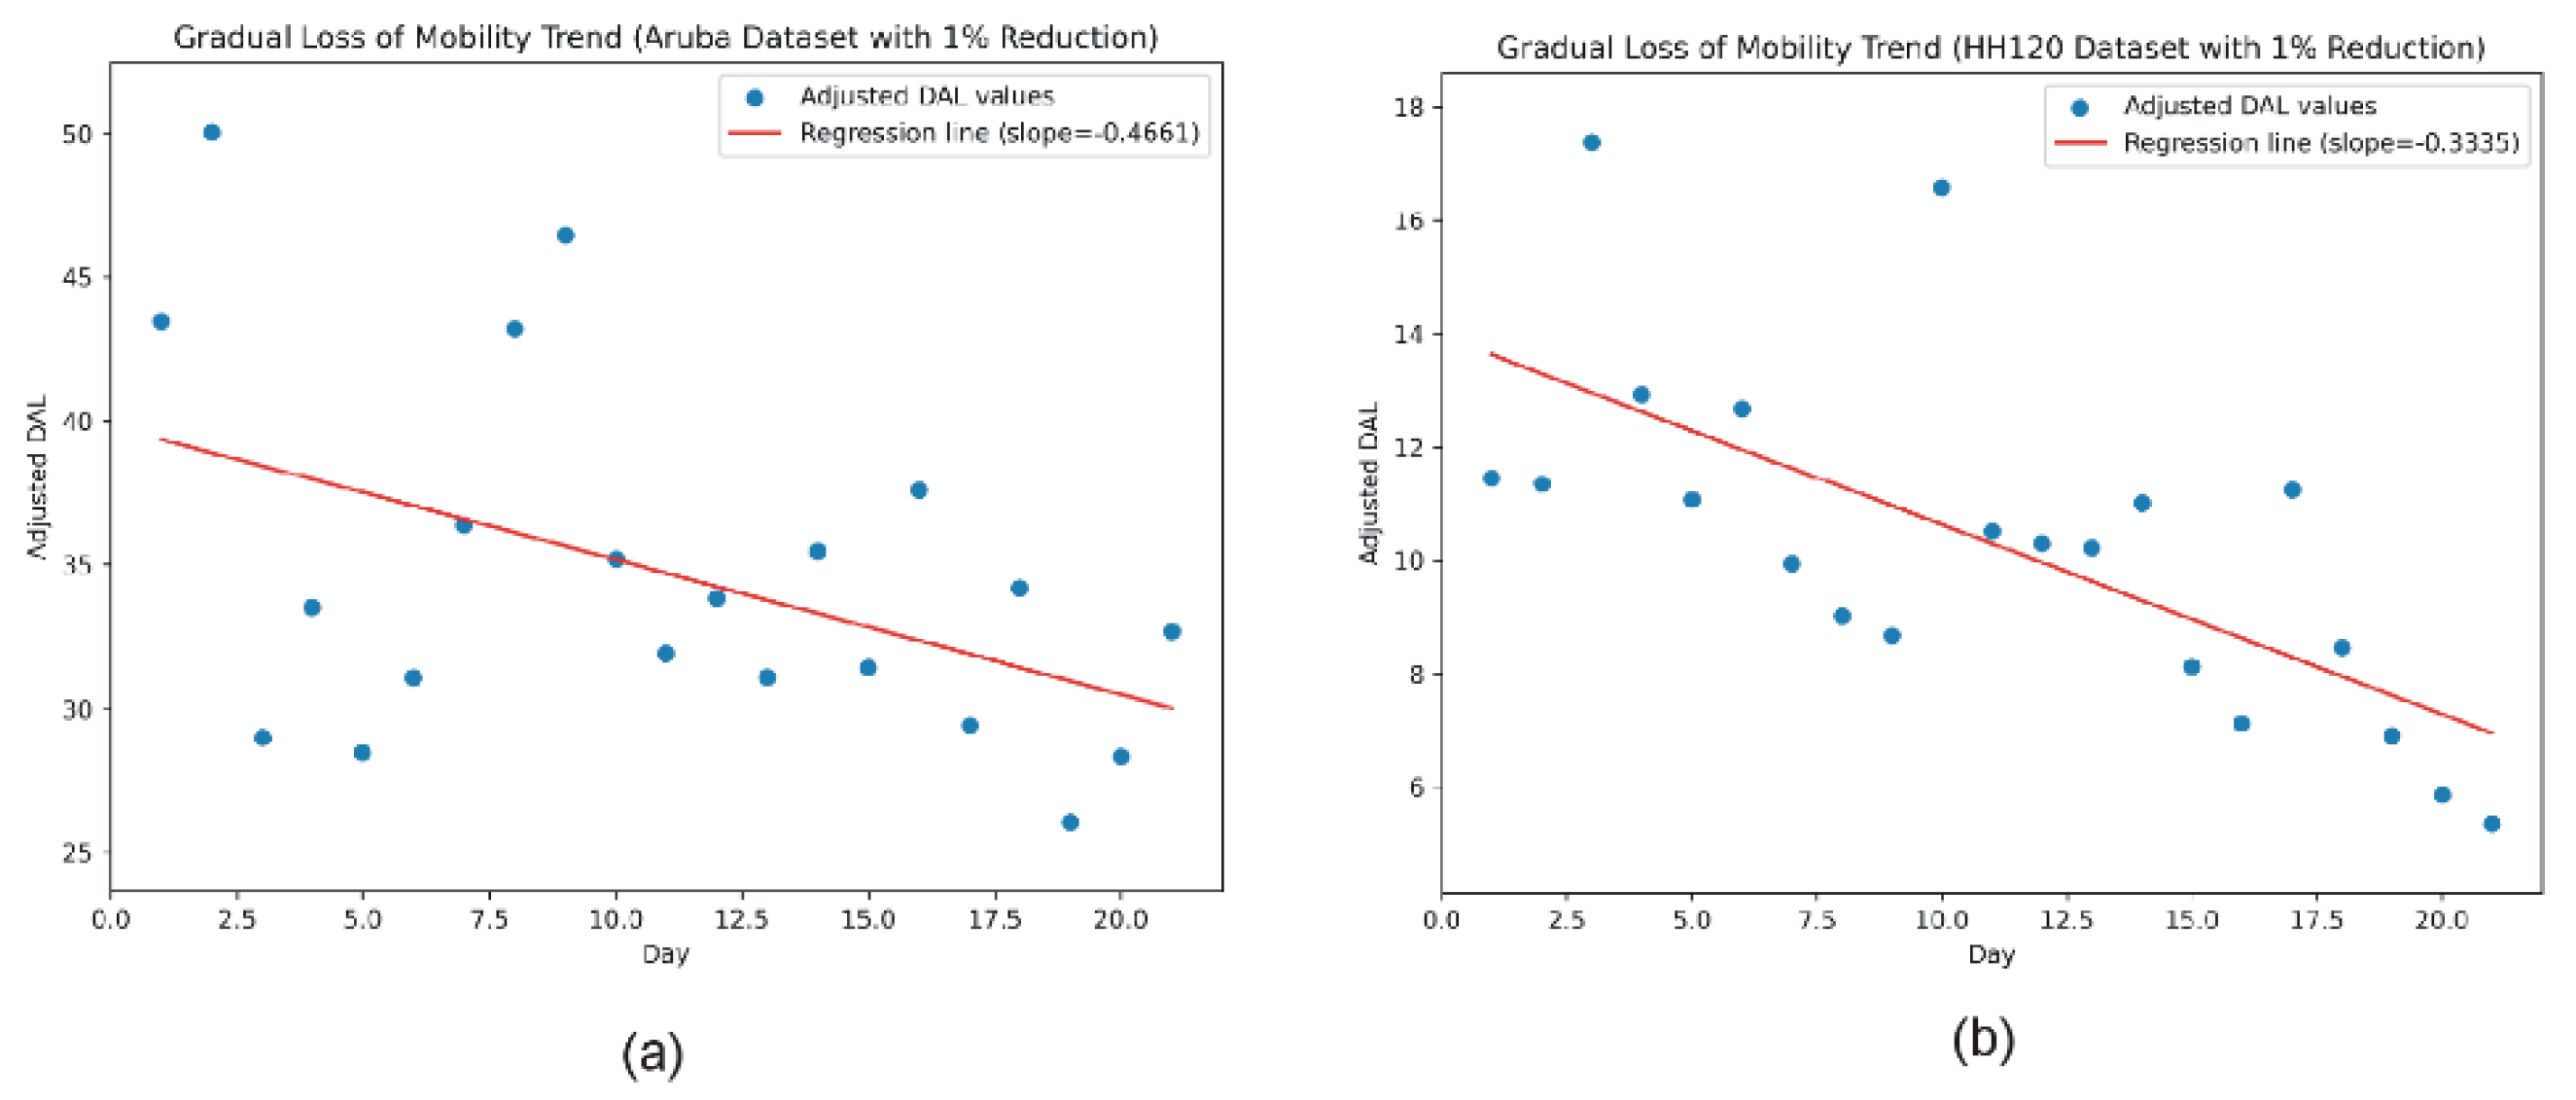

Table 1.
Summary of the most frequently mobility anomalies addressed in the literature.
| Mobility anomaly | Sensors used | References |
|---|---|---|
| Falls | Depth sensors | [21,22] |
| Accelerometers, gyroscopes | [23] | |
| Passive Infrared (PIR) and accelerometer | [24,25] | |
| Video | [26] | |
| Gait anomalies | RGB camera | [27] |
| Pressure sensors in smart insoles | [28] | |
| Pressure/force sensors in smart floors | [29,30] | |
| Wandering and erratic walking in dementia | Active infrared sensors | [31] |
| Ambient beacons and wearable transponder | [32] | |
| GPS | [33,34] | |
| Prolonged inactivity | Smartphone sensors | [35,36] |
| Microphone+accelerometer | [37] | |
| Passive infrared (PIR) sensors | [38,39,40,41] | |
| Slow loss of mobility due to chronic conditions | Passive infrared (PIR) sensors | [42,43] |
| Electric power load | [44] | |
| Sarcopenia related mobility anomalies | Smartwatch sensors | [45] |
Table 2.
The rule base of the fuzzy inference module used to estimate the probability of mobility anomaly.
Table 2.
The rule base of the fuzzy inference module used to estimate the probability of mobility anomaly.
| Observed activity level (OAL) | Euclidean distance between the observed and predicted vectors (Dist) | Probability of mobility anomaly (PA) |
|---|---|---|
| LOW | LOW | MEDIUM |
| LOW | MEDIUM | MEDIUM |
| LOW | HIGH | HIGH |
| MEDIUM | LOW | LOW |
| MEDIUM | MEDIUM | MEDIUM |
| MEDIUM | HIGH | MEDIUM |
| HIGH | LOW | LOW |
| HIGH | MEDIUM | LOW |
| HIGH | HIGH | LOW |
Table 3.
RMSE values for the forecasting models tested.
| Testbed | Model | Short length train dataset (28 days) | Full length train dataset |
|---|---|---|---|
| Aruba | Prophet | 23.67 | 19.47 |
| RF | 19.03 | 19.83 | |
| SVR | 20.78 | 20.16 | |
| SARIMA | 21.36 | 18.39 | |
| VAR | 21.28 | 21.46 | |
| HH120 | Prophet | 7.95 | 7.13 |
| RF | 7.44 | 7.33 | |
| SVR | 8.03 | 7.5 | |
| SARIMA | 8.9 | 7.73 | |
| VAR | 8.53 | 8.14 |
Table 4.
Evaluation metrics for point mobility anomaly detection.
| Dataset | TP | FN | FP | TN | Detection Rate | False Positive Rate |
|---|---|---|---|---|---|---|
| Aruba | 49 | 11 | 56 | 281 | 0.81 | 0.16 |
| HH120 | 28 | 8 | 42 | 295 | 0.77 | 0.12 |
Disclaimer/Publisher’s Note: The statements, opinions and data contained in all publications are solely those of the individual author(s) and contributor(s) and not of MDPI and/or the editor(s). MDPI and/or the editor(s) disclaim responsibility for any injury to people or property resulting from any ideas, methods, instructions or products referred to in the content. |
© 2025 by the authors. Licensee MDPI, Basel, Switzerland. This article is an open access article distributed under the terms and conditions of the Creative Commons Attribution (CC BY) license (http://creativecommons.org/licenses/by/4.0/).
Copyright: This open access article is published under a Creative Commons CC BY 4.0 license, which permit the free download, distribution, and reuse, provided that the author and preprint are cited in any reuse.


