
Submitted:
25 April 2025
Posted:
28 April 2025
You are already at the latest version
Abstract
Background/Objectives: Individuals with eating disorders (EDs) experience stronger body illusions than controls, which may indicate abnormalities in multisensory processing underlying misperceptions of one’s body. These illusions can also temporarily reduce body image disturbance in EDs. Since the face is often a key component of identity and social functioning, and emerging evidence suggests distorted self-face perception in EDs, this study examined whether a facial illusion (the enfacement illusion) produces similar effects. Methods: White Australian women, 19 with an ED and 24 control participants, completed synchronous and asynchronous facial mimicry tasks to induce the enfacement illusion. Enfacement was assessed via self-report and an objective self-face recognition task, alongside pre- and post-illusion measures of face and body image disturbance (perceived facial attractiveness, adiposity estimation, and head/body dissatisfaction). Results: The illusion was successfully induced across both groups. Unexpectedly, ED and control participants were equally susceptible to the illusion, and neither group experienced improvements in face or body image disturbance. Notably, ED participants experienced increased head dissatisfaction following the illusion. Conclusions: These findings suggest that the multisensory integration processes underlying self-face perception may remain intact in EDs, unlike the disruptions seen in body perception. However, the limited therapeutic effects of the enfacement illusion highlight how socio-emotional processing biases in EDs, such as heightened self-consciousness and sensitivity to evaluation, may constrain its benefits. These findings offer novel starting points for future research to consider how socio-emotional processes shape self-face perception in EDs, not just sensory integration.
Keywords:
eating disorder
; self-perception
; face perception
; body image disturbance
; enfacement illusion
; embodiment illusion
; multisensory integration
Introduction
Body image disturbance is a central feature of eating disorders (EDs), particularly anorexia nervosa (AN) and bulimia nervosa (BN) [1] and is also common in binge eating disorder (BED) and other specified feeding or eating disorders (OSFED) [2]. Body image disturbance plays a key role in the onset, maintenance, and poor treatment outcomes of EDs [2,3]. While cognitive-affective components, such as body dissatisfaction and drive for thinness, have been extensively studied, EDs are also characterised by perceptual distortions, such as body size and shape misestimation [4,5]. Despite being common, persistent, and linked to poorer outcomes [4,6,7], these perceptual disturbances remain comparatively less understood and are neglected in conventional treatments [8,9]. The mechanisms underlying these distortions, and more broadly how the bodily self is mentally represented in EDs, remain unclear.
Recent neuroscientific advances demonstrate that bodily self-representations are not static but rather dynamic, continuously shaped and updated through multisensory integration—the dynamic process by which the brain combines sensory information across multiple modalities (e.g., vision, touch, interoception, proprioception) [10,11]. Embodiment illusions offer compelling experimental support for this dynamic nature of body representation. These paradigms exploit multisensory integration processes to temporarily alter, for example, the sense of bodily ownership by inducing the illusion of ownership over artificial body parts or entire bodies [12]. In the classic rubber hand illusion, participants observe a rubber hand being stroked while feeling synchronised touches on their unseen hand, with such congruent visuo-tactile cues creating an illusory sense of owning the rubber hand [13]. These principles have been extended to the entire body through full-body illusions via virtual reality [14].
Embodiment illusions have advanced understanding of distorted body perception in EDs and also show therapeutic promise (for review, see [15]). AN and mixed ED samples consistently demonstrate heightened susceptibility to the rubber hand illusion, in particular, compared to controls [16,17,18]. One full-body illusion study showed similar findings when stimulating the abdomen [19]. These results provide evidence of heightened bodily plasticity in EDs and support the role of disrupted multisensory integration processes underlying distorted body perception in these populations. Therapeutically, embodying another body or body part that differs from one’s actual or perceived physical appearance, such as a positively evaluated or “healthy” model, has been shown to recalibrate distorted body perception and subsequently improve ED symptoms [19,20]. Improvements appear most pronounced in ED populations compared to controls [19,21], presumably because greater negative self-evaluations at baseline allow more room for improvement.
Importantly, however, while embodiment illusion research has traditionally focused on the body, the face represents a central yet understudied component of self-representation in EDs. Self-face perception is typically central to identity [22] and one’s face plays an important role in social cognition and emotional communication [23,24]. EDs are associated with disturbances in identity [25,26] and socio-cognitive functioning domains [27]. Moreover, social media usage is a documented ED risk factor among young women [28] and has intensified facial appearance concerns and dissatisfaction among users [29,30]. Limited research suggests that women with or at high risk of EDs exhibit deficits in self-face perception, including poorer self-face recognition accuracy [31,32] and facial image disturbances (e.g., facial dissatisfaction, lower perceived attractiveness, and higher adiposity [facial weight] estimation) [32,33], mirroring traditional body image disturbances. Despite such concerns, ED research and treatments overwhelmingly focus on body shape and weight (e.g., [8]). Neglecting self-face perception may limit our understanding of image disturbance in EDs and its full clinical impact.
Importantly, self-face representations, like bodily representations, are malleable, and the enfacement illusion [34,35] provides a powerful tool for investigating such phenomena. Synchronous visuo-motor or visuo-tactile stimulation can induce self-other merging, whereby the features of an external face are incorporated into one’s self-representation [22]. While the enfacement illusion has been increasingly used to study the perceptual plasticity of self-face representation, its application in ED populations is critically limited (for discussion, see [36]). A recent community-based study by Portingale et al. [37] of White and Asian women (N = 226, n = 102 high ED-risk via the Eating Attitudes Test-26 [EAT-26 [38]]), found no differences in enfacement illusion susceptibility between high and low ED-risk groups. Unexpected post-enfacement illusion effects were also observed: high-risk participants showed increased body and head dissatisfaction, whereas low-risk participants showed improvements. These findings contrast with prior embodiment illusion research indicating that clinical ED participants show greater illusion susceptibility and might also derive greater therapeutic benefit than controls [17,19]. However, community samples may mask clinically meaningful effects. Community-based embodiment illusion studies have reported null effects of non-clinical ED symptomatology on susceptibility [39] and negative changes in body image post-embodiment that correlated with the degree of (non-clinical) ED symptomatology [20].
The present study aimed to extend prior work by examining the enfacement illusion in women with an ED compared to controls. Our objectives were twofold: (1) to assess whether individuals with an ED show heightened susceptibility to the enfacement illusion compared to controls; and (2) to determine whether experiencing the illusion improves face and/or body image disturbance, particularly in those with an ED.
We hypothesised that ED participants would be more susceptible to the enfacement illusion than controls (H1), and that improvements in face and/or body image disturbance would occur after experiencing the enfacement illusion task (H2), particularly for ED participants compared to controls (H3).
Materials and Methods
Ethical approval was granted by a Melbourne university [masked for review]. All participants provided informed consent and were compensated for their time with university course credit or e-gift vouchers. The study followed a published protocol [40] with minor deviations in the clinical sample. The study’s design, hypotheses and analysis plan were pre-registered on the Open Science Framework [masked for review].
Participants
Nineteen individuals with an ED and 24 control individuals were recruited for the study. ED and control participants were recruited from an Australian university’s participant pool, university noticeboards, social media, and word-of-mouth referrals. ED participants were also recruited through ED-related organisations and private practices. Inclusion criteria required participants to be cisgender women, White, ≥18 years old, proficient in English, and without physical conditions preventing task performance.
ED participants were initially identified based on a self-reported current ED diagnosis and symptom levels indicative of high ED risk using the EAT-26 [38] and were then required to meet DSM-5 diagnostic criteria for an ED [41] which was verified using the Eating Disorder Examination (EDE) v17.0D [42]. Participants with comorbid psychiatric conditions were not excluded as this would not have represented a typical ED sample. Control participants were required to self-report no history of an ED and minimal disordered eating symptoms using the EAT-26 [38].
ED diagnoses included AN restricting (n = 6), AN binge-purge (n = 2), BN (n = 2), and OSFED (n = 9). OSFED subtypes comprised atypical AN (n = 2), low frequency/limited duration BED (n = 1), low frequency/limited duration BN (n = 4), and purging disorder (n = 2). The mean duration of the ED diagnosis was 5.31 years (SD = 8.13), with an average age of onset of 22.16 years (SD = 9.72). Participants were typically young adults. Average body mass index (BMI) was considered healthy across ED and control individuals (six ED individuals and four control individuals were considered overweight/obese). ED participants were significantly older and more educated than controls. For complete participant demographic and clinical information, see Table 1.
Stimuli
Stimulation Videos
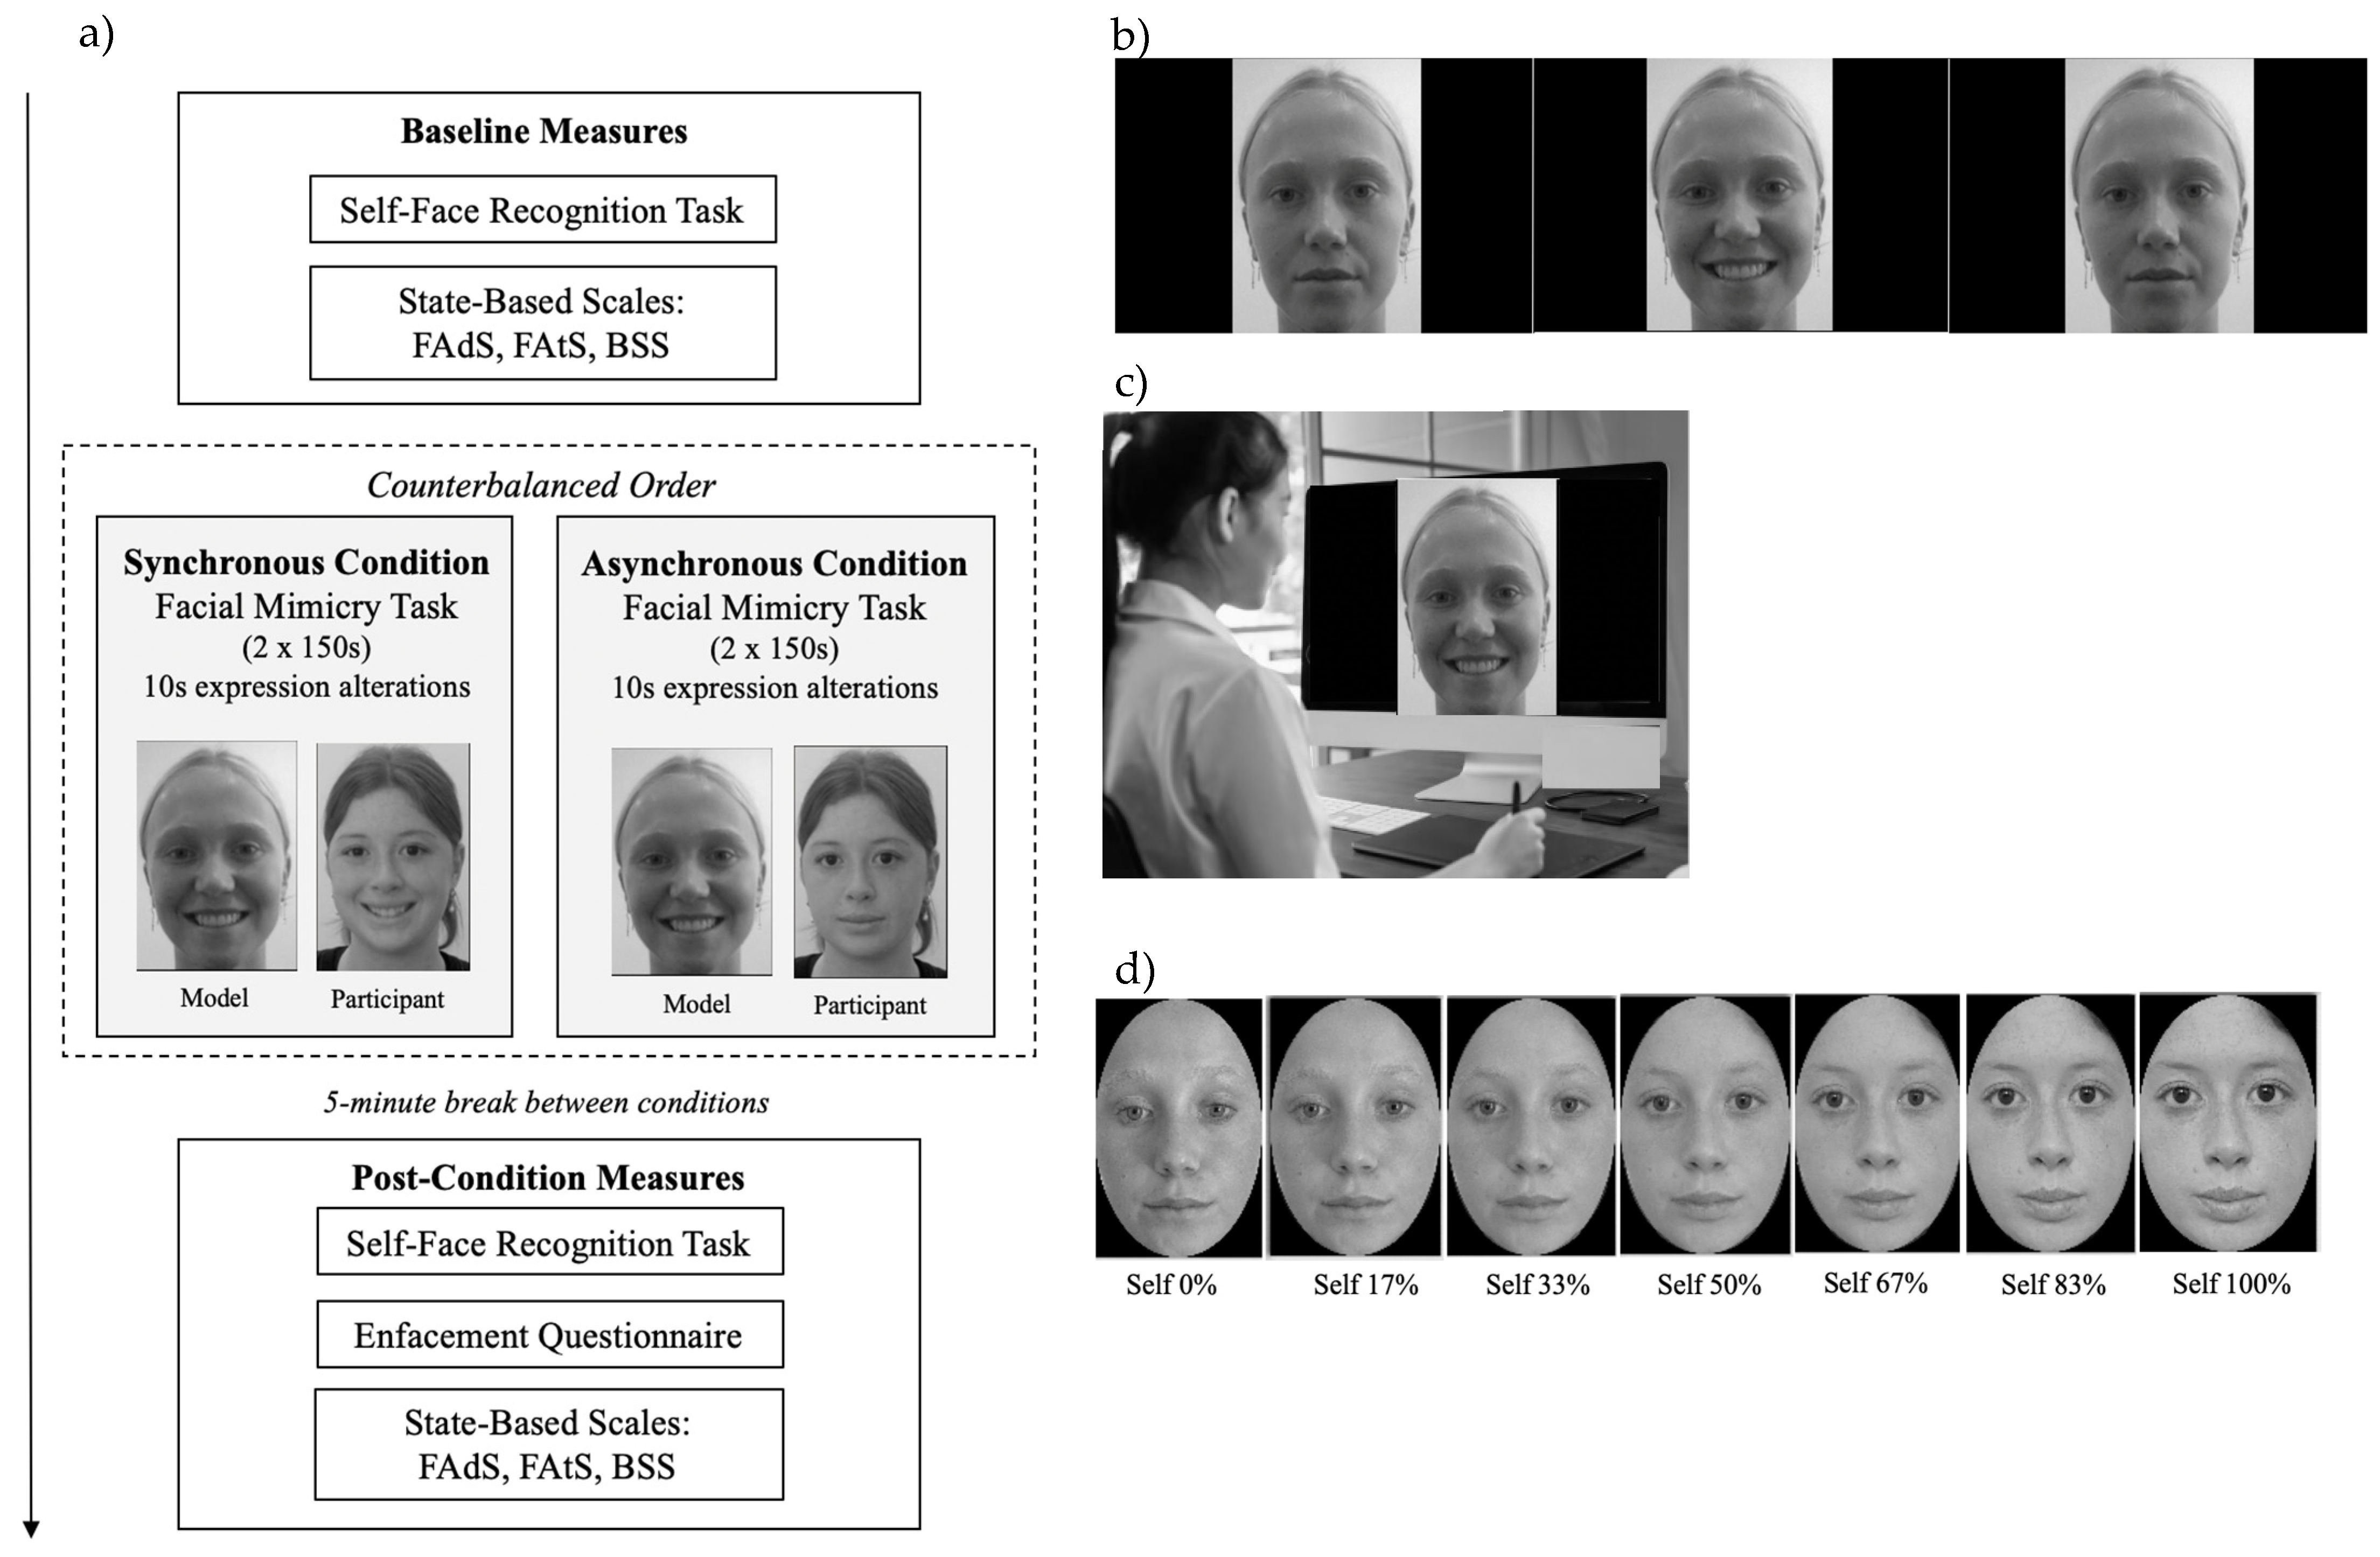
Six young adult White female models were selected based on third-party ratings from a demographically matched sample, ensuring average levels of attractiveness, adiposity, and likability, as well as emotional neutrality—attributes influencing enfacement (e.g., [43,44]). Videos were recorded of each model to develop the facial mimicry task stimuli used for multisensory (visuo-motor) stimulation (Figure 1b). Each video featured a front-facing model alternating between a neutral expression and an exaggerated visible-tooth smile every 10 seconds for 150 seconds—slightly longer than the standard 120-second duration [35] to maximise the likelihood of enfacement.
Figure 1.
Experimental Design, Stimuli, and Set-Up. Note. (a) Graphical depiction of the experimental procedure; (b) stimulation video depicting a model alternating between neutral and smiling expressions at 10s intervals, over each 150 second trial (section of the video depicted for illustrative purposes); (c) participant completes the synchronous condition (preforming the corresponding facial expression to the model); (d) morphing video sequence—used for the self-face recognition task—which involved images transitioning from 0% self (100% model) to 100% self (0% model) (depicted in standardised 17% increments for illustrative purposes). Measures: FAds = Facial Adiposity Scale; FAts = Facial Attractiveness Scale; BSS = Body Satisfaction Scale.
Morph Videos
For the self-face recognition task (Figure 1d), morphing videos were custom-generated for each participant using a front-view, neutral-expression photograph of their face. Images were mirror-transposed, converted to grey-scale, and circular-cropped to remove non-facial features (background, ears, hair) [35] via PhotoScape X (Version 4). Model images underwent the same processing. Each participant’s face was morphed with their model’s face (the same identity used in the stimulation video) in 1% increments, creating a 100-frame video transitioning from 0% to 100% self-face over 100 seconds using Abrosoft FantaMorph [45].
Measures
Demographic and Clinical Information
Self-report demographic information included age, height, weight (to calculate BMI), primary language, sexual orientation, marital status, and employment status. ED history (current/lifetime diagnosis, age of onset, illness duration) was also collected.
Formal DSM-5 ED diagnoses were verified via the EDE v17.0D [42]. Interviews were conducted by a registered clinical psychologist or trained postgraduate researchers and were double-screened for reliability. The EDE also provides a global severity score based on four subscales (dietary restraint, eating concern, weight concern, and shape concern). The EAT-26 [38], a 26-item measure of ED symptoms, was used to pre-screen the ED group (a validated cut-off score ≥20 denoting high ED risk) and determine control group eligibility (a score between 0 and 5 indicating minimal disordered eating). In the present study, internal consistency for the EAT-26 was excellent (α = .968).
State-Based Outcome Measures
Subjective Enfacement. The 8-item Enfacement Questionnaire (EQ) [46] assesses subjective enfacement on a 7-point scale (-3 = strongly disagree, 3 = strongly agree). The questionnaire contains three subcomponents: self-identification (4 items; feeling that the model’s face was their own), similarity (2 items; perceived resemblance), and affect (2 items; perceived attractiveness/trustworthiness of the model). Subcomponent scores were calculated by averaging relevant items (range: -3 to 3), and a total score was computed as the mean of the three subcomponents (range: -3 to 3). Higher scores indicate greater subjective enfacement. In the current study, internal consistency was good across conditions for the total score (α = .836–.844).
Objective Enfacement. In the self-face recognition task [35], participants viewed a morphing video (0% self to 100% self) and were instructed to press the spacebar when the image appeared more like themselves. Stopping times were converted to the % of frames judged as “self”. Earlier stopping times (lower % of self) following stimulation indicate enfacement, reflecting increased acceptance of the model’s features as their own.
Facial Attractiveness and Adiposity. Participants rated their perceived facial attractiveness and adiposity on separate 7-point scales (0 = very unattractive/underweight, 6 = very attractive/overweight) [47,48]. Higher scores indicate greater perceived facial attractiveness and adiposity.
Head and Body Dissatisfaction. The Body Satisfaction Scale (BSS) [49] comprises two validated 7-item sub-scales assessing dissatisfaction with features of the head (head, face, jaw, teeth, nose, mouth, eyes) and body (shoulders, chest, tummy, arms, hands, legs feet) (1 = very satisfied, 7 = very unsatisfied). Scores are summed for each subscale (range: 7–49). Higher scores indicate greater dissatisfaction. In the present study, internal consistency was good-excellent across conditions for both subscales (α = .894–.933).
Procedure
Participants were pre-screened for eligibility (ED history, EAT-26) and ED participants completed the EDE v17.0D. Each participant undertook a one-on-one experimental session with a researcher over Zoom, lasting approximately 1.5–2 hours, following a structured protocol (see [40] for procedural details). Participants were required to be seated at a laptop or computer positioned directly in front of them, approximately 50 cm away and aligned with eye level.
As depicted in Figure 1a, the session involved a baseline condition comprising a self-face recognition task and state-based body and face image measures. Participants then completed two visuomotor illusion induction conditions in a counterbalanced order. In the synchronous condition, participants observed the stimulation video and mimicked the model’s expressions in real-time (e.g., smiled when the model smiled) (Figure 1b). In the asynchronous condition, participants watched the same video but performed the opposite facial expressions to the model (e.g., smiled when the model was neutral). Each condition involved two facial mimicry trials (150 seconds per trial), followed by measures of objective and subjective enfacement and then state-based face and body image (randomised). A 5-minute break between conditions minimised carryover effects. Model identity was consistent across the stimulation video and self-face recognition task.
After completing both conditions, participants provided demographic information and were debriefed. All questionnaires/scales were delivered via Qualtrics. Self-face recognition and mimicry tasks were administered through PowerPoint, which participants opened locally in full-screen mode and screen-shared for monitoring.
Statistical Analyses
Given the nested data structure (Level 1: repeated measures; Level 2: participants), two multilevel models (MLMs) with random intercepts were tested. Fixed effects included Time (synchronous = 0, asynchronous = 1; synchronous = 0, baseline = 1), Group (control = 0, ED = 1), their interaction (Time × Group), and mean-centred age. Only age was controlled for due to sample size constraints and its established links to ED symptoms [50,51] and enfacement outcomes [52].
The first model tested differential susceptibility to the enfacement illusion (H1), using EQ scores (total and subscales) across synchronous versus asynchronous conditions, and self-face recognition task scores across synchronous versus asynchronous and synchronous versus baseline conditions. Stronger enfacement was indicated by higher EQ scores and lower recognition scores in the synchronous condition. A Time × Group interaction tested group differences in these changes.
The second model evaluated changes in face and body image post-enfacement—facial attractiveness, facial adiposity (single-item scales), and head/body dissatisfaction (BSS subscales)—comparing synchronous versus baseline conditions (H2). Improvements were defined as increased facial attractiveness and reduced scores on the remaining measures in the synchronous condition. A Time × Group interaction tested group differences in these changes (H3). Only the synchronous versus baseline comparison was examined given prior evidence from embodiment illusion studies that greater body image improvements occur following synchronous compared to asynchronous conditions (for reviews, see [15,53]).
Significant effects were explored via estimated marginal means with Bonferroni-corrected pairwise comparisons. Model fit was assessed using marginal R² (fixed effects), conditional R² (fixed and random effects) [54], and semi-partial R² via the SGV method [55]. Analyses were conducted in R Studio (v4.4.1) using the lme4, lmerTest, and emmeans packages [56,57].
Results
Assumptions Checking
Multicollinearity was within acceptable limits (Variance Inflation Factor scores < 5). Shapiro-Wilk tests indicated normality violations (H2-H3), and residual plots suggested potential heteroscedasticity for one model. To enhance robustness, we applied Satterthwaite approximations for degrees of freedom and computed 95% confidence intervals across models. Several outliers (standardised residuals > 3) were identified, but Cook’s Distance (> 4/N) showed no undue influence; all cases were retained to preserve power and sample representativeness. Intraclass correlation coefficients supported the multilevel structure (Table 3).
Susceptibility to Enfacement
- Subjective Enfacement
MLM analyses (Table 3) revealed a significant main effect of Time for the self-identification subscale of the EQ (semi-partial R2 = 3%), with higher scores in the synchronous (versus asynchronous) condition, indicating an enfacement effect across the entire sample. Average self-identification scores across conditions fell below the scale’s affirmative range, suggesting such an effect was weak (see Table 2 for descriptive statistics). No significant main effect of Time emerged for the total EQ score or affect and similarity subscale scores (R² = 0–1%). No significant main effect of Group (R² = 0%) or Time × Group interactions (R² = 0–2%) emerged. The models explained 43–67% of the total variance (5–10% unique variance).
Objective Enfacement
A significant main effect of Time (R² = 1%) showed lower self-face recognition task scores following synchronous (but not asynchronous) compared to baseline conditions (average reduction of 6.88% of ‘self’ required for self-identification), indicating an enfacement effect across the entire sample. There was no significant main effect for Group or Time × Group interactions (all R2 = 0%). The model explained 82% of the total variance (4% unique).
Face and Body Image Changes Post-Enfacement
At baseline, ED participants reported greater head and body dissatisfaction, higher perceived facial adiposity, and lower perceived facial attractiveness (near scale extremes) than controls (around or below scale midpoints) (Table 2).
Facial Attractiveness and Adiposity
No significant main effect of Time or Time × Group interactions emerged for either outcome (R² = 0–1%). A significant main effect of Group emerged for attractiveness (R2 = 12%), but not adiposity (R2 = 5%), with ED participants reporting lower perceived facial attractiveness than controls across conditions. The model’s total variance explained was 85% for attractiveness (23% unique) and 75% for adiposity (24% unique).
Head and Body Dissatisfaction
There was no significant main effect of Time for either outcome (R2 = 0%) or Time × Group interaction for body dissatisfaction (R2 = 0%). However, there was a significant Time × Group interaction for head dissatisfaction (R2 = 1%), indicating that the magnitude of change differed between groups. Post-hoc pairwise comparisons (Figure 3) within the ED group revealed significantly greater head dissatisfaction post-synchronous versus baseline conditions (b = 2.84, SE = 0.91, t = 3.12, p = 0.003), with estimated marginal means of 36 and 33 (SE’s = 1.9), respectively. No significant timing effects emerged among controls (b = -0.67, SE = 0.81, t = -0.82, p = 0.415), with estimated marginal means of 17 and 18 (SE’s = 1.7) for synchronous and baseline conditions, respectively. The main effect of Group was significant for both outcomes (R2 = 40–48%), with ED participants reporting greater dissatisfaction than controls across conditions. The models explained 94% and 98% of the total variance (51–62% unique) for head and body dissatisfaction, respectively.
Figure 2.
Head Dissatisfaction Scores by Condition and Group. Note. Line plot displaying estimated marginal means of head dissatisfaction scores, presented by condition and group. Significantly greater head dissatisfaction was observed following the synchronous condition compared to baseline for the ED group, with no significant difference between conditions for the control group. Error bars represent 95% confidence intervals, with significance brackets showing where differences occur. ** p <.01.
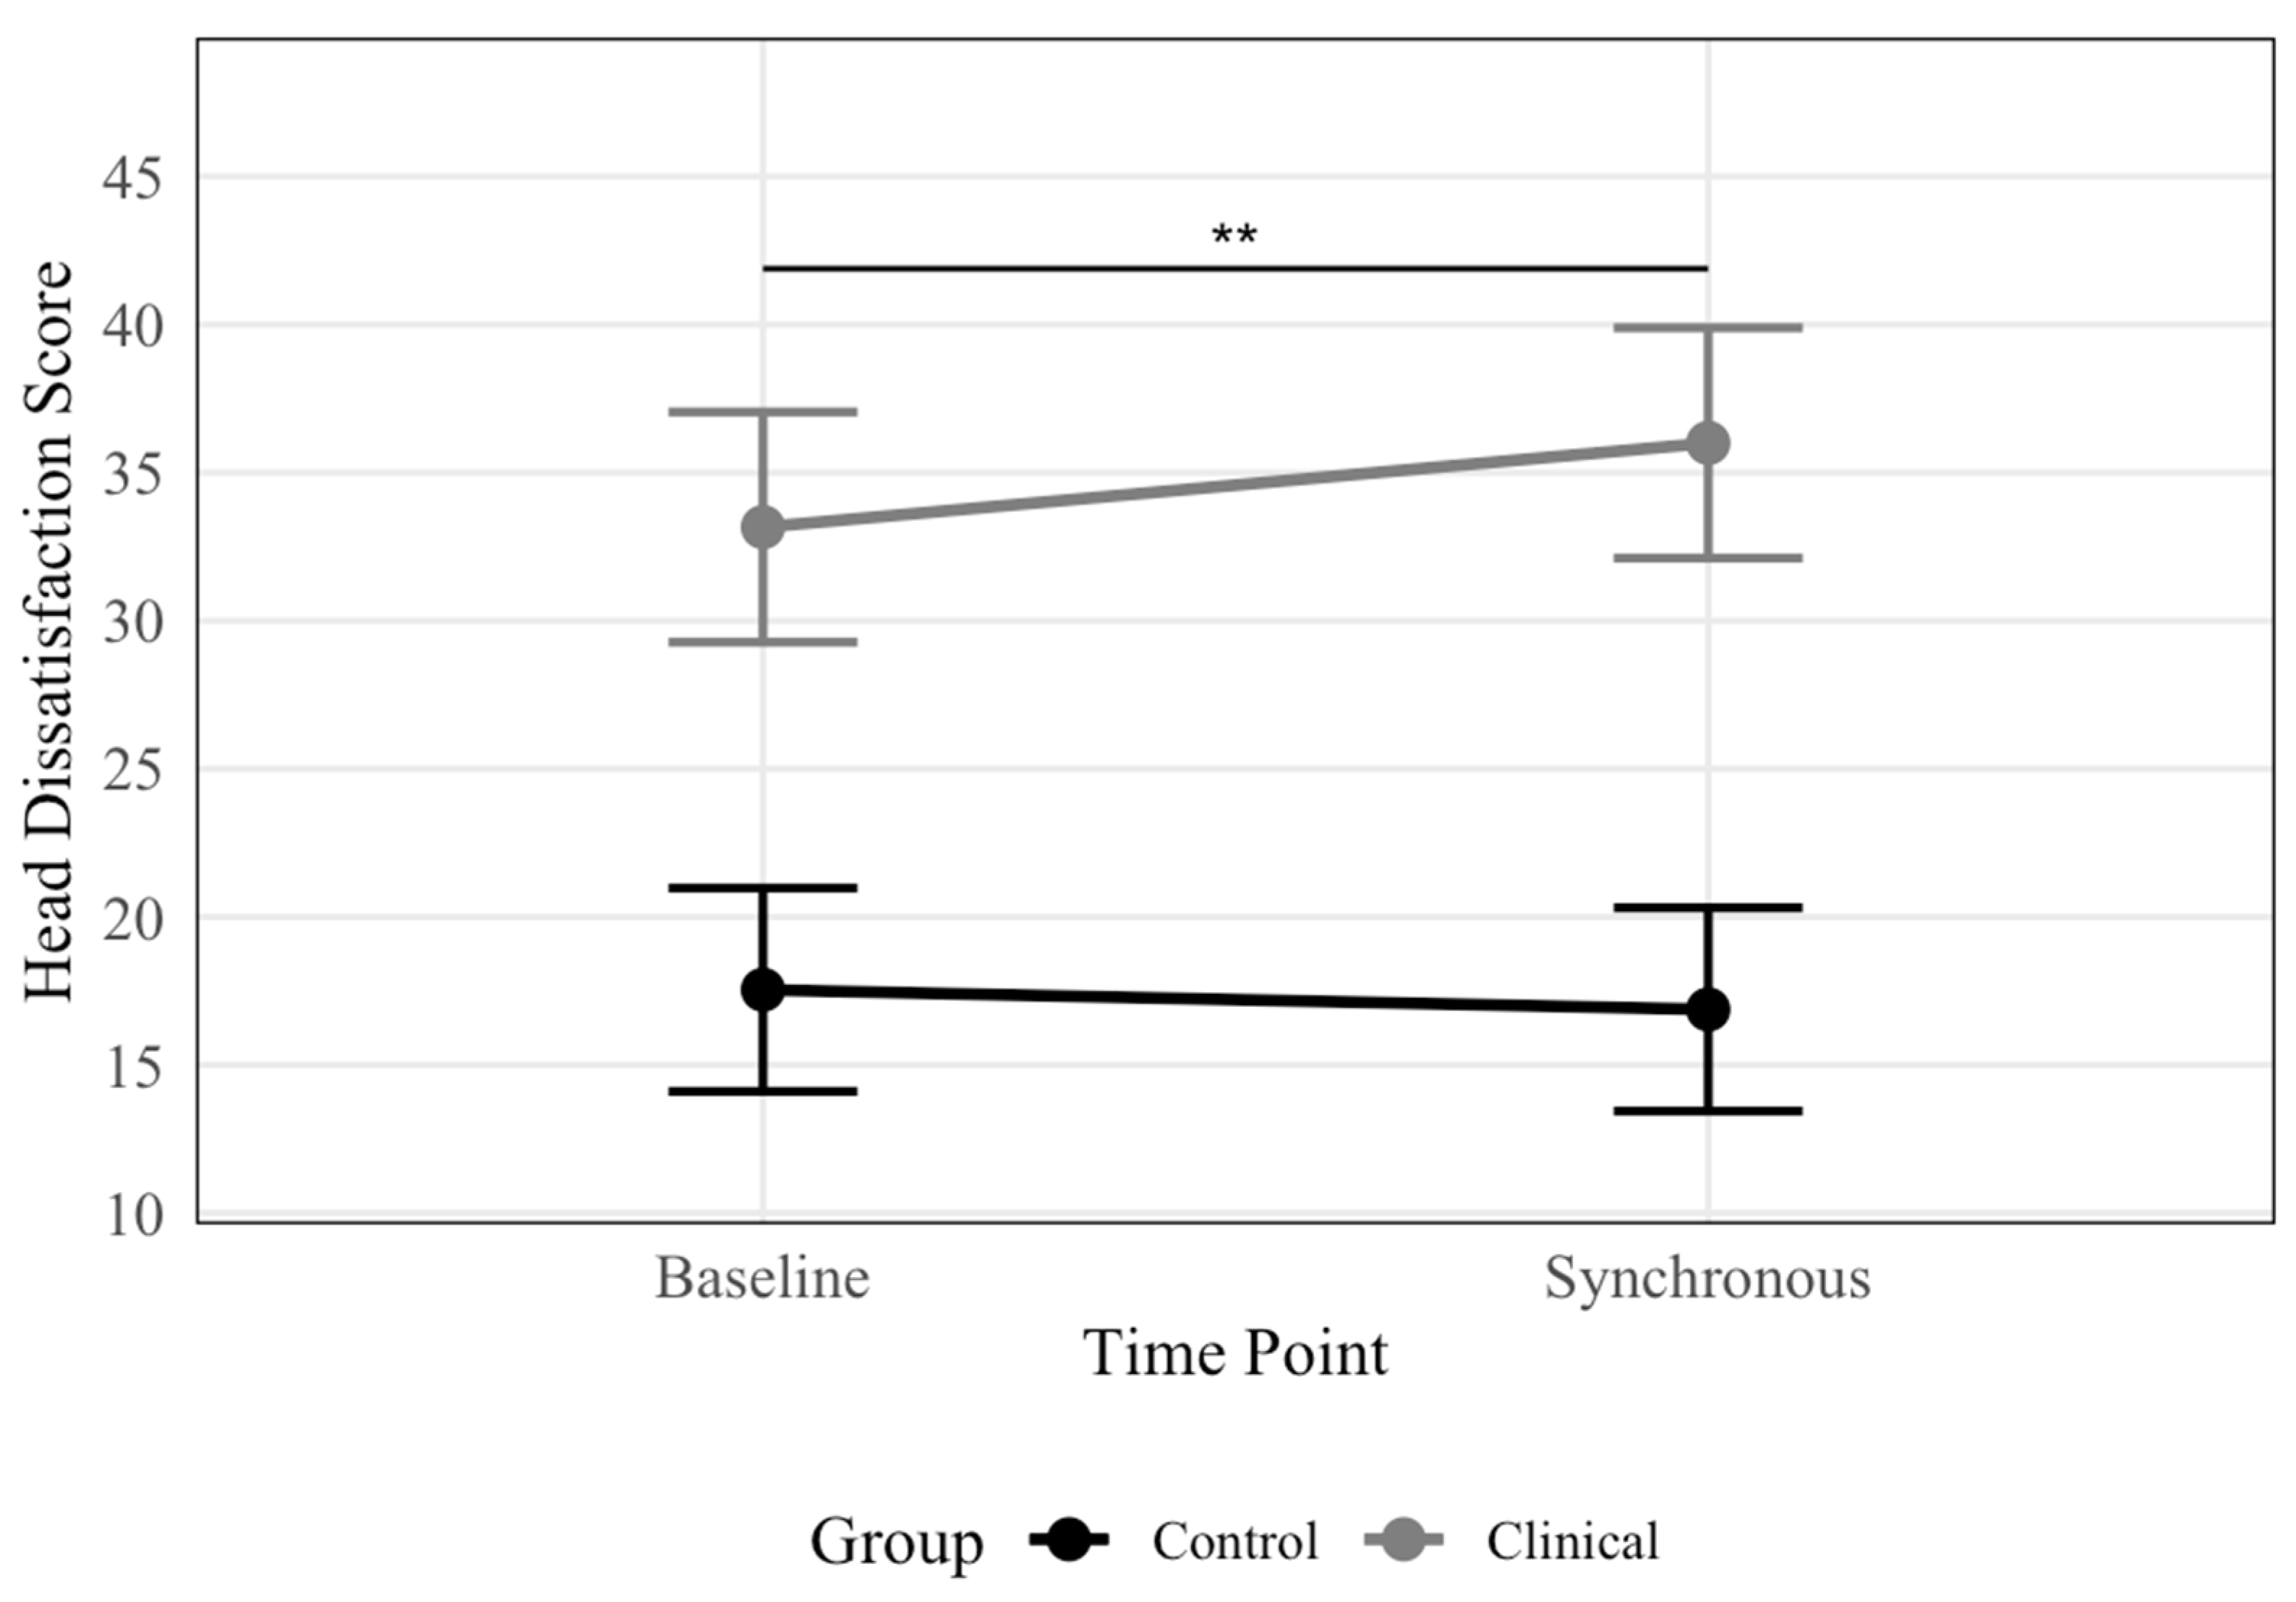

Table 2.
Descriptive Statistics for Outcome Variables.
| Outcome variable | Time | Total (N = 43) | ED (n = 19) | Control (n = 24) | |||||||
| M | SD | Observed range | M | SD | Observed range | M | SD | Observed range | Possible range | ||
| Subjective enfacement | |||||||||||
| Total | Sync | -0.22 | 1.31 | -2.67–1.67 | -0.38 | 1.24 | -2.67–1.67 | -0.09 | 1.37 | -2.67–1.67 | -3.00–3.00 |
| Async | -0.68 | 1.17 | -3.00–1.92 | -1.01 | 1.13 | 2.67–1.67 | -0.42 | 1.17 | -2.67–1.83 | ||
| Self-identification | Sync | -0.99 | 1.53 | -3.00–1.75 | -1.17 | 1.56 | -3.00–1.75 | -0.84 | 1.52 | -3.00–1.75 | -3.00–3.00 |
| Async | -1.53 | 1.35 | -3.00–1.50 | -1.57 | 1.24 | -3.00–1.25 | -1.50 | 1.46 | -3.00–1.50 | ||
| Similarity | Sync | -0.24 | 1.93 | -3.00–2.50 | -0.53 | 1.93 | -3.00–2.50 | -0.02 | 1.94 | -3.00–2.50 | -3.00–3.00 |
| Async | -0.77 | 1.80 | -3.00–2.50 | -1.21 | 1.72 | -3.00–2.50 | -0.42 | 1.82 | -3.00–2.00 | ||
| Affect | Sync | 0.57 | 1.62 | -3.00–3.00 | 0.55 | 1.85 | -3.00–3.00 | 0.58 | 1.45 | -2.00–3.00 | -3.00–3.00 |
| Async | 0.24 | 1.42 | -3.00–2.50 | -0.26 | 1.61 | -3.00–2.50 | 0.65 | 1.12 | -2.00–2.00 | ||
| Objective enfacement | Baseline | 60.96 | 16.28 | 27.73–95.54 | 61.42 | 19.29 | 41.88–90.00 | 60.59 | 13.87 | 27.73–95.54 | 0–100 |
| Sync | 54.08 | 16.91 | 17.00–96.02 | 53.66 | 18.07 | 27.80–88.00 | 54.41 | 16.31 | 17.00–96.02 | ||
| Async | 55.34 | 16.44 | 22.54–92.00 | 56.98 | 16.46 | 22.54–92.00 | 54.04 | 16.67 | 29.12–86.49 | ||
| Facial attractiveness | Baseline | 2.23 | 1.59 | 0–5 | 1.32 | 1.53 | 0–5 | 2.96 | 1.23 | 1–5 | 0–6 |
| Sync | 2.40 | 1.64 | 0–5 | 1.58 | 1.57 | 0–5 | 3.04 | 1.40 | 1–5 | ||
| Async | 2.26 | 1.72 | 0–5 | 1.53 | 1.78 | 0–5 | 2.83 | 1.46 | 0–5 | ||
| Facial adiposity | Baseline | 3.95 | 0.97 | 2–6 | 4.47 | 1.07 | 2–6 | 3.54 | 0.66 | 2–5 | 1–6 |
| Sync | 3.70 | 1.15 | 1–6 | 4.16 | 1.38 | 1–6 | 3.33 | 0.76 | 2–6 | ||
| Async | 3.65 | 1.17 | 0–6 | 4.05 | 1.54 | 0–6 | 3.33 | 0.64 | 2–5 | ||
| Head dissatisfaction | Baseline | 24.44 | 10.94 | 7–48 | 32.53 | 9.13 | 14–48 | 18.04 | 7.53 | 7–35 | 7–49 |
| Sync | 25.33 | 12.03 | 7–47 | 35.37 | 8.19 | 17–47 | 17.38 | 7.91 | 7–35 | ||
| Async | 26.16 | 12.28 | 7–48 | 36.26 | 9.37 | 17–48 | 18.17 | 7.47 | 7–32 | ||
| Body dissatisfaction | Baseline | 28.09 | 11.54 | 7–47 | 38.26 | 7.02 | 25–47 | 20.04 | 7.17 | 7–33 | 7–49 |
| Sync | 28.09 | 12.59 | 7–49 | 39.11 | 7.88 | 24–49 | 19.38 | 7.83 | 7–37 | ||
| Async | 28.72 | 12.46 | 7–49 | 39.42 | 7.83 | 25–49 | 20.25 | 8.13 | 7–41 | ||
Note. M = mean; SD = standard deviation; sync = synchronous; async = asynchronous. Objective enfacement scores show the mean % of frames for which the face was perceived as looking more like “self” than “other”.
Table 3.
Fixed Effects Results for Outcome Variables, Random Effects, and Model Fit.
| Outcome variable | Fixed effects | b | b 95% CI [LB, UB] | SE | df | p | Random effects (variance) | Conditional R² a | Marginal R² b | Semi-partial R² c | ICC | |
| Intercept | Residual | |||||||||||
| Subjective enfacement | ||||||||||||
| Total | Time: async | -0.33 | [-0.84, 0.18] | 0.26 | 41.00 | 0.212 | 0.72 | 0.81 | .51 | .08 | .01 | .47 |
| Group: ED | -0.18 | [-0.96, 0.60] | 0.40 | 63.08 | 0.655 | .00 | ||||||
| Age | -0.02 | [-0.06, 0.02] | 0.02 | 40.00 | 0.390 | .01 | ||||||
| Time: async * ED | -0.30 | [-1.07, 0.47] | 0.39 | 41.00 | 0.445 | .00 | ||||||
| Self-identification | Time: async | -0.66 | [-1.15, -0.17] | 0.25 | 41.00 | 0.012 | 1.39 | 0.75 | .67 | .05 | .03 | .65 |
| Group: ED | -0.21 | [-1.14, 0.72] | 0.48 | 54.35 | 0.665 | .00 | ||||||
| Age | -0.02 | [-0.07, 0.03] | 0.03 | 40.00 | 0.447 | .01 | ||||||
| Time: async * ED | 0.26 | [-0.48, 1.00] | 0.38 | 41.00 | 0.490 | .00 | ||||||
| Similarity | Time: async | -0.40 | [-1.12, 0.33] | 0.37 | 41.00 | 0.292 | 1.68 | 1.64 | .55 | .10 | .01 | .51 |
| Group: ED | -0.19 | [-1.34, 0.97] | 0.59 | 61.34 | 0.754 | .00 | ||||||
| Age | -0.05 | [-0.11, 0.01] | 0.03 | 40.00 | 0.093 | .05 | ||||||
| Time: async * ED | 0.29 | [-1.38, 0.80] | 0.56 | 41.00 | 0.607 | .00 | ||||||
| Affect | Time: async | 0.06 | [-0.60, 0.73] | 0.34 | 41.00 | 0.854 | 0.90 | 1.38 | .43 | .07 | .00 | .40 |
| Group: ED | -0.15 | [-1.10, 0.81] | 0.49 | 66.66 | 0.766 | .00 | ||||||
| Age | 0.02 | [-0.03, 0.07] | 0.02 | 40.00 | 0.443 | .01 | ||||||
| Time: async * ED | -0.87 | [-1.88, 0.12] | 0.51 | 41.00 | 0.092 | .02 | ||||||
| Objective enfacement | Time: baseline | 6.18 | [2.02, 10.34] | 2.12 | 82.00 | 0.005 | 0.91 | 0.44 | .82 | .04 | .01 | .81 |
| Time: async | -0.37 | [-4.53, 3.78] | 2.12 | 82.00 | 0.861 | .00 | ||||||
| Group: ED | -0.35 | [-11.14, 10.45] | 5.51 | 50.31 | 0.950 | .00 | ||||||
| Age | -0.07 | [-0.68, 0.54] | 0.31 | 40.00 | 0.830 | .00 | ||||||
| Time: baseline * ED | 1.58 | [-4.68, 7.83] | 3.19 | 82.00 | 0.622 | .00 | ||||||
| Time: async * ED | 3.69 | [-2.56, 9.94] | 3.19 | 82.00 | 0.251 | .00 | ||||||
| Facial attractiveness | Time: baseline | -0.08 | [-0.45, 0.28] | 0.18 | 41.00 | 0.654 | 1.67 | 0.41 | .85 | .23 | .00 | .80 |
| Group: ED | -1.51 | [-2.43, -0.59] | 0.47 | 47.57 | 0.002 | .12 | ||||||
| Age | 0.01 | [-0.05, 0.06] | 0.03 | 40.00 | 0.781 | .00 | ||||||
| Time: baseline * ED | -0.18 | [-0.72, 0.36] | 0.28 | 41.00 | 0.521 | .00 | ||||||
| Facial adiposity | Time: baseline | 0.21 | [-0.10, 0.51] | 0.16 | 41.00 | 0.190 | 0.61 | 0.29 | .75 | .24 | .01 | .67 |
| Group: ED | 0.62 | [0.01, 1.22] | 0.31 | 53.26 | 0.051 | .05 | ||||||
| Age | 0.04 | [0.00, 0.07] | 0.02 | 40.00 | 0.047 | .08 | ||||||
| Time: baseline * ED | 0.11 | [-0.35, 0.57] | 0.24 | 41.00 | 0.650 | .00 | ||||||
| Head dissatisfaction | Time: baseline | 0.67 | [-0.92, 2.25] | 0.81 | 41.00 | 0.415 | 57.84 | 7.88 | .94 | .51 | .00 | .88 |
| Group: ED | 19.13 | [13.93, 24.33] | 2.66 | 44.44 | <0.001 | .40 | ||||||
| Age | -0.19 | [-0.49, 0.11] | 0.15 | 40.00 | 0.226 | .03 | ||||||
| Time: baseline * ED | -3.51 | [-5.90, -1.12] | 1.22 | 41.00 | 0.006 | .01 | ||||||
| Body dissatisfaction | Time: baseline | 0.67 | [-0.39, 1.72] | 0.54 | 41.00 | 0.223 | 52.38 | 3.49 | .98 | .62 | .00 | .94 |
| Group: ED | 19.14 | [15.85, 25.46] | 2.45 | 42.25 | <0.001 | .48 | ||||||
| Age | -0.15 | [-0.44, 0.13] | 0.14 | 40.00 | 0.292 | .03 | ||||||
| Time: baseline * ED | -1.51 | [-3.10, 0.08] | 0.81 | 41.00 | 0.070 | .00 | ||||||
Note. CI = confidence interval; LB = lower bound; UB = upper bound; sync = synchronous; async = asynchronous; ED = eating disorder; b = regression coefficient; SE = standard error; ICC = intraclass correlation coefficient. a = variance explained by fixed and random effects; b = shared variance explained by fixed effects; c = unique variance explained by each fixed effect. Reference categories (Time = synchronous; Group = control) were assigned a value of 0; whilst categories shown in the table (Time = baseline, asynchronous; Group = ED) were assigned a value of 1. Significant p values (<.05) bolded.
Discussion
This study investigated the malleability of self-face representation in EDs and the therapeutic potential of the enfacement illusion, a multisensory integration paradigm previously unexplored in clinical ED samples. ED and control participants showed comparable susceptibility to the illusion, and neither group showed improvements in face or body image disturbance following the task. Instead, ED participants selectively reported increased dissatisfaction with their head region.
Enfacement Susceptibility
Contrary to expectations, ED and control participants showed comparable susceptibility to the enfacement illusion across subjective and objective measures, as indexed by self-reported self-identification with the model and a self-other attribution bias following synchronous stimulation. Such findings mirror those in a recent community study observing equivalent enfacement susceptibility across low and high-ED-risk groups [37]. This pattern contrasts with consistent evidence of heightened susceptibility to bodily illusions in clinical ED samples [17,19]. The dissociation suggests that facial (unlike bodily) representations may retain normative multisensory flexibility in subclinical and clinical ED populations. This does not negate the occurrence of facial distortions in EDs but instead implies that such distortions—as observed in reduced facial recognition accuracy and negative evaluations [31,32]—may arise from mechanisms distinct from those underpinning body distortions. Such a face-body dissociation is broadly supported by neuroimaging evidence suggesting partial anatomical and functional separation of face and body processing systems [58,59].
The current findings may be contextualised within a predictive coding framework [60,61], according to which perception is an inferential process shaped by the interaction between bottom-up sensory inputs and top-down expectations (based on prior knowledge and beliefs within internal mental models). Under this model, any discrepancy between expected and actual sensory input generates a prediction error, which the brain attempts to resolve either by updating internal models or reinterpreting the sensory data to fit prior beliefs. The strategy employed depends on the relative precision or reliability of each source of information. Embodiment illusions, including the enfacement illusion, are a powerful means to study these dynamics. The enfacement illusion in the present study arises when synchronised visuo-motor stimulation between one’s own and another’s face creates a prediction error that is resolved by incorporating external sensory signals (e.g., the other’s facial features) into one’s self-representation. Heightened susceptibility to embodiment illusions in ED populations has been interpreted as reflecting an overreliance on rigid prior beliefs at the expense of incoming sensory input which is deemed less reliable, possibly due to known deficits in multisensory integration in EDs, namely, an overreliance on visual information about the body relative to somatosensory information (e.g., [16,62]). This imbalance may promote the persistence of distorted body representations in EDs, whereby rigid and maladaptive pre-existing expectations about the body (e.g., prior beliefs of being overweight) are over-relied upon at the expense of conflicting sensory information [62].
Importantly, while predictive coding frameworks have been applied to explain top-down distortions in bodily representations among individuals with EDs, the current findings suggest that this model may not extend as readily to self-face representations. One possible reason is that self-face representations, despite being emotionally salient [32], may be less affected by top-down distortions than bodily representations in EDs. Indeed, body image distortions in EDs tend to be global, affecting the body as a whole: although some evidence points to localised concerns, these centre more on weight-relevant body regions (e.g., stomach, thighs) than on the face [5,63]. Furthermore, research has shown that individuals with AN direct more visual attention toward body stimuli than to faces during passive viewing tasks (e.g., via eye-tracking) [64], suggesting that the self-face in EDs may be a lesser source of emotional or appearance-based information. Together, these findings suggest that self-face representations might be less affected than the body by top-down distortions in EDs, thus, allowing for normal integration of bottom-up sensory bodily information and resulting in typical levels of facial malleability among ED participants and comparable enfacement illusion susceptibility to control participants.
It is also worth considering the possibility that the enfacement illusion lacks sensitivity to detect subtle differences in multisensory integration between ED and control participants. The subjective experience of enfacement was modest, as indicated by subjective scores generally falling below the scale’s affirmative range—a pattern consistent with previous enfacement research, unlike the typically observed more affirmative scores in embodiment research [22]. Since the face, unlike the body, often plays a central role in identity [34], and face recognition is a highly practised, socially important skill that continues to improve in early adulthood [65], this may render self-face representations more stable and less amenable to recalibration via brief multisensory stimulation. However, robust direct comparisons have yet to be published on this issue.
Enfacement as an Intervention
Contrary to expectations, experiencing the enfacement illusion did not improve face or body image disturbance in ED or control participants. Instead, head dissatisfaction increased for participants with an ED following the illusion. This finding aligns with previous research suggesting that experiencing enfacement may exacerbate rather than alleviate head/body dissatisfaction in individuals with elevated ED symptomatology [37]. The null results on other outcomes should be interpreted cautiously, given potential limitations in measurement sensitivity.
One explanation for the increase in head dissatisfaction lies in the interpersonal nature of the enfacement illusion. Unlike embodiment, the modest illusory effect of enfacement might have preserved self-other boundaries, rendering the task more socially charged than purely perceptual, especially since the face plays a central role in social communication [24]. In ED participants, this may have triggered affective or interpersonal discomfort. Individuals with EDs typically avoid visually attending to faces [64,66]. Since the enfacement illusion task required participants to maintain constant visual engagement with a stranger’s face, if such avoidance reflects a protective mechanism against social discomfort, the task may have evoked feelings of self-consciousness. For individuals with EDs who frequently report heightened sensitivity to perceived negative social evaluation, especially appearance-based [27], the task may have specifically evoked concerns around judgment and rejection, and subsequently self-consciousness of one’s facial appearance, driving head dissatisfaction. Furthermore, ED individuals tend to avoid attending to emotionally expressive faces [64,66] and because these individuals tend to show negative interpretation biases of social stimuli [67] even simple social cues like watching a model’s face alternating between smiling and neutral expression might have been misinterpreted as signals of rejection, increasing head dissatisfaction. Post-task participant reflections support these interpretations: most ED participants described heightened appearance concerns after the illusion, and many reported discomfort with the model’s gaze, including feelings of judgment and self-consciousness—patterns not seen in controls. In this sense, self-face perception in EDs may be driven by a deeper unease with self-other dynamics (e.g., interpersonal evaluation), with face-related dissatisfaction emerging primarily in contexts that increase social self-awareness.
From a neurocognitive perspective, the Allocentric Lock Theory [69,70] offers a complementary explanation. This theory posits that individuals with EDs are “locked” into a negative, third-person (allocentric) body representation that resists updating from first-person (egocentric) sensory cues. If the enfacement illusion fails to elicit a strong sense of self-identification with the model’s face, this lack of egocentric updating may have unintentionally reinforced negative allocentric representations, thereby increasing head dissatisfaction.
Interestingly, this dissatisfaction was specific to the head. One possibility is that while the body holds more entrenched cognitive-affective salience in EDs, the face becomes more only in social contexts that provoke interpersonal evaluation. The null effects on facial attractiveness and adiposity may reflect poor measurement sensitivity as these outcomes were assessed with single-item scales lacking psychometric validation. In contrast, the head dissatisfaction scale, as a composite measure of multiple facial features, may have better detected localised appearance concerns. Individuals with EDs, especially AN, display a feature-focused visual bias away from salient facial features (e.g., eyes, mouth) [66]. Since these regions convey social information (e.g., emotion, gaze), avoidance may reflect anxiety around social judgement. Over time, this pattern may reinforce associations between these regions and perceived scrutiny, inadvertently increasing dissatisfaction with specific aspects of the face.
Strengths and Limitations
Study strengths include the clinically verified ED sample, reducing misclassification biases common in embodiment illusion research [15] and a comprehensive battery of face and body evaluation measures alongside controlled comparisons between synchronous and asynchronous stimulation conditions, enhancing internal validity. While the sample size was modest, it is consistent with prior embodiment studies in clinical ED populations [71,72,73]. Nonetheless, the study may have been underpowered to detect subtle effects or interactions, particularly given the small effect sizes observed (1–3% unique variance explained).
Including a mixed ED sample reflects clinical reality, given symptom overlap across diagnoses [74], and aligns with previous embodiment research [16,17,21]. Nonetheless, this approach may have obscured diagnosis-specific effects, especially as multisensory integration abnormalities are better established in AN [62].
Future research should employ larger, diagnostically stratified samples and ensure sufficient power to account for relevant covariates such as BMI and alexithymia.
Further limitations include the non-validated, single-item measures of facial attractiveness and adiposity, which may not adequately capture the complexity of self-face representation. Future work should incorporate validated psychometric tools and objective indices (e.g., eye-tracking, facial metrics) to enhance measurement precision. Additionally, the use of ‘average’ faces may have confounded responses; attractive faces are known to strengthen enfacement [44], yet, if self-other boundaries are preserved during enfacement, incorporating attractive faces may provoke adverse responses in ED populations (e.g., via upward appearance comparisons [75]). Tailoring facial stimuli to individual social-affective profiles, such as by enhancing model likeability or reducing perceived social threat, could improve therapeutic utility.
Finally, findings may not generalise beyond White cisgender women. Given that cultural and gender differences in body and face image are well-documented [76,77], future enfacement research should examine whether enfacement effects differ across diverse populations (for discussion, see [78]). For instance, cultural schemas may shape the domains (face versus body) around which ED-related perceptual biases consolidate.
Future Research Directions and Clinical Implications
The current findings, pending replication, highlight the potentially complex and context-dependent nature of self-face perception in EDs, offering several implications for theory and practice. While susceptibility to the enfacement illusion was comparable across ED and control groups, the affective consequences of the illusion diverged, suggesting that it is not sensory integration per se, but the social meaning attributed to the task that may drive negative outcomes in ED individuals. In this sense, self-face perception in EDs may be shaped less by deficits in bottom-up multisensory integration, and more by entrenched top-down beliefs related to social evaluation and interpersonal self-consciousness.
Future research should prioritise disentangling the perceptual and socio-emotional dimensions of the enfacement illusion. ED-relevant traits such as alexithymia, autism spectrum characteristics [79,80], social anxiety, and rejection sensitivity [27], should be systematically examined. These factors may influence how ED individuals experience self-other overlap—e.g., alexithymia and autism spectrum characteristics have been shown to embodiment susceptibility (either attenuating or strengthening it) outside of ED contexts [81]—or whether they interpret the illusion as an emotionally-charged social encounter that drives self-consciousness.
In line with predictive coding frameworks, the affective consequences of the illusion may arise from the interplay between incoming sensory input (e.g., seeing the model’s face) and rigid, maladaptive socially-driven prior beliefs (e.g., “others judge my appearance negatively”). Future researchers should therefore investigate how individuals with EDs perceive social evaluation, particularly beliefs about being judged due to their ED and discomfort with their face being seen or judged, and assess how these priors moderate enfacement outcomes. Moreover, research should examine whether self-face representations in EDs are indeed less distorted due to their weaker emotional salience, or whether they become distorted only within certain social contexts.
Clinically, the current findings of increased head dissatisfaction in ED participants post-enfacement prompt caution against enfacement-based interventions for EDs that do not account for the social dynamics embedded in the task. Nonetheless, these findings do not discourage future research into enfacement-based interventions for EDs. Prior evidence supports the potential for enfacement to recalibrate and improve face and body image disturbance in individuals with low levels of ED symptoms [37], suggesting the illusion may have preventive or subclinical applications. However, for clinical ED groups, interventions may need to be adapted, such as by incorporating features that promote social safety and emotion regulation (e.g., non-judgmental facial expressions, averted gaze, or cognitive reappraisal techniques) or by reducing the social significance of the illusion (e.g., using avatars instead of real models).
Conclusions
Our findings underscore a potential dissociation in how multisensory processes contribute to face versus body image disturbance in EDs. While enfacement illusions may not offer universal therapeutic benefits for EDs, it may not be the illusion’s perceptual strength that matters most, but rather how the experience is interpreted on a socio-emotional level. Future researchers should investigate how interpersonal processing shapes self-perception in EDs and how enfacement interventions can be better tailored to these dynamics to enhance their therapeutic potential.
Author Contributions
Jade Portingale: Conceptualization, Methodology, Investigation, Formal Analysis, Data Curation, Project Administration, Visualization, Writing—Original Draft, Writing—Review & Editing. David Butler: Conceptualization, Methodology, Supervision, Writing—Review & Editing. Isabel Krug: Conceptualization, Methodology, Project Administration, Supervision, Writing—Review & Editing.
Funding
This research was supported by a Medical Dentistry Health Science Mid-Career Seeding Ideas Grant Scheme, The University of Melbourne (“Enfacement in Eating Disorders”, Krug, I., Butler, D., Bartholomeusz, C., & van Rheenen, T., 2020) (ID: MCRSIG016).
Institutional Review Board Statement
The authors assert that all procedures contributing to this work comply with the ethical standards of the National Health and Medical Research Council (NHMRC) Human Research Ethics Committee and with the Helsinki Declaration of 1975, as revised in 2008. Informed consent was obtained from all subjects involved in the study. All authors have provided consent for publication. Informed consent has been obtained from all subjects for publication of identifying images used in the Figure in an online open-access publication.
Data Availability Statement
The datasets analysed during the current study are available from the corresponding author upon request.
Acknowledgments
Jade Portingale completed this work as part of her PhD requirements at The University of Melbourne. We would like to thank Lili Belle Vincent, Jan Teh, Milly Tupthim, Jessica Dowdell, Sarah Pearse, Kayla Purnomo, Zhen An, Hermione Liu, Navya Singh, Jane Oon, Kaitlyn McVicar, Catherine Duong, Valentina Zevallos, and Jocelyn Clarke for their invaluable assistance with data collection. Special thanks as well to Jocelyn Clarke and Lirim Mustafovski for their assistance with scoring the clinical data.
Conflicts of Interest
The authors have no conflicts of interest to declare.
References
- American Psychiatric Association. Diagnostic and Statistical Manual of Mental Disorders, 5th ed., text rev.; American Psychiatric Publishing, 2022.
- Prnjak, K.; Jukic, I.; Mitchison, D.; Griffiths, S.; Hay, P. Body Image as a Multidimensional Concept: A Systematic Review of Body Image Facets in Eating Disorders and Muscle Dysmorphia. Body Image 2022, 42, 347–360. [Google Scholar] [CrossRef]
- Glashouwer, K. A.; Van Der Veer, R. M. L.; Adipatria, F.; De Jong, P. J.; Vocks, S. The Role of Body Image Disturbance in the Onset, Maintenance, and Relapse of Anorexia Nervosa: A Systematic Review. Clin. Psychol. Rev. 2019, 74, 101771. [Google Scholar] [CrossRef] [PubMed]
- Mölbert, S. C.; Klein, L.; Thaler, A.; Mohler, B. J.; Brozzo, C.; Martus, P.; Karnath, H.-O.; Zipfel, S.; Giel, K. E. Depictive and Metric Body Size Estimation in Anorexia Nervosa and Bulimia Nervosa: A Systematic Review and Meta-Analysis. Clin. Psychol. Rev. 2017, 57, 21–31. [Google Scholar] [CrossRef] [PubMed]
- Ralph-Nearman, C.; Arevian, A. C.; Moseman, S.; Sinik, M.; Chappelle, S.; Feusner, J. D.; Khalsa, S. S. Visual Mapping of Body Image Disturbance in Anorexia Nervosa Reveals Objective Markers of Illness Severity. Sci. Rep. 2021, 11(1), 12262. [Google Scholar] [CrossRef]
- Boehm, I.; Finke, B.; Tam, F. I.; Fittig, E.; Scholz, M.; Gantchev, K.; Roessner, V.; Ehrlich, S. Effects of Perceptual Body Image Distortion and Early Weight Gain on Long-Term Outcome of Adolescent Anorexia Nervosa. Eur. Child Adolesc. Psychiatry 2016, 25(12), 1319–1326. [Google Scholar] [CrossRef]
- Gardner, R. M.; Brown, D. L. Body Size Estimation in Anorexia Nervosa: A Brief Review of Findings from 2003 through 2013. Psychiatry Res. 2014, 219(3), 407–410. [Google Scholar] [CrossRef]
- Fairburn, C. G.; Cooper, Z.; Shafran, R. Cognitive Behaviour Therapy for Eating Disorders: A “Transdiagnostic” Theory and Treatment. Behav. Res. Ther. 2003, 41(5), 509–528. [Google Scholar] [CrossRef]
- Dalhoff, A. W.; Romero Frausto, H.; Romer, G.; Wessing, I. Perceptive Body Image Distortion in Adolescent Anorexia Nervosa: Changes After Treatment. Front. Psychiatry 2019, 10, 748. [Google Scholar] [CrossRef]
- Berlucchi, G.; Aglioti, S. M. The Body in the Brain Revisited. Exp. Brain Res. 2010, 200(1), 25–35. [Google Scholar] [CrossRef]
- Blanke, O.; Slater, M.; Serino, A. Behavioral, Neural, and Computational Principles of Bodily Self-Consciousness. Neuron 2015, 88(1), 145–166. [Google Scholar] [CrossRef]
- Pyasik, M.; Ciorli, T.; Pia, L. Full Body Illusion and Cognition: A Systematic Review of the Literature. Neurosci. Biobehav. Rev. 2022, 143, 104926. [Google Scholar] [CrossRef] [PubMed]
- Botvinick, M.; Cohen, J. Rubber Hands ‘Feel’ Touch That Eyes See. Nature 1998, 391(6669), 756. [Google Scholar] [CrossRef] [PubMed]
- Petkova, V. I.; Ehrsson, H. H. If I Were You: Perceptual Illusion of Body Swapping. PLoS ONE 2008, 3(12), e3832. [Google Scholar] [CrossRef]
- Portingale, J.; Krug, I.; Liu, H.; Kiropoulos, L.; Butler, D. Your Body, My Experience: A Systematic Review of Embodiment Illusions as a Function of and Method to Improve Body Image Disturbance. Clin. Psychol. Sci. Pract. 2024, 31(4), 445–458. [Google Scholar] [CrossRef]
- Eshkevari, E.; Rieger, E.; Longo, M. R.; Haggard, P.; Treasure, J. Increased Plasticity of the Bodily Self in Eating Disorders. Psychol. Med. 2012, 42(4), 819–828. [Google Scholar] [CrossRef]
- Eshkevari, E.; Rieger, E.; Longo, M. R.; Haggard, P.; Treasure, J. Persistent Body Image Disturbance Following Recovery from Eating Disorders. Int. J. Eat. Disord. 2014, 47(4), 400–409. [Google Scholar] [CrossRef]
- Keizer, A.; Smeets, M. A. M.; Postma, A.; Van Elburg, A.; Dijkerman, H. C. Does the Experience of Ownership over a Rubber Hand Change Body Size Perception in Anorexia Nervosa Patients? Neuropsychologia 2014, 62, 26–37. [Google Scholar] [CrossRef]
- Keizer, A.; Van Elburg, A.; Helms, R.; Dijkerman, H. C. A Virtual Reality Full Body Illusion Improves Body Image Disturbance in Anorexia Nervosa. PLOS ONE 2016, 11(10), e0163921. [Google Scholar] [CrossRef]
- Preston, C.; Ehrsson, H. H. Implicit and Explicit Changes in Body Satisfaction Evoked by Body Size Illusions: Implications for Eating Disorder Vulnerability in Women. PLOS ONE 2018, 13(6), e0199426. [Google Scholar] [CrossRef]
- Carey, M.; Preston, C. Investigating the Components of Body Image Disturbance Within Eating Disorders. Front. Psychiatry 2019, 10, 635. [Google Scholar] [CrossRef]
- Porciello, G.; Bufalari, I.; Minio-Paluello, I.; Di Pace, E.; Aglioti, S. M. The ‘Enfacement’ Illusion: A Window on the Plasticity of the Self. Cortex 2018, 104, 261–275. [Google Scholar] [CrossRef]
- Hugenberg, K.; Wilson, J. P. Faces Are Central to Social Cognition; The Oxford handbook of social cognition, 2013.
- Zebrowitz, L. A.; Montepare, J. M. Social Psychological Face Perception: Why Appearance Matters. Soc. Personal. Psychol. Compass 2008, 2(3), 1497–1517. [Google Scholar] [CrossRef] [PubMed]
- Croce, S. R.; Malcolm, A. C.; Ralph-Nearman, C.; Phillipou, A. The Role of Identity in Anorexia Nervosa: A Narrative Review. New Ideas Psychol. 2024, 72, 101060. [Google Scholar] [CrossRef]
- Verschueren, M.; Luyckx, K.; Kaufman, E. A.; Vansteenkiste, M.; Moons, P.; Sleuwaegen, E.; Berens, A.; Schoevaerts, K.; Claes, L. Identity Processes and Statuses in Patients with and without Eating Disorders. Eur. Eat. Disord. Rev. 2017, 25(1), 26–35. [Google Scholar] [CrossRef] [PubMed]
- Cardi, V.; Tchanturia, K.; Treasure, J. Premorbid and Illness-Related Social Difficulties in Eating Disorders: An Overview of the Literature and Treatment Developments. Curr. Neuropharmacol. 2018, 16(8), 1122–1130. [Google Scholar] [CrossRef]
- Dane, A.; Bhatia, K. The Social Media Diet: A Scoping Review to Investigate the Association between Social Media, Body Image and Eating Disorders amongst Young People. PLOS Glob. Public Health 2023, 3(3), e0001091. [Google Scholar] [CrossRef]
- Beos, N.; Kemps, E.; Prichard, I. Photo Manipulation as a Predictor of Facial Dissatisfaction and Cosmetic Procedure Attitudes. Body Image 2021, 39, 194–201. [Google Scholar] [CrossRef]
- Yang, J.; Fardouly, J.; Wang, Y.; Shi, W. Selfie-Viewing and Facial Dissatisfaction among Emerging Adults: A Moderated Mediation Model of Appearance Comparisons and Self-Objectification. Int. J. Environ. Res. Public. Health 2020, 17(2), 672. [Google Scholar] [CrossRef]
- Hirot, F.; Lesage, M.; Pedron, L.; Meyer, I.; Thomas, P.; Cottencin, O.; Guardia, D. Impaired Processing of Self-Face Recognition in Anorexia Nervosa. Eat. Weight Disord. - Stud. Anorex. Bulim. Obes. 2016, 21(1), 31–40. [Google Scholar] [CrossRef]
- Portingale, J.; Krug, I.; Butler, D. Beyond Body Image: Self-face Recognition and Negative Self-face Evaluations in Women at High Risk for an Eating Disorder. Eur. Eat. Disord. Rev. 2025, 33(2), 374–389. [Google Scholar] [CrossRef]
- Hrabosky, J. I.; Cash, T. F.; Veale, D.; Neziroglu, F.; Soll, E. A.; Garner, D. M.; Strachan-Kinser, M.; Bakke, B.; Clauss, L. J.; Phillips, K. A. Multidimensional Body Image Comparisons among Patients with Eating Disorders, Body Dysmorphic Disorder, and Clinical Controls: A Multisite Study. Body Image 2009, 6(3), 155–163. [Google Scholar] [CrossRef] [PubMed]
- Sforza, A.; Bufalari, I.; Haggard, P.; Aglioti, S. M. My Face in Yours: Visuo-Tactile Facial Stimulation Influences Sense of Identity. Soc. Neurosci. 2010, 5(2), 148–162. [Google Scholar] [CrossRef]
- Tsakiris, M. Looking for Myself: Current Multisensory Input Alters Self-Face Recognition. PLoS ONE 2008, 3(12), e4040. [Google Scholar] [CrossRef] [PubMed]
- Portingale, J.; Krug, I.; Butler, D. Enfacement Illusions: Filling a Knowledge Gap in Eating Disorder Risk Assessment, Prevention, and Intervention? Int. J. Eat. Disord. 2024, 57(9), 1805–1810. [Google Scholar] [CrossRef]
- Portingale, J.; Krug, I.; Rheenen, T. E. V.; Kiropoulos, L.; Bartholomeusz, C. F.; Nasser, H.; Butler, D. Divergent Effects of the Enfacement Illusion on Face and Body Image Disturbance Across Female Eating Disorder Risk Groups. In Review January 23, 2025. [CrossRef]
- Garner, D. M.; Olmsted, M. P.; Bohr, Y.; Garfinkel, P. E. The Eating Attitudes Test: Psychometric Features and Clinical Correlates. Psychol. Med. 1982, 12(4), 871–878. [Google Scholar] [CrossRef]
- Scarpina, F.; Serino, S.; Keizer, A.; Chirico, A.; Scacchi, M.; Castelnuovo, G.; Mauro, A.; Riva, G. The Effect of a Virtual-Reality Full-Body Illusion on Body Representation in Obesity. J. Clin. Med. 2019, 8(9), 1330. [Google Scholar] [CrossRef]
- Portingale, J.; Butler, D.; Krug, I. Novel Online Enfacement Illusion for Investigating Self-Perception in Mental Disorders: An Experimental Study Protocol. J. Eat. Disord. 2024, 12(1), 94. [Google Scholar] [CrossRef]
- American Psychiatric Association. Diagnostic and Statistical Manual of Mental Disorders, Fifth Edition.; American Psychiatric Association, 2013. [CrossRef]
- Cooper, Z.; Fairburn, C. The Eating Disorder Examination: A Semi-Structured Interview for the Assessment of the Specific Psychopathology of Eating Disorders. Int. J. Eat. Disord. 1987, 6(1), 1–8. [Google Scholar] [CrossRef]
- De Jager, S.; Coetzee, N.; Coetzee, V. Facial Adiposity, Attractiveness, and Health: A Review. Front. Psychol. 2018, 9, 2562. [Google Scholar] [CrossRef]
- Panagiotopoulou, E.; Crucianelli, L.; Lemma, A.; Fotopoulou, A. Identifying with the Beautiful: Facial Attractiveness Effects on Unisensory and Multisensory Self–Other Distinction. Q. J. Exp. Psychol. 2022, 75(7), 1314–1329. [Google Scholar] [CrossRef]
- Abrosoft. FantaMorph, 2020. Available online: https://www.fantamorph.com.
- Panagiotopoulou, E.; Filippetti, M. L.; Tsakiris, M.; Fotopoulou, A. Affective Touch Enhances Self-Face Recognition During Multisensory Integration. Sci. Rep. 2017, 7(1), 12883. [Google Scholar] [CrossRef] [PubMed]
- Coetzee, V.; Faerber, S. J.; Greeff, J. M.; Lefevre, C. E.; Re, D. E.; Perrett, D. I. African Perceptions of Female Attractiveness. PLoS ONE 2012, 7(10), e48116. [Google Scholar] [CrossRef] [PubMed]
- Tinlin, R. M.; Watkins, C. D.; Welling, L. L. M.; DeBruine, L. M.; Al-Dujaili, E. A. S.; Jones, B. C. Perceived Facial Adiposity Conveys Information about Women’s Health. Br. J. Psychol. 2013, 104(2), 235–248. [Google Scholar] [CrossRef]
- Slade, P. D.; Dewey, M. E.; Newton, T.; Brodie, D.; Kiemle, G. Development and Preliminary Validation of the Body Satisfaction Scale (BSS). Psychol. Health 1990, 4(3), 213–220. [Google Scholar] [CrossRef]
- Rohde, P.; Stice, E.; Shaw, H.; Gau, J. M.; Ohls, O. C. Age Effects in Eating Disorder Baseline Risk Factors and Prevention Intervention Effects. Int. J. Eat. Disord. 2017, 50(11), 1273–1280. [Google Scholar] [CrossRef]
- Potterton, R.; Richards, K.; Allen, K.; Schmidt, U. Eating Disorders During Emerging Adulthood: A Systematic Scoping Review. Front. Psychol. 2020, 10, 3062. [Google Scholar] [CrossRef]
- Tajadura-Jiménez, A.; Longo, M. R.; Coleman, R.; Tsakiris, M. The Person in the Mirror: Using the Enfacement Illusion to Investigate the Experiential Structure of Self-Identification. Conscious. Cogn. 2012, 21(4), 1725–1738. [Google Scholar] [CrossRef]
- Turbyne, C.; Goedhart, A.; De Koning, P.; Schirmbeck, F.; Denys, D. Systematic Review and Meta-Analysis of Virtual Reality in Mental Healthcare: Effects of Full Body Illusions on Body Image Disturbance. Front. Virtual Real. 2021, 2, 657638. [Google Scholar] [CrossRef]
- Nakagawa, S.; Schielzeth, H. A General and Simple Method for Obtaining R2 from Generalized Linear Mixed-effects Models. Methods Ecol. Evol. 2013, 4(2), 133–142. [Google Scholar] [CrossRef]
- Rights, J. D.; Sterba, S. K. Quantifying Explained Variance in Multilevel Models: An Integrative Framework for Defining R-Squared Measures. Psychol. Methods 2019, 24(3), 309–338. [Google Scholar] [CrossRef]
- Bates, D.; Mächler, M.; Bolker, B.; Walker, S. Fitting Linear Mixed-Effects Models Using Lme4. J. Stat. Softw. 2015, 67(1). [Google Scholar] [CrossRef]
- Kuznetsova, A.; Brockhoff, P. B.; Christensen, R. H. B. lmerTest Package: Tests in Linear Mixed Effects Models. J. Stat. Softw. 2017, 82(13). [Google Scholar] [CrossRef]
- Nasr, S.; Tootell, R. B. H. Role of Fusiform and Anterior Temporal Cortical Areas in Facial Recognition. NeuroImage 2012, 63(3), 1743–1753. [Google Scholar] [CrossRef] [PubMed]
- Pann, A.; Bonnard, M.; Felician, O.; Romaiguère, P. The Extrastriate Body Area and Identity Processing: An fMRI Guided TMS Study. Physiol. Rep. 2021, 9(8). [Google Scholar] [CrossRef]
- Apps, M. A. J.; Tsakiris, M. The Free-Energy Self: A Predictive Coding Account of Self-Recognition. Neurosci. Biobehav. Rev. 2014, 41, 85–97. [Google Scholar] [CrossRef]
- Friston, K. The Free-Energy Principle: A Unified Brain Theory? Nat. Rev. Neurosci. 2010, 11(2), 127–138. [Google Scholar] [CrossRef]
- Brizzi, G.; Sansoni, M.; Di Lernia, D.; Frisone, F.; Tuena, C.; Riva, G. The Multisensory Mind: A Systematic Review of Multisensory Integration Processing in Anorexia and Bulimia Nervosa. J. Eat. Disord. 2023, 11(1), 204. [Google Scholar] [CrossRef]
- Toh, W. L.; Grace, S. A.; Rossell, S. L.; Castle, D. J.; Phillipou, A. Body Parts of Clinical Concern in Anorexia Nervosa versus Body Dysmorphic Disorder: A Cross-Diagnostic Comparison. Australas. Psychiatry 2020, 28(2), 134–139. [Google Scholar] [CrossRef]
- Sfärlea, A.; Radix, A. K.; Schulte-Körne, G.; Legenbauer, T.; Platt, B. Attention Biases for Eating Disorder-Related Stimuli Versus Social Stimuli in Adolescents with Anorexia Nervosa – An Eye-Tracking Study. Res. Child Adolesc. Psychopathol. 2023, 51(4), 541–555. [Google Scholar] [CrossRef]
- Germine, L. T.; Duchaine, B.; Nakayama, K. Where Cognitive Development and Aging Meet: Face Learning Ability Peaks after Age 30. Cognition 2011, 118(2), 201–210. [Google Scholar] [CrossRef]
- Phillipou, A.; Abel, L. A.; Castle, D. J.; Hughes, M. E.; Gurvich, C.; Nibbs, R. G.; Rossell, S. L. Self Perception and Facial Emotion Perception of Others in Anorexia Nervosa. Front. Psychol. 2015, 6. [Google Scholar] [CrossRef] [PubMed]
- Rowlands, K.; Wilson, E.; Simic, M.; Harrison, A.; Cardi, V. A Critical Review of Studies Assessing Interpretation Bias Towards Social Stimuli in People With Eating Disorders and the Development and Pilot Testing of Novel Stimuli for a Cognitive Bias Modification Training. Front. Psychol. 2020, 11, 538527. [Google Scholar] [CrossRef] [PubMed]
- Riva, G. Neuroscience and Eating Disorders: The Allocentric Lock Hypothesis. Med. Hypotheses 2012, 78(2), 254–257. [Google Scholar] [CrossRef]
- Riva, G.; Dakanalis, A. Altered Processing and Integration of Multisensory Bodily Representations and Signals in Eating Disorders: A Possible Path Toward the Understanding of Their Underlying Causes. Front. Hum. Neurosci. 2018, 12, 49. [Google Scholar] [CrossRef]
- Provenzano, L.; Porciello, G.; Ciccarone, S.; Lenggenhager, B.; Tieri, G.; Marucci, M.; Dazzi, F.; Loriedo, C.; Bufalari, I. Characterizing Body Image Distortion and Bodily Self-Plasticity in Anorexia Nervosa via Visuo-Tactile Stimulation in Virtual Reality. J. Clin. Med. 2019, 9(1), 98. [Google Scholar] [CrossRef]
- Serino, S.; Chirico, A.; Pedroli, E.; Polli, N.; Cacciatore, C.; Riva, G. Two-Phases Innovative Treatment for Anorexia Nervosa: The Potential of Virtual Reality Body-Swap. Annu Rev CyberTherapy Telemed 2017, 15, 111–115. [Google Scholar]
- Zopf, R.; Contini, E.; Fowler, C.; Mondraty, N.; Williams, M. A. Body Distortions in Anorexia Nervosa: Evidence for Changed Processing of Multisensory Bodily Signals. Psychiatry Res. 2016, 245, 473–481. [Google Scholar] [CrossRef]
- Monteleone, A. M.; Cascino, G. A Systematic Review of Network Analysis Studies in Eating Disorders: Is Time to Broaden the Core Psychopathology to Non Specific Symptoms. Eur. Eat. Disord. Rev. 2021, 29(4), 531–547. [Google Scholar] [CrossRef]
- Fardouly, J.; Pinkus, R. T.; Vartanian, L. R. The Impact of Appearance Comparisons Made through Social Media, Traditional Media, and in Person in Women’s Everyday Lives. Body Image 2017, 20, 31–39. [Google Scholar] [CrossRef]
- Frederick, D. A.; Kelly, M. C.; Latner, J. D.; Sandhu, G.; Tsong, Y. Body Image and Face Image in Asian American and White Women: Examining Associations with Surveillance, Construal of Self, Perfectionism, and Sociocultural Pressures. Body Image 2016, 16, 113–125. [Google Scholar] [CrossRef]
- Mellor, D.; Waterhouse, M.; Mamat, N. H. B.; Xu, X.; Cochrane, J.; McCabe, M.; Ricciardelli, L. Which Body Features Are Associated with Female Adolescents’ Body Dissatisfaction? A Cross-Cultural Study in Australia, China and Malaysia. Body Image 2013, 10(1), 54–61. [Google Scholar] [CrossRef] [PubMed]
- Portingale, J.; Krug, I.; Butler, D. Whose Body Is It Anyway? Cultural Reflections on Embodiment Illusion Research in Eating Disorders and Body Dysmorphic Disorder. Front. Psychiatry 2024, 15, 1433596. [Google Scholar] [CrossRef]
- Westwood, H.; Kerr-Gaffney, J.; Stahl, D.; Tchanturia, K. Alexithymia in Eating Disorders: Systematic Review and Meta-Analyses of Studies Using the Toronto Alexithymia Scale. J. Psychosom. Res. 2017, 99, 66–81. [Google Scholar] [CrossRef] [PubMed]
- Huke, V.; Turk, J.; Saeidi, S.; Kent, A.; Morgan, John. F. Autism Spectrum Disorders in Eating Disorder Populations: A Systematic Review. Eur. Eat. Disord. Rev. 2013, 21(5), 345–351. [CrossRef]
- Crespi, B.; Dinsdale, N. Autism and Psychosis as Diametrical Disorders of Embodiment. Evol. Med. Public Health 2019, eoz021. [Google Scholar] [CrossRef]
Table 1.
Participant Demographic and Clinical Characteristics.
| Variable | Group | ||||
| ED (n = 19) |
Control (n = 24) |
Total (N = 43) |
t/χ2 |
p | |
| Age (M ± SD) | 27.47 ± 10.70 | 21.50 ± 4.77 | 24.14 ± 8.40 | -2.45 | 0.019 |
| BMI (M ± SD) | 21.15 ± 7.00 | 22.60 ± 3.55 | 21.96 ± 5.34 | 0.89 | 0.381 |
| Primary language spoken at home (n, %) | 2.55 | 0.110 | |||
| English | 19 (100.0%) | 21 (87.5%) | 40 (93.0%) | ||
| Other | 0 (0.0%) | 3 (12.5%) | 3 (7.0%) | ||
| Highest education completed (n, %) | 11.18 | 0.048 | |||
| Year 12 or below | 7 (36.8%) | 15 (62.5%) | 22 (51.2%) | ||
| Certificate/diploma | 4 (21.0%) | 0 (0.0%) | 4 (9.4%) | ||
| Bachelor’s degree | 5 (26.3%) | 4 (16.7%) | 9 (20.9%) | ||
| Postgraduate degree (e.g., Honours, Masters, PhD) | 3 (15.8%) | 5 (20.8%) | 8 (18.6%) | ||
| Sexual orientation (n, %) | 4.13 | 0.388 | |||
| Heterosexual | 11 (57.9%) | 16 (66.7%) | 27 (62.8%) | ||
| Lesbian/gay | 1 (5.3%) | 0 (0.0%) | 1 (2.3%) | ||
| Bisexual | 4 (21.1%) | 6 (25.0%) | 10 (23.3%) | ||
| Asexual | 2 (10.5%) | 0 (0.0%) | 2 (4.7%) | ||
| Other | 1 (5.3%) | 2 (8.3%) | 3 (7.0%) | ||
| Marital status (n, %) | 3.51 | 0.320 | |||
| Single | 11 (57.9%) | 12 (50.0%) | 23 (53.5%) | ||
| Relationship (including open relationship) | 4 (21.1%) | 8 (33.3%) | 12 (27.9%) | ||
| Married | 2 (10.5%) | 0 (0.0%) | 2 (4.7%) | ||
| De facto | 2 (10.5%) | 4 (16.7%) | 6 (14.0%) | ||
| ED diagnosis type (yes, %) a | - | - | |||
| Anorexia nervosa (restricting) | 6 (31.6%) | - | - | ||
| Anorexia nervosa (binge-purge) | 2 (10.5%) | - | - | ||
| Bulimia nervosa | 2 (10.5%) | - | - | ||
| OSFED b | 9 (47.4%) | - | - | ||
| ED diagnosis duration (years) (M ± SD) | 5.31 ± 8.13 | - | - | - | - |
| Average age of ED onset (years) (M ± SD) | 22.16 ± 9.72 | - | - | - | - |
| EDE interview score (M ± SD) | - | - | |||
| Global severity | 4.02 ± 0.99 | - | - | ||
| Restraint | 3.99 ± 1.26 | - | - | ||
| Eating concern | 3.12 ± 1.13 | - | - | ||
| Weight concern | 4.87 ± 0.94 | - | - | ||
| Shape concern | 4.56 ± 1.12 | - | - | ||
| EAT-26 score (M ± SD) | 46.58 ± 13.05 | 2.79 ± 1.56 | 22.14 ± 23.63 | -14.54 | <0.001 |
Note. BMI = Body Mass Index (kg/m2); ED = eating disorder; OSFED = other specified feeding or eating disorder; M = mean; SD = standard deviation; EDE = Eating Disorder Examination interview v 17.0D (Cooper & Fairburn, 1987; Fairburn et al., 2018); EAT-26 = Eating Attitudes Test-26 item questionnaire (Garner et al., 1982). t-test for continuous variables, chi-squared test for categorical variables. a ED diagnosis type verified via the EDE interview. b OSFED types included atypical anorexia nervosa (n = 2), binge-eating disorder (of low frequency or limited duration) (n = 1), bulimia nervosa (of low frequency or limited duration) (n = 4), and purging disorder (n = 2). Significant (two-sided) p values are bolded.
Disclaimer/Publisher’s Note: The statements, opinions and data contained in all publications are solely those of the individual author(s) and contributor(s) and not of MDPI and/or the editor(s). MDPI and/or the editor(s) disclaim responsibility for any injury to people or property resulting from any ideas, methods, instructions or products referred to in the content. |
© 2025 by the authors. Licensee MDPI, Basel, Switzerland. This article is an open access article distributed under the terms and conditions of the Creative Commons Attribution (CC BY) license (https://creativecommons.org/licenses/by/4.0/).
Copyright: This open access article is published under a Creative Commons CC BY 4.0 license, which permit the free download, distribution, and reuse, provided that the author and preprint are cited in any reuse.


