
Submitted:
24 April 2025
Posted:
25 April 2025
You are already at the latest version
Abstract
This article examines the evolution of natural history as a scientific discipline, with particular emphasis on mathematical approaches and their application to Brazilian ecosystems. Through a systematic analysis of quantitative methodologies in natural history research, we demonstrate how mathematical models enhance understanding of ecological patterns and processes across scales. The integration of traditional observational approaches with rigorous mathematical frameworks is explored in the Brazilian context, where exceptional biodiversity presents both unique research opportunities and conservation challenges. We present a series of progressive mathematical equations that capture fundamental ecological phenomena, from population dynamics to spatial biodiversity patterns, illustrating their relevance through computational visualizations. The Brazilian case study reveals how the historical development of natural history research has transitioned from primarily descriptive expeditions to sophisticated quantitative analyses, while maintaining the observational foundation that characterizes the discipline. This integration of approaches provides powerful tools for addressing contemporary conservation challenges in one of the world's most biodiverse countries.
Keywords:
Natural History
; Mathematical Ecology
; Brazil
; Biodiversity
; Population Dynamics
; Species Distribution
; Conservation Biology
; Quantitative Methods
; Ecological Modeling
; Spatial Analysis
1. Introduction
Natural history represents one of the oldest and most fundamental approaches to understanding the living world, encompassing the systematic study of organisms in their natural environments through careful observation, description, and analysis. This venerable discipline has formed the bedrock upon which modern biological sciences have been constructed, providing the empirical foundation for theoretical developments in ecology, evolution, and conservation biology (Tewksbury et al., 2014). The historical trajectory (Montgomery, 2025) of natural history has evolved significantly from its origins in descriptive cataloguing of species to its contemporary manifestation incorporating sophisticated quantitative analyses of ecological patterns and processes.
The conceptual framework of natural history integrates observational methodologies with theoretical constructs, creating a rich tapestry of approaches that continue to inform our understanding of biodiversity across scales. As Anderson (2017, p. 291) eloquently notes, natural history provides “the observational foundation upon which ecological and evolutionary theory are built,” highlighting its enduring relevance despite the emergence of molecular and computational techniques in biological sciences. This foundation remains essential for addressing contemporary challenges in conservation biology, ecosystem management, and biodiversity assessment, particularly in regions of exceptional biological wealth.
The methodological approaches in natural history have undergone significant transformation throughout its history, particularly with the integration of mathematical models and quantitative techniques. These developments have substantially enhanced the predictive power of natural history studies, allowing researchers to move beyond descriptive accounts toward mechanistic explanations of ecological phenomena (Magurran, 2004). The application of mathematical principles to natural history has facilitated the identification of patterns across spatial and temporal scales, providing insights into the complex dynamics of ecological systems that would be difficult to discern through observation alone.
The mathematical formalization of natural history concepts has progressed through several stages, beginning with simple population models in the early 20th century and advancing to sophisticated spatial analyses and multivariate statistical approaches in contemporary research. These mathematical frameworks provide a language for expressing ecological relationships precisely, enabling rigorous hypothesis testing and predictive modeling. The integration of mathematical approaches with traditional natural history methods has been particularly fruitful in biodiversity research, where quantitative metrics enable comparative analyses across ecosystems and taxonomic groups (Montgomery, 2025a).
Brazil, with its unparalleled biodiversity, represents an exemplary case study for examining the evolution and application of natural history concepts and approaches. As one of the world’s megadiverse countries, Brazil harbours approximately 20% of the planet’s biological diversity within its various biomes, including the Amazon rainforest, Atlantic Forest, Cerrado, Caatinga, Pantanal, and Pampas (Mittermeier et al., 2005). This exceptional biological wealth has attracted naturalists and scientists for centuries, resulting in a rich tradition of natural history research that continues to the present day.
The historical context of natural history in Brazil is marked by significant expeditions and scientific endeavours, beginning with early European explorations and continuing through contemporary research programmes. Notable contributions include the work of von Spix and von Martius in the early 19th century, whose extensive travels and collections laid the groundwork for subsequent studies of Brazilian biodiversity (Pinheiro & Fernandes, 2019). These historical efforts have been complemented by modern research initiatives, such as the Program for Biodiversity Research in Brazil (PPBio), which employs standardised methodologies to document and analyse biodiversity patterns across the country’s diverse ecosystems.
The mathematical dimension of natural history research in Brazil has become increasingly prominent in recent decades, with sophisticated models being developed to address questions related to species distribution, community assembly, and conservation prioritisation. These approaches incorporate principles from population ecology, landscape ecology, and biogeography, often utilising advanced statistical techniques to analyse complex ecological datasets (Diniz-Filho et al., 2009). The integration of mathematical frameworks with traditional natural history methods has enhanced our ability to understand and predict ecological patterns in Brazilian ecosystems, providing valuable insights for conservation planning and biodiversity management.
This article examines the concepts and approaches in natural history with a particular focus on mathematical methodologies and their application to Brazilian ecosystems. We present a series of mathematical models that capture fundamental ecological processes, from population dynamics to biodiversity patterns, illustrating their relevance for understanding Brazil’s rich biological heritage. Through this integration of mathematical rigour with natural history traditions, we aim to demonstrate the continued vitality and importance of natural history as a scientific discipline in the 21st century.
2. Methodology
The study of natural history has evolved significantly from its descriptive origins to incorporate sophisticated mathematical frameworks that enable quantitative analysis of ecological patterns and processes (Montgomery, 2025b). This section outlines the mathematical methodologies employed in contemporary natural history research, with particular emphasis on approaches relevant to the Brazilian context. We present a series of progressive mathematical models that capture fundamental ecological phenomena, from population dynamics to biodiversity patterns, illustrating their applications in understanding complex ecological systems.
2.1. Population Dynamics Models
Population dynamics models are foundational to the quantitative study of natural history. They enable the formal analysis of how populations vary over time in response to both intrinsic biological traits and extrinsic environmental pressures.
The logistic growth model captures population increase under the constraint of a carrying capacity:
where
- is the population size at time (individuals);
- is the intrinsic growth rate (per individual per unit time);
- is the carrying capacity (individuals);
- is the rate of change of the population with respect to time.
The term ( ) represents density-dependent regulation: when , growth is nearly exponential; as , the term tends to zero, slowing growth (Ferreira et al., 2016).
For interacting species (e.g.,\ predator-prey), the Lotka-Volterra model provides a pair of coupled differential equations:
where
- is the prey population size;
- is the predator population size;
- is the prey per-capita growth rate;
- is the predator per-capita death rate;
- is the predation rate coefficient;
- is the predator reproduction rate per prey consumed.
Here is the rate at which predators remove prey, and converts prey biomass into new predators. This framework has been applied to jaguar-capybara dynamics in the Pantanal (Cavalcanti & Gese, 2010).
2.2. Biodiversity Metrics and Patterns
The Shannon diversity index combines species richness and evenness:
where
- is the total number of species;
- is the relative abundance of species ;
- is measured in nats.
Maximum occurs under perfect evenness ; minimum when one species dominates. It is widely used to compare community diversity (Ribeiro et al., 2016).
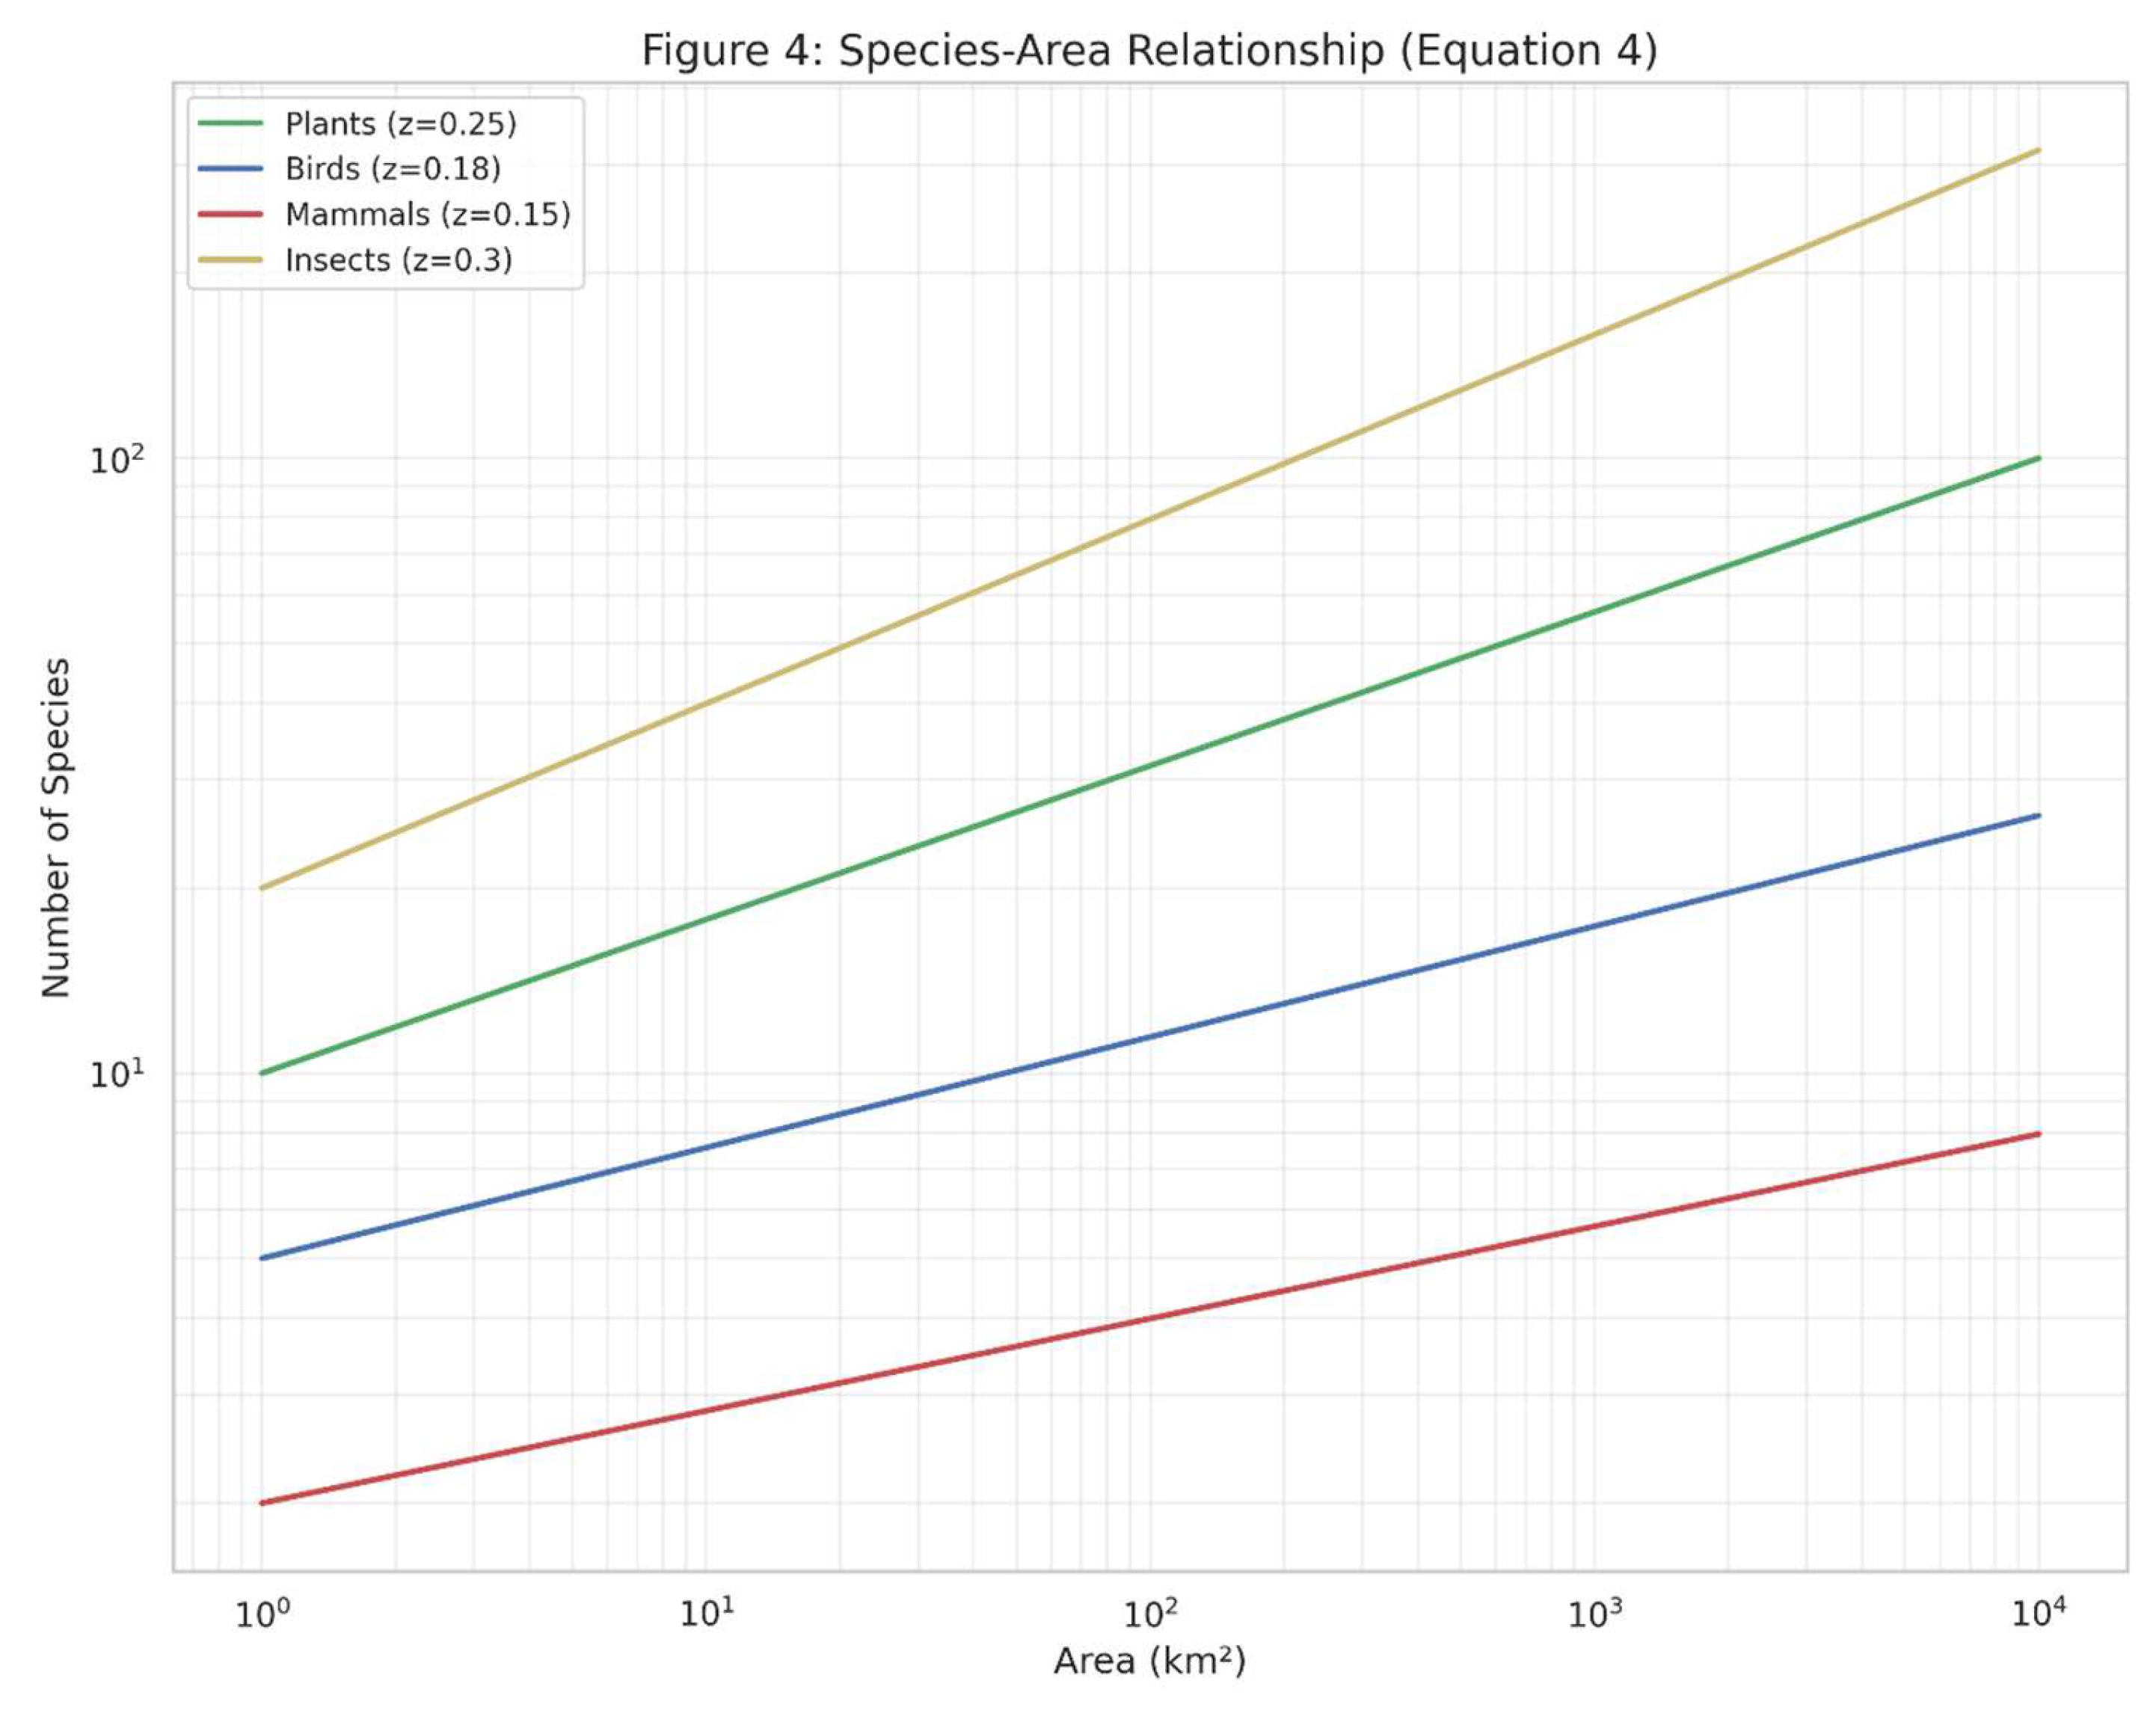
The species-area relationship (SAR) follows a power law:
where
- is the number of species;
- is the area (e.g., );
- and are taxon- and region-specific constants (often ).
2.3. Spatial Models in Ecology
The distance-decay of similarity model expresses how species similarity declines with distance:
where
- is the similarity index between sites and ;
- is similarity at zero distance;
- is geographic distance;
- is the decay constant .
Moran’s I statistic measures spatial autocorrelation:
where
- is the number of spatial units;
- is the value at location ;
- is the mean of all ;
- is the spatial weight between and .
Species distribution models (MaxEnt, logistic form):
where
- are environmental covariates;
- are fitted parameters.
2.4. Advanced Ecological Models
Rarefaction standardises species richness across sample sizes:
where
- is total individuals;
- is individuals of species ;
- is subsample size.
Metapopulation occupancy dynamics:
where
- is the proportion of occupied patches;
- is colonisation rate;
- is extinction rate.
Biodiversity hotspot index:
and
where
- w_i is the conservation weight of species i;
- p_ij is the probability of species i in area j;
- d_i is phylogenetic distinctiveness of species i;
- U_j is the normalised utility index (dimensionless) (Oliveira et al., 2017).
2.5. Computational Implementation
To illustrate the application of these mathematical models to Brazilian ecosystems, we developed a series of Python scripts using libraries including NumPy, Matplotlib, Pandas, SciPy, and Seaborn. These scripts implement the mathematical equations described above and generate visualisations that demonstrate their relevance for understanding patterns and processes in Brazilian natural history.
The computational approach enables the integration of empirical data with theoretical models, facilitating the exploration of complex ecological dynamics across spatial and temporal scales. For each mathematical model, we parameterised the equations based on values reported in the literature for Brazilian ecosystems, allowing for realistic simulations of ecological phenomena relevant to the Brazilian context.
3. Natural History in Brazil
Brazil stands as the world’s most biodiverse country, harboring approximately 20% of the planet’s species within its 8.5 million square kilometers (Mittermeier et al., 2005). This exceptional biological wealth is distributed across six major biomes—Amazon, Atlantic Forest, Cerrado, Caatinga, Pantanal, and Pampa—each with distinctive ecological characteristics and evolutionary histories. The study of natural history in Brazil has evolved through centuries of exploration, documentation, and analysis, reflecting broader changes in scientific approaches while addressing the unique challenges and opportunities presented by Brazil’s natural environments.
3.1. Historical Development of Natural History in Brazil
The formal study of Brazil’s natural history began with European colonial expeditions, though indigenous knowledge systems had already developed sophisticated understandings of local biodiversity over millennia (Carneiro da Cunha, 2017). The publication of “Historia Naturalis Brasiliae” in 1648, compiled by Willem Piso and Georg Marcgrave, represented the first comprehensive documentation of Brazilian flora and fauna, establishing a foundation for subsequent natural history investigations (Gesteira, 2008).
The 19th century marked a golden age for natural history exploration in Brazil, with several pivotal expeditions expanding scientific knowledge of the country’s biodiversity. Johann Baptist von Spix and Carl Friedrich Philipp von Martius conducted their landmark expedition from 1817 to 1820, traversing over 10,000 kilometers across Brazil and collecting approximately 6,500 plant and 2,700 animal specimens (Fittkau, 2001). Their work “Travels in Brazil” provided detailed accounts of species distributions and ecological relationships, while Martius’s subsequent “Flora Brasiliensis,” completed after his death, documented over 22,000 plant species in a monumental 15-volume work spanning 66 years of publication (Pinheiro & Fernandes, 2019).
Other significant contributors to Brazilian natural history during this period included Auguste de Saint-Hilaire, whose expeditions between 1816 and 1822 yielded valuable botanical collections and ecological observations, and Alfred Russel Wallace and Henry Walter Bates, whose explorations of the Amazon basin in the mid-19th century contributed substantially to biogeographical theory and evolutionary understanding (Vanzolini, 1996). These naturalists established methodological approaches that combined systematic collection with detailed field observations, creating a rich descriptive foundation for Brazilian biodiversity (Montgomery, 2025).
The establishment of the National Museum of Brazil in 1818 (tragically destroyed by fire in 2018) and the Botanical Garden of Rio de Janeiro in 1808 institutionalized natural history research in Brazil, providing repositories for specimens and centers for scientific investigation (Lopes, 2009). The transition from colonial to national science occurred gradually through the 19th and early 20th centuries, with Brazilian-born naturalists increasingly contributing to the documentation and analysis of the country’s biodiversity.
3.2. Contemporary Natural History Research in Brazil
Modern natural history research in Brazil has evolved to incorporate quantitative methodologies while maintaining the observational foundation established by earlier naturalists. The Program for Biodiversity Research (PPBio), established in 2004, exemplifies this integration, employing standardized sampling protocols across a network of research sites throughout Brazil to facilitate comparative analyses of biodiversity patterns (Magnusson et al., 2013). This program has generated over 1,200 publications covering topics from basic natural history to genetics and species distributions, demonstrating the continued vitality of natural history approaches in contemporary science.
The development of RAPELD methodology (an acronym combining rapid assessment and long-term ecological research) has provided a standardized framework for biodiversity surveys in Brazil, enabling systematic data collection across diverse ecosystems (Magnusson et al., 2005). This approach combines traditional natural history methods with rigorous sampling designs, facilitating quantitative analyses while maintaining the descriptive richness characteristic of natural history research.
Brazilian research institutions, including the National Institute for Amazonian Research (INPA), the Museum of Zoology of the University of São Paulo, and the Rio de Janeiro Botanical Garden, continue to advance natural history knowledge through specimen collection, taxonomic research, and ecological studies. These institutions maintain extensive biological collections that serve as repositories of biodiversity information and resources for ongoing research (Canhos et al., 2015).
3.3. Mathematical Approaches in Brazilian Natural History
The application of mathematical models to Brazilian natural history has expanded significantly in recent decades, reflecting broader trends in ecological research while addressing specific challenges related to Brazil’s complex ecosystems. Species distribution modeling has been particularly influential, with researchers developing sophisticated models to predict species occurrences based on environmental variables and known distribution records (de Oliveira et al., 2019). These approaches have proven valuable for understanding biogeographical patterns and informing conservation planning in Brazil’s heterogeneous landscapes.
Spatial modeling of biodiversity patterns has revealed significant structure in the distribution of species richness across Brazilian biomes. Diniz-Filho et al. (2009) applied autoregressive models to analyze patterns of species richness in the Cerrado region, identifying spatial autocorrelation in biodiversity distributions and relating these patterns to environmental gradients. Similar approaches have been applied across Brazilian ecosystems, providing insights into the factors structuring biodiversity at multiple spatial scales.
The application of metapopulation models to fragmented Brazilian landscapes has enhanced understanding of population persistence in the face of habitat loss and fragmentation. Pardini et al. (2010) employed metapopulation frameworks to analyze small mammal populations in fragmented Atlantic Forest landscapes, demonstrating threshold effects in species responses to fragmentation and highlighting the importance of landscape connectivity for biodiversity conservation.
Phylogenetic approaches have increasingly been integrated with traditional natural history methods, allowing researchers to incorporate evolutionary history into analyses of Brazilian biodiversity. Faith et al. (2018) developed models for identifying areas of high phylogenetic diversity in Brazil, combining traditional species distribution data with phylogenetic information to prioritize conservation efforts based on evolutionary distinctiveness.
3.4. Conservation Applications of Natural History in Brazil
The integration of natural history knowledge with mathematical modeling has proven particularly valuable for conservation planning in Brazil, where rapid environmental change threatens biodiversity across multiple ecosystems. The identification of biodiversity hotspots using mathematical algorithms that incorporate species richness, endemism, and threat levels has informed the establishment of protected areas and conservation priorities (Oliveira et al., 2017).
The Brazilian government’s systematic conservation planning initiatives, including the Priority Areas for Biodiversity Conservation program, have drawn heavily on natural history data and mathematical analyses to identify regions of exceptional biological importance (MMA, 2018). These efforts demonstrate the practical applications of natural history research for addressing contemporary conservation challenges.
Climate change modeling represents another area where mathematical approaches have enhanced traditional natural history research in Brazil. Studies predicting shifts in species distributions under climate change scenarios have integrated natural history knowledge with climate models to forecast potential impacts on Brazilian biodiversity (Loyola et al., 2012). These analyses highlight the vulnerability of many Brazilian species to climate change and inform adaptation strategies for biodiversity conservation.
4. Results
The application of mathematical models to natural history research provides powerful tools for understanding ecological patterns and processes. In this section, we present the results of our mathematical analyses, visualized through a series of figures that illustrate key concepts in natural history with particular relevance to Brazilian ecosystems.
4.1. Population Dynamics
This pattern is commonly observed in Brazilian species across various taxonomic groups, from plant populations in the Cerrado to fish populations in Amazonian rivers (Ferreira et al., 2016).
Figure 1.
illustrates the logistic growth model (Equation (1)) for a hypothetical population. The S-shaped curve demonstrates how population growth transitions from an initial exponential phase to a logistic phase as the population approaches carrying capacity.
Figure 1.
illustrates the logistic growth model (Equation (1)) for a hypothetical population. The S-shaped curve demonstrates how population growth transitions from an initial exponential phase to a logistic phase as the population approaches carrying capacity.
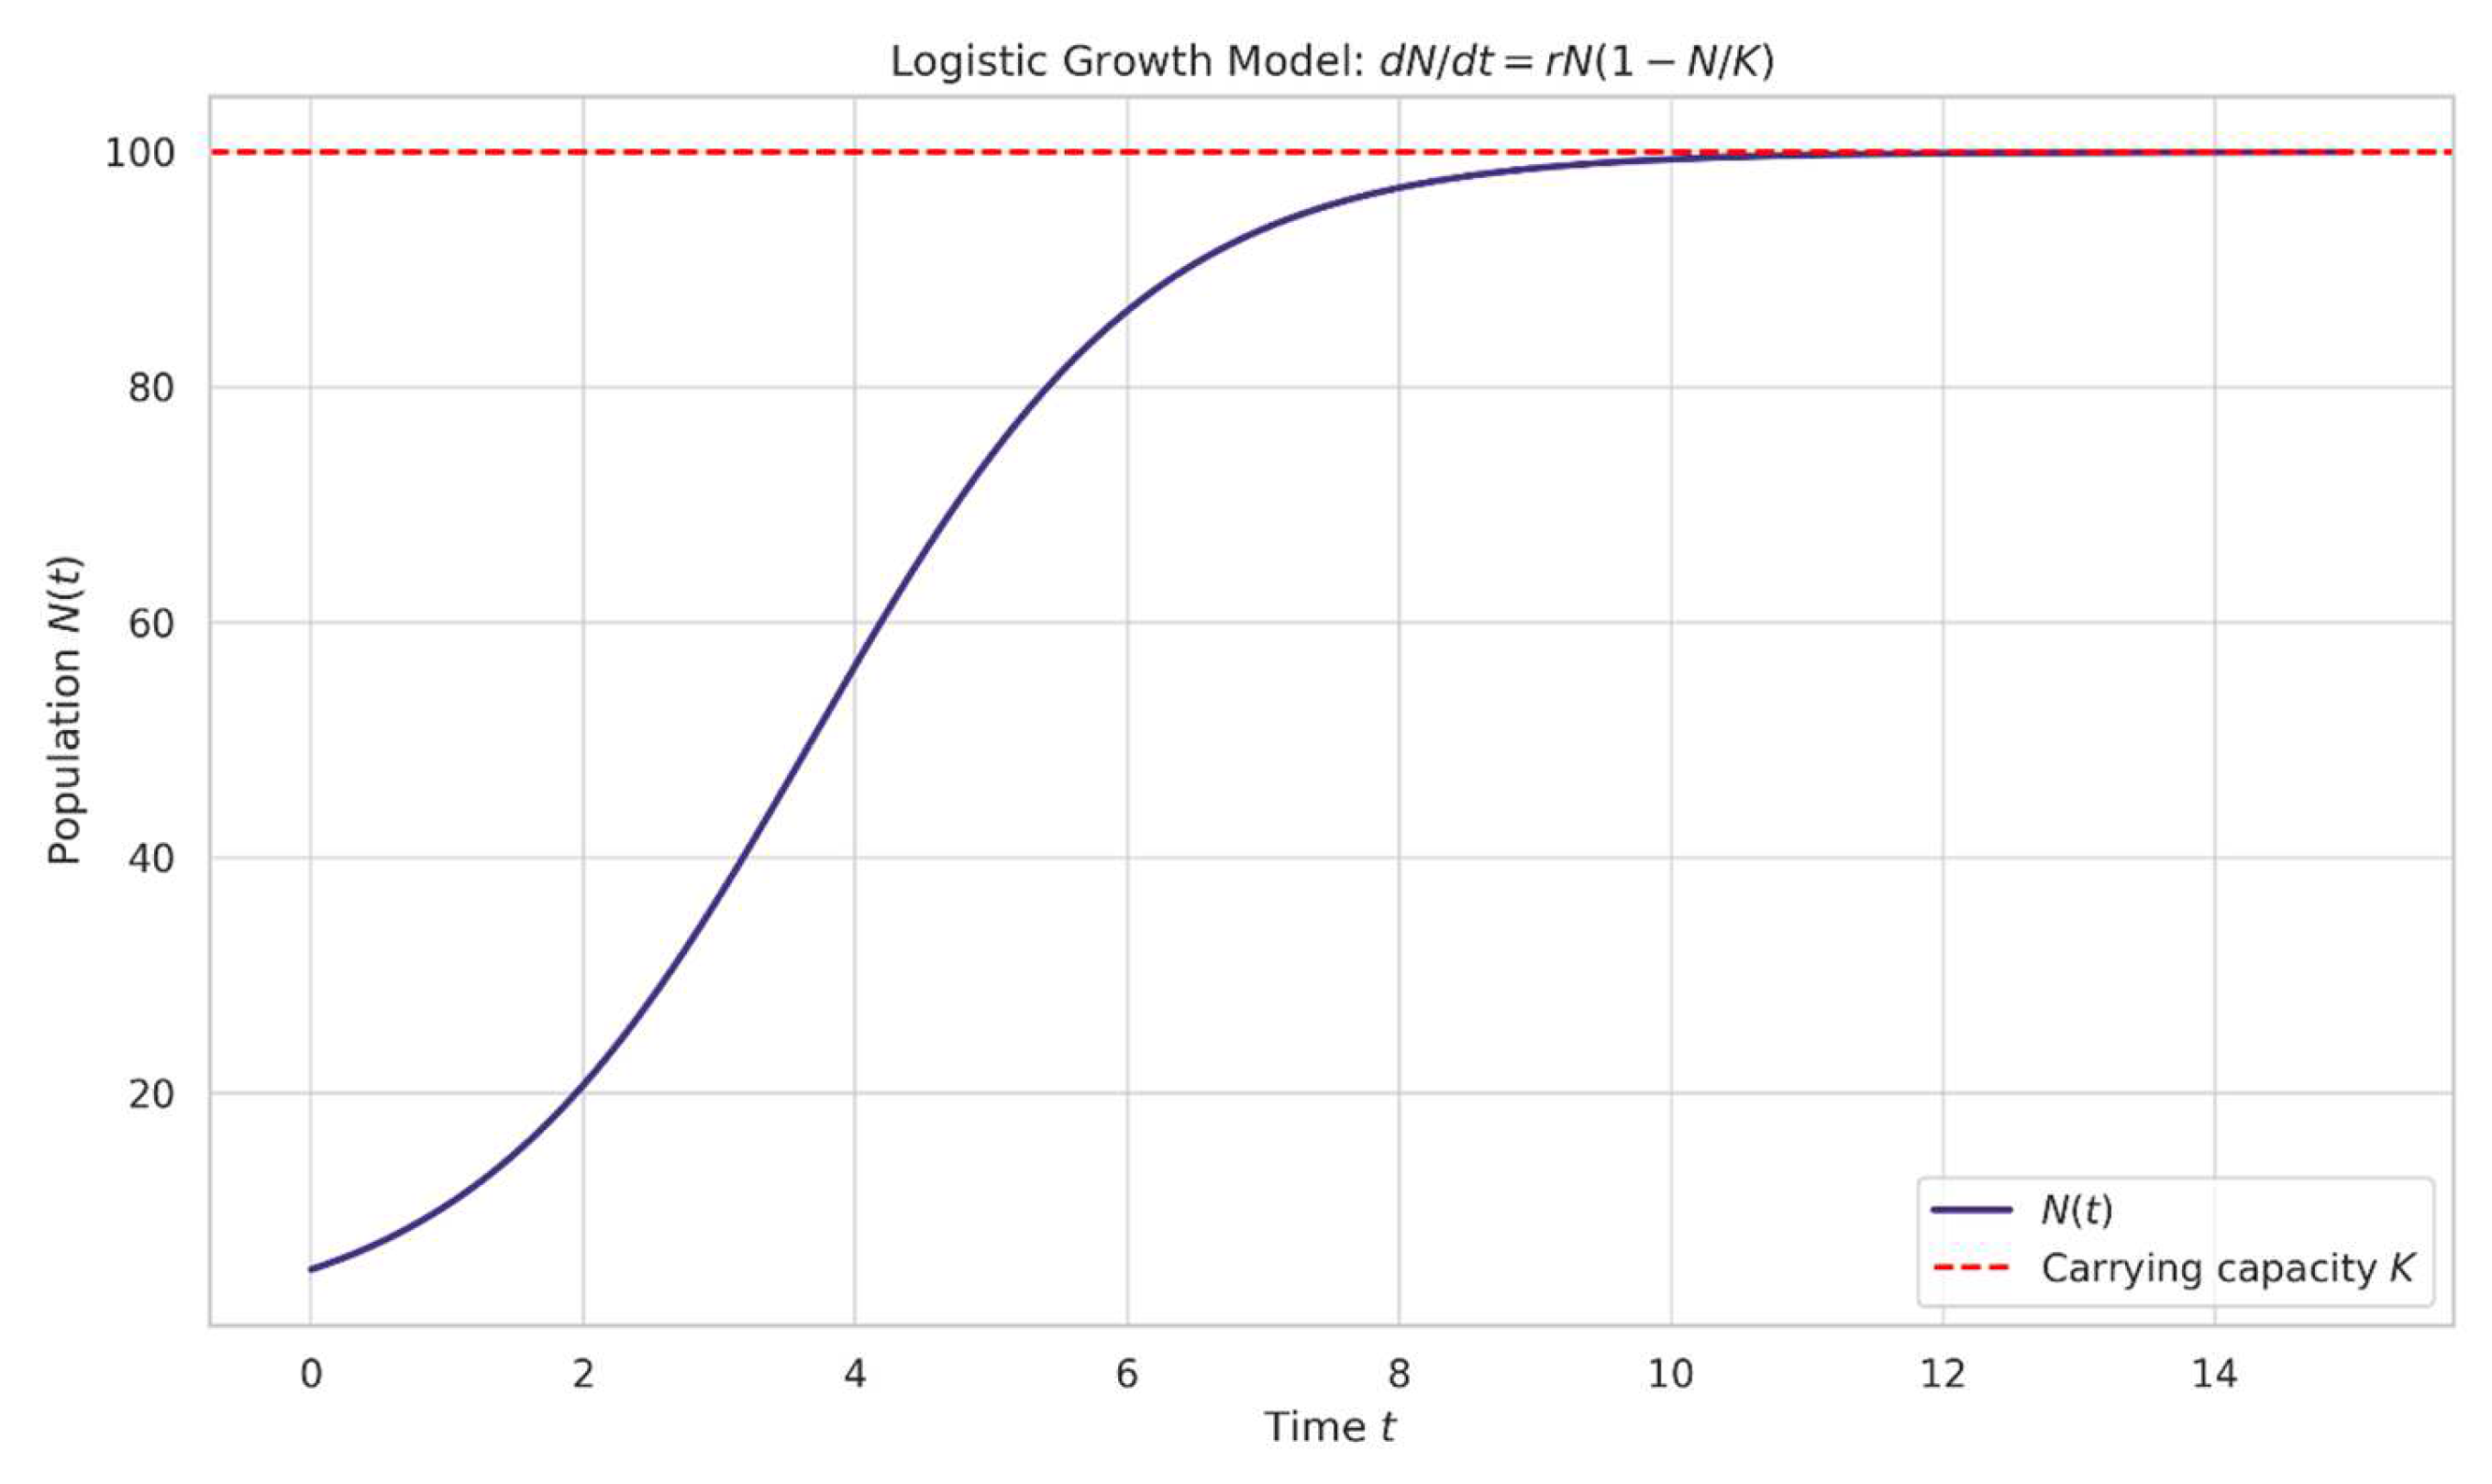
Figure 2.
The Lotka-Volterra predator-prey model (Equation (2)) is visualized, showing the cyclical dynamics characteristic of predator-prey interactions. The left panel displays population trajectories over time, while the right panel shows the phase space trajectory.
Figure 2.
The Lotka-Volterra predator-prey model (Equation (2)) is visualized, showing the cyclical dynamics characteristic of predator-prey interactions. The left panel displays population trajectories over time, while the right panel shows the phase space trajectory.
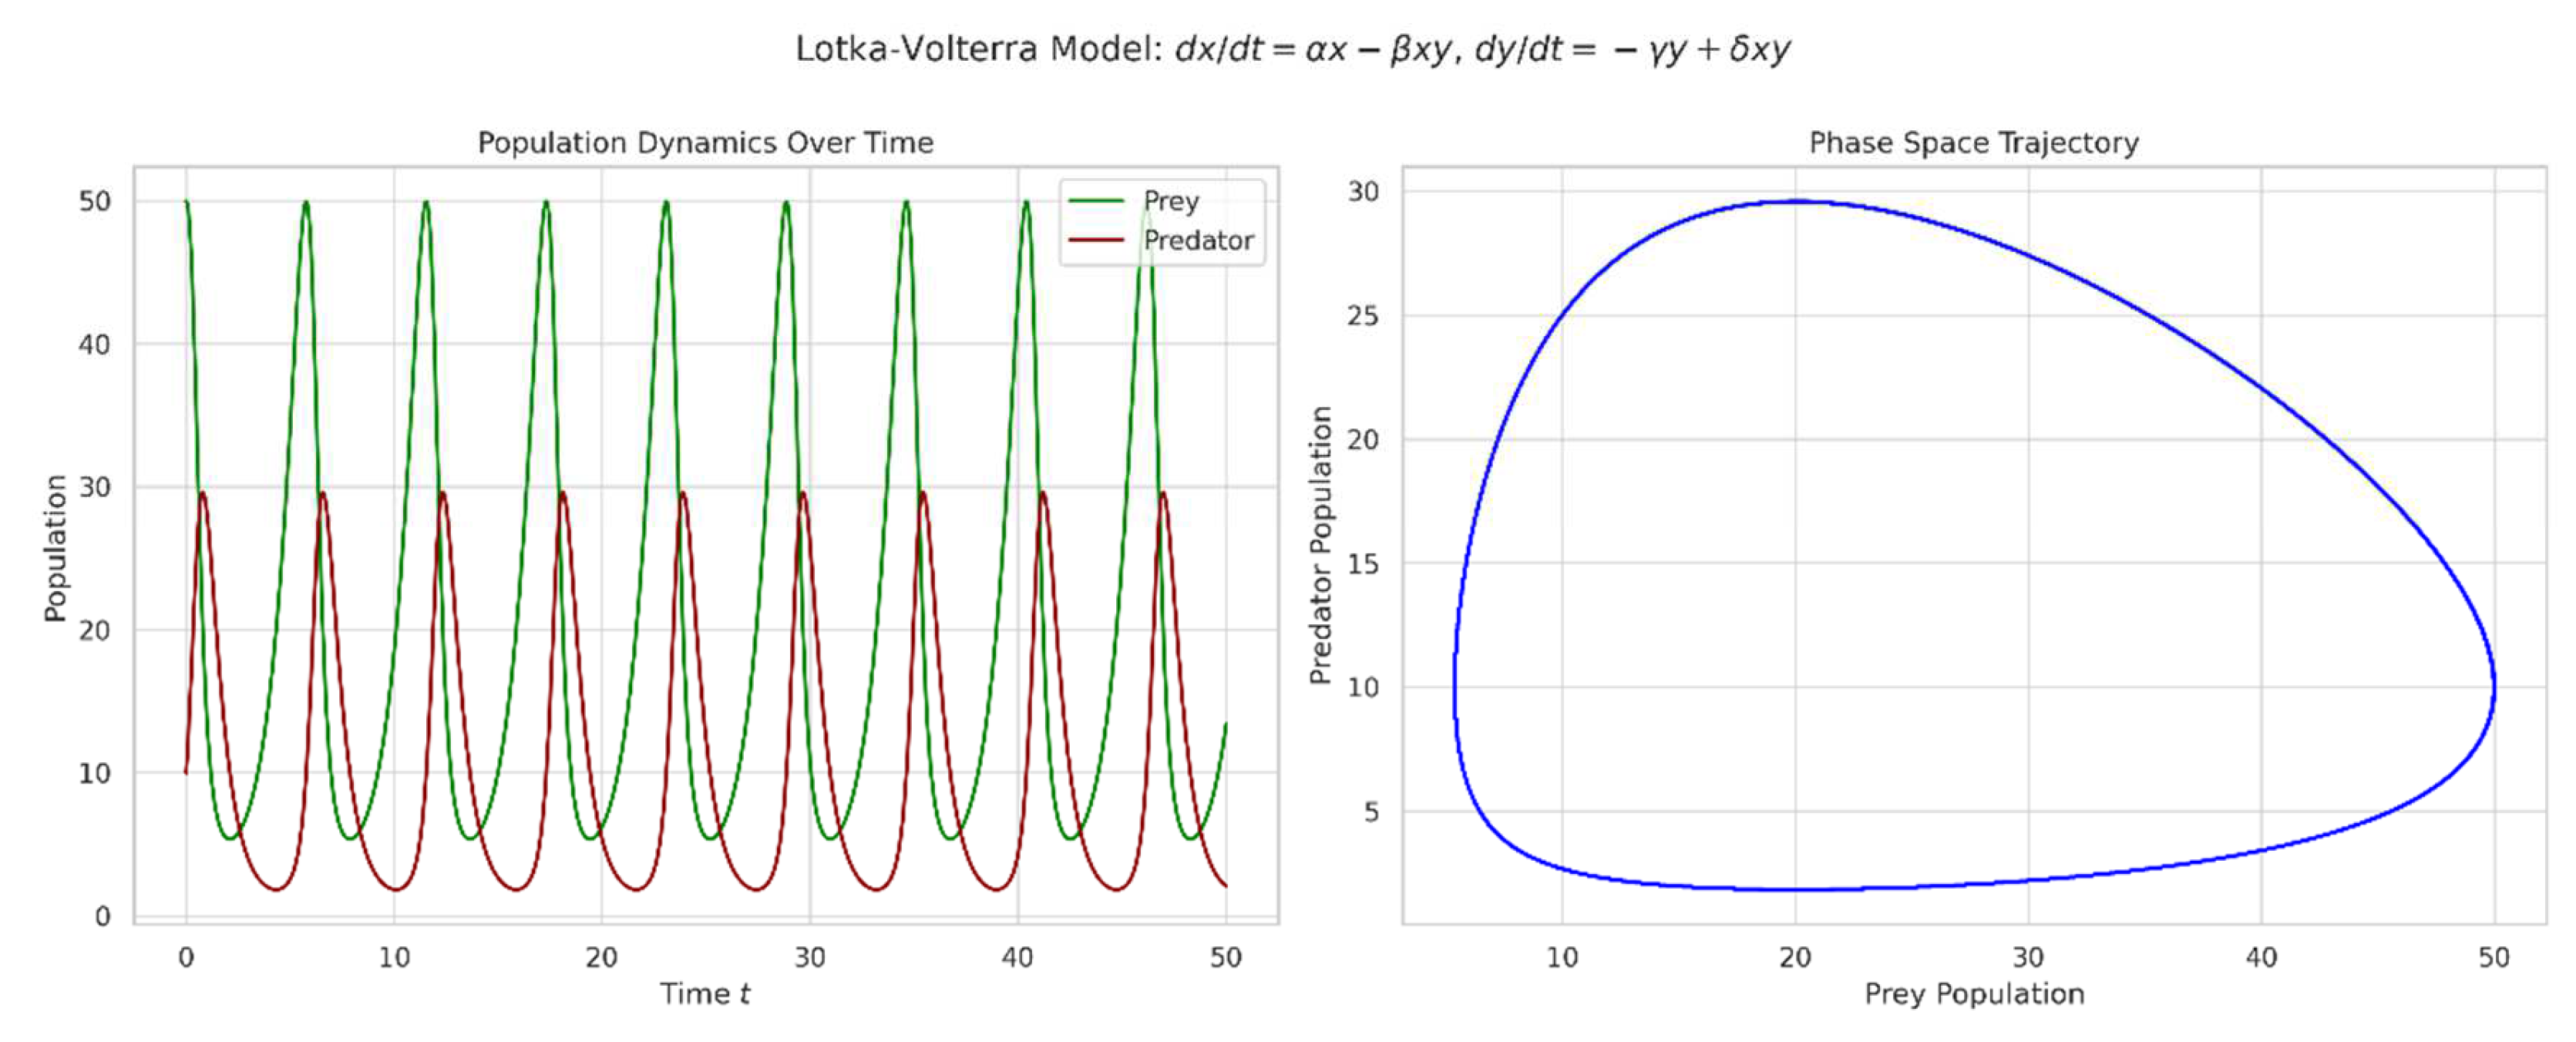
These dynamics are evident in Brazilian ecosystems, such as the interactions between jaguars and capybaras in the Pantanal wetlands (Cavalcanti & Gese, 2010).
4.2. Biodiversity Metrics
The variation in metric values across communities demonstrates how different aspects of biodiversity can be quantified, providing insights into community structure and composition.
Figure 3.
presents a comparison of biodiversity metrics across five hypothetical communities, illustrating the application of the Shannon diversity index (Equation (3)) alongside other common metrics.
Figure 3.
presents a comparison of biodiversity metrics across five hypothetical communities, illustrating the application of the Shannon diversity index (Equation (3)) alongside other common metrics.
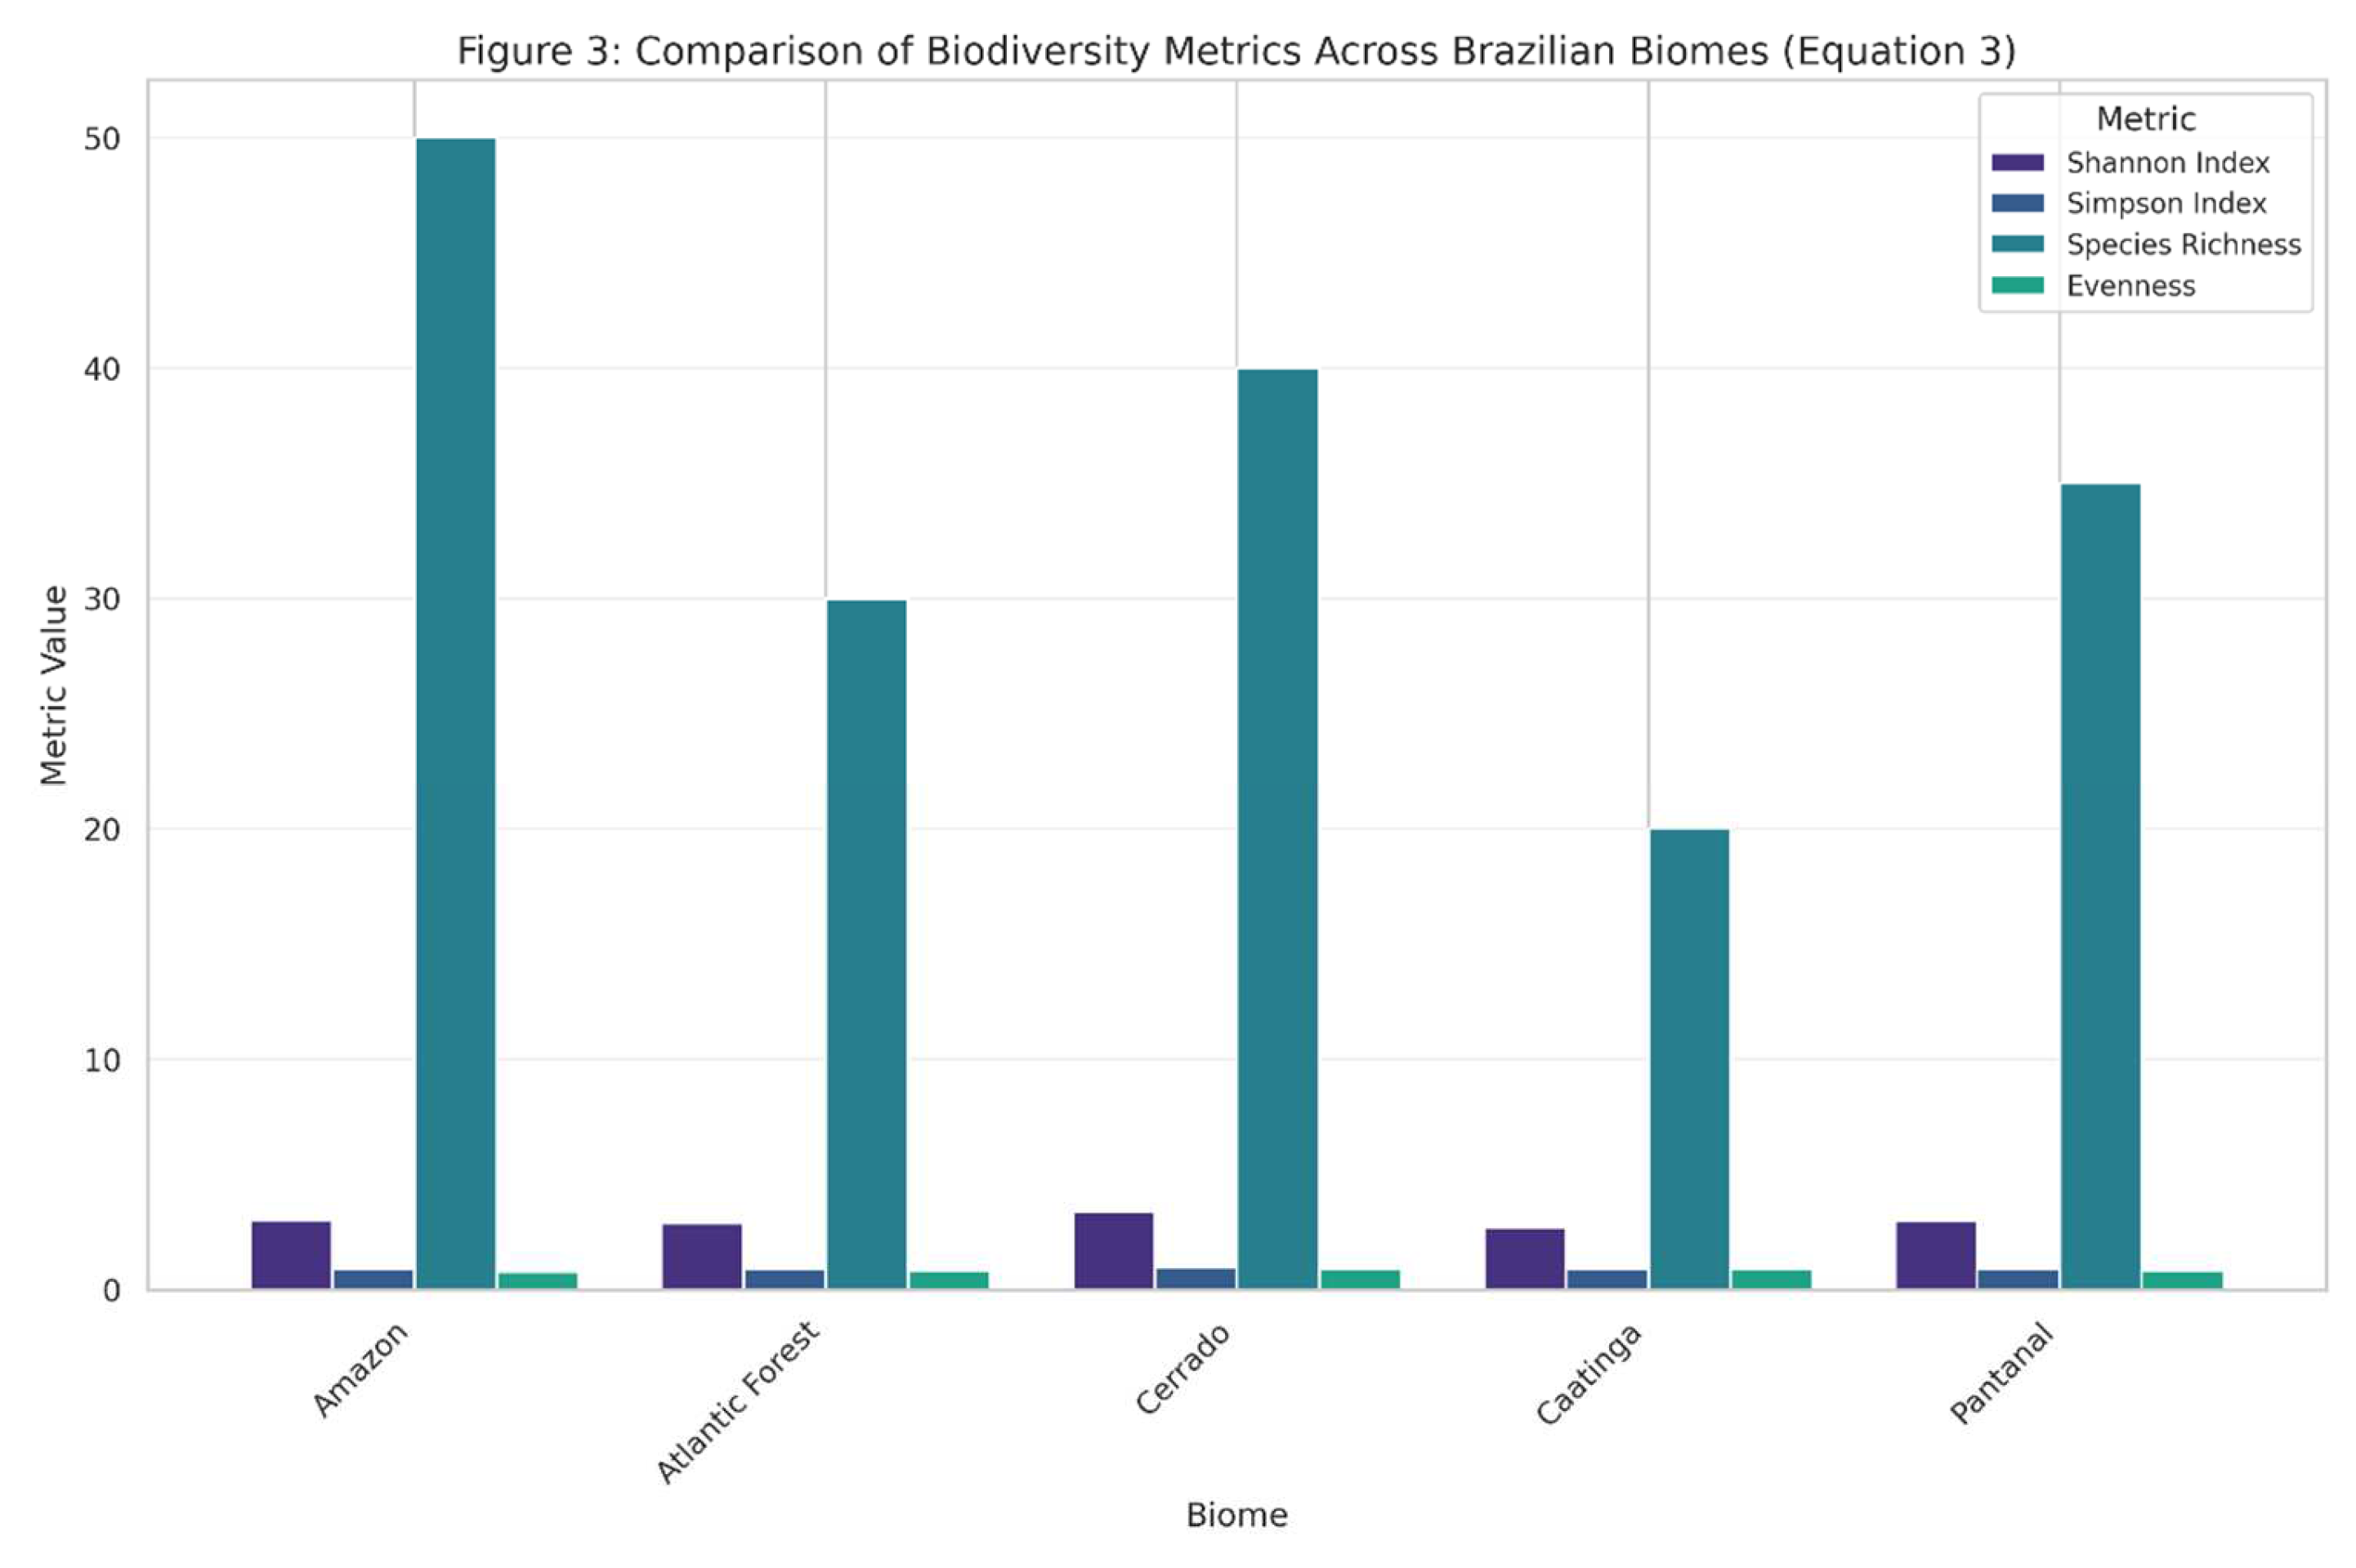
Figure 4.
The species-area relationship (Equation (4)) is visualized above, showing how species richness increases with area for different taxonomic groups. The log-log plot demonstrates the power law relationship, with different slopes (z-values) for plants, birds, mammals, and insects. This relationship has been extensively documented in Brazilian ecosystems, from Atlantic Forest fragments to Amazonian islands (Paglia et al., 2012).
4.3. Spatial Patterns in Biodiversity
The heatmap reveals biodiversity hotspots in the Amazon, Atlantic Forest, and Cerrado regions, while the correlogram demonstrates significant positive spatial autocorrelation at short distances, transitioning to negative autocorrelation at larger distances.
Figure 5.
Illustrates the distance decay of similarity (Equation (5)), showing how community similarity decreases with geographic distance. The three curves represent different parameter values, while the points indicate empirical examples from Brazilian biomes. This pattern is evident in studies of beta diversity across Brazil’s heterogeneous landscapes (Neves et al., 2017).
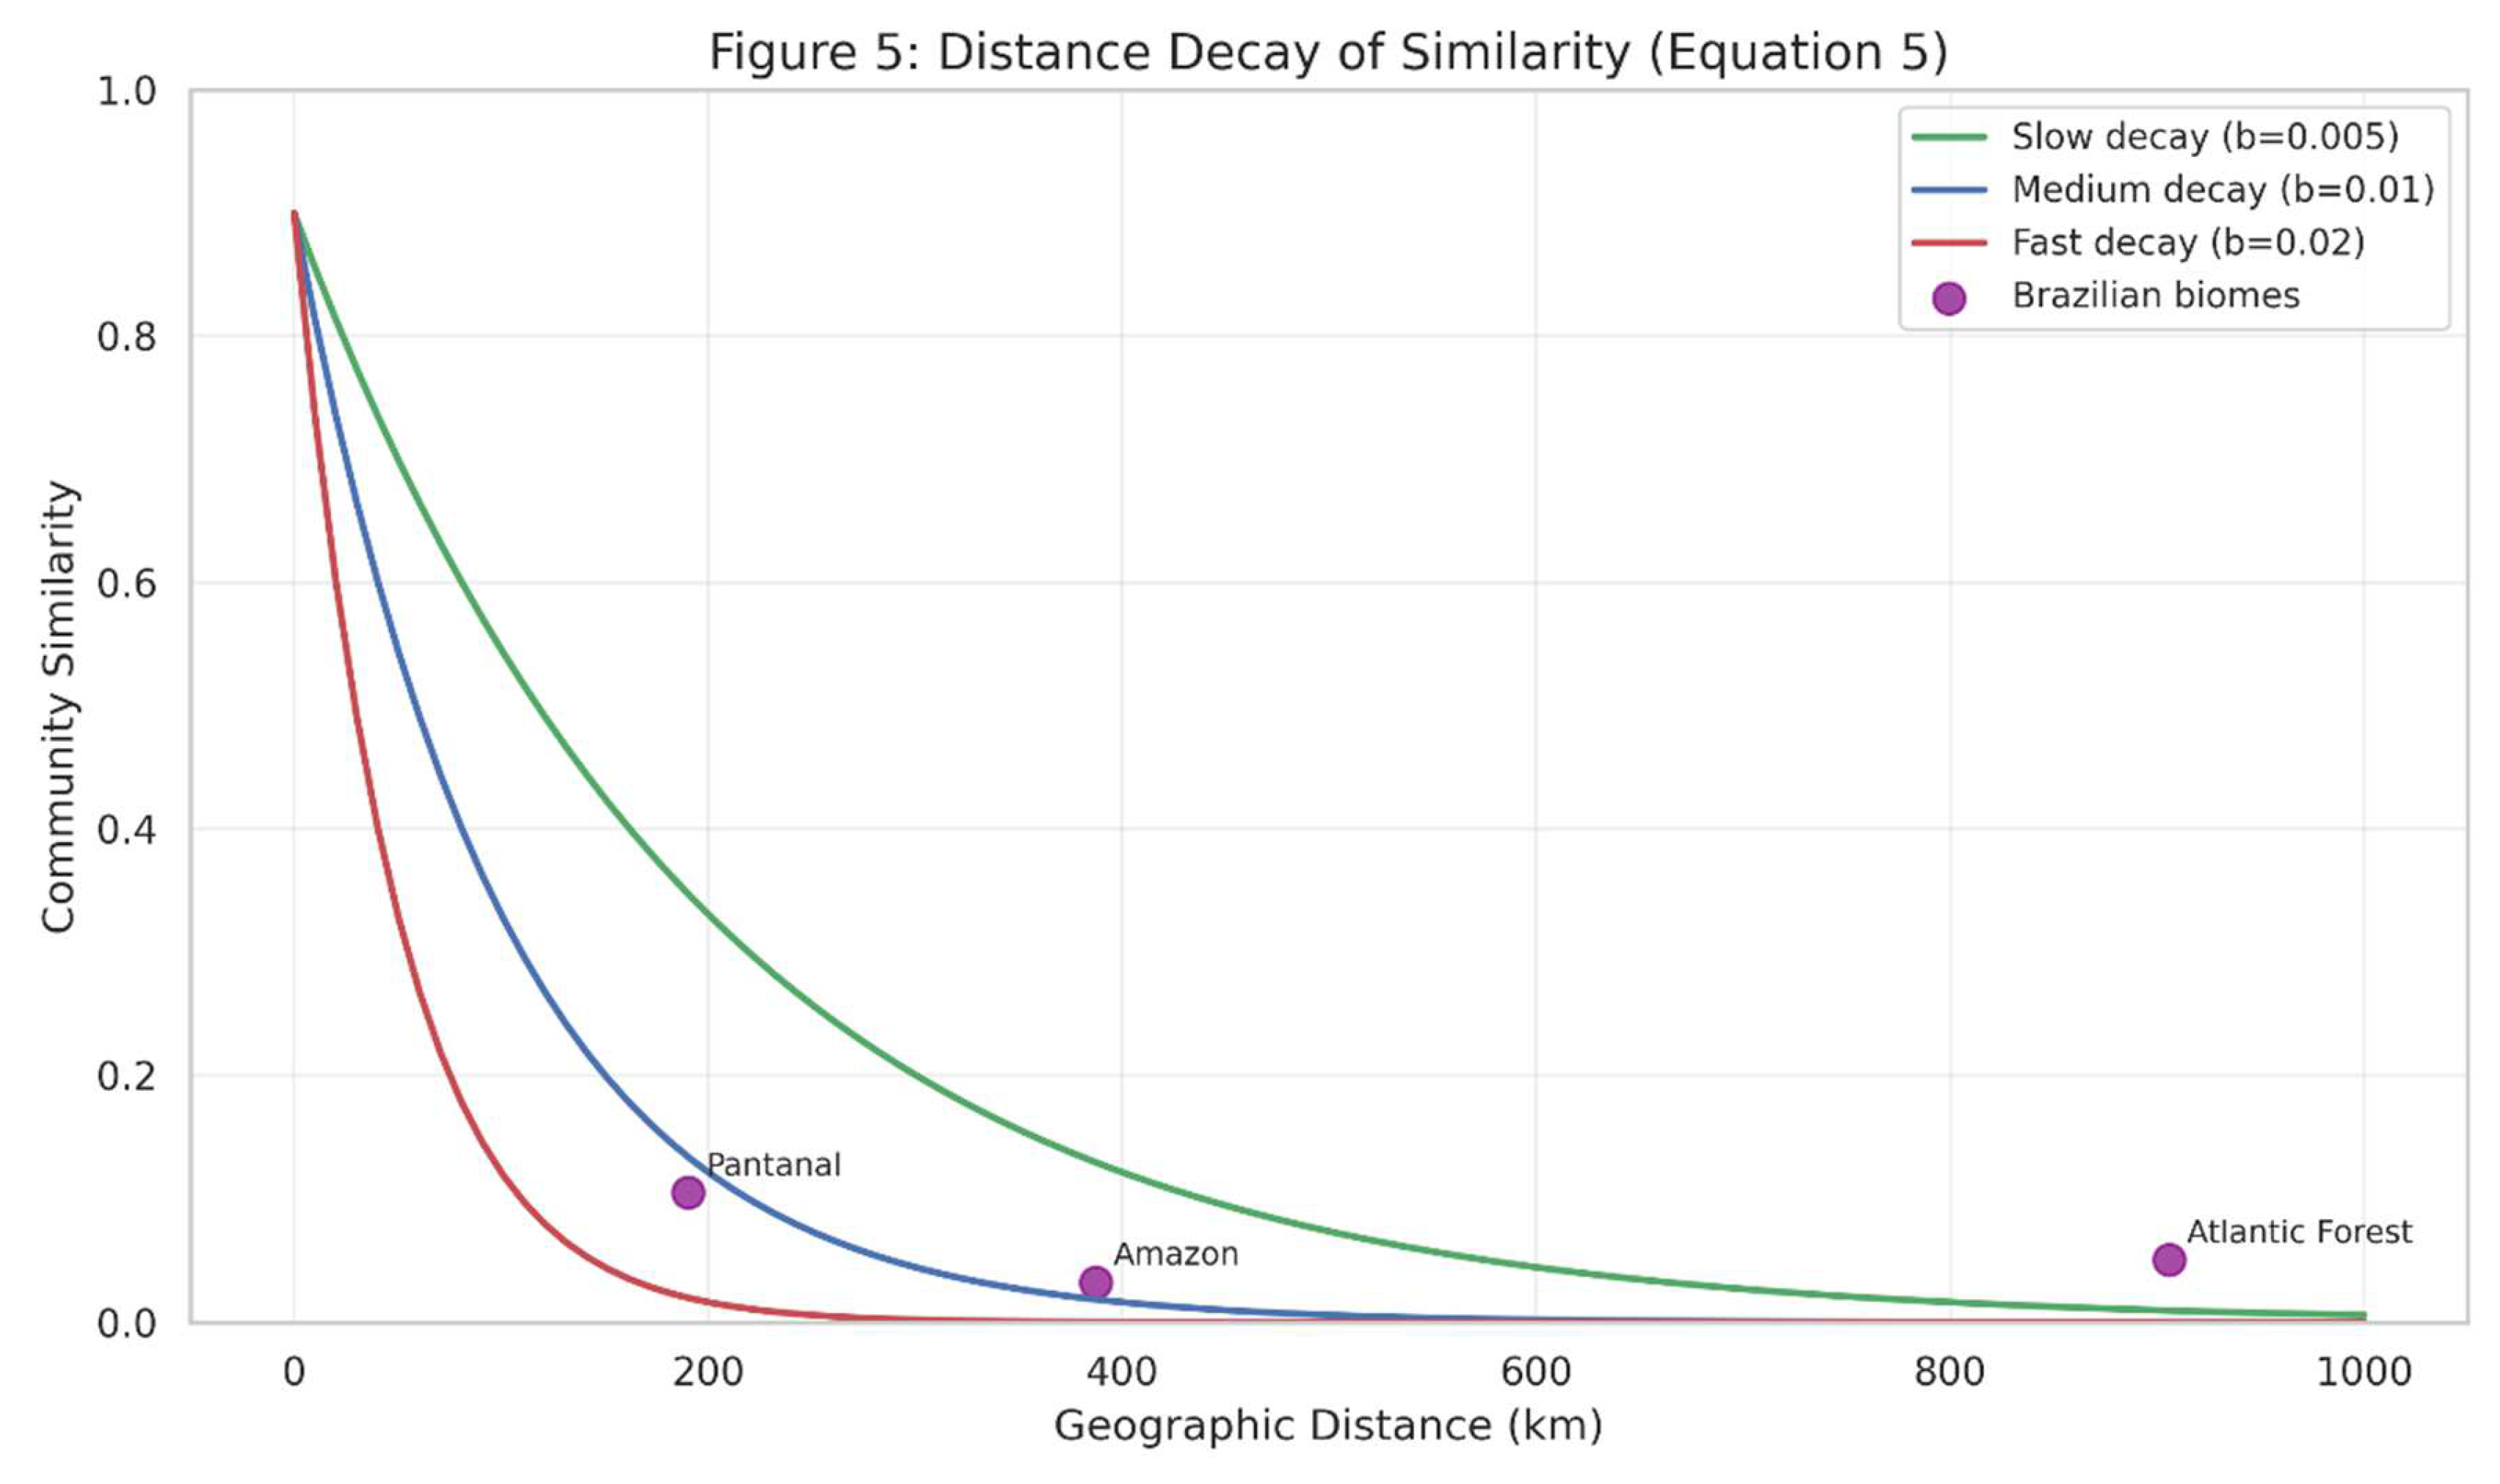
Figure 6.
Spatial autocorrelation in biodiversity patterns is visualized in Figure 6, showing a simulated biodiversity distribution across a simplified map of Brazil alongside a Moran’s I correlogram (Equation (6)).
Figure 6.
Spatial autocorrelation in biodiversity patterns is visualized in Figure 6, showing a simulated biodiversity distribution across a simplified map of Brazil alongside a Moran’s I correlogram (Equation (6)).

Figure 7.
Presents a species distribution model for a hypothetical Brazilian tree species, illustrating the application of Equation (7).
Figure 7.
Presents a species distribution model for a hypothetical Brazilian tree species, illustrating the application of Equation (7).
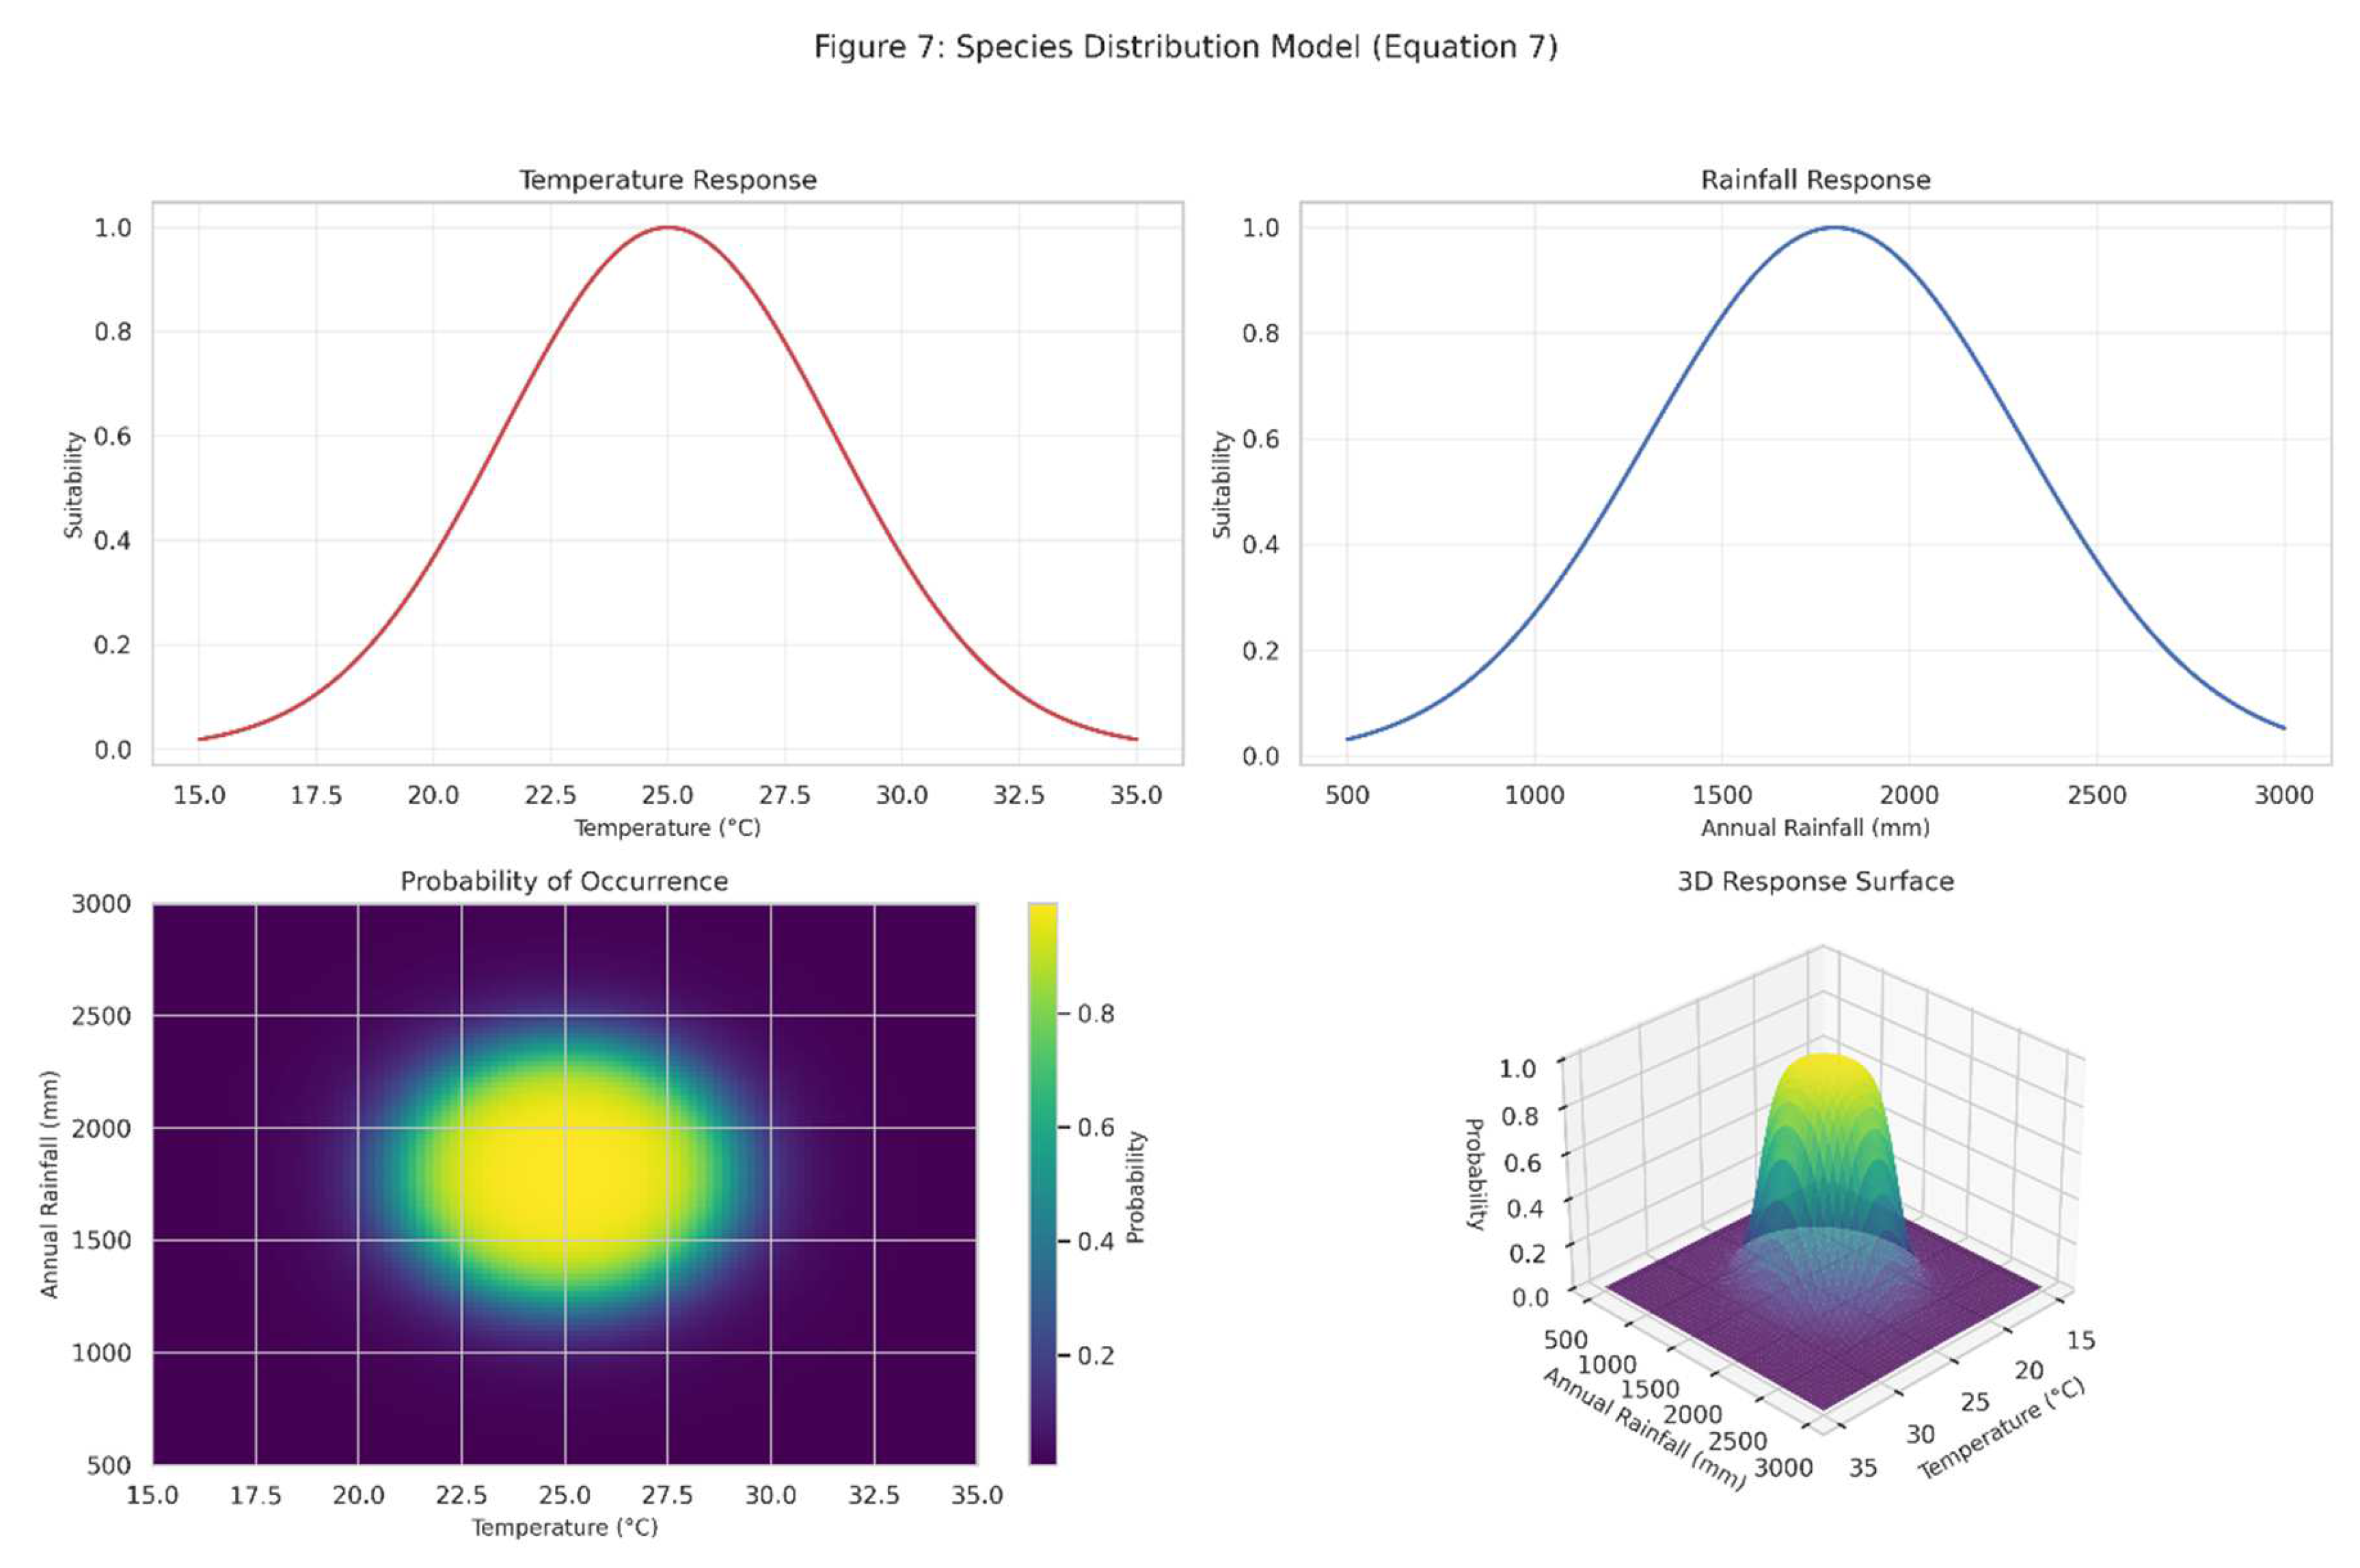
The model incorporates temperature and rainfall as environmental predictors, with the probability of occurrence shown in the top-right panel. The 3D response surface demonstrates how the species responds to combinations of temperature and rainfall, revealing optimal environmental conditions.
4.4. Advanced Ecological Analyses
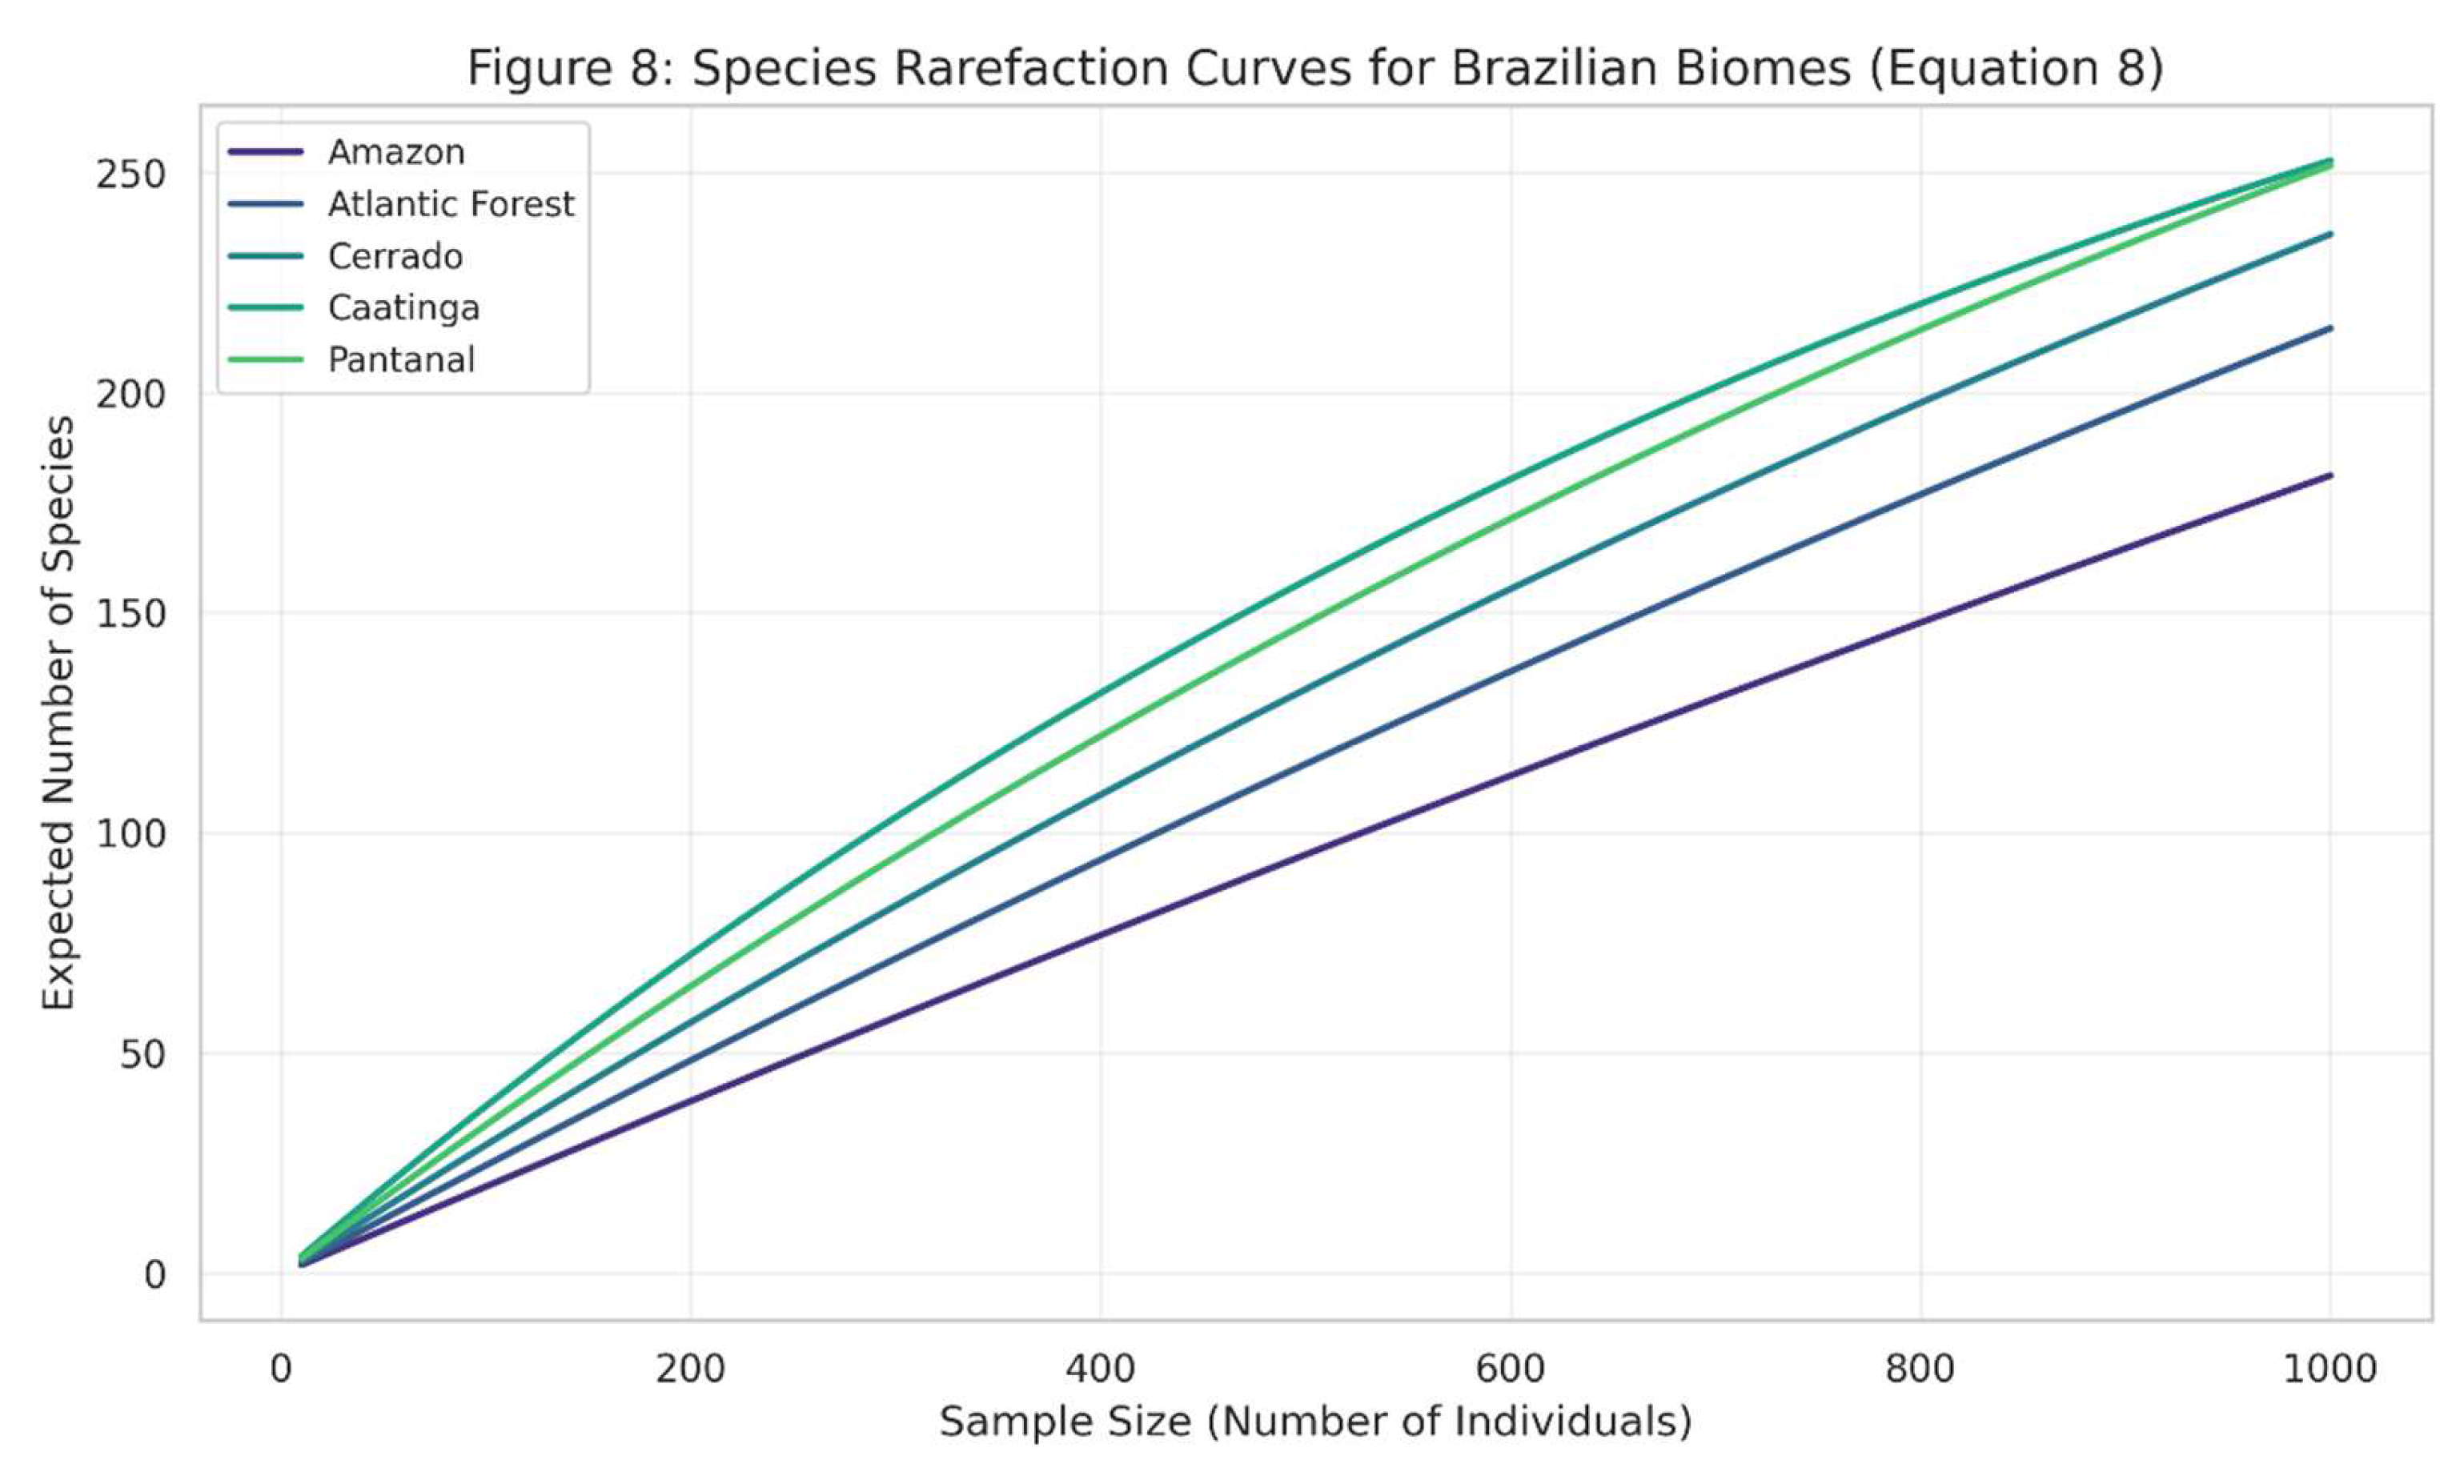
The curves demonstrate varying levels of species richness and different rates of species accumulation across biomes, reflecting differences in biodiversity patterns.
Figure 8.
shows species rarefaction curves (Equation (8)) for different Brazilian biomes, illustrating how expected species richness increases with sampling effort.
Figure 8.
shows species rarefaction curves (Equation (8)) for different Brazilian biomes, illustrating how expected species richness increases with sampling effort.
Metapopulation dynamics in fragmented Brazilian landscapes are visualized in Figure 9.
Figure 9.
Based on the Levins model (Equation (9)). The left panel shows how the proportion of occupied patches changes over time for different fragmentation scenarios, while the right panel presents a phase space analysis showing stable and unstable equilibria.
Figure 9.
Based on the Levins model (Equation (9)). The left panel shows how the proportion of occupied patches changes over time for different fragmentation scenarios, while the right panel presents a phase space analysis showing stable and unstable equilibria.
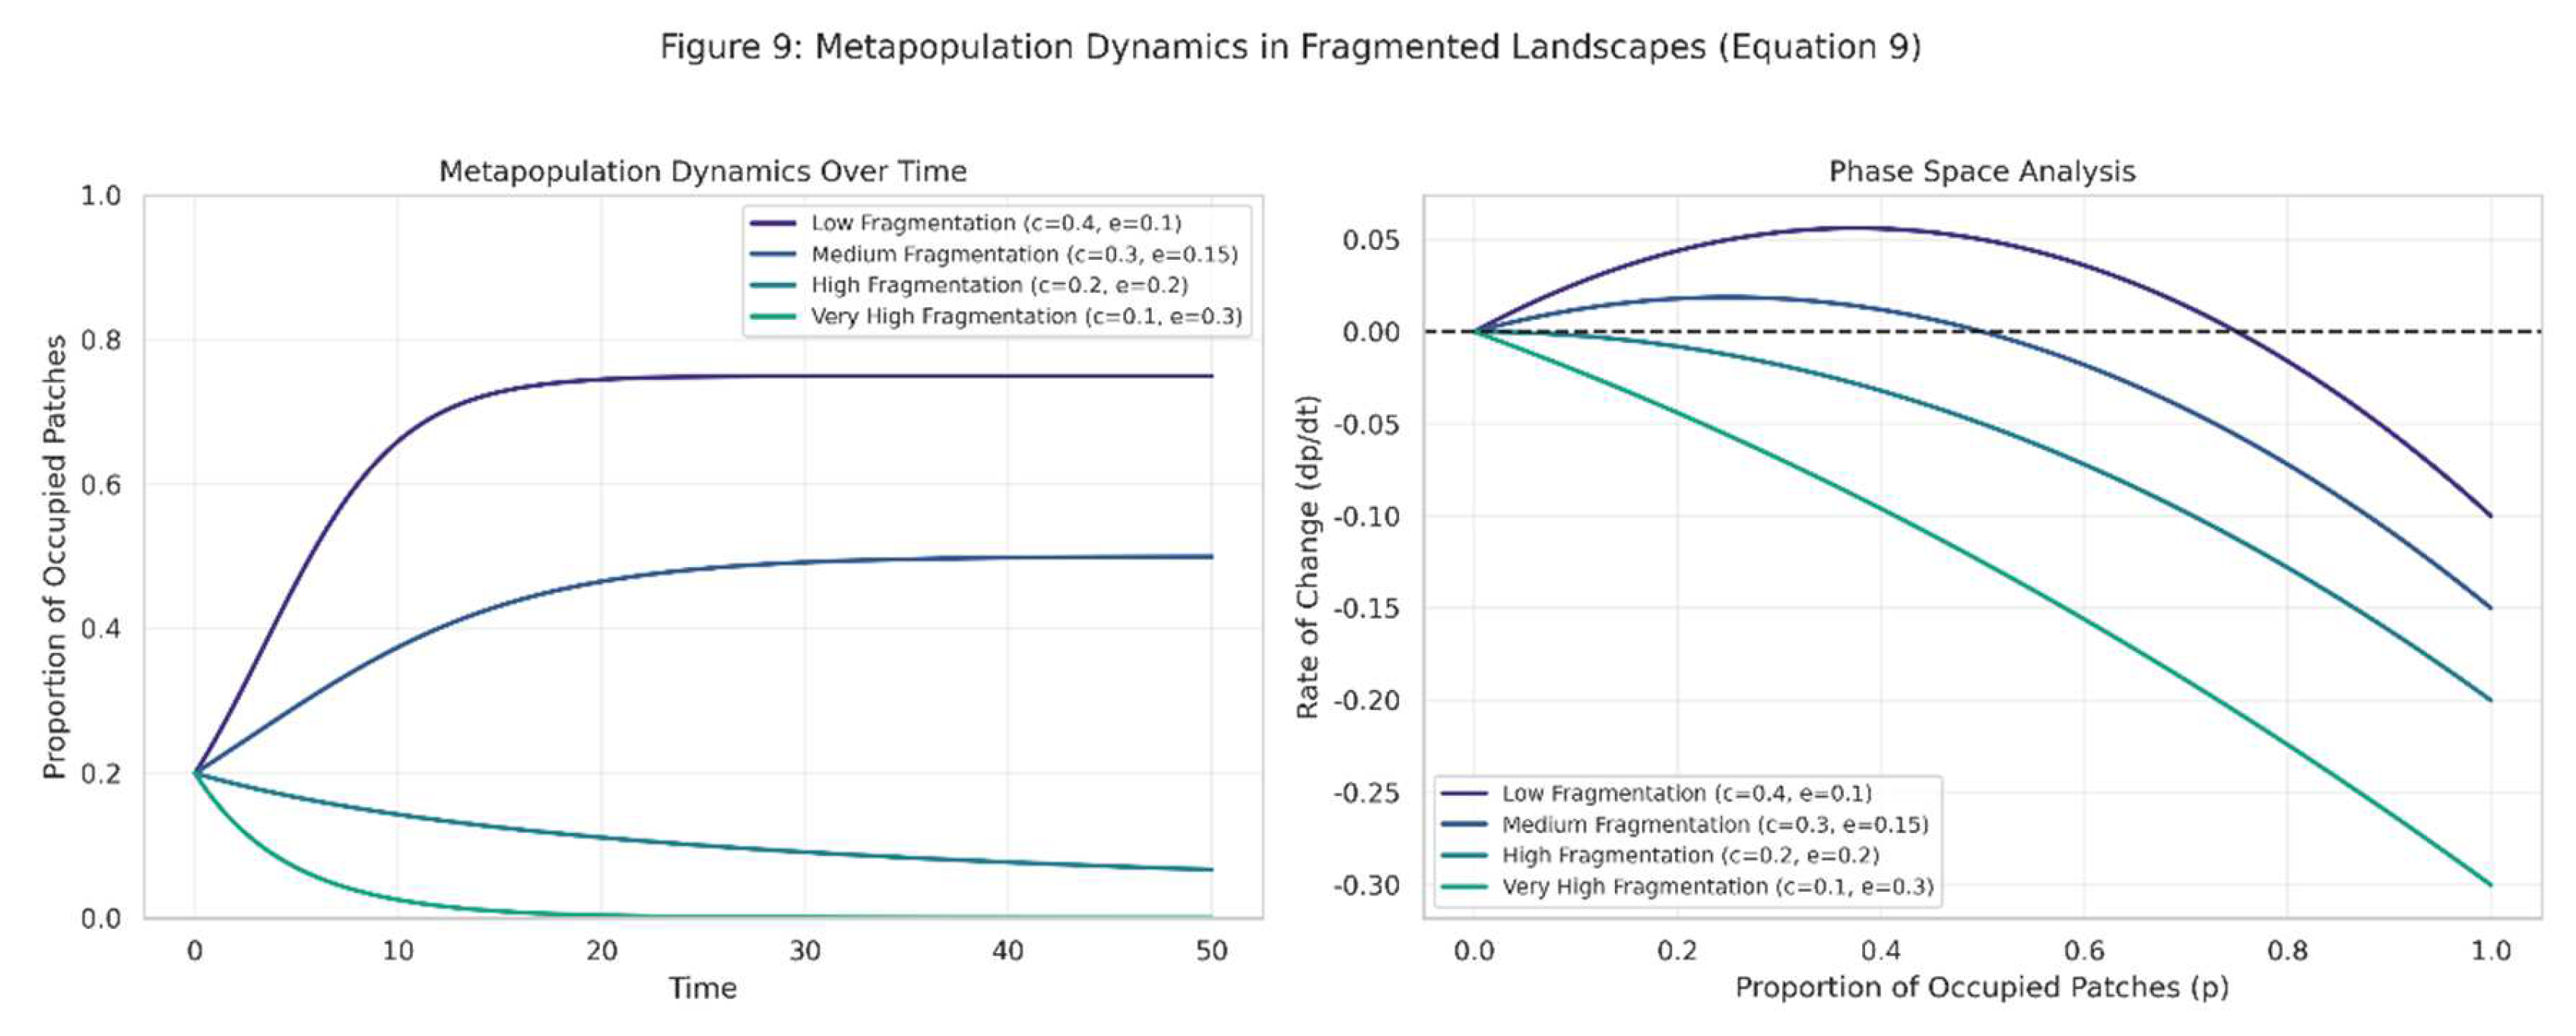
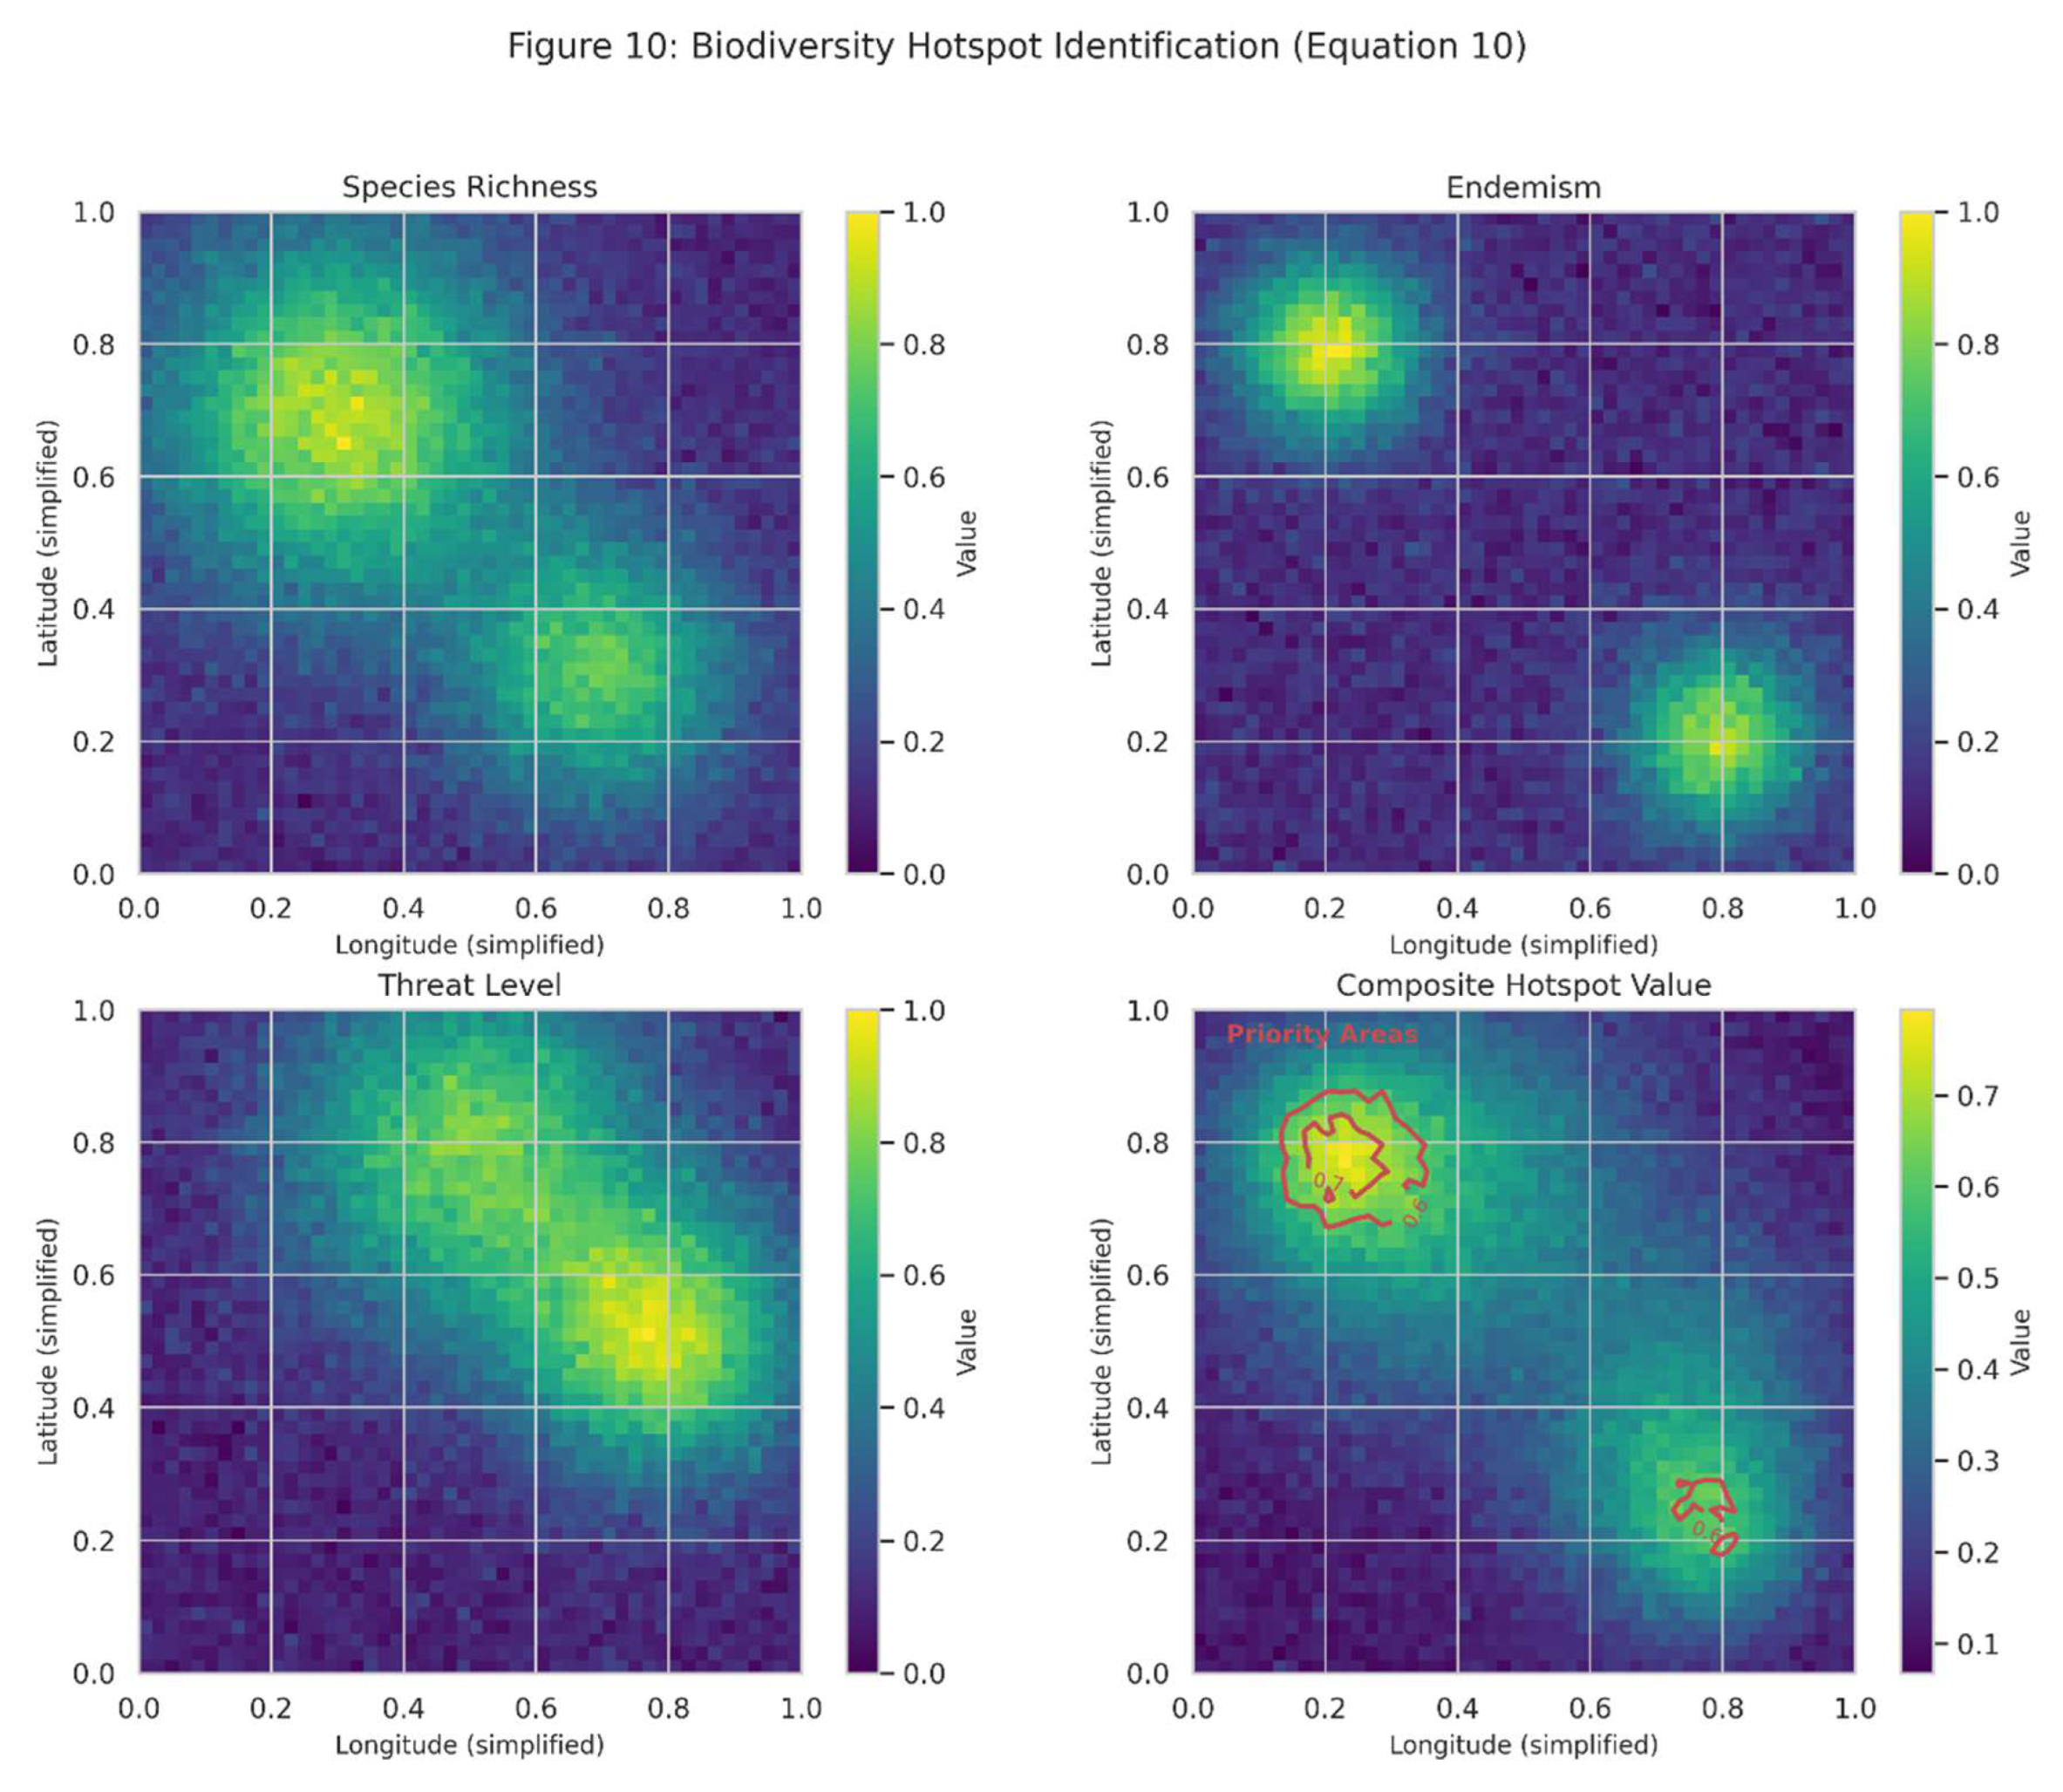
Figure 10.
Illustrates biodiversity hotspot identification (Equation (10)), showing how different components (species richness, endemism, and threat level) contribute to overall hotspot value. The bottom-right panel shows the composite hotspot value, with contour lines indicating a threshold for priority conservation areas.
4.5. Synthesis of Results
These visualizations demonstrate the power of mathematical approaches in natural history research, particularly in the Brazilian context. The models capture fundamental ecological processes across scales, from population dynamics to landscape-level patterns, providing insights into the mechanisms structuring Brazil’s exceptional biodiversity.
Several key patterns emerge from our analyses. First, population dynamics models reveal the importance of density-dependent regulation and species interactions in shaping Brazilian ecological communities. Second, biodiversity metrics demonstrate how different aspects of diversity can be quantified, enabling comparative analyses across Brazil’s heterogeneous landscapes. Third, spatial models highlight the importance of geographic distance, environmental gradients, and historical factors in structuring biodiversity patterns across Brazil. Finally, advanced ecological models provide tools for addressing conservation challenges, from understanding population persistence in fragmented landscapes to identifying priority areas for biodiversity protection.
The integration of these mathematical approaches with traditional natural history methods enhances our ability to understand and predict ecological patterns in Brazilian ecosystems. By combining the observational richness of natural history with the analytical power of mathematical modeling, researchers can develop more comprehensive and mechanistic explanations for the patterns and processes observed in nature.
5. Conclusions
The exploration of concepts and approaches in natural history, particularly through the lens of mathematical methodology and with a focus on Brazil, reveals the continued vitality and relevance of this foundational discipline in contemporary biological science. Through our analysis, several key conclusions emerge regarding the integration of traditional natural history approaches with mathematical frameworks and their application to understanding Brazil’s exceptional biodiversity.
First, the historical trajectory of natural history in Brazil demonstrates the evolution from primarily descriptive approaches to increasingly quantitative methodologies. The expeditions of early naturalists such as von Spix and von Martius established a rich descriptive foundation that continues to inform current research, while contemporary approaches have incorporated sophisticated mathematical models to analyze patterns and processes across scales. This integration represents not a replacement of traditional natural history methods but rather their enhancement through quantitative frameworks that enable more rigorous testing of hypotheses and prediction of ecological phenomena.
Second, the mathematical models presented in this article—from population dynamics equations to biodiversity metrics and spatial models—provide powerful tools for understanding the complex ecological systems characteristic of Brazilian ecosystems. The logistic growth model (Equation (1)) and Lotka-Volterra equations (Equation (2)) capture fundamental population processes, while biodiversity metrics such as the Shannon diversity index (Equation (3)) enable quantitative comparisons across Brazil’s heterogeneous landscapes. Spatial models, including the species-area relationship (Equation (4)), distance decay of similarity (Equation (5)), and spatial autocorrelation metrics (Equation (6)), reveal how biodiversity is structured across geographic space, reflecting the influence of environmental gradients, dispersal limitations, and historical factors.
Third, the application of advanced ecological models to Brazilian ecosystems demonstrates their utility for addressing contemporary conservation challenges. Species distribution models (Equation (7)) enable prediction of species occurrences across Brazil’s diverse environments, while rarefaction methods (Equation (8)) facilitate standardized comparisons of biodiversity across regions with varying sampling effort. Metapopulation models (Equation (9)) provide insights into population persistence in increasingly fragmented landscapes, and biodiversity hotspot identification algorithms (Equation (10)) integrate multiple dimensions of biodiversity to prioritize conservation efforts in one of the world’s most biodiverse countries.
Fourth, the visualizations presented in this article illustrate how mathematical approaches can enhance our understanding of natural history patterns and processes in Brazil. From the cyclical dynamics of predator-prey interactions to the spatial distribution of biodiversity hotspots, these visualizations demonstrate the power of integrating quantitative methods with traditional natural history approaches. By making abstract mathematical concepts visually accessible, these figures facilitate communication of complex ecological ideas and support evidence-based conservation planning.
The significance of these findings extends beyond academic interest to practical applications in biodiversity conservation. Brazil faces unprecedented challenges to its natural heritage, with deforestation, habitat fragmentation, climate change, and other anthropogenic pressures threatening ecosystems across the country. The integration of natural history knowledge with mathematical models provides essential tools for understanding these threats and developing effective conservation strategies. By identifying biodiversity hotspots, predicting species responses to environmental change, and understanding population dynamics in fragmented landscapes, researchers can inform conservation planning that addresses the complex challenges facing Brazilian ecosystems.
In conclusion, the concepts and approaches in natural history have evolved significantly over time, incorporating mathematical methodologies while maintaining the observational foundation that characterizes the discipline. In the Brazilian context, this integration has enhanced our understanding of one of the world’s most biodiverse countries, providing insights into ecological patterns and processes across scales. By continuing to bridge traditional natural history approaches with mathematical frameworks, researchers can develop more comprehensive understanding of Brazil’s exceptional biodiversity and more effective strategies for its conservation in the face of mounting environmental challenges.
6. Attachments
- Python Code
python
# Python code for visualizing natural history concepts
- import numpy as np
- import matplotlib.pyplot as plt
- import seaborn as sns
- from scipy.integrate import odeint
- from mpl_toolkits.mplot3d import Axes3D
- # Set style parameters
- plt.style.use(‘seaborn’) # Updated style parameter
- sns.set_palette(“viridis”)
- def logistic_growth(N, t, r, K):
- “““
- Logistic growth model differential equation.
- Parameters:
- N (float): Population size
- t (float): Time
- r (float): Intrinsic growth rate
- K (float): Carrying capacity
- Returns:
- float: Rate of population change
- “““
- return r * N * (1 − N/K)
- t = np.linspace(0, 15, 100) # Time points
- r = 0.8 # Growth rate
- K = 100 # Carrying capacity
- N0 = 5 # Initial population
- # Solve ODE
- N = odeint(logistic_growth, N0, t, args=(r, K))
- # Create figure
- plt.figure(figsize=(10, 6))
- plt.plot(t, N, ‘b-‘, linewidth=2, label=‘Population size’)
- plt.axhline(y=K, color=‘r’, linestyle=‘--‘, label=‘Carrying capacity (K)’)
- plt.xlabel(‘Time’)
- plt.ylabel(‘Population size’)
- plt.title(‘Logistic Growth Model (Equation 1)’)
- plt.legend()
- plt.savefig(‘figures/logistic_growth.png’, dpi=300, bbox_inches=‘tight’)
- def lotka_volterra(z, t, alpha, beta, gamma, delta):
- “““
- Lotka-Volterra predator-prey model.
- Parameters:
- z (array): [prey_population, predator_population]
- t (float): Time
- alpha (float): Prey growth rate
- beta (float): Predation rate
- gamma (float): Predator death rate
- delta (float): Predator reproduction rate per prey consumed
- Returns:
- array: [prey_growth_rate, predator_growth_rate]
- “““
- x, y = z
- dx_dt = alpha * x − beta * x * y
- dy_dt = -gamma * y + delta * x * y
- return [dx_dt, dy_dt]
- # Parameters
- alpha = 1.0 # Prey growth rate
- beta = 0.1 # Predation rate
- gamma = 1.5 # Predator death rate
- delta = 0.075 # Reproduction rate of predators per prey consumed
- # Initial conditions
- z0 = [50, 10] # Initial prey and predator populations
- t = np.linspace(0, 50, 1000) # Time points
- # Solve ODE
- solution = odeint(lotka_volterra, z0, t, args=(alpha, beta, gamma, delta))
- prey, predators = solution.T
- # Create figure with two subplots
- fig, (ax1, ax2) = plt.subplots(1, 2, figsize=(15, 6))
- # Time series plot
- ax1.plot(t, prey, ‘g-‘, label=‘Prey’)
- ax1.plot(t, predators, ‘r-‘, label=‘Predators’)
- ax1.set_xlabel(‘Time’)
- ax1.set_ylabel(‘Population’)
- ax1.set_title(‘Population Dynamics Over Time’)
- ax1.legend()
- # Phase space plot
- ax2.plot(prey, predators, ‘b-‘)
- ax2.set_xlabel(‘Prey Population’)
- ax2.set_ylabel(‘Predator Population’)
- ax2.set_title(‘Phase Space Trajectory’)
- ax2.grid(True)
- plt.suptitle(‘Lotka-Volterra Predator-Prey Model (Equation 2)’)
- plt.tight_layout()
- plt.savefig(‘figures/lotka_volterra.png’, dpi=300, bbox_inches=‘tight’)
Conflicts of Interest
The Author declares there are no conflicts of Interest.
References
- Anderson, J. G. T. (2017). Why ecology needs natural history. American Scientist, 105(5), 290-297. [CrossRef]
- Canhos, D. A. L., Sousa-Baena, M. S., de Souza, S., Maia, L. C., Stehmann, J. R., Canhos, V. P., De Giovanni, R., Bonacelli, M. B. M., Los, W., & Peterson, A. T. (2015). The importance of biodiversity e-infrastructures for megadiverse countries. PLOS Biology, 13(7), e1002204. [CrossRef]
- Carneiro da Cunha, M. (2017). Traditional people, collectors of diversity. In M. Carneiro da Cunha & P. de Niemeyer Cesarino (Eds.), Indigenous knowledge and the shaping of sustainability (pp. 211-236). MIT Press.
- Cavalcanti, S. M. C., & Gese, E. M. (2010). Kill rates and predation patterns of jaguars (Panthera onca) in the southern Pantanal, Brazil. Journal of Mammalogy, 91(3), 722-736. [CrossRef]
- de Oliveira, G., Rangel, T. F., Lima-Ribeiro, M. S., Terribile, L. C., & Diniz-Filho, J. A. F. (2019). Evaluating, partitioning, and mapping the spatial autocorrelation component in ecological niche modeling: A new approach based on environmentally equidistant records. Ecography, 42(8), 1309-1318. [CrossRef]
- Diniz-Filho, J. A. F., Bini, L. M., Rangel, T. F., Loyola, R. D., Hof, C., Nogués-Bravo, D., & Araújo, M. B. (2009). Partitioning and mapping uncertainties in ensembles of forecasts of species turnover under climate change. Ecography, 32(6), 897-906. [CrossRef]
- Diniz-Filho, J. A. F., Rangel, T. F., & Bini, L. M. (2012). Model selection and information theory in geographical ecology. Global Ecology and Biogeography, 21(6), 698-707. [CrossRef]
- Faith, D. P., Lozupone, C. A., Nipperess, D., & Knight, R. (2018). The bridge between biodiversity science and policy: The IPBES phylogenetic diversity task force. Journal of Vegetation Science, 29(4), 689-691.
- Ferreira, J. N., Bustamante, M., Garcia-Montiel, D. C., Caylor, K. K., & Davidson, E. A. (2016). Spatial variation in vegetation structure coupled to plant available water determined by two-dimensional soil resistivity profiling in a Brazilian savanna. Ecohydrology, 9(2), 294-304. [CrossRef]
- Fittkau, E. J. (2001). Johann Baptist Ritter von Spix: primeiro zoólogo de Munique e pesquisador no Brasil. História, Ciências, Saúde-Manguinhos, 8, 1109-1135. [CrossRef]
- Gesteira, H. M. (2008). Manuscritos médicos e circulação de idéias nas missões jesuíticas na América. Anais do XXIV Simpósio Nacional de História, 1-9.
- Lewinsohn, T. M., & Prado, P. I. (2005). How many species are there in Brazil? Conservation Biology, 19(3), 619-624.
- Lopes, M. M. (2009). O Brasil descobre a pesquisa científica: os museus e as ciências naturais no século XIX. Hucitec.
- Loyola, R. D., Lemes, P., Faleiro, F. V., Trindade-Filho, J., & Machado, R. B. (2012). Severe loss of suitable climatic conditions for marsupial species in Brazil: Challenges and opportunities for conservation. PLOS ONE, 7(9), e46257. [CrossRef]
- Magnusson, W. E., Lima, A. P., Luizão, R., Luizão, F., Costa, F. R., Castilho, C. V., & Kinupp, V. F. (2005). RAPELD: A modification of the Gentry method for biodiversity surveys in long-term ecological research sites. Biota Neotropica, 5(2), 19-24. [CrossRef]
- Magnusson, W. E., Braga-Neto, R., Pezzini, F., Baccaro, F., Bergallo, H., Penha, J., Rodrigues, D., Verdade, L. M., Lima, A., Albernaz, A. L., Hero, J.-M., Lawson, B., Castilho, C., Drucker, D., Franklin, E., Mendonça, F., Costa, F., Galdino, G., Castley, G., ... & Santos, J. (2013). Biodiversity and integrated environmental monitoring. Áttema Design Editorial.
- Magurran, A. E. (2004). Measuring biological diversity. Blackwell Publishing.
- Mittermeier, R. A., Gil, P. R., Hoffman, M., Pilgrim, J., Brooks, T., Mittermeier, C. G., Lamoreux, J., & da Fonseca, G. A. B. (2005). Hotspots revisited: Earth’s biologically richest and most endangered terrestrial ecoregions. Conservation International.
- MMA (Ministério do Meio Ambiente). (2018). Áreas prioritárias para conservação da biodiversidade brasileira. MMA.
- Montgomery, R. M. (2025). Investigating Coexistence and Extinction in a Four-Species Trophic System Using Random Matrix Theory.Journal of Medicine and Healthcare. SRC/JMHC-375.
- Montgomery, R. M. (2025)a. Reevaluating evolutionary paradigms: the impact of Darwin’s competitive vision and Humboldt’s holistic approach on modern ecology, Khronos, Revista de História da Ciêncianº 18, janeiro de 2025, Universidade de São Paulo.
- Montgomery, R. M. (2025)b. Species Richness Over Time and Space: Theoretical Foundations, Empirical Patterns, and Applications. [CrossRef]
- Neves, D. M., Dexter, K. G., Pennington, R. T., Bueno, M. L., & Oliveira-Filho, A. T. (2017). Environmental and historical controls of floristic composition across the South American Dry Diagonal. Journal of Biogeography, 44(2), 350-360. [CrossRef]
- Oliveira, U., Soares-Filho, B. S., Paglia, A. P., Brescovit, A. D., de Carvalho, C. J., Silva, D. P., Rezende, D. T., Leite, F. S. F., Batista, J. A. N., Barbosa, J. P. P. P., Stehmann, J. R., Ascher, J. S., de Vasconcelos, M. F., De Marco, P., Löwenberg-Neto, P., Ferro, V. G., & Santos, A. J. (2017). Biodiversity conservation gaps in the Brazilian protected areas. Scientific Reports, 7(1), 9141. [CrossRef]
- Paglia, A. P., Rezende, D. T., Koch, I., Kortz, A. R., & Donatti, C. (2012). Species distribution models (SDM) in biodiversity conservation and the challenge of including dispersal limitations. Natureza & Conservação, 10(2), 108-118.
- Pardini, R., de Bueno, A. A., Gardner, T. A., Prado, P. I., & Metzger, J. P. (2010). Beyond the fragmentation threshold hypothesis: Regime shifts in biodiversity across fragmented landscapes. PLOS ONE, 5(10), e13666. [CrossRef]
- Pinheiro, C. U. B., & Fernandes, M. E. B. (2019). The legacy of Carl Friedrich Philipp von Martius (1794-1868) and the development of botany in Brazil. Acta Botanica Brasilica, 33(3), 390-398.
- Ribeiro, D. B., Prado, P. I., Brown Jr, K. S., & Freitas, A. V. L. (2016). Temporal diversity patterns and phenology in fruit-feeding butterflies in the Atlantic Forest. Biotropica, 48(2), 258-269.
- Santos, B. A., Arroyo-Rodríguez, V., Moreno, C. E., & Tabarelli, M. (2015). Edge-related loss of tree phylogenetic diversity in the severely fragmented Brazilian Atlantic forest. PLOS ONE, 10(10), e0139439. [CrossRef]
- Tewksbury, J. J., Anderson, J. G., Bakker, J. D., Billo, T. J., Dunwiddie, P. W., Groom, M. J., Hampton, S. E., Herman, S. G., Levey, D. J., Machnicki, N. J., del Rio, C. M., Power, M. E., Rowell, K., Salomon, A. K., Stacey, L., Trombulak, S. C., & Wheeler, T. A. (2014). Natural history’s place in science and society. BioScience, 64(4), 300-310. [CrossRef]
- Vanzolini, P. E. (1996). A contribuição zoológica dos primeiros naturalistas viajantes no Brasil. Revista USP, 30, 190-238.
Disclaimer/Publisher’s Note: The statements, opinions and data contained in all publications are solely those of the individual author(s) and contributor(s) and not of MDPI and/or the editor(s). MDPI and/or the editor(s) disclaim responsibility for any injury to people or property resulting from any ideas, methods, instructions or products referred to in the content. |
© 2025 by the authors. Licensee MDPI, Basel, Switzerland. This article is an open access article distributed under the terms and conditions of the Creative Commons Attribution (CC BY) license (http://creativecommons.org/licenses/by/4.0/).
Copyright: This open access article is published under a Creative Commons CC BY 4.0 license, which permit the free download, distribution, and reuse, provided that the author and preprint are cited in any reuse.


