
Submitted:
24 April 2025
Posted:
25 April 2025
You are already at the latest version
Abstract
Although mechanistic studies on Yoga and meditation have demonstrated their efficacy over the past few decades, very few studies have focused on the Yogic state of Samaadhi, characterized by an ultimate state of peace and happiness. In this study, we probed electrophysiological correlates of Samaadhi in a Yogi par excellence. This research was conducted in the 1980s and is now being brought to the public domain. We characterized changes in muscle, cardiac and brain electrical activity, as well as breathing during about 30 minutes of meditative Samaadhi using a multichannel polygraph system during two experiments in 1985 and 1988. Spectral analysis was carried out using computers in the late 1980s. During meditation, we observed a substantial reduction in breathing amplitude (to <5% of pre-meditation levels) and subjectively measured heartbeat and pulse amplitude. Cardiac electrical activity remained intact, but the data pointed to the possibility of a considerable reduction in cardiac mechanical activity. Muscle contractions were consistent and substantially higher. A unique pattern of alpha as well as beta activity was observed in frontal electroencephalogram (EEG) electrodes, and alpha activity with occasional beta activity was observed in occipital EEG electrodes. During an epoch of eyes open state (within the meditation phase), EEG patterns resembled a deep meditative state, such as high occipital alpha and beta activity and frontal beta activity, which is strange because occipital alpha activity typically vanishes with the eyes open. Taken together, we provide preliminary evidence for the electrophysiological correlates of Samaadhi. The patterns observed from multiple modalities, taken together, were unique and different from those typically seen in adults. They were distinct from the electrophysiological correlates of three typical states of consciousness (awake, dreaming, sleeping). Further research with the latest technologies and analytical tools is required for a better mechanistic understanding of the state of Samaadhi.
Keywords:
Meditation
; Samadhi
; Yoga
; EEG
; polygraph
; scientific
1. Introduction
Yoga was developed in the Indian subcontinent several thousand years ago [1,2], and one of its core tenets is the existence of a fourth state of consciousness called Samaadhi (the earliest mentions of it being in the Upanishads [3]), separate from the other three states, viz. awake, dream and non-dream sleep. Yoga deals with the understanding of and the means to attain Samaadhi [4,5] through the practice of Yogic meditation as a tool and supported by a lifestyle conducive to attaining it [6]. In Yogic tradition, meditation is used as a tool for achieving Samaadhi, whereby typically, focused attention-type meditation is employed [7] (focusing all attentional resources on an object/image of interest and maintaining that focus while blocking out all other distractors, including real-time input from the senses and memory input from the past). In ancient Indian literature, including Yogic literature, Samaadhi is described as the pinnacle of human achievement of supreme bliss and peace; a state which can be replicated across individuals and which every human being is equipped to attain [6,8]. Given the subjective nature of the Samaadhi experience, and the difficulty in explaining it to someone who has not experienced it, Samaadhi has primarily remained a topic of qualitative deliberation among traditional scholars [9]. The evidence for its existence and its characteristics have been chiefly the word of those who claim to have experienced it (e.g., [10,11]), the consistency of experiential accounts across scores of individuals [12], vast examples of such individuals in every century of India’s recorded history over thousands of years in distinct geographical sections of the Indian subcontinent [13], and the extensive philosophical literature on meditative states and Samaadhi in India as part of the Vedic and Yogic traditions over several millennia [9].
Despite this compelling background, the evidence so far is primarily subjective, qualitative, situational, and historical. There is a need for objective quantitative measurements of the state of Samaadhi from a neutral or third-person perspective. Such evidence is necessary for understanding the nature of Samaadhi from a neutral scientific standpoint. Treating this subject matter as a purely metaphysical one has kept it outside the realm of precise mechanistic investigation of scientific research. Quantitative measurements of Samaadhi are required to understand the bodily processes underway during Samaadhi, how it differs from other states, and whether it truly is the pinnacle of human experience [14]. To conduct such research investigations, two requirements must be met – (i) the availability of human subjects capable of attaining a higher state of consciousness such as Samaadhi, and (ii) the availability of technology and tools to measure quantitative changes in the body during that state. So far, a few scattered attempts have been made to study mystic phenomena, including the control of sensory and autonomic functions using Yogic practices [15,16,17,18,19,20,21,22]. However, not many studies have investigated Samaadhi directly (apart from one study claiming to study Samaadhi in four Yogis [23]). The collective progress toward the neurobiological and physiological understanding of Samaadhi has been insufficient, one reason being that it has been challenging to find suitable individuals in the last few decades after it became technologically feasible to conduct such experiments. The broad idea has been to make measurements of bodily signals during the Samaadhi state, to understand changes in the body (including the brain or spinal cord) during Samaadhi, and if possible, to decipher the physiological imprints of the experience during that state.
We do not make any claims about the nature of Samaadhi, whether it is an extra-sensory divine experience or not. Our argument merely is that irrespective of the nature of Samaadhi, the experience must leave traces or correlates on the body, which can be measured with instruments. In the current study, we took a step in this direction by measuring the electrophysiological correlates of an altered state of consciousness in a Yogi par excellence. It is to be noted that we are studying only one Yogi here because Yogis who can attain the state of Samaadhi at will are extremely rare to find for conducting an experiment, and it is also challenging to get their consent to participate in an experiment. Our study must be viewed in this light and differentiated from those studies where a large number of meditators practicing meditation are considered.
The report is organized as follows. The next section explains methodological details. The third section presents the findings, discusses them, and gives the scope for future work. The final section draws conclusions.
2. Materials and Methods
2.1. The Yogi (Subject)
Historical records and individual accounts consider Smt. Vijayalakshmi Srimataji to be a Yogi par excellence, with expertise in attaining the Samaadhi state with ease and at will [24,25,26]. In the 1980s, in order to support the scientific investigation of Yogic meditation using modern technologies, we approached Smt. Vijayalakshmi Srimataji (the President of Ashtanga Yoga Vijnana Mandiram [AYVM] at the time) to participate in our proposed experiments. When we approached her with our ideas, she extended her support, provided informed consent, and agreed to our request to record data on her meditative states. The founder and first president of AYVM, Sri Sriranga Mahaguru, had initiated the idea of making scientific measurements of the Samaadhi state long ago in 1955. The experiments he had conducted with Srimataji as the subject served as a precursor and motivation for the current study. Details about this historical context and its relevance for the current study can be found in the Appendix A.
2.2. Experimental Timeline
Below is an account of the two experiments conducted with Smt. Vijayalakshmi Srimataji as the subject and the corresponding timeline. The first experiment was conducted on 16 September 1985 between 4:28 pm and 5:05 pm (37-minute acquisition) at National Institute of Mental Health and Neurosciences (NIMHANS), Bangalore, India. Multi-channel electrophysiological data were acquired with four electroencephalogram (EEG), one electrocardiogram (ECG), one electromyogram (EMG), and one respiration channel (using an 8-channel polygraph system). The second experiment was conducted on 26 November 1988 between 6:33 pm and 7:04 pm (33-minute acquisition) at NIMHANS with more channels and better equipment. In this case, 21-channel electrophysiological data were acquired with thirteen EEG, one electrooculogram (EOG), two EMG, two respiration, one galvanic skin response (GSR), one photo-plethysmogram (PPG), and one ECG channel. Additionally, specific observations were documented in real-time during both experiments. After that, a preliminary investigation of the recordings was conducted, and this manuscript resulted from the same.
We emphasize that merely preliminary analyses are reported here, which were conducted in the 1980s with the facilities, computational power, analytical tools and resources available at that time. The full breadth of planned analyses is scope for future work. Nevertheless, the nature of the preliminary results motivated us that the findings are significant and novel enough to report. The timeline of this project is as follows. The project was conceptualized by D.N.D. in 1982. The team of D.N.D, G.R.G. and C.R.R. led the experiments in 1985 and 1988. D.N.D. prepared a preliminary report on experiment-1 in 1988. Subsequently, analyses of data from experiment-2 were conducted between 1988 and 1990 by D.N.D. and N.P. Recently, D.N.D. wrote a report of these findings with the help of D.R. and G.D. The report was further expanded into this comprehensive scientific manuscript mainly by D.R. and G.D. during 2022–24. We note that there is a long gap between data acquisition and public reporting of its results. This is because, even though we had consent to acquire the data, we obtained consent to publish those results in the public domain only now.
2.3. Instruments Used and Signals Recorded
For experiment-1, an 8-channel polygraph system situated at NIMHANS was used for data acquisition. A 4-channel Hewlett-Packard instrumentation tape recorder (connected to the polygraph) from the Indian Institute of Science, Bangalore, India, was used for recording EEG signals on a tape for further analysis on a computer. Independently, 8-channel data from the polygraph was printed in real-time on a paper trace. In addition, an audio tape recorder from AYVM was used for recording the real-time verbal description of the experiment during the course of the experiment. Specifically, naaDi was examined in real-time by an experienced Ayurvedic practitioner (G.R.G.) and narrated for the audio record (more on this later). The experimental protocol was the same in experiment-2, except that 21 channels of data were acquired.
The polygraph instrument used by us simultaneously recorded multiple electrophysiological signals such as EEG, ECG, EMG, EOG and respiration. Its write-out system traced these signals on paper for later study. Its electrical output points were used to record the signals on tape using an instrumentation tape recorder. We present below a brief description of the signals that were recorded using instruments. A more detailed description can be found in the Appendix A. We used ECG to measure the heart’s electrical activity [27]. Voluntary skeletal muscle contractions also result in measurable electrical activity, and were recorded as EMG [28]. Relatively higher EMG frequency and amplitude occur when muscles contract. We used EOG, a variant of EMG with electrodes placed close to the eyes, for measuring eye movements assessed based on the corneo-retinal standing potential [29]. For measuring breathing/respiration, we used a thermistor (a temperature-sensitive resistor) [30] placed near the nostrils, wherein its resistance varied as hot air blew through it during expiration, and relatively colder air passed through it during inspiration. Finally, we acquired EEG that measures neuronal potentials on the scalp, where individual neuronal signals are summated, as millions of them discharge synchronously. Using EEG, we characterized Alpha waves (8–13Hz) that typically appear over the occipital lobes in the awake, mentally relaxed state with closed eyes, and disappear when the eyes are open [31], and beta waves (13–30Hz) [32] that often appear over the parietal and frontal lobes.
Spatiotemporal blood flow patterns in the radial artery at the wrist (naaDi): In addition to the signals recorded via instruments described above, a trained Ayurvedic physician (author G.R.G.) also subjectively measured the spatiotemporal patterns of blood flow in the radial artery at the wrist from the subject during meditation (referred to as naaDi in Sanskrit [33,34,35,36], which is different from the simple wrist pulse). This was done to provide independent validation of the meditative states of the subject based on traditional systems, and it was one of the measured entities we utilized. The traditional Indian system of medicine, Ayurveda [37], has long used naaDi as a diagnostic tool to infer bodily states. While traditionalists may debate the value of studying the physiological correlates of higher meditative states, it must be emphasized that naaDi has been used in Ayurveda to diagnose both physiological and mental diseases. Sriranga Mahaguru not only passionately advocated, but also practically demonstrated the utility of naaDi as a tool to infer higher states of consciousness of individuals during meditation [6]. Hence, we next give a brief description of naaDi and its measurement during our experiments. G.R.G. had extensive experience in measuring naaDi with his fingers to infer bodily and mental states [6,33,34,35]. He was trained under Sriranga Mahaguru, and was skilled at inferring different meditative states in real time based on dynamic variations in spatiotemporal blood flow patterns at the radial artery. There is a long-recorded history of this skill in the Indian subcontinent [33,34,35]. The idea is that the circulatory system is a closed loop, and hence the three-dimensional pressure waves traveling through the arteries are modulated by changing bodily and mental conditions and thus contain information about physiological perturbations across the body and brain. These pressure waves are amplitude-modulated by the dominant pulse waves generated by heartbeats. NaaDi has been traditionally measured by subjectively sensing the spatiotemporal pressure patterns at the radial artery using the fingertips of the expert making the measurements (which is a rare and difficult skill to master, taking decades of practice). Obviously, there is a subjective element to this, and hence Ayurvedic physicians are trained to develop the skill to infer the demodulated spatiotemporal wave patterns underlying the pulse. So far, it has not been possible to measure naaDi at such precision with instruments, although preliminary progress has been made [36,38,39,40,41,42,43,44,45,46,47,48,49,50,51,52,53]. In our experiments, naaDi measurements were characterized by G.R.G. and narrated in real-time, but they were subjectively measured through his skill, and this was not available as quantifiable data to any other individual.
2.4. Methodological Details of the Experiments
The first experiment was conducted on 16 September 1985, and the second on 26 November 1988. In 1985 or 1988, NIMHANS (where the experiment was conducted) did not have a formal ethical approval process for human studies, i.e., it did not have an ethics committee or an institutional review board. The ethics committee at NIMHANS came into existence only in 1993. However, there was an informal process in place to conduct research ethically, wherein the authorities at NIMHANS did not allow experiments that they did not consider ethical. Since this experiment was conducted with the approval of NIMHANS authorities, we can claim that it received informal ethical approval. Also, in accordance with the principles of the Declaration of Helsinki, the human participant (i.e., Srimataji) provided informed consent for participating in the experiments.
2.4.1. Experiment-1 (1985)
Data was acquired for about 37 minutes. Srimataji sat in the Sukhaasana posture (a common Yoga posture) on comfortable seating overlaid with soft cotton fabrics. The first two minutes of the recording were made with Srimataji in an awake relaxed state with eyes open (Figure 1, Photo 1). Afterward, Srimataji meditated for about 30 minutes (Figure 1, Photos 2, 3 and 4). The moment she closed her eyes was timestamped as the onset of meditation. Srimataji had experience in a specific Yogic meditation for over 50 years at that time, which resulted in her attaining and maintaining an altered state of consciousness (which we consider as Samaadhi here). Then she opened her eyes (timestamped as the end of meditation) and remained seated for about 5 minutes.
The electrophysiological signals recorded using the polygraph were as follows. ECG (lead 1) was recorded on one channel. One-channel EMG was recorded by placing an electrode pair (positive and ground) on the right forearm muscles. Respiration was recorded using a thermistor placed near the left nostril (Figure 1, Photo 2). EEG was recorded using bipolar electrodes at four positions (Figure 1, Photo 4): two frontal channels, F3-C3 (frontal left) and F4-C4 (frontal right), and two posterior/occipital channels, C3-O1 (posterior left) and C4-O2 (posterior right). The Nyquist sampling rate was 70 Hz, with the maximum captured frequency being 35 Hz (hence, we sampled only up to the beta band). All signals were also recorded on paper using the polygraph. The paper speed of the polygraph was 25 mm/second, and the sensitivity was 50 microvolts per centimeter. In all, about 180 sheets of data were generated. EEG signals were also recorded on the four channels of the instrumentation tape recorder, which started at counter number 47 and ended at counter number 193, with each counter/epoch corresponding to about 15 seconds of data. The instrumentation tape recorder was run at a speed of 9.5 centimeters per second. Half-inch width tape was used.
Those four EEG channels were chosen on the following basis. Even though we wished to record more than four channels, we were constrained by the limitations of the instruments available to us at that time. After accommodating other physiological signals, only four channels were available for the EEG channels on the 8-channel polygraph system. The instrumentation tape recorder also had only four channels available for recording. Hence, as mentioned before, we chose the two frontal and two occipital channels. Fronto-polar (Fp1 and Fp2) electrodes were not chosen due to their higher likelihood of having ocular artifacts. Upward movement of the eyes and eyebrows was not uncommon during her meditation, and nearby EEG electrodes can capture EOG/EMG artifacts as a result. Bipolar configuration was used.
Objective observations were made from the recorded 8-channel polygraph data. In the 1980s in India, clinical interpretation of EEG relied on the ability of the electroencephalographer to view, analyze and interpret the information contained in the graphic paper trace of the EEG signal. This was carried out in this study in consultation with a clinician with expertise in reading paper EEG records (Dr. H.P. Eshwara). Additionally, EEG data analysis using computers and programming tools (which were cutting-edge back then) was also explored to gain further insights. Computer analysis of certain portions of the signals recorded on the instrumentation tape recorder was carried out as follows. An average power spectrum (squared magnitude vs. frequency plot) was obtained with portions of the records from O1 (and F4) channels with counter numbers 49 to 58 (before meditation) and 77 to 82 (during meditation). Each epoch lasted for about 15 seconds. The resulting power spectra are presented and interpreted.
During the experiment, G.R.G. continuously measured Srimataji’s naaDi, and heartbeat (with a stethoscope), and gave a verbal description of his observations, which was recorded onto an audio tape. He had prior experience in inferring meditative conditions and corroborating them with the experiences of the practitioners. Simultaneously, visual observations were made by another person (please refer to the Acknowledgments section) regarding the meditative condition of Srimataji (like the position of eyebrows and facial expressions), which were narrated onto another audio tape. Also, numbers on the counter of the instrumentation tape recorder were read aloud and recorded to synchronize the timings. Concurrently, these numbers were also marked on the recording paper of the polygraph. This procedure was adopted to later identify sections of the polygraphy data corresponding to the observations recorded on the audio tape by G.R.G. (such as the position of eyebrows, and expressions associated with meditative states). A few photographs and continuous videographs were also captured during the experiment.
4.2.2. Experiment-2 (1988)
Data was acquired for about 33 minutes on 26 November 1988. The experimental paradigm and specifics were consistent with experiment-1. The first minute of the recording was in an awake relaxed state with eyes open. The subsequent meditation phase with eyes closed (which included the altered state of consciousness) lasted for about 29 minutes (Figure 2, Photo 7). After that, Srimataji sat in the eyes-open state for about 1 minute. The 21 channels of electrophysiological signals recorded using the polygraph (Figure 2, Photo 5) were as follows. Thirteen EEG electrodes were placed (unipolar configuration, referenced to mastoids A1 and A2) at the frontal pole (Fp1, Fp2), lateral prefrontal (F3, F4), central/somatomotor (C3, C4, Cz), lateral parietal (P4, Pz), lateral temporal (T3, T4), and occipital (O1, O2) locations. The remaining eight channels included one EOG, two EMG, two respiration, one GSR, one PPG, and one ECG channel. In total, this was the maximum number of channels that could have been recorded with our instrumentation (Figure 2, Photo 6). Note that these were among the most sophisticated high-end instrumentation available in India in 1988. Although 21-channel data was recorded on the paper trace, only 9 of these channels were digitally recorded using two instrumentation tape recorders (speed: 3.75 inches per second) – 4 EEG channels on a Schlumberger recorder, and 1 EMG and 4 EEG channels on a Hewlett-Packard recorder. A few photographs and continuous videographs were also captured.
As before, objective observations were made from the recorded data, albeit with a different approach for the EEG data. The EEG power spectrum analysis was not done. Instead, a compressed spectral array (CSA) analysis was carried out to generate CSA plots. A CSA plot is generated by decomposing a signal into a time-frequency plot by superimposing on each other the power spectra of short epochs of time across successive epochs [54,55]. It appears like a three-dimensional hill-and-valley display of frequency horizontally (x-axis), time vertically (y-axis), and the power amplitude as the peaks (z-axis). The higher the spectral peak, the more will be the spectral energy at that frequency at that point in time. It informs us of changes in the frequency content of a signal across time. To obtain the CSA plot, the data were filtered digitally using a fourth order Butterworth band-pass filter in cascade [0.25–55 Hz]. A lower cut-off of 0.25 Hz was used to filter out movement and other low-frequency drifts. A higher cut-off of 55 Hz was used to filter out high-frequency noise. Given the sampling rate was 256 Hz, we used data segments of 1024 points (=4×256) without zero padding for computing the CSA. These rolling 4-second segments were overlaid onto each other with hidden line suppression. Time domain data were transformed to the frequency domain using standard fast Fourier transform with a Hamming window. We interpreted the generated CSA plots qualitatively but objectively and grounded on visual evidence (instead of numerical). CSA plots were generated for Fp1 and O1 channels after ascertaining data quality.
We understand that additional analyses were possible, such as generating CSA plots for all 8 digitally recorded EEG channels instead of just the two, or generating CSA plots for experiment-1 data, and so on. But we acknowledge that the results presented here were generated over 30 years ago, with the limitations and drawbacks of the circumstances and tools at that time. Conducting these additional analyses, including those with the latest analytical tools and approaches, is scope for future work.
Overall, our analysis approach was mainly qualitative in nature, but it was grounded on objective inference and precise evidence from the data. Rather than the technology used or the methods employed, the most critical piece of this study was the participant being studied, owing to her Yogic achievements [24,26] and her ability to attain the state of Samaadhi at will, based on historical records, individual accounts and naaDi measurements (as cited before).
3. Results and Discussion
3.1. Respiration Results (Both Experiments)
In experiment-1, before meditation, routine breathing waves at the rate of about 15 breaths per minute were observed (illustration in Figure 3a) (Figure 4a, Channel 1). Immediately after the onset of meditation, the breathing rate reduced to about 10 per minute (Figure 4b, Channel 1). Subsequently, the breathing amplitude became extremely low (with a mean value of <5% of the pre-meditation amplitude), and the breathing waves were hardly visible on the paper trace (illustration in Figure 3b) (Figure 5b, Channel 1). It remained this way until nearly the end of the meditation period. It was also noted that there was no compensatory breathing after the periods of respiratory suspension, such that even the extremely low amplitude breathing waves ran alike for pages on the paper trace over a majority of the meditation period, showing no signs of compensatory breathing. The whole process looked natural during the experiment, and we did not suspect any forced suspension of breathing. There was no compensatory breathing even after meditation (Figure 6b, Channel 1). We could not reliably infer the breathing rate during meditation because of the extremely low amplitude. Identical observations were made in experiment-2 (Figure 8, Figure 9 and Figure 10, Channel 18). These results indirectly indicated a considerable reduction in bodily metabolic activity, which likely reduced the oxygen demand, resulting in minimal breathing amplitude. Future studies must empirically confirm this by directly measuring metabolic rate through bodily glucose uptake using fluorodeoxyglucose positron emission tomography [56].
These observations corroborate with related descriptions provided by Sriranga Mahaguru in 1955 and 1962 [6,25,26]. Based on his experiments, experiences, and observations, he had elaborated that deep breathing at the initiation of Yogic meditation is generally followed by extremely low amplitude breathing during the Yogi’s ‘deep’ and ‘inward’ meditative states. Figure 4a (Channel 1) elucidates the breathing pattern of Srimataji just before the start of meditation, showing clear peaks and breathing cycles, which transitioned to deeper breaths at the beginning of meditation (Figure 4b, Channel 1). Breathing cycles disappeared after some time, and extremely low amplitude breathing was seen during meditation (Figure 5b, Channel 1). Overall, the breathing patterns seemed to be unique and unusual, yet not pathological.
3.2. Electrical Activity of the Muscles (EMG Results) (Both Experiments)
During experiment-1, before meditation, the EMG signal was nearly flat, indicating that the forearm muscles were relaxed (Figure 4a, Channel 2). This transitioned to high amplitude high-frequency EMG activity about a minute after the onset of meditation, and was sustained throughout the period of meditation. Figure 5b (Channel 2) shows the EMG signal during meditation at about 15 minutes after onset. This indicated that her forearm muscles contracted stiffly and sustained that state throughout the meditation. Identical observations were made during experiment-2 (Figure 8 and Figure 9, Channel 15). High amplitude high-frequency EMG activity was seen immediately upon the onset of meditation and sustained throughout the meditation period. Visual observations during meditation showed stiffened muscles, which corroborate inferences made from EMG data. This coincides with observations made by Sriranga Mahaguru on Srimataji during Samaadhi several decades before the experiment (in 1955 and 1962) [6,25,26], as well as claims made in ancient Vedic texts, which assert that the body becomes stiff like a log of wood during Samaadhi (in Sanskrit: ‘kaashthavat jaayate vapuhu’ [57]). Interestingly, during meditation, GSR amplitude was noticeably reduced to the level of being imperceptible (Expt-2: Figure 9b, Channel 19), indicative of a calm state with minimal arousal and low sympathetic response [58]. This implies that, strangely, Srimataji was very relaxed and calm while her forearm muscles were stiffened during meditation.
Experiment-2 also included an EOG channel that showed a positive signal change immediately after meditation onset (Figure 8, Channel 14), indicative of considerable upward movement of the eyeballs. This phenomenon is documented in ancient Vedic literature [59]. EOG evidence suggested an immediate and quick transition to a meditative state upon closing the eyes and marking the beginning of meditation.
3.3. Electrical Activity of the Heart (ECG Results) (Both Experiments)
In both experiments, during meditation, ECG showed regular waves with QRS segments of almost equal amplitude compared to before meditation (Expt-1: Figure 5, Channel 4) (Expt-2: Figure 9, Channel 21). The fast baseline variations seen only during meditation were either due to artifacts or because of muscular contractions (as seen in EMG signals) that confounded the ECG signal as noise.
Interestingly, the heartbeat as heard on a stethoscope and the pulse as felt on the wrist with his finger by G.R.G. during meditation differed from what was seen in ECG. Specifically, heartbeat and wrist pulse (both related to mechanical pumping of the heart) had extremely low amplitude to the level of being imperceptible, even though the ECG waves (related to the electrical activity of the heart) appeared normal. It is worth mentioning that experiments conducted on voluntary control of the heart and pulse by certain Yogic practitioners found that their ECG showed consistent cardiac electrical activity, but the pulse was almost imperceptible, and no heart sounds were heard [17]. Similar observations were made in our study as well, although, in contrast, we did not observe any significant changes in P waves or the QRS complex during meditation. This indicates that Srimataji’s meditation did not interfere with natural cardiac electrical activity. It is likely that the cardiac output (and mechanical activity) was significantly reduced to meet lower metabolic demands, as corroborated by observations made from the respiration data. Such dissociation between cardiac electrical and mechanical activities is possible, and has been reported, for instance, during hypothermia [60,61]. ECG measures the electrical activity of the heart, but it need not necessarily correlate with the intensity of mechanical pumping of the heart. This might explain why heartbeat sounds were very feeble or imperceptible. The wrist pulse felt at the radial artery is not merely a function of the heartbeat but also the vascular system and its neural control [33,35]. This could underlie low-amplitude wrist pulse observed during meditation. Further experiments are needed to test these empirical observations more thoroughly.
3.4. Electrical Activity of the Brain (EEG Results) (Experiment-1, 1985)
EEG results are shown in Figure 5a (before meditation) and Figure 5b (during meditation, 15 minutes after onset) on Channel 5 (F3-C3), Channel 6 (C3-O1), Channel 7 (F4-C4) and Channel 8 (C4-O2). Observations made by a visual examination of the four EEG channels on the paper trace record (in consultation with Dr. H.P. Eshwara) are summarized in this and next paragraphs: Before meditation, the EEG background activity consisted of medium amplitude 11 Hz waves well-formed over posterior regions. Artifacts were noted anteriorly related to eye movements. Corroborating EMG data, immediate changes in the EEG paper trace could be visually noticed upon starting meditation. With the onset of meditation, bifrontal slow activity was noted in the range of 5 Hz theta wave and 2.5 Hz medium amplitude delta wave activity, as well as bi-occipital 11 Hz medium amplitude alpha wave activity. Intermixed with bifrontal slow theta and delta activity, alpha activity was also apparent. During meditation, the bifrontal delta wave became more prominent, along with associated muscle tension artifacts.
Frontal slow-wave activity is typically seen in sleeping adults; however, the stiff muscle tone observed in EMG rules out sleep or drowsiness as a likely cause. Evoked slow-wave frontal response has been shown to be a marker of response inhibition and sustained attention [62]. However, we observed spontaneous (and not evoked) slow-wave frontal activity. Therefore, we can only speculate that both response inhibition and sustained attention, which are essential aspects of meditation, may have played a role. Yet, it appears that there is something distinct about seeing slow-wave frontal activity in spontaneous EEG. These do not represent clinically abnormal records either, because the data were essentially normal before and after meditation (the participant also did not have any history of neurological or psychiatric symptoms). When these observations were taken together with the associated findings from the other channels, it appeared that the data pointed towards a state of consciousness different from awake, dreaming or sleeping. Specifically, EMG findings indicated rigidity of the body during meditation, which was opposite to that commonly seen during drowsiness or sleep (looseness of the body). Respiration amplitude was an order of magnitude lower during meditation, which is not characteristic of awake, dreaming or sleeping states (or even a hypnotic state). Taken together with the visual description during meditation, the evidence points towards a distinct state of consciousness that could correspond to Samaadhi, or what is called the fourth state of consciousness in Yogic literature. The subjective experiences of Srimataji, as narrated to us later, also lend support to this.
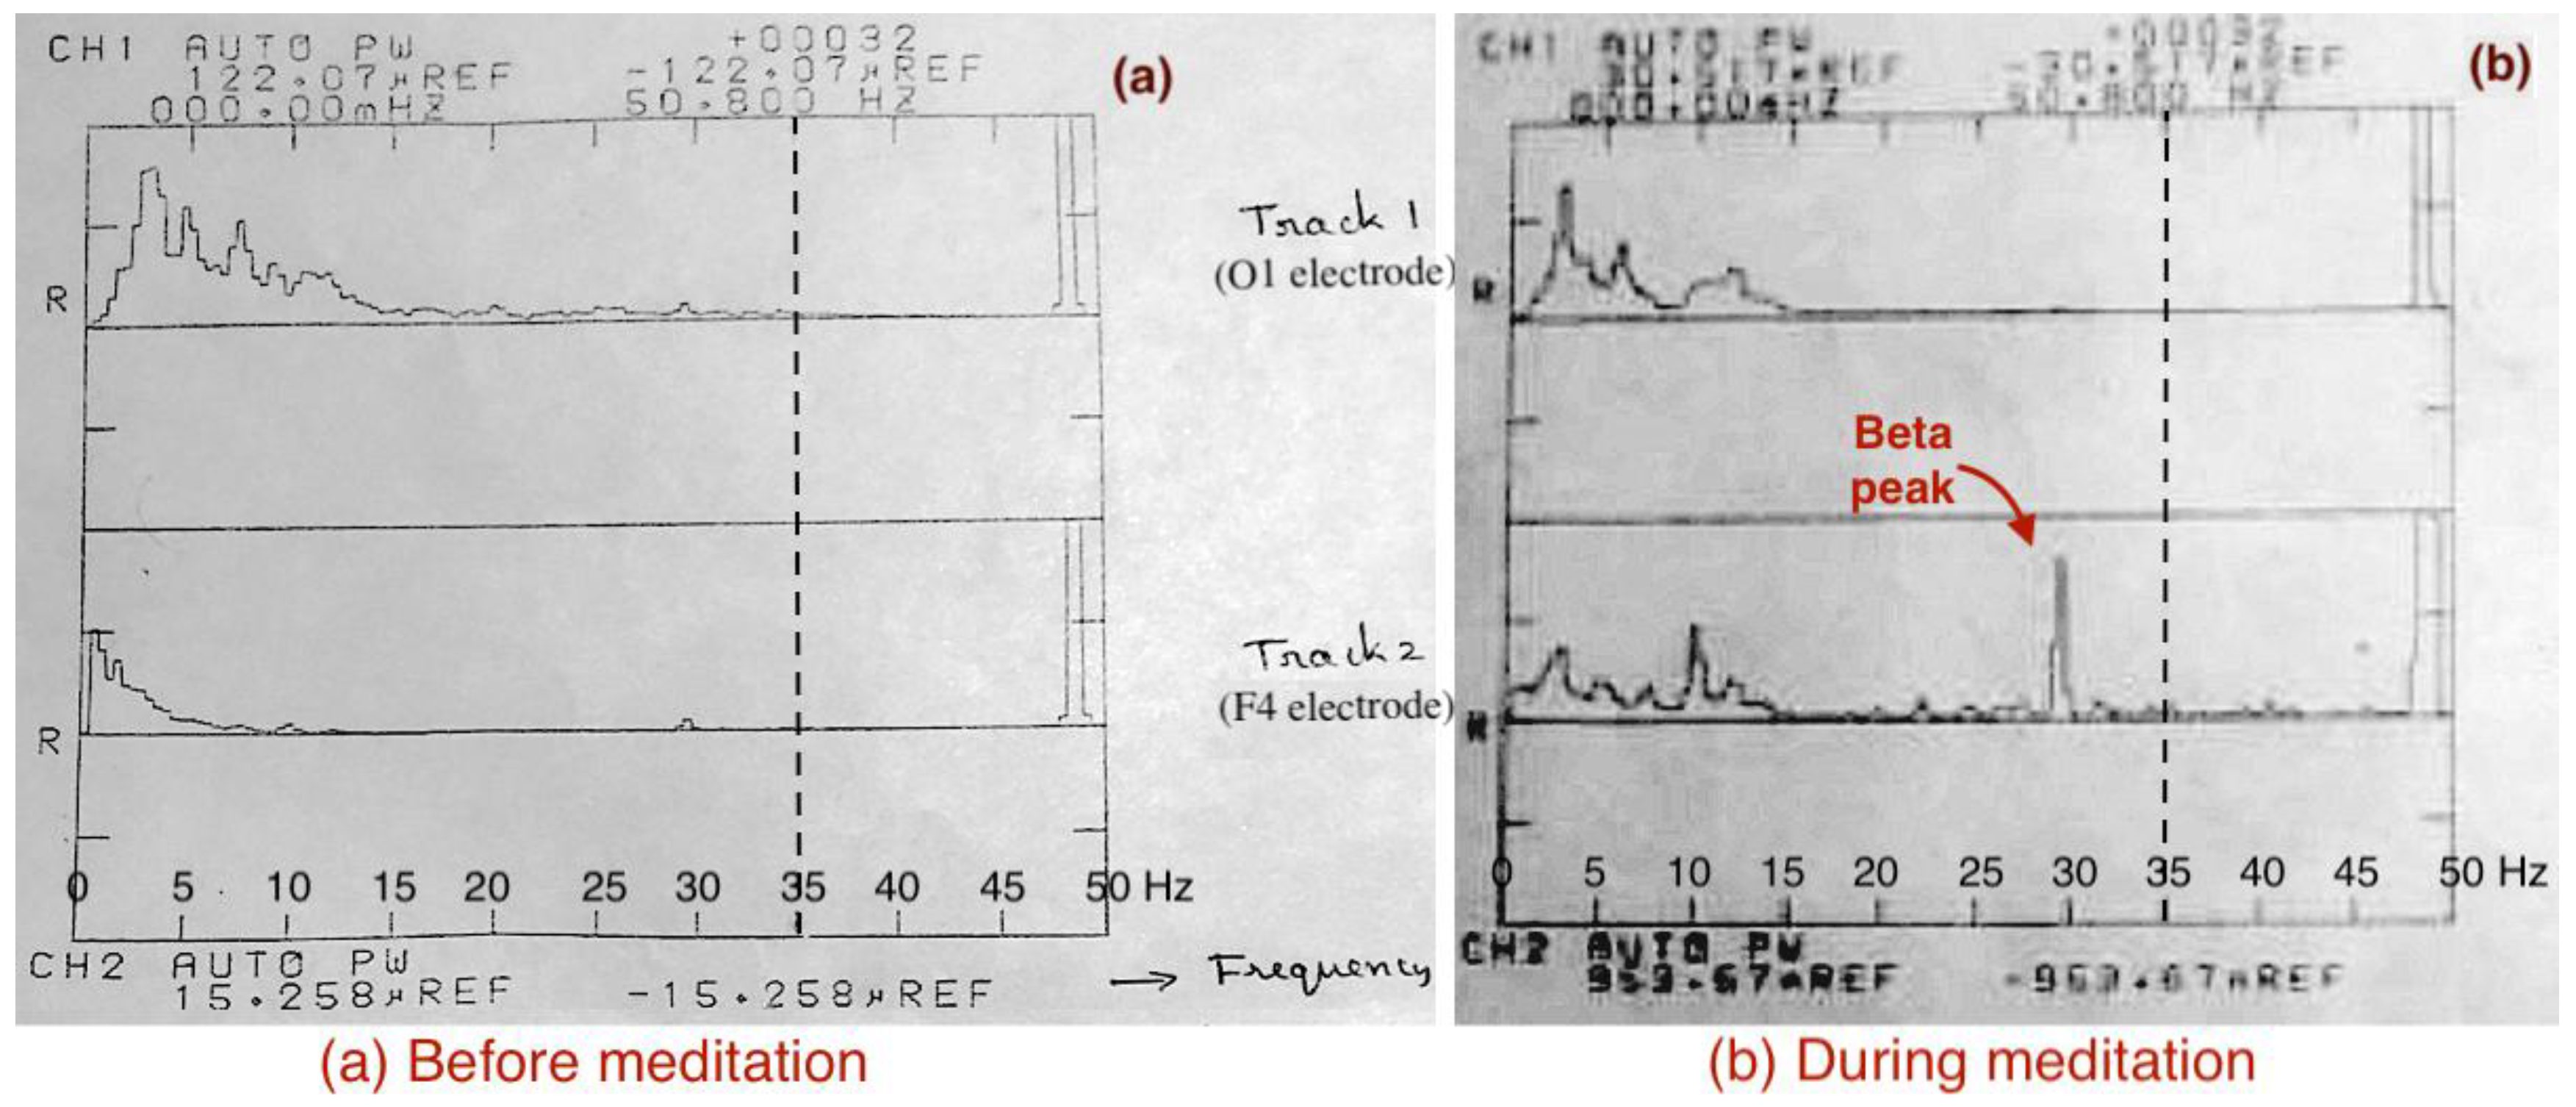
Analysis of the digitally recorded EEG data on a computer using programming tools was carried out (computer processing was cutting-edge at that time). The resulting power spectrum plots are shown in Figure 7. The power spectrum during meditation seemed unique, and the audio description by G.R.G. based on naaDi measurements indicated the possibility of an exceptional meditative experience during this epoch. We observed 30 Hz beta wave activity in the right frontal region (F4) during meditation, corresponding to the exceptional meditative condition as noted by G.R.G, suggesting that certain Yogic meditative experiences could be associated with bursts of high-frequency EEG activity. It is noteworthy that frontal beta was accompanied by a smaller alpha peak in this meditative epoch. This is a rare signature since it indicates high arousal and high relaxation during the same state. Generally, arousal and relaxation are inversely related, but here we have an example where they occur simultaneously during meditation. Our acquisition upper cut-off frequency was 35 Hz; hence sampling at higher rates in the future could reveal even higher frequency contents (up to 80 Hz gamma waves) during such meditative states. It is also possible that a higher frequency 40 Hz peak got aliased into 30 Hz due to the 35 Hz cut-off.
Figure 7.
The average power spectrum of two tracks/channels during a 10-second epoch (a) before meditation, and (b) during meditation. Track-1 corresponds to the O1 electrode, and track-2 to the F4 electrode. Although the x-axis ranges from 0 to 50.8 Hz (because of the software used to generate the plots), the sampling rate was 70 Hz, and hence the maximum sampled frequency was 35 Hz (thick vertical dotted lines), During meditation, a high-frequency peak around 30 Hz in the beta band (13–30 Hz) of channel F4 was observed (red arrow), which was not present before meditation.
3.5. EEG Results (Experiment-2, 1988)
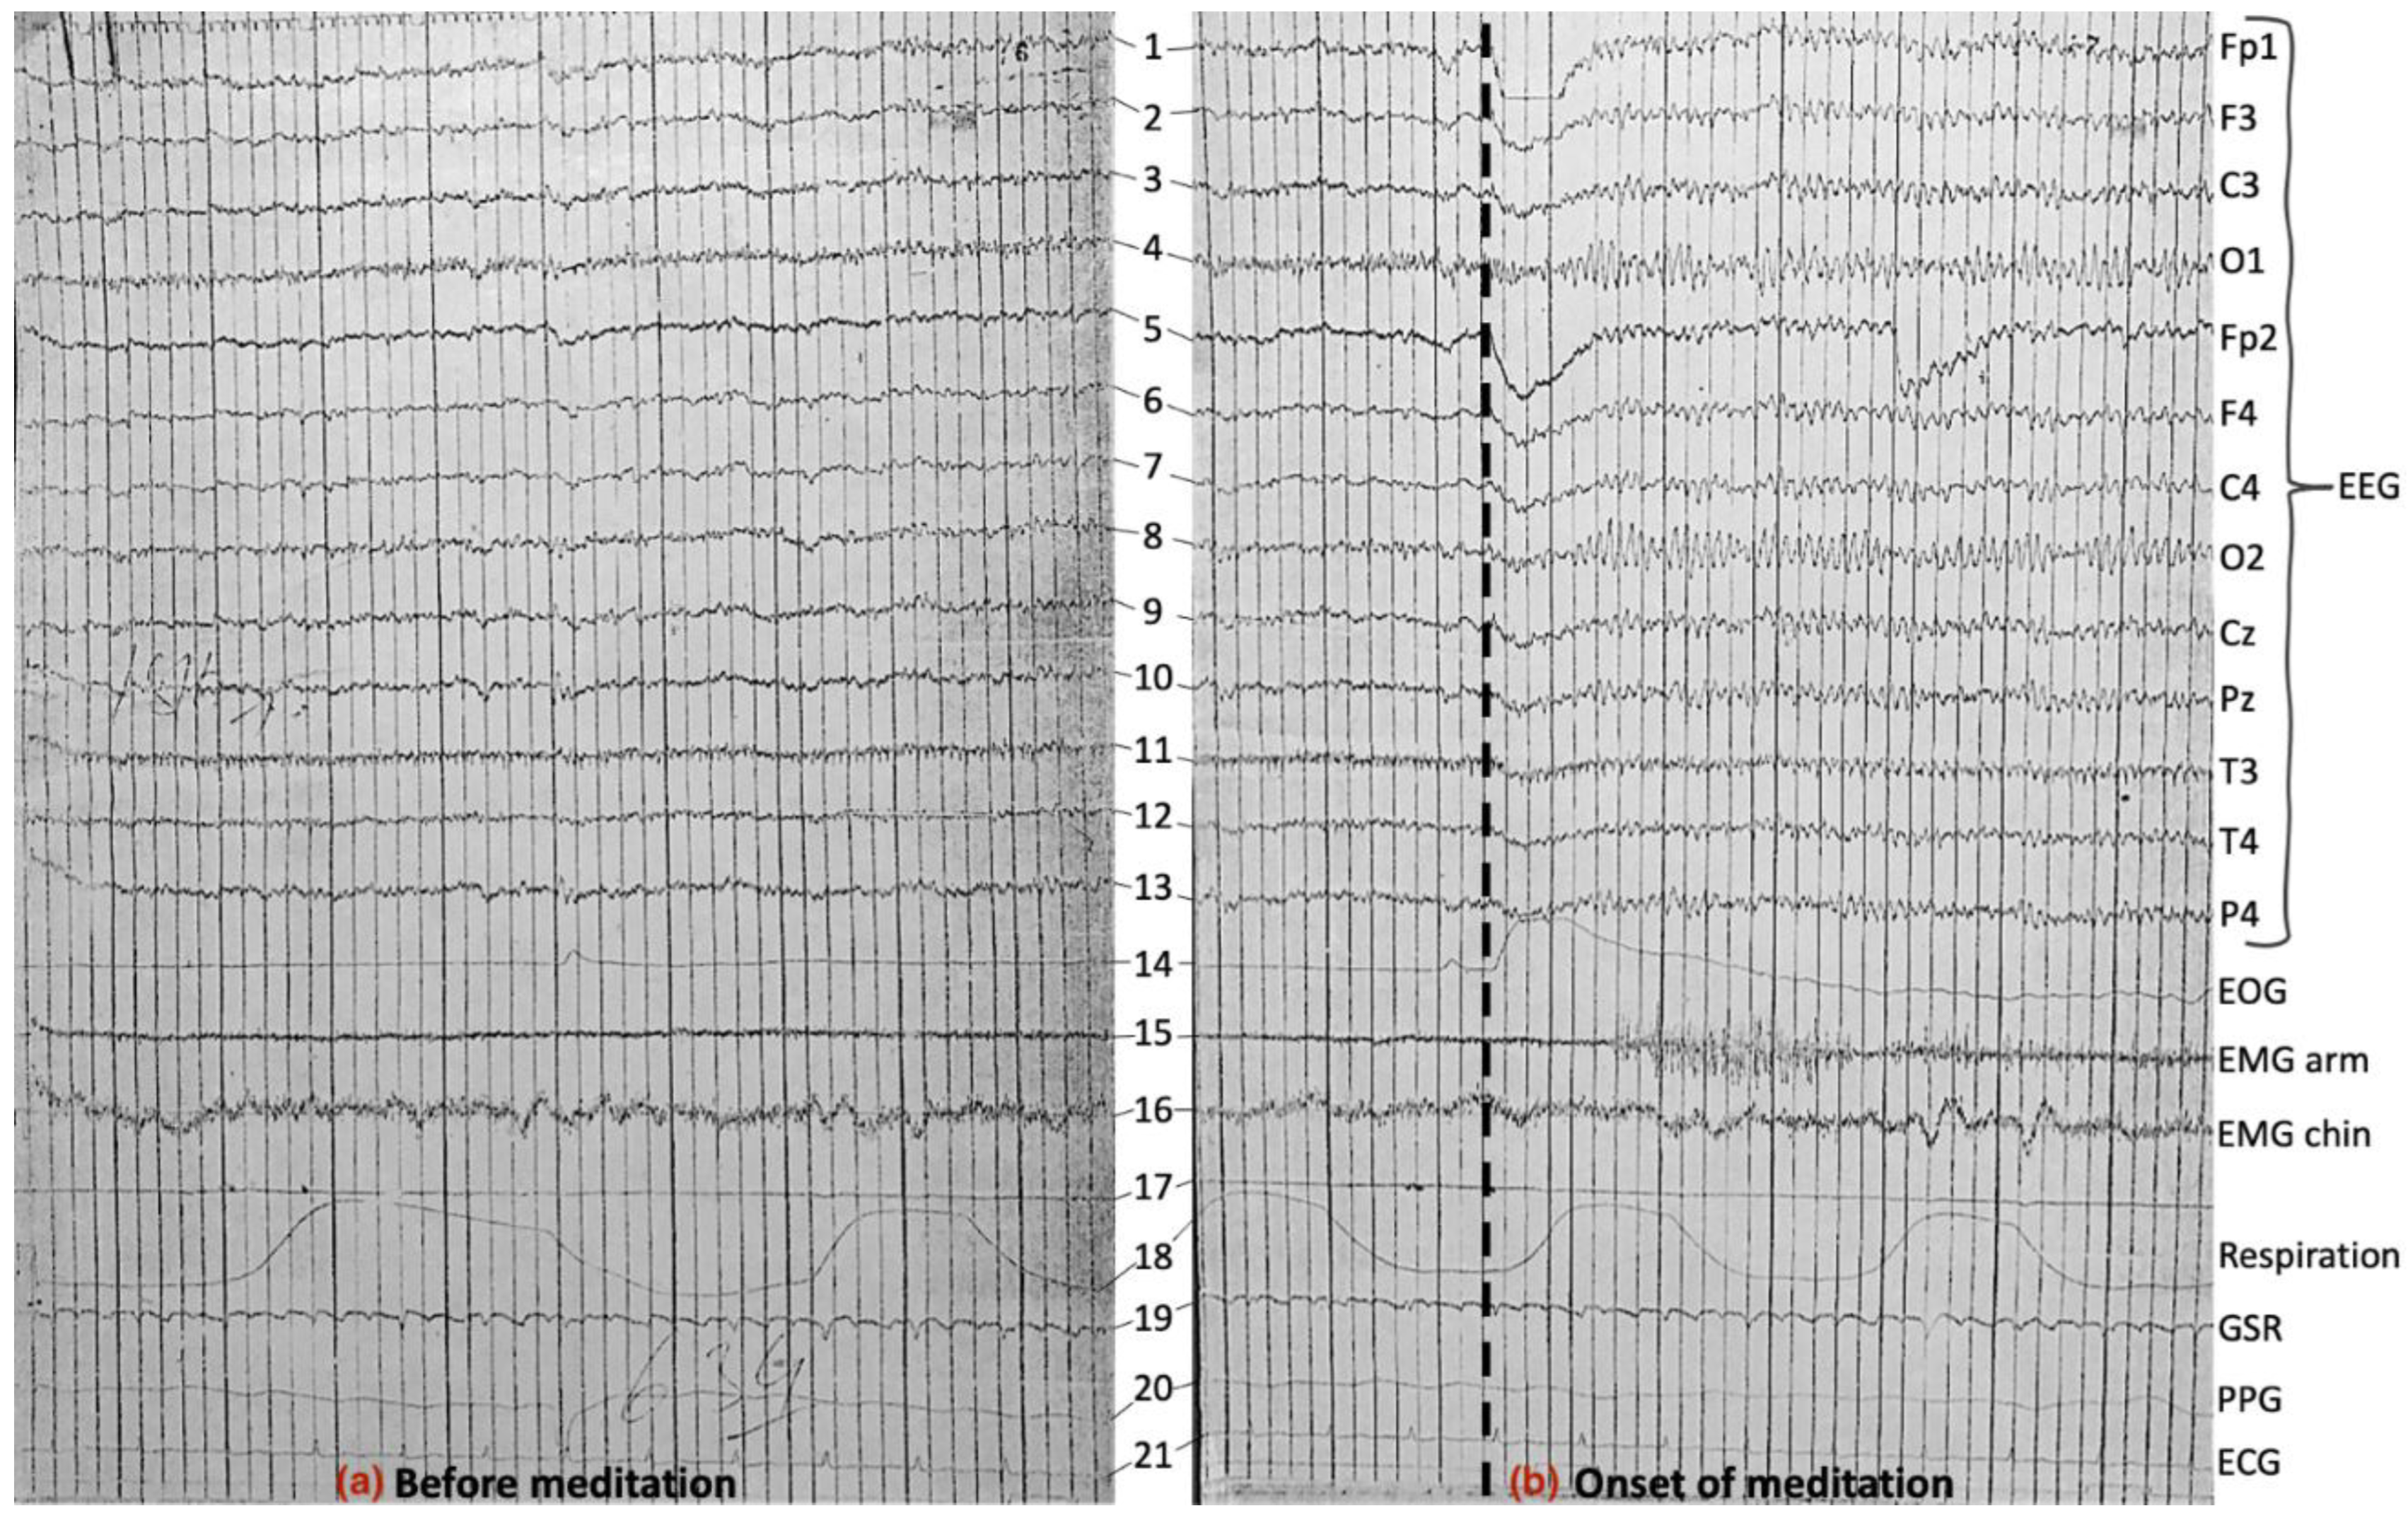
Corroborating EMG/EOG observations, immediate changes in EEG signals could be visually noticed upon the onset of meditation (Figure 8). It can be seen that Srimataji instantly transitioned to a meditative state in under a second with drastic changes in all EEG channels along with instant upward movement of the eyeballs (EOG channel) and stiffening of both arm and chin muscles (EMG channels). The immediate upward eye movement upon meditation onset seemed to create artifacts in Fp1 and Fp2 channels that were close to the eyes. We observed a widespread increase in alpha activity across EEG channels, with relatively more increase in O1 and O2 channels. It is not surprising that occipital channels displayed alpha activity, as often happens during the eyes closed condition [63]. However, increased magnitude of alpha activity unanimously across the rest of the cortex was unexpected. High beta activity was observed in the frontal electrodes in certain epochs during meditation, along with high EOG and EMG activity, low GSR amplitude, and reduced respiration amplitude and rate (Figure 9). The records after meditation are shown in Figure 10.
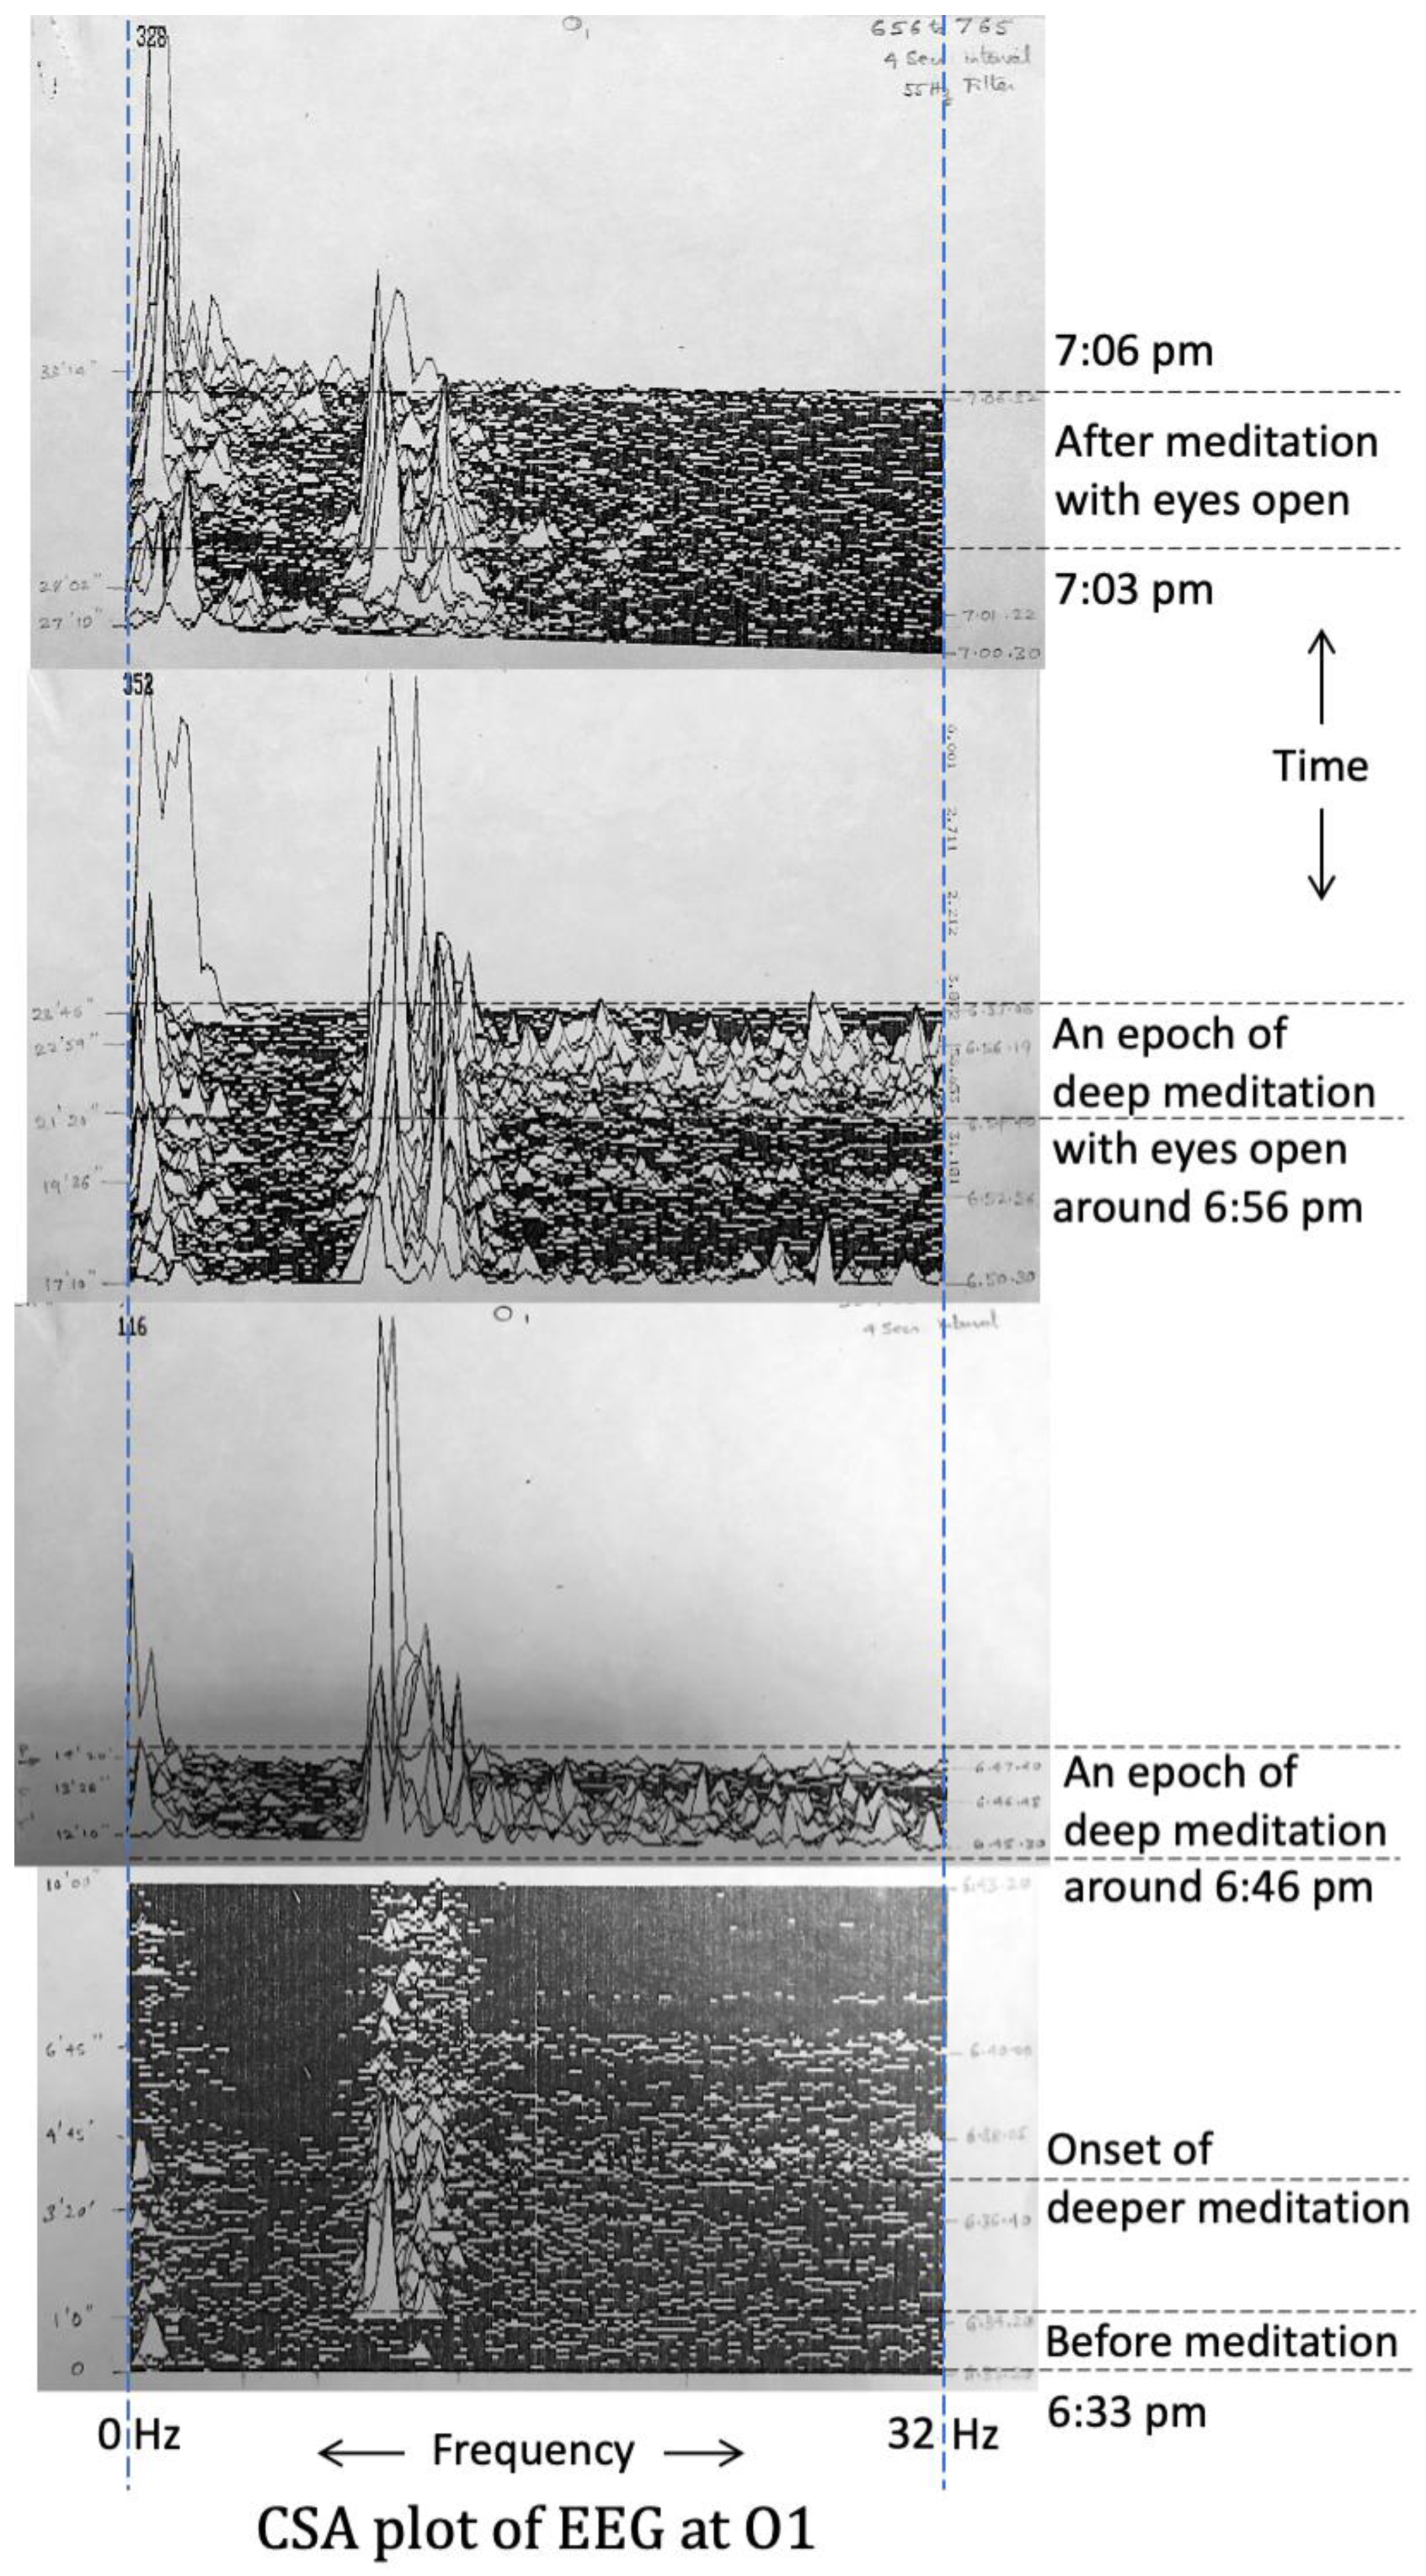
While we obtained an interpretation of EEG records from a clinician and generated power spectra in experiment-1, we generated CSA plots in experiment-2 for channels Fp1 (Figure 11) and O1 (Figure 12), which provided richer information compared to power spectra. Before meditation (6:33:20 pm to 6:34:20 pm), both channels saw minimal alpha and beta activity. The moments immediately after the start of meditation at 6:34:20 pm saw the onset of visibly higher alpha activity at both Fp1 and O1. The beginning of a deep meditative state was observed by G.R.G. based on naaDi measurements at 6:37:20 pm, and at that precise moment, EEG data revealed the onset of high beta activity along with alpha activity at Fp1; also high alpha activity was observed at O1. This state lasted for just over two minutes, and then Srimataji returned to the meditative state that existed before this. Several such cycles were observed over the course of the experiment. Another such epoch of deep meditation lasting for about two and half minutes around 6:46 pm is shown in the figures wherein high beta activity at Fp1 and high alpha as well as beta activities at O1 were observed.
An interesting observation was made during a two-and-a-half minute epoch around 6:56 pm when Srimataji had her eyes open. When a person is awake with the eyes open, alpha activity is absent in the occipital cortex [63]. However, Srimataji exhibited precisely the same EEG patterns during this eyes-open epoch compared to the deep meditation epochs (with eyes closed) observed earlier. Specifically, high beta activity was observed at Fp1, and high alpha, as well as beta activity, were observed at O1. This indicated that Srimataji was possibly in a deep meditative state even though her eyes were open. The presence of alpha activity at O1 suggests the possibility that visual information from the eyes was not being relayed to the occipital cortex but was gated at the lateral geniculate nucleus of the thalamus [64]. This possibility can be empirically tested in future studies by measuring brain function during this state using functional magnetic resonance imaging (fMRI) [65]. NaaDi measurements by G.R.G. also indicated that Srimataji was in a deep meditative state. In Yogic literature, this is described as a unique Yogic condition called ‘poornima drishti’ [5,35].
Figure 8.
Experiment-2 21-channel electrophysiological data of about a 10-second epoch (a) before, and (b) at the onset of meditation. The onset is marked with a thick vertical dotted line. An increase in EMG muscle contractions and immediate upward eye movement upon the onset of meditation are visibly apparent, apart from changes in EEG discussed in sections 4.4 and 4.5. Overall, an increase in alpha activity across EEG channels immediately following meditation onset is also apparent.
Although 7:03 pm was marked as the end of meditation when Srimataji opened her eyes, EEG patterns during the subsequent 3-minute post-meditation phase were different from pre-meditation, and more similar to EEG patterns during meditation, especially at O1. Specifically, high alpha activity was observed at O1 even though her eyes were open. But unlike the ‘poornima drishti’ epoch, beta activity was not seen at Fp1. This pattern was similar to EEG signatures during certain meditation periods between the deep meditative epochs. EOG and breathing had returned to a normal state during the post-meditation phase. Ice cubes were placed on Srimataji’s arm at this stage, and to the experimenters’ surprise, this did not result in any noticeable changes in Srimataji (arm reflexes, tactile sensations, facial expressions, naaDi measurements); she confirmed after the experiment that she did not feel the sensation of ice cubes. She gained awareness of the external world only after some time had passed in the eyes-open post-meditation phase.
On a side note, low-frequency delta and theta waves were also noticed consistently during meditation at O1 and during certain epochs at Fp1. As in experiment-1, high frequency beta activity was accompanied by alpha activity in the same electrodes, indicating simultaneous relaxation and arousal. Overall, specific unusual and atypical EEG observations were made during this experiment that are highly uncommon or absent in healthy adults during awake, dreaming or sleeping states.
Figure 9.
Experiment-2 21-channel electrophysiological data of about a 10-second epoch (a) before (for comparison), and (b) during meditation. EMG muscle contractions and EOG eye movements were high and consistent during meditation, apart from changes in EEG discussed in sections 4.4 and 4.5. Low respiration amplitude and high EEG beta activity (predominant in frontal electrodes) was also apparent.
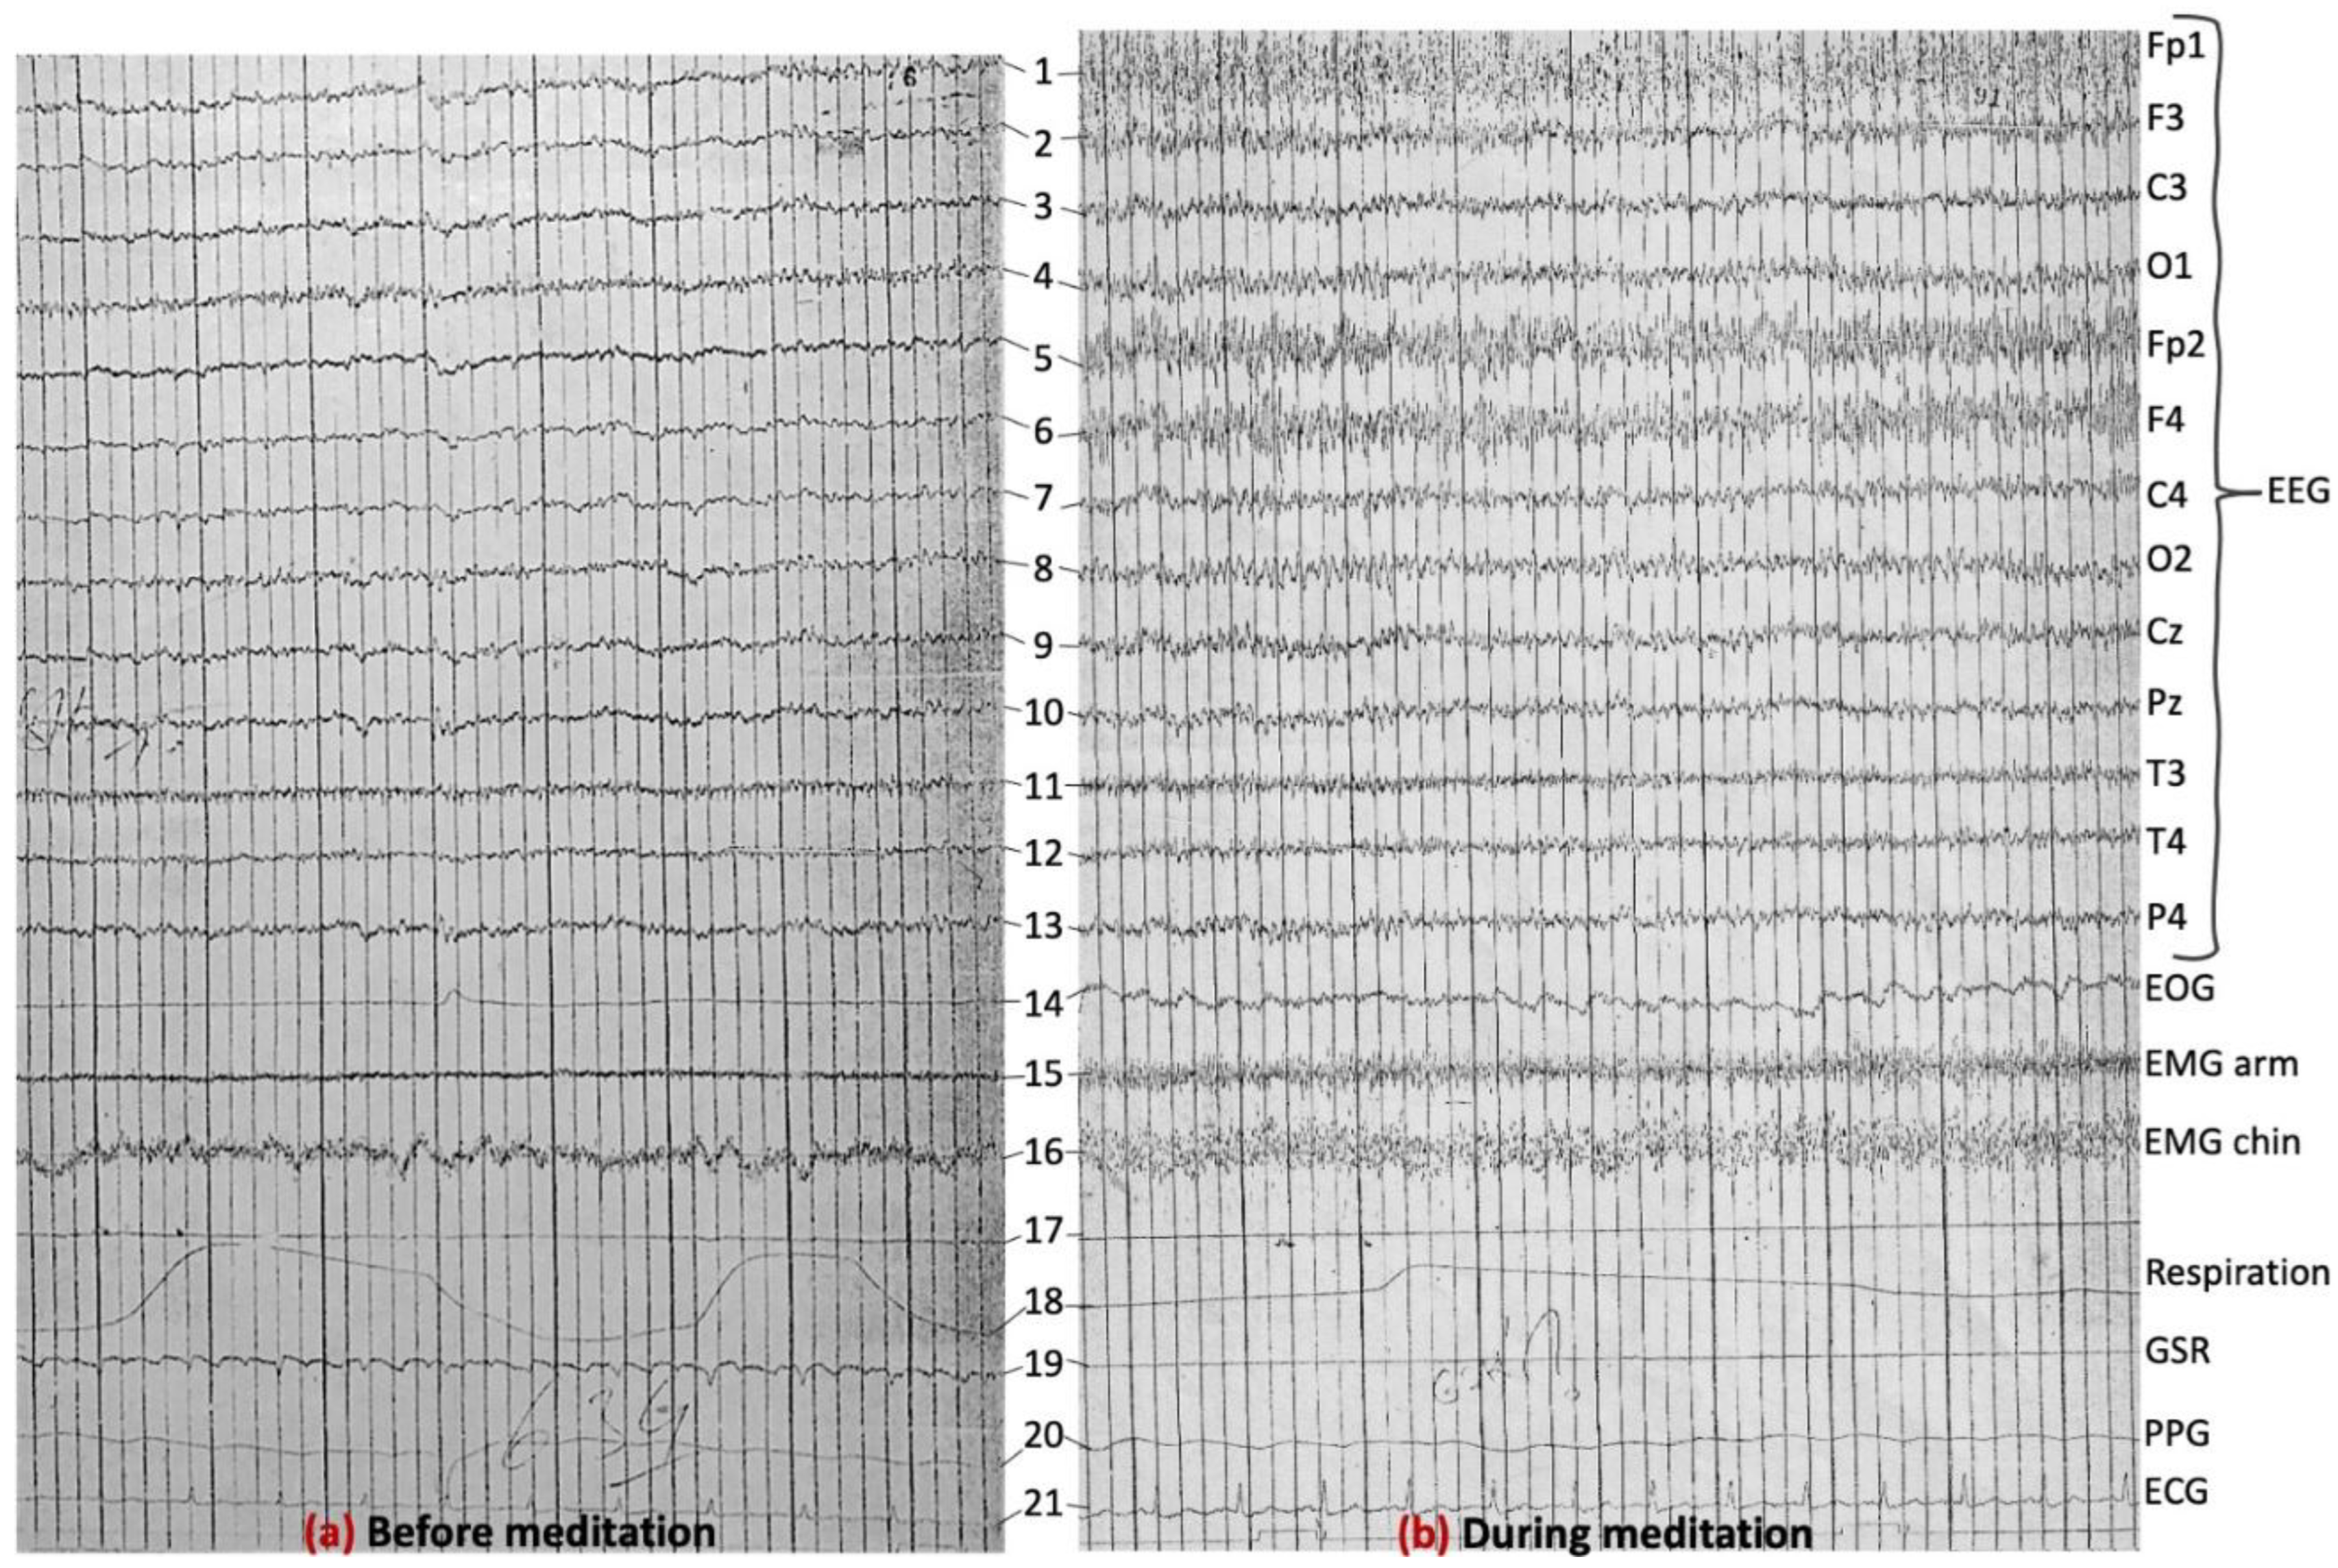
Figure 10.
Experiment-2 21-channel electrophysiological data of about a 10-second epoch (a) before (for comparison), and (b) after meditation. The row above channel-1 corresponds to a time marker and can be safely ignored.
Figure 10.
Experiment-2 21-channel electrophysiological data of about a 10-second epoch (a) before (for comparison), and (b) after meditation. The row above channel-1 corresponds to a time marker and can be safely ignored.
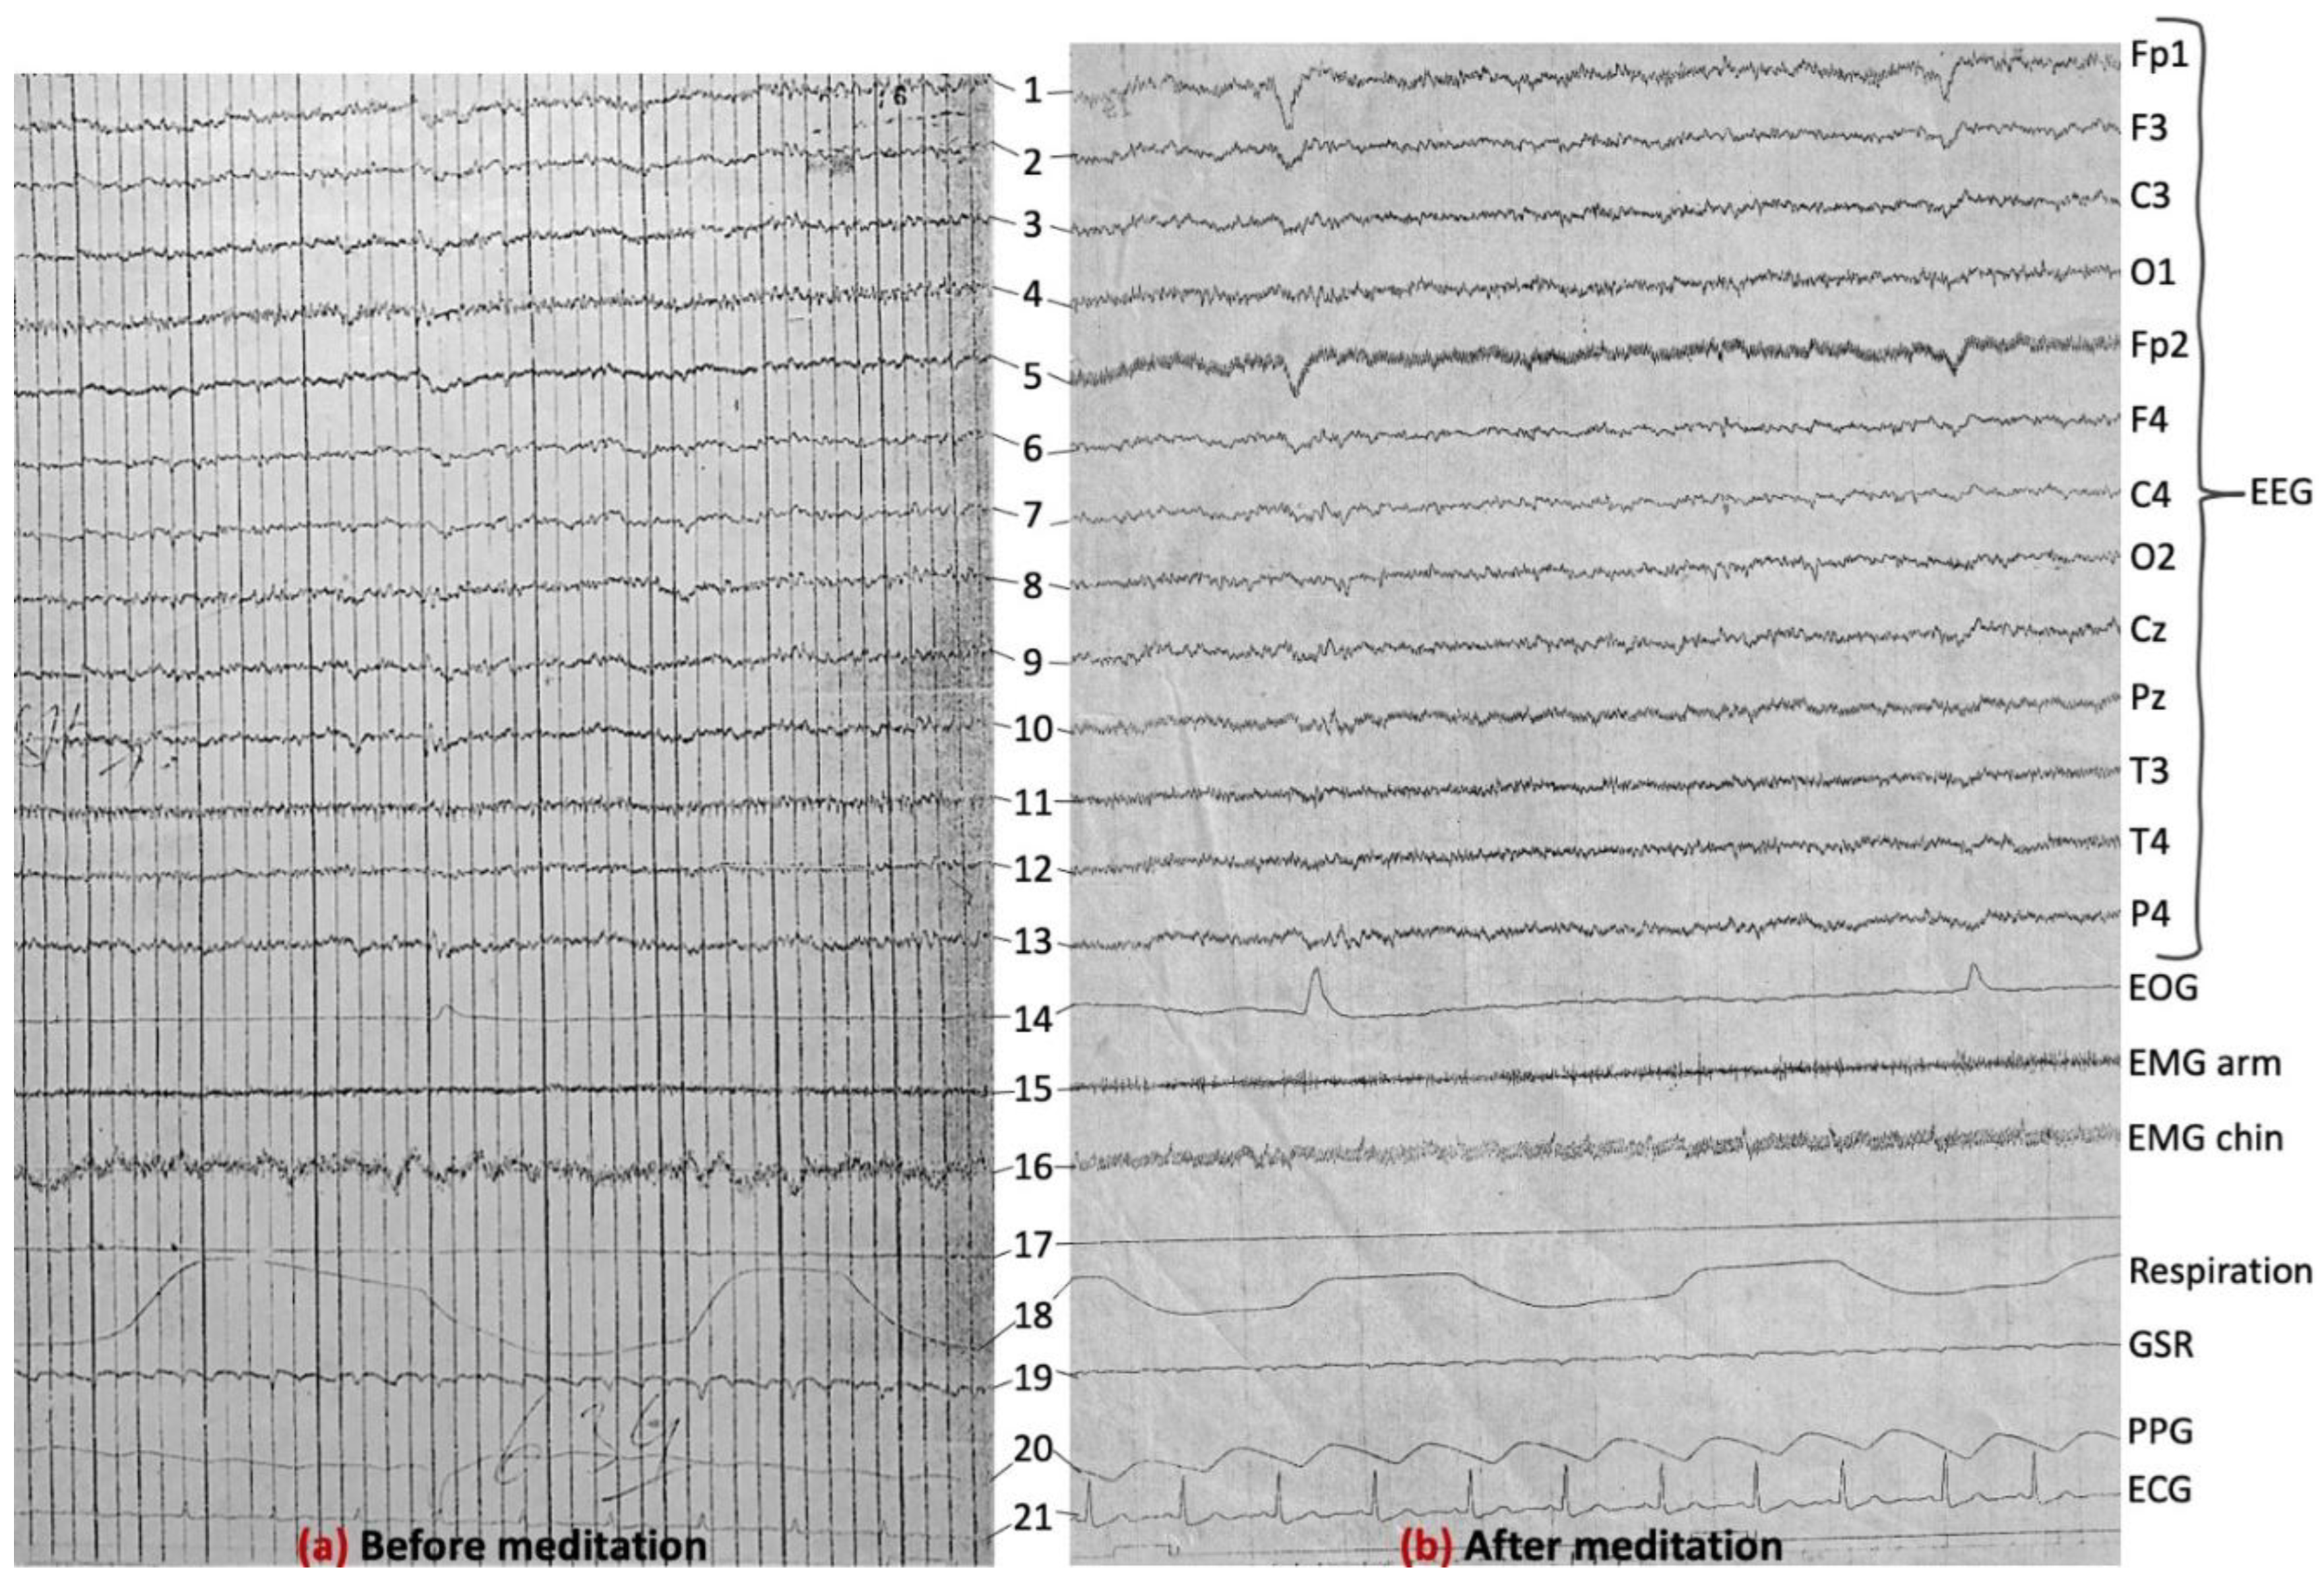
Figure 11.
Compressed spectral array (CSA) plot of the EEG signal from the left frontal pole channel (Fp1). Frequency (0 to 32 Hz) is on the x-axis, and time (from 6:33 pm to 7:06 pm) is on the y-axis, although time is not continuous with different figures from certain epochs of time being stitched together. Relevant events are marked on the y-axis. Epochs of deeper meditation were associated with higher beta activity. The meditation segments in between saw higher alpha activity. During one epoch, around 6:56 pm, the eyes were open, but EEG beta activity as well as naaDi observations by G.R.G. indicated a state of deep meditation. Also, after meditation with eyes open, high alpha activity similar to relaxed or intermediate meditative states was seen. The upper cut-off frequency was 32 Hz (instead of 35 Hz) to facilitate fast Fourier transform computations easily as a multiple of 2 without zero padding.
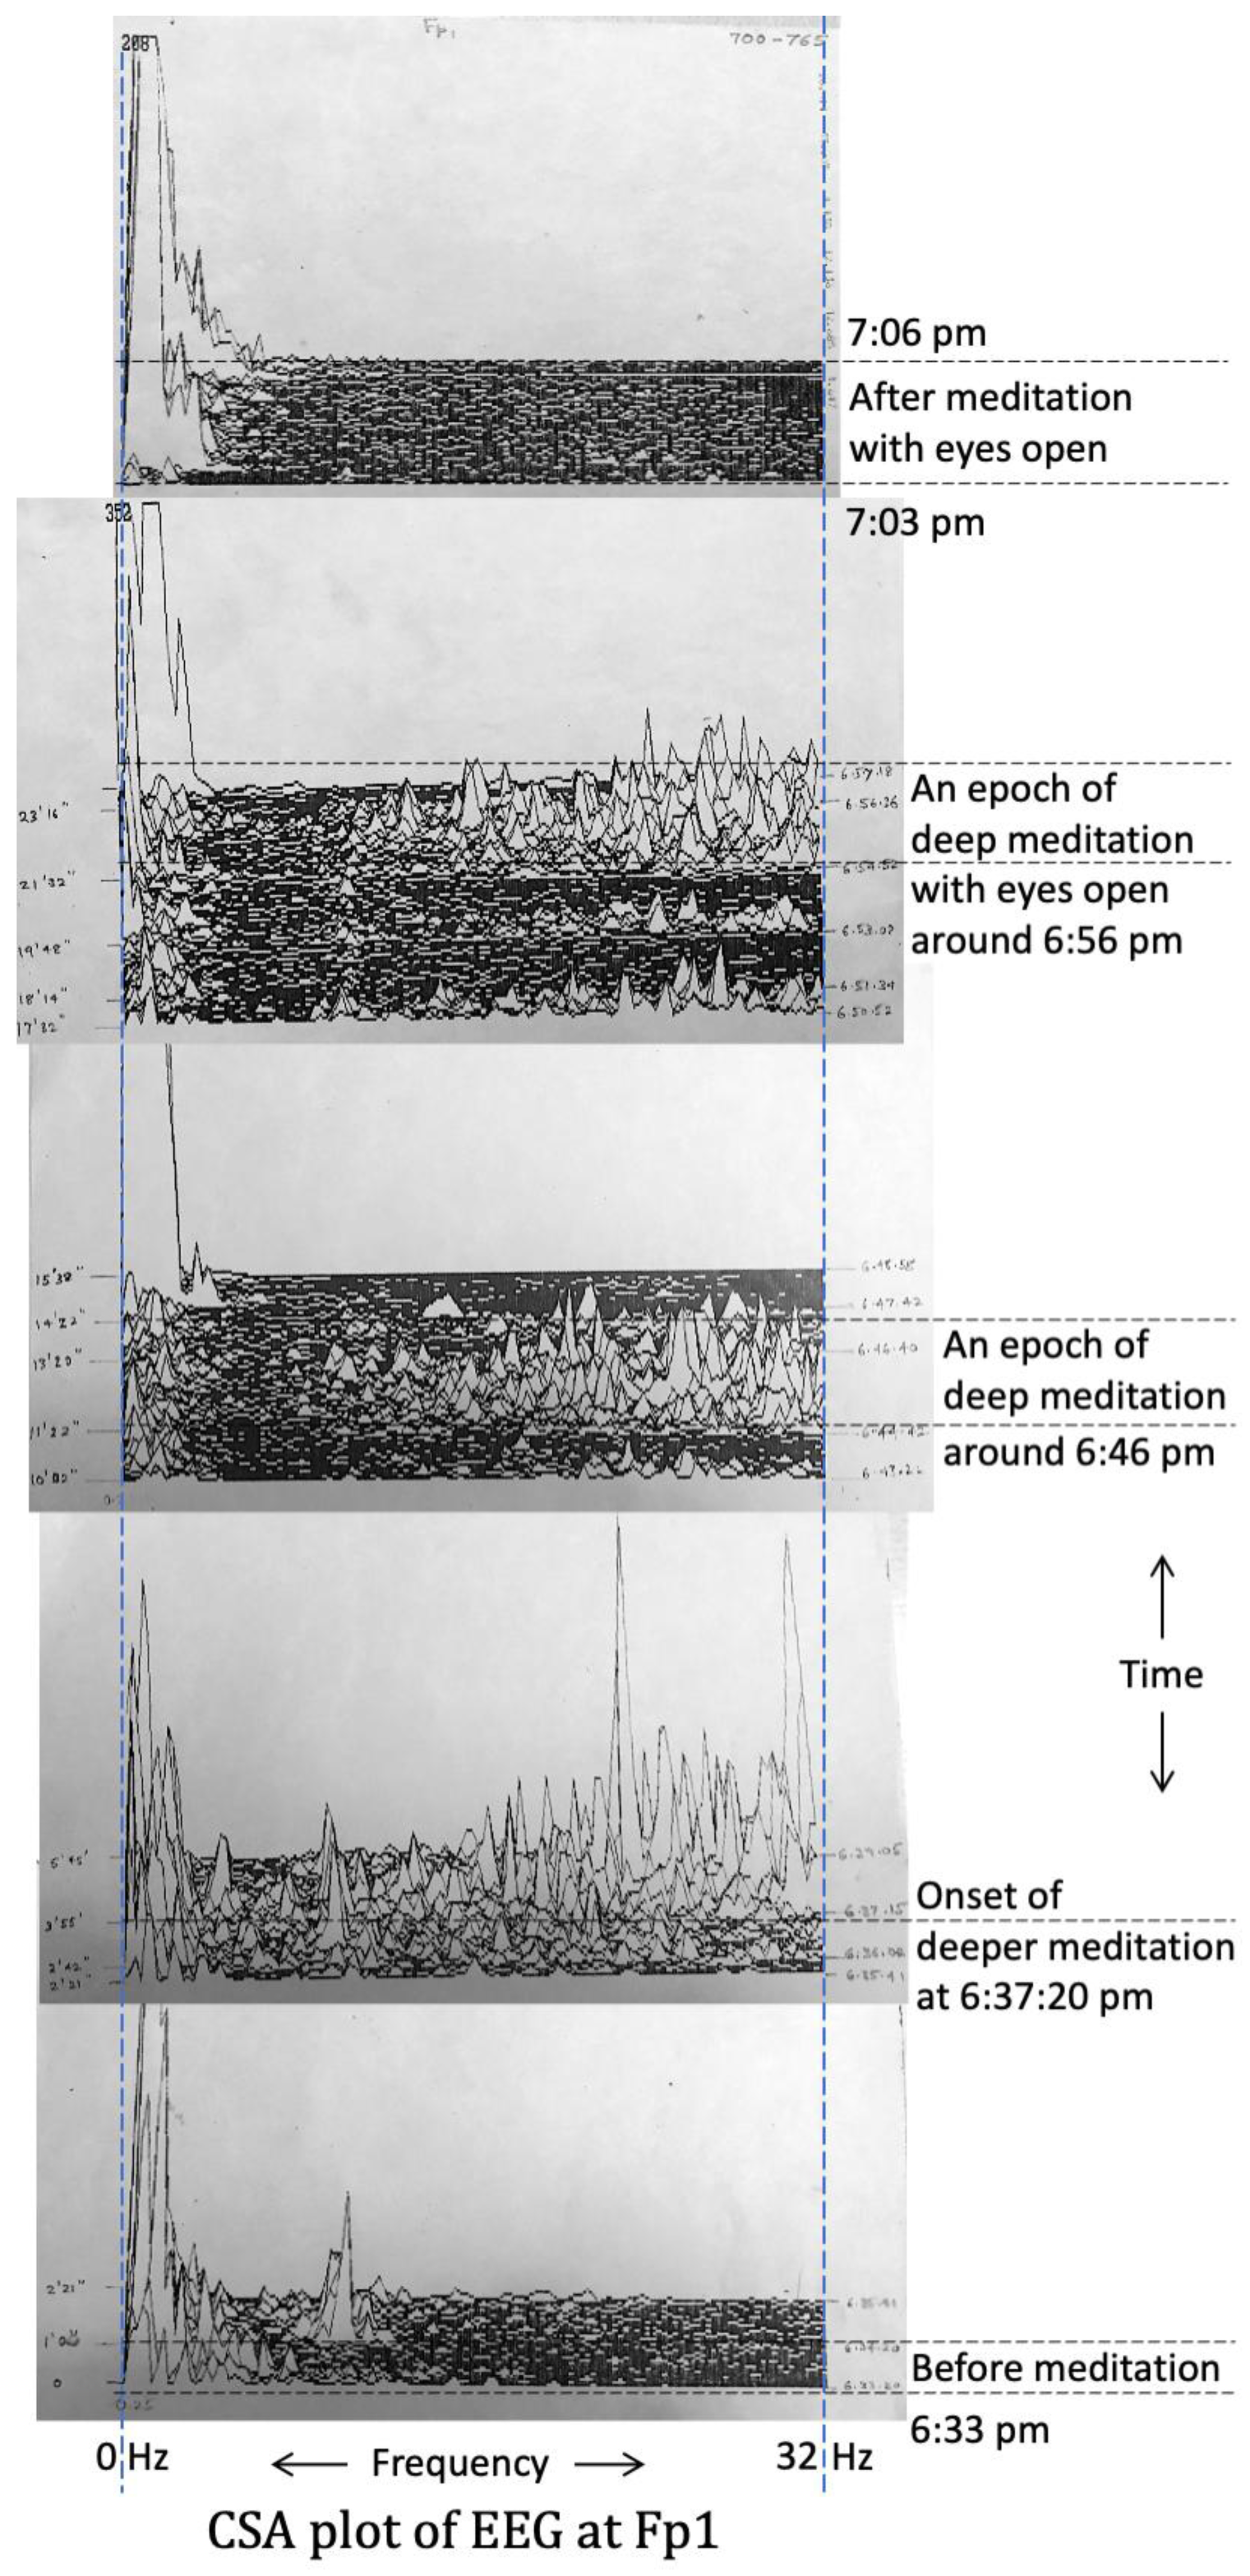
Figure 12.
CSA plot of the EEG signal from the left occipital lobe channel (O1). Frequency (0 to 32 Hz) is on the x-axis, and time (from 6:33 pm to 7:06 pm) is on the y-axis. Different figures from certain epochs of time are stitched together, and relevant events are marked on the y-axis, as in Figure 11. Epochs of deeper meditation were associated with higher alpha as well as beta activity. The meditation segments in between saw higher alpha activity only. During one epoch, around 6:56 pm, the eyes were open, but EEG alpha and beta activity as well as naaDi observations by G.R.G. indicated a state of deep meditation. Also, after meditation with eyes open, high alpha activity similar to relaxed or intermediate meditative states was seen.
3.6. Further Discussion and Scope for Future Work
The results from these experiments provide preliminary evidence for physiological signatures of high Yogic meditative states with altered consciousness that can be experienced by humans, which is distinct from typical states seen in adults (awake, dreaming, sleeping). There is no evidence for the existence of the patterns we observed in breathing, EMG, GSR and EEG, taken together, during the awake/dream/sleep stages in adults. We thus believe that there is sufficient premise to conduct further investigations in this direction to better understand the bodily and neural correlates of altered states of consciousness such as Samaadhi. Such investigations, however, are contingent upon the availability of a participant capable of attaining such states, at will, and is willing to participate. It is our earnest hope that findings from this and subsequent studies will enhance our understanding of the mechanistic underpinnings of Yogic meditation and Samaadhi within the modern scientific framework. That will also provide a platform for people to contemplate upon, understand, and appreciate the Yogic tradition preserved across millennia by saints and Yogis of ancient India.
The general perception among many traditional practitioners of Yoga typically is that it is not possible to record Yogic experiences of the "inner world" on an external plane using instruments. For example, the argument is that the visions and bliss experienced by a Yogi are subjective experiences, and it may not be possible to measure all of them objectively. However, we are of the view that subjective experiences are facilitated by biological mechanisms of the human body, and thus, those experiences leave their imprints on the body, and measuring these effects using instruments is possible. This is precisely why we claim to capture “physiological correlates” of meditative experiences and not the experiences themselves. By analyzing the recorded signals, either visually or using computers, it is possible to infer (to some extent) what is happening to the body during such Yogic meditative states. Therefore, without arguing about the existence or non-existence of this “inner world”, we believe that it is possible to independently measure the effects of “Yogic experiences” on the body using instruments. This is because the body facilitates these experiences, and bodily signals can be measured irrespective of the causes/sources driving those signal variations. The availability of modern sophisticated instruments is helping it. The fact that Sriranga Mahaguru had planned for research along similar lines encouraged us to proceed in this direction.
Such investigations are of great value for the following reasons: (1) It will help us verify whether the states experienced by a Yogi are real and well-defined, both physiologically and subjectively. (2) It will help us in investigating whether the state attained by meditation is different from other altered states of consciousness (waking, dreaming, and sleeping states). (3) Physiological correlates of states induced by mental relaxation or hypnosis or delusion may also be compared with the meditative states to look for any differences between them. Any definite and positive variation will address criticisms that Yogic experiences could be hypnotism or brainwashing. (4) It has been previously observed that certain persons possess the ability to control their involuntary functions (such as significantly lowering the heart rate); sometimes one might claim that itself to be the Samaadhi state. However, it is known that the state of Samaadhi is not just about controlling involuntary functions, even though cardiac activity, respiration, etc., may change considerably during meditation as a consequence of attaining Samaadhi. Samaadhi is an altered state of consciousness with distinct neurophysiological signatures where the person experiences pure bliss. Hence, this area of research may be used to answer such questions in due course of time with continued effort.It must be acknowledged that our instrumentation was rudimentary compared to today’s standards. But that does not invalidate our results. All non-invasive modalities (even today) are merely a low-dimensional noisy representation of the ground truth, and the inferences are generally correlational in nature [66]. Hence, the advantage of repeating a similar experiment with today’s EEG technology would be to get precision in the coarser measurements done in the 1980s. However, it is noteworthy that coarser measurements obtained from older technology are not false; they are just a less detailed representation of reality. Therefore, while we acknowledge that there is scope for future work (described below), we see much value in reporting the results from this study done in the 1980s. We presented preliminary results from a different participant during meditation at a conference in 1995 [67].
With today’s technological advancements, we can understand brain and spinal cord function like never before. Higher resolution and less noisy high-density 128-channel EEG is now available [68]. EEG source localization and signal processing tools have also advanced. Other technologies, such as fMRI, have emerged over the past three decades, which hold great potential in studying brain and spinal cord function during Samaadhi, because of high spatial resolution and specificity, as well as high sensitivity to neural activity [69]. It is also possible to measure changes in neurochemicals (using magnetic resonance spectroscopy [70]), metabolic rate (using positron emission tomography [56]), and cerebral blood flow (using perfusion MRI [71]) during Samaadhi. Structural changes in the brain’s white-matter connections arising from long-term Yogic meditation can be measured using diffusion MRI [72], as in Tang et al. [73]. Likewise, changes in gray-matter thickness can be measured using anatomical MRI [74], as in Lazar et al. [75]. A complementary technique to EEG, magnetoencephalography can measure cerebral neural activity at higher spatial resolution [76]. Studying Samaadhi using multiple modalities will help us develop a comprehensive mechanistic model of the neural correlates of Samaadhi. Yoga and meditation were considered baseless practices by many just a few decades ago, but today there is strong evidence for their underlying mechanisms and efficacy [77,78,79,80,81,82,83,84,85,86,87,88,89,90,91,92,93]. Research on Samaadhi can take inspiration from that.
Innovation is also possible by studying factors that favorably or adversely affect the state of Samaadhi. If the neural signatures of Samaadhi are well understood, then the perturbation caused by extraneous factors on that state can also be investigated. For example, it is possible to investigate the effect on the quality of the Samaadhi state (and one’s ability to reach that state) upon consuming certain foods, touching certain materials, listening to certain music or sounds, seeing certain colors, and leading certain lifestyles. There is literary and historical evidence that these factors contributed to several lifestyle prescriptions and cultural practices in ancient India brought about by ancient saints who experienced high Yogic states, and its residues are prevalent in India even today [94,95,96,97,98,99]. In fact, as recently as a few decades ago, Sriranga Mahaguru experimentally demonstrated these aspects on multiple instances as per historical records and individual accounts [25,26,35]. He first built a framework of naaDi patterns associated with deep meditative states and Samaadhi, and then used it as a template to study how various extraneous and lifestyle factors influenced these patterns. This way, if a person decided to lead a life with the goal of experiencing higher Yogic states such as Samaadhi, then they could tailor their lifestyle accordingly using the naaDi findings. He provided naaDi-based evidence that the consumption of certain foods (e.g., satvik foods), usage of certain materials (e.g., gold, turmeric, darbha grass), listening to certain sounds/music (e.g., Om), seeing certain visuals (e.g., saffron color), and leading a certain type of lifestyle are all conducive to attaining and sustaining the state of Samaadhi. He suggested that this is the bedrock of the ‘Indian way of life’ as prescribed in ancient texts. This is supported by the fact that attaining Samaadhi is presented as the ultimate goal of life across several diverse cultures within the Indian subcontinent even today [5,93,100,101]. Hence, if Samaadhi is indeed attainable, and if it is an ultimate state of peace and happiness that is worth attaining, then research in this direction can have a substantial impact on the global society, and can positively contribute to human lives across the board.
The primary drawback of this study is the lack of rigorous quantitative analyses, which we have already acknowledged before. The presented analyses were conducted 30 years ago, and several additional analyses (including with the latest tools) are scope for future work. Our upper cut-off frequency was 35 Hz; hence we missed the entire gamma frequency band (up to 80 Hz [102]). It is possible that important markers of Samaadhi in the gamma band were entirely missed by us. A few other suggestions for future work are listed next. (a) Measuring heartbeat sounds using a phonocardiogram [103] could further quantify the reduction in heartbeat amplitude during Samaadhi. (b) Recording respiration independently from both nostrils could give more information than single-nostril breathing recording (see, for example [104,105,106]). (c) Other physiological signals, such as body temperature (which could correlate with the metabolic rate [107]), skin conductance response and continuous blood pressure can be recorded. (d) EMG could be measured from multiple locations across the body to test if muscle contractions are consistent.
4. Conclusions
In this study, we investigated multi-channel electrophysiological data acquired from a Yogi par excellence before, during and after Yogic meditation in two separate experiments (1985, 1988). The respiration data revealed typical breathing pre-meditation, deep breaths at the onset of meditation, and extremely low breathing amplitudes during meditation, indicative of reduced metabolism and considerably lower oxygen demand from the body during meditation (viewed as the Samaadhi state). EMG data revealed relaxed forearm muscles before meditation, and stiffening of the muscles during meditation that was maintained during the entire course of the meditation period. GSR data pointed to a calm and relaxed state during meditation. ECG was generally indistinct during meditation, but heartbeat and pulse were of significantly lower amplitude during meditation, which corroborated with respiration observations. Meditation did not seem to intervene with cardiac electrical activity, but noticeably reduced cardiac mechanical activity. With EEG, distinct slow waves and beta waves were observed in frontal electrodes, in conjunction with alpha and beta waves in posterior electrodes, a combination rarely (or perhaps never) seen in awake, dreaming or sleeping states, indicating a state of simultaneous high arousal and relaxation. Also, 30 Hz beta waves were noticed (at the top end of our frequency pass band), indicating bursts of very high frequency activity during meditation. Overall, these combinations of characteristic multimodal markers are not typical of any common states of consciousness (awake, dreaming or sleeping). In fact, the patterns we observed were paradoxical, indicating the coexistence of low metabolic activity (nearly zero breathing and pulse amplitudes) and calmness (low GSR) with muscle stiffness (high EMG), as well as the coexistence of mental relaxation (EEG alpha activity, even with eyes open) with mental arousal (EEG beta activity). Corroborating these electrophysiological findings with naaDi measurements and the experience of the meditation narrated by the participant, the evidence supports the attainment of an unusual state of consciousness during the meditation phase of the experiments, which is described in ancient Vedic literature as the state of Samaadhi. Further investigation of such states with the latest technologies and tools available to us today will help us better understand these phenomena.
Author Contributions
D.N.D.: Conceptualization, Project Administration, Resources, Data Acquisition, Data Analysis, Methodology, Software, Investigation/Interpretation, Visualization, Writing – Original Draft, Reviewing/Editing. G.R.G.: Project Administration, Resources, Data Acquisition, Investigation/Interpretation, Writing – Reviewing/Editing. C.R.R.: Project Administration, Resources, Data Acquisition, Investigation/Interpretation, Writing – Reviewing/Editing. D.R.: Investigation/Interpretation, Writing – Original Draft, Reviewing/Editing. G.D.: Investigation/Interpretation, Writing – Original Draft, Reviewing/Editing. N.P.: Data Analysis, Methodology, Software.
Acknowledgments
Our foremost gratitude is towards Sri Sriranga Mahaguru and Smt. Vijayalakshmi Srimataji. They were the architects of this evidence-based research. Sriranga Mahaguru (1913–1969) initiated the idea that meditative states such as Samaadhi can be measured and investigated objectively (either using naaDi or with modern instruments). He conducted experiments (two of which from 1955 and 1962 were well-documented) even before the first evidence-based study on Yogic meditation was published in any journal. We merely adopted his original ideas, which were way ahead of his times. He led by example by experimenting and demonstrating with the tools and expertise available at his time; we merely used newer technologies to replicate the same. In essence, he has the most significant intellectual contribution to this work. Srimataji carried this spirit forward and provided us with the necessary encouragement and nourishment, which were essential for this research. She enthusiastically participated and permitted us to examine her meditative states without hesitation. The bottom line of this research was the availability of an ultra-rare individual capable of attaining the state of Samaadhi at will, enabling us to measure the electrophysiological correlates of Samaadhi during the experiment. This was made possible by Srimataji, and we owe immense gratitude to her for the same. We thank Ashtanga Yoga Vijnana Mandiram (AYVM), Karnataka, India (an organization founded by Sriranga Mahaguru in 1947) for maintaining the ideas of Sriranga Mahaguru and educating about the same, which contributed positively to this study even more than 15 years after his time. AYVM also provided certain organizational support to this research. We thank Dr. H.P. Eshwara for the consultation session that helped in the clinical interpretation of paper EEG records from experiment-1. We are grateful to NIMHANS, Bangalore, India, for the facilities and support to conduct this research on their premises; experiment-1 was conducted in Dr. M. Gourie-Devi’s lab while experiment-2 was conducted in Dr. Somnath Chatterjee’s lab. We thank Prof. I.S.N. Murthy from Indian Institute of Science, Bangalore, India for providing the instrumentation tape recorder. We are also thankful to several individuals who volunteered to help during the experiments. Vidwan Sri Chayapati provided verbal description of Srimataji during meditation during experiment-1, while Smt. Prabhamani provided the same during experiment-2. Sri K. Dattatreya performed videography during both experiments. During experiment-2, Smt. D. Katyayini read out counter numbers, which were recorded onto the audio tape. Several volunteers of AYVM helped with various tasks such as managing the audio tape recorder and taking photographs. Two technicians at NIMHANS provided expert help with data acquisition. We thank Smt. K.P. Chinmayi for typing handwritten manuscript drafts on a computer in 2022.
Conflicts of Interest
The authors report no competing financial interests related to the contents of this manuscript.
Appendix A
Appendix A.1. Historical Context
Sri Sriranga Mahaguru (1913–1969) was a Yogi par excellence and a scientist in spirit (Sanskrit: Jnaani and Vijnaani) as per historical records and individual accounts [25,26]. He guided a handful of people in attaining Samaadhi through Yogic meditative practices. In a personal capacity, he had also gained expertise in making scientific investigations (through hypotheses-experiments-observations-inferences) of Samaadhi as well as on various lifestyle factors that favorably or unfavorably contributed to attaining it [96]. He had recognized the importance of the scientific investigation of bodily and mental states during meditation/Samaadhi. He asserted that the science of Yoga and the Vedic way of life (also called Sanatana Dharma) had evolved in India over several millennia because of the sustained efforts of many saints of the past (rishis) who built an ecosystem of scientific inquiry and conducted scientific investigations using subjective tools such as naaDi. With this spirit, Sriranga Mahaguru had conducted several experiments using naaDi and using facilities available to him at Hedathale, Mysore district, Karnataka, India (his experiments in 1955 and 1962 were well documented) [6,25,26]. He had also expressed his desire to utilize modern instruments and technologies to demonstrate to the modern mind, the true nature of various meditative states - in particular, the state of Samaadhi. He founded an organization, Ashtanga Yoga Vijnana Mandiram (AYVM), with one of its aims being to achieve the above objectives.
We briefly describe the motivation under which our experiments were designed in the first place, which also served as a precursor to our premise and experimental paradigm. Specifically, Sriranga Mahaguru’s scientific approach to studying Samaadhi and his experiments made a contribution to our study; hence we touch upon those aspects here. He had made several experimental observations on Samaadhi, with a couple of well-documented experiments held on 28 December 1955 [25,26] and 9 May 1962 [6]. Before conducting his experiment on Srimataji in 1962, he highlighted a few salient points on Samaadhi as follows. During the highly exalted state of Samaadhi, the body will be stiff like wood and become gradually cold with no perception of sound, touch, taste, smell, or sight (either with eyes closed or open). In a sense, the body state observed in this strange Rajayoga condition cannot be called the condition of being alive since many bodily markers are similar to impending death (at the border of life and death). It cannot be called a condition of death either since the person comes out of that condition and lives thereafter. It is neither an awake state nor a sleep state. Hence, it is a strange condition (vichitra in Sanskrit). He reiterated that one does not need to accept these things merely because they are written in ancient texts or are claimed by certain individuals, but that one can observe bodily markers before, during and after Samaadhi measured experimentally and conclude for oneself.
During the 1955 experiment [25,26], Sriranga Mahaguru provided an experimental demonstration of Samaadhi using Srimataji as an illustrative subject, in the presence of Dr. G.R. Ganesh Rao (G.R.G.), an Ayurvedic physician and a contributor to this study. Objective measures were derived from naaDi. Sriranga Mahaguru had developed expertise in naaDi to observe the real-time bodily states of an individual. He asked G.R.G. to observe Srimataji’s naaDi before, during and after meditation. After the onset of meditation, he said that a Yogi cannot consistently sustain the Samaadhi state, and will go through cycles of meditative states, attaining the Samaadhi state several times in the process (as can be ascertained by naaDi measurements). Under Sriranga Mahaguru’s supervision, G.R.G. made a few observations as follows. (i) Srimataji’s body had become colder (<94° Fahrenheit) during Samaadhi but was normal before and after meditation. (ii) NaaDi, wrist pulse (at the radial artery) and heartbeat (using a stethoscope) were perceptible before/after but not during meditation as they had become very subtle. The heart rate was about 70 beats per minute before/after meditation. (iii) The respiratory rate was 14 cycles per minute before/after meditation with the air entry sound audible through a stethoscope. Respiration was not perceptible during meditation, and the air entry sound was inaudible. (iv) A deep dimple mark was present in the throat during meditation only. (iv) Srimataji’s limbs were normal and easy to bend before/after meditation, but they had become stiff like a log of wood during meditation.
The 1962 experiment [6] was conducted similarly in the presence of several attendees and identical observations were made. Upon Srimataji’s body becoming cold and limbs becoming stiff like wood during Samaadhi, Sriranga Mahaguru asked others to try moving her hands or separating the thumb and index fingers (chinmudra) that were held together. None were able to do it, and he said metaphorically that even if one were to bring an elephant and try to pull, one could hardly lift the hands. Subsequently, Srimataji entered a meditative state with eyes open and gaze fixed, but with no apparent external sight (called the Shambhavi or Vaishnavi mudra). Sriranga Mahaguru moved his fingers very close to the eyes of Srimataji and asked people to observe the absence of typically involuntary eyelid movements, indicating a lack of vision. He finally remarked that, for example, a model globe helps us study geography, but the earth does not get broken if the model globe breaks; likewise, the truths about Samaadhi are never lost even if ancient texts and written scriptures are forgotten, as the evidence for Samaadhi is established primarily by people who can attain that state and the objective measurements made on them.
Although biomedical technologies were in their infancy at his time, Sriranga Mahaguru was a proponent of using modern technologies, instruments, and tools to investigate the human body during such Yogic states, as well as to study the lifestyle factors that favorably or adversely affect such Yogic pursuits. In our study, we took a cue from his experiments like these and conducted a preliminary investigation of the electrophysiological correlates of Yogic meditation in Srimataji. It is noteworthy that Sriranga Mahaguru had explicitly stated that Srimataji had attained the state of Samaadhi during the experiments he conducted on 28 December 1955 [25,26] and 9 May 1962 [6]. Srimataji was a Yogi par excellence with about five decades of experience (at the time of our experiments) in attaining and sustaining the Samaadhi state at will [24,25]. Her ability to attain Samaadhi at any time out of her own volition was critical since we required her to attain Samaadhi during the short span of our controlled experiment. During our electrophysiological experiments, G.R.G (who had also participated in the experiment conducted by Sriranga Mahaguru in 1955) measured Srimataji’s naaDi and other physiological parameters during meditation and inferred based on his expertise that Srimataji had attained the state of Samaadhi.
Apart from Sriranga Mahaguru’s experiments and demonstrations, his views on modern science also contributed to our scientific investigation significantly; hence, we brief it here [6,25,108]. At a time when traditionalists and scientists generally disagreed with each other, he argued for bridging the two. This study is the descendent of the same thought process. He argued that there is a need to utilize the well-developed modern technologies, and present ancient Indian knowledge in a modern framework to benefit current and future generations. For that, it is necessary to accurately understand the ancient knowledge developed by the saints of India, and design experiments using modern tools with the correct perspective without going against their overarching framework. He said that modern discoveries must not be rejected, but rather integrated into the understanding we derive from ancient discoveries. Both ancient and modern knowledge must be viewed unbiasedly, and only the truth must be accepted. He supported examining ancient literature to check the facts and build upon it to suit experimental observations. He said that ancient knowledge was brought out as a tradition through rigorous study and practice, but what remains now is scanty after being diluted through generations. Yet, if humanity could investigate these topics in a fresh light with proper attention, then it is possible to build it up in due course of time for the benefit of all humans globally. We incorporated his ideas and initiated this study as a step in this direction.
Appendix A.2. Details of the Signals Recorded
Electrocardiogram (ECG): ECG measures the heart’s electrical activity [27]. An electrocardiograph is an instrument sensitive to small electrical currents emitted by the heart. ECG voltages are generally of the order of millivolts, and are amplified during data acquisition. Importantly, ECG only records the electrical activity and not the mechanical movements taking place in the heart (please refer to [27] for further details on ECG). Cardiac electrical phenomena are exceedingly complex, and hence the non-invasive recordings made on the body surface (even if precise) can, at best, provide only a lower dimensional estimate of cardiac electrical properties.
Electromyogram (EMG): Voluntary skeletal muscle contractions also result in measurable electrical activity (recorded as EMG) [28]. Multiple motor units in each muscle proportionately activate according to the strength of muscular contractions. Fewer motor units activate for weak contractions, while more motor units fire at faster frequencies for stronger contractions, leading to higher EMG voltages on the body surface. Polygraphy records the contraction of entire muscles; hence, only two electrodes were placed (positive and ground) for acquiring one channel EMG signal. Relatively higher EMG frequency and amplitude occur when muscles contract. EOG is a variant of EMG with electrodes placed close to the eyes for measuring eye movements assessed based on the corneo-retinal standing potential [29].
Respiration: Several transducers are available for measuring respiration. Our method was based on a thermistor (a temperature-sensitive resistor) [30] placed near the nostrils, wherein its resistance varied as hot air blew through it during expiration, and relatively colder air passed it during inspiration. When placed in one arm of a Wheatstone bridge, the thermistor sensed variations in electrical resistance in the balancing arm of the bridge.
Electroencephalogram (EEG): Neurons are the basic functional units of the central nervous system (CNS). Neuronal currents drive brain and spinal cord activity. Rhythmical voltage changes originate in the neurons and are measurable with electrodes either non-invasively on the scalp or invasively from the cerebral cortex. When measured on the scalp as EEG [102], individual neuronal signals are summated, as millions of them discharge synchronously. Although EEG data acquisition principles share similarities with ECG, the ECG physiological mechanisms are different and relatively well understood, whereas mechanisms generating EEG waveforms are significantly more complex and harder to understand [102]. As such, EEG signals can be interpreted generally on a purely empirical basis. The peak-to-peak EEG amplitude is typically <100 microvolts, while that on the exposed brain is 10 to 20 times greater. The frequency content ranges from <1 Hz to about 80 Hz [102]. It depends on the underlying neuronal processes, including the level of attention, wakefulness and sleep. There is also considerable inter-individual variability arising from biological differences.
EEG activity varies both in frequency and amplitude under different circumstances, for example, in certain healthy mental states (different levels of consciousness [109]) and pathological conditions, such as epilepsy [110]. Under normal conditions, there is generally an inverse relationship between amplitude and frequency; if the frequency increases, the amplitude usually decreases [102]. Different names have been assigned to different EEG wave types depending on the frequency range. We briefly describe each of these EEG frequency bands next [31,32].
Alpha waves (8–13 Hz) typically appear over the occipital lobes in the awake, mentally relaxed state with closed eyes, and disappear when the eyes are open. Beta waves (13–30 Hz) often appear over the parietal and frontal lobes. Under normal conditions, the amplitude of beta waves is lower, only rarely exceeding 20 microvolts. Theta waves (4–8 Hz) appear in adults during light sleep and in children. Delta waves contain all EEG activity below 4 Hz. They appear in adults during deep sleep, in premature babies and in infants. Theta and delta waves are generally inconspicuous in healthy alert adults. Gamma waves (30–80 Hz) occur during intense cognitive processing. Pathological waveforms (e.g., spikes) occur during epileptic attacks. Subcortical processes affecting levels of consciousness also affect the shape of EEG waves by modulating the synchronization of cortical neurons. For instance, drowsiness, sleep and levels of consciousness cause certain characteristic changes in EEG.
There are several standards for EEG electrode placement on the scalp. One frequently-used standard is the International 10-20 electrode placement system [111], so named because the positions of the electrodes are based on intervals of 10% or 20% of the distance between specified points on the scalp. Electrode locations and naming have been standardized by the American Electroencephalographic Society; please refer to figures 1 to 6 in [112] and figure 2 in [113] for illustrations of the 10-20 system. To obtain good electrical contact in the case of wet electrodes (used by us), an electrolyte paste was applied between the electrode and the cleaned scalp.
Like ECG, EEG can be recorded with either bipolar or unipolar (monopolar) configurations [102]. In the bipolar configuration, the difference in voltage between two scalp electrodes is measured, whereas in the unipolar configuration, the voltage of each electrode is measured with respect to an indifferent (or ground) electrode (generally on the chin, ear or back of the neck), but with slight interference from adjacent muscles and ECG also being recorded as noise. The voltage measured on the scalp from a specific cortical center of activity decreases roughly with the square of the distance between the two. Therefore, the EEG signal essentially represents cortical activity from within the vicinity of the electrodes, and also not directly from deeper parts of the brain [102].
References
- S. H. Aranya, Introduction: Yoga Philosophy of Patanjali with Bhasvati, Calcutta, India: University of Calcutta, 2000, pp. xxiii-xxiv.
- J. Mallinson and M. Singleton, Roots of Yoga, London, UK: Penguin Books, 2017.
- R. E. Hume, The Thirteen Principal Upanishads, Oxford, UK: Oxford University Press, 1921. [CrossRef]
- F. Tola, C. Dragonetti and K. D. Prithipaul, The Yogasūtras of Patañjali on concentration of mind, Delhi, India: Motilal Banarsidass, 1987.
- S. V. Bharati, Yoga Sutras of Patanjali: With the Exposition of Vyasa, Delhi, India: Motilal Banarsidas, 2001.
- S. Mahaguru, Amaravani - A compilation of the lectures of Sriranga Mahaguru on Ayurveda-Yoga-NadiShastra: Volume 6 (in Kannada language), Mysore, India: Ashtanga Yoga Vijnana Mandiram, 1988.
- M. Washburn, The Ego and the Dynamic Ground: A Transpersonal Theory of Human Development, Albany, NY, USA: State University of New York Press, 1988.
- G. Maehle, Ashtanga Yoga: Practice and Philosophy, Novato, CA, USA: New World Library, 2007.
- S. D. Goswami, Readings in Vedic Literature: The Tradition Speaks for Itself, Mumbai, India: Bhaktivedanta Book Trust, 1976.
- P. Yogananda, Autobiography of a Yogi, Los Angeles, CA, USA: Self-Realization Fellowship, 1946.
- S. Vivekananda, Complete Works of Swami Vivekananda, Hollywood, CA, USA: Vedanta Press, 1922.
- S. Rama, Living with the Himalayan Masters, Honesdale, PA, USA: Himalayan Institute Press, 1978.
- Sivarupa, Yogis of India: Timeless Stories of Their Lives and Wisdom, Delhi, India: Wisdom Tree Publishers, 2012.
- B. Ramamurthi, "The fourth state of consciousness: the Thuriya Avastha.," Psychiatry and clinical neurosciences, vol. 49, no. 2, p. 107–110, 1995. [CrossRef]
- B. K. Anand, G. S. Chhina and B. Singh, "Studies on Shri Ramanand Yogi during his stay in an air-tight box.," The Indian journal of medical research, vol. 49, p. 1, 1961.
- M. A. Wenger and B. K. Bagchi, "Studies of autonomic functions in practitioners of Yoga in India.," Behavioral science, vol. 6, p. 312–323, 1961. [CrossRef]
- M. A. Wenger, B. K. Bagchi and B. K. Anand, "Experiments in India on "voluntary" control of the heart and pulse.," Circulation, vol. 24, p. 1319–1325, 1961. [CrossRef]
- L. K. Kothari, A. Bardia and O. P. Gupta, "The yogic claim of voluntary control over the heart beat: an unusual demonstration.," American heart journal, vol. 86, no. 2, p. 282–284, 1973. [CrossRef]
- P. Arambula, E. Peper, M. Kawakami and K. H. Gibney, "The physiological correlates of Kundalini Yoga meditation: a study of a yoga master.," Applied psychophysiology and biofeedback, vol. 26, no. 2, p. 147–153, 2001. [CrossRef]
- D. S. Shannahoff-Khalsa, B. B. Sramek, M. B. Kennel and S. W. Jamieson, "Hemodynamic observations on a yogic breathing technique claimed to help eliminate and prevent heart attacks: a pilot study.," Journal of alternative and complementary medicine, vol. 10, no. 5, p. 757–766, 2004.
- R. Kakigi, H. Nakata, K. Inui, N. Hiroe, O. Nagata, M. Honda, S. Tanaka, N. Sadato and M. Kawakami, "Intracerebral pain processing in a Yoga Master who claims not to feel pain during meditation.," European journal of pain, vol. 9, no. 5, p. 581–589, 2005. [CrossRef]
- D. T. Lott, T. Yeshi, N. Norchung, S. Dolma, N. Tsering, N. Jinpa, T. Woser, K. Dorjee, T. Desel, D. Fitch, .. ... and R. J. Davidson, "No Detectable Electroencephalographic Activity After Clinical Declaration of Death Among Tibetan Buddhist Meditators in Apparent Tukdam, a Putative Postmortem Meditation State.," Frontiers in psychology, vol. 11, p. 599190, 2021.
- B. K. Anand, G. S. Chhina and B. Singh, "Some aspects of electroencephalographic studies in Yogis," Electroencephalography and Clinical Neurophysiology, vol. 13, no. 3, pp. 452-456, 1961. [CrossRef]
- S. Jois, The light that lit up for a hundred years: A brief depiction of the divine personality of Sri Vijayalakshmi Srimataji (original published in Kannada language: Nooru Samvatsara Belagida Nandadeepa), Mysore, India: Ashtanga Yoga Vijnana Mandiram, 2019.
- S. V. Chamu, Sri Ranga Mahaguru (in Kannada language), Mysore, India: Ashtanga Yoga Vijnana Mandiram, 1972.
- S. V. Chamu, Sri Ranga Sadguru: A short Biography of a Yogi, Mysore, India: Ashtanga Yoga Vijnana Mandiram, 1992.
- J. K. Cooper, "Electrocardiography 100 years ago. Origins, pioneers, and contributors.," The New England journal of medicine, vol. 315, no. 7, p. 461–464, 1986.
- M. B. Raez, M. S. Hussain and F. Mohd-Yasin, "Techniques of EMG signal analysis: detection, processing, classification and applications.," Biological procedures online, vol. 8, p. 11–35, 2006.
- M. Brown, M. Marmor, Vaegan, E. Zrenner, M. Brigell, M. Bach and ISCEV, "ISCEV Standard for Clinical Electro-oculography (EOG) 2006.," Documenta ophthalmologica. Advances in ophthalmology, vol. 113, no. 3, p. 205–212, 2006. [CrossRef]
- E. Jovanov, D. Raskovic and R. Hormigo, "Thermistor-based breathing sensor for circadian rhythm evaluation.," Biomedical sciences instrumentation, vol. 37, p. 493–497, 2001.
- S. Palva and J. M. Palva, "New vistas for alpha-frequency band oscillations.," Trends in neurosciences, vol. 30, no. 4, p. 150–158, 2007.
- G. Buzsáki, Rhythms of the Brain., New York, NY, USA: Oxford University Press, 2006.
- S. Upadhyaya, Nadi Vijnana: Ancient Pulse Science, New Delhi, India: Chaukhamba Sanskrit Pratishthan, 1986.
- V. D. Lad, Secrets of the Pulse: The Ancient Art of Ayurvedic Pulse Diagnosis, Delhi, India: Motilal Banarsidass Publishing House, 1996.
- T. V. Ananthapadmanabha, Inner workings during yoga practice, Bangalore, India: Anugraha Publishers, 1999.
- P. V. G. Kumar, S. Deshpande and H. R. Nagendra, "Traditional practices and recent advances in Nadi Pariksha: A comprehensive review.," Journal of Ayurveda and integrative medicine, vol. 10, no. 4, p. 308–315, 2019. [CrossRef]
- L. Mishra, B. B. Singh and S. Dagenais, "Healthcare and disease management in Ayurveda.," Alternative therapies in health and medicine, vol. 7, no. 2, p. 44–50, 2001.
- C. S. Hu, Y. F. Chung, C. C. Yeh and C. H. Luo, "Temporal and spatial properties of arterial pulsation measurement using pressure sensor array.," Evidence-based complementary and alternative medicine, p. 745127, 2012. [CrossRef]
- H. Kim, J. Y. Kim, Y. J. Park and Y. B. Park, "Development of pulse diagnostic devices in Korea.," Integrative medicine research, vol. 2, no. 1, p. 7–17, 2013. [CrossRef]
- P. Wang, W. Zuo and D. Zhang, "A Compound Pressure Signal Acquisition System for Multichannel Wrist Pulse Signal Analysis," IEEE Transactions on Instrumentation and Measurement, vol. 63, no. 6, pp. 1556-1565, 2014. [CrossRef]
- D. Rangaprakash and D. Narayana Dutt, "Study of wrist pulse signals using time domain spatial features.," Computers & Electrical Engineering, vol. 45, pp. 100-107, 2015. [CrossRef]
- D. Wang, D. Zhang and G. Lu, "A Novel Multichannel Wrist Pulse System With Different Sensor Arrays.," IEEE Transactions on Instrumentation and Measurement, vol. 64, no. 7, pp. 2020-2034, 2015. [CrossRef]
- Y.-J. Lee, J. Lee and J.-Y. Kim, "A study on characteristics of radial arteries through ultrasonic waves.," Annual International Conference of the IEEE Engineering in Medicine and Biology Society, p. 2453–2456, 2008.
- J. U. Kim, Y. J. Lee, J. Lee and J. Y. Kim, "Differences in the Properties of the Radial Artery between Cun, Guan, Chi, and Nearby Segments Using Ultrasonographic Imaging: A Pilot Study on Arterial Depth, Diameter, and Blood Flow.," Evidence-based complementary and alternative medicine, p. 381634, 2015.
- B. J. Lee, Y. J.B. J. Lee, Y. J. Jeon, B. Ku, J. U. Kim, J. H. Bae and J. Y. Kim, "Association of hypertension with physical factors of wrist pulse waves using a computational approach: a pilot study.," BMC complementary and alternative medicine, vol. 15, p. 222, 2015. [CrossRef]
- W. Zuo, P. Wang and D. Zhang, "Comparison of Three Different Types of Wrist Pulse Signals by Their Physical Meanings and Diagnosis Performance.," IEEE journal of biomedical and health informatics, vol. 20, no. 1, p. 119–127, 2016. [CrossRef]
- A. Joshi, A. Kulkarni, S. Chandran, V. K. Jayaraman and B. D. Kulkarni, "Nadi Tarangini: a pulse based diagnostic system.," Annual International Conference of the IEEE Engineering in Medicine and Biology Society, p. 2207–2210, 2007.
- D. Wang, D. Zhang and G. Lu, "An Optimal Pulse System Design by Multichannel Sensors Fusion.," IEEE journal of biomedical and health informatics, vol. 20, no. 2, p. 450–459, 2016. [CrossRef]
- D. Lin, A. Zhang, J. Gu, X. Chen, Q. Wang, L. Yang, Y. Chou, G. Liu and J. Wang, "Detection of multipoint pulse waves and dynamic 3D pulse shape of the radial artery based on binocular vision theory.," Computer methods and programs in biomedicine, vol. 155, p. 61–73, 2018. [CrossRef]
- C. Chen, Z. Li, Y. Zhang, S. Zhang, J. Hou and H. Zhang, "A 3D Wrist Pulse Signal Acquisition System for Width Information of Pulse Wave.," Sensors (Basel, Switzerland), vol. 20, no. 1, p. 11, 2019. [CrossRef]
- Q. Zhang, J. Zhou and B. Zhang, "Graph Based Multichannel Feature Fusion for Wrist Pulse Diagnosis.," IEEE journal of biomedical and health informatics, vol. 25, no. 10, p. 3732–3743, 2021. [CrossRef]
- Guo, Z. Jiang, H. He, Y. Liao and D. Zhang, "Wrist pulse signal acquisition and analysis for disease diagnosis: A review.," Computers in biology and medicine, vol. 143, p. 105312, 2022. [CrossRef]
- S. Kumar, S. Kumar and K. Veer, "Pulse (Nadi) Analysis for Disease Diagnosis: A Detailed Review.," Proceedings of the National Academy of Sciences, India Section A: Physical Sciences, vol. 93, p. 135–145, 2023.
- R. G. Bickford, J. Brim, L. Berger and M. Aung, "Application of compressed spectral array in clinical EEG," in Automation of clinical Electroencephalo-graphy, New York, Raven Press, 55-64, p. 1973.
- L. M. Moura, M. M. Shafi, M. Ng, S. Pati, S. S. Cash, A. J. Cole, D. B. Hoch, E. S. Rosenthal and M. B. Westover, "Spectrogram screening of adult EEGs is sensitive and efficient.," Neurology, vol. 83, no. 1, p. 56–64, 2014. [CrossRef]
- D. L. Bailey, D. W. Townsend, P. E. Valk and M. N. Maisy, Positron Emission Tomography: Basic Sciences, Secaucus, NJ, USA: Springer-Verlag, 2003. [CrossRef]
- E. F. Bryant, The Yoga sūtras of Patañjali : a new edition, translation, and commentary with insights from the traditional commentators., Albany, NY, USA: North Point Press, 2009.
- P. Ren, A. Barreto, Y. Gao and M. Adjouadi, "Comparison of the use of pupil diameter and galvanic skin response signals for affective assessment of computer users.," Biomedical sciences instrumentation, vol. 48, p. 345–350, 2012.
- B. Bernard, The Essence of Yoga: Reflections on the Yoga Sūtras of Patañjali., Delhi, India: Sri Satguru Publications, 1997.
- G. Thiene, S. Rizzo and C. Basso, "Chapter 11 - Pathology of sudden death, cardiac arrhythmias, and conduction system," in Cardiovascular Pathology, 5th edition ed., Cambridge, MA, USA, Academic Press, 2022, pp. 447-534.
- A. L. Goldberger, Z. D. Goldberger and A. Shvilkin, Goldberger's Clinical Electrocardiography., 9th edition ed., Cambridge, MA, USA: Academic Press, 2017.
- E. Kirmizi-Alsan, Z. Bayraktaroglu, H. Gurvit, Y. H. Keskin, M. Emre and T. Demiralp, "Comparative analysis of event-related potentials during Go/NoGo and CPT: decomposition of electrophysiological markers of response inhibition and sustained attention.," Brain research, vol. 1104, no. 1, p. 114–128, 2006. [CrossRef]
- R. J. Barry, A. R. Clarke, S. J. Johnstone, C. A. Magee and J. A. Rushby, "EEG differences between eyes-closed and eyes-open resting conditions.," Clinical neurophysiology, vol. 118, no. 12, p. 2765–2773, 2007. [CrossRef]
- C. Müller-Axt, C. Eichner, H. Rusch, L. Kauffmann, P. L. Bazin, A. Anwander, M. Morawski and K. von Kriegstein, "Mapping the human lateral geniculate nucleus and its cytoarchitectonic subdivisions using quantitative MRI.," NeuroImage, vol. 244, p. 118559, 2021. [CrossRef]
- J. R. Polimeni, B. Fischl, D. N. Greve and L. L. Wald, "Laminar analysis of 7T BOLD using an imposed spatial activation pattern in human V1.," NeuroImage, vol. 52, no. 4, p. 1334–1346, 2010. [CrossRef]
- J. L. Prince and J. Links, Medical imaging signals and systems, 2nd edition ed., New York, NY, USA: Pearson, 2014.
- N. Pradhan and D. Narayana Dutt, "An analysis of dimensional complexity of brain electrical activity during meditation.," in Proceedings of the First Regional Conference on IEEE Engineering in Medicine and Biology Society and the 14th Conference of the Biomedical Engineering Society of India, New Delhi, India, 1995.
- C. M. Michel, G. Lantz, L. Spinelli, R. G. De Peralta, T. Landis and M. Seeck, "128-channel EEG source imaging in epilepsy: clinical yield and localization precision.," Journal of clinical neurophysiology, vol. 21, no. 2, p. 71–83, 2004. [CrossRef]
- N. K. Logothetis, "What we can do and what we cannot do with fMRI.," Nature, vol. 453, no. 7197, p. 869–878, 2008.
- J. F. Jansen, W. H. Backes, K. Nicolay and M. E. Kooi, "1H MR spectroscopy of the brain: absolute quantification of metabolites.," Radiology, vol. 240, no. 2, p. 318–332, 2006. [CrossRef]
- S. Petcharunpaisan, J. Ramalho and M. Castillo, "Arterial spin labeling in neuroimaging.," World journal of radiology, vol. 2, no. 10, p. 384–398, 2010.
- V. J. Wedeen, P. Hagmann, W. Y. Tseng, T. G. Reese and R. M. Weisskoff, "Mapping complex tissue architecture with diffusion spectrum magnetic resonance imaging.," Magnetic resonance in medicine, vol. 54, no. 6, p. 1377–1386, 2005. [CrossRef]
- Y. Y. Tang, Q. Lu, X. Geng, E. A. Stein, Y. Yang and M. I. Posner, "Short-term meditation induces white matter changes in the anterior cingulate.," Proceedings of the National Academy of Sciences of the United States of America, vol. 107, no. 35, p. 15649–15652, 2010.
- B. Fischl and A. M. Dale, "Measuring the thickness of the human cerebral cortex from magnetic resonance images.," Proceedings of the National Academy of Sciences of the United States of America, vol. 97, no. 20, p. 11050–11055, 2010. [CrossRef]
- S. W. Lazar, C. E. Kerr, R. H. Wasserman, J. R. Gray, D. N. Greve, M. T. Treadway, M. McGarvey, B. T. Quinn, J. A. Dusek, H. Benson, S. L. Rauch, C. I. Moore and B. Fischl, "Meditation experience is associated with increased cortical thickness.," Neuroreport, vol. 16, no. 17, p. 1893–1897, 2005. [CrossRef]
- N. Coquelet, X. De Tiège, F. Destoky, L. Roshchupkina, M. Bourguignon, S. Goldman, P. Peigneux and V. Wens, "Comparing MEG and high-density EEG for intrinsic functional connectivity mapping.," NeuroImage, vol. 210, p. 116556, 2020. [CrossRef]
- S. Ganesan, E. Beyer, B. Moffat, N. T. Van Dam, V. Lorenzetti and A. Zalesky, "Focused attention meditation in healthy adults: A systematic review and meta-analysis of cross-sectional functional MRI studies.," Neuroscience and biobehavioral reviews, vol. 141, p. 104846, 2022. [CrossRef]
- K. C. Fox, M. L. Dixon, S. Nijeboer, M. Girn, J. L. Floman, M. Lifshitz, M. Ellamil, P. Sedlmeier and K. Christoff, "Functional neuroanatomy of meditation: A review and meta-analysis of 78 functional neuroimaging investigations.," Neuroscience and biobehavioral reviews, vol. 65, p. 208–228, 2016. [CrossRef]
- C. Gururaja, D. Rangaprakash and G. Deshpande, "Research Trends in the Application of Yoga to Human Health: A Data Science Approach.," International journal of public mental health and neurosciences, vol. 7, no. 1, p. 8–13, 2020.
- K. C. Fox, S. Nijeboer, M. L. Dixon, J. L. Floman, M. Ellamil, S. P. Rumak, P. Sedlmeier and K. Christoff, "Is meditation associated with altered brain structure? A systematic review and meta-analysis of morphometric neuroimaging in meditation practitioners.," Neuroscience and biobehavioral reviews, vol. 43, p. 48–73, 2014. [CrossRef]
- N. P. Gothe, I. Khan, J. Hayes, E. Erlenbach and J. S. Damoiseaux, "Yoga Effects on Brain Health: A Systematic Review of the Current Literature.," Brain plasticity, vol. 5, no. 1, p. 105–122, 2019. [CrossRef]
- A. Venkatraman, R. Nandy, S. S. Rao, D. H. Mehta, A. Viswanathan and R. Jayasundar, "Tantra and Modern Neurosciences: Is there any Correlation?.," Neurology India, vol. 67, no. 5, p. 1188–1193, 2019. [CrossRef]
- J. van Aalst, J. Ceccarini, G. Schramm, D. Van Weehaeghe, A. Rezaei, K. Demyttenaere, S. Sunaert and K. Van Laere, "Long-term Ashtanga yoga practice decreases medial temporal and brainstem glucose metabolism in relation to years of experience.," EJNMMI research, vol. 10, no. 1, p. 50, 2020. [CrossRef]
- E. R. Gizewski, R. Steiger, M. Waibel, S. Pereverzyev, P. J. D. Sommer, C. Siedentopf, A. E. Grams, L. Lenhart and N. Singewald, "Short-term meditation training influences brain energy metabolism: A pilot study on 31 P MR spectroscopy.," Brain and behavior, vol. 11, no. 1, p. e01914, 2021.
- M. G. R. Babu, R. Kadavigere, P. Koteshwara, B. Sathian and K. S. Rai, "Rajyoga meditation induces grey matter volume changes in regions that process reward and happiness.," Scientific reports, vol. 10, no. 1, p. 16177, 2020. [CrossRef]
- S. Kajimura, N. Masuda, J. K. L. Lau and K. Murayama, "Focused attention meditation changes the boundary and configuration of functional networks in the brain.," Scientific reports, vol. 10, no. 1, p. 18426, 2020. [CrossRef]
- H. Kaur, S. Chaudhary, S. Mohanty, G. Sharma, S. S. Kumaran, N. Ghati, R. Bhatia, A. Nehra and R. M. Pandey, "Comparing cognition, coping skills and vedic personality of individuals practicing yoga, physical exercise or sedentary lifestyle: a cross-sectional fMRI study.," Integrative medicine research, vol. 11, no. 1, p. 100750, 2022. [CrossRef]
- D. Chetry, S. Telles and A. Balkrishna, "A PubMed-Based Exploration of the Course of Yoga Research from 1948 to 2020.," International journal of yoga therapy, vol. 31, no. 1, p. Article_22, 2021. [CrossRef]
- T. Jao, C. W. Li, P. E. Vértes, C. W. Wu, S. Achard, C. H. Hsieh, C. H. Liou, J. H. Chen and E. T. Bullmore, "Large-Scale Functional Brain Network Reorganization During Taoist Meditation.," Brain connectivity, vol. 6, no. 1, p. 9–24, 2016. [CrossRef]
- C. Kaur and P. Singh, "EEG Derived Neuronal Dynamics during Meditation: Progress and Challenges.," Advances in preventive medicine, p. 614723, 2015. [CrossRef]
- H. Nakata, K. Sakamoto and R. Kakigi, "Meditation reduces pain-related neural activity in the anterior cingulate cortex, insula, secondary somatosensory cortex, and thalamus.," Frontiers in psychology, vol. 5, p. 1489, 2014.
- K. B. Bærentsen, "Patanjali and neuroscientific research on meditation.," Frontiers in psychology, vol. 6, p. 915, 2015. [CrossRef]
- J. S. K. Reddy and S. Roy, "Commentary: Patanjali and neuroscientific research on meditation.," Frontiers in psychology, vol. 9, p. 248, 2018. [CrossRef]
- S. S. Rangapriya Sri Srih, Insights into Sanatana Dharma, Mysore, India: Ashtanga Yoga Vijnana Mandiram, 2010.
- V. Chayapati, Food, Health and Spirituality (in kannada language: Aahara Aarogya Aadhyatma), Ashtanga Yoga Vijnana Mandiram: Mysore, India, 2006.
- S. S. Rangapriya Sri Srih, Indian Festivals (in Kannada language: Bharatiyara Habba Haridinagalu), Bangalore, India: Bharatha Samskruthi Prakashana, 2013.
- S. Mahaguru, Amaravani - A compilation of the lectures of Sriranga Mahaguru on Samskara: Volume 9 (in Kannada language), Mysore, India: Ashtanga Yoga Vijnana Mandiram, 1999.
- S. S. Rangapriya Sri Srih, Rites and Rituals: What, Why and How (in Kannada language: Samskaragalu enu eke hege), Mysore, India: Ashtanga Yoga Vijnana Mandiram, 2010.
- S. S. Rangapriya Sri Srih, A Hand-Book of Sandhyavandanam, Mysore, India: Ashtanga Yoga Vijnana Mandiram, 2022.
- S. Mahaguru, Amaravani - A compilation of the lectures of Sriranga Mahaguru on life (jeevana): Volume 1 (in Kannada language), Mysore, India: Ashtanga Yoga Vijnana Mandiram, 1983.
- V. Tripathi and P. Bharadwaj, "Neuroscience of the yogic theory of consciousness.," Neuroscience of consciousness, vol. 2021, no. 2, p. niab030, 2021. [CrossRef]
- E. Niedermeyer and F. L. da Silva, Electroencephalography: Basic Principles, Clinical Applications, and Related Fields., Philadelphia, PA, USA: Lippincott Williams & Wilkins, 2004.
- S. Ismail, I. Siddiqi and U. Akram, "Localization and classification of heart beats in phonocardiography signals —a comprehensive review.," EURASIP Journal on Advances in Signal Processing, p. 26, 2018. [CrossRef]
- S. Telles, R. Nagarathna and H. R. Nagendra, "Breathing through a particular nostril can alter metabolism and autonomic activities.," Indian journal of physiology and pharmacology, vol. 38, no. 2, p. 133–137, 1994.
- R. Kahana-Zweig, M. Geva-Sagiv, A. Weissbrod, L. Secundo, N. Soroker and N. Sobel, "Measuring and Characterizing the Human Nasal Cycle.," PloS one, vol. 11, no. 10, p. e0162918, 2016. [CrossRef]
- K. Singh, H. Bhargav and T. M. Srinivasan, "Effect of uninostril yoga breathing on brain hemodynamics: A functional near-infrared spectroscopy study.," International journal of yoga, vol. 9, no. 1, p. 12–19, 2016. [CrossRef]
- E. F. Du Bois, "The basal metabolism in fever.," Journal of the American Medical Association, vol. 77, no. 5, p. 352–355, 1921.
- S. Mahaguru, "Vijnyana Mandiram: Its Aims and Programme," 24 October 1947. [Online]. Available: https://www.ayvm.in/aboutus_page1. [Accessed 2023].
- M. N. Rusalova, "Frequency-amplitude characteristics of the EEG at different levels of consciousness.," Neuroscience and behavioral physiology, vol. 36, no. 4, p. 351–358, 2006. [CrossRef]
- J. Pillai and M. R. Sperling, "Interictal EEG and the diagnosis of epilepsy.," Epilepsia, vol. 47, no. Suppl 1, p. 14–22, 2006. [CrossRef]
- H. Jasper, "Report of the committee on methods of clinical examination in electroencephalography," Electroencephalography and Clinical Neurophysiology, vol. 10, no. 2, p. 370–375, 1958.
- G. H. Klem, H. O. Lüders, H. H. Jasper and C. Elger, "The ten-twenty electrode system of the International Federation. The International Federation of Clinical Neurophysiology.," Electroencephalography and clinical neurophysiology. Supplement, vol. 52, p. 3–6, 1999.
- T. Alotaiby, F. E. A. El-Samie, S. A. Alshebeili and I. Ahmad, "A review of channel selection algorithms for EEG signal processing.," EURASIP Journal of Advances in Signal Processing, p. 66, 2015. [CrossRef]
Figure 1.
Photos of the participant captured before (Photo 1) and during meditation (Photos 2, 3 and 4) during experiment-1 (16 September 1985). Photo 4 shows a posture (called ‘namaskaara mudra’ in Sanskrit) manifesting naturally at one point during meditation. The expression of Photo 3 with raised eyes and eyebrows manifested naturally as well. The photos are reproduced with permission.
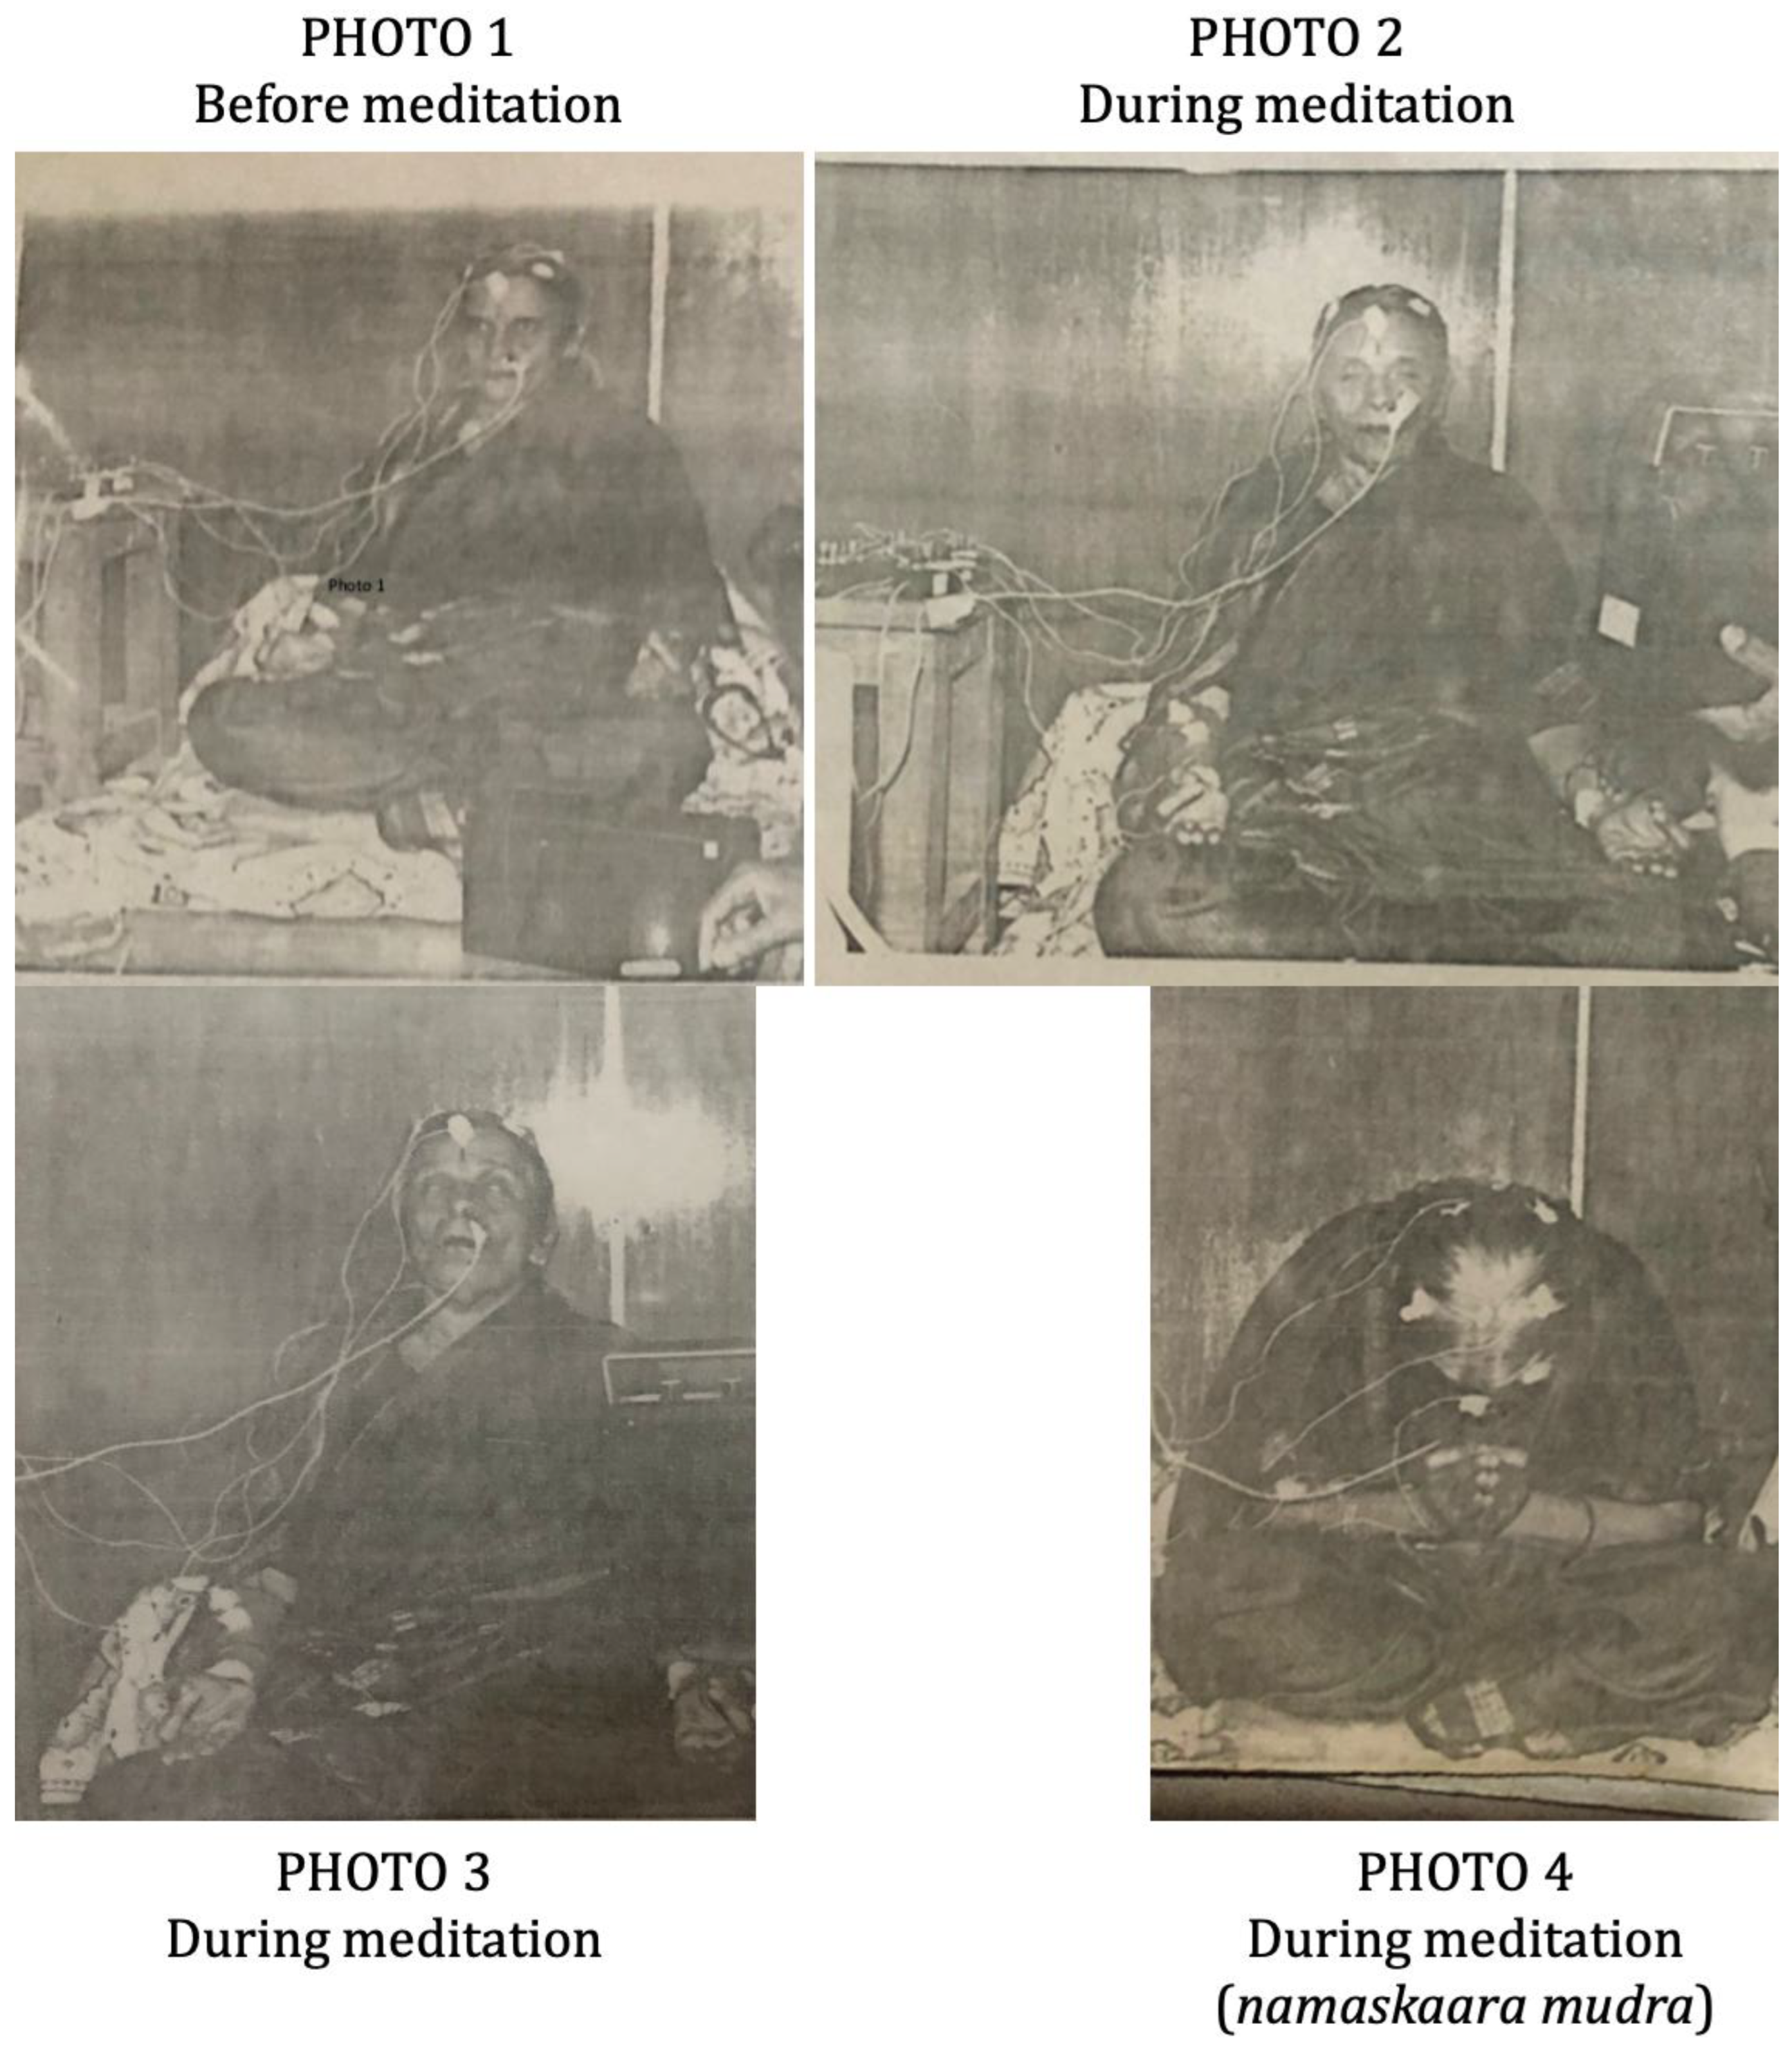
Figure 2.
Photos of the polygraph equipment for data acquisition (Photo 5), additional equipment used for recording the data onto a tape (Photo 6), and the participant during meditation (Photo 7) during experiment-2 (26 November 1988). Reproduced with permission.
Figure 2.
Photos of the polygraph equipment for data acquisition (Photo 5), additional equipment used for recording the data onto a tape (Photo 6), and the participant during meditation (Photo 7) during experiment-2 (26 November 1988). Reproduced with permission.
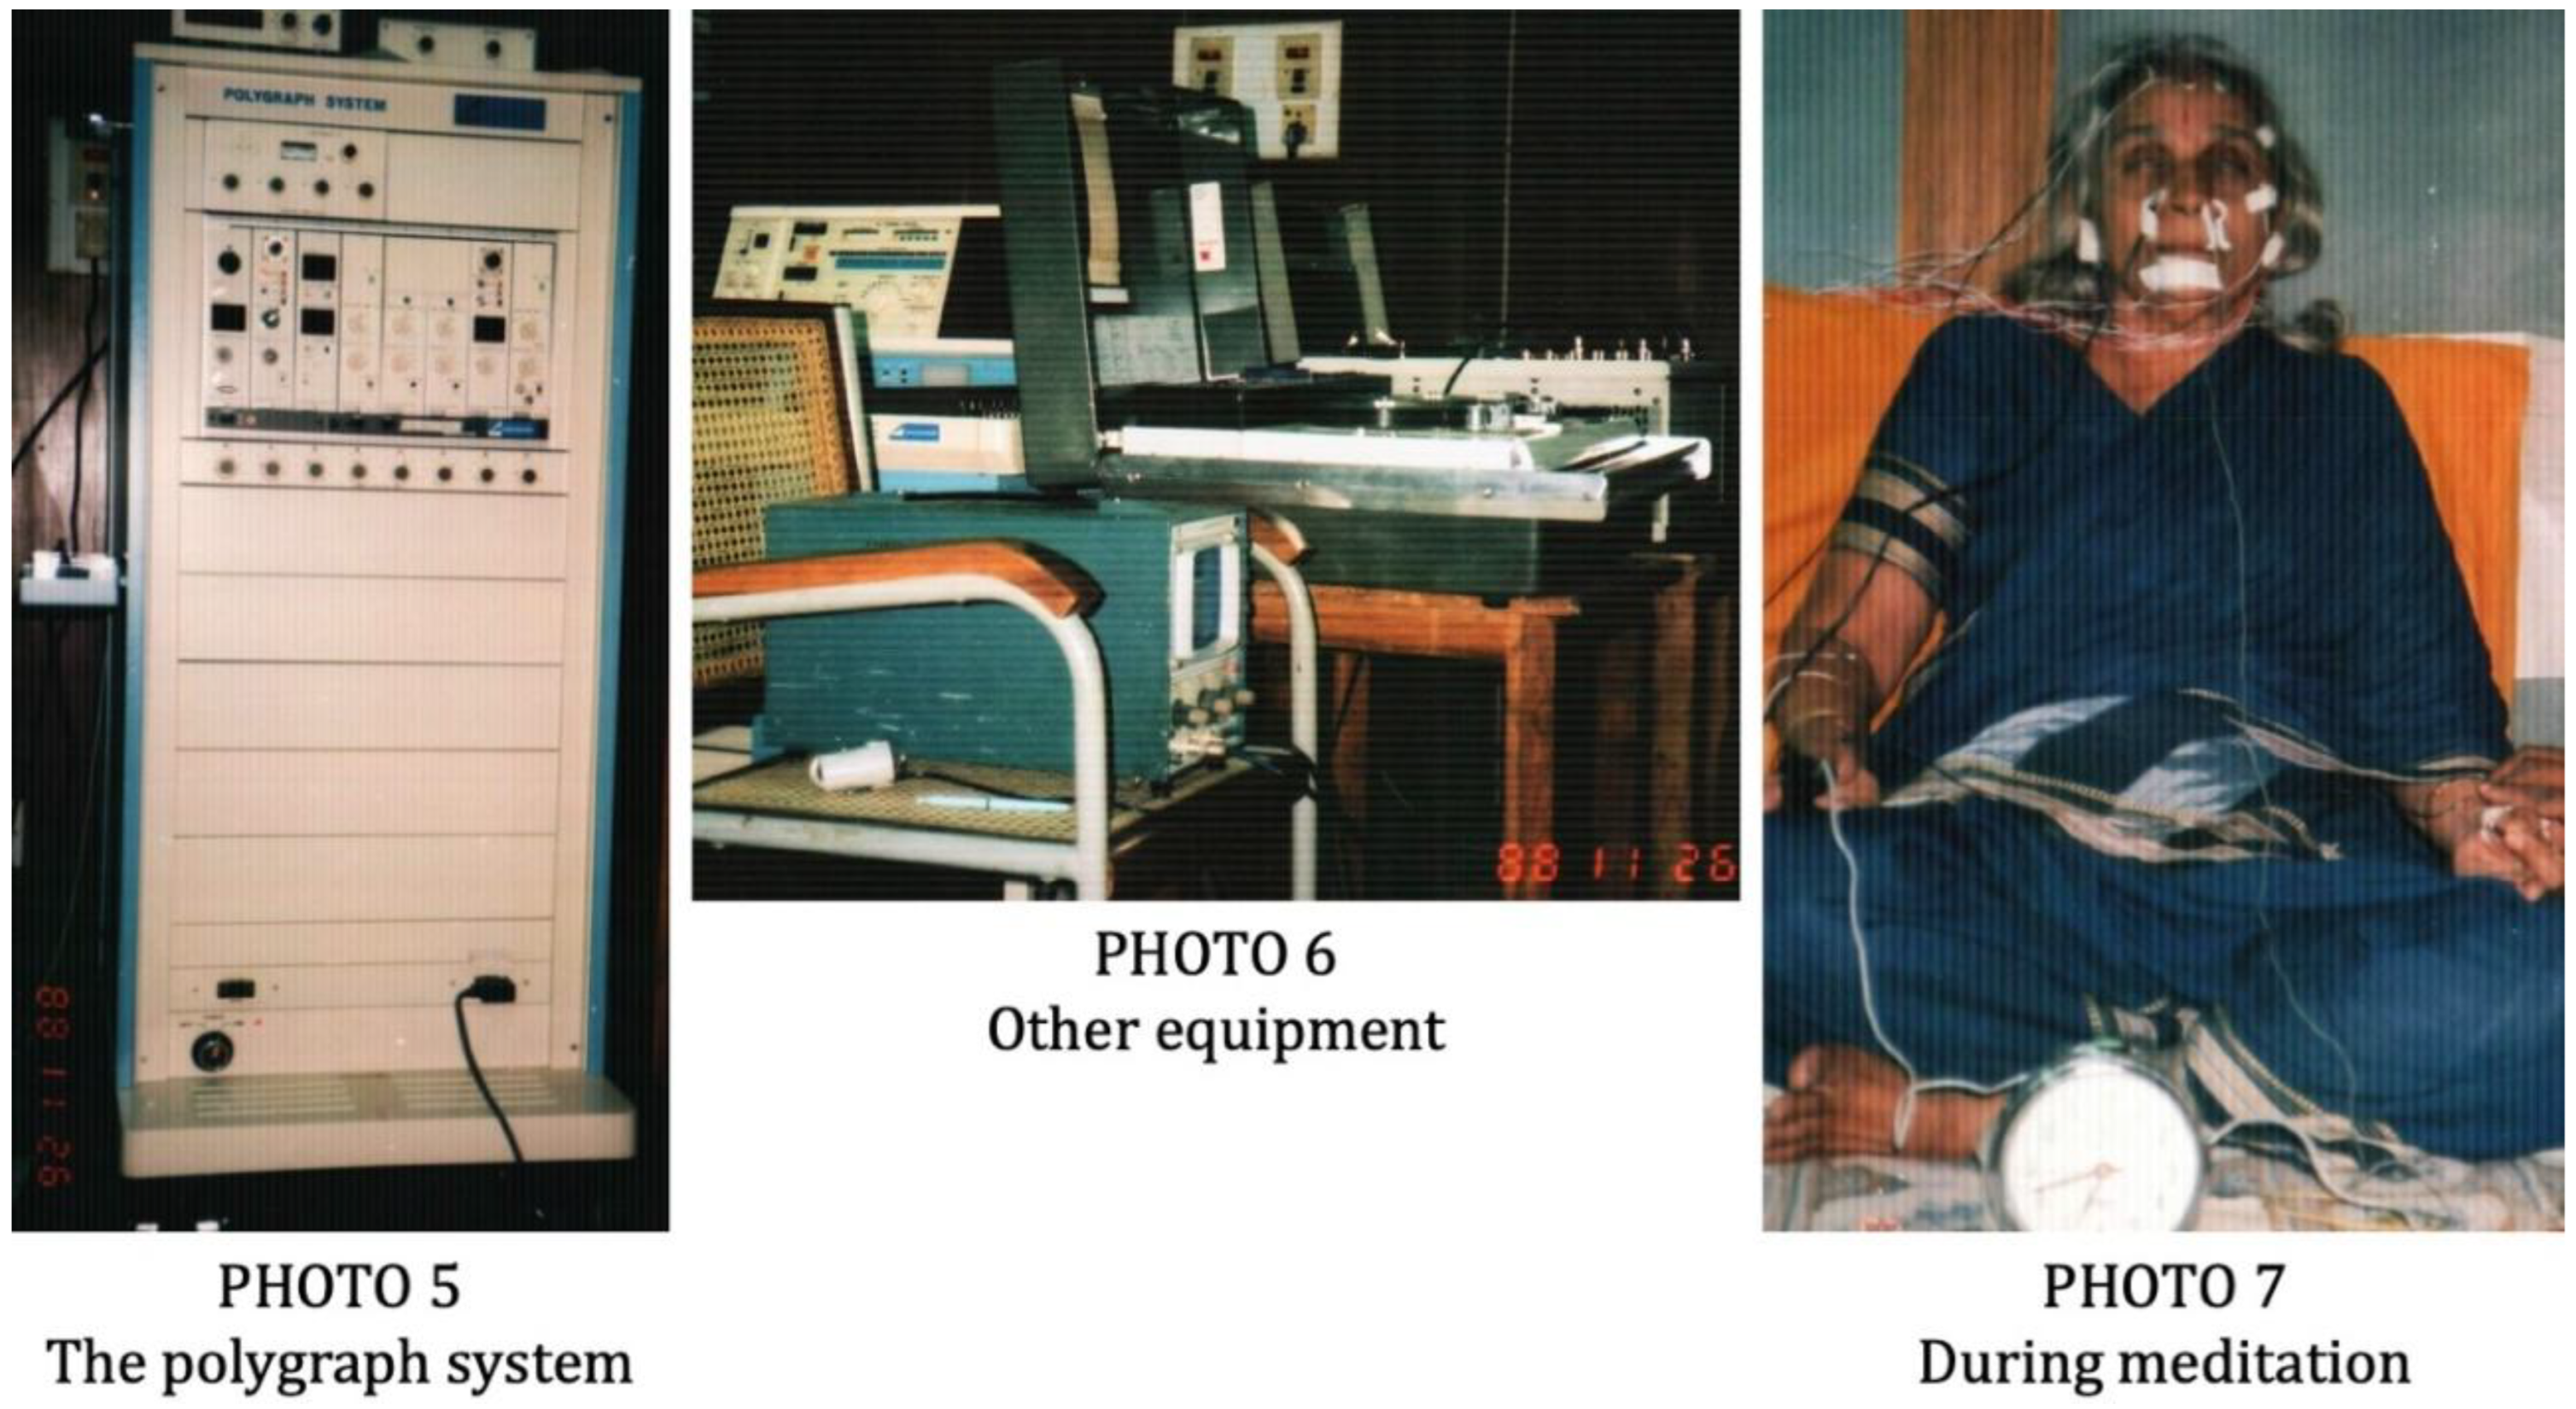
Figure 3.
A pictorial illustration of typical breathing waveforms before and during meditation. This is a handwritten illustration only, not actual data. Shorter segments of acquired respiration data can be compared in Figure 4, Figure 5 and Figure 6 (channel 1) as well as Figure 8, Figure 9 and Figure 10 (channel 18). Before meditation (top graph), the respiration amplitude was normal, while during meditation (bottom graph), the respiration amplitude was extremely low (mean amplitude was <5% of that before meditation).
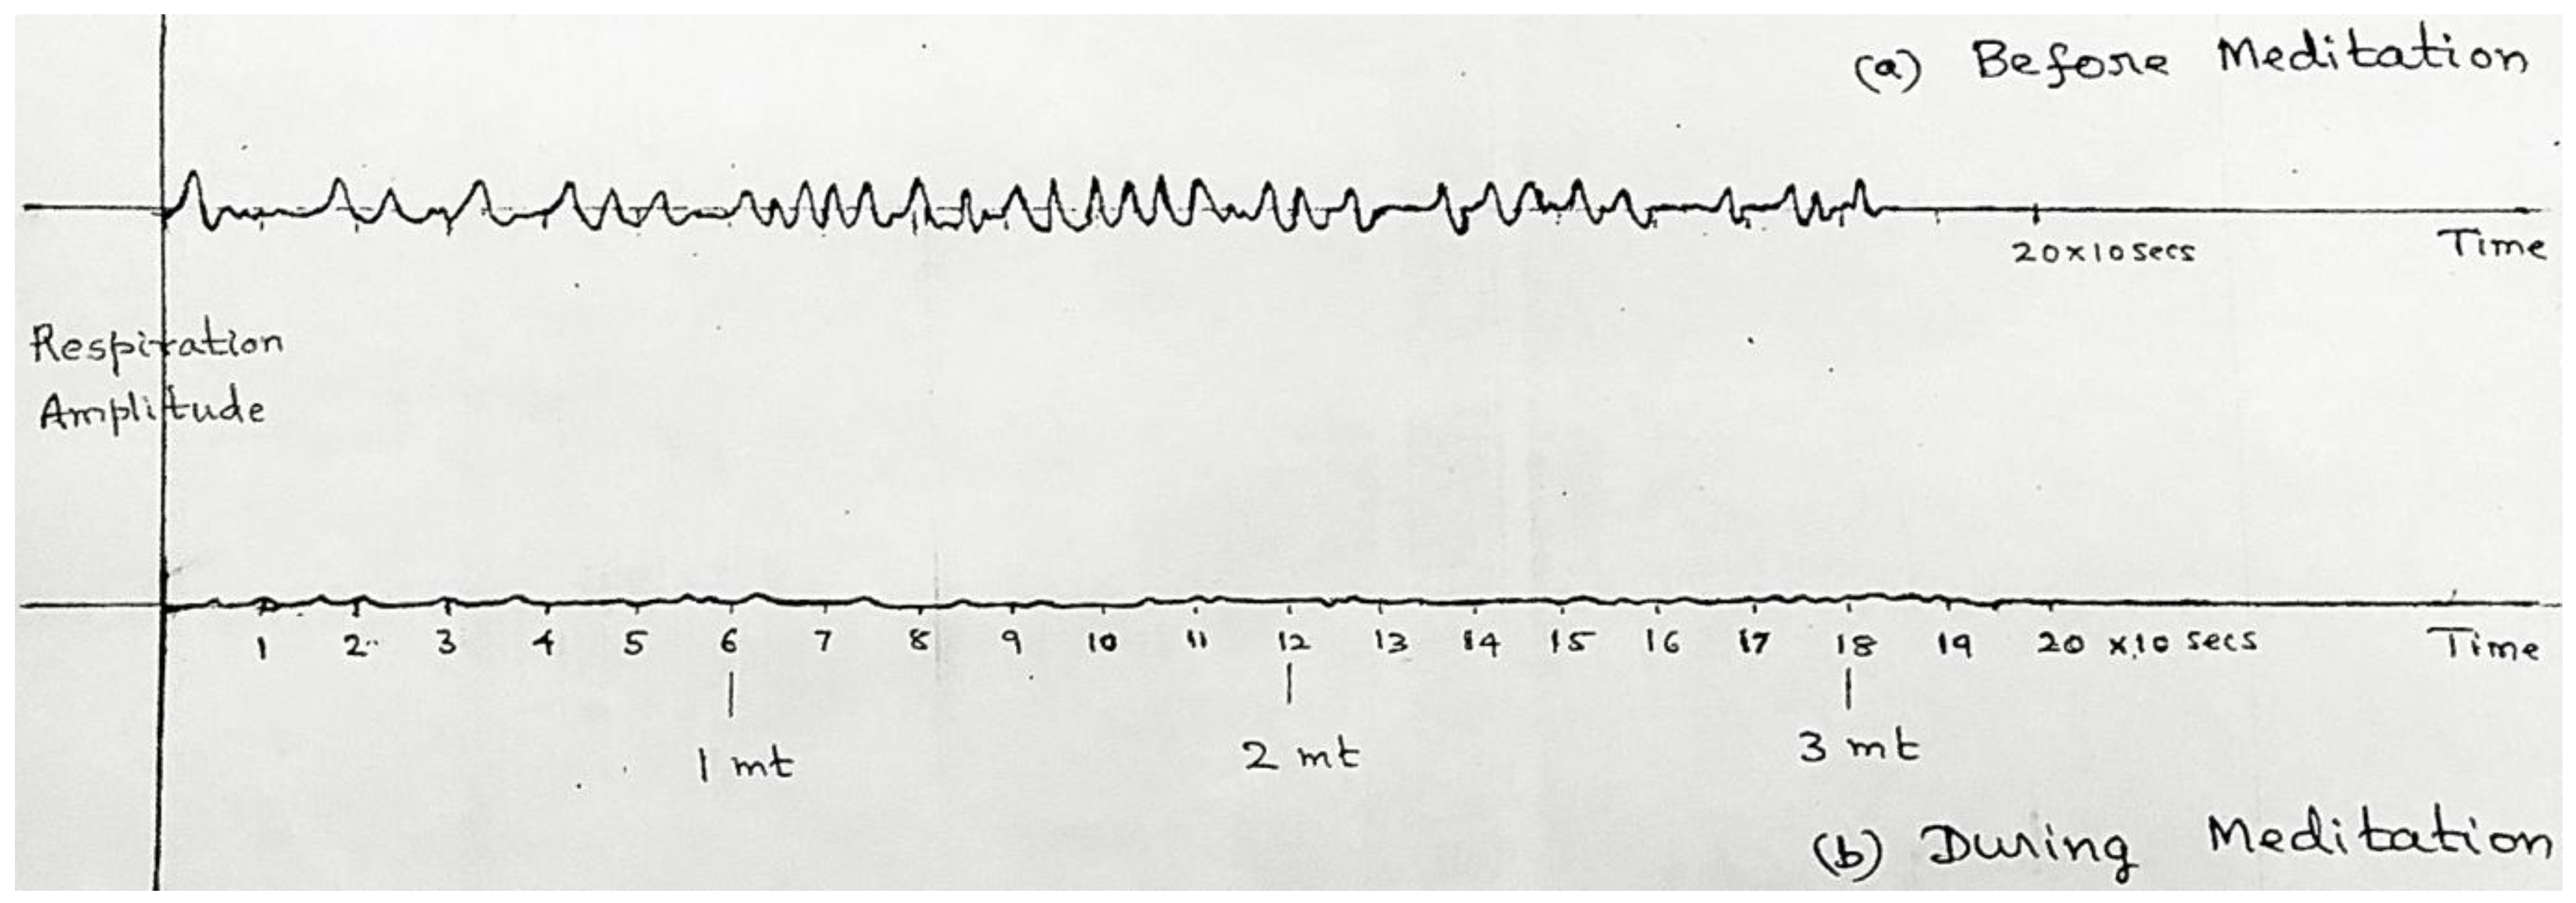
Figure 4.
Experiment-1 8-channel electrophysiological data of about a 10-second epoch (a) before, and (b) immediately after the onset of meditation. Two deep breaths are visible at the onset of meditation, along with changes in EEG activity especially in the frontal electrodes.
Figure 4.
Experiment-1 8-channel electrophysiological data of about a 10-second epoch (a) before, and (b) immediately after the onset of meditation. Two deep breaths are visible at the onset of meditation, along with changes in EEG activity especially in the frontal electrodes.
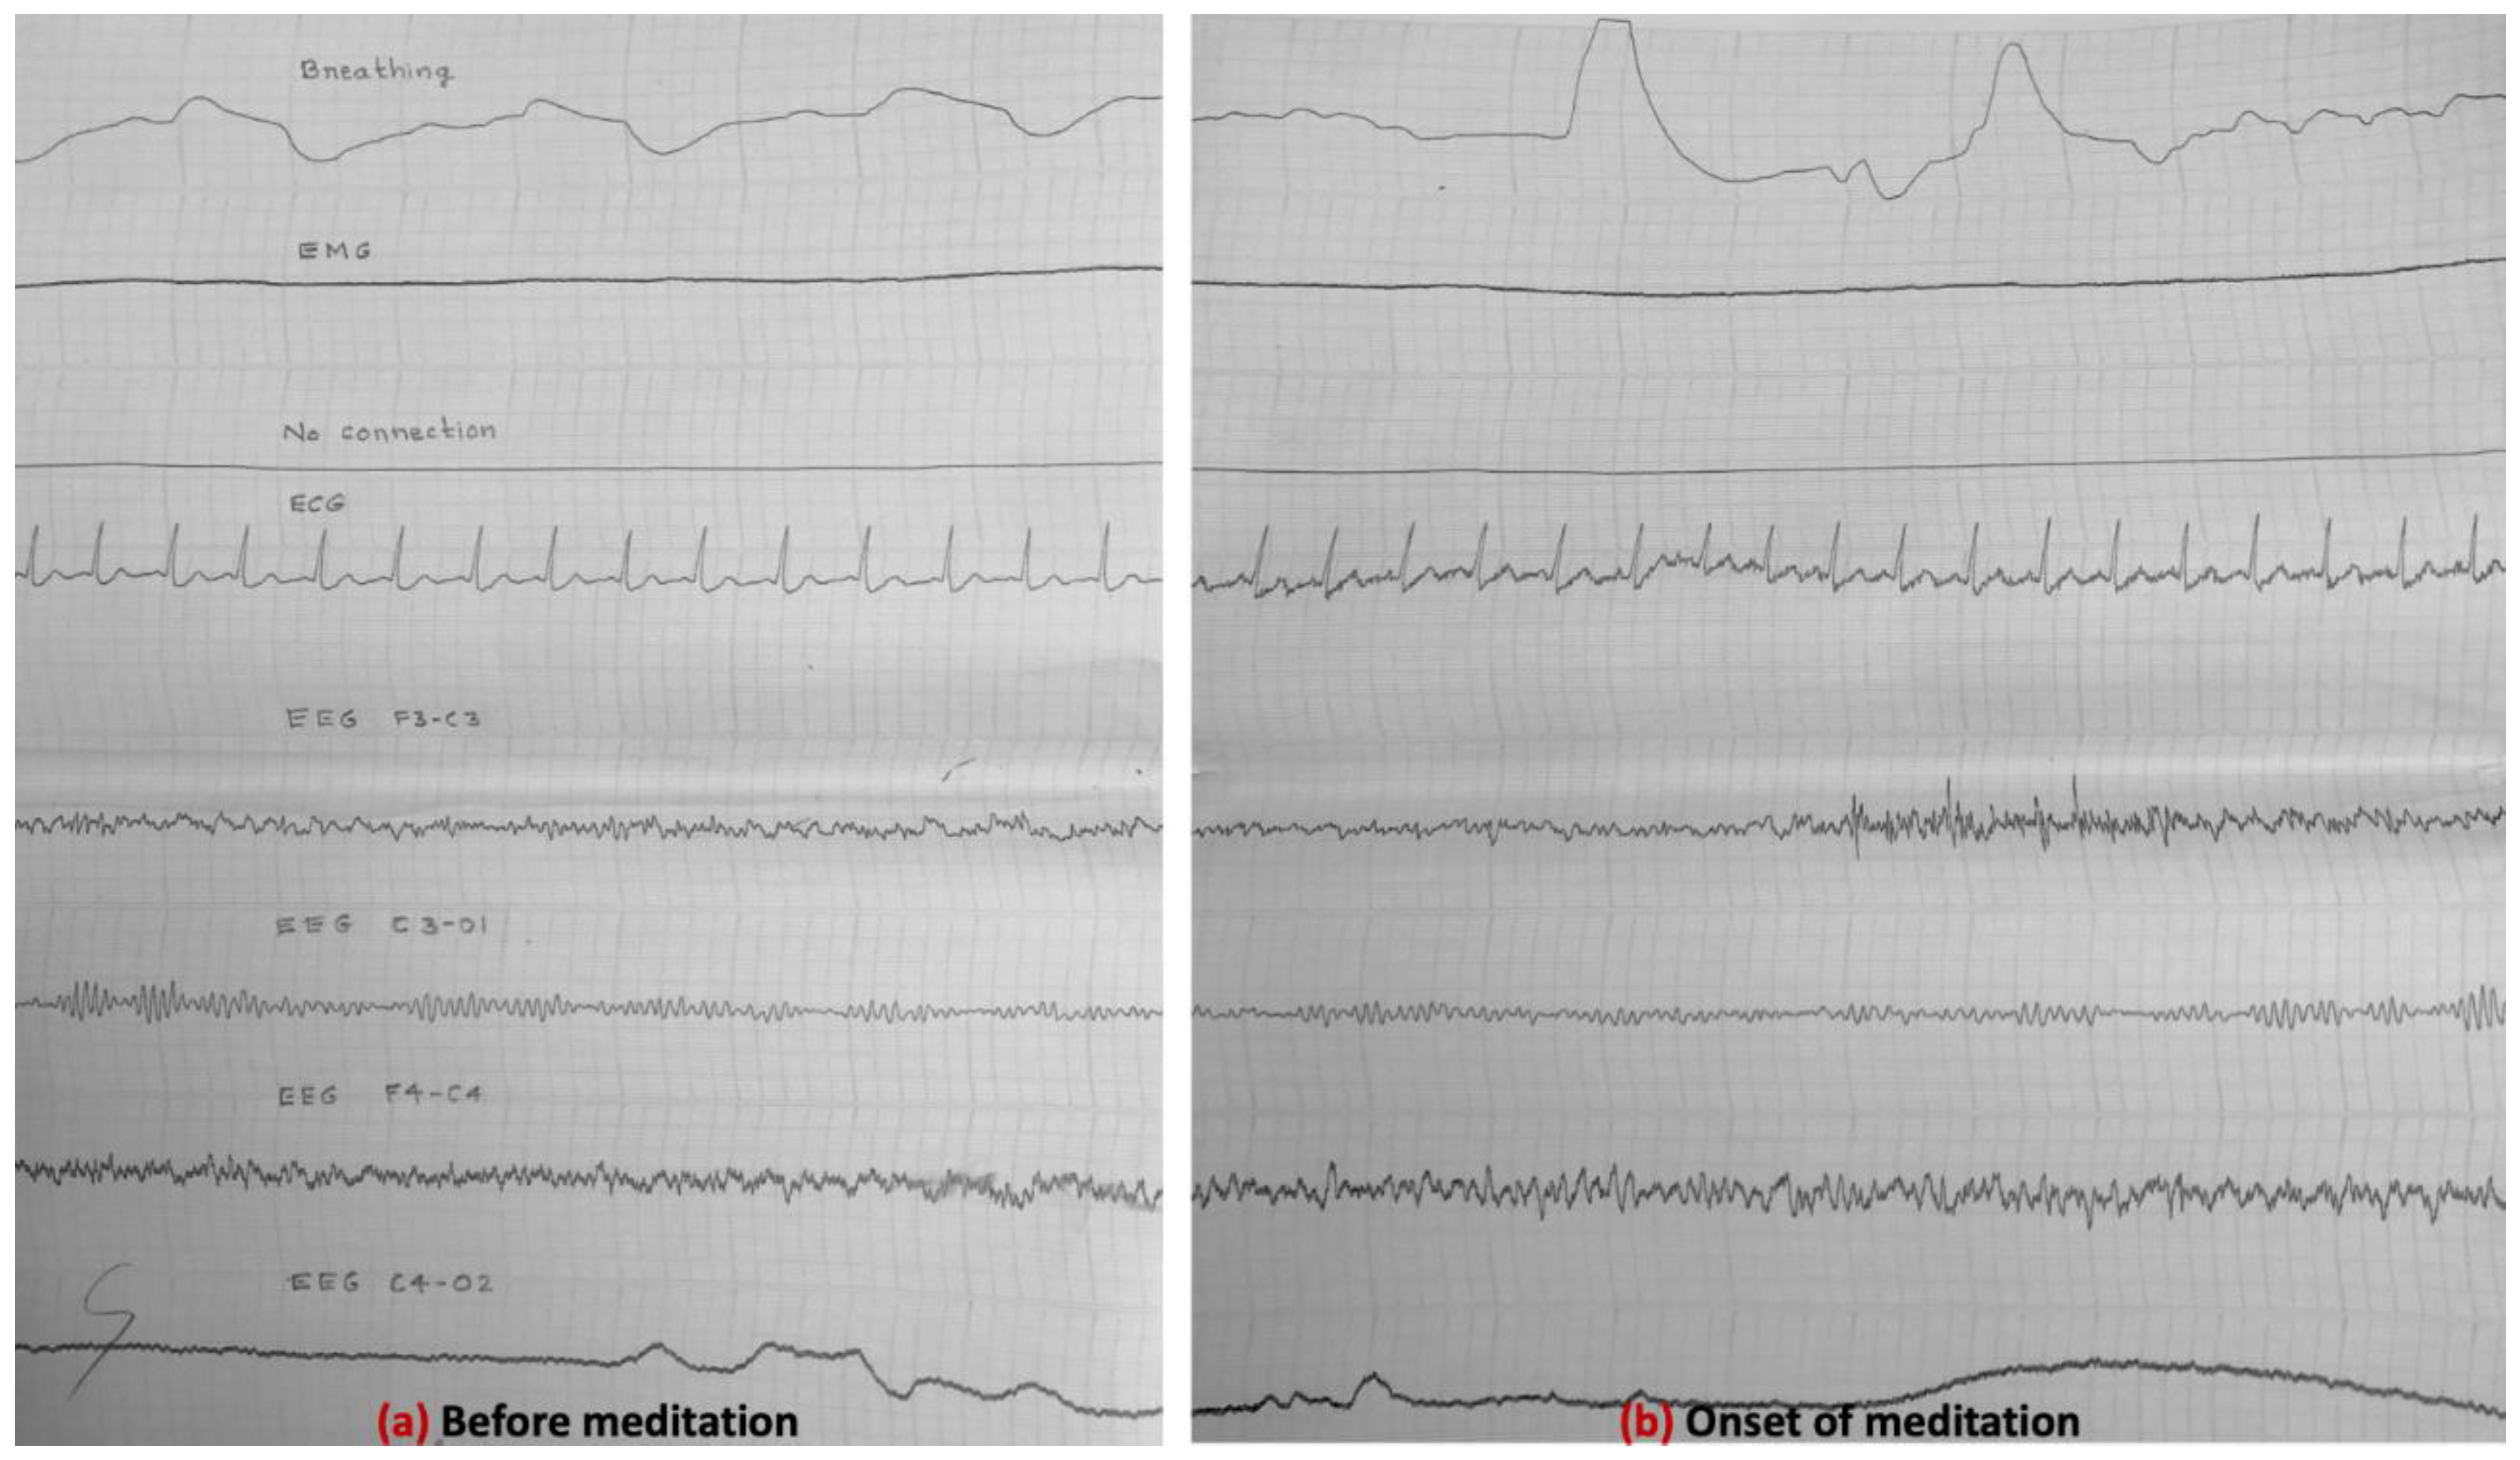
Figure 5.
Experiment-1 8-channel electrophysiological data of about a 10-second epoch (a) before (for comparison), and (b) during meditation. The latter was about 15 minutes after the onset of meditation. A reduction in breathing amplitude and an increase in EMG muscle contractions are visibly apparent, apart from changes in EEG discussed in section 4.4.
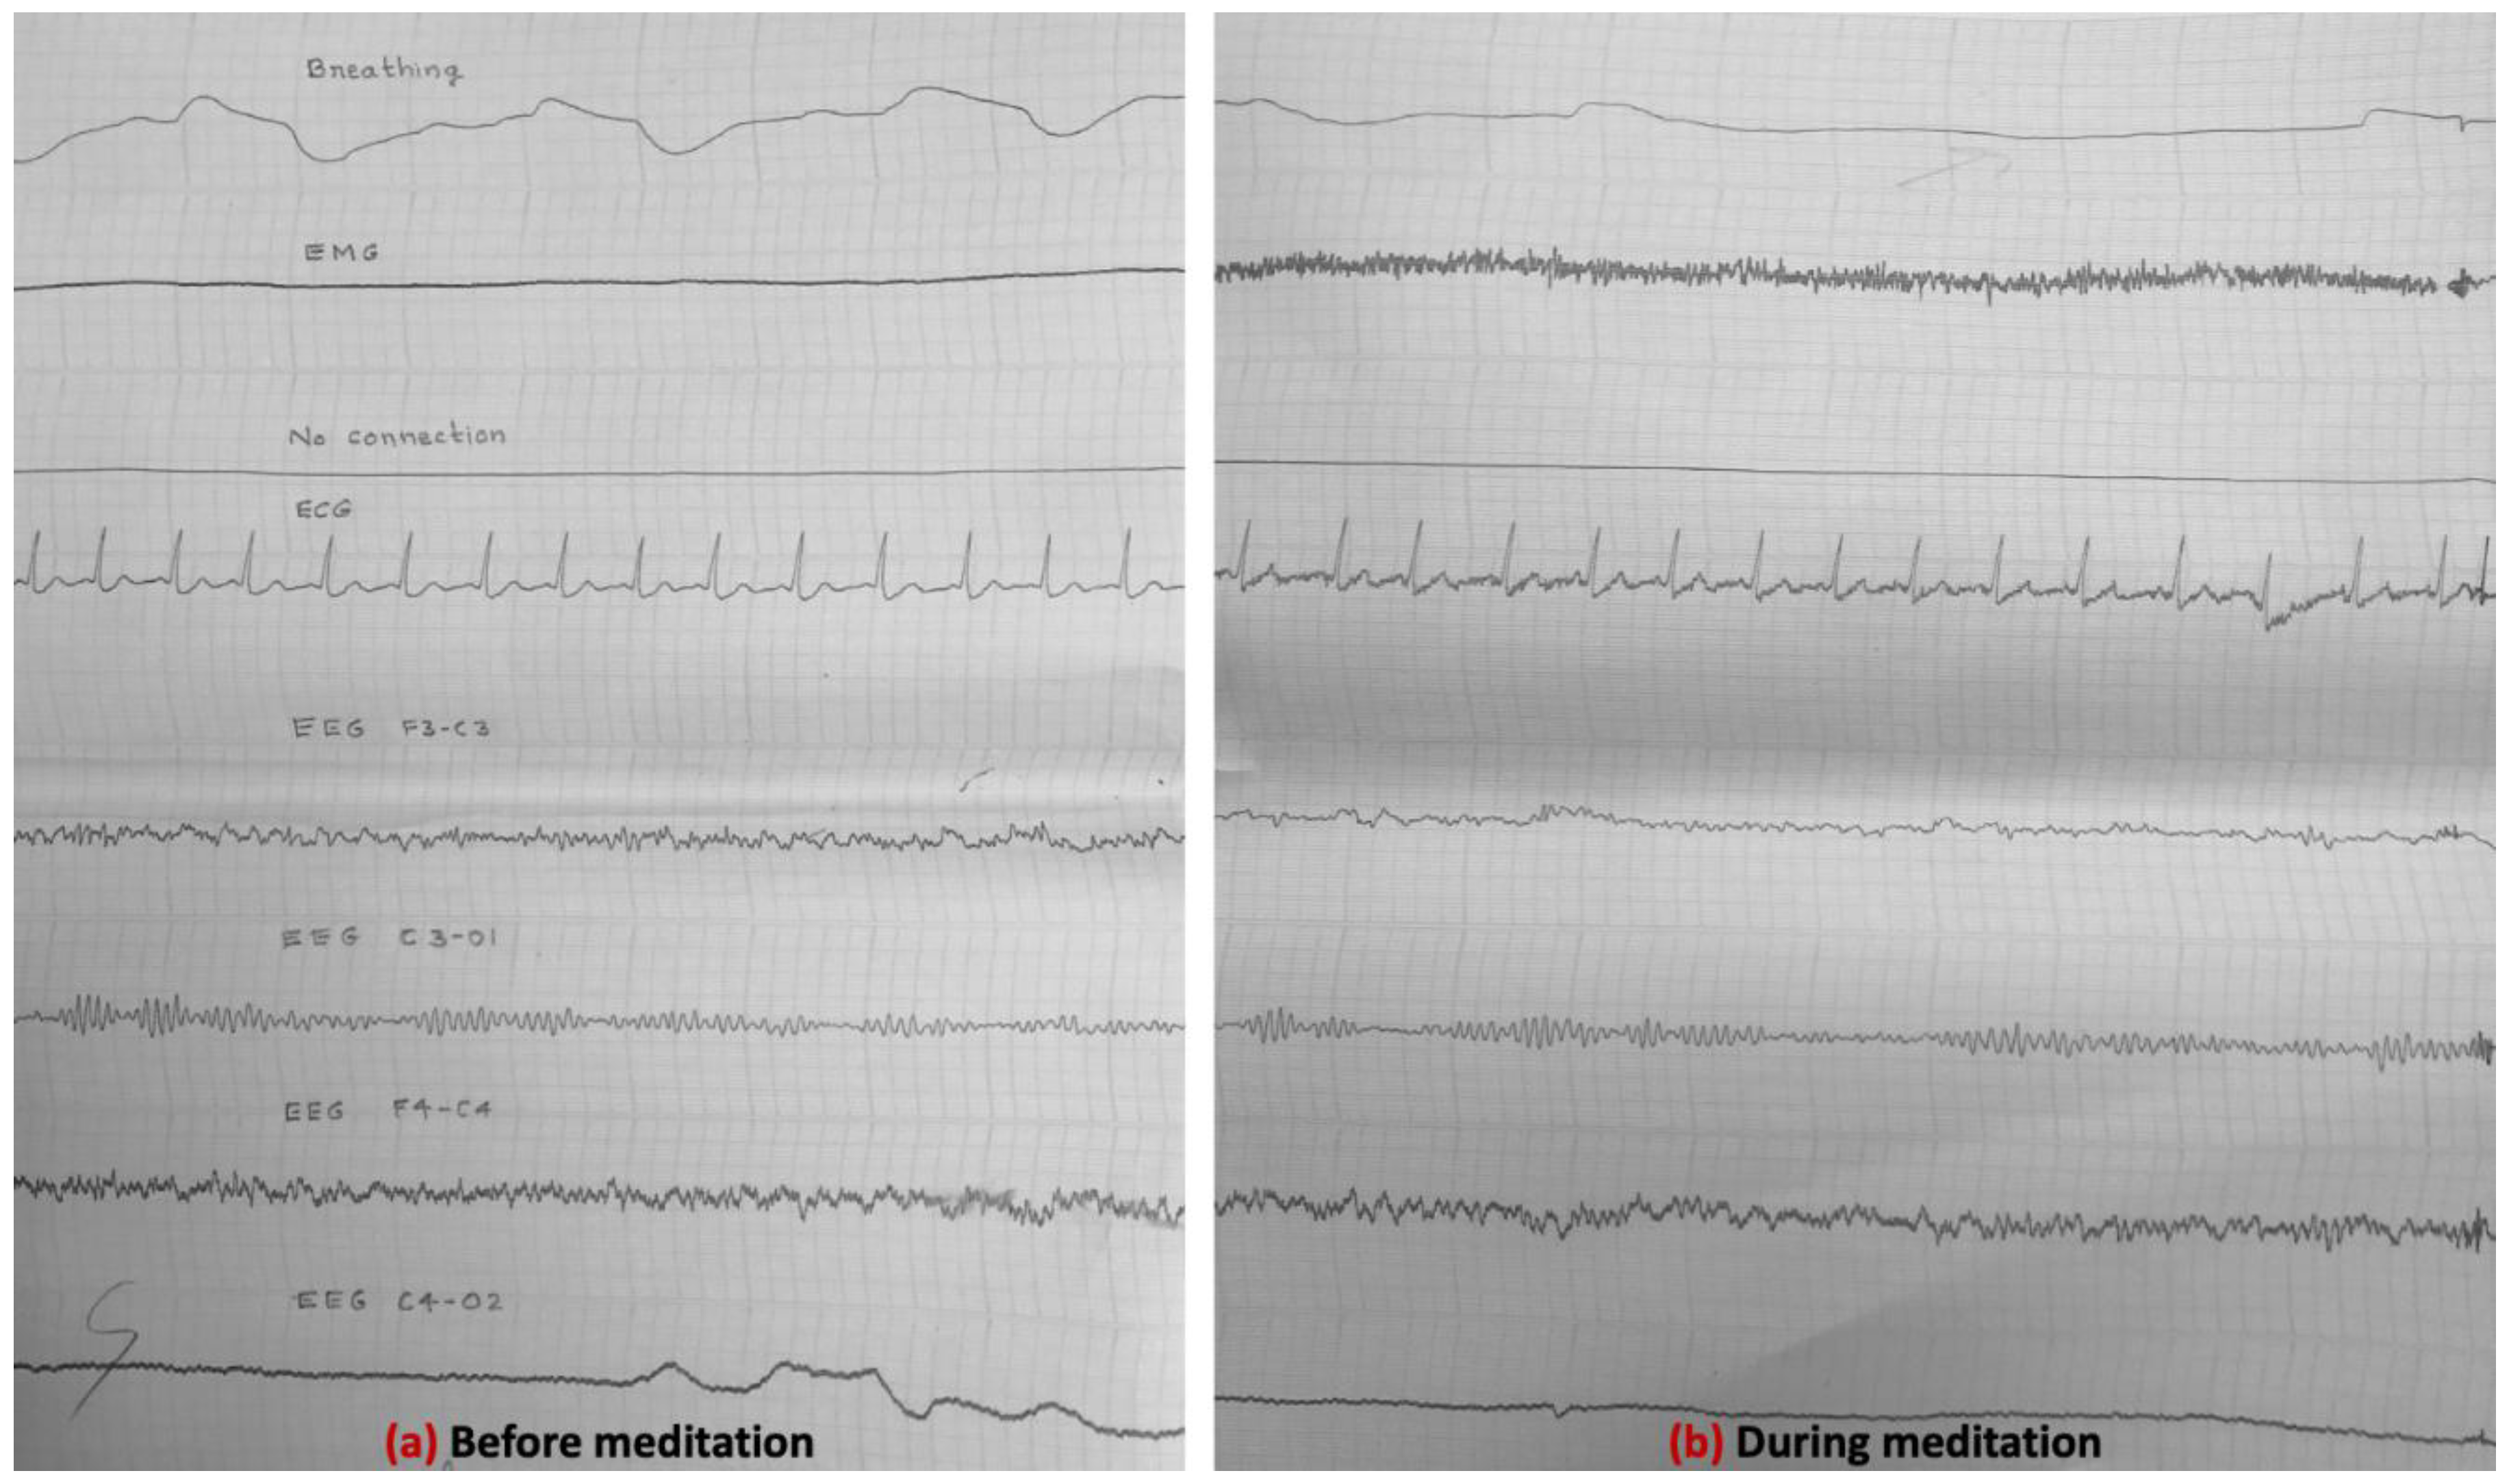
Figure 6.
Experiment-1 8-channel electrophysiological data of about a 10-second epoch (a) before (for comparison), and (b) after meditation.
Figure 6.
Experiment-1 8-channel electrophysiological data of about a 10-second epoch (a) before (for comparison), and (b) after meditation.
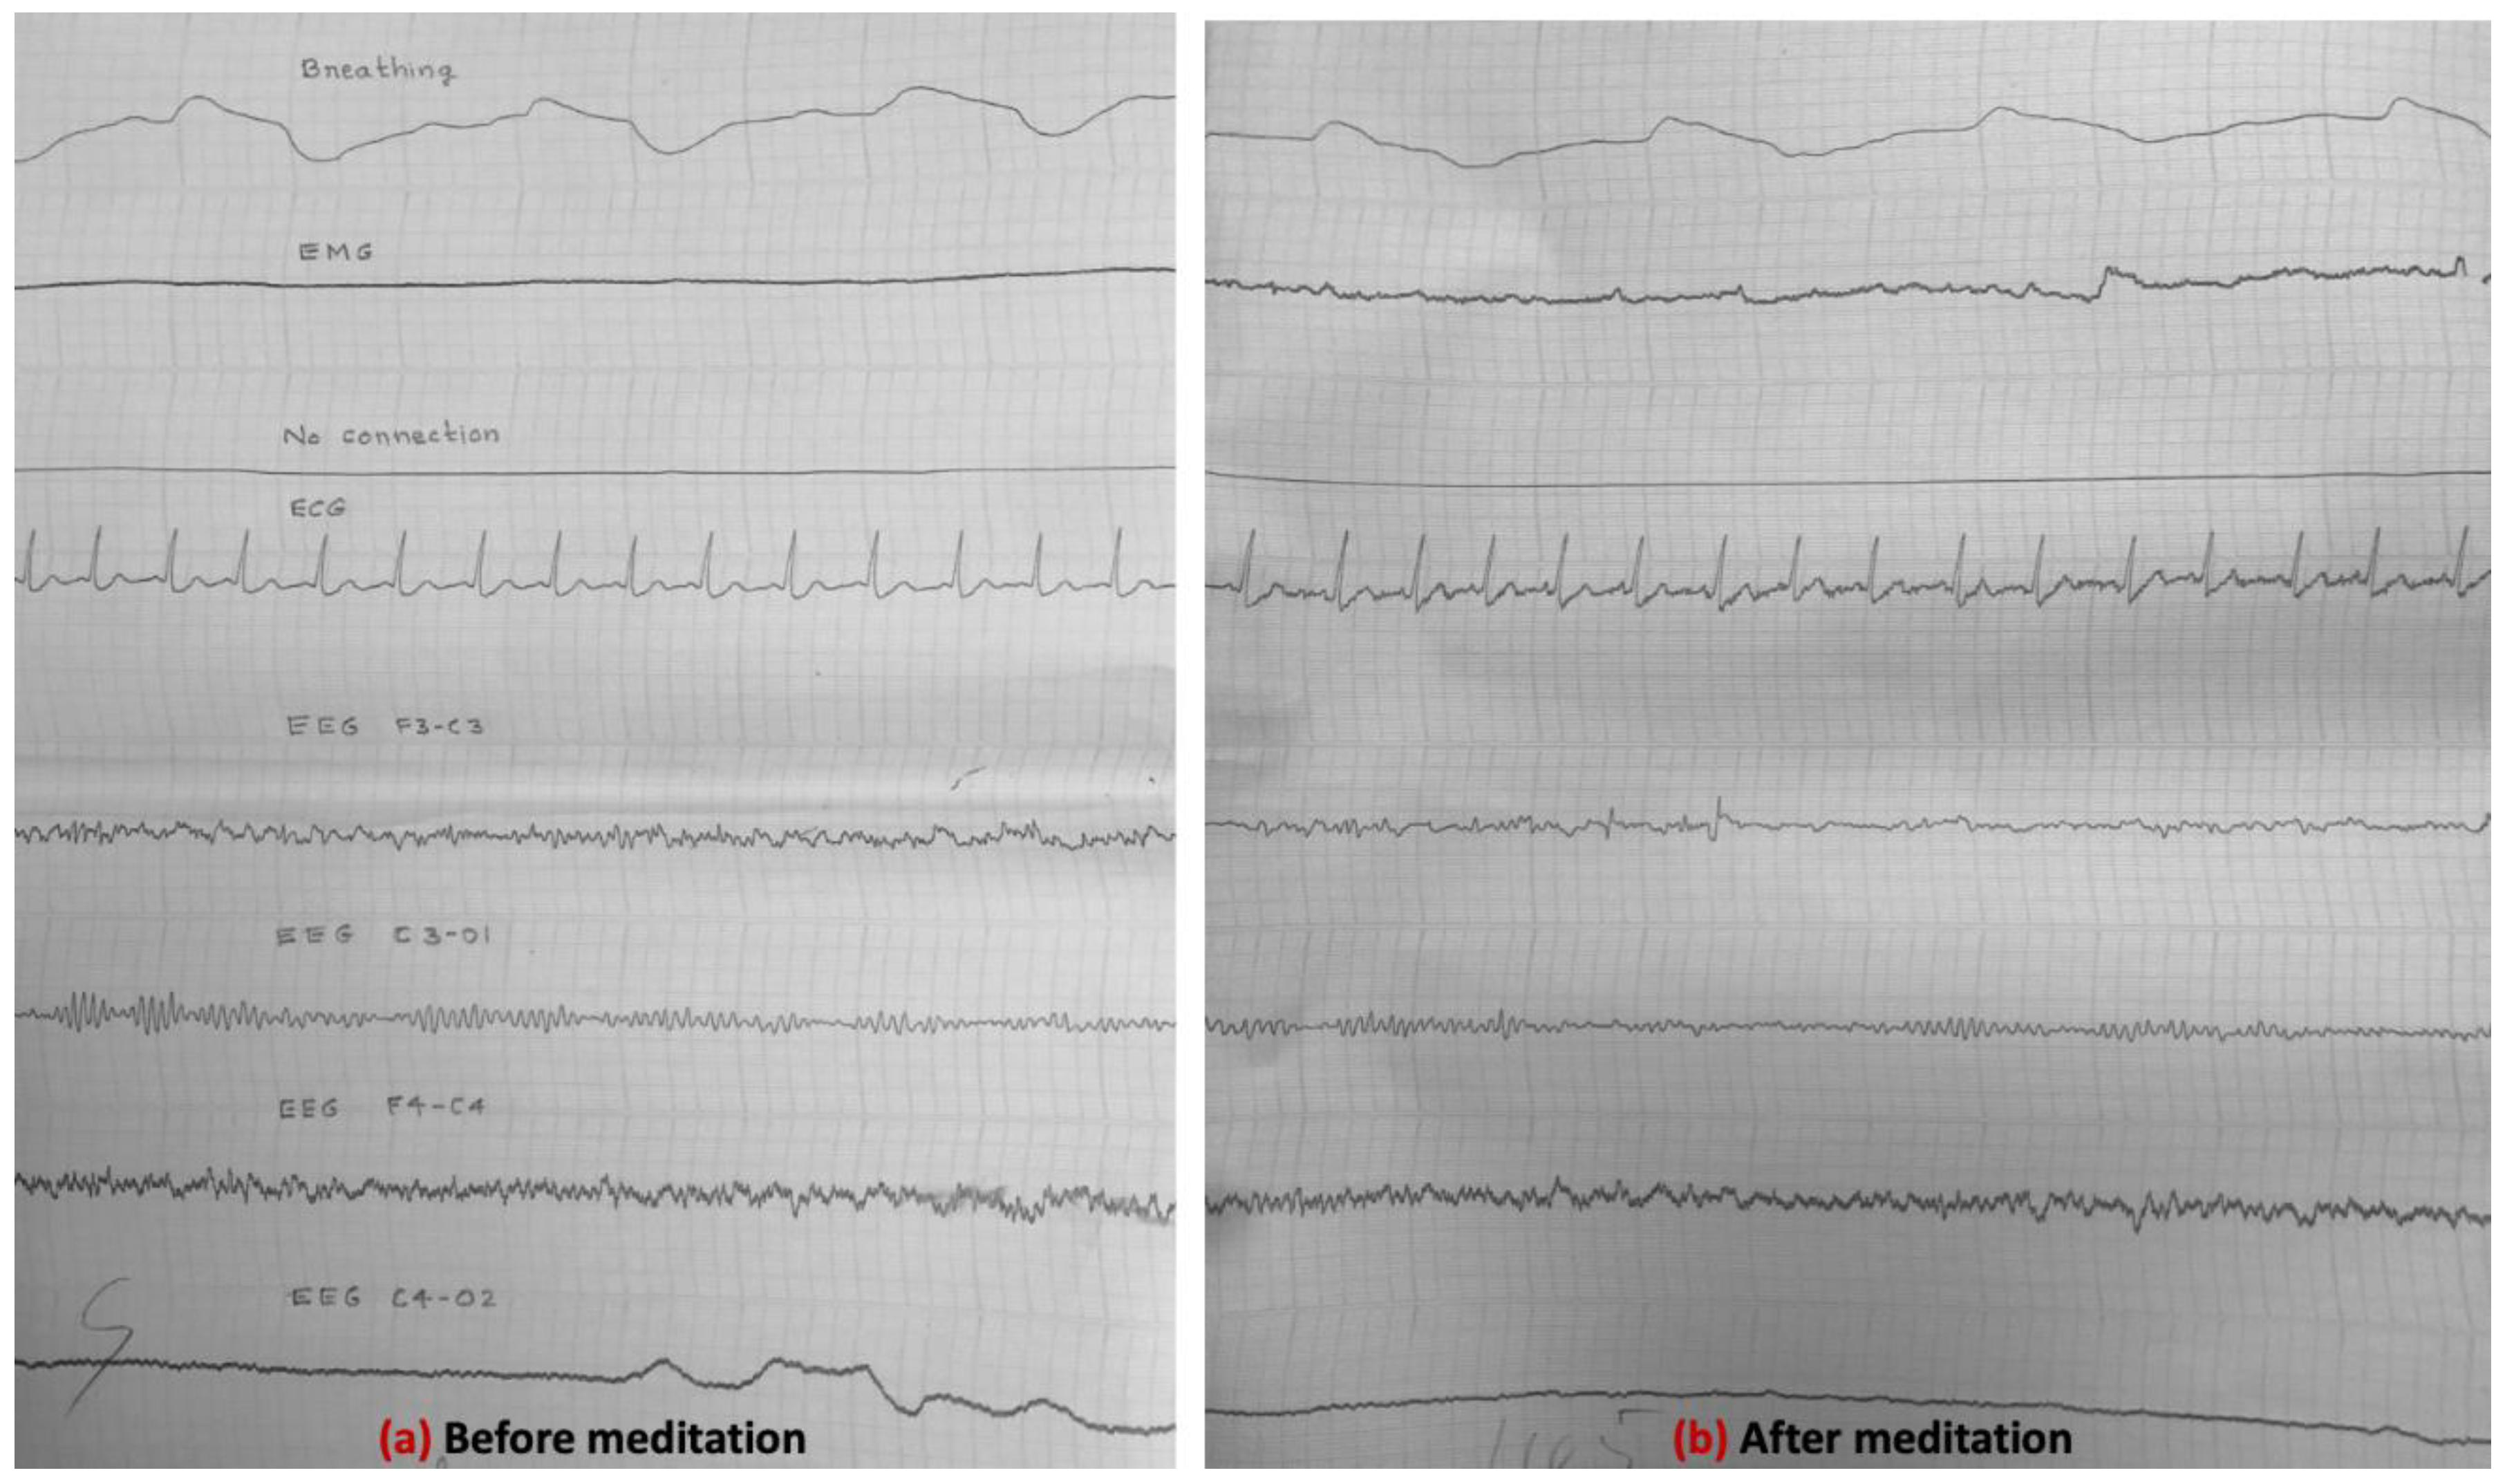
Disclaimer/Publisher’s Note: The statements, opinions and data contained in all publications are solely those of the individual author(s) and contributor(s) and not of MDPI and/or the editor(s). MDPI and/or the editor(s) disclaim responsibility for any injury to people or property resulting from any ideas, methods, instructions or products referred to in the content. |
© 2025 by the authors. Licensee MDPI, Basel, Switzerland. This article is an open access article distributed under the terms and conditions of the Creative Commons Attribution (CC BY) license (http://creativecommons.org/licenses/by/4.0/).
Copyright: This open access article is published under a Creative Commons CC BY 4.0 license, which permit the free download, distribution, and reuse, provided that the author and preprint are cited in any reuse.


