
Submitted:
23 April 2025
Posted:
24 April 2025
You are already at the latest version
Abstract
This research focused on studying the soil improvement ability provided by the roots of smooth cordgrass, Spartina alterniflora, flourishing in the dredged soil of the Sabine Refuge Marsh Creation Project in the coastal area of Louisiana, USA. Field vane shear tests were conducted to obtain the in-situ undrained shear strength of the soil vegetated with Spartina alterniflora. Direct shear tests were performed on undisturbed rooted soil samples to investigate the overall effect of roots on soil shear strength. Laboratory tensile tests were conducted on the roots of Spartina alterniflora to estimate their tensile strength. In this research, the W&W model and the fiber bundle model (FBM), were adopted and the modified ones were proposed to study the correlation between root-induced cohesion and nominal root tensile strength. The model outcomes were compared with field and laboratory measurements. The research results showed that the roots of Spartina alterniflora significantly increased soil shear strength, with an increase in cohesion of up to 130% at one location. The increases varied at different locations depending on the root area ratio (RAR), soil sample depth, and root tensile strength.
Keywords:
shear strength
; rooted soil
; field and lab test
; model
; Spartina alterniflora
; Louisiana wetland
1. Introduction
Louisiana’s coastal wetlands are vital for protecting coastal communities from storm surges and floods. They absorb wave energy, reduce the area of open water where winds can form, trap sediments, and act as natural sponges, helping to maintain shallow water depths (Abbott et al. 2022; Costanza et al. 2006; Day et al. 2004; Moeller et al. 1996; Wayne 1976). It’s estimated that one hectare of wetland in Louisiana provides an annual net benefit of about $1,749 (Costanza et al. 2008), which translates to roughly $450,000 per square mile (1 mi² = 2.58999 km²). These advantages make coastal wetlands a cost-effective and sustainable alternative to constructing barrier islands.
However, these wetlands are vanishing at an alarming rate, with an average loss of 16.57 ±3.26 square miles per year, equivalent to the area of an American football field (360 ft x 160 ft; 1 ft = 0.3048 m) every hour (Costanza et al. 2011). From 1932 to 2010, Louisiana lost 1,883 square miles of its coastal wetlands, representing a 25% reduction in the 1932 land area (Costanza et al. 2011). Projections estimate an additional loss of 513 square miles of Louisiana wetlands between 2000 and 2050 (Barras et al. 2009). A more recent study by Couvillion et al. (2017) indicated a slower rate of wetland loss, equivalent to one American football field of coastal wetland disappearing every 100 minutes. Mulhern (2021) from NASA compared images of Barataria Bay, one of Louisiana’s major bays, from 1985 to 2020, and noted a loss of a football field of land every 90 minutes, as reported by the USGS in 2011. According to Brasuell (2023), Louisiana has already lost 2,000 square miles of coastal land since 1932.
The significant loss of wetlands is driven by both human activities and natural processes. Human-induced factors include the construction of levees and floodways on the Mississippi (Barry 1997; Boesch et al. 1994; Day et al. 2000), dredging canals for drainage, logging, and activities related to the oil industry (Boesch et al. 1994; Day et al. 2000). Other contributing factors are land reclamation projects, rapid urbanization, and oil spill disasters (Crone and Tolstoy 2010; McNutt et al. 2012; Owens et al. 2011). Natural factors involve rapid subsidence, which is further worsened by oil and gas exploration (Dixon et al. 2006; Shinkle and Dokka 2004), rising sea levels (Kemp et al. 2011), saltwater intrusion, and the annual hurricanes that impact the coast (Day et al. 2007).
The 2017 Coastal Master Plan of Louisiana, developed by the Coastal Protection and Restoration Authority (CPRA), allocated $17.1 billion for marsh creation projects. These initiatives, along with other sediment diversion efforts, are expected to maintain or create approximately 800 square miles of land over the next 50 years (CPRA 2017). Marsh creation involves dredging and transporting sediments to designated areas where they are deposited, allowed to settle, and gradually stabilize. However, managing millions of cubic feet of sediment and the absence of older projects as benchmarks make it difficult to assess the success of these efforts. The resilience of the created marshland depends on the inherent shear strength of the dredged soil and the reinforcement provided by native vegetation that takes root. To ensure sustainable and resilient marshlands, it is essential to understand the strength contributions from both the soil and the vegetation. Therefore, studying the soil-binding capabilities of native vegetation, particularly Spartina alterniflora, on established dredged land along the Louisiana coast is both timely and necessary.
Vegetation plays a crucial role in slope stabilization and erosion control (Coppin and Richards 1990; Gray and Sotir 1996; Greenway 1987; Pollen and Simon 2005; Schmidt et al. 2001; Wu et al. 1979). As the need to reduce carbon footprints and reliance on man-made materials grows, bio-inspired anchors and deep foundations will likely receive greater attention in the future (Martinez and Frost, 2023). The strength of below-ground biomass, particularly vegetation roots, directly contributes to soil cohesion and increases the overall shear strength of the soil (Gray and Sotir 1996; Greenway 1987; Waldron 1977; Wu et al. 1979). Vegetation roots also serve as a physical barrier between soil and water, helping to stabilize tidal creeks (Mazda et al. 2007). Above-ground stems reduce water velocity, turbulence, and bed shear stress, which aids in settling and trapping sediments carried by flowing water (Cahoon et al. 1995; Christiansen et al. 2000; Costanza et al. 2006; Redfield 1972). Additionally, decaying plant matter contributes to peat formation, which enhances the vertical accretion rate of wetlands (Le Hir et al. 2000). Research by Shahriar et al. (2013, 2016) quantified the impact of Johnson grass roots on increasing resistance to surface erosion. They found that Johnson grass roots enhanced soil cohesion by approximately 102%, although their effect on the friction angle was minimal.
In this research, the soil reinforcement provided by the roots of the grass species Spartina alterniflora was studied. Vane shear tests were conducted to estimate the in-situ shear strength of the dredged soil. Direct shear tests were performed on both rooted and plain soil samples to estimate the root reinforcement coefficient (cR) for the soils. Soil samples were taken from three different layers, and for each layer, the values of cohesion and friction angle were estimated from the tests. Nominal tensile strength of different root samples was obtained from laboratory tensile tests, and these values were used to calculate cR in the analytical models.
Two different root reinforcement models were used to study the correlation between root-induced cohesion (cR) and nominal root tensile strength. The first model is a perpendicular root reinforcement model by (Wu et al. 1979), which assumes simultaneous mobilization of the tensile strength of all roots crossing the shear plane and presumes that all roots break at the same time. This model is referred to as the “W&W model” (Comino et al. 2010), where the first “W” refers to “Tien Wu (Wu et al. 1979)” and the second “W” refers to “Waldron L. J. (Waldron 1977),” two independent researchers.
The second model is the Rip-Root model by Pollen and Simon (2005), equivalent to the fiber bundle model (FBM), and is referred to as the FBM model hereafter. It assumes that, due to the varying tensile strength values of roots, they break at different points as load is applied to the rooted soil.
2. A Brief Description of the Shear Strength Models for Rooted Soils
Waldron (1977) applied the Mohr-Coulomb failure criterion to estimate the shear strength of rooted soils. He assumed that root reinforcement acts as an additional factor to the soil’s shear strength, extending the criterion as follows:
Here, cR represents the additional cohesion due to the presence of roots, while c is the cohesion of plain soil. Waldron (1977) modeled roots as cylindrical, flexible, and oriented perpendicularly to the slip plane. It was also assumed that, as the soil-root matrix begins to shear, the tensile strength of all roots is fully mobilized. This tensile strength is then resolved into a tangential component, which counteracts the shear force, and a normal component, which increases the confining pressure on the plane. The additional cohesion cR can be expressed as:
where tR is the tensile strength of the roots, and θ is the angle between the root and the direction of the shear plane. Wu et al. (1979) demonstrated that the term within the parentheses in Equation (2) varies between 1.0 kPa and 1.3 kPa for typical values of θ and ϕ, ranging from 40° to 90° and 25° to 40°, respectively. To simplify, Wu et al. (1979) substituted the term in the parentheses with a constant value of 1.2, reducing Equation (2) to:
where Tri is the tensile strength (tensile resistance per unit area) of individual root (i), and Ari is the total area occupied by root (i) in the considered area A of the soil cross-section shear plane. The term Ari/A represents the fraction of the cross-sectional area occupied by a single root (i), also known as the Root Area Ratio (RAR) of the single root (i). The variable n denotes the total number of roots in the considered soil cross-section. Equation (3) is used in this research to quantify the root reinforcement of Spartina alterniflora. The tensile strength Tr can be correlated with root diameter d using the power law equation given by Gray and Sotir (1996):
where α and β are empirical constants which vary with plant species.
Studies by Coppin and Richards (1990) demonstrated that the W&W model’s assumption of tensile failure as the sole failure mechanism for roots, without considering slip failure, significantly overestimates root reinforcement. Similarly, Pollen and Simon (2005) found that the tensile strength of all roots is not fully mobilized during soil shearing, further suggesting that the W&W model’s assumption of simultaneous tensile failure for all roots may substantially overestimate actual root reinforcement.
In response, Pollen and Simon (2005) proposed a new root reinforcement model called the Rip Root model, based on the traditional Fiber Bundle Model (FBM). This model assumes that the load is evenly distributed among all the roots in a bundle, and due to variations in tensile strength, roots fail at different times. When the applied load surpasses the strength of an individual root, the weakest root fails first, and the load is redistributed among the remaining intact roots. Complete failure occurs once all the roots in the bundle have been broken by the acting force. Cohen et al. (2011) derived analytical expressions for FBM, linking the pullout force to displacement.
Building on this, Karimi et al. (2022) investigated the role of white mangrove roots in coastal stabilization using three models: W&W, FBM, and Root Bundle Weibull (RBMw). Their findings indicated that the Root Volume Ratio (RVR) and the Number of Roots (NoR) decreased with distance from the tree stem, while root tensile forces increased with root diameter. Moreover, recent years have seen a surge in experimental, analytical, and numerical studies on the strength of vegetated/rooted soils based on these three models, leading to significant advancements in the field (Borga, 2019; Chakrabarti et al. 2021; Cronkite-Ratcliff et al. 2022; Hales 2018; Mao 2022; Meijer 2021; Phan et al. 2021; Ruiz et al. 2021; Spiekermann 2022).
3. Materials and Methodology
3.1. Subsurface Soils and Site Classification
Spartina alterniflora, commonly known as smooth cordgrass or saltmarsh cordgrass, is a dominant emergent grass species native to the Atlantic and Gulf coasts. This species typically thrives in low marsh areas of intertidal wetlands that are frequently flooded. Spartina alterniflora grows taller at the outer edges of marshes and shorter toward the interior, characterized by hollow stems, long tapered leaves, and dense rhizoidal root networks. This hardy plant is highly tolerant of salinity and can easily reproduce through seeds or its rhizoidal roots. The presence of aerial roots aids in oxygenation, allowing the plant to survive in highly hypoxic conditions (Anderson 1974). The use of Spartina alterniflora in marsh creation and restoration has been well-documented in numerous studies (Broome et al. 1988; Craft et al. 1999, 2003; Zedler 2000).
The Sabine Refuge Marsh Creation project (CS-28) was selected to investigate the soil-binding ability of Spartina alterniflora. This project is located northeast of the Sabine National Wildlife Refuge, south of Black Lake, and west of LA Highway 27 in Cameron Parish, Louisiana. The CS-28 project consists of five cycles, with only Cycle 1 (the oldest man-made marsh zone) and Cycle 3 selected for field testing and soil sampling as part of the Coastal Science Assistantship Program (CSAP)-funded project. Three cores were taken from Cycle 1 and three from Cycle 3.
Cycle 1 was completed in February 2002, creating 214 acres of marsh, while Cycle 3 was completed in March 2007, creating 232 acres. Both cycles involved dredging sediments from the Calcasieu River Ship Channel into the shallow open water area within retention dikes (Miller 2014). Spartina alterniflora was planted along the perimeters of both projects. The primary objectives were to prevent saltwater intrusion into the marshes, establish a new marsh ecosystem, and protect the marshes from erosion. A site visit was conducted in March 2017, during which in-situ tests were performed, and undisturbed soil samples were collected from three different locations within each cycle.
Hydraulically dredged soils were used to create the artificial marshlands. These marsh soils are a complex mixture of sand, silt, and clay, which makes it challenging to categorize them into stable combinations. The earth materials at the marsh creation sites primarily consist of very soft to soft clays, with varying depths of organic material below the mud line. Additionally, silt, sand, and shell deposits are present within many of the clay layers, and sand and silty sand layers can be found at varying depths.
The top layer typically consists of very soft to soft fat clay (CH) at depths ranging from 8 to 15 feet. This layer usually overlies a stratum of sandy clay (CL), clayey sand (SC), or lean clay (CL) (Quilichin and Woodward, 2020). Along the coastline, the very soft to soft fat clay (CH) layer can reach a thickness of up to 60 feet. Below a depth of approximately 12 feet, the soil becomes slightly more competent and potentially weathered (oxidized). The physical properties of the marsh clay in coastal areas are summarized in Table 1, based on laboratory data from multiple CPRA projects (Apu et al., 2021).
According to the data, soils in the marsh creation areas in coastal Louisiana can be classified as medium to highly plastic. As per the Unified Soil Classification System (USCS), most of the soils are classified as CL, CH, SM, SC, and PT (Howard 1984).
3.2. The Direct Shear Tests
Consolidated drained direct shear tests were conducted on the undisturbed soil samples obtained from the site using an ELE International direct shear test machine, following ASTM D3080 standards. Since root reinforcement varies with depth, the soil samples were categorized based on their depths: Layer 1 (0-8 cm), Layer 2 (8-16 cm), and Layer 3 (16-24 cm). Below a depth of 24 cm, there were very few live roots in the soil samples. Laboratory observations revealed that most of the few dead roots had nearly decomposed and had minimal impact on the soil’s shear strength. Therefore, soil samples collected below a depth of 24 cm were classified as belonging to the “plain-soil layer.”
A total of twenty-four soil specimens were prepared for direct shear tests, with twelve specimens taken from Cycle 1 and twelve from Cycle 3. For each layer, at least three specimens from the same core were tested to determine shear strength parameters: cohesion (c) and angle of friction (ϕ). During the consolidation stage, three different normal pressures—5 kPa, 11 kPa, and 19 kPa—were selected to cover the range of overburden pressures corresponding to the soil samples in the marsh ground. To maintain drained conditions, a small controlled horizontal load corresponding to a strain rate of 0.1 mm/min was applied to the upper half of the shear box using a motor and gear arrangement. For each soil layer, a minimum of three valid tests were performed. The peak shear stress and corresponding normal stress were used to plot a graph of shear strength versus normal stress (τ vs. σ) for each layer.
3.3. The Tensile Strength Tests of the Roots
The root system of Spartina alterniflora was found to be adventitious, comprising thicker underground stems (rhizomes) and thinner fibrous roots. Rhizomes were observed at shallow depths, with their diameters decreasing as they extended deeper into the soil. Shoots and adventitious roots emerged from the rhizome nodes. Despite appearing as distinct individuals above ground, the plants remained interconnected by these underground rhizomes. The adventitious roots grew almost perpendicularly from the rhizomes, forming a dense mesh at shallow depths. Unlike the rhizomes, these roots had fine root hairs and could penetrate deeper into the soil.
The root system was classified into three major types based on diameter: R1, R2, and R3, with average diameters of 4.57 mm, 2.54 mm, and 0.76 mm, respectively. The diameter of each root specimen was measured at the midpoint of the root segment and at both ends using electronic slide calipers with a 0.01 mm resolution.
Since tensile strength varies with moisture content, all roots were immersed in water for 24 hours before testing to ensure uniformity. A significant challenge during the tensile tests was managing the clamping ends of each root specimen. Roots could easily slip out or break at the clamping points, leading to erroneous data and wastage of valuable root specimens. After testing several methods, two arrangements were finalized: the Grip Arrangement (GA) and the Hook Arrangement (HA), both illustrated in Figure 1. The GA used pneumatic grips to hold and pull the roots at both ends. To prevent slipping and protect the roots from being crushed by the pneumatic grips, the root ends were coated with hot glue. The HA used hooks to pull the roots, with the ends also secured by hot glue.
All tensile strength tests for the roots of Spartina alterniflora were conducted using the ADMET eXpert 2611 universal tensile testing equipment at Louisiana Tech University. The root samples were tested at a pulling rate of 0.10 in/min (2.54 mm/min) using a servo-controlled tensile testing machine equipped with a load cell (50 lbf or 222 N) sensitive to two decimal places. Each root specimen was cut to a uniform length of 50.8 mm (2 inches), with a consistent distance of 25.4 mm maintained between the two pneumatic grips or hooks.
For both arrangements, a test was deemed invalid if failure occurred at either of the clamping ends, to eliminate the influence of hot glue on the root tensile strength. After several tests, a total of thirteen valid results were obtained. The Grip Arrangement (GA) was employed to test root type R1, which had larger diameters, while the Hook Arrangement (HA) was used for root types R2 and R3, which had relatively smaller diameters.
3.4. The Vane Shear Tests in the Field
Field tests to determine the undrained shear strength of rooted soils were conducted using the Vane Tester VT12 by Pagani Geotechnical Equipment. A vane with a diameter of 30 mm and a height of 60 mm was selected for the tests. Testing was carried out at three different locations in both Cycle 1 and Cycle 3, following the ASTM D2573 (2011) standard to determine the peak undrained shear strength. The tests were performed to a depth of 40 cm, based on the assumption that this is the maximum depth the roots of Spartina alterniflora could reach. Vertical profiles of vane shear strength distribution were created in 10 cm increments at each testing location. To account for factors such as anisotropy, strain effects, and disturbance, the measured undrained shear strength was corrected as recommended by Bjerrum (1972).
4. Results and Discussion
4.1. The Direct Shear Test Results
For the marsh creation zone of Cycle 1, Figure 2 (a through c) illustrates the stress-strain curves under normal stresses of 5 kPa, 11 kPa, and 19 kPa, respectively. The plot of normal stress versus shear strength is presented in Figure 3(a). As shown in Table 2, the highest and lowest cohesion values were found to be 5.51 kPa for ‘Layer 1’ and 2.48 kPa for the plain soil layer, respectively. The results revealed that peak shear strength increased in all rooted soil samples compared to the plain soil. Additionally, peak shear strength was found to decrease with depth. Roots increased the cohesion of the reinforced soils by approximately 130% for Layer 1, 70% for Layer 2, and 12.5% for Layer 3.
The data in Table 2 indicated a significant influence of root reinforcement up to a depth of 24 cm, beyond which there was a negligible increase in cohesion or friction angle. These findings differ slightly from the conclusions of Wu et al. (1979), who suggested that roots had no influence on the soil’s friction angle. Figure 3(a) and Table 2 summarize the results from the direct shear tests for Cycle 1, showing that both cohesion and friction angles decrease with soil depth. Comparing the three selected shear stress-strain curves presented in Figure 2, it is evident that plain soil is the most ductile, and root reinforcement has enhanced the shear modulus of the soils. As shown in Table 2, the friction angles (ϕ) of the three soil layers increased significantly due to root reinforcement.
Similarly, Figure 4 (a through c) presents the results from the direct shear tests conducted on soil samples from Cycle 3. These figures show three selected shear stress-shear strain curves for normal stresses of 5 kPa, 11 kPa, and 19 kPa, respectively. As shown in Table 2, the highest cohesion value was 4.94 kPa for Layer 1, while the lowest value of 2.14 kPa was observed in the plain soil layer. Notably, the cohesion of the plain soil layer in Cycle 3 was comparable to that in Cycle 1. Once again, peak shear strength was higher in all rooted soil layers. Figure 3(b) illustrates that the Mohr-Coulomb failure envelope gradually flattened from Layer 1 to the plain soil layer. Cohesion in the rooted soil increased by approximately 127% in Layer 1, 124% in Layer 2, and showed minimal increase in Layer 3.
The results indicated a significant influence of root reinforcement up to a depth of 16 cm, after which there was little to no increase in cohesion. This contrasts with the findings from Cycle 1, where the influence on cohesion extended through all three layers. This suggests that root reinforcement penetrated deeper in Cycle 1 than in Cycle 3, likely due to the earlier establishment of the marshland in Cycle 1. Additionally, shear stiffness increased due to vegetation roots, following the same pattern observed in the Cycle 1 soil samples.
4.2. The Vane Shear Test Results
Vane shear tests were conducted on the created marshland in both Cycles 1 and 3. The land was frequently flooded by tides and the soils were classified as clay with high plasticity (CH) based on the United Soil Classification system as described in Section 3.1. The resulting corrected undrained shear strength profiles of the soils at different locations are shown in Figure 5.
The undrained shear strength (Su) of the soils was highest at the ground surface and gradually decreased with depth. Overall, Su values were highest in Cycle 1 and lowest in Cycle 3. At the top layer, Su ranged from 6.82 to 10.45 kPa, attributed to the significant root reinforcement provided by the dense concentration of rhizomes and adventitious roots near the surface. As depth increased to 10 cm, Su decreased notably to a range of 5.50 to 7.50 kPa, reflecting the reduction in root density with depth. Between 10 and 20 cm, Su values continued to decline slightly across most testing stations, ranging from 5.45 to 6.36 kPa.
At depths between 30 and 40 cm, Su values were relatively consistent, largely due to the minimal presence of roots in this zone. The lowest Su values were observed at a depth of 40 cm, ranging from 3.18 to 4.54 kPa.
4.3. The Tensile Test Results
The original tension test data for root types ‘R1,’ ‘R2,’ and ‘R3’ are presented in Figure 6, Figure 7 and Figure 8, where tensile load is plotted against percentage deformation (tensile strain). Given that a single root exhibits different diameters at its ends and midpoint, plotting load against percentage deformation provides a more meaningful analysis. Among the three root types, root type ‘R1,’ with an average diameter of 4.741 mm (0.19 inches), withstood the highest peak load at failure, ranging from 28.169 N to 42.658 N. Root type ‘R2,’ with an average diameter of 2.54 mm (0.1 inch), supported peak loads ranging from 9.520 N to 16.590 N. Root type ‘R3,’ with the smallest average diameter of 0.767 mm (0.03 inch), bore the lowest peak load, ranging from 5.429 N to 8.767 N. The peak loads at root failure varied significantly.
One of the research objectives was to identify the pattern of root tensile strength relative to different root diameters. To do this, the tensile strength for each root was calculated based on its original cross-sectional area, and the results were averaged to determine the nominal tensile strength for each root type, as shown in Table 3. The data clearly indicate an inverse relationship between root diameter and tensile strength: smaller diameter roots exhibited higher tensile strength, aligning with the findings of Shahrier et al. (2016). The nominal tensile strengths were 2.20 MPa for root type R1, 2.65 MPa for root type R2, and 15.62 MPa for root type R3, as shown in Table 3.
The ratio of root area ratio (RAR) was also calculated using the average diameter of each root type, ensuring consistency between the RAR and tensile strength values in Equation (3). Figure 9 illustrates an exponential increase in nominal root tensile strength as root diameter decreases. Notably, the tensile strength of smaller diameter roots exhibited greater variability compared to that of larger diameter roots. Using the data from Figure 9 and Equation (4), the values of the parameters α and β were calculated to be 10.102 and 1.22, respectively. These values provide a basis for the preliminary estimation of the tensile strength of Spartina alterniflora based on root type and diameter.
4.4. Calculations of the Root Area Ratio (RAR)
To measure the root area ratio (RAR), representative soil samples from each layer were taken from three separate cores with a diameter of 63.5 mm and then air-dried. After drying, the samples were extracted from the cores, split in the middle, and the roots were counted for each root type. The RAR was calculated as the ratio of the total root area to the total cross-sectional area of the soil core, using the average diameter of each root type.
Consistent with previous studies (Greenway 1987; Schmidt et al. 2001), the RAR values for Spartina alterniflora samples decreased with depth at all sampling locations. The number of roots, as well as their average diameter, also decreased with depth, as shown in Table 4. In Cycle 1, the RAR value ranged from 0.07 (7.0%) in Layer 1 (0-8 cm) to 0.03 (3.0%) in Layer 3 (16-24 cm). In contrast, Cycle 3 exhibited slightly lower RAR values, ranging from 0.07 (7.0%) in Layer 1 (0-8 cm) to 0.0 (0.0%) in Layer 3 (16-24 cm). This difference is likely due to the younger age of the marshland in Cycle 3 compared to Cycle 1.
4.5. The W & W and FBM Models
To establish a modified W & W model for the rooted soils at the CS-28 project, root-induced cohesion (cR) for each layer was calculated based on the direct shear test results. This involved subtracting the cohesion of the plain soil layer from the cohesion of the rooted soil at the corresponding layer, as determined from the direct shear tests. The resulting values of cR for different layers are presented in the fourth column from the right in Table 4. Additionally, cR was calculated for each layer using the W & W model, as expressed in Equation (3) (column six), and the FBM model, following the flowchart provided by Pollen and Simon (2005) (column five). For simplicity, a value of 1.2 was used in the FBM model to streamline Equation (3).
Root-induced cohesion (cR) was observed to decrease from Layer 1 to Layer 3. In Cycle 1, cR values ranged from 54.97 kPa to 13.79 kPa using the W & W model and from 49.65 kPa to 13.58 kPa using the FBM model. In Cycle 3, cR values ranged from 48.07 kPa to 10.19 kPa with the W & W model and from 27.16 kPa to 10.87 kPa with the FBM model. Both models significantly overestimated the root reinforcement coefficient compared to the cR values obtained from the direct shear tests.It is assumed that the direct shear tests provided accurate values for root-induced cohesion (cR). The ratio of the actual root-reinforced cohesion (cR) obtained from these tests to the term in Equation (3) was computed for each rooted soil layer at every sampling station. The average of these ratios across different sampling locations at the CS-28 project site was found to be 0.058. Consequently, Equation (3) can be re-written as Equation (5), referred to as the modified W&W model for the CS-28 marsh creation project. The coefficient 0.058 in Equation (5) adjusts the root reinforcement coefficient of 1.2 proposed by Wu et al. (1979) to better fit the conditions of Spartina alterniflora growing in the dredged soils of the CS-28 project. This modified equation provides a valuable tool for the preliminary estimation of vegetated soil shear strength in coastal marshes:
where is the root area ratio RAR for individual root (i).
Analysis of Table 4 reveals that while the root-induced cohesion (cR) from the FBM model is closer to the direct shear test values compared to the W & W model, both models still significantly overestimate the impact of root reinforcement. The ratio of cR between the FBM and W & W models ranged from 0.52 to 1.07.
Several factors contribute to the inaccuracies of these models. Although both models incorporate root tensile strength and consider root diameter as a factor in soil reinforcement, they do not account for the slipping effect between the soil and roots, leading to incomplete mobilization of root tensile strength. Additionally, challenges in accounting for root orientation relative to the failure plane and the distortion angle of sheared roots contribute to model inaccuracies. The variability in root diameter measurements, particularly for smaller roots, increases errors in estimating the root area ratio (RAR) and the corresponding tensile strength from peak loads.
Furthermore, the models primarily consider roots as stretched cables, neglecting their bending and compression strengths (Mao et al. 2014). Additionally, coastal soils experience various forces, including torques during hurricanes, such as twisting, which current models do not adequately address.
5. Conclusions
The study of vegetated soil reinforcement is intricate, involving multiple interacting factors. Laboratory and in-situ tests on rooted soil samples at the CS-28 marsh creation project, managed by CPRA, highlighted the significant role of Spartina alterniflora roots in improving the shear strength of the dredged soil. Direct shear tests revealed that root reinforcement effects diminish with depth across all sampling stations. In Cycle 1, the presence of Spartina alterniflora roots enhanced soil cohesion by approximately 130% in Layer 1 (0-8 cm), 70% in Layer 2 (8-16 cm), and just 12.5% in Layer 3 (17-24 cm). For Cycle 3, the increase in soil cohesion due to root reinforcement was about 127% for Layer 1, 124% for Layer 2, and nearly negligible for Layer 3.
Vane shear test results demonstrated a consistent decrease in both undrained shear strength (Su) and root area ratio (RAR) with increasing depth at all six sampling locations in Cycles 1 and 3. The undrained shear strength was highest in the top layer, ranging from 6.82 kPa to 10.45 kPa, and lowest at a depth of 40 cm, where it ranged from 3.18 kPa to 4.54 kPa.
These findings underscore the significant impact of roots on the undrained shear strength of rooted soils. While tensile tests showed that larger diameter roots supported higher peak loads, smaller diameter roots exhibited relatively higher tensile strengths, aligning with the observations of Shahrier et al. (2016).
The research led to the development of a modified W&W model with a root-induced cohesion coefficient of 0.058, significantly lower than the previously proposed value of 1.2 by Wu et al. (1979). This modified model provides a useful tool for estimating the root-induced soil cohesion of Spartina alterniflora at project CS-28. Findings from in-situ vane shear tests, laboratory direct shear tests, and analytical models consistently demonstrated that Spartina alterniflora roots contribute significantly to soil reinforcement, enhancing the shear strength of coastal soils. These results highlight the potential of Spartina alterniflora as an effective soil reinforcement asset for newly created dredged lands in coastal Louisiana.
The study also recommends that root reinforcement be more accurately measured through in-situ direct shear tests or using large-scale direct shear machines in the laboratory to accommodate large-rooted samples. Additionally, sampling soil and root specimens across different seasons is advised to achieve a more comprehensive evaluation of the reinforcement effect provided by vegetation.
Acknowledgments
The authors greatly appreciate the support of CSAP of Louisiana Sea Grant. The first two authors also would like to thank the extensive support from CPRA personnel at Baton Rouge and Lafayette, Louisiana, with special thanks to Mike Miller for his leading roles and guidance in the field trip and tests.
References
- Abbott: K. M., Quirk, T., and Fultz, L. M. (2022). Soil microbial community development across a 32-year coastal wetland restoration time series and the relative importance of environmental factors. Science of The Total Environment, 821, 153359. [CrossRef]
- Anderson, C. E. (1974). “Review of structure in several North Carolina salt marsh plants.” In R. J. Reimold and W. H. Queen (eds.), Ecology of Halophytes, Academic Press, New York, 307-344.
- Apu, O. S., Wang, J. X., Sarker, D. (2021). “Evolution of Large-Strain One-Dimensional Consolidation Test for Louisiana Marsh Soil.” International Foundation Congress and Equipment Expo, May 10-14, 2021, Dallas, Texas, http://ifceexpo.com.
- ASTM D2573. (2011). “Standard Test Method for Field Vane Shear Test in Saturated Fine-Grained Soils.” ASTM International, West Consohocken, PA.
- ASTM D3080. (2011). “Standard Test Method for Direct Shear Test of Soils Under Consolidated Drained Conditions.” ASTM International, West Consohocken, PA.
- Barras, J. A. (2009). Land area change, and overview of major hurricane impacts in coastal Louisiana, 2004-08. US Department of the Interior, US Geological Survey.
- Barry, J. M. (1997). Rising tide: the great Mississippi flood of 1927 and how it changed America. Simon and Schuster, New York.
- Boesch, D. F., Josselyn, M. N., Mehta, A. J., Morris, J. T., Nuttle, W. K., Simenstad, C. A., and Swift, D. J. (1994). “Scientific assessment of coastal wetland loss, restoration and management in Louisiana.” Journal of Coastal Research, 1–103.
- Borga, M. (2019). “Hazard assessment and forecasting of landslides and debris flows: A case study in Northern Italy.” In V. M. Maggioni (Ed.), Extreme Hydroclimatic Events and Multivariate Hazards in a Changing Environment (pp. 343-367). Chennai, India: Elsevier. [CrossRef]
- Bourne, J. (2000). “Louisiana’s vanishing wetlands: Going, going...” Science, 289(5486), 1860–1863.
- Broome, S. W., Seneca, E. D., and Woodhouse, W. W. (1988). “Tidal salt marsh restoration.” Aquatic Botany, 32(1–2), 1–22.
- Brasuell,J. (2023, January 20). $50 Billion Coastal Master Plan Updated in Louisiana. Retrieved from Planetizen: https://www.planetizen.com/news/2023/01/121104-50-billion-coastal-master-plan-updated-louisiana.
- Cahoon, D. R., Reed, D. J., and Day Jr, J. W. (1995). “Estimating shallow subsidence in microtidal salt marshes of the southeastern United States: Kaye and Barghoorn revisited.” Marine geology, 128(1–2), 1–9.
- Chakrabarti, B. K., Soumyajyoti Biswa, S., & Pradhan, S. (2021). Cooperative Dynamics in the Fiber Bundle Model. Frontiers in Physics, Volume 8 (February), 613392. [CrossRef]
- Christiansen, T., Wiberg, P. L., and Milligan, T. G. (2000). “Flow and sediment transport on a tidal salt marsh surface.” Estuarine, Coastal and Shelf Science, 50(3), 315–331.
- Cohen, D., Schwarz, M., & Or, D. (2011, August). “An analytical fiber bundle model for pullout mechanics of root bundles.” Journal of Geophysical Research Atmospheres, 116, F03010. [CrossRef]
- Comino, E., Marengo, P., and Rolli, V. (2010). “Root reinforcement effect of different grass species: A comparison between experimental and models results.” Soil and Tillage research, 110(1), 60–68.
- Coppin, N. J., and Richards, I. G. (1990). Use of vegetation in civil engineering. Construction Industry Research and Information Association London.
- Costanza, R., Mitsch, W. J., and Day, J. W. (2006). “A new vision for New Orleans and the Mississippi delta: applying ecological economics and ecological engineering.” Frontiers in Ecology and the Environment, 4(9), 465–472.
- Costanza, R., Pérez-Maqueo, O., Martinez, M. L., Sutton, P., Anderson, S. J., and Mulder, K. (2008). “The value of coastal wetlands for hurricane protection.” AMBIO: A Journal of the Human Environment, 37(4), 241–248.
- Couvillion, B. R., Barras, J. A., Steyer, G. D., Sleavin, W., Fischer, M., Beck, H., Trahan, N., Griffin, B., and Heckman, D. (2011). Land area change in coastal Louisiana (1932 to 2010), US Department of the Interior, US Geological Survey.
- Couvillion, B. R., Beck, H., Schoolmaster, D., and Fischer, M. (2017). Land area change in coastal Louisiana (1932 to 2016), Scientific Investigations Map, Report, Reston, VA.
- CPRA. (2017). Louisiana’s comprehensive master plan for a sustainable coast. Coastal Protection and Restoration Authority, Baton Rouge, LA.Craft, C., Megonigal, P., Broome, S., Stevenson, J., Freese, R., Cornell, J., Zheng, L., and Sacco, J. (2003). “The pace of ecosystem development of constructed Spartina alterniflora marshes.” Ecological Applications, 13(5), 1417–1432.
- Craft, C., Reader, J., Sacco, J. N., and Broome, S. W. (1999). “Twenty-five years of ecosystem development of constructed Spartina alterniflora (Loisel) marshes.” Ecological Applications, 9(4), 1405–1419.
- Crone, T. J., and Tolstoy, M. (2010). “Magnitude of the 2010 Gulf of Mexico oil leak.” Science, 330(6004), 634–634.
- Cronkite-Ratcliff, C., Schmidt, K. M., and Wirion, C. (2022). “Comparing Root Cohesion Estimates from Three Models at a Shallow Landslide in the Oregon Coast Range.” Geohazards, 3(3), 428-451. [CrossRef]
- Day, J. W., Boesch, D. F., Clairain, E. J., Kemp, G. P., Laska, S. B., Mitsch, W. J., Orth, K., Mashriqui, H., Reed, D. J., and Shabman, L. (2007). “Restoration of the Mississippi Delta: lessons from hurricanes Katrina and Rita.” Science, 315(5819), 1679–1684.
- Day, J. W., Britsch, L. D., Hawes, S. R., Shaffer, G. P., Reed, D. J., and Cahoon, D. (2000). “Pattern and process of land loss in the Mississippi Delta: a spatial and temporal analysis of wetland habitat change.” Estuaries and Coasts, 23(4), 425–438.
- Day, J. W., Ko, J.-Y., Rybczyk, J., Sabins, D., Bean, R., Berthelot, G., Brantley, C., Cardoch, L., Conner, W., and Day, J. N. (2004). “The use of wetlands in the Mississippi Delta for wastewater assimilation: a review.” Ocean & Coastal Management, 47(11–12), 671–691.
- Dixon, T. H., Amelung, F., Ferretti, A., Novali, F., Rocca, F., Dokka, R., Sella, G., Kim, S.-W., Wdowinski, S., and Whitman, D. (2006). “Space geodesy: Subsidence and flooding in New Orleans.” Nature, 441(7093), 587–588.
- Gray, D. H., and Sotir, R. B. (1996). Biotechnical and soil bioengineering slope stabilization: a practical guide for erosion control. John Wiley & Sons.
- Greenway, D. R. (1987). “Vegetation and slope stability”, In Slope Stability, Anderson MG, Richards KS (eds). John Wiley & Sons: Chichester; 187-230. 187-230.
- Hales, T. C. (2018). “Modelling biome-scale root reinforcement and slope stability: Biome driven root reinforcement change.” Earth Surface Processes and Landforms, 43(10), 2157-2166. [CrossRef]
- Howard, A. K. (1984). “The revised ASTM standard on the unified classification system.” Geotechnical Testing Journal, ASTM International, 7(4), 216–222.
- Karimi, Z., Abdi, E., Deljouei, A., Cislaghi, A., Shirvany, A., Schwarz, M., & Hales, T. C. (2022). “Vegetation-induced soil stabilization in coastal area: An example from a natural mangrove forest.” Catena, 216, Part B, 106410. [CrossRef]
- Kemp, A. C., Horton, B. P., Donnelly, J. D., Mann, M. E., Vermeer, M. and Rahmstorf, S. (2011). “Climate related sea-level variations over the past two millennia.” Proceedings of the National Academy of Sciences 108, 11017-11022.
- LDNR. (2010). (Louisiana Department of Natural Resources). Selected Louisiana Energy Statistics, Louisiana Energy Topic, Technology Assessment Division 2010, Baton Rouge, LA.
- Le Hir, P., Roberts, W., Cazaillet, O., Christie, M., Bassoullet, P., and Bacher, C. (2000). “Characterization of intertidal flat hydrodynamics.” Continental shelf research, 20(12), 1433–1459.
- Mao,Z. (2022). “Root reinforcement models: classification, criticism and perspectives.” Plant and soil, 472 (1-2), 17-28.
- Mao, Z., Yang, M., Bourrier, F., and Fourcaud, T. (2014). “Evaluation of root reinforcement models using numerical modelling approaches.” Plant and soil, 381(1–2), 249–270.
- Martinez, A., Frost, J. D. (2023, August/September). “How nature inspires development and field development of novel geotechnical solutions.” Geostrata, 27(4), pp. 30-38.
- Mazda, Y., Wolanski, E., and Ridd, P. (2007). The role of physical processes in mangrove environments: manual for the preservation and utilization of mangrove ecosystems. Terrapub,Tokyo, 598 pp.
- McNutt, M. K., Camilli, R., Crone, T. J., Guthrie, G. D., Hsieh, P. A., Ryerson, T. B., Savas, O., and Shaffer, F. (2012). “Review of flow rate estimates of the Deepwater Horizon oil spill.” Proceedings of the National Academy of Sciences, 109(50), 20260–20267.
- Meijer, G. (2021). “A generic form of fibre bundle models for root reinforcement of soil.” Plant and Soil, 468(1-2), 1-21. [CrossRef]
- Miller, M. (2014). “Operations, maintenance and monitoring report for Sabine Refuge Marsh Creation Project (CS-28), Coastal Protection and Restoration Authority of Louisiana “. Coastal Protection and Restoration, Lafayette, Louisiana.
- Moeller, I., Spencert, T., and French, J. (1996). “Wind wave attenuation over saltmarsh surfaces: preliminary results from Norfolk, England.” Journal of Coastal Research, 1009–1016.
- Mulhern, O. (2021, January 21). NASA Imagery: Louisiana is Losing its Coastline. Retrieved from EARTH.ORG: https://earth.org/data_visualization/louisiana-shrinking-coastline/.
- Owens, E. H., Santner, R., Cocklan-Vendl, M., Michel, J., Reimer, P. D., and Stong, B. (2011). “Shoreline treatment during the Deepwater Horizon-Macondo response.” International Oil Spill Conference Proceedings (IOSC), (Vol. 2011, No. 1, p. abs271), American Petroleum Institute.
- Phan, T. N., Likitlersuang, S., Kamchoom, V., & Leung, A. (2021).” Root biomechanical properties of Chrysopogon zizanioides and Chrysopogon nemoralis for soil reinforcement and slope stabilisation.” Land Degradation and Development, 32(16), 4624-4636.
- Pollen, N., and Simon, A. (2005). “Estimating the mechanical effects of riparian vegetation on stream bank stability using a fiber bundle model.” Water Resources Research, 41(7).
- Quilichin, G. F. S., and Woodwad M. L. (2020). Draft Geotechnical Data Report Field and Laboratory Services—Borrow Area Investigation No Name Bayou Marsh Creation & Nourishment (CS-0078), Cameron Parish, Louisiana, ARDAMAN & ASSOCIATES, INC., Baton Rouge, Louisiana.
- Reed, D. J., and Wilson, L. (2004). “Coast 2050: A new approach to restoration of Louisiana coastal wetlands.” Physical Geography, 25(1), 4–21.
- Ruiz, S., Fletcher, D. M., Williams, K., and Roose, T. (2021). “Review of plant-soil modelling: root growth, nutrient and water transport/uptake, and mechanics.” Annual Plant Reviews online, 4(1). Retrieved from. [CrossRef]
- Schmidt, K. M., Roering, J. J., Stock, J. D., Dietrich, W. E., Montgomery, D. R., and Schaub, T. (2001). “The variability of root cohesion as an influence on shallow landslide susceptibility in the Oregon Coast Range.” Canadian Geotechnical Journal, 38(5), 995–1024.
- Shahriar, M. M., Wang, J. X., Alam, S., and Patterson, W. B. (2016). “Soil-binding ability of vegetation roots in enhancing erosion resistance of a shallow slope.” International Journal of Geotechnical Engineering, 10(4), 409–417.
- Shahriar, M. M., Wang, J. X., and Patterson, W. B. (2013). “Contribution of Shrub Roots on Enhancement of Slope and Embankment Stability in the Coastal Area of Louisiana”, Geo-Congress 2013, San Diego, CA, March 3-6, 2013 , Geotechnical Special Publication, GSP 231, pp. 1339-1348.
- Shinkle, K. D., and Dokka, R. K. (2004). Rates of vertical displacement at benchmarks in the lower Mississippi valley and the northern Gulf Coast. US Department of Commerce, National Oceanic and Atmospheric Administration, National Ocean Service, National Geodetic Survey.
- Spiekermann, R. (2022). Quantifying the performance of silvopastoralism for landslide erosion and sediment control in New Zealand’s hill country. Massey University. Palmerston North, New Zealand: Massey University. Retrieved July 30, 2023, from https://mro.massey.ac.nz/handle/10179/17854.
- Waldron, L. J. (1977). “The shear resistance of root-permeated homogeneous and stratified soil.” Soil Science Society of America Journal, 41(5), 843–849.
- Wayne, C. (1976). “The effects of sea and marsh grass on wave energy.” Coastal Research Notes, 4(7), 6–8.
- Wu, T. H., McKinnell III, W. P., and Swanston, D. N. (1979). “Strength of tree roots and landslides on Prince of Wales Island, Alaska.” Canadian Geotechnical Journal, 16(1), 19–33.
- Zedler, J. B. (2000). “Progress in wetland restoration ecology.” Trends in Ecology & Evolution, 15(10), 402–407.
Figure 1.
(left) Hook arrangement for tensile test showing hooks, root samples and parts consisting of hot glue to hold root sample, (right) Pneumatic grip arrangement showing the upper and lower grips and root sample.
Figure 1.
(left) Hook arrangement for tensile test showing hooks, root samples and parts consisting of hot glue to hold root sample, (right) Pneumatic grip arrangement showing the upper and lower grips and root sample.
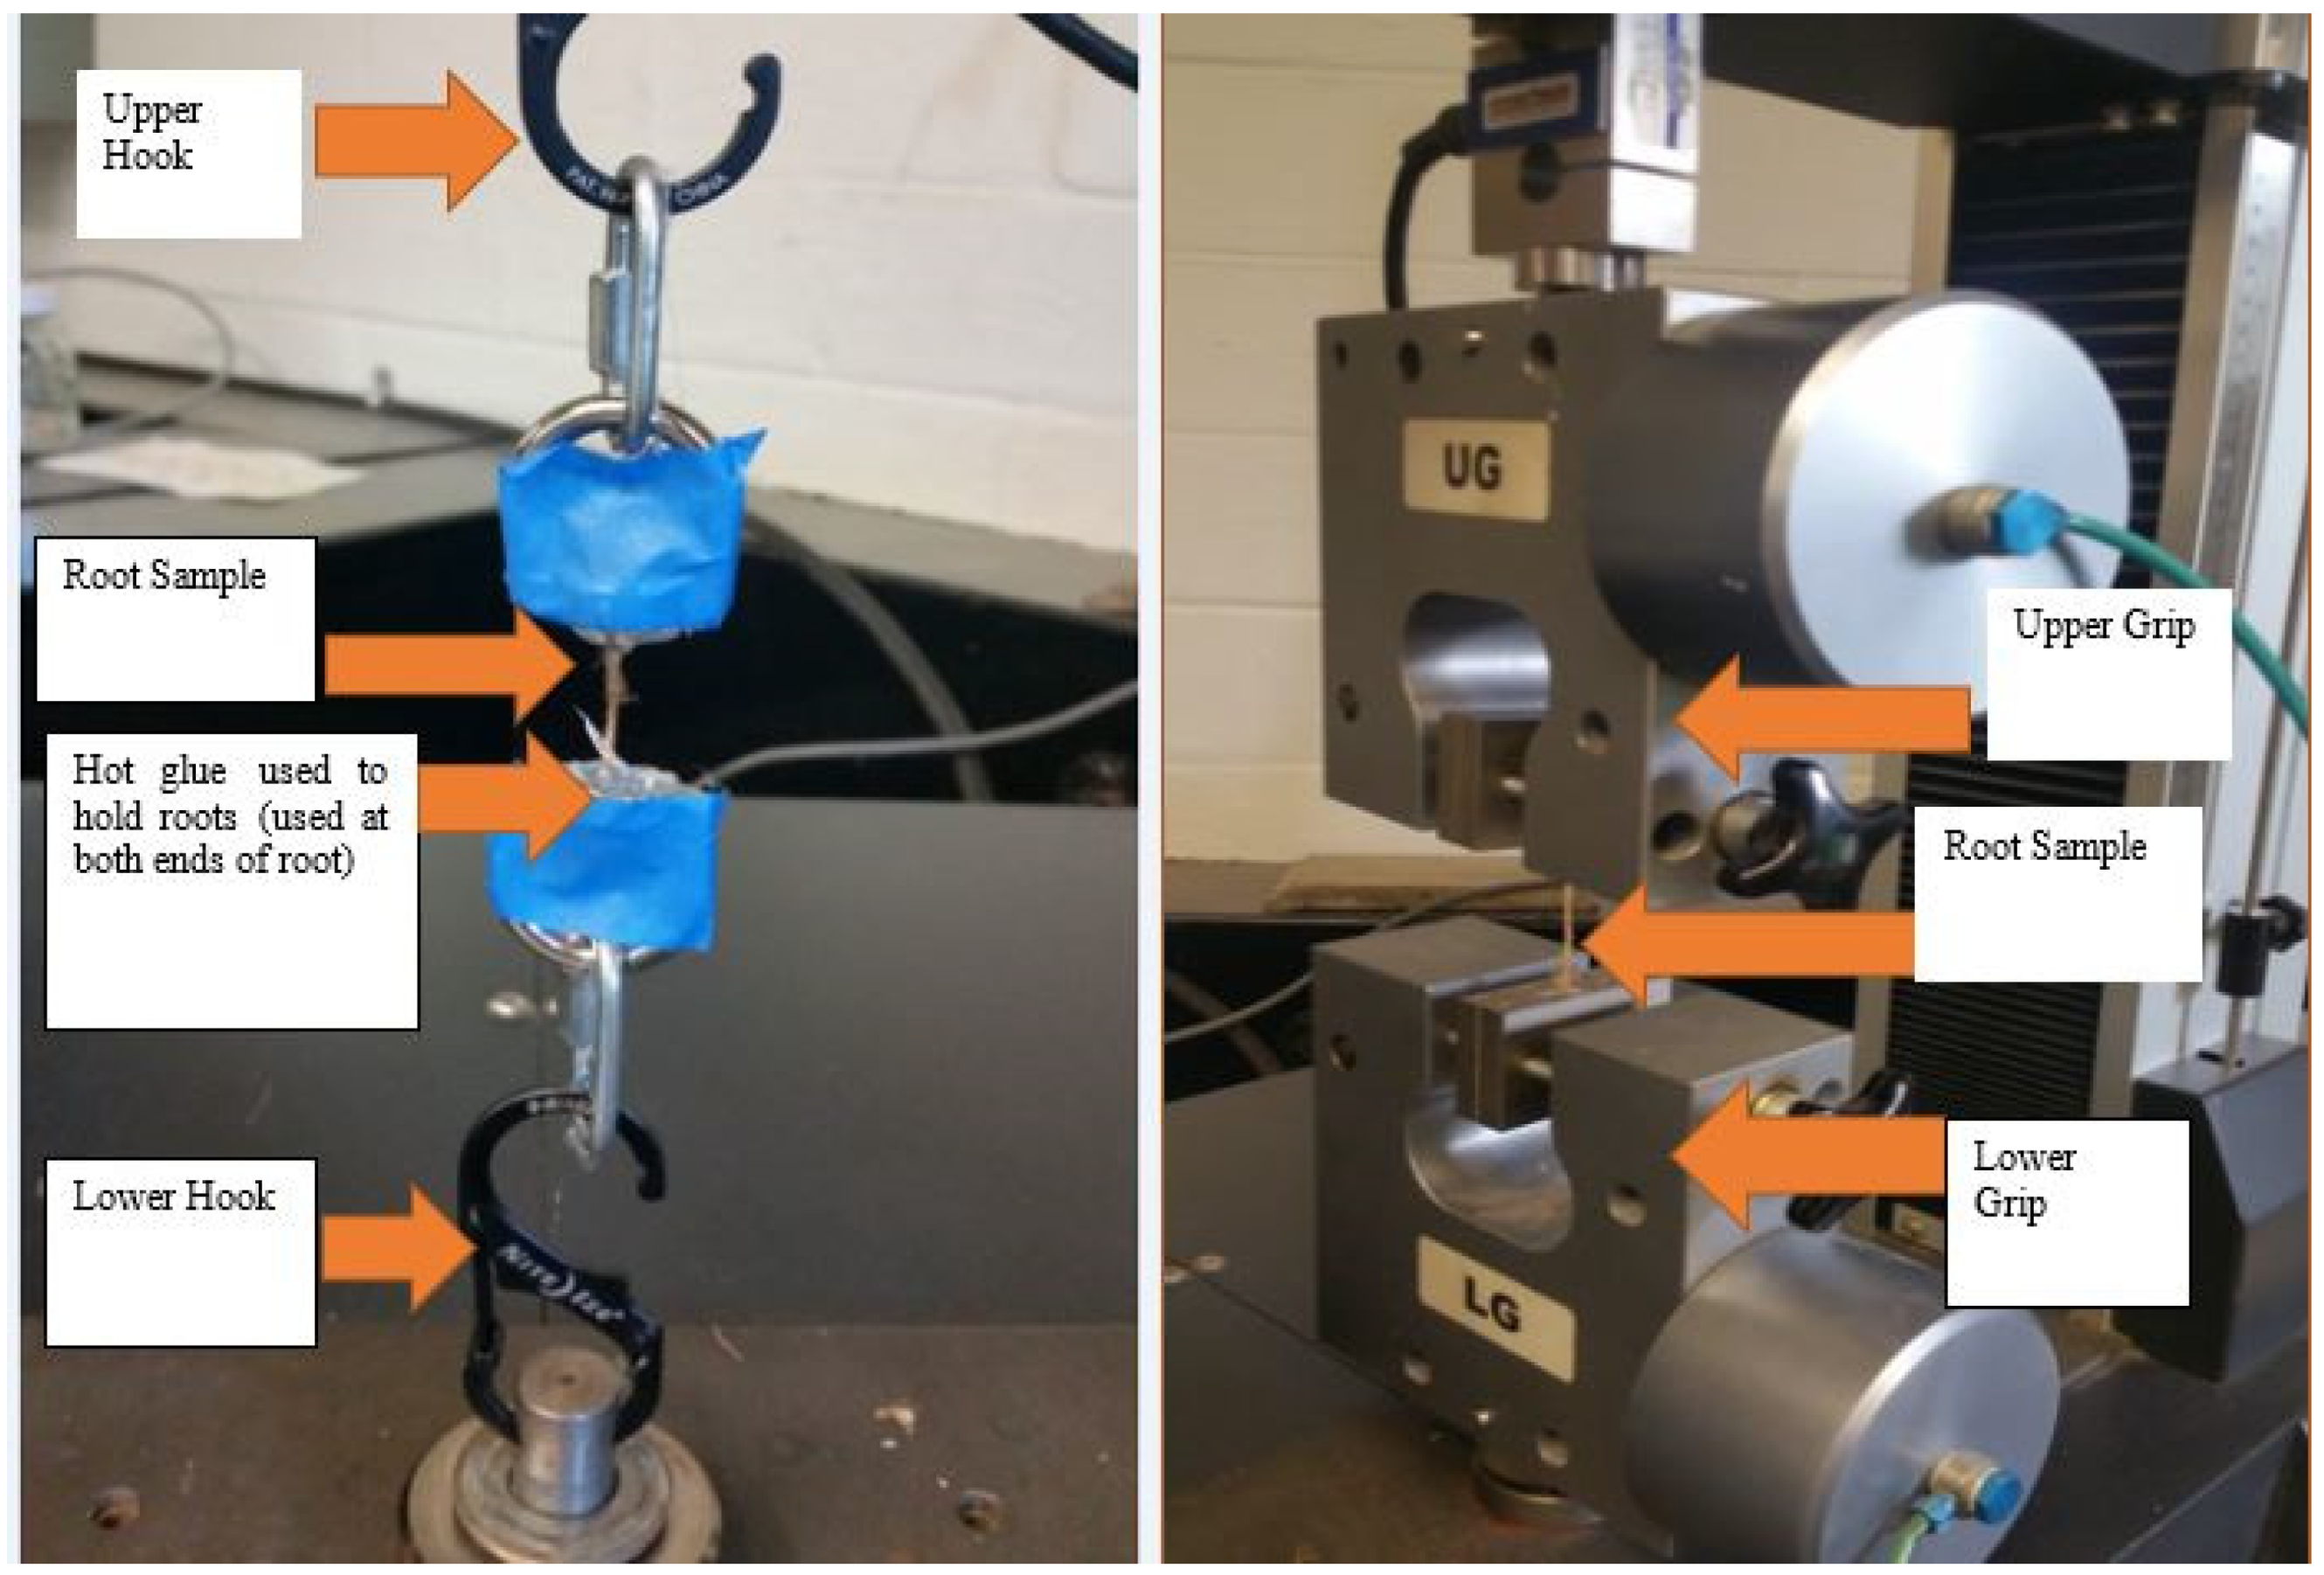
Figure 2.
The shear stress-strain curves for soil samples from Cycle 1 under different normal stresses, (a) at normal stress of 5 kN, (b) at normal stress of 11 kN, (c) at normal stress of 19 kN.
Figure 2.
The shear stress-strain curves for soil samples from Cycle 1 under different normal stresses, (a) at normal stress of 5 kN, (b) at normal stress of 11 kN, (c) at normal stress of 19 kN.
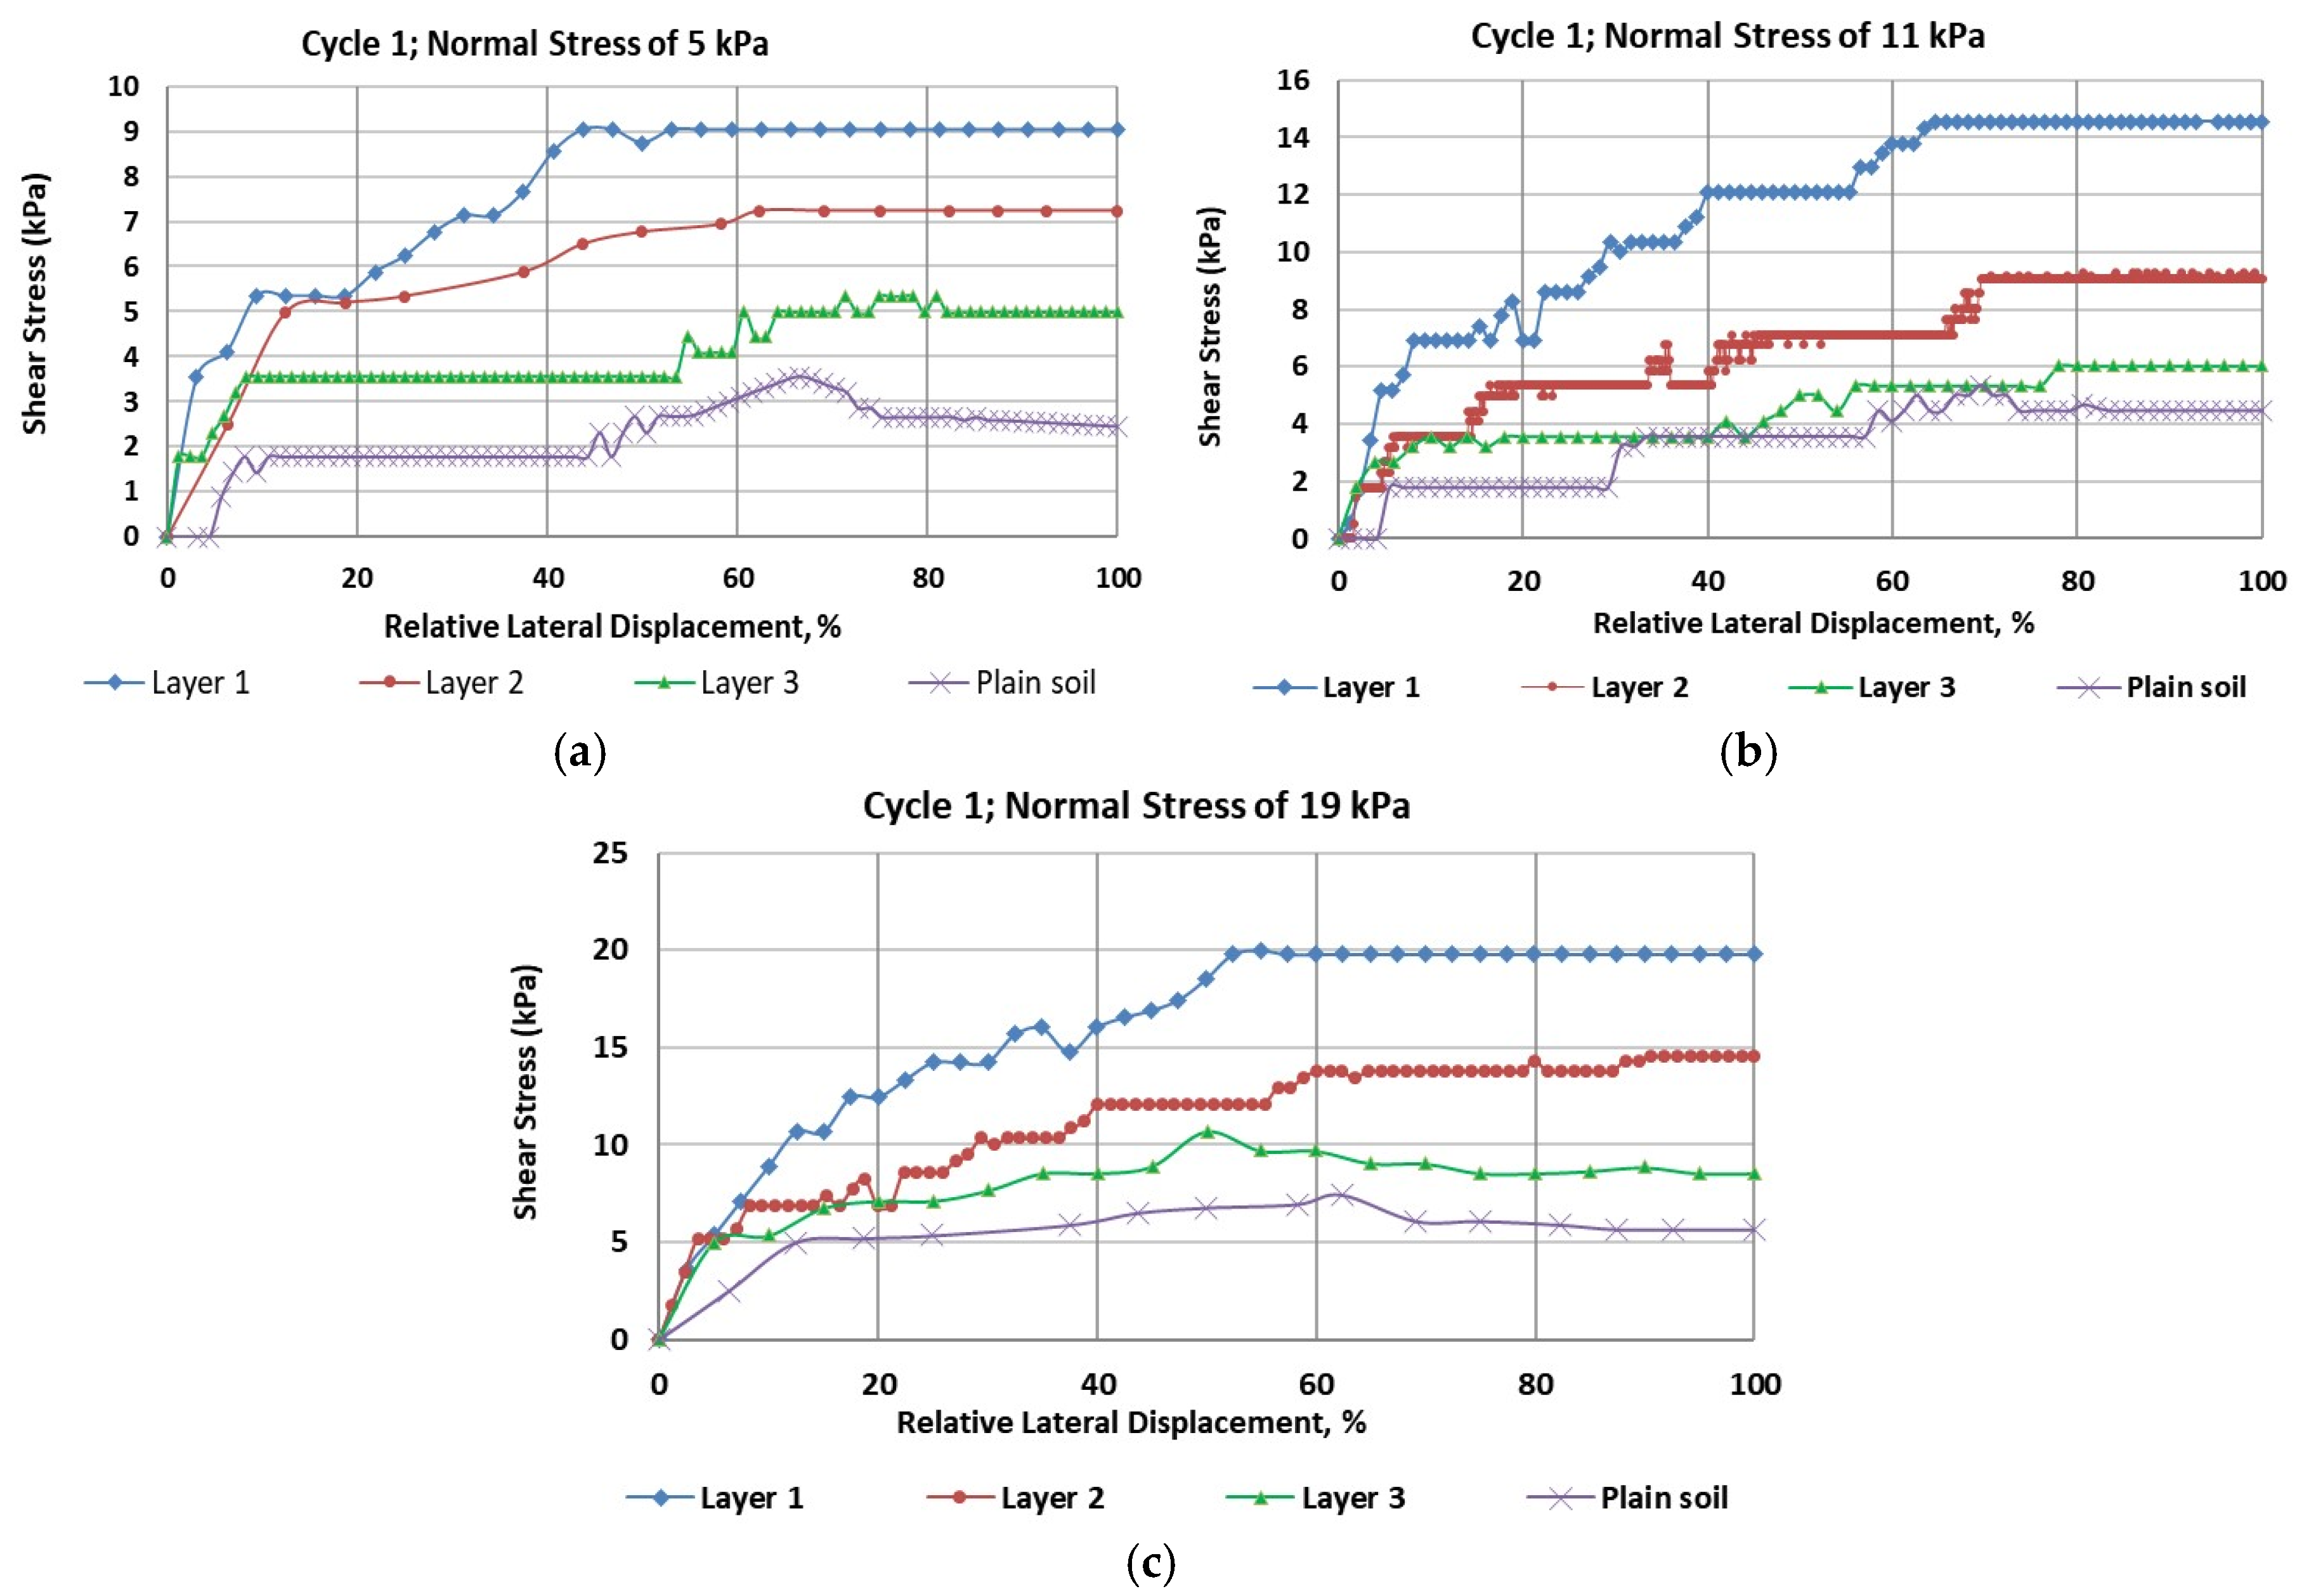
Figure 3.
Normal stress vs. shear strength plots. (a) Cycle 1, (b) Cycle 3.
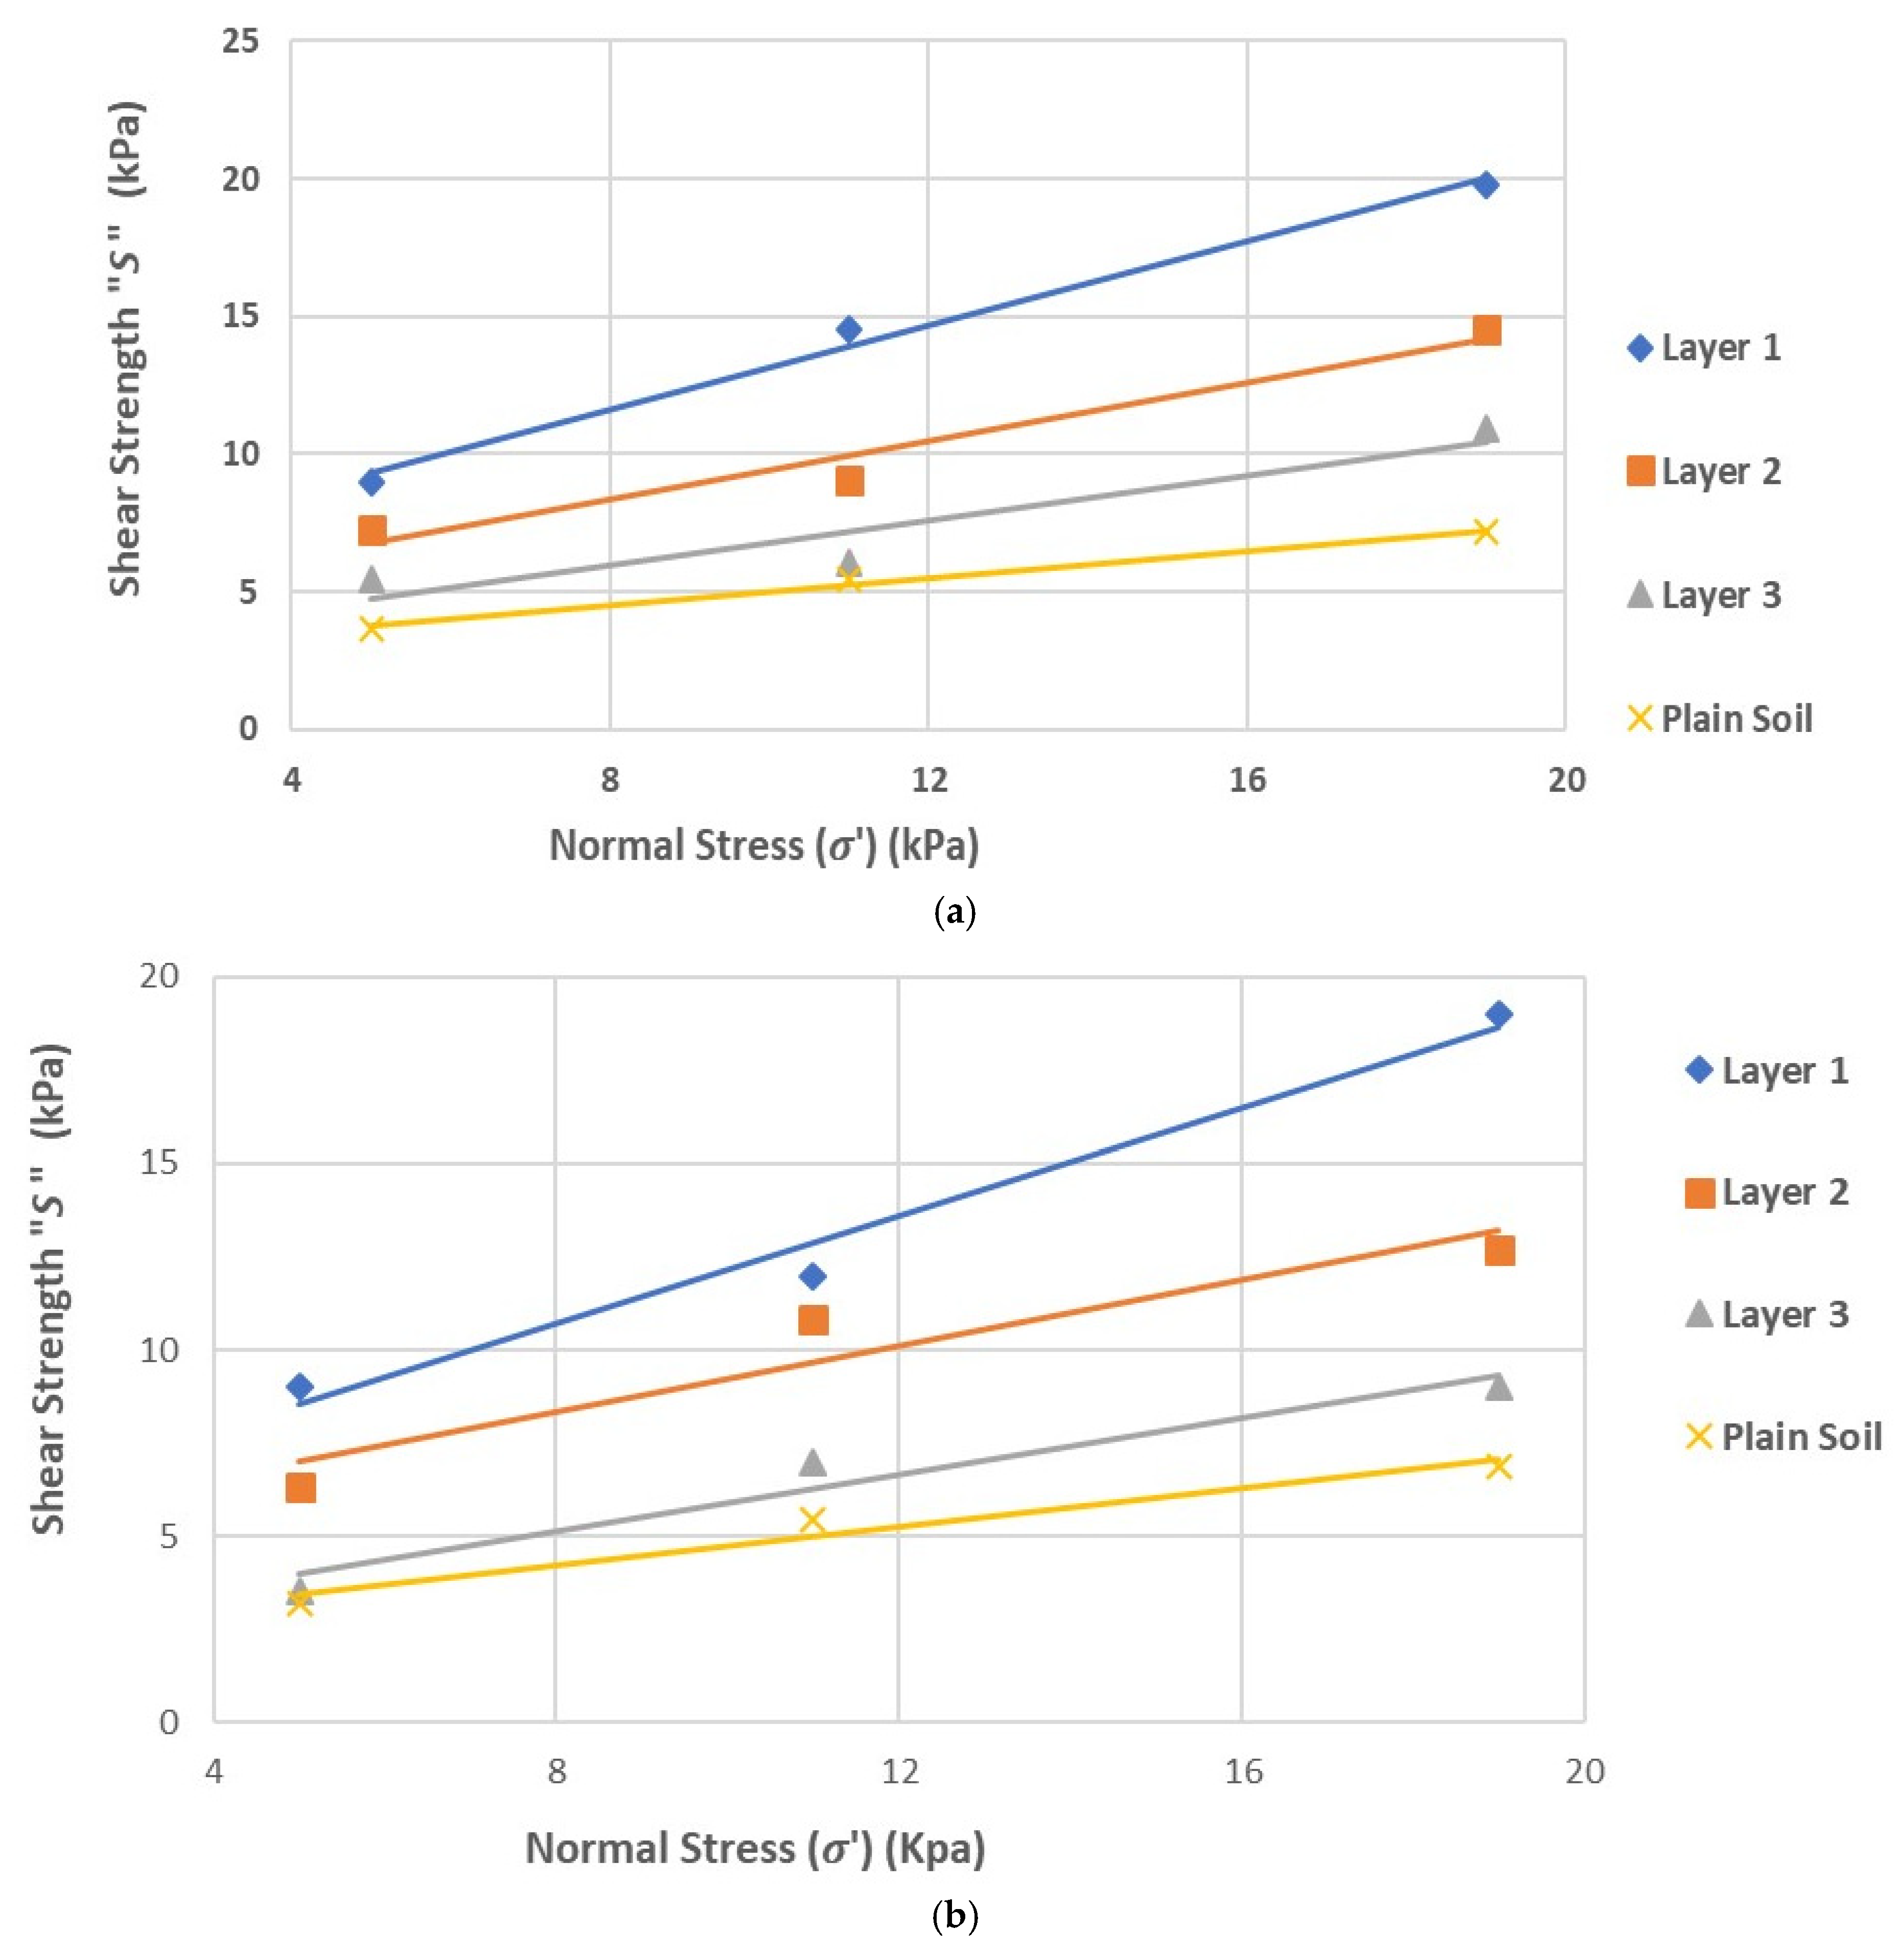
Figure 4.
The shear stress-strain curves for soil samples from Cycle 3 under different normal stresses, (a) at normal stress of 5 kN, (b) at normal stress of 11 kN, (c) at normal stress of 19 kN.
Figure 4.
The shear stress-strain curves for soil samples from Cycle 3 under different normal stresses, (a) at normal stress of 5 kN, (b) at normal stress of 11 kN, (c) at normal stress of 19 kN.
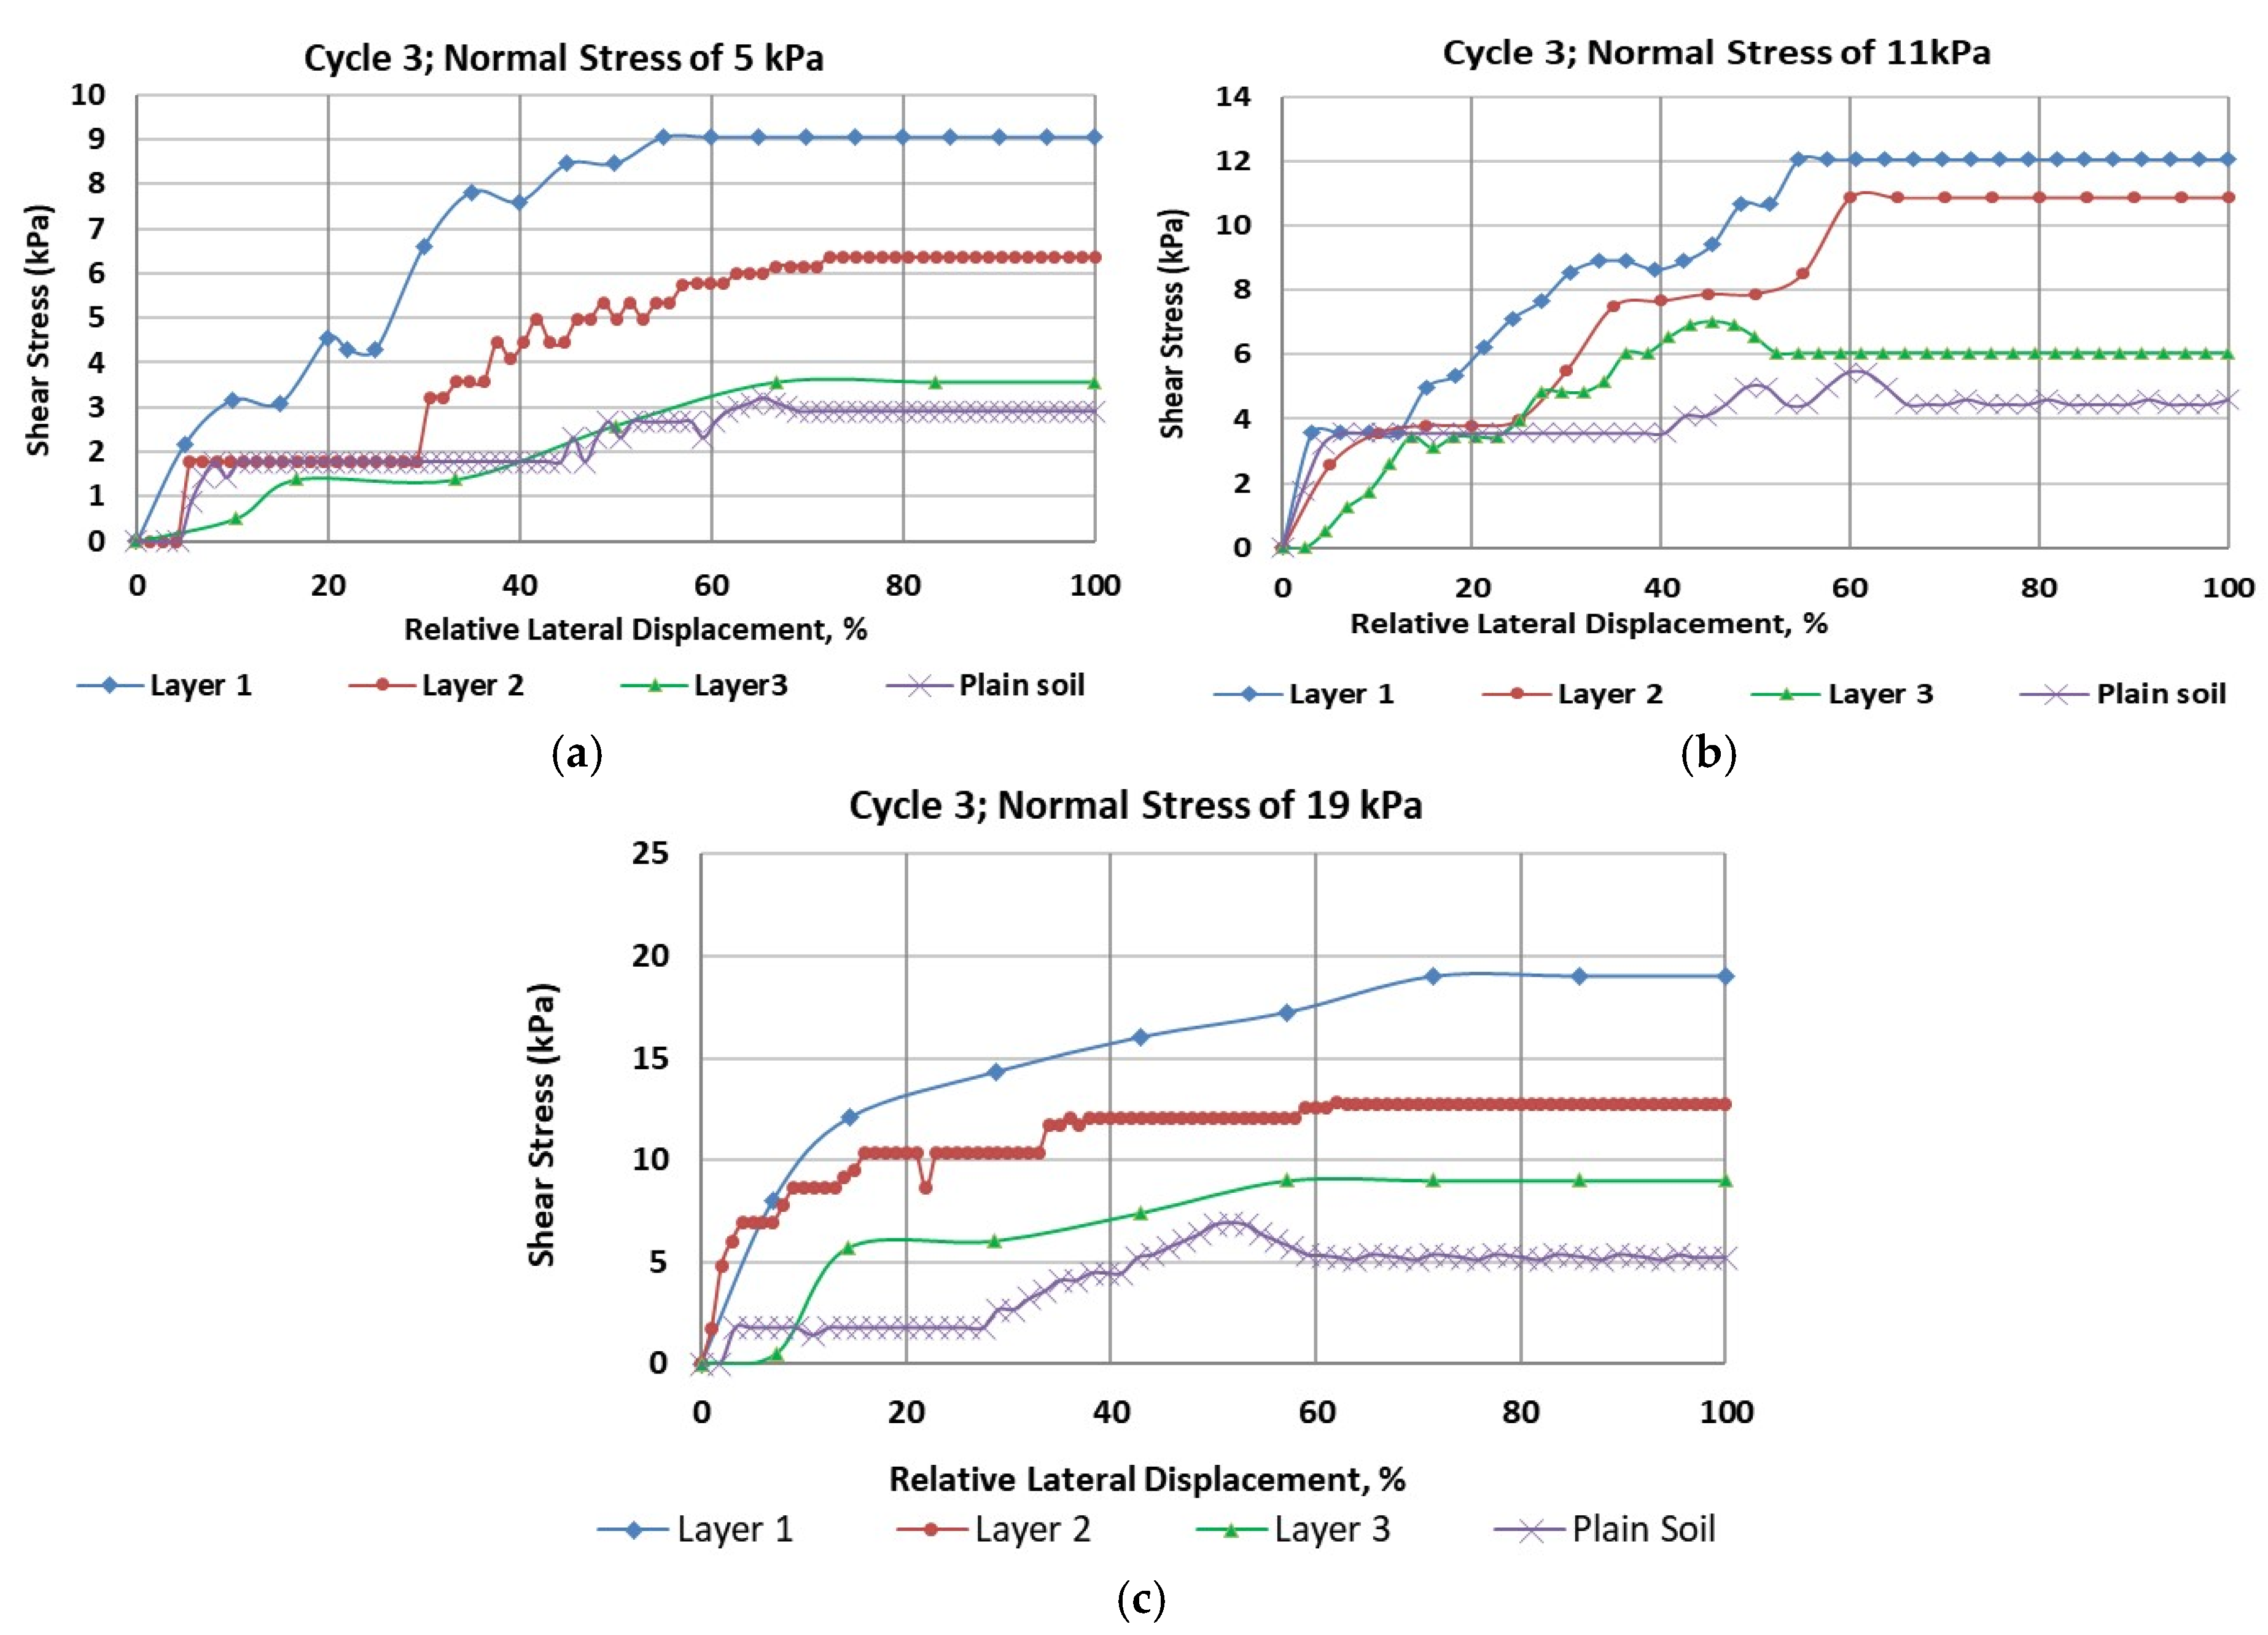
Figure 5.
Corrected undrained shear strength profiles obtained from the vane shear tests at six different locations at CS-28.
Figure 5.
Corrected undrained shear strength profiles obtained from the vane shear tests at six different locations at CS-28.
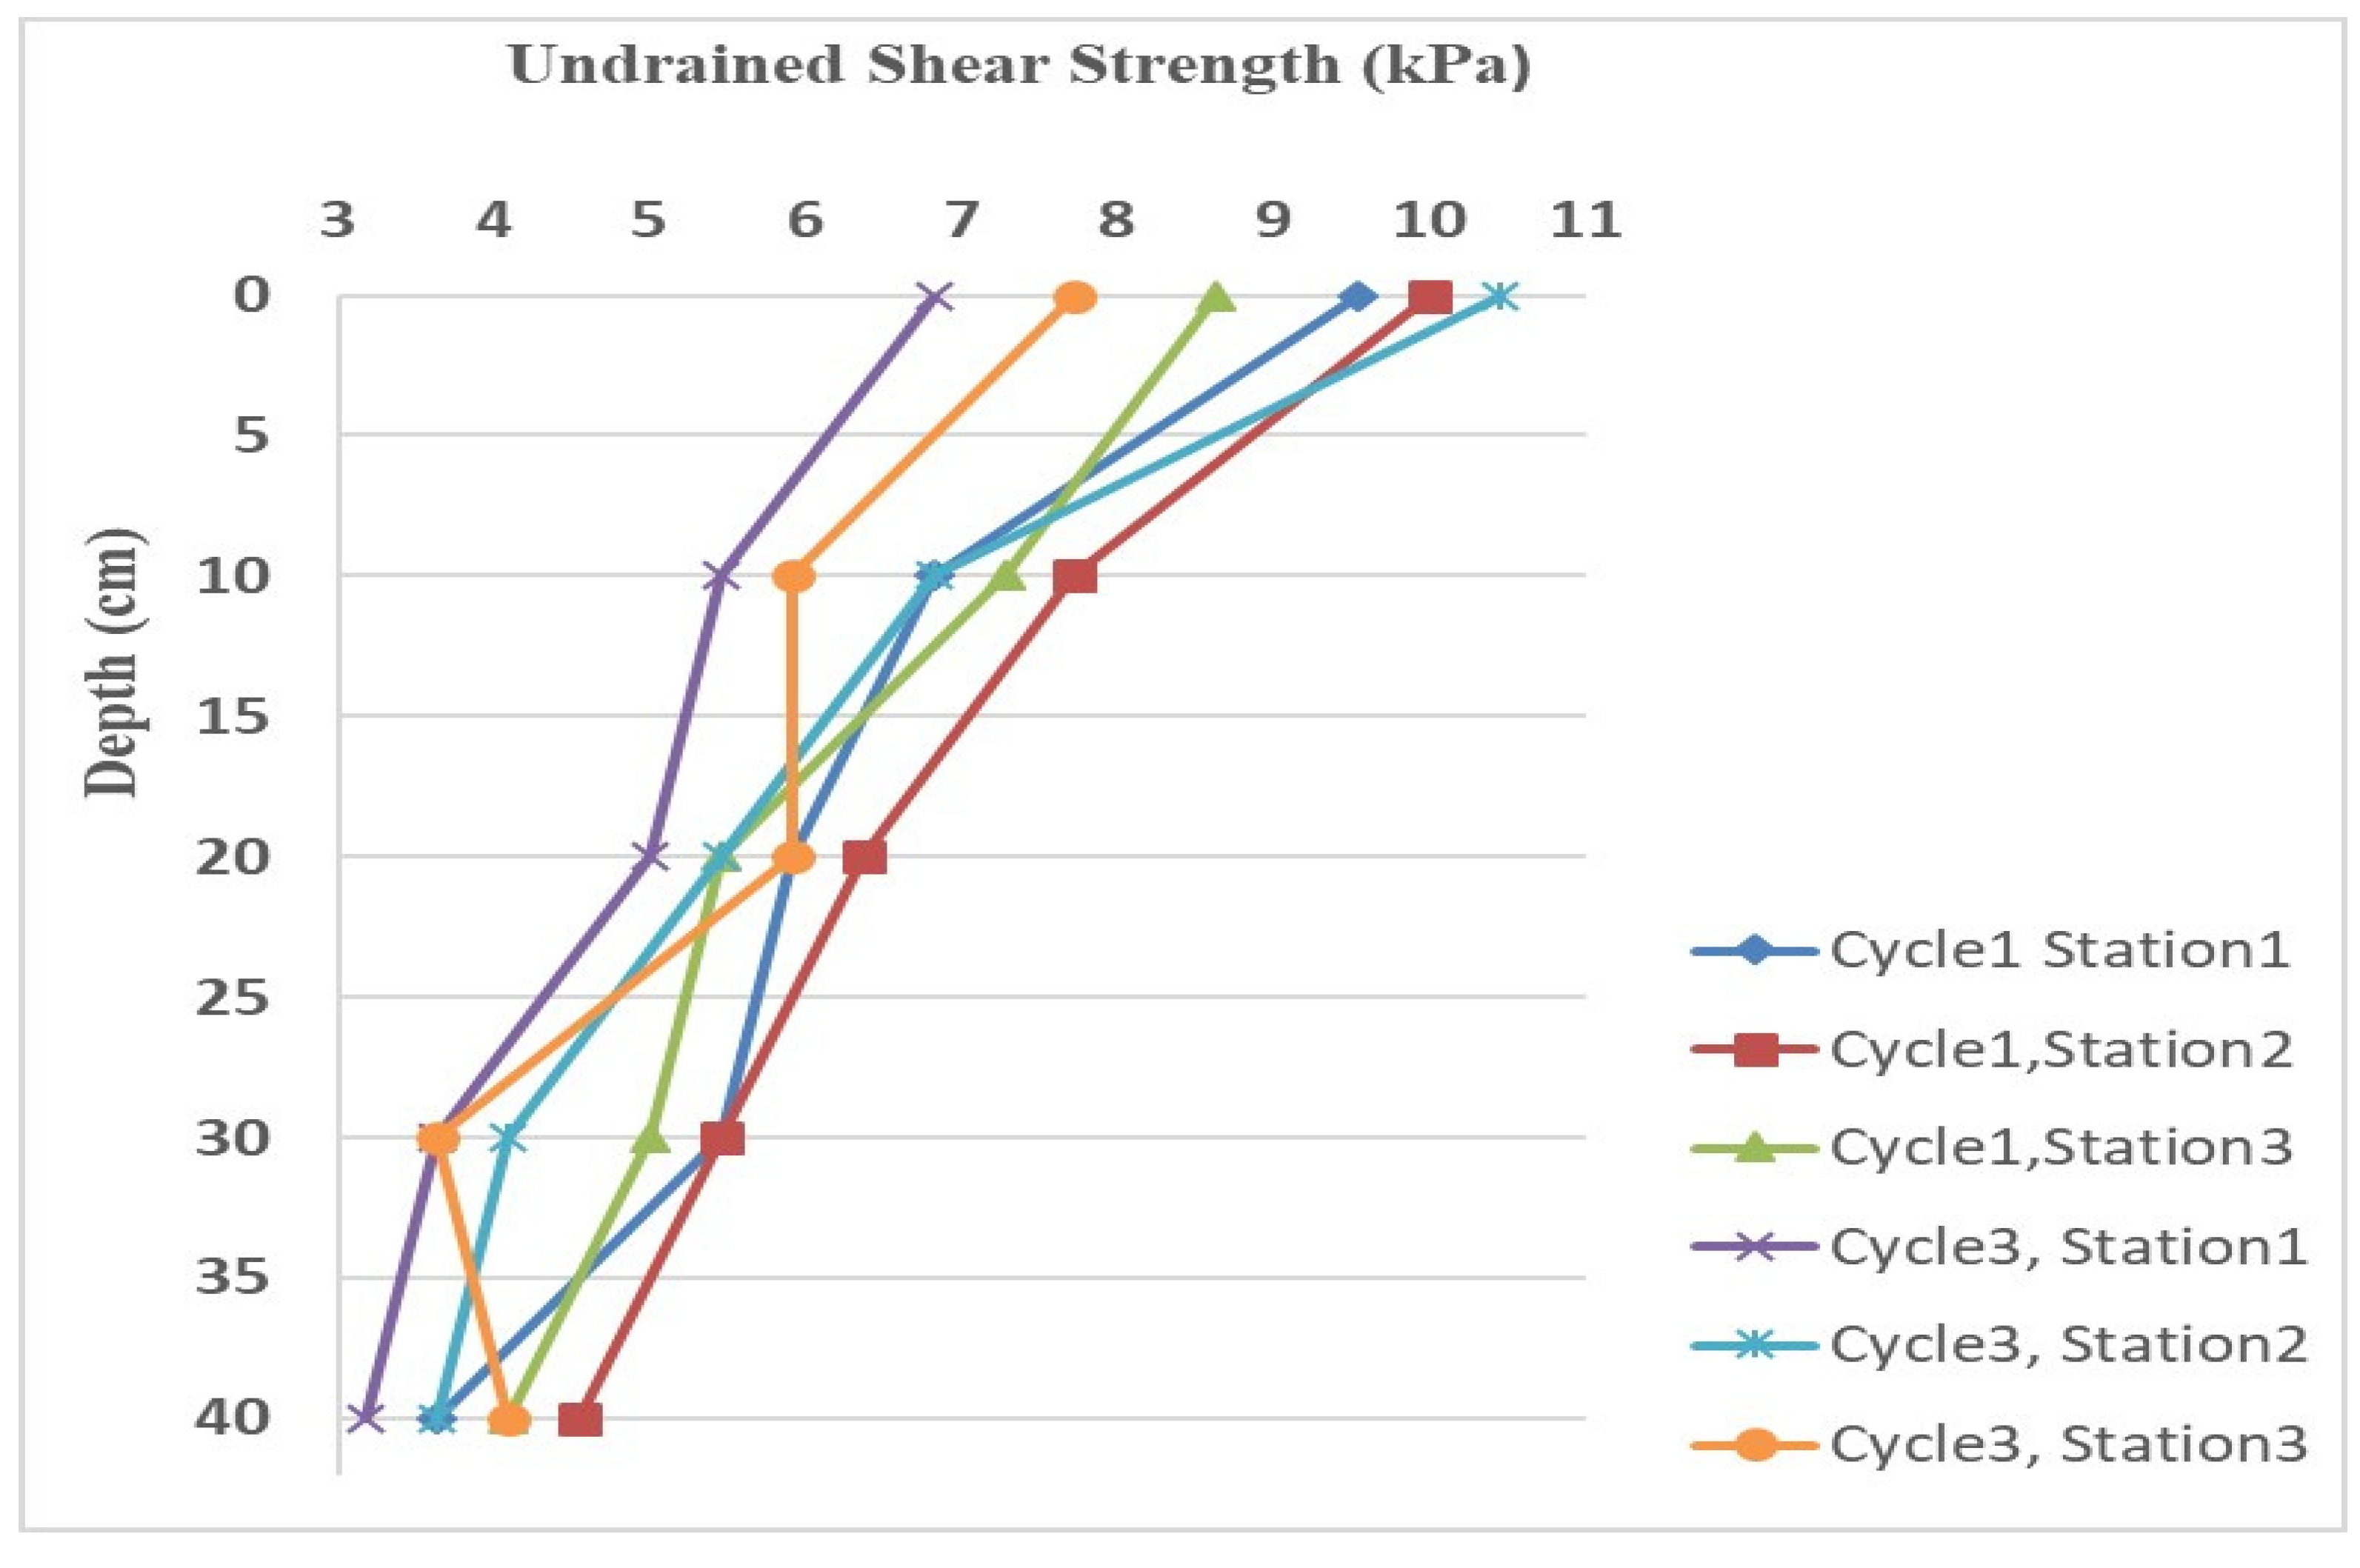
Figure 6.
Load vs. axial strain for different root samples of root type “R1”.
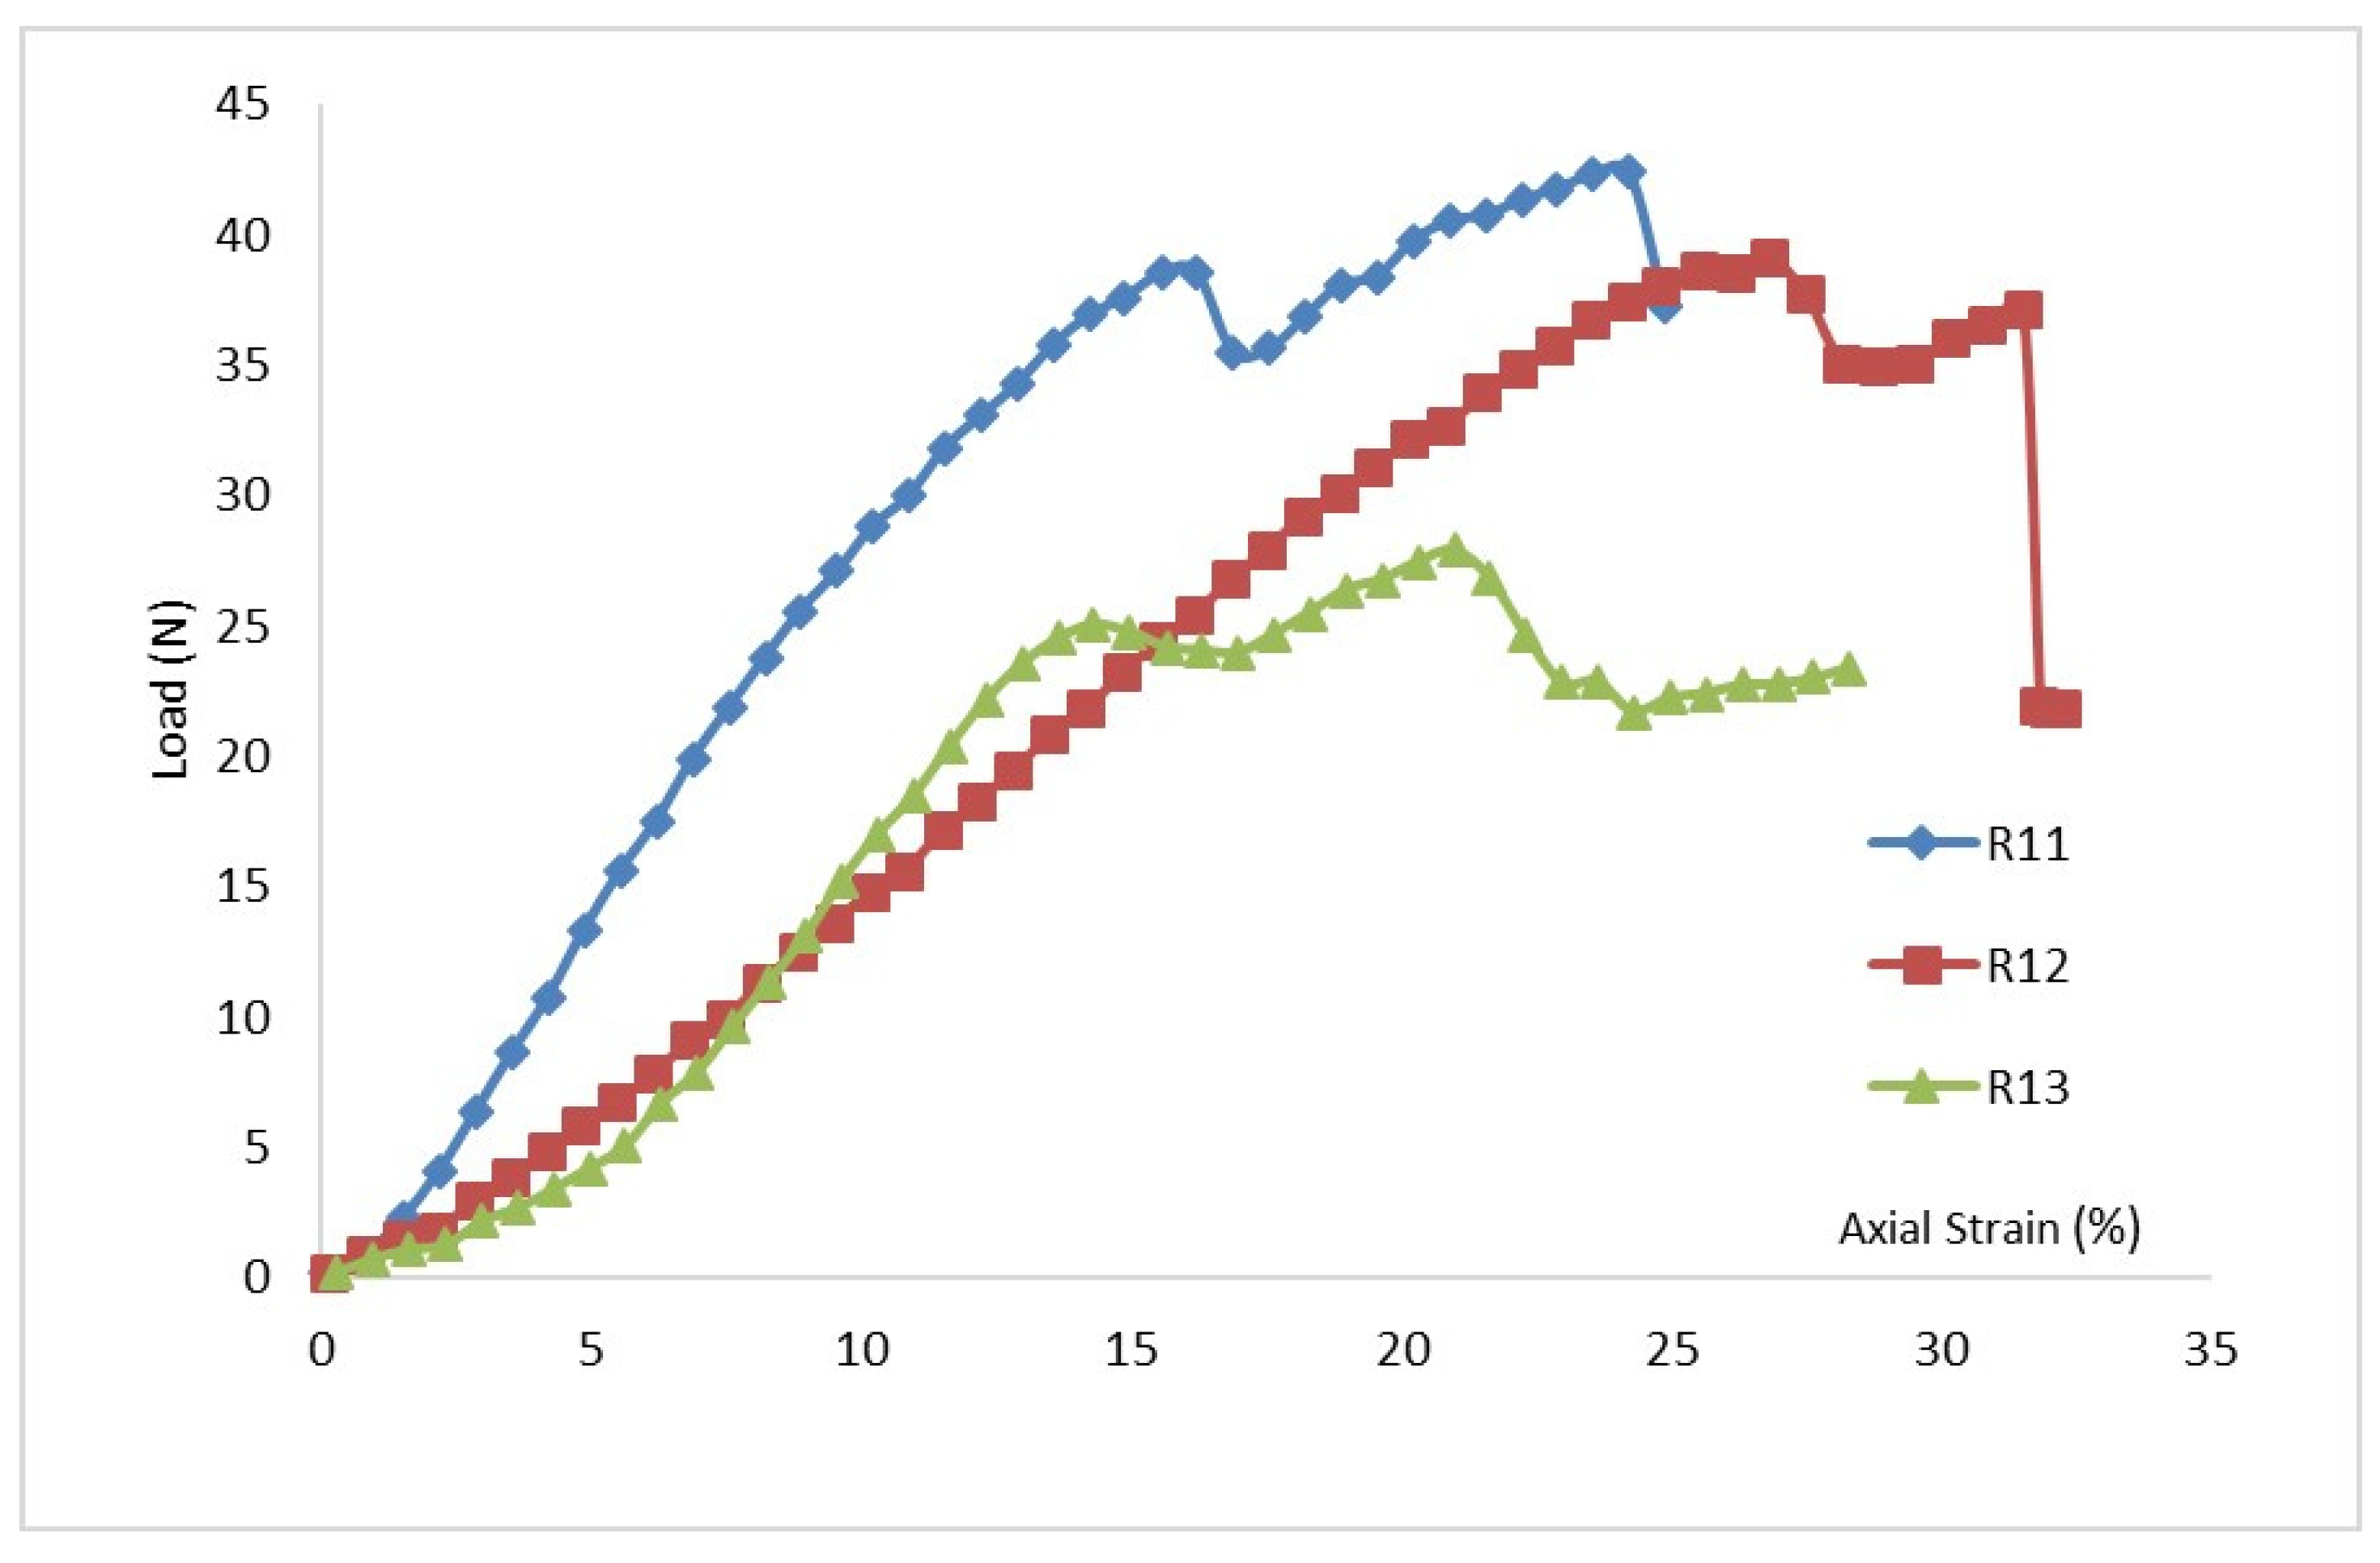
Figure 7.
Load vs. axial strain for different root samples of root type “R2”.
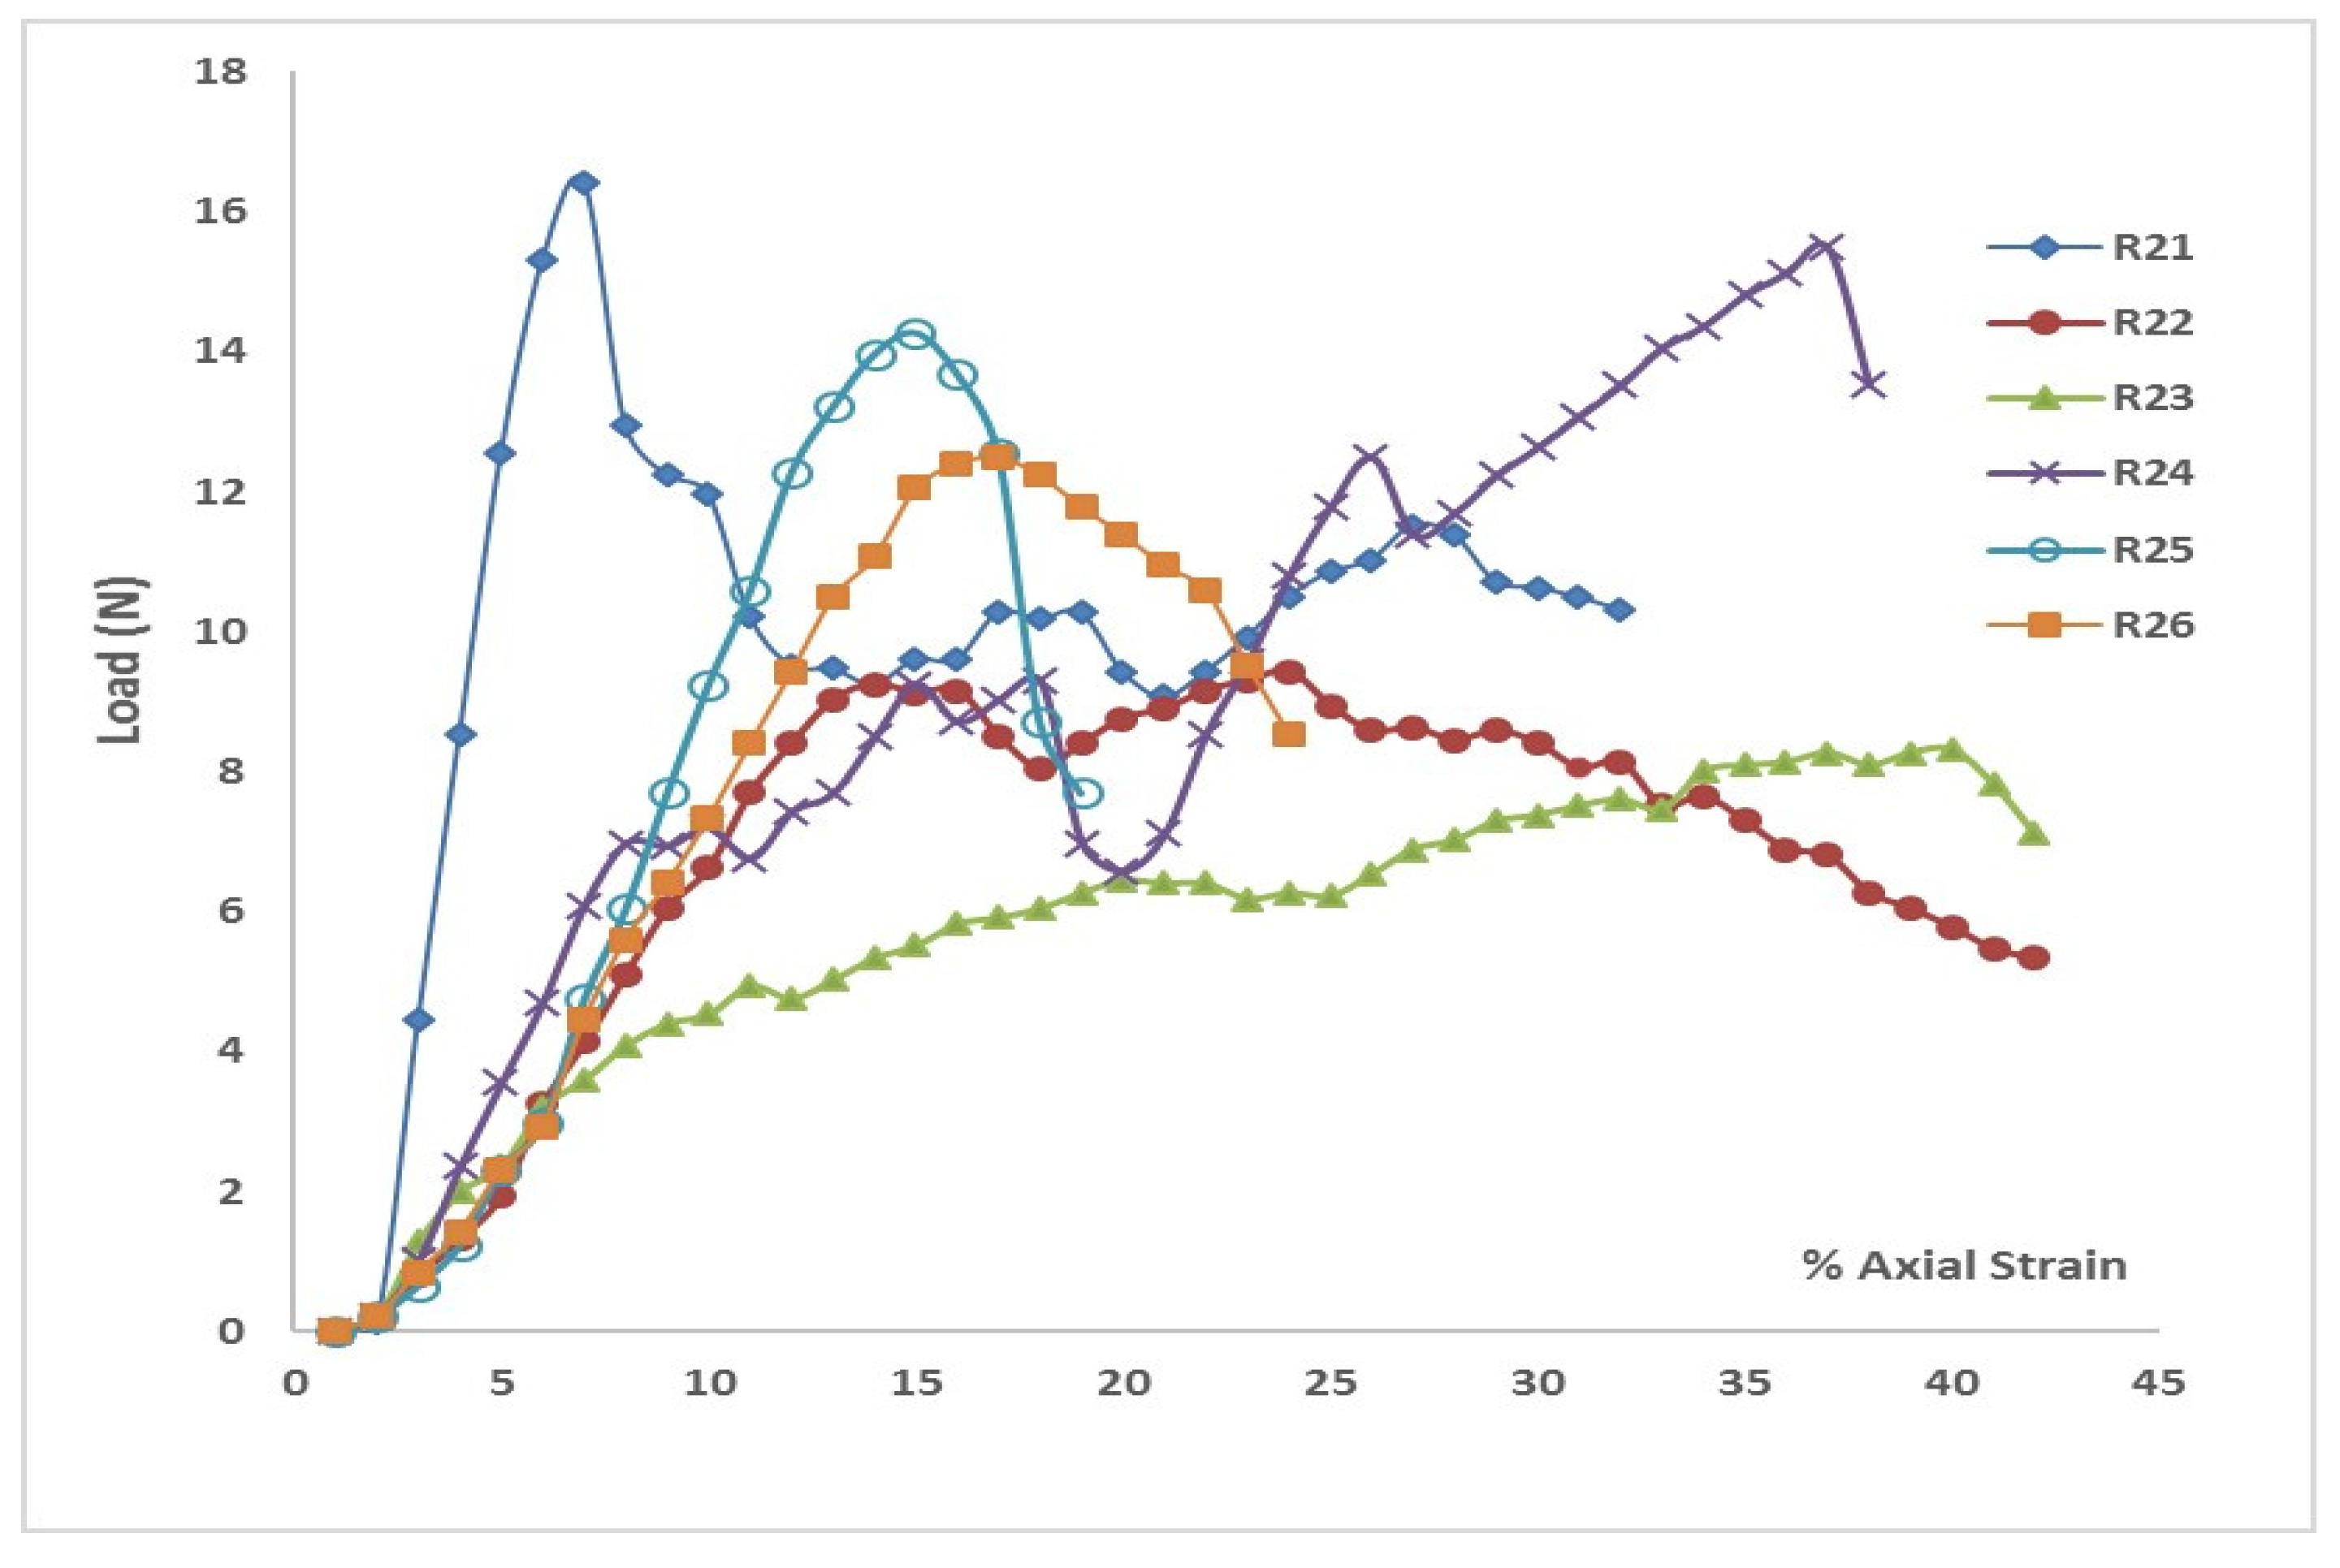
Figure 8.
Load vs. axial strain for different root samples of root type “R3”.
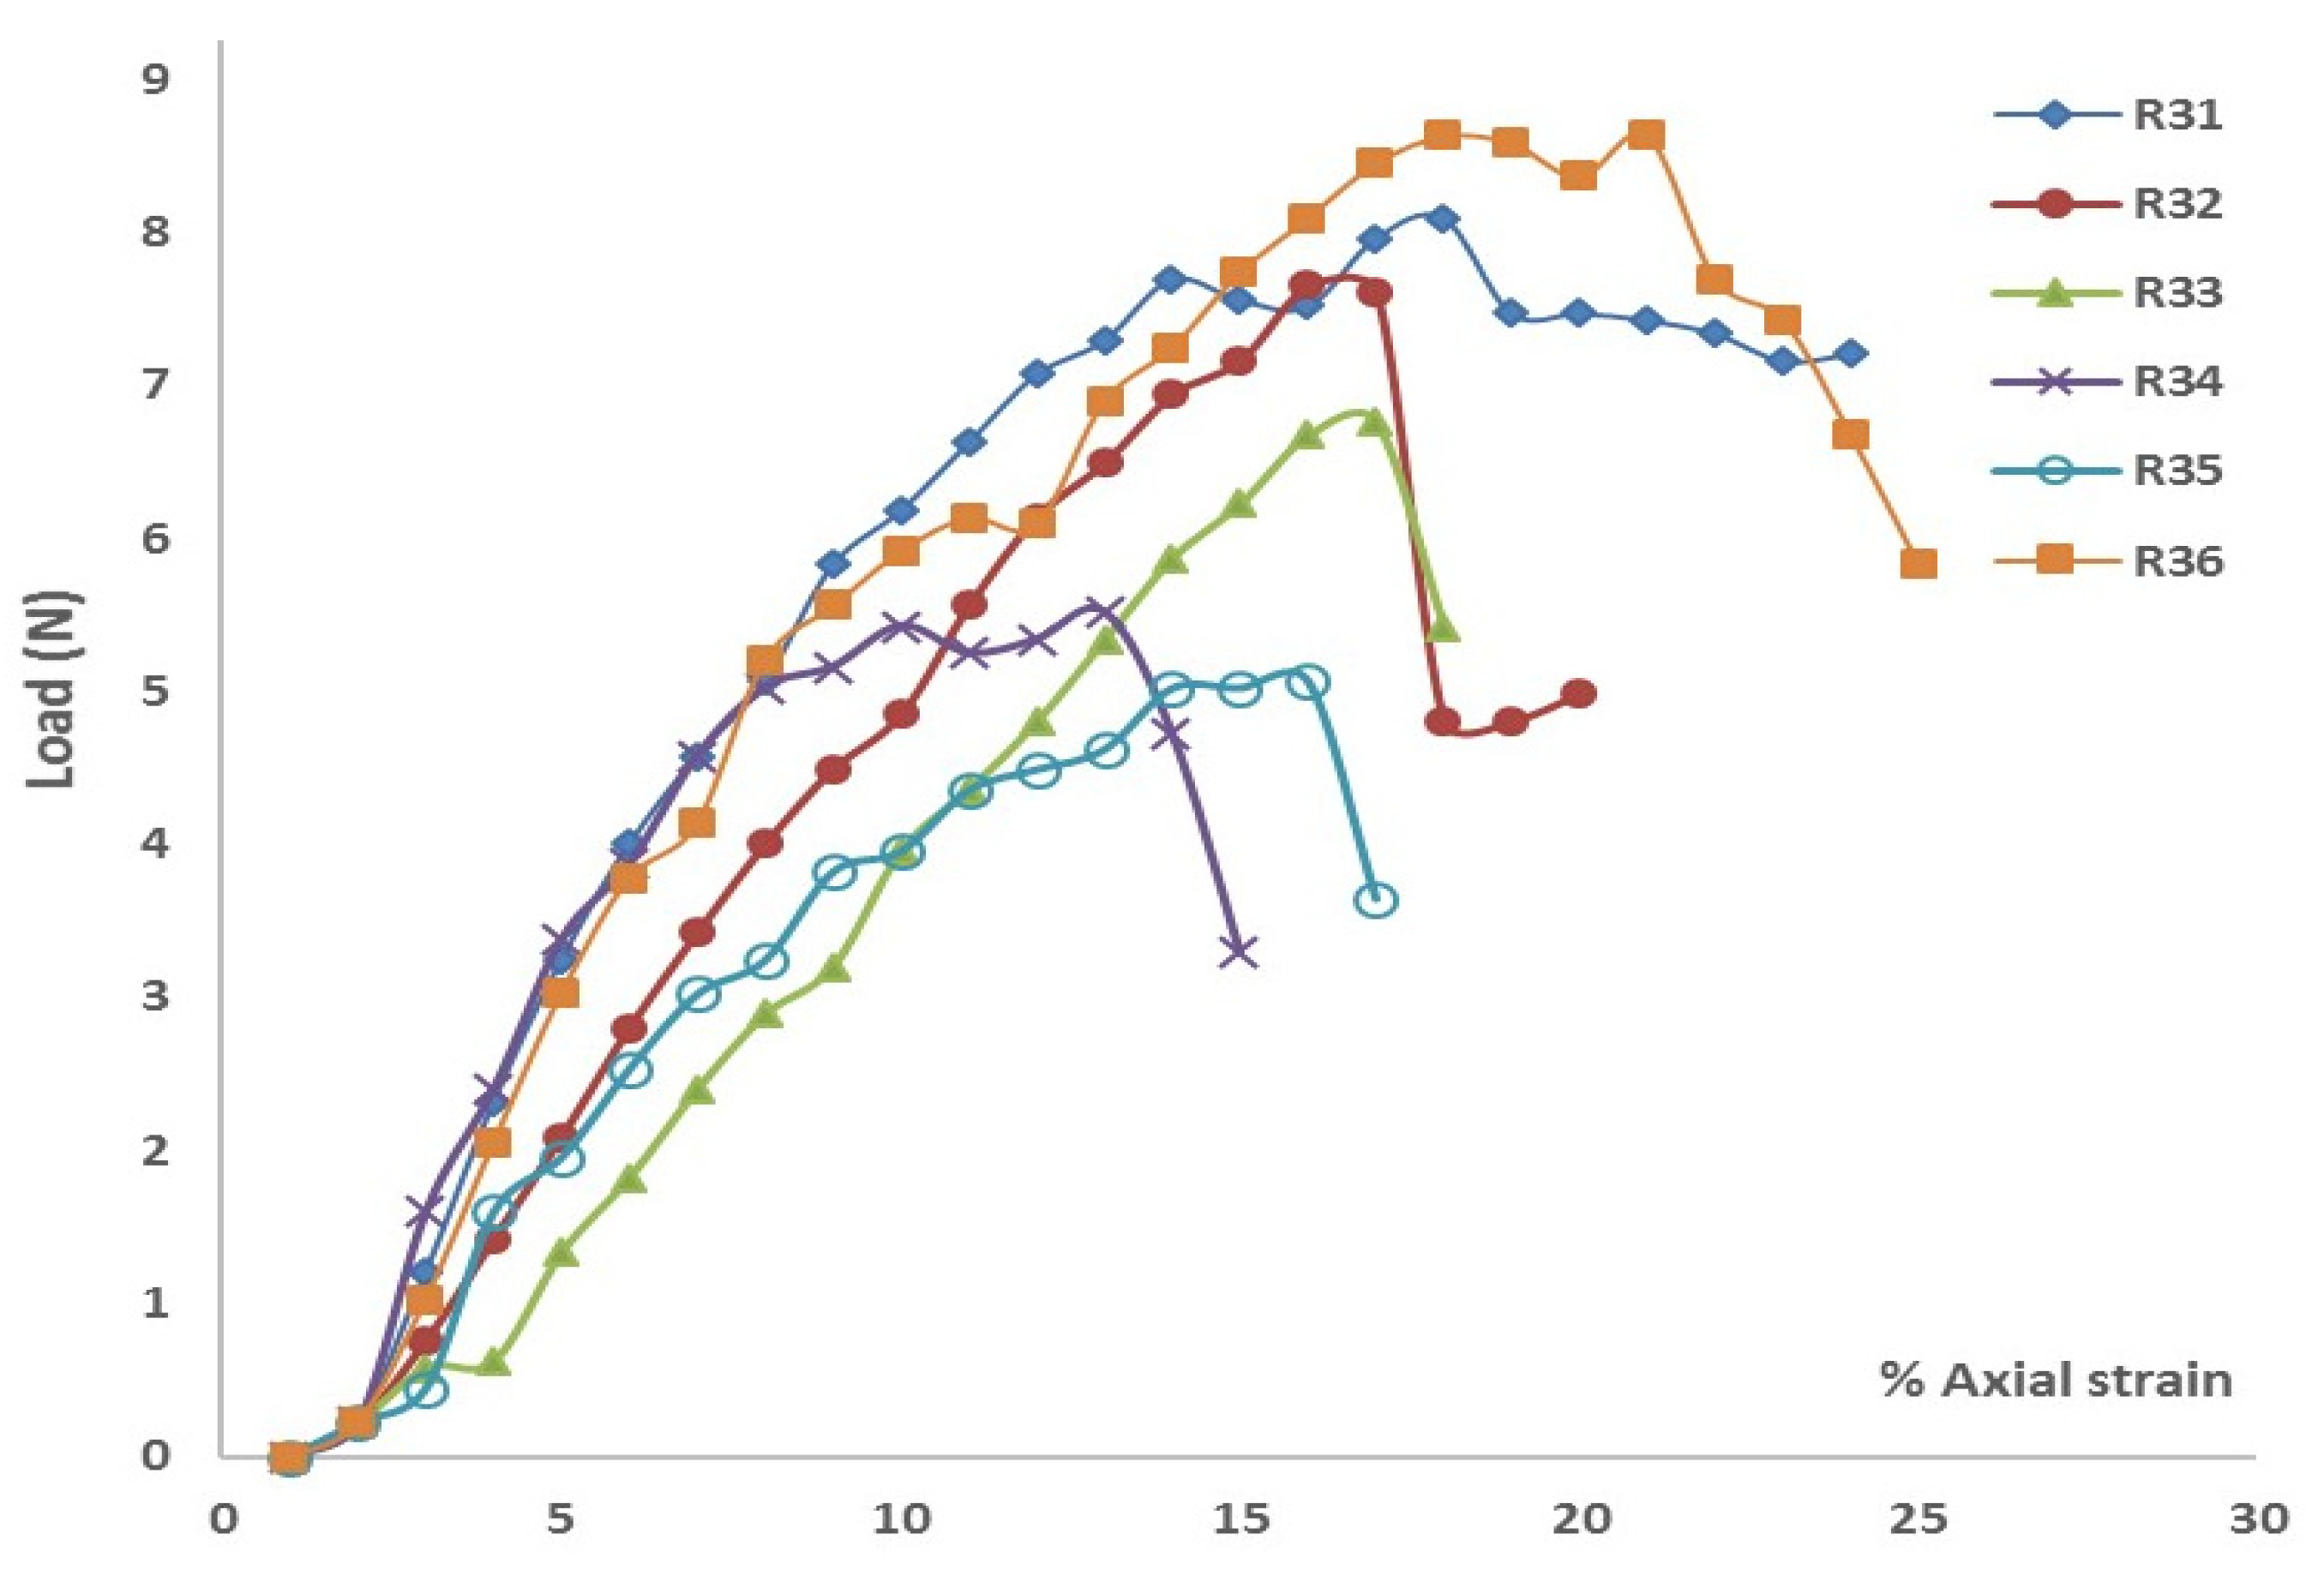
Figure 9.
Root tensile strength (MPa) vs. root diameter (mm) showing the power law regression.
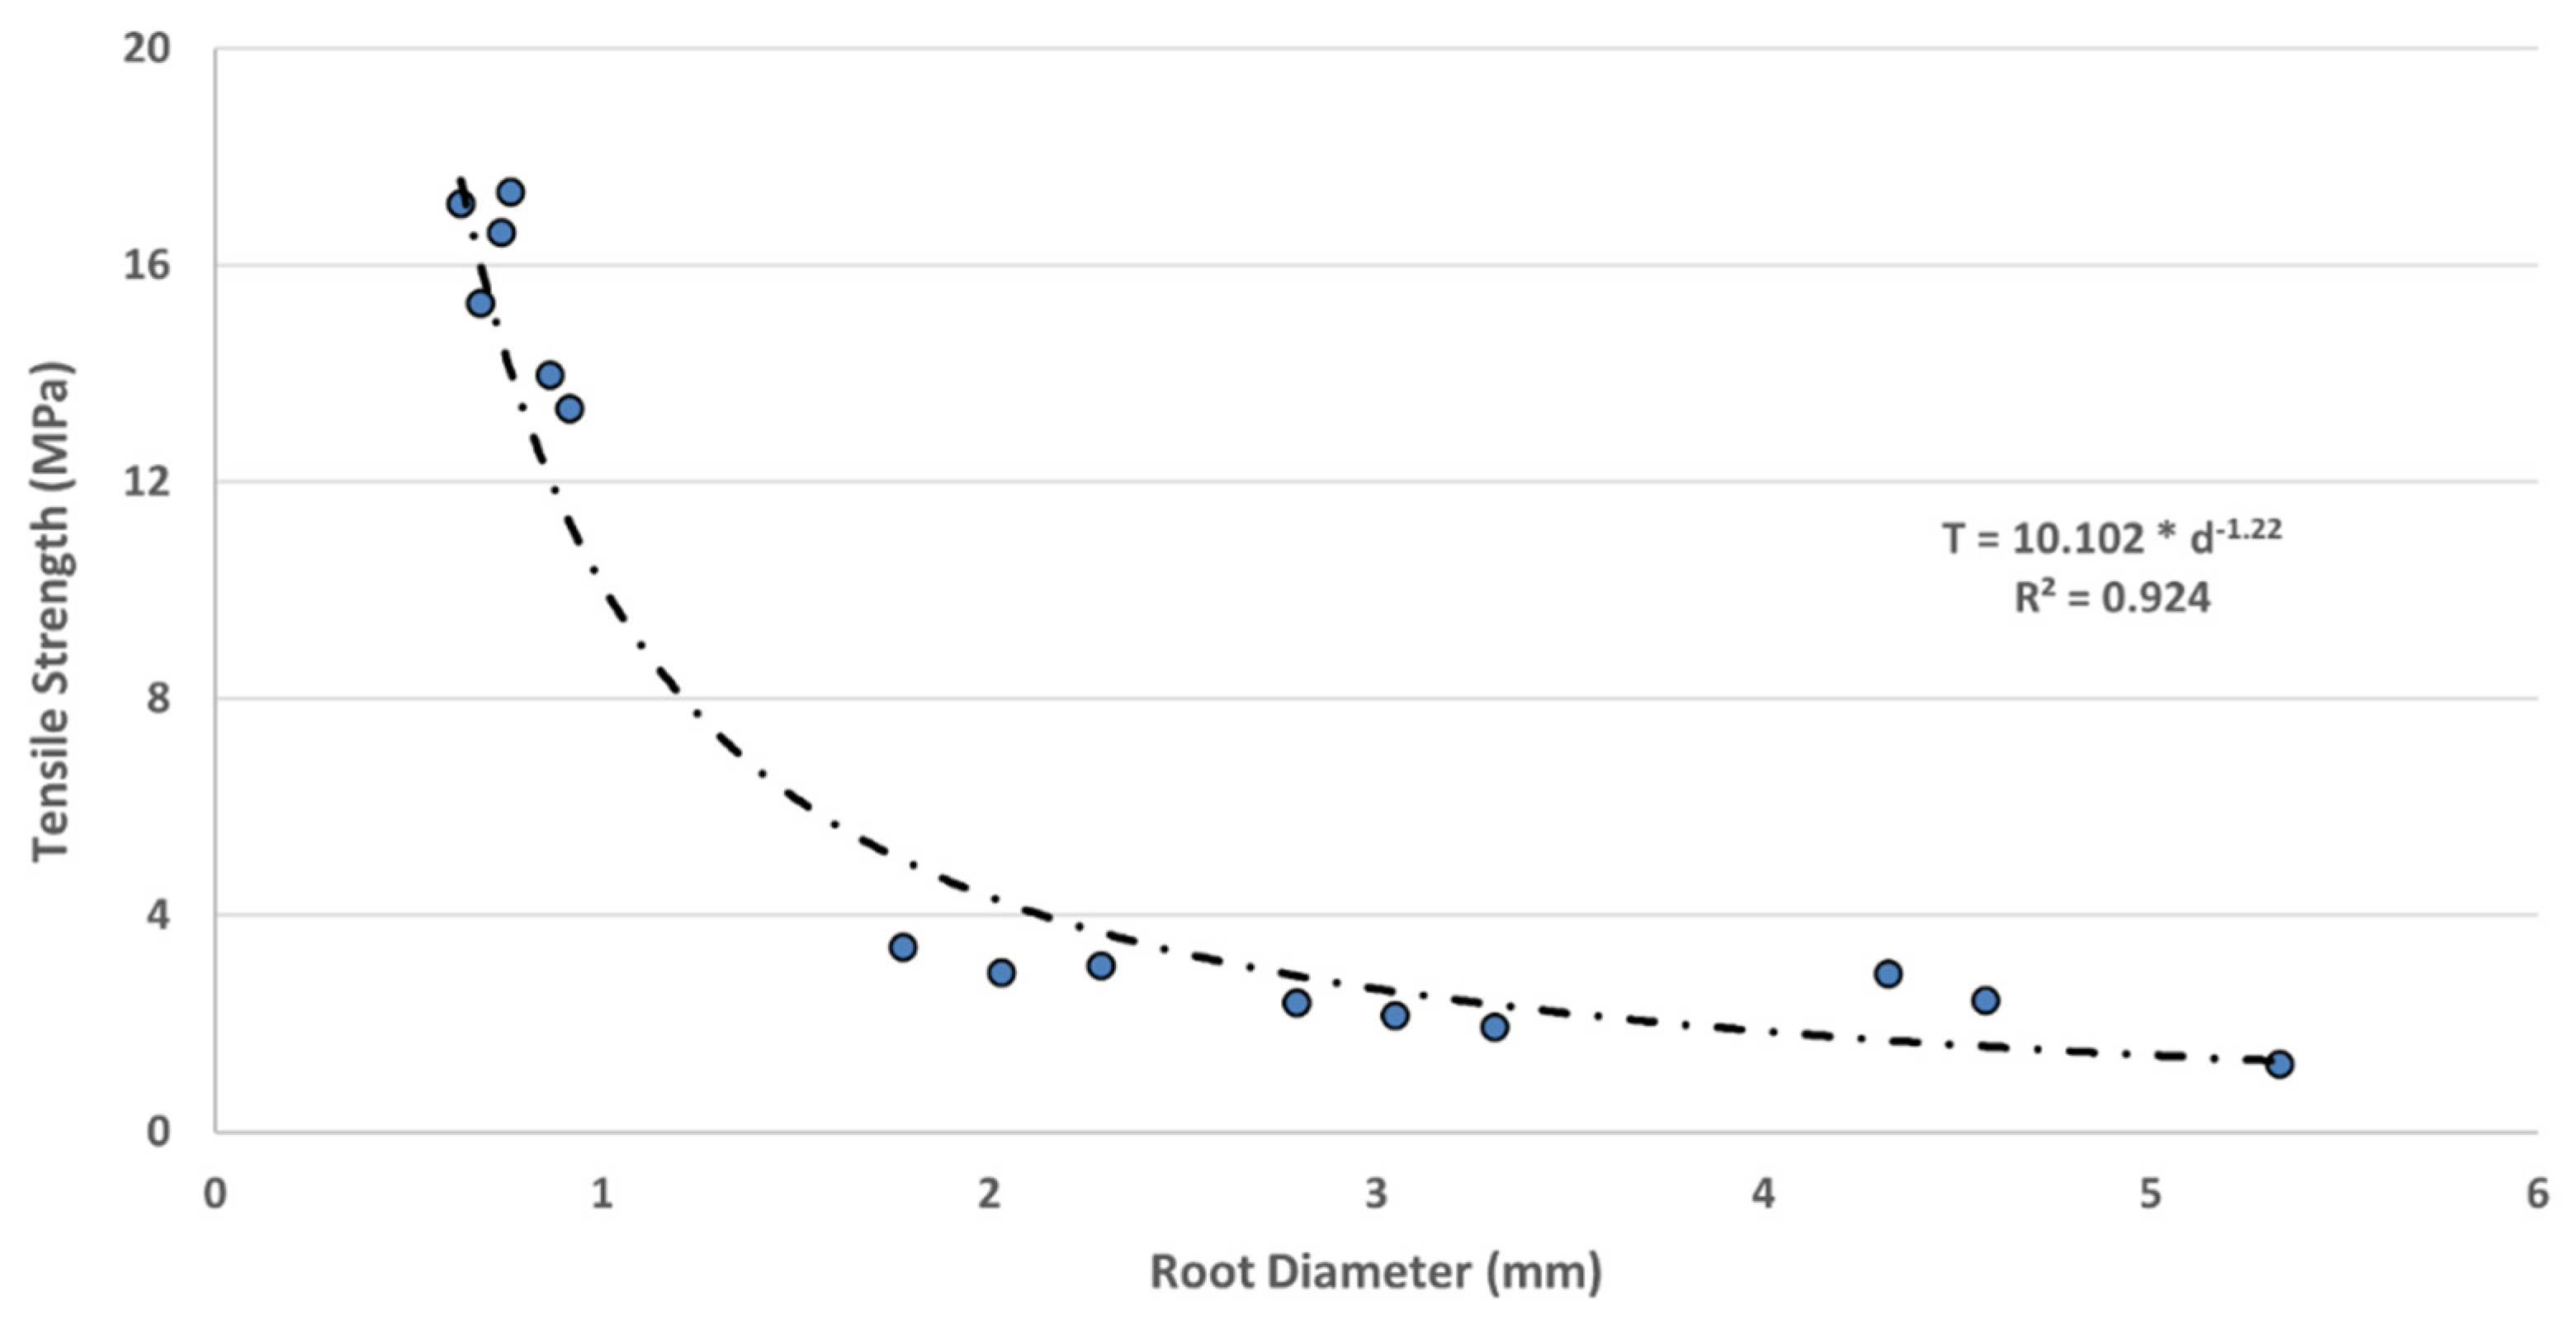

Table 1.
Properties of marshland creation soils along Louisiana coastal line.
| Soil properties | (%) | (Pcf) | (%) | PI (%) | |||
| Range | 24.4–418 | 18.5–100 | 37–394 | 17–268 | 2.35–2.72 | 0.16–2.86 | 0.669–12.74 |
| Average | 110.52 | 55.08 | 116.93 | 79.52 | 2.60 | 0.96 | 2.96 |
| SD | 83.86 | 23.18 | 105.37 | 73.98 | 0.11 | 0.73 | 2.48 |
(Note: = compression index, = initial void ratio, = liquid limit, = moisture content, = dry unit weight, PI = plasticity index, = specific gravity, SD = standard deviation.).
Table 2.
Cohesions (c) and friction angles (ϕ) for rooted soils in Cycles 1 and 3.
|
Normal stress (kPa) |
Peak shear strength (kPa) | |||||||
|
Layer 1 (0-8 cm) |
Layer 2 (8-16 cm) |
Layer 3 (16-24 cm) |
Plain soil layer | |||||
| Cycle 1 | Cycle 3 | Cycle 1 | Cycle 3 | Cycle 1 | Cycle 3 | Cycle 1 | Cycle 3 | |
| 5 | 9.00 | 9.04 | 7.24 | 6.35 | 5.43 | 3.55 | 3.62 | 3.20 |
| 11 | 14.54 | 12.00 | 9.04 | 10.85 | 6.03 | 7.01 | 5.43 | 5.43 |
| 19 | 19.80 | 19.00 | 14.54 | 12.70 | 10.90 | 9.00 | 7.15 | 6.90 |
| Cohesion c (kPa) | 5.51 | 4.94 | 4.08 | 4.81 | 2.75 | 2.07 | 2.48 | 2.14 |
| Friction Angle (ϕ) | 37.40 | 35.76 | 27.80 | 23.83 | 21.93 | 20.89 | 14.04 | 14.56 |
Table 3.
Nominal tensile strength of different root types of Spartina alterniflora.
| Root Type | Root Samples |
Peak load (N) |
Diameter (mm) |
Tensile strength (kPa) |
Average Tensile Strength (kPa) |
| R1 | R11 | 42.66 | 4.32 | 2913.062 | 2198.05 |
| R12 | 39.74 | 4.57 | 2420.523 | ||
| R13 | 28.17 | 5.33 | 1260.572 | ||
| R2 | R21 | 16.59 | 3.30 | 1937.54 | 2652.37 |
| R22 | 9.52 | 2.03 | 2935.37 | ||
| R23 | 8.50 | 1.78 | 3421.89 | ||
| R24 | 15.75 | 3.05 | 2158.09 | ||
| R25 | 14.68 | 2.79 | 2394.18 | ||
| R26 | 12.59 | 2.29 | 3067.12 | ||
| R3 | R31 | 8.18 | 0.86 | 13972.98 | 15617.63 |
| R32 | 7.92 | 0.76 | 17362.27 | ||
| R33 | 7.07 | 0.74 | 16597.02 | ||
| R34 | 5.65 | 0.69 | 15293.44 | ||
| R35 | 5.43 | 0.64 | 17135.97 | ||
| R36 | 8.76 | 0.91 | 13344.13 |
Note: Three samples for root type R1, six for R2 and six for R3 were selected from the tension tests to demonstrate the load—strain curves.
Table 4.
Root-reinforced soil cohesions from the direct shear tests and the W & W & FBM models.
| Layer | Soil shear plane area (mm2) | Root Type | Root Dia. (mm) | No. of roots | root area (mm2) | RAR for each root type | Tensile Strength (kPa) | Root cohesion Cr (kPa) (Wu et al. Perpendicular Model) | Root cohesion Cr (kPa) (FBM model) | Cr from Direct Shear Test (kPa) | Cr from tensile test (excluding 1.2 of Wu et al. model) | Co-relation coefficient | Average of co-relation coefficient |
| CYCLE 1 |
0.058 |
||||||||||||
| 0-8 cm |
3166.92 |
R1 | 5.33 | 1 | 22.346 | 0.0071 | 1260.57 | 54.97 |
49.65 |
3.10 |
45.81 |
0.07 |
|
| R1 | 4.32 | 1 | 14.644 | 0.0046 | 2913.06 | ||||||||
| R2 | 3.30 | 1 | 8.5530 | 0.0027 | 1937.54 | ||||||||
| R2 | 2.79 | 1 | 6.1136 | 0.0019 | 2394.18 | ||||||||
| R3 | 0.86 | 1 | 0.5809 | 0.0002 | 13972.98 | ||||||||
| R3 | 0.76 | 1 | 0.4536 | 0.0001 | 17362.27 | ||||||||
| R3 | 0.74 | 1 | 0.4301 | 0.0001 | 16597.02 | ||||||||
| R3 | 0.69 | 1 | 0.3739 | 0.0001 | 15293.44 | ||||||||
| R3 | 0.64 | 1 | 0.3217 | 0.0001 | 17135.97 | ||||||||
| R3 | 0.91 | 1 | 0.6504 | 0.0002 | 13344.13 | ||||||||
| 8-16cm |
3166.92 |
R1 | 4.57 | 1 | 16.417 | 0.0052 | 2420.52 | 36.32 |
19.02 |
1.70 |
30.27 |
0.06 |
|
| R2 | 2.79 | 1 | 6.1136 | 0.0019 | 2394.18 | ||||||||
| R2 | 2.29 | 1 | 4.1187 | 0.0013 | 3067.12 | ||||||||
| R3 | 0.86 | 1 | 0.5809 | 0.0002 | 13972.98 | ||||||||
| R3 | 0.76 | 1 | 0.4536 | 0.0001 | 17362.27 | ||||||||
| R3 | 0.74 | 1 | 0.4301 | 0.0001 | 16597.02 | ||||||||
| R3 | 0.69 | 1 | 0.3739 | 0.0001 | 15293.44 | ||||||||
| 16-24cm |
3166.92 |
R1 | 4.57 | No roots found in category R1 | 13.79 |
13.58 |
0.30 |
11.49 |
0.03 |
||||
| R2 | 1.78 | 1 | 2.4885 | 0.0008 | 3421.89 | ||||||||
| R2 | 2.03 | 1 | 3.2365 | 0.001 | 2935.37 | ||||||||
| R3 | 0.74 | 1 | 0.4301 | 0.0001 | 16597.02 | ||||||||
| R3 | 0.69 | 1 | 0.3739 | 0.0001 | 15293.44 | ||||||||
| R3 | 0.64 | 1 | 0.3217 | 0.0001 | 17135.97 | ||||||||
| CYCLE 3 | |||||||||||||
| 0-8 cm |
3166.92 |
R1 | 4.57 | 1 | 16.417 | 0.0052 | 2244.34 | 48.07 |
27.16 |
2.76 |
40.06 |
0.07 |
|
| R2 | 3.30 | 1 | 8.553 | 0.0027 | 1937.54 | ||||||||
| R2 | 3.05 | 1 | 7.3062 | 0.0023 | 2158.09 | ||||||||
| R2 | 2.79 | 1 | 6.1136 | 0.0019 | 2394.18 | ||||||||
| R3 | 0.86 | 1 | 0.5809 | 0.0002 | 13972.98 | ||||||||
| R3 | 0.76 | 1 | 0.4536 | 0.0001 | 17362.27 | ||||||||
| R3 | 0.74 | 1 | 0.4301 | 0.0001 | 16597.02 | ||||||||
| R3 | 0.69 | 1 | 0.3739 | 0.0001 | 15293.44 | ||||||||
| R3 | 0.64 | 1 | 0.3217 | 0.0001 | 17135.97 | ||||||||
| R3 | 0.91 | 1 | 0.6504 | 0.0002 | 13344.13 | ||||||||
| 8-16cm |
3166.92 |
R1 | 4.57 | No roots found in category R1 | 24.70 |
24.45 |
2.66 |
20.58 |
0.13 |
||||
| R2 | 2.79 | 1 | 6.1136 | 0.0019 | 2394.18 | ||||||||
| R2 | 2.29 | 1 | 4.1187 | 0.0013 | 3067.12 | ||||||||
| R2 | 2.03 | 1 | 3.2365 | 0.001 | 2935.37 | ||||||||
| R3 | 0.86 | 1 | 0.5809 | 0.0002 | 13972.98 | ||||||||
| R3 | 0.76 | 1 | 0.4536 | 0.0001 | 17362.27 | ||||||||
| R3 | 0.74 | 1 | 0.4301 | 0.0001 | 16597.02 | ||||||||
| R3 | 0.69 | 1 | 0.3739 | 0.0001 | 15293.44 | ||||||||
| R3 | 0.64 | 1 | 0.3217 | 0.0001 | 17135.97 | ||||||||
| R3 | 0.91 | 1 | 0.6504 | 0.0002 | 13344.13 | ||||||||
| 16-24cm |
3166.92 |
R1 | 4.57 | No roots found in category R1 | 10.19 |
10.87 |
0.00 |
8.49 |
0.00 |
||||
| R2 | 1.78 | 1 | 2.4885 | 0.0008 | 3421.89 | ||||||||
| R3 | 0.74 | 1 | 0.4301 | 0.0001 | 16597.02 | ||||||||
| R3 | 0.69 | 1 | 0.3739 | 0.0001 | 15293.44 | ||||||||
| R3 | 0.64 | 1 | 0.3217 | 0.0001 | 17135.97 | ||||||||
Disclaimer/Publisher’s Note: The statements, opinions and data contained in all publications are solely those of the individual author(s) and contributor(s) and not of MDPI and/or the editor(s). MDPI and/or the editor(s) disclaim responsibility for any injury to people or property resulting from any ideas, methods, instructions or products referred to in the content. |
© 2025 by the authors. Licensee MDPI, Basel, Switzerland. This article is an open access article distributed under the terms and conditions of the Creative Commons Attribution (CC BY) license (http://creativecommons.org/licenses/by/4.0/).
Copyright: This open access article is published under a Creative Commons CC BY 4.0 license, which permit the free download, distribution, and reuse, provided that the author and preprint are cited in any reuse.


