Submitted:
23 April 2025
Posted:
23 April 2025
You are already at the latest version
Abstract
Hadal amphipods are ubiquitous inhabitants of hadal ecosystems, where gut microbiota plays key roles in host physiology and environmental adaptation, establishing them as critical targets for investigating host-ecosystem interactions. Current research on hadal amphipod gut microbes is limited, especially for culturable fungi, with no reported fungal characterization from their digestive systems. This study reports the successful isolation of Aspergillus sydowii XTO612 from the gut of hadal amphipods. Comparative physiological profiling with A. sydowii DM1, originating from hadal sediment, revealed significant interspecific divergence in hypo-osmotic stress responses (0.1 M NaCl). Employing low-osmolarity conditions as an environmental stressor, we systematically compared osmotic adaptation mechanisms in two A. sydowii strains through a multi-parametric approach. The alterations of secondary metabolites, metabolic activity, micromorphology, and reactive oxygen species in hadal filamentous fungi under different osmotic pressures, demonstrating enhanced stress responsiveness in the A. sydowii XTO612. Transcriptomic analyses under hypo-osmotic conditions revealed comprehensive regulatory strategies in A. sydowii XTO612, including modulation of membrane permeability, cell wall restructuring, energy metabolism reprogramming, and osmolyte biosynthesis pathways to optimize osmotic homeostasis. Differences in physiological responses between two strains of the same genus shows that selective pressures in different habitats have driven marine filamentous fungi to develop unique environmental adaptation mechanisms during evolution.
Keywords:
hadal
; amphipods
; Aspergillus sydowii
; transcriptomic analyses
; environmental adaption
1. Introduction
The oceans cover 71% of the Earth’s surface, but contain 80% of the planet’s biological resources and are therefore considered to be the origin of life [1]. The deep ocean represents a uniquely extreme environment, distinguished by its high pressures, low temperatures and variable salinity and oxygen concentrations [2]. The influence of geological formations has led to changes in seafloor topography, resulting in diverse and topographically complex ecological environments such as trenches, hydrothermal vents and cold seep [3]. The presence of a wide range of biological populations in extreme hadal environments is well documented [4,5]. Hadal environments, distinguished by their unique features, necessitate physiological and biochemical adaptations for organisms to thrive and survive within this extreme habitat [6]. Amphipods, known for their global distribution and dominant predatory roles in hadal environments [7], have emerged as key subjects in recent studies of adaptation to these extreme habitats [8,9,10] . Gut microbes have been demonstrated to be integrally associated with various facets of host physiology, including improving the nutrient assimilation, strengthening the immune system of the host, and enhancing environmental adaptability [11,12,13], while the composition of the gut microbial community is influenced by host species and environmental factors. Despite the growing recognition of the importance and necessity of gut microbes, the microbial community and diversity within the amphipod gut remain understudied [14]. Current research on the gut microbiota of hadal amphipods has focused on bacterial biodiversity and biological functions, but there is a gap in the study of fungi isolated from the gut of hadal amphipods.
Fungal organisms must dynamically acclimate to heterogeneous environmental stressor through coordinated morpho-physiological adaptations across their life cycle stages, from conidial germination to reproductive maturation [15]. Hadal fungal endemic to hadal zones must physiologically contend with extreme environments: sustained hydrostatic pressures, near-constant psychrophilic conditions, and osmotic gradients. Fungi regulate intracellular water activity in the face of osmotic stress by accumulating compatible soluble such as glycerol and alginate [16]. Under osmotic pressure, fungi adapt to osmotic stress through plasma membrane restructuring [17] and cell wall thickening [18]. Additionally, osmotic perturbation induces increased fatty acid unsaturation [17] and morphological alterations in fungal colonies. High osmotic stress induces adaptive strategies in fungi, reallocating resources to dispersal-optimized morphogenesis to colonize new niches. Concurrently, osmotic stress modulates secondary metabolite biosynthesis through stress-responsive regulatory pathways [14,19].
A. sydowii is an extremely widespread fungus found in both terrestrial and marine environments, considered to be a causative agent of coral reef disease [20]. A. sydowii has been found to be of great research value as a halophilic fungus prevalent in various marine ecosystems. A. sydowii is capable of producing structurally diverse metabolites [21,22]. In addition, A. sydowii can produce a variety of enzymes with significant industrial and biotechnological potential, which is important for the development and use of bioenergy [23,24]. Currently, most research on A. sydowii focuses on the secondary metabolites and the salinophilic mechanism. Recent studies have shown that in the halophilic fungus A. sydowii, the physiological response to salinity varies under additional stress condition [25]. Under high osmotic pressure conditions (2.0 M NaCl), A. sydowii induces cell wall reorganization and alters the structure and composition of the cell wall by regulating the expression of relevant genes to enhance cellular tolerance to high salt environments. However, there is a significant dearth of research regarding both the response and regulation of A. sydowii under conditions of low osmotic pressure.
While studies on hadal fungal adaptation to extreme environments remain scarce, we successfully isolated and characterized A. sydowii XTO612, a filamentous fungus obtained from hadal amphipod gut microbiota, and investigated its response to osmotic stress. Furthermore, our study conducted a multi-level phenotypic comparison of two A. sydowii strains isolated from distinct hadal ecosystems with a comparative assessment. Analyses encompassed metabolic activity, growth rate, micromorphology and reactive oxygen species measurements of the marine filamentous fungus in response to the osmotic stress. Complementary transcriptomic profiling elucidated stress-responsive gene networks governing fungal osmoregulation. These findings establish foundational insights into fungal ecological contributions to hadal biogeochemical cycling.
2. Materials and Methods
2.1. Sample Collection and Isolation, Growth Rate Determination
Hadal amphipods were collected from the Challenger Deep of the Mariana Trench in September 2021 using a microbiological pressure-retaining sampler deployed. Two sampling points were located at A (11°19.6098′N, 142°11.283′,10,895 m )and B (11°22.584′N, 142°35.3102′E,10,910 m) [27]. Amphipods were stored at -80 °C immediately after collection. The samples were transferred to 4 °C and rinsed with distilled water. All amphipods were dissected with a sterile scalpel and the gut tissues were carefully removed and stored in 2 mL centrifuge tubes at 4 °C. The apparatus ensured that there was no external microbial contamination, thus guaranteeing the authenticity of the hadal fungal isolation. The gut contents of the amphipods were diluted to ratios of 10⁻², 10⁻³, and 10⁻⁴ with freshly prepared 3.4% sterile NaCl solution. Subsequently, 200 µL of each dilution was plated onto Potato Dextrose Agar (PDA) plates, which were then incubated at 28 °C for 4-7 days. Pure cultures were obtained by picking a small amount of mycelium from the colony edge and re-inoculated it into the center of a new plate, based on the methods described in our previously study [28]. In addition, three strains of A. sydowii from other sources isolated in our laboratory were selected. Strain DM1 was obtained from hadal sediments at 10,898 m depth in the Mariana Trench, strain SDM1 originated from a shallow marine ecosystem, and strain L-5 was isolated from intertidal mudflat samples collected at Luchaogang Beach, China.
Each of the four A. sydowii was inoculated onto PDA of different salinities (0 M, 0.1 M, 0.3 M, 0.5 M, 1 M, and 2 M NaCl) incubated at 28 °C, and growth diameters were measured daily.
2.2. DNA Extraction, PCR Amplification, and Phylogenetic Analysis
All fungal total DNA extracts were taken according to the manufacturer’s instructions of TIAN combi DNA Lyse & Det PCR Kit (TIANGEN BIOTECH, China). The polymerase chain reaction (PCR) was conducted as previously described [28]. The PCR amplification products were analyzed by GENEWIZ(Suzhou). The amplified sequences were analyzed and identified by comparison with sequences in the NCBI database using the BLASTn program. Phylogenetic trees were constructed using MEGA11 software with Clustal W [29].
2.3. Morphological Characterization of A. sydowii
The fungal colony was incubated on PDA medium at a constant temperature of 28 °C for 3-7 days. Fresh spore suspension was prepared and drops on 2% agar thin-layer medium (0.1 M: 5.8 g/L NaCl, 20 g/L Agar; 0.5 M: 28 g/L NaCl, 20 g/L Agar) of different salinities, placed on slides and incubated for 2 days, then the mycelial morphology was observed under a microscope.
Fungal colonies were incubated on PDA medium at a constant temperature of 28 °C for 3-7 days, after which the surface spores were scraped with sterile water and filtered to obtain a pure spore suspension. The fresh spore suspension (4×10⁶ cell/mL) was placed on PDA medium with different salinity (0 M, 0.1 M, 0.3 M, 0.5 M, 1 M, 2 M) and incubated at 28 °C for 10 days to observe the colony morphology.
2.4. Secondary Metabolite Analysis of Two A. sydowii
Secondary metabolites were extracted according to Xiao [30].Preparation of spore suspensions(4×10⁶ cell/mL) and inoculation into potato dextrose broth (PDB) of 0.1 M and 0.5 M salinity. The fermentation broth was then incubated at 28 °C for 10 days in a rotary incubator at 180 rpm. The liquid culture was extracted three times with equal volumes of ethyl acetate. The ethyl acetate crude extract was obtained by concentrating the combined extract using a rotary evaporator. Samples of the crude extracts were prepared by dissolving them in 1 mL of methanol to give a uniform concentration of 100 mg/mL. The solutions were then filtered through a 0.22 μm filter membrane.
The concentration of crude extracts was used for LC-MS/MS analysis. Ultra-performance liquid chromatography/tandem mass spectrometry (UPLC-MS/MS) was used as previously described [31] for the qualitative identification of secondary metabolites. The UPLC-MS/MS analysis was performed using a Vanquish UPLC system coupled to a high-resolution mass spectrometer (Thermo Fisher Scientific) equipped with an electrospray ionization (ESI) interface. The chromatographic separation was performed on a Waters ACQUITY UPLC BEH C18 column (2.1×100 mm, 1.7 μm, USA). The mobile phase was delivered at a flow rate of 0.4 mL/min. The column temperature was maintained at 60 °C, while the sample injection temperature was set at 10 °C.
2.5. Conidial Number and Evaluation of Metabolic Activity of Polarized Growth Conidia of A. sydowii
Following 4 days cultivation on PDA under differential NaCl concentration (0.1 M and 0.5 M) at 28 °C, A. sydowii conidia were aseptically collected through sterile water washing. For the spore suspension obtained, the number of spores was counted under a microscope using a hemocytometer. Three sets of replicates were performed for each set of samples.
The advanced resazurin test as the previous report was used to evaluate the metabolic activity of spores subjected to hypotonic treatment [32]. Conidial suspensions were prepared by scraping spores from the surface of PDA using 0.1 M and 0.5 M salinity minimal medium (MM: 1% glucose and 70 mM NaNO3) at 28 °C for 7 days, respectively. The conidia suspensions (4×10⁶ cell/mL) were incubated in 200 μL of minimal medium with 0.1 M and 0.5 M at 37℃. After 8 hours, the medium in each well was replaced with 100 μL of medium supplemented with a final concentration of 25 μg/mL resazurin. The plates were then incubated at 37 °C for every 12 hours. The assay was performed in a 96-well cell plate in a spectrophotometer (Thermo Scientific Multiskan® Spectrum) with an excitation wavelength of 530 nm and an emission wavelength of 590 nm. Three replicate wells were used for each concentration. A negative control was established using the same amount of resazurin and minimal medium to quantify background absorbance.
2.6. Determination of Mycelial Septum Length of Two A. sydowii
Polarized-growth conidia were induced by incubating fresh spores in PDB supplemented with 0.1 M or 0.5 M NaCl under static culture conditions for 18 h. Polarized growth conidia were harvested and stained with a final concentration of 25 μg/ml Calcofluor white (CFW; Sigma-Aldrich) as the previous report [33] and then incubated in the dark for 5 min at 37 °C. Each sample was washed three times with phosphate-buffered saline (PBS). Morphometric analysis of septal spacing was conducted using fluorescence microscopy. Slides were systematically scanned to measure hyphal septum intervals across ≥ 20 randomly selected microscopic fields. All experimental treatments included triplicate biological replicates with independent staining procedures to ensure methodological rigor and data reproducibility.
2.7. Reactive Oxygen Measurements of A. sydowii
Reactive oxygen species measurements were performed as described previously [32]. Freshly harvested conidia were aseptically inoculated into PDB supplemented with 0.1 M and 0.5 M NaCl at 28 °C using an orbital shaker 180 rpm for 60 h in darkness. Subsequently, hyphae were harvested by centrifugation, and DCFH-DA at a final concentration of 10 μM was added into the medium, which was then incubated at 37 °C for 1.5 h. After that, the mycelium was rinsed three times with PBS buffer in a 1.5 mL centrifuge tube, and weighed to the same mass and transferred to a new 1.5 mL centrifuge tube, then the mycelium was thoroughly crushed with a pestle and mortar, and the fluorescence intensity was measured by fluorescence microscopy with an excitation wavelength of 488 nm and an emission wavelength of 525 nm. The relative amount of ROS was normalized by the fluorescence intensity. The experiment was repeated at least three times to ensure the reliability of the results.
2.8. RNA-Seq Analysis
To perform RNA sequencing and transcriptomics analysis, the two A. sydowii spore suspensions (4×10⁶ spores/mL) were inoculated in 0.1 M and 0.5 M NaCl PDB and incubated at 28 °C using an orbital shaker 180 rpm for 3 days, after which biomass was harvested. The mycelium was ground thoroughly with liquid nitrogen and stored at -80 °C in RNAiso Plus (Takara, Japan).
The RNA extraction, transcriptomics sequencing, and bioinformatics analysis were accomplished by Novogene Co., Ltd (BGI, China). Transcriptome libraries were constructed after end repair, A-tailing, adapter ligation, size selection, amplification, and purification. The final product was loaded on Illumina for RNA sequencing. Gene expression levels were calculated by FPKM values using RSEM software. Differential expression analysis was performed using DESeq2. Qvalue≤0.05 and |log2(foldchange)|≥1 was set as the threshold for significant differential expression. All differentially expressed genes (DEGs) are annotated against NR, Swiss-Prot [34], Pfam [35], EggNOG [36], GO [37], and KEGG [38] database.
2.9.qRT-PCR Validation
To validate the RNA-Seq results, quantitative reverse transcription PCR (qRT-PCR) analyses were performed as previously described [39]. Total RNA was acquired from Novogene Co,Ltd and RNA reverse transcription was according to the manufacturer’s instructions for the PrimeScript RT Reagent Kit (Takara, Japan). Gene expression levels were calculated using the 2-∆∆Ct methods [40].
3.0. Statistical Analysis
All experiments and experimental groups were performed in at least triplicate, with three biological replicates for each sample. Statistical differences (**** p < 0.0001, *** p < 0.001, ** p < 0.01, and * p < 0.05) were analyzed by one-way analysis of variance (ANOVA). Statistical analysis and graphing with GraphPad Prism 8.0.2.
3. Results
3.1. Identification of A. sydowii XTO612 from the Gut of Hadal Amphipods
Aspergillus sydowii XTO612, was isolated and characterized from the gut of hadal amphipods in the Mariana Trench. To elucidate the environmental adaptations of A. sydowii from different habitats, we conducted a comparative analysis involving A. sydowii XTO612 and three strains of A. sydowii from other sources currently isolated in the laboratory. Due to insufficient resolution from rRNA gene regions for fungal classification, we selected the β-tubulin (benA) and calmodulin (cam) genes as secondary phylogenetic markers to achieve more confident species-level identification, with all primer sequences detailed in Table S1. Phylogenetic analysis with combination of ITS, benA, and cam markers for phylogenetic tree construction (Figure 1a, Table S1).
To compare the osmotic stress tolerance of A. sydowii from different habitats, we selected four A. sydowii strains from diverse habitats to assess osmo-tolerance and determine mycelial morphological variations under osmotic stress (0.1 M and 0.5 M NaCl). The mycelial morphology of the four A. sydowii strains under 0.1 M and 0.5 M salinity conditions was observed microscopically on agar plates, hyphal swelling was absent exclusively in A. sydowii XTO612, whereas all three A. sydowii strains (DM1, SDM1, and L-5) exhibited hyphal swelling under 0.1 M salinity conditions (Figure 1b). To elucidate the evolution strategies of A. sydowii across geographically distinct hadal zones, we selected two hadal-origin strains of similar isolation depths.
After 7 days of incubation at 28 °C, the colony morphology of the two A. sydowii species on PDA was almost similar to that of green ascomycete colonies and white margin (Figure 1c-d). The microscopic morphology of A. sydowii XTO612 was observed to exhibit the typical phenotype of conidiophores and conidia (Figure 1e-f). The salt tolerance of A. sydowii were evaluated through the measurement of growth diameter on PDA at varying NaCl concentrations, which turned out the 0.5 M NaCl was the optimal concentration (Figure S1).
3.2. Secondary Metabolism of A. sydowii Differs Under Hypotonic Stress from Different Habitats
Fungi that survive in different environments are constantly challenged by a variety of environmental stresses, and the production of secondary metabolites varies with the environment [41]. To evaluate the phenotypic variations between the two A. sydowii strains derived from distinct habitat sources, the strains were inoculated on PDA with different salinities (0 M, 0.1 M, 0.3 M, 0.5 M, 1 M, 2 M) and incubated at 28 °C for 7 days for observation (Figure 2a). Our findings reveal significant intraspecific variation in secondary metabolite production between the two A. sydowii strains under different salinity conditions. The experimental results demonstrated that salinity exerted a profound influence on pigment biosynthesis, with A. sydowii DM1 exhibiting robust pigment production across a range of NaCl concentrations (0 M, 0.1 M, 0.3 M, and 0.5 M NaCl). In contrast, A. sydowii XTO612 showed markedly reduced pigmentation capacity at lower salinity levels (0 M and 0.1 M NaCl). Notably, pigment synthesis was completely inhibited in both strains when exposed to elevated salinity conditions (1 M and 2 M NaCl), suggesting a salinity threshold for pigment production in these fungal strains.
Subsequently, fungal suspensions of A. sydowii were inoculated in PDB medium with varying salinity levels (0 M, 0.1 M, and 0.5 M NaCl). The results revealed that 0.1 M salinity represented a particularly intriguing inflection point for pigment production, where the responses of the two strains diverged significantly. Notably, A. sydowii DM1 exhibited maximal pigment production in the fermentation broth at 0.1 M salinity, whereas A. sydowii XTO612 showed the weakest pigmentation under the same condition. This striking contrast highlights the strain-specific modulation of metabolites biosynthesis by salinity (Figure 2b-2c).
To further explore the effects of 0.1 M hypo-osmotic conditions on the two strains, their metabolites were extracted and subjected to UPLC-MS/MS analysis. By comparing the metabolites of the two A. sydowii strains under the same hypotonic stress, distinct peaks were found in the total ion chromatogram (TIC) (Figure 2d). The results showed that the secondary metabolites of the two strains of A. sydowii were significantly different at a salinity of 0.1 M NaCl. Subsequently, the mass spectrometry data were subjected to a comparative analysis in the COCONUT, NP Atlas, and StreptomeDB databases [7] with the objective of identifying the corresponding compounds. To investigate the phenotypic divergence between the two strains under low-osmolarity conditions, 10 compounds exhibiting pronounced alterations in chromatographic signal intensities were identified. The top 10 compounds were identified as A-1(C37H56N8O7), A-2(C39H58N6O9), A-3(C28H41NO2), A-4(C15H18N2O3), A-5(C34H60O15), A-6(C35H62O15), A-7(C18H18O7), A-8(C44H58O6), A-9(C33H58O15), A-10(C38H57N9O8) by database comparison (Table S2).
3.3. Enhanced Growth of A. sydowii XTO612 Under Hypoosmotic Stress
Previous experimental validation demonstrated that fresh conidia of A. sydowii can reach the polarized growth phase after 10-12 hours of static incubation in PDB medium [41]. Following 16-hour static cultivation in PDB, mycelial morphology was examined via microscopy and CFW staining (Figure 3a). Quantification of septal length was performed across multiple microscopic fields, with a minimum of 20 independent measurements per replicate and three biological replicates per strain to ensure statistical robustness (Figure S2). Under 0.5 M NaCl, the mean septal length of A. sydowii XTO612 was quantified as 26.48 μm, whereas a statistically significant reduction to 18.65 μm was observed under hypo-osmotic stress (0.1 M NaCl). Similarly, A. sydowii DM1 exhibited a septal length of 27.50 μm at 0.5 M NaCl, decreasing to 23.3 μm under 0.1 M NaCl. Comparative analysis revealed that both strains displayed elongated septal intervals under optimal stress relative to hypo-osmotic environments, with A. sydowii XTO612 demonstrating a greater reduction in septal length compared to A. sydowii DM1 under low-salinity conditions.
Recent studies have demonstrated a significant reduction in conidial production under hyperosmotic conditions [42]. To examine whether low-salinity conditions influence conidial production in A. sydowii strains from distinct sources, conidial counts for both strains were quantified using a hemocytometer at 0.1 M and 0.5 M NaCl. The results revealed that both strains exhibited enhanced sporulation at 0.1 M salinity compared to 0.5 M salinity. Notably, A. sydowii XTO612 displayed a 40% increase in spore production at 0.1 M salinity relative to 0.5 M salinity, whereas A. sydowii DM1 showed a 20% increase under the same conditions. Furthermore, A. sydowii XTO612 outperformed A. sydowii DM1 in spore production under low-osmotic stress, highlighting strain-specific responses to salinity variation (Figure 3b).
3.4. Enhanced Metabolic Activity of A. sydowii XTO612 Under Hypoosmotic Stress
The transition of spores from dormancy to active growth underscores the adaptability of spores to their environment [26]. To assess the difference in spore metabolic activity between the two A. sydowii strains under low salinity conditions, we prepared fresh spore suspensions and subjected the spores to low salinity stress and used the fluorescence values of resazurin under a fluorescent enzyme labeler as an indicator for spore metabolic viability assays. Heat maps were plotted based on the values after normalization of the fluorescence values of A. sydowii DM1 at 48 h at 0.5 M NaCl (Figure 3c). The results showed that the metabolic activity of A. sydowii XTO612 under low salinity conditions could be restored to that under normal salinity conditions within 48 h. In contrast, the metabolic activity of A. sydowii DM1 under low salinity conditions was lower than that of A. sydowii DM1 under normal salinity conditions.
Oxidative stress is induced when the level of reactive oxygen species (ROS) exceeds the antioxidant capacity of the cell, thus prompting the cell to adopt various defense and repair strategies [43]. To further verify whether the oxidative stress responses of the two A. sydowii strains differed under hypotonic conditions, a reactive oxygen species assay kit (Beyotime, China) was employed to detect the intracellular reactive oxygen species content. The content of ROS was evaluated using fluorescence values. The results showed that both A. sydowii exhibited significantly higher ROS levels at 0.1 M salinity compared to 0.5 M salinity (Figure 3d). The two A. sydowii strains exhibited different ROS levels in response to the same salinity stress, with A. sydowii XTO612 exhibiting significantly lower ROS levels compared to A. sydowii DM1 at 0.1 M salinity.
3.5. Transcriptome Overview, Differentially Expressed Genes, and Enrichment Analysis
To clarify the molecular mechanism of adaptation of A. sydowii in different environmental conditions, especially in low salinity. We conducted RNA sequencing analyses on two A. sydowii strains under different osmotic pressure conditions (0.1 M, 0.5 M). Statistical analysis of the FPKM values obtained was conducted to screen for differential genes. Raw reads information was listed in Table S3, which indicated the reliability of RNA-Seq data in this work.
Principal component analysis of the expression profiles of all samples revealed that the expression profiles of the two A. sydowii strains under osmotic stress exhibited statistically significant differences between individuals. A total of 10270 differentially expressed genes (DEGs) were identified in A. sydowii XTO612 under 0.1 M and 0.5 M salinity conditions, including 793 up-regulated genes and 793 down-regulated genes. A total of 902 differentially expressed genes (DEGs) were identified in A. sydowii DM1 under 0.1 M and 0.5 M salinity condition, including 432 up-regulated genes and 470 down-regulated genes (Figure S3). The focus was on the differentially expressed genes of the two strains in relation to the low salinity conditions and these differentially expressed genes were analyzed comparatively. The two strains of A. sydowii were further screened for up-regulated and down-regulated differentially expressed genes. The results revealed that A. sydowii XTO612 exhibited 719 unique up-regulated genes and 640 unique down-regulated genes, while A. sydowii DM1 displayed 358 unique up-regulated genes and 316 unique down-regulated genes (Figure 4a-4b). These differential genes may indicate their potential function under low osmotic conditions, which in turn may reveal the mechanism of adaptation of the two strains. Further analysis is required to confirm this hypothesis. Gene names and the proteins they encode were listed in Table S4.
DEGs for the two A. sydowii strains at 0.1 M salinity were enriched in the KEGG and GO databases. Additionally, the top 10 items in all groups were further enriched in Figure 4c-4d. Comparative transcriptomic analysis revealed that A. sydowii DM1 exhibited a paucity of DEGs, with no significant functional enrichment detected in GO database or KEGG pathways. Consequently, subsequent investigations were prioritized to elucidate the transcriptional dynamics and response mechanisms of A. sydowii XTO612 under low-osmolarity stress. Among the top 10 entries analyzed by GO enrichment, two functional categories, cellular components and molecular functions, were mainly involved. Among them, differentially expressed genes related to biological processes (GO:0009987) accounted for most of the entries, which were mainly enriched in the GO functional categories oxidoreductase activity (GO:0016491), cofactor binding (GO:0048037) and coenzyme binding (GO:0050662). In the KEGG enrichment analysis, there was a high percentage of differentially expressed genes in the pathways of peroxisome metabolism (ko04146), tryptophan metabolism (ko00380), lysine degradation (ko00310), glyoxylate and dicarboxylic acid metabolism (ko00310) and glycine, serine and threonine metabolism (ko00260). These results implied that biosynthesis of amino acids, lipid metabolism play an essential role in A. sydowii XTO612 under low-osmotic conditions.
The expression patterns of all DEGs identified by qRT-PCR were found to be consistent with those observed in the RNA-seq data, which serves to validate the reliability of the RNA-seq data (Figure S4). The results substantiated the reliability of the RNA-Seq data and simultaneously demonstrated that transcriptome analysis is a reliable tool for investigating the regulatory mechanisms of filamentous fungi under low osmotic stress conditions.
3.6. Cell Wall Composition Shows Variations Under Hypotonic Stress
In our results, hypoosmotic stress induced major changes in the transcriptional levels of DEGs related to cell wall components (Figure 5a). Among these, the expression levels of the chitin synthase gene (chs1) and the mannose-6-phosphate isomerase gene (manA) were significantly up-regulated. This suggests that the biosynthetic processes of chitin and mannose may be enhanced, leading to increased levels of these components in the cell wall. At the same time, the expression of the glucan 1,3-β-glucosidase (E3.2.1.58) gene was down-regulated. The downregulation of this enzyme, which is mainly responsible for the hydrolysis of β-1,3-glucan, may result in the inhibition of β-1,3-glucan catabolism, which in turn may contribute to the accumulation of β-1,3-glucan in the cell wall. Next, a heat map containing the major genes associated with hypoosmotic stress tolerance was drawn (Figure 5b).
3.7. Energy Metabolic Pathways Shows Variations Under Hypotonic Stress
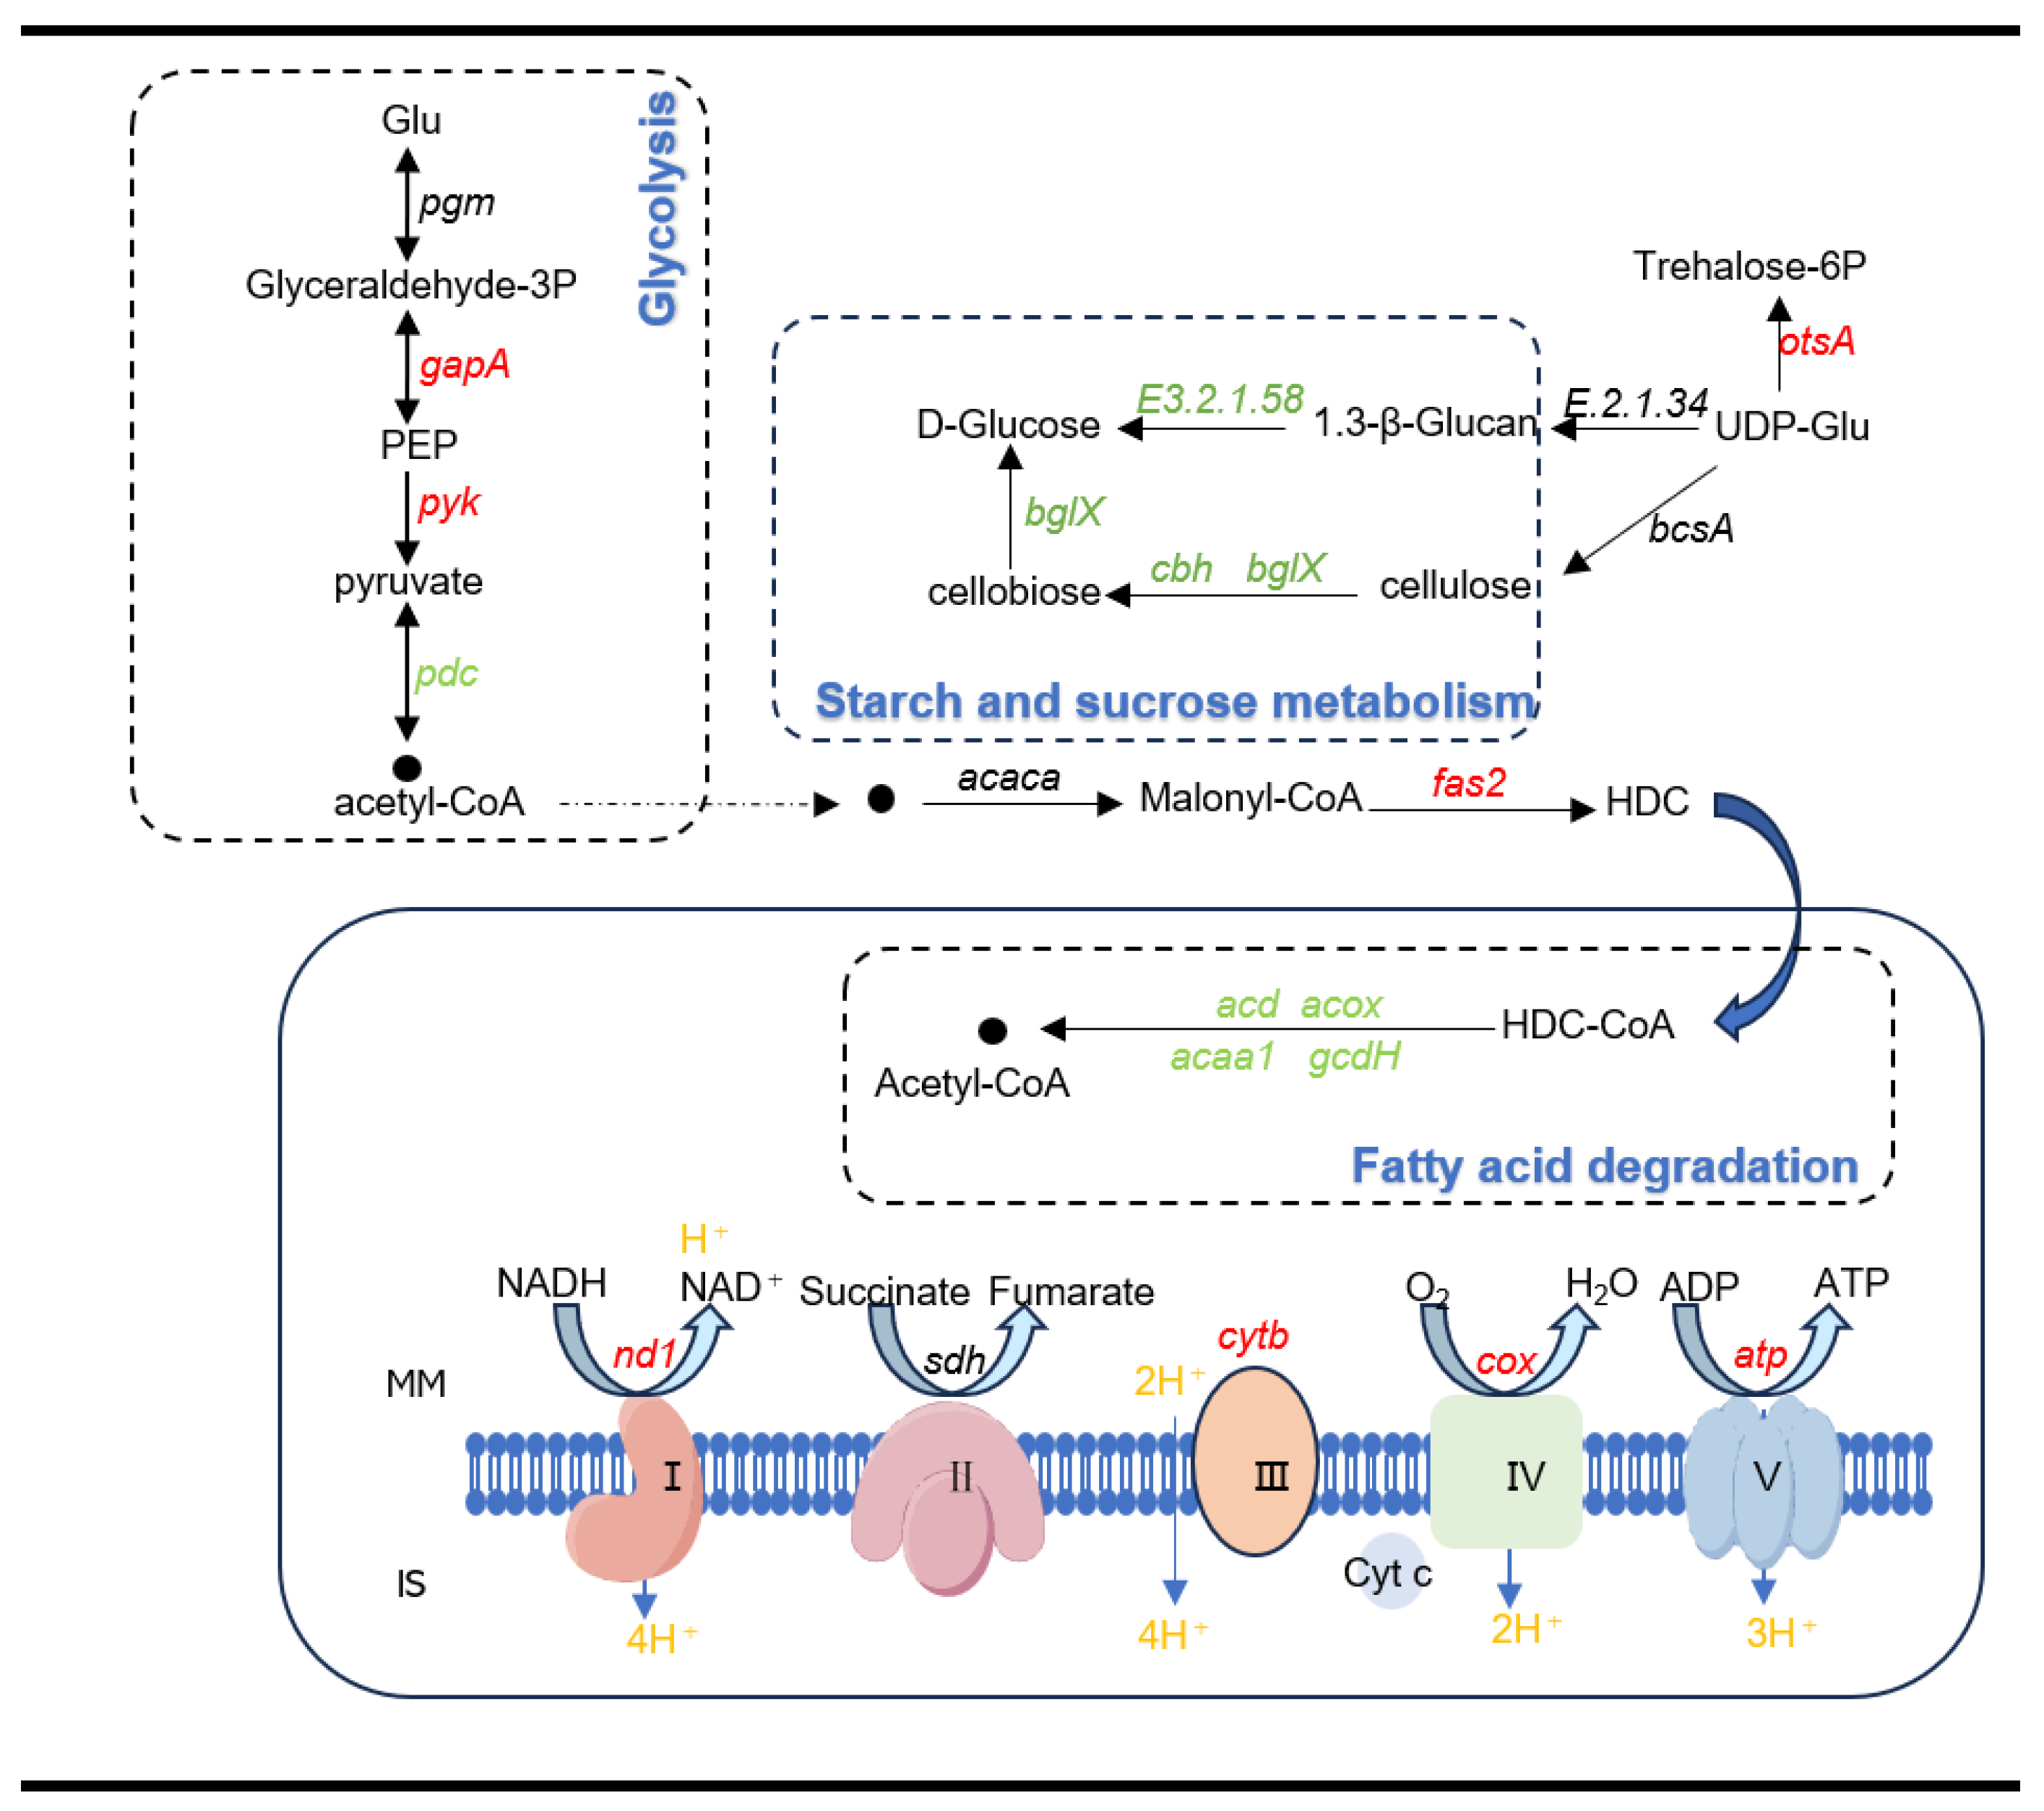
The expression of genes related to the oxidative phosphorylation pathway showed significant differences (Figure 5b, Figure 6). Eight genes were significantly up-regulated, including the genes involved in the NADH-ubiquinone oxidoreductase chain (ND4L, ND5, ND4, ND1), NADH:quinone reductase (ndh), ubiquinone-cytochrome c reductase cytochrome (cytB) and the F-type H ⁺transporter ATPase subunit (ATP9, ATP6). At the same time, the expression of the cytochrome c oxidase subunit (cox) gene was downregulated. NAD+-dependent phosphorylation D-glyceraldehyde-3-phosphate dehydrogenase (GAPDH) converts D-glyceraldehyde-3-phosphate to 1,3-diphosphoglycerate [44] and is a key enzyme in the glycolysis and gluconeogenesis pathways.
The expression of genes related to the glycolysis pathway showed significant differences (Figure 5b, Figure 6). The expression of two genes was upregulated and one gene was downregulated. One of these is the up-regulated expression of the pyruvate kinase (pyk) gene, which is a key regulator controlling metabolic fluxes and ATP production during glycolysis [45], while almost all pyk are heterologously regulated by various physiological effectors [46]. Upregulation of the expression of the relevant genes is likely to increase the operational efficiency of the pathway, which in turn generates more ATP to adequately support the energy demands of the cells.
Differential expression of genes involved in the synthesis of soluble substances was also observed, which could contribute to the regulation of osmotic pressure (Figure 5b, Figure 6). The expression of the gene responsible for the synthesis of 6-phosphate alginate (otsA) was upregulated, while the expression of the gene associated with sucrose degradation (bglX) was downregulated.
Fatty acid degradation, another pathway that generates acetyl-CoA, overexpression of two genes was also observed (Figure 5b, Figure 6). Fatty acid synthesis subunit and bifunctional Δ-12/ω-3 fatty acid desaturase(log2folgchange≥1,qvalue<0.05). The former implies an increased fatty acid content, while the latter is involved in the synthesis of unsaturated fatty acids. At the same time, the expression of genes of the fatty acid degradation pathway (acaa1, acox) was down-regulated, which directly led to an increase in fatty acid content. The function of these enzymes may increase the fluidity of the cell membrane, which was described in the extremely halotolerant black yeast [5]. These adjustments may make A. sydowii XTO612 better adapted to low osmotic condition.
4. Discussion
The primary distinction between freshwater and marine environments lies in the level of salinity [47,48]. Marine environments, characterized by high osmotic pressure, cause water loss from non-adapted cell [49]. In response, marine microorganisms have evolved to restructure their life processes, enabling them to thrive in these hypertonic conditions. So, how do marine microbes respond when they are removed from the high osmotic pressure marine environment? In our work, a strain of A. sydowii XTO612 was isolated and characterized from the gut of hadal amphipod. The physiological response to the osmotic stress was determined and compared with that of A. sydowii DM1, derived from hadal sediments. However, research on A. sydowii as a salinophilic fungus has predominantly concentrated on adaptation mechanisms under high salinity conditions [10]. Under hyperosmotic conditions, A. sydowii synthesizes glycerol, remodels cell wall architecture to enhance thickness, modifies membrane lipid composition, and upregulates hydrophobic protein biosynthesis [25]. Under salt-free conditions, A. sydowii upregulates trehalose biosynthesis and hydrophobic protein-encoding genes. Concurrently, polyol accumulation correlates with constitutive activation of Hog1 kinase homologs in without NaCl environment [10,25]. However, analogous investigations under low osmolarity conditions remain absent. Thus, here, low osmotic pressure was employed as an environmental stress to investigate the mechanism of A. sydowii response to osmotic stress in different habitats of hadal. This should be the most comprehensive study of filamentous fungal growth under low osmotic pressure conditions in recent years and provides insights for future studies in environmental adaptation as well as in mechanisms that respond to low osmotic pressure.
There is limited information available on the adaptations and genomic information of cultivable filamentous fungi from different habitats under osmotic stress, and there is a paucity of studies on the relationship between their physiological properties and hypotonic stress. Novelty, in this study the two strains of A. sydowii exhibited divergent physiological responses to low osmotic pressure (0.1 M NaCl). It is worth noting that A. sydowii from different sources is highly adaptable to the environment in which it lives. Comparing different isolates of the same fungal species can offer valuable insights into the environmental adaptation strategies of filamentous fungi. For example, A. sydowii isolated from marine environments has been demonstrated to be pathogenic to corals, whereas its terrestrial counterpart does not exhibit such pathogenicity [12]. Different sources of Pseudomonas syringae exhibited varying epiphytic competencies and hyperosmotic tolerance, indicating that even microorganisms of the same species possess distinct strategies for coping with osmotic stress [13]. Thus, this study compared the growth, development, and metabolism of two congeneric marine filamentous fungi at multiple phenotypic levels. Additionally, transcriptomics technology was employed to investigate the intrinsic genes of these fungi, aiming to elucidate the regulatory mechanisms underlying their responses to environmental stress.
Recent research on marine fungi has achieved significant progress in drug discovery, with these organisms generating chemically diverse compounds exhibiting broad-spectrum antibacterial, antiviral, and anticancer activities in preclinical models, underscoring their value as a critical source of medicinal natural products [9,52,53]. It is well known that osmotic stress affects secondary metabolism in Aspergillus [14]. A recent study has linked VeA, a light-dependent global regulator controlling both sexual/asexual morphogenesis and secondary metabolism in filamentous fungi, to the osmotic-stress response in A. flavus [54]. In our experiments, we found that the production of secondary metabolites by the fungus was promoted under low osmotic pressure conditions and that A. sydowii was able to produce more secondary metabolites. While previous studies have shown that high osmolarity affects the production of fungal secondary metabolites, the present study from a low osmolarity point of view provides new directions and opportunities for the subsequent development of marine drugs.
A notable finding from our study reveals that A. sydowii XTO612 lacked mycelial swelling under low osmolarity conditions, with reduced septal spacing compared to the optimal growth condition. The function of mycelial septa in fungi has not been clearly established in the literature, but some researchers have suggested that mycelial septa may increase the rigidity of the mycelium and may be able to provide additional structural support to the mycelium [55]. Fungal cell walls are capable of remodeling their intrinsic components in response to external changes such as temperature, pH, osmotic stress, and other factors [56]. Our transcriptome results show that the expression of genes related to cell wall remodelling is up-regulated and that they are able to synthesise unsaturated fatty acids and increase the fluidity of the cell membrane. The divergent responses of the two A. sydowii strains to identical hypotonic stress can be attributed to differential environmental adaptation through evolutionary processes. A. sydowii XTO612, which lives in the gut of the hadal amphipods, may be due to the specificity of the hadal environment and the unique dietary structure of the amphipods, which makes the gut environment different from the surrounding seawater and sediment environments. Such dynamic gut microenvironments may drive microbial evolutionary adaptations, enabling A. sydowii XTO612 to develop enhanced regulatory capacity for rapid osmotic stress response.
In conclusion, our work provides new insights into the adaptation of filamentous fungi to low osmotic pressure environments. Although this work represents only a small aspect of the study of the environmental adaptation of marine filamentous fungi, it is an important step towards understanding the mechanism of their osmotic pressure adaptation.
Supplementary Materials
The following supporting information can be downloaded at: The following supporting information can be downloaded at the website of this paper posted on Preprints.org. Supplemental Figures: Figure S1- Figure S4. Table S1: Primer information used in this work; Table S2: UPLC-MS/MS diagram of secondary metabolites of A.sydowii; Table S3: Statistical summary of the results of RNA-seq data; Table S4: Summary of differential genes in two strains of two A. sydowii under hypotonic conditions.
Author Contributions
Writing—original draft preparation, Z.W.; software, Z.W.; validation, Z.W and Y.C.; visualization, Z.W and Y.C.; supervision, J.F.; writing—review and editing, X.Y. All authors have read and agreed to the published version of the manuscript.
Funding
This work was supported by grants from National Natural Science Foundation of China 42476091, Shanghai Municipal Education Commission 2023ZKZD53.
Institutional Review Board Statement
Not applicable.
Informed Consent Statement
Not applicable.
Data Availability Statement
The entire ITS, benA, and cam genes in A. sydowii XTO612 were submitted to the NCBI, accession numbers PV412627 (ITS), PV459640 (cam), and PV459641 (benA). Raw sequencing reads for the transcript information in this work were submitted to the NCBI Sequence Read Archive under sequential accession numbers from SAMN47618251 to SAMN47618262. Correspondence and requests for materials should be addressed to Xi Yu.
Acknowledgments
We expressed our sincere gratitude to Institute of Deep-sea Science and Engineering, CAS, for the precious hadal sediment samples during the expedition of the Discovery-One research vessel (TS 21) in October 2021.
Conflicts of Interest
The authors declare that the research was conducted in the absence of any commercial or financial relationships that could be construed as a potential conflict of interest.
References
- Ma, C.; Pan, H.; Zhou, H.; Chen, W.; Ma, W.; Lin, Y.; Li, L. Marine microbial applications and prospects. science and technology information 2010, 210–212. [Google Scholar] [CrossRef]
- Das, S.; Lyla, P.S.; Khan, S.A. Marine microbial diversity and ecology: importance and future perspectives. Current Science 2006, 90, 1325–1335. [Google Scholar]
- Zhang, L. ; Qin, Y, The Characteristic of Deep Sea Hydrothermal Ecosystem and Their Impact on the Extreme Microorganism. Advances in Earth Science 2017, 32, 696–706. [Google Scholar] [CrossRef]
- Eustace, R.M.; Kilgallen, N.M.; Lacey, N.C.; Jamieson, A.J. Population Structure of the Hadal Amphipod Hirondellea Gigas (Amphipoda: Lysianassoidea) from the Izu-Bonin Trench. Journal of Crustacean Biology 2013, 33, 793–801. [Google Scholar] [CrossRef]
- Turk, M.; Abramović, Z.; Plemenitaš, A.; Gunde-Cimerman, N. Salt stress and plasma-membrane fluidity in selected extremophilic yeasts and yeast-like fungi. FEMS Yeast Research 2007, 7, 550–557. [Google Scholar] [CrossRef]
- Rauceo, J.M.; Blankenship, J.R.; Fanning, S.; Hamaker, J.J.; Deneault, J.-S.; Smith, F.J.; Nantel, A.; Mitchell, A.P. Regulation of the Candida albicans Cell Wall Damage Response by Transcription Factor Sko1 and PAS Kinase Psk1. Molecular Biology of the Cell 2008, 19, 2741–2751. [Google Scholar] [CrossRef] [PubMed]
- Paris, S.; Wysong, D.; Debeaupuis, J.-P.; Shibuya, K.; Philippe, B.; Diamond Richard, D.; Latgé, J.-P. Catalases of Aspergillus fumigatus. Infection and Immunity 2003, 71, 3551–3562. [Google Scholar] [CrossRef] [PubMed]
- Jamieson, A.J.; Fujii, T.; Mayor, D.J.; Solan, M.; Priede, I.G. Hadal trenches: the ecology of the deepest places on Earth. Trends Ecol. Evol. 2010, 25, 190. [Google Scholar] [CrossRef]
- Peng, Q.; Li, Y.; Deng, L.; Fang, J.; Yu, X. High hydrostatic pressure shapes the development and production of secondary metabolites of Mariana Trench sediment fungi. Scientific Reports 2021, 11, 11436. [Google Scholar] [CrossRef]
- Rodríguez-Pupo, E.C.; Pérez-Llano, Y.; Tinoco-Valencia, J.R.; Sánchez, N.S.; Padilla-Garfias, F.; Calahorra, M.; Sánchez, N.D.C.; Sánchez-Reyes, A.; Rodríguez-Hernández, M.D.R.; Peña, A.; et al. Osmolyte Signatures for the Protection of Aspergillus sydowii Cells under Halophilic Conditions and Osmotic Shock. Journal of Fungi 2021, 7. [Google Scholar] [CrossRef]
- Zajc, J.; Zalar, P.; Plemenitaš, A. Biology of Marine Fungi. Progress in Molecular and Subcellular Biology, vol 53. Springer, Berlin, Heidelberg, 2012; pp. 133–158. [CrossRef]
- Alker, A.P.; Smith, G.W.; Kim, K. Characterization of Aspergillus sydowii (Thom et Church), a fungal pathogen of Caribbean sea fan corals. Hydrobiologia 2001, 460, 105–111. [Google Scholar] [CrossRef]
- Freeman Brian, C.; Chen, C.; Yu, X.; Nielsen, L.; Peterson, K.; Beattie Gwyn, A. Physiological and Transcriptional Responses to Osmotic Stress of Two Pseudomonas syringae Strains That Differ in Epiphytic Fitness and Osmotolerance. Journal of Bacteriology 2013, 195, 4742–4752. [Google Scholar] [CrossRef] [PubMed]
- Duran, R.; Cary, J.W.; Calvo, A.M. Role of the Osmotic Stress Regulatory Pathway in Morphogenesis and Secondary Metabolism in Filamentous Fungi. Toxins 2010, 2, 367–381. [Google Scholar] [CrossRef]
- Rangel, D.E.N.; Finlay, R.D.; Hallsworth, J.E.; Dadachova, E.; Gadd, G.M. Fungal strategies for dealing with environment- and agriculture-induced stresses. Fungal Biology 2018, 122, 602–612. [Google Scholar] [CrossRef]
- Dijksterhuis, J.; de Vries, Ronald, P. Compatible solutes and fungal development. Biochemical Journal 2006, 399. [Google Scholar] [CrossRef]
- Turk, M.; Méjanelle, L.; Šentjurc, M.; Grimalt, J.O.; Gunde-Cimerman, N.; Plemenitaš, A. Salt-induced changes in lipid composition and membrane fluidity of halophilic yeast-like melanized fungi. Extremophiles 2004, 8, 53–61. [Google Scholar] [CrossRef]
- Kralj Kunčič, M.; Kogej, T.; Drobne, D.; Gunde-Cimerman, N. Morphological Response of the Halophilic Fungal Genus Wallemia to High Salinity. Applied and Environmental Microbiology 2009, 76, 329–337. [Google Scholar] [CrossRef]
- Calvo, A.M.; Wilson, R.A.; Bok, J.W.; Keller, N.P. Relationship between secondary metabolism and fungal development. Microbiol Mol Biol Rev 2002, 66, 447–459. [Google Scholar] [CrossRef]
- Geiser, D.M.; Taylor, J.W.; Ritchie, K.B.; Smith, G.W. Cause of sea fan death in the West Indies. Nature 1998, 394, 137–138. [Google Scholar] [CrossRef]
- Ibrahim, S.R.M.; Fadil, S.A.; Fadil, H.A.; Eshmawi, B.A.; Mohamed, S.G.A.; Mohamed, G.A. Fungal Naphthalenones; Promising Metabolites for Drug Discovery: Structures, Biosynthesis, Sources, and Pharmacological Potential. Toxins (Basel) 2022, 14, 154. [Google Scholar] [CrossRef]
- Wang, Y.-N.; Mou, Y.-H.; Dong, Y.; Wu, Y.; Liu, B.-Y.; Bai, J.; Yan, D.-J.; Zhang, L.; Feng, D.-Q.; Pei, Y.-H.; et al. Diphenyl Ethers from a Marine-Derived Aspergillus sydowii. Marine Drugs 2018, 16, 451. [Google Scholar] [CrossRef]
- Albuquerque, K.K.S.A.; Albuquerque, W.W.C.; Costa, R.M.P.B.; Batista, J.M.S.; Marques, D.A.V.; Bezerra, R.P.; Herculano, P.N.; Porto, A.L.F. Biotechnological potential of a novel tannase-acyl hydrolase from Aspergillus sydowii using waste coir residue: Aqueous two-phase system and chromatographic techniques. Biocatalysis and Agricultural Biotechnology 2020, 23, 101453. [Google Scholar] [CrossRef]
- Elwan, S.H.; Ammar, M.S.; Mohawed, S.M. Lipases from Aspergillus sydowi. Zentralblatt für Mikrobiologie 1986, 141, 233–239. [Google Scholar] [CrossRef]
- Pérez-Llano, Y.; Rodríguez-Pupo, E.C.; Druzhinina, I.S.; Chenthamara, K.; Cai, F.; Gunde-Cimerman, N.; Zalar, P.; Gostinčar, C.; Kostanjšek, R.; Folch-Mallol, J.L.; et al. Stress Reshapes the Physiological Response of Halophile Fungi to Salinity. Cells 2020, 9, 525. [Google Scholar] [CrossRef] [PubMed]
- Zhong, M.; Li, Y.; Deng, L.; Fang, J.; Yu, X. Insight into the adaptation mechanisms of high hydrostatic pressure in physiology and metabolism of hadal fungi from the deepest ocean sediment. mSystems 2023, 9, e01085–23. [Google Scholar] [CrossRef]
- Cui, Y.; Xiao, Y.; Wang, Z.; Ji, P.; Zhang, C.; Li, Y.; Fang, J.; Yu, X. Microbial community structure and functional traits involved in the adaptation of culturable bacteria within the gut of amphipods from the deepest ocean. Microbiology Spectrum 2024, 13. [Google Scholar] [CrossRef]
- Deng, L.; Zhong, M.; Li, Y.; Hu, G.; Zhang, C.; Peng, Q.; Zhang, Z.; Fang, J.; Yu, X. High hydrostatic pressure harnesses the biosynthesis of secondary metabolites via the regulation of polyketide synthesis genes of hadal sediment-derived fungi. Frontiers in Microbiology 2023, 14. [Google Scholar] [CrossRef]
- Kumar, S.; Stecher, G.; Li, M.; Knyaz, C.; Tamura, K. MEGA X: Molecular Evolutionary Genetics Analysis across Computing Platforms. Molecular Biology and Evolution 2018, 35, 1547–1549. [Google Scholar] [CrossRef]
- Xiao, Y.; Yan, F.; Cui, Y.; Du, J.; Hu, G.; Zhai, W.; Liu, R.; Zhang, Z.; Fang, J.; Chen, L.; et al. A symbiotic bacterium of Antarctic fish reveals environmental adaptability mechanisms and biosynthetic potential towards antibacterial and cytotoxic activities. Frontiers in Microbiology 2023, 13. [Google Scholar] [CrossRef]
- Peng, Q.; Li, Y.; Fang, J.; Yu, X. Effects of Epigenetic Modification and High Hydrostatic Pressure on Polyketide Synthase Genes and Secondary Metabolites of Alternaria alternata Derived from the Mariana Trench Sediments. Marine Drugs 2023, 21, 585. [Google Scholar] [CrossRef]
- Ye, J.; Wang, Y.; Li, X.; Wan, Q.; Zhang, Y.; Lu, L. Synergistic Antifungal Effect of a Combination of Iron Deficiency and Calcium Supplementation. Microbiology Spectrum 2022, 10, e01121–22. [Google Scholar] [CrossRef] [PubMed]
- Wang, Y.; Koopmann, B.; von Tiedemann, A. Methods for Assessment of Viability and Germination of Plasmodiophora brassicae Resting Spores. Frontiers in Microbiology 2022, 12. [Google Scholar] [CrossRef] [PubMed]
- Bairoch, A.; Apweiler, R. The SWISS-PROT protein sequence database and its supplement TrEMBL in 2000. Nucleic Acids Research 2000, 28, 45–48. [Google Scholar] [CrossRef]
- Finn, R.D.; Bateman, A.; Clements, J.; Coggill, P.; Eberhardt, R.Y.; Eddy, S.R.; Heger, A.; Hetherington, K.; Holm, L.; Mistry, J.; :, *!!! REPLACE !!!*; et al. : the protein families database. Nucleic Acids Research 2014, 42, D222–D230. [Google Scholar] [CrossRef]
- Jensen, L.J.; Julien, P.; Kuhn, M.; von Mering, C.; Muller, J.; Doerks, T.; Bork, P. eggNOG: automated construction and annotation of orthologous groups of genes. Nucleic Acids Research 2008, 36 (Suppl. 1), D250–D254. [Google Scholar] [CrossRef] [PubMed]
- Gene Ontology, C. The Gene Ontology (GO) database and informatics resource. Nucleic Acids Research 2004, 32 (suppl_1), D258–D261. [Google Scholar] [CrossRef]
- Kanehisa, M.; Goto, S. KEGG: Kyoto Encyclopedia of Genes and Genomes. Nucleic Acids Research 2000, 28, 27–30. [Google Scholar] [CrossRef]
- Peidro-Guzmán, H.; Pérez-Llano, Y.; González-Abradelo, D.; Fernández-López, M.G.; Dávila-Ramos, S.; Aranda, E.; Hernández, D.R.O.; García, A.O.; Lira-Ruan, V.; Pliego, O.R.; et al. Transcriptomic analysis of polyaromatic hydrocarbon degradation by the halophilic fungus Aspergillus sydowii at hypersaline conditions. Environ Microbiol 2021, 23, 3435–3459. [Google Scholar] [CrossRef]
- Livak, K.J.; Schmittgen, T.D. Analysis of relative gene expression data using real-time quantitative PCR and the 2(-Delta Delta C(T)) Method. Methods 2001, 25 4, 402–408. [Google Scholar] [CrossRef]
- Zhang, P.; Li, X.; Wang, B.G. Secondary Metabolites from the Marine Algal-Derived Endophytic Fungi: Chemical Diversity and Biological Activity. Planta Medica 2016, 82, 832–842. [Google Scholar] [CrossRef]
- Lennicke, C.; Cochemé, H.M. Redox metabolism: ROS as specific molecular regulators of cell signaling and function. Molecular Cell 2021, 81, 3691–3707. [Google Scholar] [CrossRef] [PubMed]
- Brown Alistair, J.P.; Cowen Leah, E.; di Pietro, A.; Quinn, J. Stress Adaptation. Microbiology Spectrum 2017, 5, 10.1128. [Google Scholar] [CrossRef]
- Harris, J.I.; Waters, M. 1 Glyceraldehyde-3-phosphate Dehydrogenase. In The Enzymes, Boyer, P.D. Ed. Academic Press: 1976; Vol. 13, pp 1-49. [CrossRef]
- Zoraghi, R.; Worrall, L.; See, R.H.; Strangman, W.; Popplewell, W.L.; Gong, H.; Samaai, T.; Swayze, R.D.; Kaur, S.; Vuckovic, M.; et al. Methicillin-resistant Staphylococcus aureus (MRSA) Pyruvate Kinase as a Target for Bis-indole Alkaloids with Antibacterial Activities*. Journal of Biological Chemistry 2011, 286, 44716–44725. [Google Scholar] [CrossRef] [PubMed]
- Enriqueta Muñoz, M.; Ponce, E. Pyruvate kinase: current status of regulatory and functional properties. Comparative Biochemistry and Physiology Part B: Biochemistry and Molecular Biology 2003, 135, 197–218. [Google Scholar] [CrossRef] [PubMed]
- Chakraborty, S.; Kenney, L.J. A New Role of OmpR in Acid and Osmotic Stress in Salmonella and E. coli. Frontiers in Microbiology 2018, 9, 2018. [Google Scholar] [CrossRef]
- Zhou, K.; George, S.M.; Métris, A.; Li, P.L.; Baranyi, J. Lag Phase of Salmonella enterica under Osmotic Stress Conditions. Applied and Environmental Microbiology 2011, 77, 1758–1762. [Google Scholar] [CrossRef]
- Margesin, R.; Schinner, F. Potential of halotolerant and halophilic microorganisms for biotechnology. Extremophiles 2001, 5, 73–83. [Google Scholar] [CrossRef]
- Hohmann, S.; Krantz, M.; Nordlander, B. Chapter Two - Yeast Osmoregulation. In Methods in Enzymology, Academic Press: 2007; Vol. 428, pp 29-45. [CrossRef]
- Roeßler, M.; Müller, V. Osmoadaptation in bacteria and archaea: common principles and differences. Environ Microbiol 2001, 3. [Google Scholar] [CrossRef]
- Carroll, A.R.; Copp, B.R.; Davis, R.A.; Keyzers, R.A.; Prinsep, M.R. Marine natural products. Natural Product Reports 2020, 37, 175–223. [Google Scholar] [CrossRef]
- Raghukumar, C.; Muraleedharan, U.; Gaud, V.R.; Mishra, R. Xylanases of marine fungi of potential use for biobleaching of paper pulp. Journal of Industrial Microbiology and Biotechnology 2004, 31, 433–441. [Google Scholar] [CrossRef]
- Calvo, A.M. The VeA regulatory system and its role in morphological and chemical development in fungi. Fungal Genetics and Biology 2008, 45, 1053–1061. [Google Scholar] [CrossRef] [PubMed]
- Mouriño-Pérez, R.R. Septum development in filamentous ascomycetes. Fungal Biology Reviews 2013, 27, 1–9. [Google Scholar] [CrossRef]
- Garcia-Rubio, R.; de Oliveira, H.C.; Rivera, J.; Trevijano-Contador, N. The Fungal Cell Wall: Candida, Cryptococcus, and Aspergillus Species. Frontiers in Microbiology 2020, 10. [Google Scholar] [CrossRef] [PubMed]
Figure 1.
Identification of different sources of A. sydowii were identified. (a) Phylogenetic tree of ITS, ben A and cam of four strains of A. sydowii. Under ITS amplification, the four A. sydowii strains were in 100% identity with ON332097.1 A. sydowii, four strains in benA were highly similar to MG832163.1:2-422 A. sydowii nucleotide sequences, and the relatives in cam were more distant with 60% identity. Bootstrap analysis was performed using 1,000 replicates. (b) Mycelial morphology of four strains of A. sydowii after 2 days of incubation at 28 °C on 0.1 M and 0.5 M salinity agar media. Scale bar represents 10 μm. (c-d) Plate morphology of A. sydowii originating from hadal amphipods gut and sediment, respectively, on PDA after 7 days of culture at 28 °C. (e–f) Conidiophores and conidia on PDA.
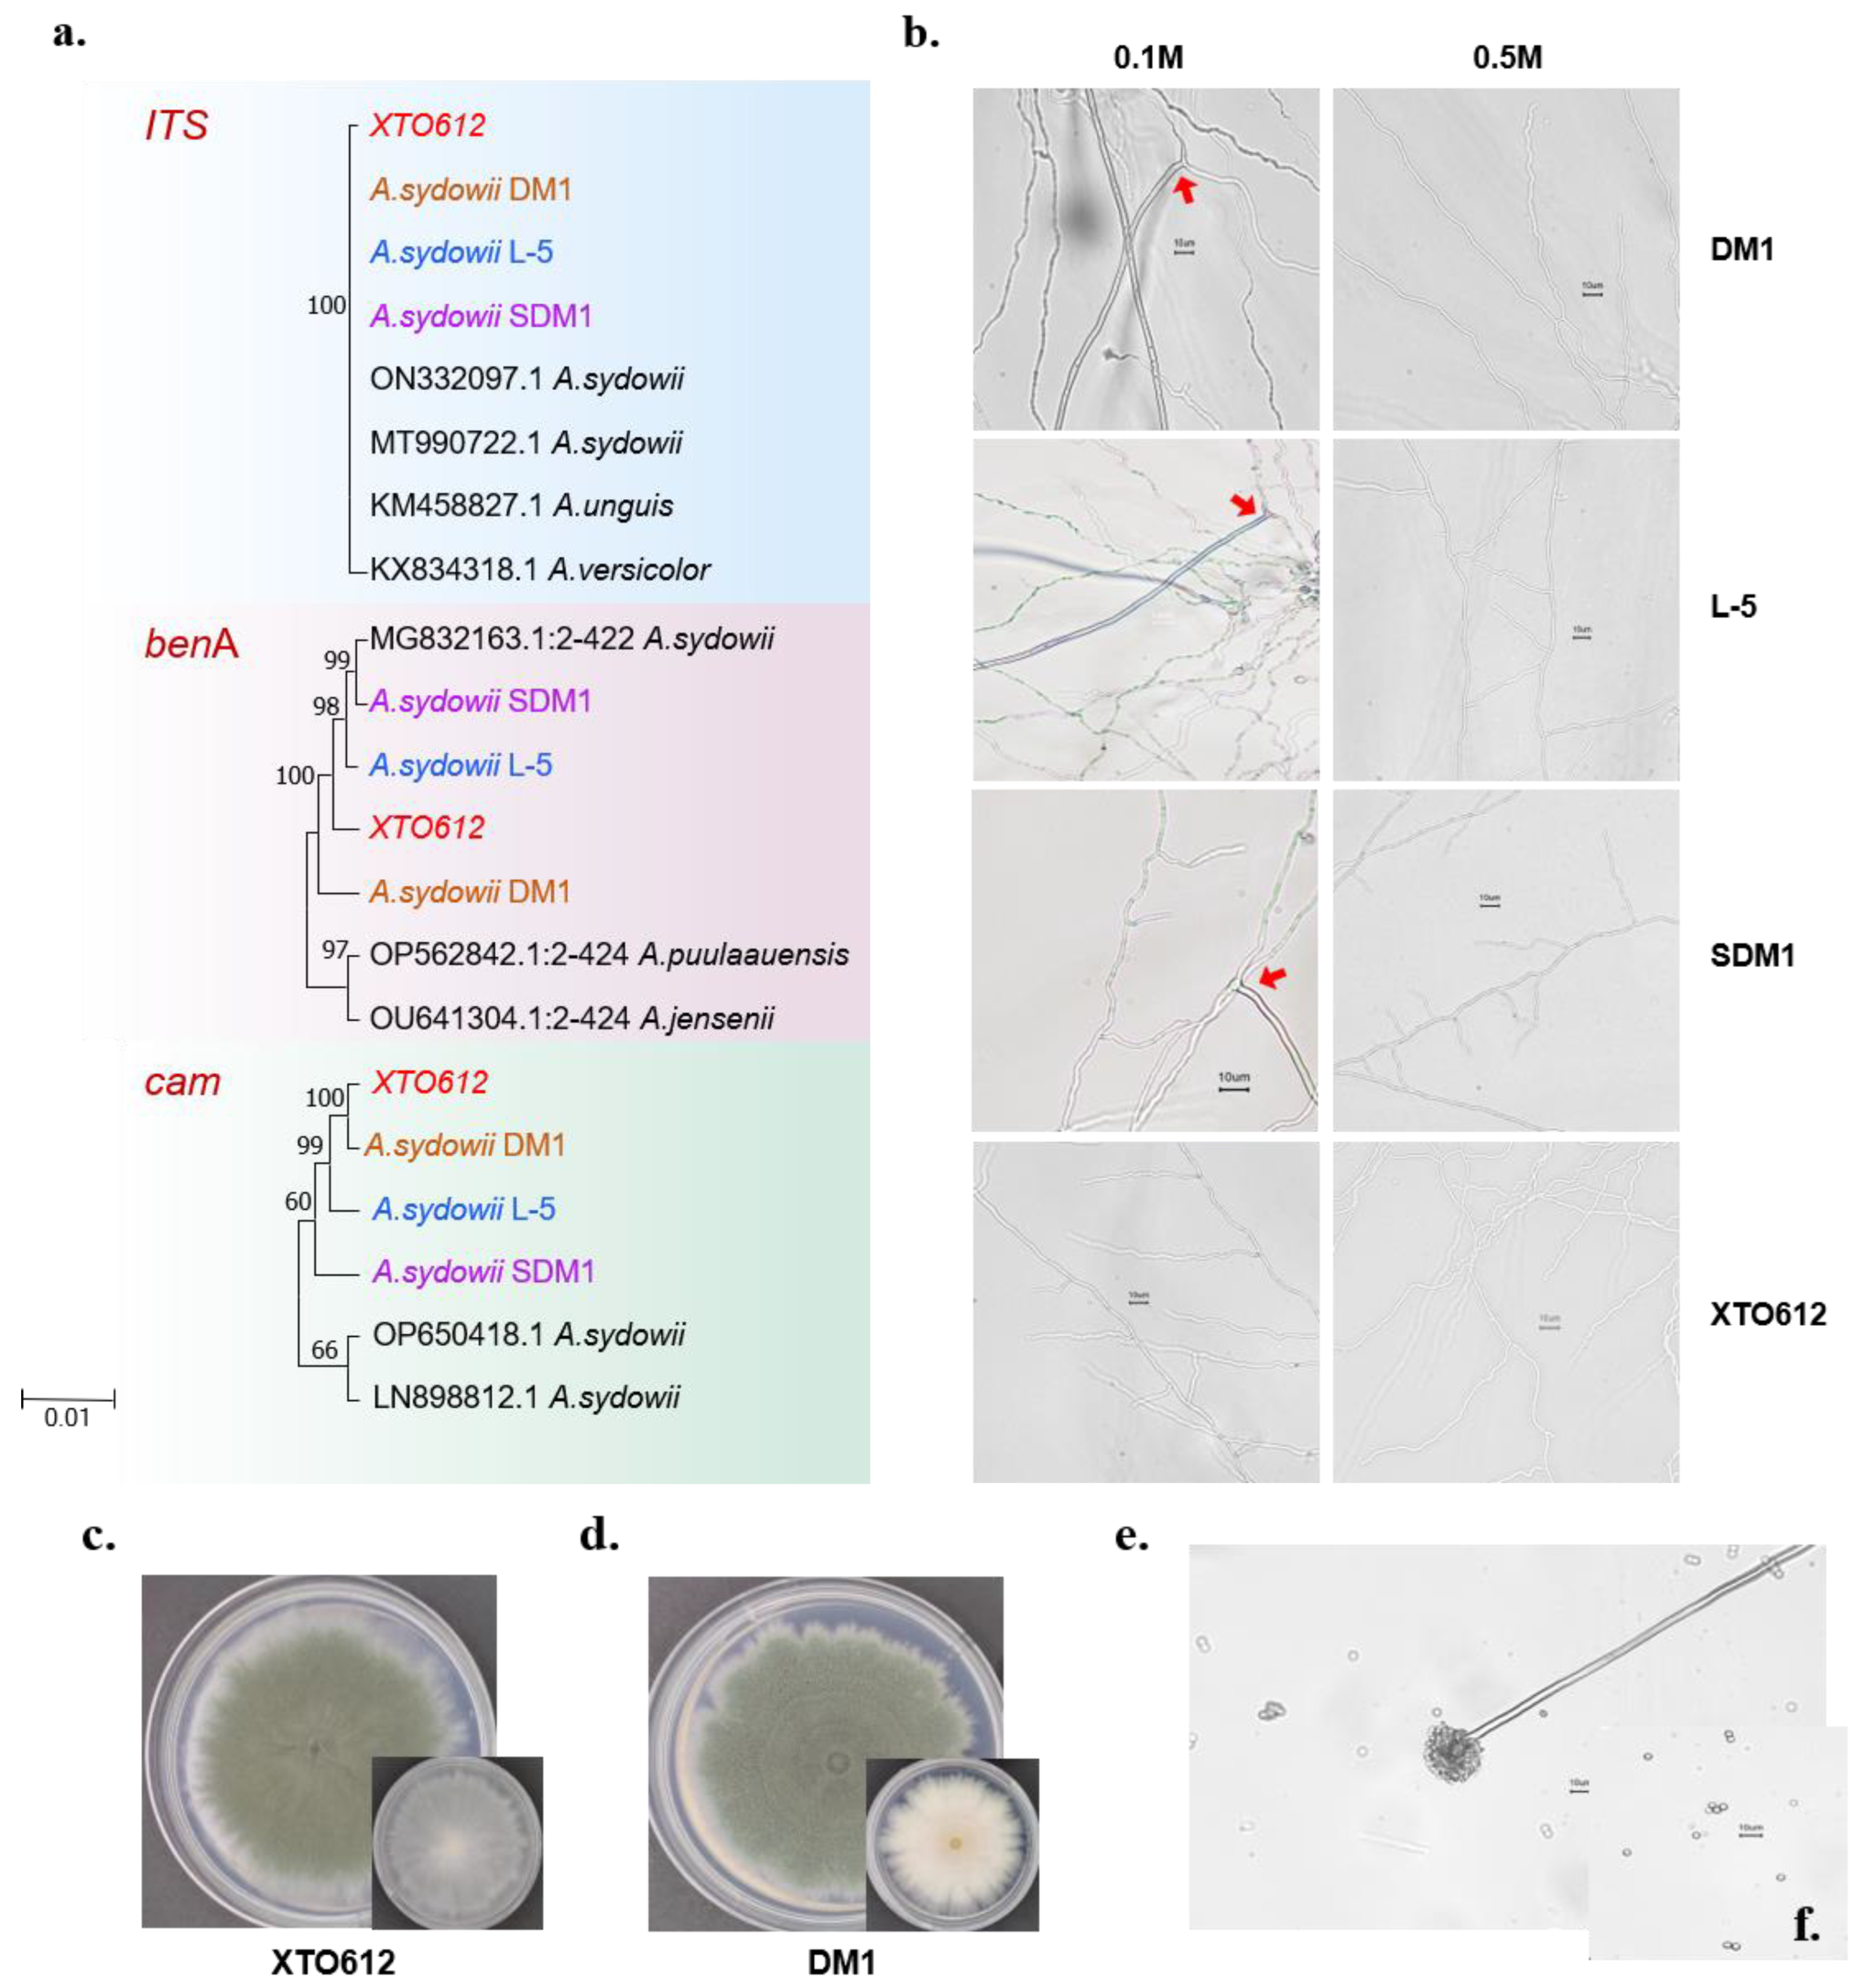
Figure 2.
Secondary metabolites of two A. sydowii strains. (a) Two strains of A. sydowii were cultured at 0 M, 0.1 M, 0.3 M, 0.5 M, 1 M and 2 M salinity conditions for 10 days at 28 °C. Colony phenotypes, pigmentation on the back of the colony. (b-c) Color changes in the fermentation broth of spores incubated on PDB for 10 days after different salinity treatments (0 M, 0.1 M, 0.5 M). The fermentation broth and fungal particles of A. sydowii DM1 spores accumulated more pigments. (d) UPLC-MS/MS spectra of secondary metabolites of two A. sydowii strains under 0.1 M salinity conditions.
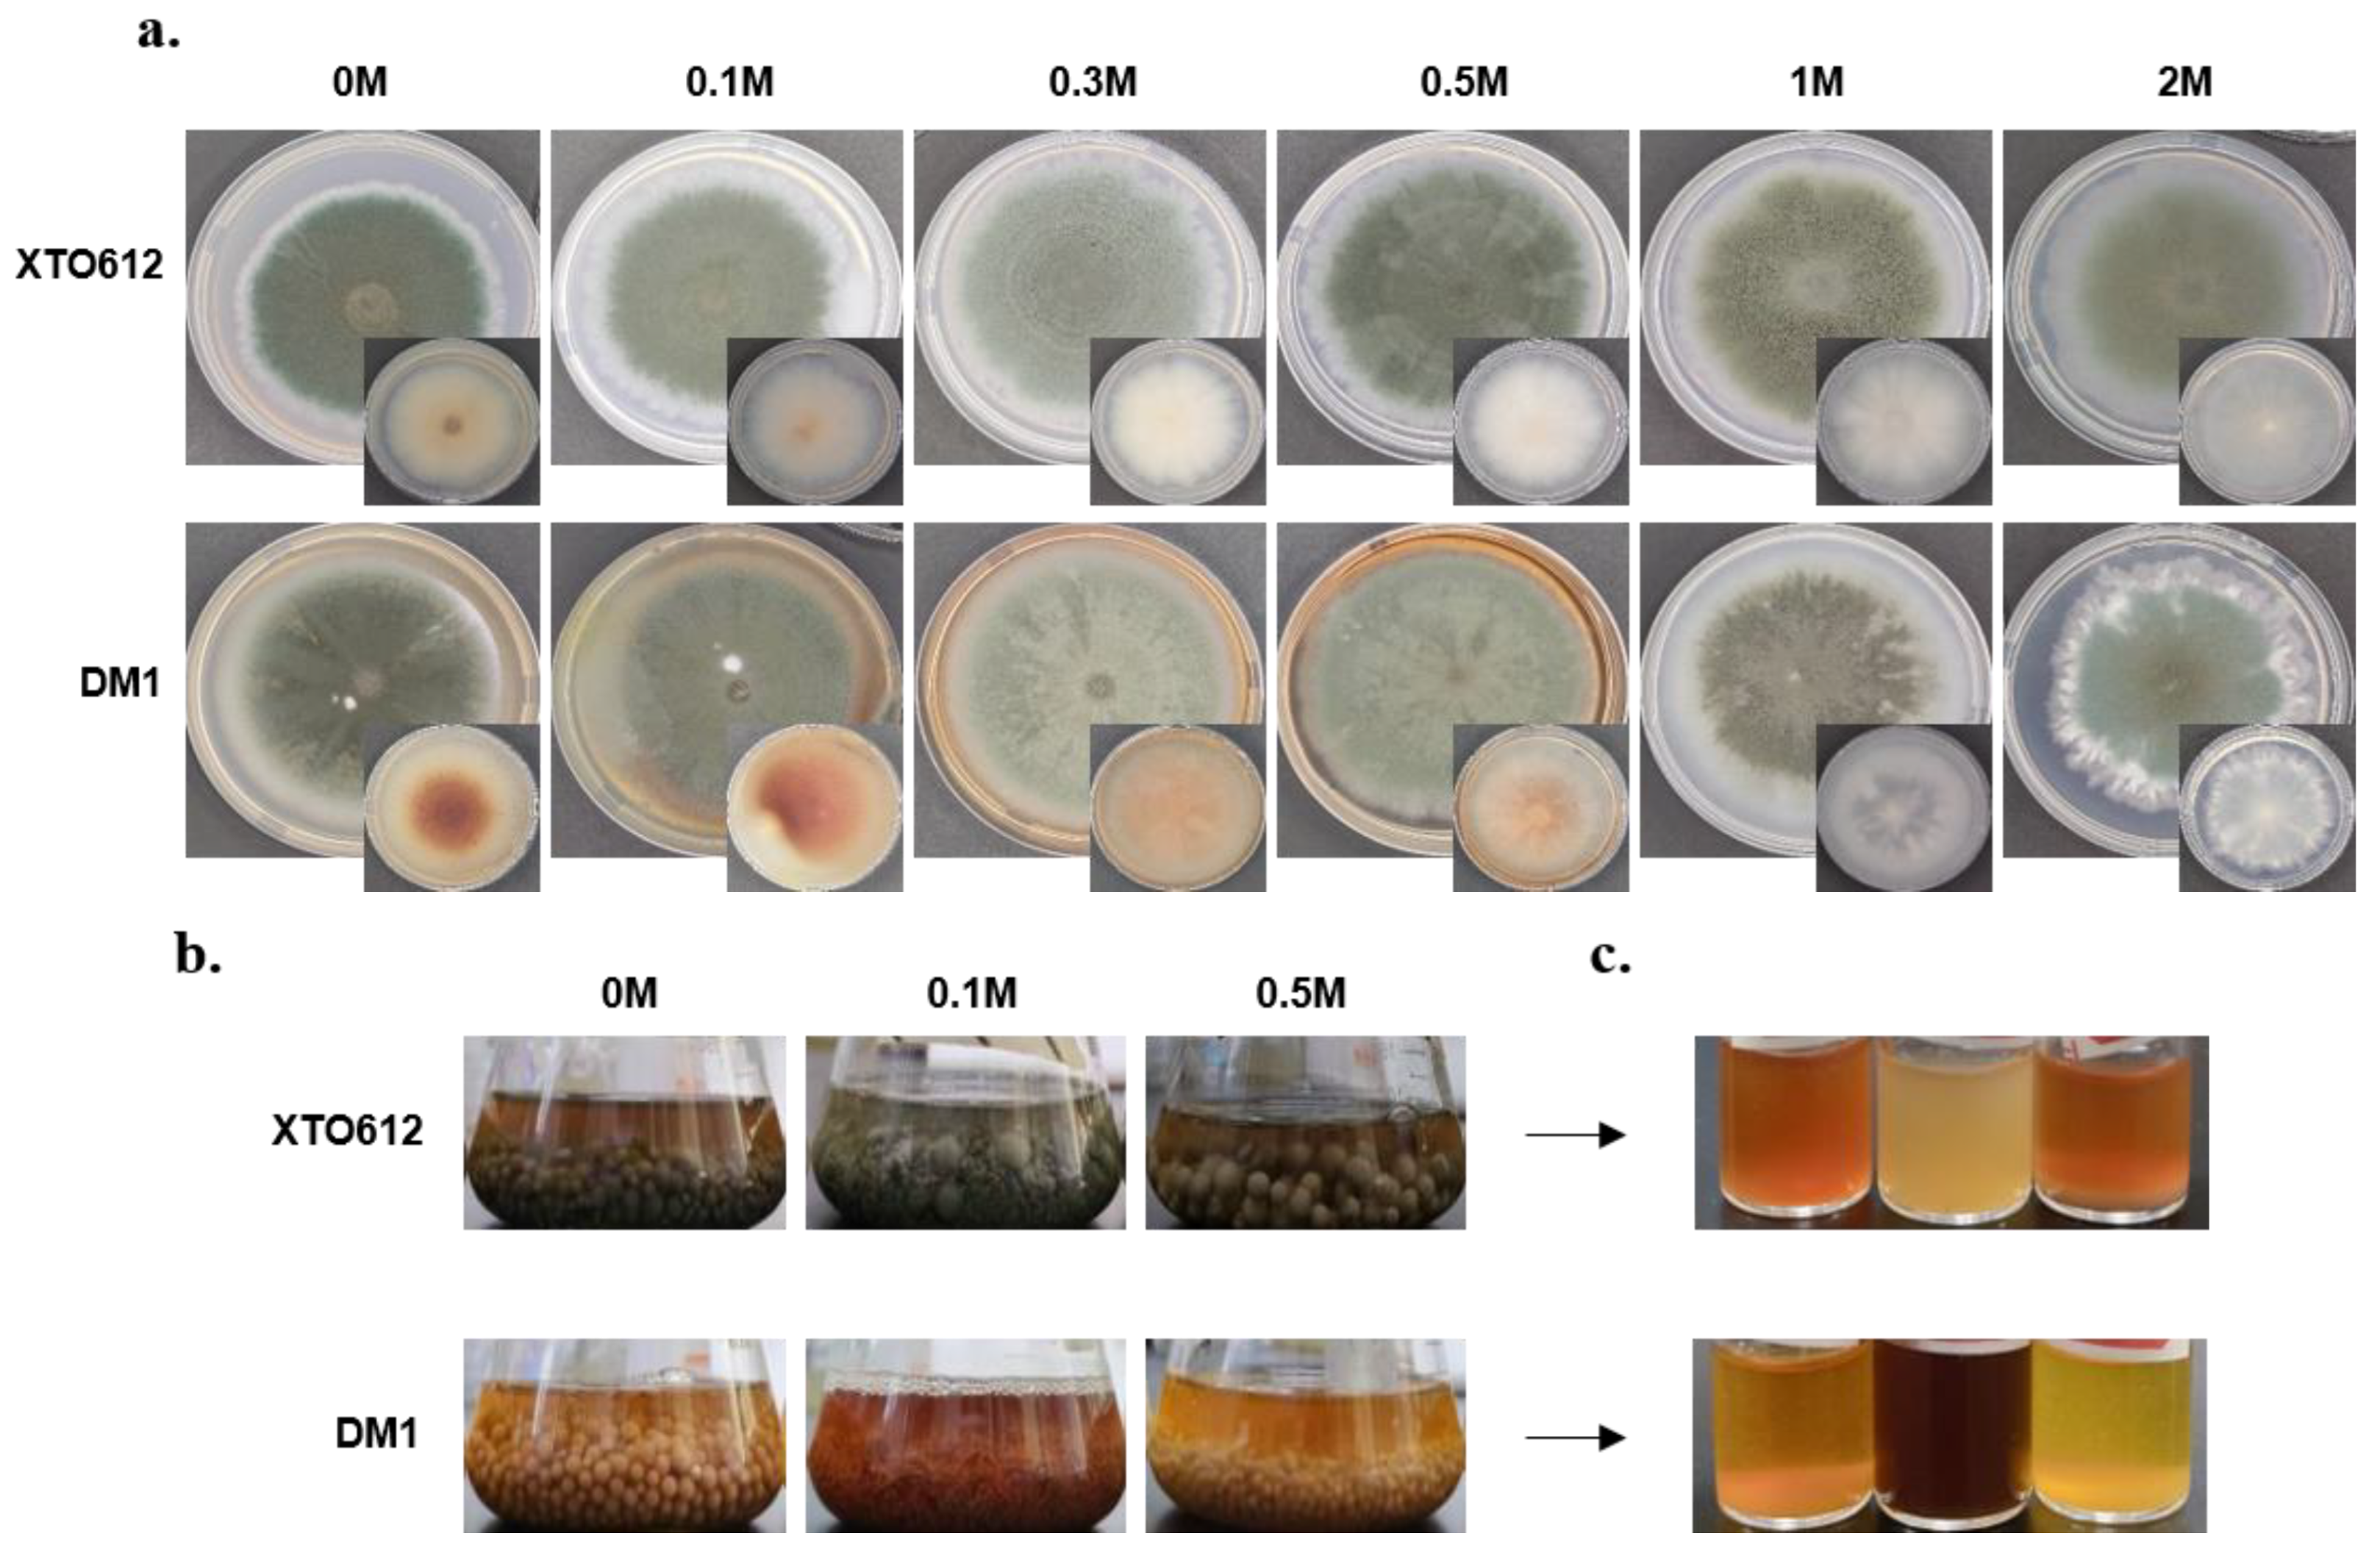
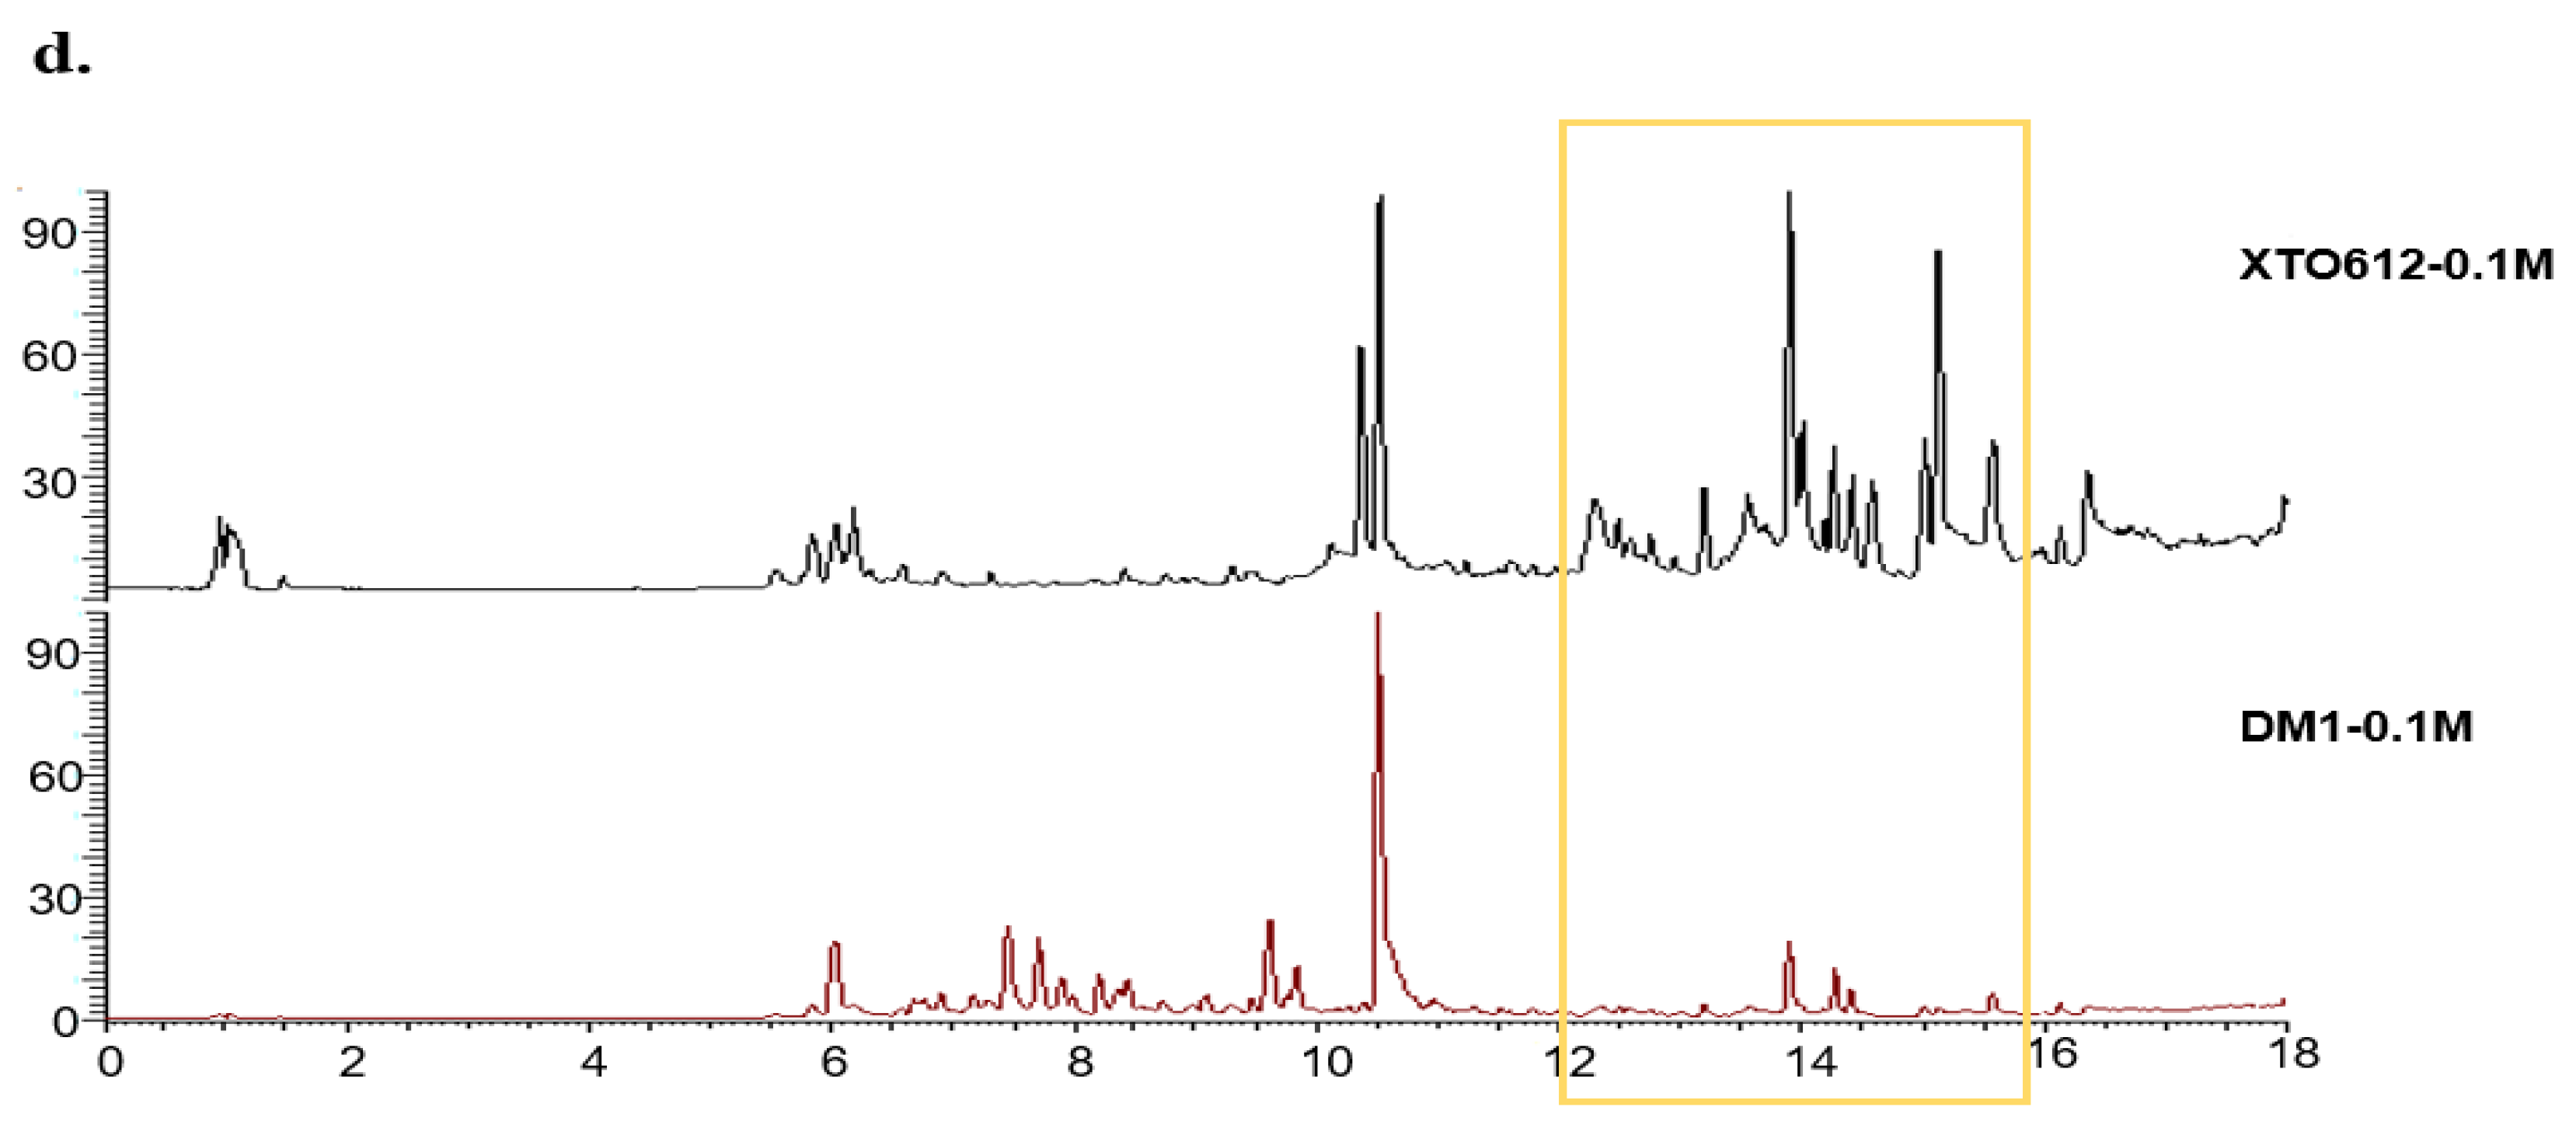
Figure 3.
Adaptive adaptation of A. sydowii under low osmotic stress. (a) A. sydowii mycelium stained by CFW under low osmotic stress. The red arrow pointed to the septa stained with fluorochrome. Scale bar represents 10 μm. (b) Conidia were inoculated in medium with different salinities (0.1 M and 0.5 M NaCl) and incubated at 28 °C for 7 days, then conidia were counted and the determination was repeated three times. (c) Conidia were inoculated into medium at different salinities and incubated at 28 °C for 8 h. Each well was replaced with 100 mL of medium supplemented with a final concentration of 25 ug/mL of resazurin. Plates were then incubated at 37 °C for 12 h each to detect fluorescence values. Each well represents the average of three replicate experiments. The heat map shows the ability of the strain to grow under different salinity conditions. X-0.1 M represents XTO612 at 0.1M salinity; X-0.5 M represents XTO612 at 0.5 M salinity; D-0.1 M represents DM1 at 0.1 M salinity; D-0.5 M represents DM1 at 0.5 M salinity. (d) Fresh spore suspensions were incubated in PDB at different salinities for 60 h after standing incubation in medium containing 10 mM DCFH-DA for 1.5 h at 37 °C. ROS production was determined for A. sydowii XTO612 and DM1 at 0.1 M and 0.5 M salinity, respectively. Results are the mean of 3 independent experiments and error bars are standard deviations. Statistical differences (**** p < 0.0001 and * p < 0.05) were analyzed by one-way analysis of variance.
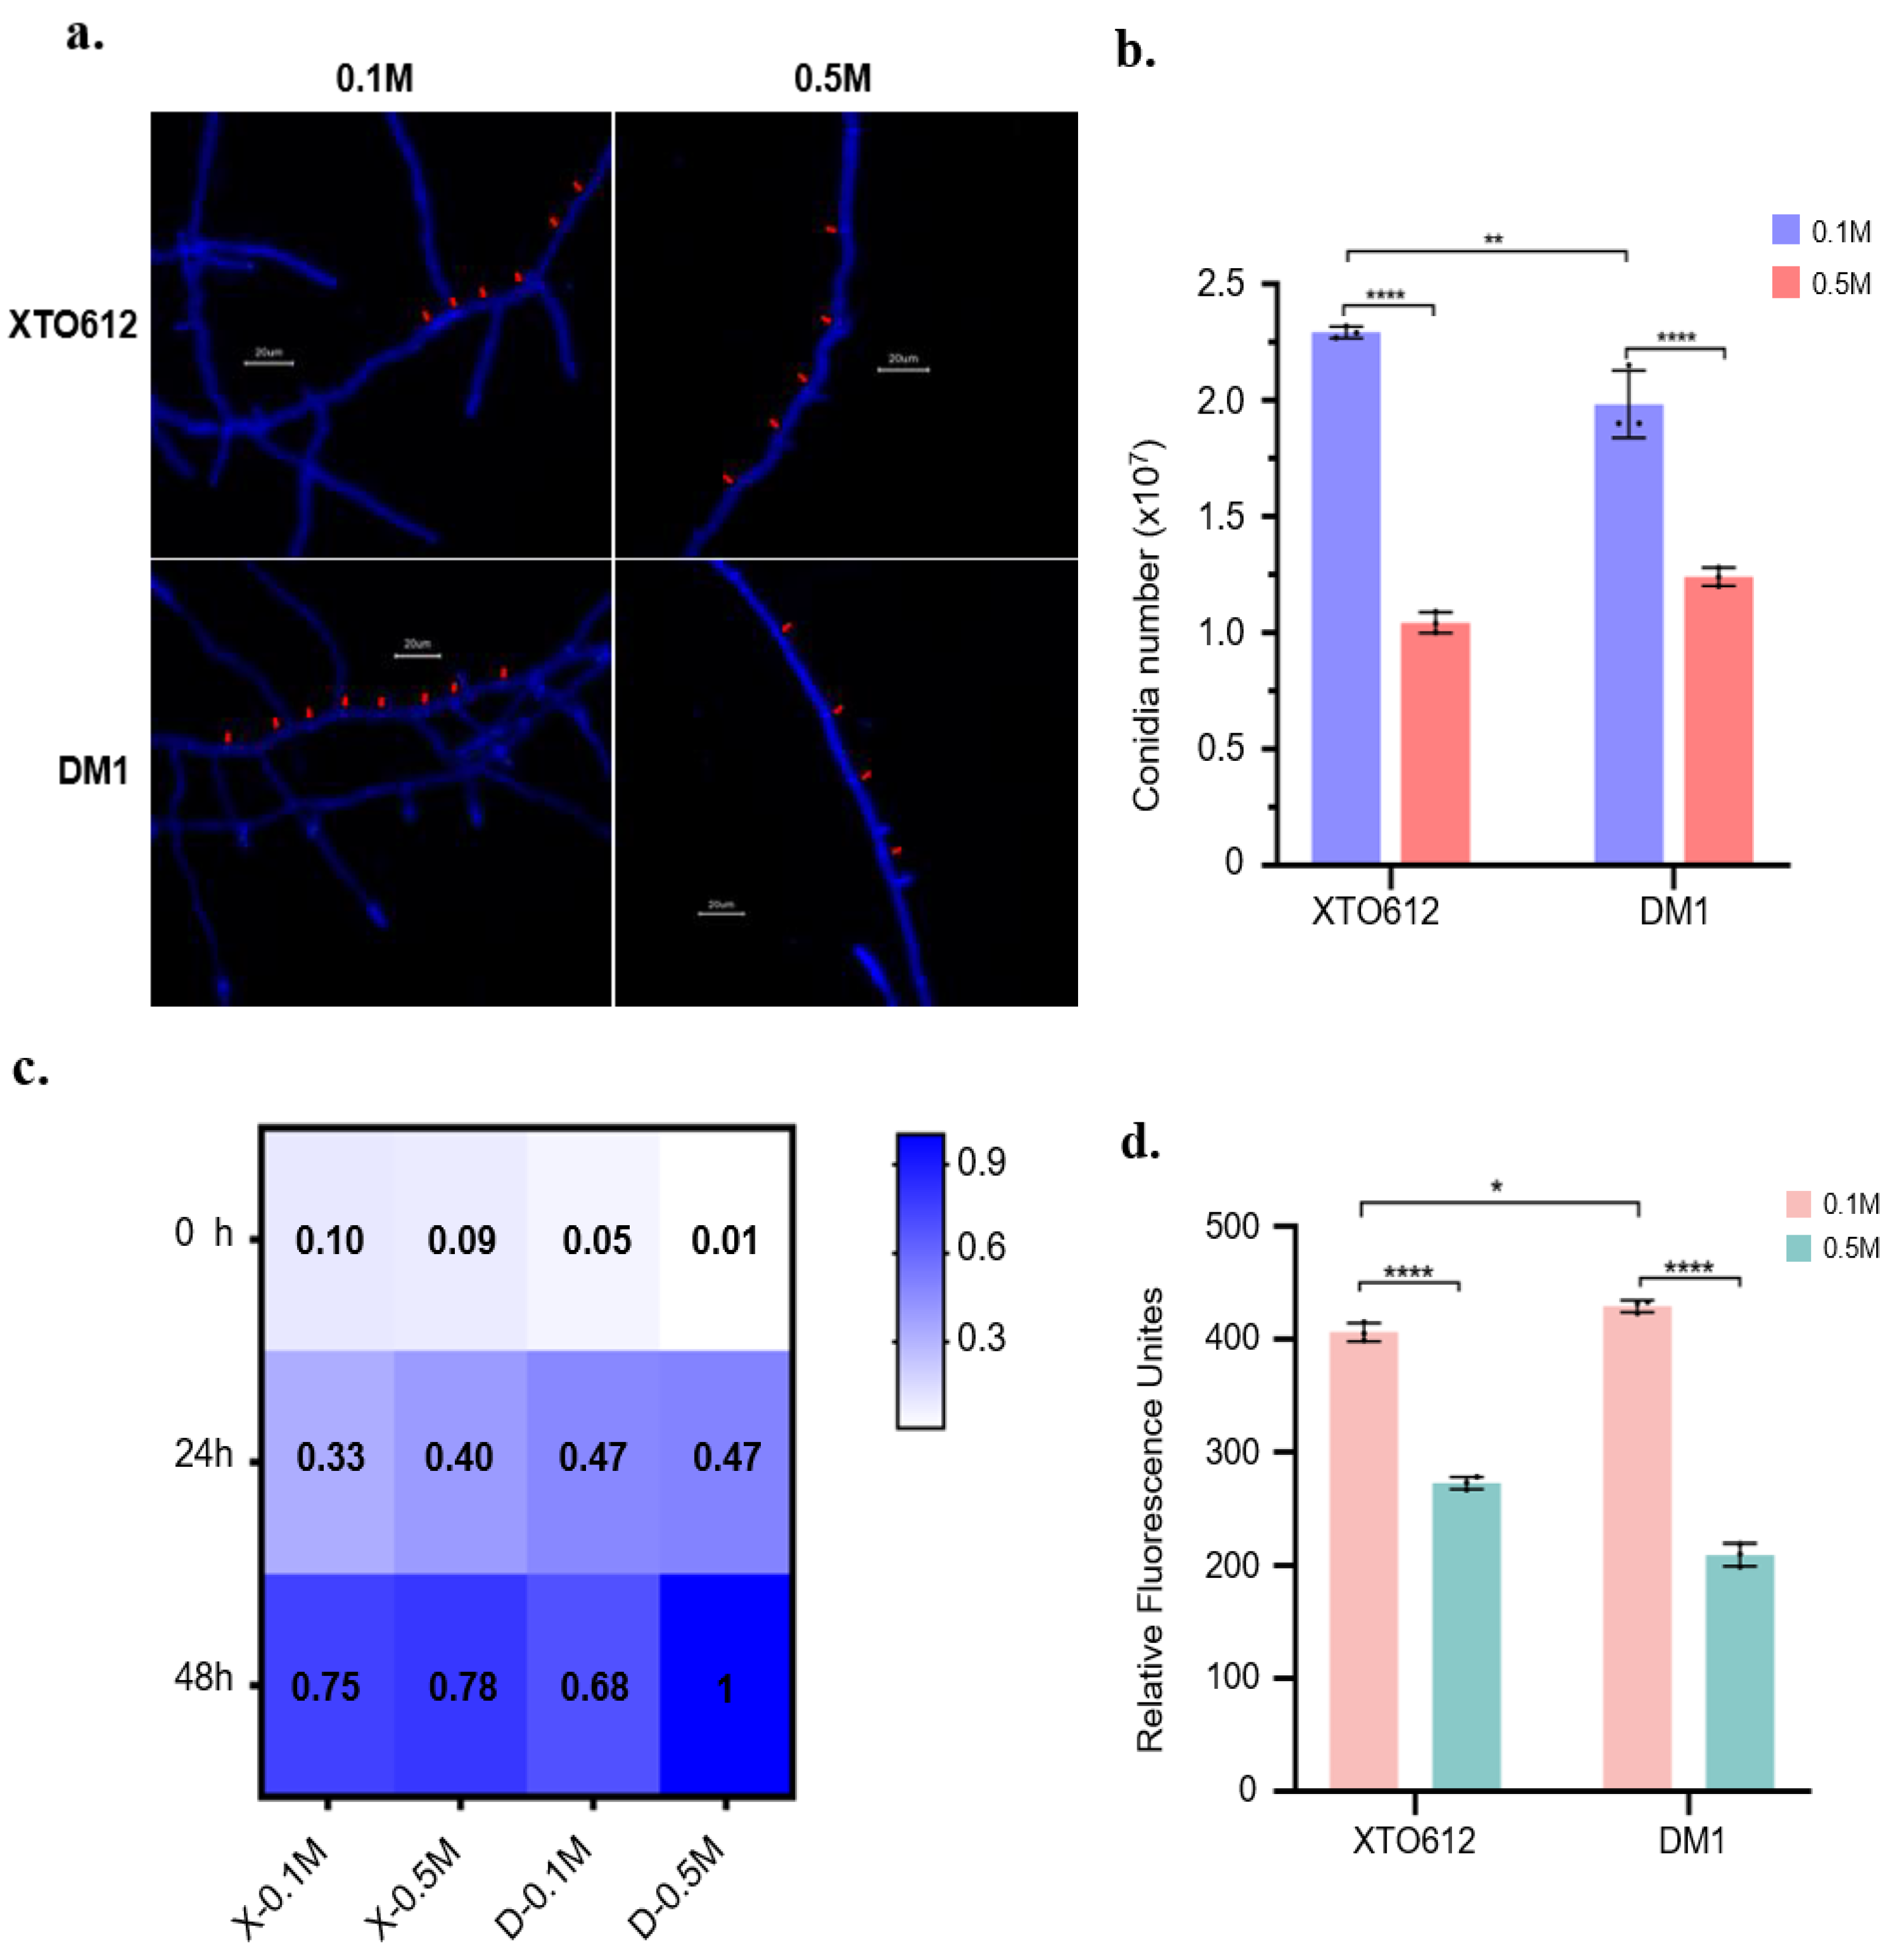
Figure 4.
DEG overview of two A. sydowii cultured under different salinity (0.1 M and 0.5 M NaCl). (a) Differential upregulated genes under low salinity (0.1 M NaCl) conditions compared to normal salinity (0.5 M NaCl) conditions for both A. sydowii. (b) Differential downregulated genes under low salinity conditions compared to normal salinity conditions for both A. sydowii. (c) Top 10 terms in GO enriched from commonly share genes of A. sydowii XTO612 and DM1 at 0.1 M salinity. (d) Top 10 terms in KEGG enriched from commonly share genes of A. sydowii XTO612 and DM1 at 0.1 M salinity. Figure was drawn by the OECloud tools (https://cloud.oebiotech.com).
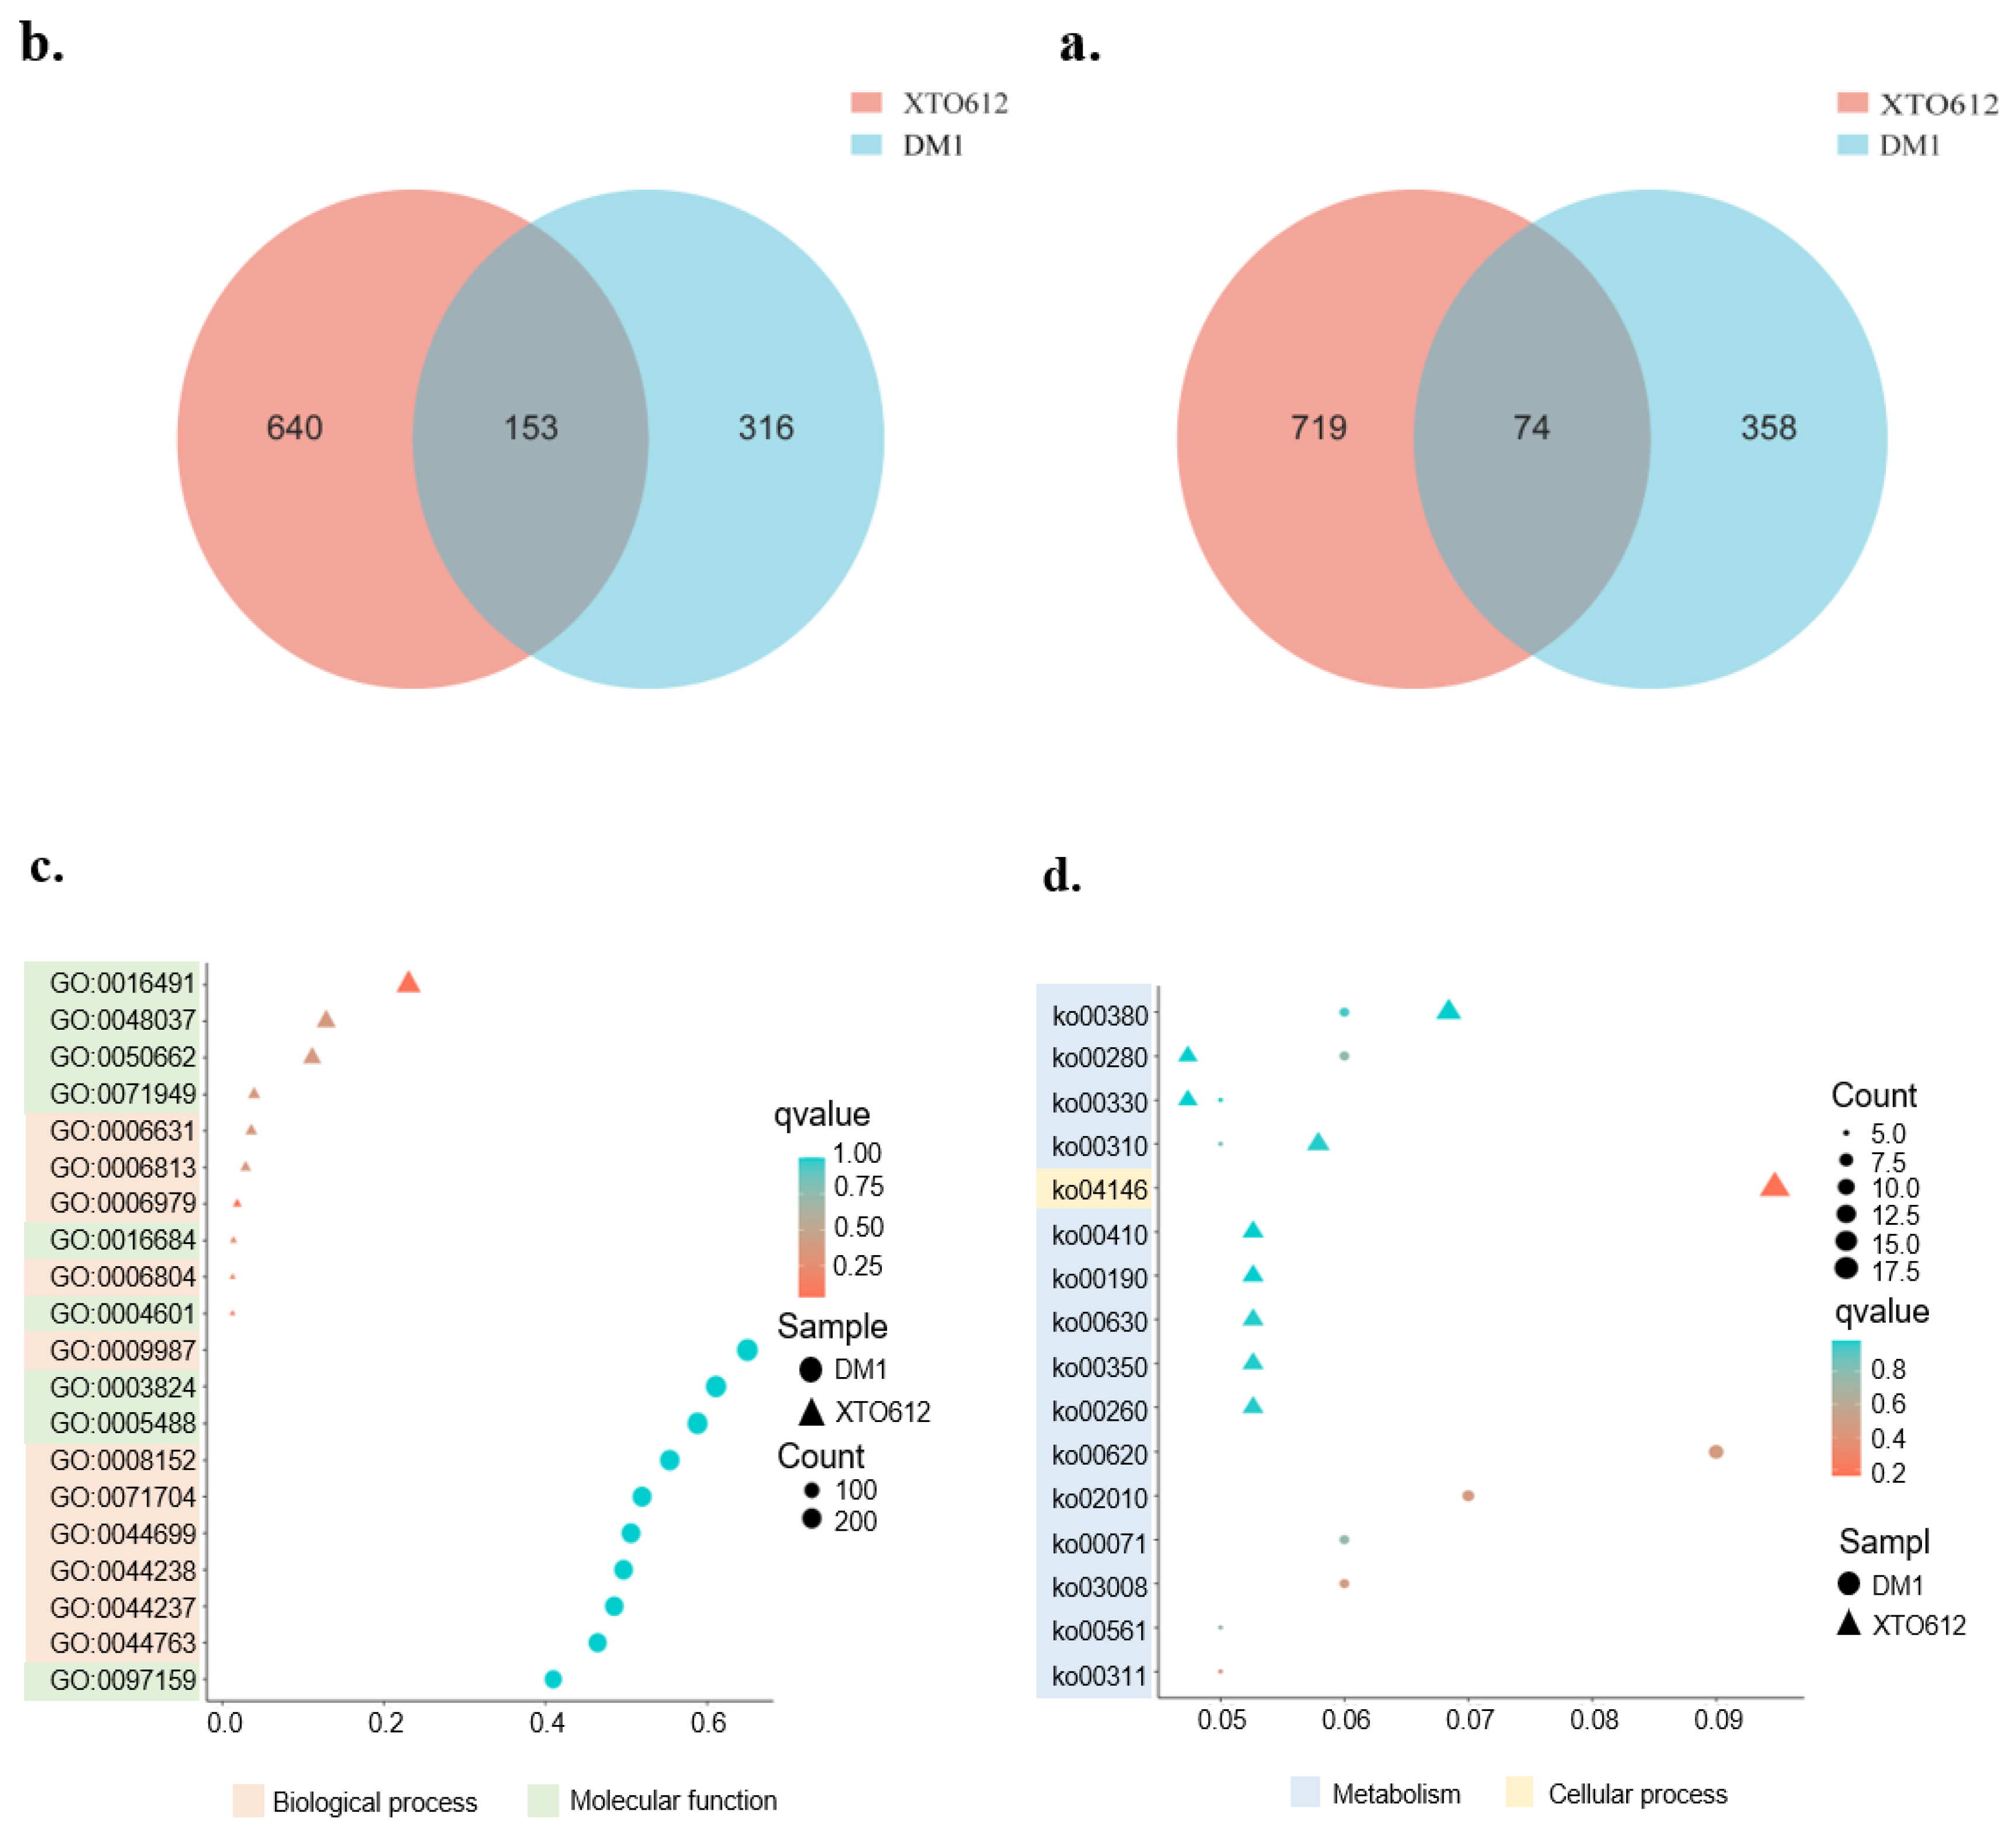
Figure 5.
The DEG overviews of A. sydowii after incubation for 3 days at different salt concentrations. (a) Diagram of the cell wall remodelling. (b) Heat map of marker genes analyzed in this study. Gly, glycolysis; CW, cell wall; SS, soluble substances; FAD, fatty acid degradation; OXPHOS, oxidative phosphorylation. X1 represents A. sydowii XTO612 cultured at 0.1 M salinity; X5 represents A. sydowii XTO612 cultured at 0.5 M salinity.

Figure 6.
Energy metabolism pathway of A. sydowii XTO612 under low osmotic pressure conditions. Red, green and black labelled genes indicate that genes are up-regulated, down-regulated and not significantly expressed, respectively. Gene names and the proteins they encode were listed in Table S4.
Figure 6.
Energy metabolism pathway of A. sydowii XTO612 under low osmotic pressure conditions. Red, green and black labelled genes indicate that genes are up-regulated, down-regulated and not significantly expressed, respectively. Gene names and the proteins they encode were listed in Table S4.
Disclaimer/Publisher’s Note: The statements, opinions and data contained in all publications are solely those of the individual author(s) and contributor(s) and not of MDPI and/or the editor(s). MDPI and/or the editor(s) disclaim responsibility for any injury to people or property resulting from any ideas, methods, instructions or products referred to in the content. |
© 2025 by the authors. Licensee MDPI, Basel, Switzerland. This article is an open access article distributed under the terms and conditions of the Creative Commons Attribution (CC BY) license (http://creativecommons.org/licenses/by/4.0/).
Copyright: This open access article is published under a Creative Commons CC BY 4.0 license, which permit the free download, distribution, and reuse, provided that the author and preprint are cited in any reuse.


