
Submitted:
22 April 2025
Posted:
24 April 2025
You are already at the latest version
Abstract
Alpha (α)-glucosyl rutin (Rutin-G) was modified to the surface of titanium dioxide (TiO2) nanoparticles (NPs) with hydrogen peroxide (H2O2) to improve the accumulation of TiO2 NPs in cancer cells. Rutin-G acts as a competitive inhibitor of glucose and is hypothesized to bind to glucose transporter 1 (Glut1), leading to selective internalization of Rutin-G-modified-NPs (RutinG-TiOx NPs). RutinG-TiOx NPs were characterized for its optical properties using UV-Vis spectroscopy. Chemical bonds and surface functional groups were determined using Fourier transform infrared. Hydrodynamic size and zeta potential were analyzed using dynamic light scattering. Rutin-G modification on the NPs was confirmed with a relative Rutin-G amount of 22.8% on RutinG-TiOx NPs. These NPs demonstrated 3-fold higher cellular uptake than our previously developed titanium peroxide NPs with polyacrylic acid (PAA) surface-modified (PAA-TiOx NPs) on MDA-MB-231 cells. Although releasing less H2O2 (39.5 µmol/g-NPs), RutinG-TiOx NPs exhibited a comparable radio-sensitization effect to X-ray irradiation at 5 Gy, compared to PAA-TiOx NPs. Hence, RutinG-TiOx NPs offer potential selective targeting to minimize healthy tissue toxicity while maintaining the radio-sensitization effect on breast cancer cells.
Keywords:
titanium oxide nanoparticles
; rutin
; radio-sensitizer
; breast cancer
1. Introduction
Radiation therapy (radiotherapy) in cancer treatment targets damages at a cellular level. The use of ionizing radiation in radiotherapy causes DNA breaks, leading to replication failure in cancer cells. Free radicals released from the radiation add to the selective toxic effect on cancer cells. Nevertheless, this therapeutic radiation has side effects, such as acute damage to surrounding healthy tissues and prolonged impact by inducing new cancers [1,2]. Innovations to optimize radiation dose while limiting the side effects to normal cells were studied [3]. Deep inspiratory breath hold (DIBH) is one of the techniques used during radiation treatment. This method allowed left-sided breast cancer patients to receive a mean heart dose of less than 4 Gy to reduce cardiac radiation exposure during the irradiation [3,4]. Another strategy is reprogramming mitochondrial function to increase tumor oxygenation and enhance tumor response to radiotherapy [5]. Metformin for diabetic treatment was reported to be used in combination with radiotherapy and acted as a radio-sensitizer by inhibiting mitochondrial respiration in diabetic breast cancer patients [6]. Targeting glucose uptake in solid tumors is also an approach to radio-sensitize tumor cells by preventing glutathione recycling using 2-deoxyglucose (2DG) [5].
Our previous studies revealed that modifying titanium dioxide (TiO2) nanoparticles (NPs) with hydrogen peroxide (H2O2) and polyacrylic acid (PAA) on the NPs surface offers a potential radio-sensitizer to X-ray radiation [7]. The continuous release of H2O2 from these titanium peroxide NPs with PAA (PAA-TiOx NPs) is the key factor for its radio-sensitization effect [8], which contributed to tumor growth inhibition for pancreatic tumor xenograft model in mice when compared to irradiation alone [9]. PAA-TiOx NPs exploit the enhanced permeability and retention effect for tumor accumulation. However, accumulation in the liver was observed [10]. To improve the accumulation of NPs in targeted cells, in this study, we develop a surface modification of TiO2 NPs with H2O2 using α-glucosyl rutin (Rutin-G) and established as RutinG-TiOx NPs.
Rutin is one of the glycoside derivatives of flavonoid quercetin. These flavonoids were reported to have antioxidant and pro-oxidant activities depending on concentration and reaction conditions, thus arising therapeutic interests [11]. With additional glucosyl group compared to rutin, Rutin-G exhibited better water solubility, resistance to light, and had the same physiological activities as intact rutin [12]. The modification of Rutin-G on the NPs surface is hypothesized to be a competitive inhibitor of glucose in the cells. Therefore, it facilitates the inhibition of membrane protein glucose transporter 1 (Glut1), leading to more selective NPs internalization. Glut1 is one of the glucose transporters that overexpressed in cancer cells, including breast cancer cells MDA-MB-231 [13]. The current study revealed that RutinG-TiOx NPs exhibited higher cellular uptake than PAA-TiOx NPs modified with PAA molecular weight of 5,000 (MW 5,000) on the MDA-MB-231 breast cancer cell line. RutinG-TiOx NPs also have a comparable radio-sensitization effect to PAA-TiOx NPs at 5 Gy of X-ray irradiation. Thus, RutinG-TiOx NPs may limit non-targeted accumulation while offering a radio-sensitization effect as PAA-TiOx NPs have.
2. Results and Discussions
2.1. Characterization of Nanoparticles
2.1.1. Visual Observation and UV-Vis Spectra
To modify Rutin-G on TiO2 NPs with H2O2, we first determined the amount of Rutin-G for TiO2 NPs dispersion in phosphate-buffered saline (PBS) by observing the dispersibility. No precipitation was observed after 24 h at ≥ 7 mg Rutin-G with 20 mg TiO2 NPs (Figure S1 (A)). This mass ratio implied that the higher the Rutin-G amount, the better the steric hindrance of the NPs, and prevents NPs aggregation in ionic solution. This mass ratio was then used to synthesize RutinG-TiO2 NPs. Next, H2O2 was added to RutinG-TiO2 NPs, and the mixture was examined for dispersion in water and PBS. Precipitation was immediately formed when the NPs were dispersed in water, as shown in Figure 1(A). The changing acidity may cause precipitation since 30% hydrogen peroxide is acid, thus, the shifting pH value may affect the dispersion in water. On the contrary, adding H2O2 resulted in well-dispersed NPs in PBS (Figure 1(B)). It may be due to the buffered solution maintaining the pH value of the mixture. Hence, the modification of RutinG-TiO2 NPs with H2O2 (RutinG-TiOx NPs) could be achieved in an ionic solution without aggregation.
Further evaluation was conducted to confirm Rutin-G modification on the NPs. We employed UV-Vis spectroscopy to analyze the light absorption behavior of the modified NPs. Since Rutin-G has catechol moiety in the structure, it is suggested that surface complexes will be formed due to TiO2 NPs interaction with Rutin-G [14]. The complexes may be indicated in the absorbance spectra from UV-Vis spectroscopy. Figure 1(C) shows the absorbance spectra of RutinG-TiOx NPs, which are increased in wavelength and absorbance compared to TiO2 NPs. The more increased absorbance rather than red-shifted [15] may resulted from H2O2 presence in RutinG-TiOx NPs, which have UV absorption spectra at 200 – 300 nm [16]. H2O2 as an oxidizer may also affect the interaction between Rutin-G and TiO2 NPs. In addition, Rutin-G is bulkier than rutin, because of additional glucose residues bound to rutin, and possesses a better hydrophilicity than Rutin [12]. Those properties may result in weak physical adsorption, reduced charge transfer, and less spectral shift. Despite the observation, the increased absorbance at 300 – 500 nm (Figure 1(C)) may indicate that Rutin-G was adsorbed and bound to the TiOx NPs surface.
Here, we also attempted to modify PAA-TiOx NPs with Rutin-G and analyzed the absorbance spectra. Figure S1(B) and Figure S1(C) showed that RutinG-PAA-TiOx NPs with PAA MW 1,800 and PAA MW 5,000, respectively, have similar spectra trends to RutinG-TiOx NPs. Slightly higher absorbances observed from PAA-TiOx and RutinG-PAA-TiOx NPs modified with PAA MW 5,000 compared to those modified with PAA MW 1,800 were suggested from an increased adsorption layer thickness of PAA with higher MW [17].
2.1.2. Fourier Transform Infrared (FT-IR) Spectra
The FT-IR spectra of RutinG-TiOx NPs compared to bare TiO2 NPs and Rutin-G are shown in Figure 1(D). The infrared (IR) spectra of Rutin-G showed a broad band at 3600 – 3000 cm-1 corresponding to the vibrations of hydroxyl group (O – H). A band at 2931 cm-1 corresponds to alkane (C – H) stretching vibrations, and peaks at 1652 – 1454 cm-1 exhibited the aromatic C=C and C=O stretching vibrations. A band at 1069 cm-1 can be attributed to C – OH groups of sugars [18]. The IR spectra of TiO2 NPs showed a band around 1620 cm-1, which may correspond to the stretching mode of Ti – OH and was ascribed to the adsorption of water on TiO2 NPs surface [19]. A strong band at 1384 cm-1 corresponds to Ti – O modes [20]. After modification with H2O2, RutinG-TiOx NPs IR spectra showed a band at 2900 – 2800 cm-1, which can be attributed to the combination band of O – H and H – O – O – H bending from H2O2 [21]. Bands at 1651, 1362, and 1048 cm-1 can be associated with Rutin-G bounded to the surface of NPs.
Modification of Rutin-G on PAA-TiOx NPs was also evaluated. It was observed that bands at 1053 cm-1 and 1054 cm-1 of RutinG-PAA-TiOx NPs (MW 1,800) (Figure S1(D)) and RutinG-PAA-TiOx NPs (MW 5,000) (Figure S1(E)), respectively, should be from Rutin-G modified to PAA-TiOx NPs. In addition, bands at 1706, 1569, and 1457 cm-1 may indicate NPs surface coated with PAA [7].
2.1.3. Size and Zeta Potential
Dynamic light scattering was employed to evaluate the hydrodynamic diameter of modified NPs. The average size of RutinG-TiOx NPs in water and culture media (DMEM supplemented with FBS) was 73.8 ± 0.5 nm and 182.1 ± 1.6 nm, respectively. Increased size in culture media is likely due to protein corona formed around inorganic NPs because NPs adsorb sets of proteins from the culture media [22]. The distinct increased size was not the case in PAA-modified NPs, regardless of the MW of PAA. The average size of RutinG-PAA-TiOx NPs (MW 1,800) and RutinG-PAA-TiOx NPs (MW 5,000) in culture media were smaller than RutinG-TiOx NPs. However, the average size in water was larger (Table S1). Carboxyl groups of the PAA modified on NPs become deprotonated in water, thus causing more negative charge on NPs surface. On the other hand, proteins from the culture media are generally negatively charged, making the electrostatic repulsion rise [17,23]. Consequently, protein adsorption to PAA-modified NPs is less than that of RutinG-TiOx NPs, and this is indicated by the smaller size. Although RutinG-TiOx NPs in culture media showed a slightly higher PdI value (0.2) than PAA-modified NPs (0.1), the values were quite low and indicated that the modified NPs were stable, and neither of them had significant aggregation in culture media.
The considered stable and non-aggregated characteristics are also indicated in water for the modified NPs. Generally, the average size of RutinG-TiOx NPs in water was smaller than PAA-modified NPs because of PAA modification on the NPs (Table S1). RutinG-PAA-TiOx NPs (MW 5,000) showed smaller size than RutinG-PAA-TiOx NPs (MW 1,800) due to different polymer conformation of PAA. Polymer conformation of lower MW PAA is flatter than higher MW PAA. Higher MW PAA has more loops and tails, making the chains more extended, leading to better steric stabilization and well-separated NPs. Different conformation is also the reason for the more negative zeta potential of RutinG-PAA-TiOx NPs (MW 5,000), as the conformation pushes the slippage plane outward [17]. The moderately strong negative surface charge of all modified NPs indicates good colloidal dispersion and reduced aggregation, supporting the hydrodynamic size observation. Although RutinG-TiOx NPs may have similar electrostatic stabilization to RutinG-PAA-TiOx NPs (MW 5,000) based on zeta potential (Table S1), the latter may provide additional steric stabilization because of the extended PAA conformation.
2.1.4. Rutin-G Amount
The relative amount of Rutin-G on modified NPs was calculated based on thermogravimetric analyses at 100 – 500°C (Figure S2). The weight loss of modified NPs between the temperature range was associated with Rutin-G decomposition. The weight at 500°C was applied to the calculation as complete Rutin-G and PAA decomposition were assumed to be at 500°C (Table S2). RutinG-TiOx NPs carried 22.8% Rutin-G, while PAA-modified NPs showed approximately one-third of the amount. Rutin-G amount on RutinG-PAA-TiOx NPs (MW 1,800) and RutinG-PAA-TiOx NPs (MW 5,000) was 7.3% and 7.9%, respectively. Since both PAA-modified NPs carried a similar amount of Rutin-G, it is suggested that PAA chain length does not significantly impact Rutin-G modification. Instead, PAA modification may reduce the available binding sites for Rutin-G, and steric hindrance from PAA may limit Rutin-G adsorption onto the NPs. According to this analysis, we focused on RutinG-TiOx NPs for further assays to investigate the effect of Rutin-G-modified NPs on breast cancer cells treated with X-ray radiation, compared to previously studied PAA-TiOx NPs (MW 5,000) [7].
2.1.5. Hydrogen Peroxide Released from RutinG-TiOx NPs
A previous study suggested that the radio-sensitizing effect of PAA-TiOx NPs (MW 5,000) was related to H2O2 released from the NPs in the liquid phase [7]. In this study, we evaluated whether Rutin-G modification affects this characteristic. At first, we determined the adsorbed H2O2 amount to RutinG-TiO2 NPs or PAA-TiO2 NPs by measuring the remaining amount of H2O2 in the filtrate of the mixture. The MW of PAA used in this assay was 5,000. It was revealed that after 24 h, H2O2 was adsorbed onto the RutinG-TiO2 NPs at 794.8 µmol/g-NPs. This amount was approximately 2-fold the time of the adsorbed amount of PAA-TiO2 NPs (392.5 µmol/g-NPs). A steady state was observed at 48 h with a similar amount of adsorbed H2O2 (Figure 2(A)).
The steric hindrance due to PAA modification on the NPs surface may be the reason for less adsorbed H2O2 onto PAA-TiO2 NPs. However, we observed that H2O2 presented in the dialysate from the PAA-TiO2 NPs mixture was a 3-fold time of which was detected from the RutinG-TiO2 NPs mixture (Figure 2(B)). Considering the adsorbed amount of H2O2 onto each NPs, it was revealed that the H2O2 released amount from RutinG-TiOx NPs was less than PAA-TiOx NPs, 39.5 µmol/g-NPs and 219.8 µmol/g-NPs, respectively. It was suggested that not only the adsorbed H2O2 contributes to the H2O2 released ability of PAA-TiOx NPs, but also the Ti – OOH structure from TiO2 NPs itself [7]. Adsorbed H2O2 is indeed not completely desorbed from the NPs surface. Nevertheless, H2O2 adsorbed onto RutinG-TiOx NPs exhibited some degree of irreversibility. The different surface modifications may cause this discrepancy. PAA may retain H2O2 yet is capable of releasing it reversibly, while with Rutin-G modification, the dynamics of H2O2 adsorb-desorb may change and result in a 5-fold time lower release compared to PAA modification. Although having a lower H2O2 release profile than PAA-TiOx NPs, we subjected RutinG-TiOx NPs to cell assays to evaluate whether Rutin-G modification affects the NPs behavior and effect on cancer cell treatment.
2.2. Cell Assays
2.2.1. Cell Cytotoxicity
WST assay was conducted to analyze the potential cytotoxicity of RutinG-TiOx NPs compared to PAA-TiOx NPs on MDA-MB-231 cells. Figure 3 showed that both NPs cytotoxicity was concentration- and time-dependent. Within 1 h, the NPs effect may not be apparent due to the short-time contact. The cytotoxicity effect was more distinct after 4-h and 24-h incubation, and both NPs showed a comparable effect. According to the result, we applied 0.25 mg/mL for 4 h on subsequent cell uptake assays.
2.2.2. Cellular Uptake
The cell uptake of RutinG-TiOx NPs on MDA-MB-231 cells was determined by analyzing the titanium (Ti) amount in the cell lysate, which was quantified by X-ray fluorescence. The amount of Ti was normalized to the total protein concentration of the cell lysate. Figure 4(A) showed that more Ti was detected from cell lysate treated with RutinG-TiOx NPs than those treated with PAA-TiOx NPs. This result indicated that RutinG-TiOx NPs internalized more by the cells with Ti amount of 3.3 ± 0.4 × 10⁻³ µg/µg protein. This amount was 3 times higher than from PAA-TiOx NPs treatment (1.1 ± 0.1 × 10⁻³ µg Ti/µg protein). We also analyzed the Ti amount in the cell lysate after treatment with RutinG-PAA-TiOx NPs (Figure S3). It was implied that RutinG-TiOx NPs were taken up more by the cells than RutinG-PAA-TiOx NPs, regardless of the PAA MW. These results can be correlated to the relative amount of Rutin-G on each modified NPs, as shown in Table S2. Therefore, to confirm whether the enhanced uptake was due to Rutin-G modification, we performed a competitive assay by blocking Glut1.
WZB117, a Glut1 inhibitor, was employed in this study as it was reported to inhibit the expression of Glut1 mRNA and protein, and suppress the glucose uptake in MDA-MB-231 cells [24]. In agreement, Figure S5(A) showed that WZB117 caused a significantly lowered uptake of glucose derivative 2-deoxy-D-glucose (2DG) in MDA-MB-231 cells. The 2DG uptake was reduced by 1.5-fold compared to the cells without WZB117 treatment. Hence, we confirmed that WZB117 effectively inhibited glucose uptake in our cell system. Therefore, we applied RutinG-TiOx NPs to MDA-MB-231 cells treated with WZB117 and compared them to those without WZB117 treatment. Figure S5(B) showed that WZB117-treated MDA-MB-231 cells internalized 1.4-fold less RutinG-TiOx NPs than MDA-MB-231 cells without WZB117 treatment. However, the difference was not statistically significant, possibly due to the protein corona on RutinG-TiOx NPs, as discussed in Section 2.1.3. Thus, the Glut1 targeting is hindered to some degree. Nevertheless, these results implied that RutinG-TiOx NPs exhibited enhanced internalization to MDA-MB-231 cells, compared to PAA-TiOx NPs, by targeting Glut1 on the cells and the Rutin-G modification mediates it.
2.2.3. Colony Formation
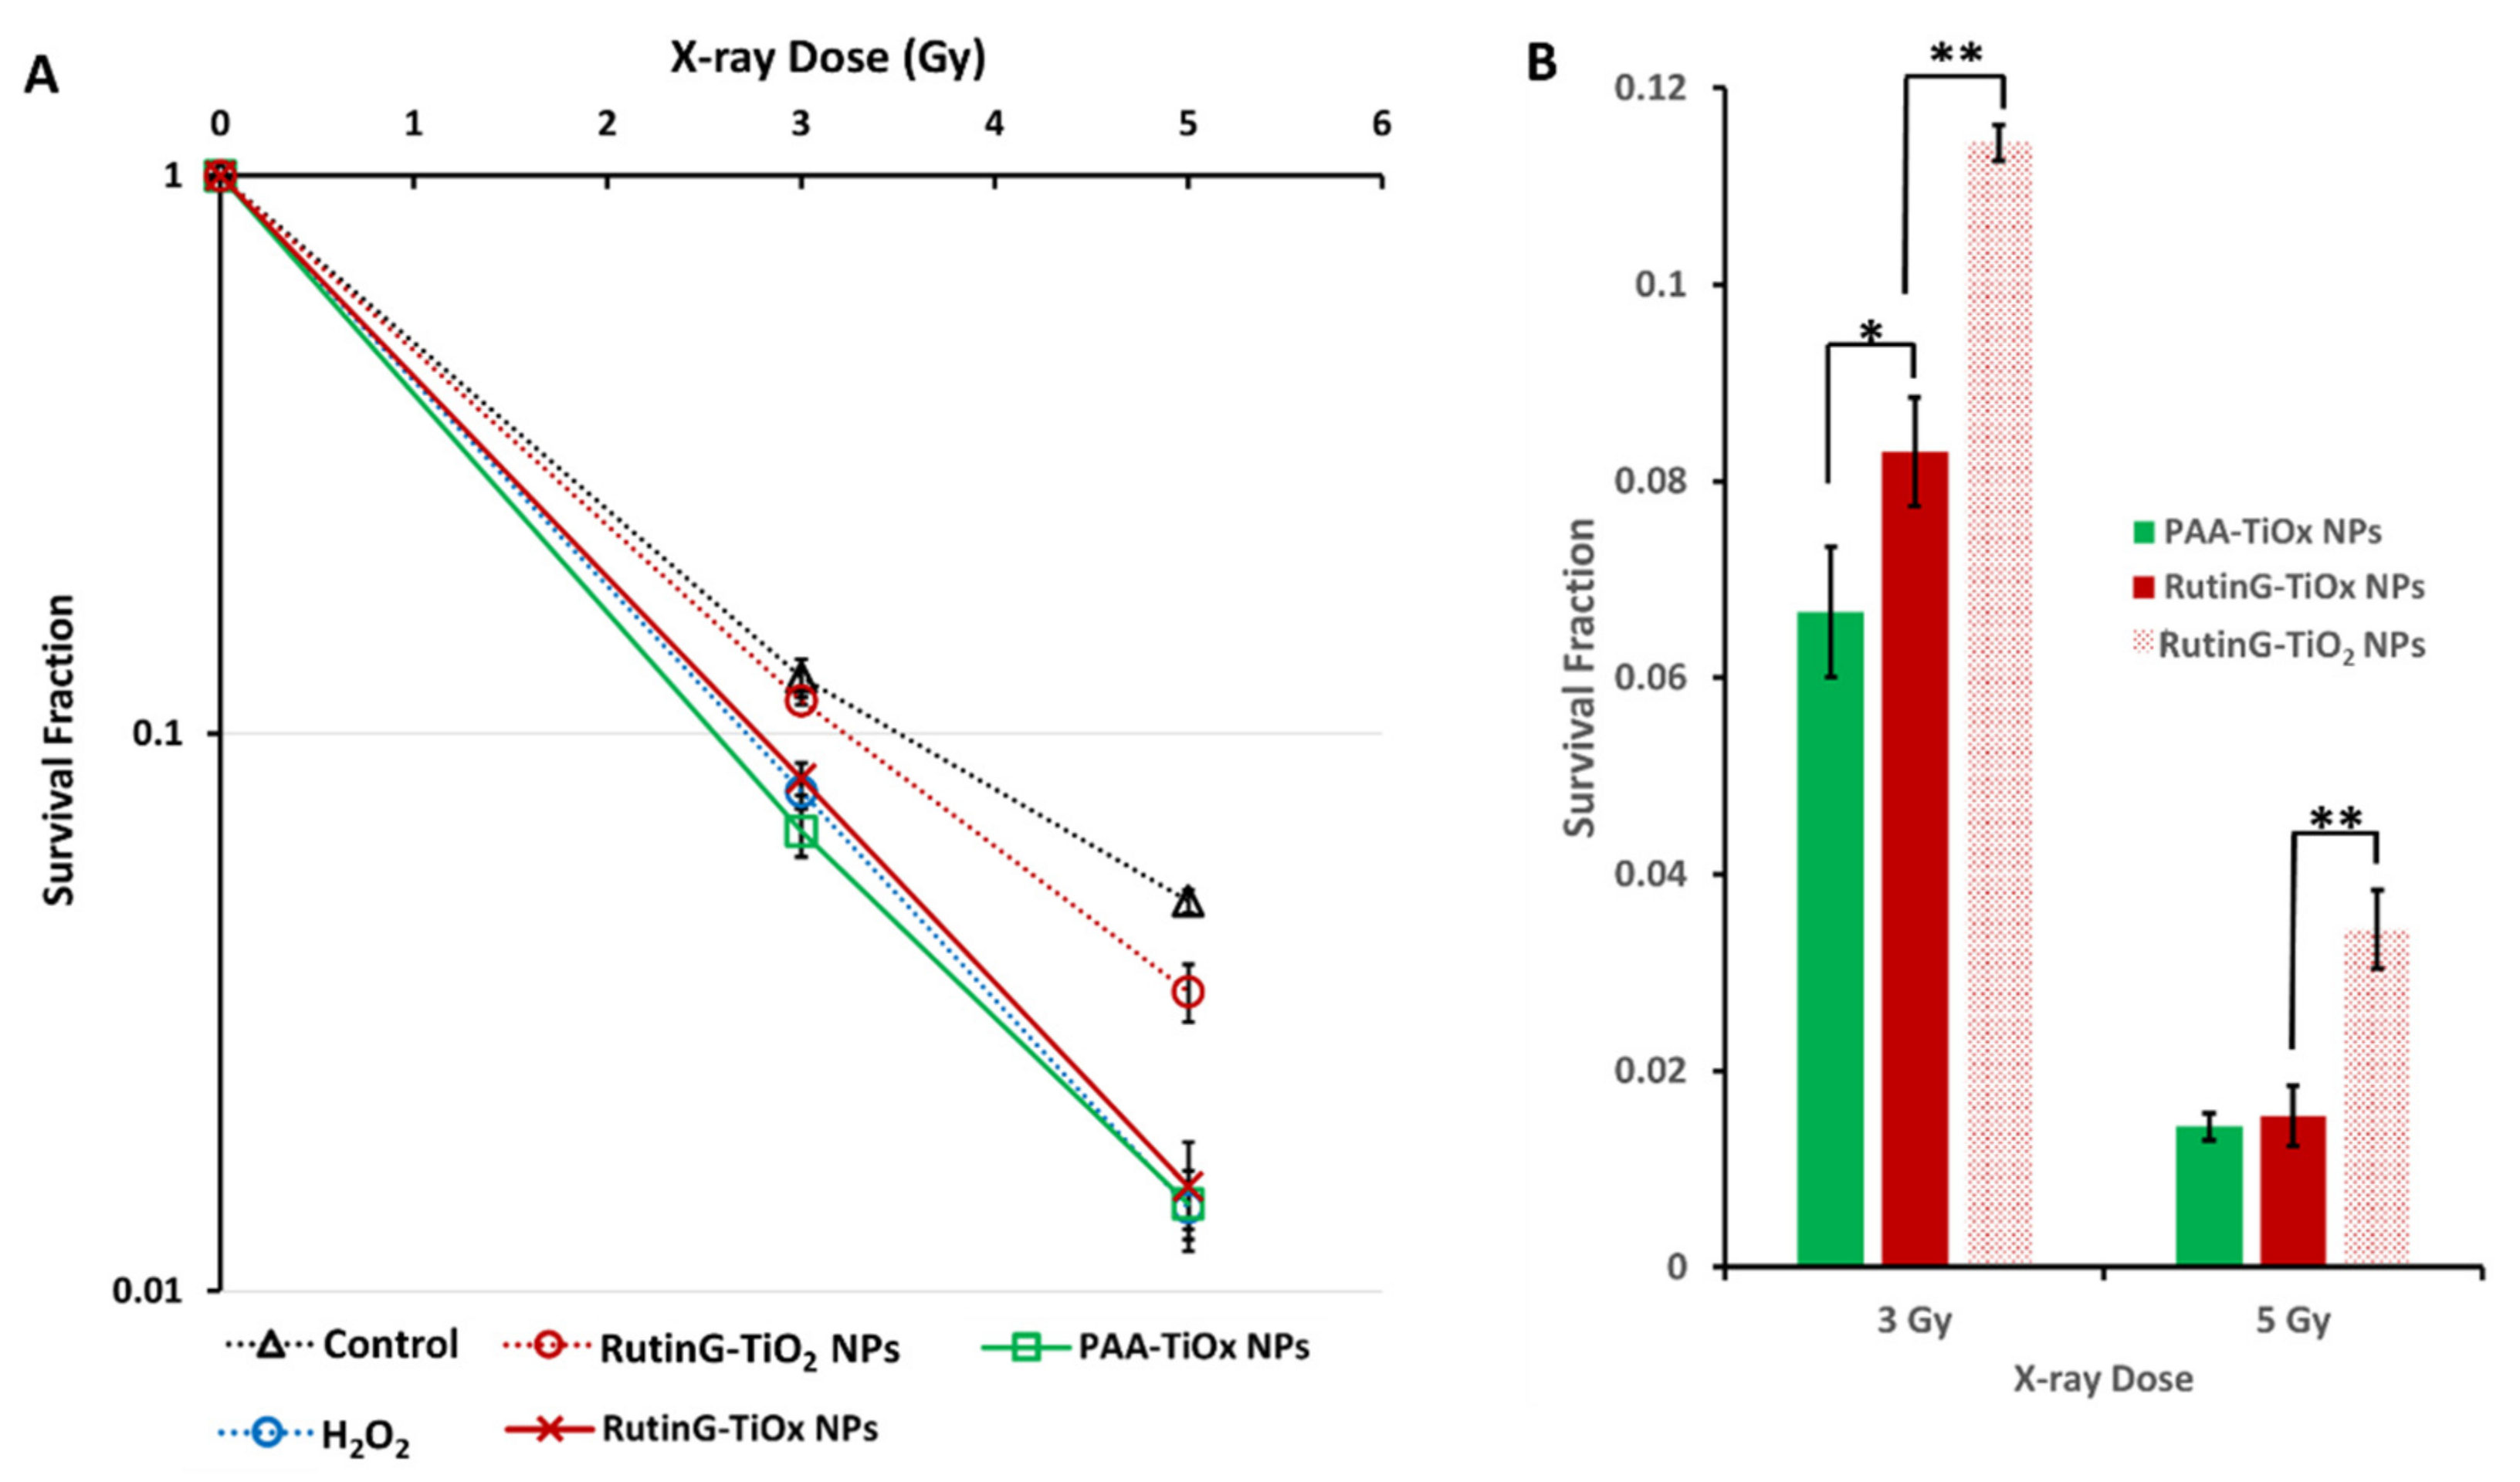
The radio-sensitizing effect of RutinG-TiOx NPs was assessed using a colony formation assay. As depicted in Figure 5(A), the cells survival fraction (SF) decreased with increasing X-ray doses and RutinG-TiOx NPs. Similar declining SF trends were also exhibited with the treatment of RutinG-TiO2 NPs and PAA-TiOx NPs. Compared to RutinG-TiO2 NPs, RutinG-TiOx NPs generated lower SF. The effect of RutinG-TiO2 NPs was comparable to that of the control. On the other hand, PAA-TiOx NPs exhibited even lower SF than RutinG-TiOx NPs. Figure 5(B) showed the extracted results from the SF curve, and it showed that SF with treatment of PAA-TiOx NPs was significantly lower than with RutinG-TiOx NPs at 3 Gy. Higher dose of X-ray clearly induced more pronounced damage to the cells, yet the SF from these two NPs were comparable. The more impactful effect of PAA-TiOx NPs compared to RutinG-TiOx NPs is likely due to a higher amount of H2O2 release from PAA-TiOx NPs, as discussed in Section 2.1.5. The higher H2O2 release may contribute to the enhanced oxidative stress and radio-sensitization, thus resulting in a significant reduction of SF at 3 Gy. In comparison, with a dose of 5 Gy, the radio-sensitizing effect from both NPs may become saturated under the current experimental conditions. The role of H2O2 presence in improving the X-ray radiation was confirmed as RutinG-TiO2 NPs exhibited significantly higher SF at both 3 and 5 Gy compared to RutinG-TiOx NPs. This indicates that additional ROS generation may work synergistically with X-ray radiation to further damage the cells.
The X-ray radiation was exposed immediately after the application of the NPs. Thus, the results indicated that the surface chemistry of the NPs plays a role in the radio-sensitizing effect. Despite exhibiting a trend toward slightly less radio-sensitization effect than PAA-TiOx NPs, RutinG-TiOx NPs in a longer time incubation demonstrated the advantage in terms of selective targeted delivery to Glut1-overexpressed cancer cells, including MDA-MB-231 cells (Figure 4). Higher cellular uptake of RutinG-TiOx NPs may facilitate the damage limitation to surrounding healthy cells. Additionally, it exhibits a comparable radio-sensitization effect to PAA-TiOx NPs (Figure 5). Hence, based on these results, RutinG-TiOx NPs are superior to PAA-TiOx NPs.
3. Materials and Methods
3.1. Nanoparticles
3.1.1. PAA-TiOx NPs
TiO2 NPs (STS-01, Ishihara Sangyo Kaisha, Osaka, Japan) were modified with PAA (MW 1,800 or MW 5,000) and H2O2 according to the previous method [7]. Briefly, TiO2 NPs were surface modified with PAA through hydrothermal reaction to obtain PAA-TiO2 NPs. PAA-TiO2 NPs were subsequently mixed with 6% H2O2 solution, resulting in PAA-TiOx NPs.
3.1.2. RutinG-TiOx NPs
Different masses of Rutin-G (1-10 mg) from Wako Pure Chemical Industries Ltd., Osaka, Japan were tested on a fixed amount of TiO2 NPs (20 mg) in PBS. Precipitation of the NPs was observed after 24 h to determine the Rutin-G amount to disperse the NPs. RutinG-TiOx NPs were synthesized by initially dissolving Rutin-G in distilled water and adding TiO2 NPs with continuous stirring. The mixture was centrifuged (5,000× g, 30 min) five times with distilled water using a centrifugal filter (3,000 MWCO). The residue was then dispersed in PBS and subsequently added with H2O2. Further centrifugation was performed as in the previous step to remove excess materials. The residue was dispersed in distilled water as RutinG-TiOx NPs.
3.1.3. RutinG-PAA-TiOx NPs
Rutin-G (100 mg) was dissolved in distilled water (35 mL) prior to the addition of PAA-TiOx NPs (0.5 mL) with continuous stirring. Excess materials were removed by centrifugation (5,000× g, 30 min) two times using a centrifugal filter (3,000 MWCO). RutinG-PAA-TiOx NPs were dispersed in distilled water.
3.2. Characterization of Nanoparticles
UV-Vis spectroscopy was employed to determine the synthesis of NPs. Absorption spectra of 0.01 mg/mL NPs were recorded within the wavelength range of 200 to 800 nm. FTIR was performed to further study the surface chemistry of NPs using Jasco FT/IR-460 Plus (Jasco International Co., Ltd., Tokyo, Japan) with a scanning range of 500-4000 cm-1. The potassium bromide pellet method was used in FTIR analysis. The size and zeta potential of synthesized NPs were characterized by dynamic light scattering using Zetasizer Nano ZS (Malvern Instrument Ltd., Worcestershire, UK). Thermogravimetric analysis was conducted using ThermoplusEVO2 (Rigaku, Tokyo, Japan). Freeze-dried samples (5 mg) were measured under Nitrogen gas with a heating rate of 10°C/min up to 500°C. Morphology of the NPs was observed using a transmission electron microscope (JEM-2100F, JEOL, Tokyo, Japan) [25].
3.3. Evaluation of Hydrogen Peroxide Adsorption and Release
The adsorption and release of H2O2 from the NPs were analyzed as previously described [25]. For adsorption analysis, RutinG-TiO2 or PAA-TiO2 NPs (1 mg/ml) in PBS were mixed with H2O2 (1000 µmol/g) at room temperature using a rotary incubator. The mixture was sampled over time and followed by ultrafiltration (3,000 MWCO) for 10 min at 12,000 rpm. The remaining H2O2 concentration in the filtrate was measured using a hydrogen peroxide fluorometric detection kit (Enzo Biochem, Inc., Farmingdale, NY, USA). The mixture was packed in a cellulose dialysis tube for release analysis and put in a 200-mL-baffled flask for dialysis in PBS (100 mL). Dialysis was conducted at 37°C and 120 rpm with sampling over time. The desorbed H2O2 from the NPs in the dialysate was measured using the adsorption analysis method. The adsorbed H2O2 amount was the difference between the initial H2O2 concentration and the remaining concentration detected in the filtrate. The released H2O2 amount was calculated as the difference between H2O2 concentration in dialysate and unadsorbed H2O2.
3.4. Cytotoxicity Assay
MDA-MB-231 (human breast cancer cell line) was used in this study to determine the effect of modified NPs. The cells (5 × 10⁴/well) were cultured in 96-well plate for 24 h in Dulbecco's modified Eagle medium (DMEM) High Glucose (Nacalai Tesque, Inc., Kyoto, Japan) supplemented with 10% fetal bovine serum (FBS) and 1% antibiotic solution (100 U/mL penicillin, 100 µg/mL streptomycin, and 0.25 µg/mL amphotericin B). Following the incubation, cells were washed with PBS and NPs in the medium were applied to the cells for 1, 4, and 24 h. Cells were then washed three times with PBS before adding the medium. Cell Counting Kit-8 (Dojindo, Kumamoto, Japan) reagent was added to each well. After incubation for 2 h, the absorbance at 490 nm was observed.
3.5. Cellular Uptake of Nanoparticles
Cells (1.5 × 10⁶ cells) were cultured into 100-mm-dish overnight. The medium was replaced with DMEM (Glucose-free), and incubation was continued for another 1 h. The NPs were applied to the cells for 4 h followed by cells collection using trypsin-EDTA. Cells were then lysed using RIPA buffer for total protein measurement using a bicinchoninic acid (BCA) assay. Cell lysate was also subjected to titanium concentration measurement using XRF. Cell lysate (13.5 µL) was mixed with 100 ppm Cobalt solution (1.5 µL). The mixture (10 µL) was dropped on a glass slide and heated on a hot plate for water evaporation. The NPs uptake was normalized to the total protein concentration.
Cellular uptake was also analyzed on Glut1-inhibited cells to confirm the targeting ability of modified NPs. WZB117 (10 µM) was added to a fresh medium for a further 24 h incubation of the overnight-grown cells. Subsequent procedures were carried out as described above. WZB117 ability to inhibit Glut1 was determined by evaluating the uptake of glucose derivative, 2DG. A glucose cellular uptake measurement kit (Cosmo Bio Inc., Tokyo, Japan) was used to calculate the glucose uptake normalized to the total protein concentration in the cell lysate.
3.6. Colony Formation Assay
Cells (1 × 10⁵ cells/well) were cultured into 6-well plate for 24 h. Cells were then treated with 1 mL NPs (1 mg/mL) and subsequently irradiated with X-ray (5 Gy) using MX-160Labo (Medi-X-Tech Co., Ltd., Chiba, Japan). The control group was cells treated with PBS. Cells were re-plated into 6-well plate and incubated for 10 days. Colonies were stained with 1 mM methylene blue, and the survival fraction was determined using the following equations.
Equation (1) was used to calculate plating efficiency (PE).
Equation (2) was used to determine survival fraction (SF).
3.7. Statistical Analysis
All data were presented as the mean ± standard deviation of three replications per condition. A two-tail Student’s t-test was performed to statistically analyze the data. A p-value ≤ 0.05 was considered to be statistically significant.
4. Conclusions
RutinG-TiOx NPs were synthesized and characterized. These NPs can release H2O2 in the dispersion, which may lead to ROS generation and radio-sensitization to X-ray radiation. Compared to PAA-TiOx NPs, RutinG-TiOx NPs internalized more to MDA-MB-231 cells, likely due to Rutin-G modification mediating a selective interaction to the Glut1-overexpressed cells. This surface modification was also suggested to contribute to its radio-sensitization effect, comparable to the results of PAA-TiOx NPs shown after immediate single-dose irradiation. This study suggests that RutinG-TiOx NPs potentially provide (1) selective targeting delivery to minimize exposure to healthy surrounding tissues and (2) radio-sensitization effect to X-ray irradiation on MDA-MB-231 cells.
Supplementary Materials
The following supporting information can be downloaded at the website of this paper posted on Preprints.org. Figure S1: Characterization of modified NPs; Figure S2: Thermograph of TiO2 NPs and modified NPs; Figure S3: Cellular uptake of modified NPs; Figure S4: Confirmation of Glut1 targeting ability of Rutin-G; Table S1: Hydrodynamic size and zeta potential of modified NPs; Table S2: Relative amount of Rutin-G based on thermogravimetric weight loss.
Author Contributions
Conceptualization, K.M., Y.M., P.K., R.S. and C.O.; formal analysis, W.T. and K.K.; resources, R.S and C.O.; writing—original draft preparation, W.T.; writing—review and editing, W.T., K.M., C.O.; supervision and funding acquisition, C.O. All authors have read and agreed to the published version of the manuscript.
Funding
This work was partially supported by JSPS KAKENHI Grant Numbers JP21K19910, JP21K07594, and JP20KK0192.
Conflicts of Interest
The authors declare no conflicts of interest.
References
- Vaidya, J.S. Principles of Cancer Treatment by Radiotherapy. Surgery (Oxford) 2023, 42, 139–149. [Google Scholar] [CrossRef]
- Feys, L.; Descamps, B.; Vanhove, C.; Vral, A.; Veldeman, L.; Vermeulen, S.; De Wagter, C.; Bracke, M.; De Wever, O. Radiation-Induced Lung Damage Promotes Breast Cancer Lung-Metastasis through CXCR4 Signaling. Oncotarget 2015, 6, 26615–26632. [Google Scholar] [CrossRef] [PubMed]
- Abshire, D.; Lang, M.K. The Evolution of Radiation Therapy in Treating Cancer. Semin Oncol Nurs 2018, 34, 151–157. [Google Scholar] [CrossRef] [PubMed]
- Pang, W.Y.C.; Yu, K.S.; Loke, A.Y. Cardiac Dose Comparison of Abdominal and Thoracic Deep Inspiration Breath Hold in Adult Female with Left-Sided Breast Cancer Receiving Radiation Therapy: A Systematic Review and Meta-Analysis. Radiography 2025, 31, 426–433. [Google Scholar] [CrossRef]
- Giaccia, A.J. Molecular Radiobiology: The State of the Art. Journal of Clinical Oncology 2014, 32, 2871–2878. [Google Scholar] [CrossRef]
- Ferro, A.; Goyal, S.; Kim, S.; Wu, H.; Taunk, N.K.; Schiff, D.; Pirlamarla, A.; Haffty, B.G. Evaluation of Diabetic Patients with Breast Cancer Treated with Metformin during Adjuvant Radiotherapy. Int J Breast Cancer 2013, 2013, 1–7. [Google Scholar] [CrossRef]
- Morita, K.; Miyazaki, S.; Numako, C.; Ikeno, S.; Sasaki, R.; Nishimura, Y.; Ogino, C.; Kondo, A. Characterization of Titanium Dioxide Nanoparticles Modified with Polyacrylic Acid and H2O2 for Use as a Novel Radiosensitizer. Free Radic Res 2016, 50, 1319–1328. [Google Scholar] [CrossRef]
- Hassan, M.; Nakayama, M.; Salah, M.; Akasaka, H.; Kubota, H.; Nakahana, M.; Tagawa, T.; Morita, K.; Nakaoka, A.; Ishihara, T.; et al. A Comparative Assessment of Mechanisms and Effectiveness of Radiosensitization by Titanium Peroxide and Gold Nanoparticles. Nanomaterials 2020, 10, 1–19. [Google Scholar] [CrossRef]
- Nakayama, M.; Sasaki, R.; Ogino, C.; Tanaka, T.; Morita, K.; Umetsu, M.; Ohara, S.; Tan, Z.; Nishimura, Y.; Akasaka, H.; et al. Titanium Peroxide Nanoparticles Enhanced Cytotoxic Effects of X-Ray Irradiation against Pancreatic Cancer Model through Reactive Oxygen Species Generation in Vitro and in Vivo. Radiation Oncology 2016, 11, 1–11. [Google Scholar] [CrossRef]
- Morita, K.; Suzuki, T.; Nishimura, Y.; Matsumoto, K.; Numako, C.; Sato, K.; Nakayama, M.; Sasaki, R.; Ogino, C.; Kondo, A. In Vivo Tissue Distribution and Safety of Polyacrylic Acid-Modified Titanium Peroxide Nanoparticles as Novel Radiosensitizers. J Biosci Bioeng 2018, 126, 119–125. [Google Scholar] [CrossRef]
- Kessler, M.; Ubeaud, G.; Jung, L. Anti- and pro-Oxidant Activity of Rutin and Quercetin Derivatives. Journal of Pharmacy and Pharmacology 2003, 55, 131–142. [Google Scholar] [CrossRef] [PubMed]
- Suzuki, Y.; Suzuki, K.; Yoneyama, M.; Hijiya, H.; Miyake, T. Preparation and Uses of Alpha-Glycosyl Rutin 1992.
- Grover-McKay, M.; Walsh, S.A.; Seftor, E.A.; Thomas, P.A.; Hendrix, M.J.C. Role for Glucose Transporter 1 Protein in Human Breast Cancer. Pathology Oncology Resesarch 1998, 4, 115–120. [Google Scholar] [CrossRef] [PubMed]
- Macyk, W.; Szaciłowski, K.; Stochel, G.; Buchalska, M.; Kuncewicz, J.; Łabuz, P. Titanium(IV) Complexes as Direct TiO2 Photosensitizers. Coord Chem Rev 2010, 254, 2687–2701. [Google Scholar] [CrossRef]
- Labuz, P.; Sadowski, R.; Stochel, G.; Macyk, W. Visible Light Photoactive Titanium Dioxide Aqueous Colloids and Coatings. Chemical Engineering Journal 2013, 230, 188–194. [Google Scholar] [CrossRef]
- Aye, T.T.; Low, T.Y.; Sze, S.K. Nanosecond Laser-Induced Photochemical Oxidation Method for Protein Surface Mapping with Mass Spectrometry. Anal Chem 2005, 77, 5814–5822. [Google Scholar] [CrossRef]
- Liufu, S.; Xiao, H.; Li, Y. Adsorption of Poly(Acrylic Acid) onto the Surface of Titanium Dioxide and the Colloidal Stability of Aqueous Suspension. J Colloid Interface Sci 2005, 281, 155–163. [Google Scholar] [CrossRef]
- Paśko, P.; Galanty, A.; Dymerski, T.; Kim, Y.M.; Park, Y.S.; Cabrales-Arellano, P.; Martinez, V.V.; Delgado, E.; Gralak, M.; Deutsch, J.; et al. Physicochemical and Volatile Compounds Analysis of Fruit Wines Fermented with Saccharomyces Cerevisiae: FTIR and Microscopy Study with Focus on Anti-Inflammatory Potential. Int J Mol Sci 2024, 25, 5627. [Google Scholar] [CrossRef]
- Chougala, L.S.; Yatnatti, M.S.; Linganagoudar, R.K.; Kamble, R.R.; Kadadevarmath, J.S. A Simple Approach on Synthesis of TiO2 Nanoparticles and Its Application in Dye Sensitized Solar Cells. Journal of Nano- and Electronic Physics 2017, 9, 04005. [Google Scholar] [CrossRef]
- León, A.; Reuquen, P.; Garín, C.; Segura, R.; Vargas, P.; Zapata, P.; Orihuela, P.A. FTIR and Raman Characterization of TiO2 Nanoparticles Coated with Polyethylene Glycol as Carrier for 2-Methoxyestradiol. Applied Sciences 2017, 7, 49. [Google Scholar] [CrossRef]
- Oba, Y.; Osaka, K.; Watanabe, N.; Chigai, T.; Kouchi, A. Reaction Kinetics and Isotope Effect of Water Formation by the Surface Reaction of Solid H2O2 with H Atoms at Low Temperatures. Faraday Discuss 2014, 168, 185–204. [Google Scholar] [CrossRef]
- Maiorano, G.; Sabella, S.; Sorce, B.; Brunetti, V.; Malvindi, M.A.; Cingolani, R.; Pompa, P.P. Effects of Cell Culture Media on the Dynamic Formation of Protein-Nanoparticle Complexes and Influence on the Cellular Response. ACS Nano 2010, 4, 7481–7491. [Google Scholar] [CrossRef] [PubMed]
- Liang, L.; Everest-Dass, A.V.; Kostyuk, A.B.; Khabir, Z.; Zhang, R.; Trushina, D.B.; Zvyagin, A.V. The Surface Charge of Polymer-Coated Upconversion Nanoparticles Determines Protein Corona Properties and Cell Recognition in Serum Solutions. Cells 2022, 11, 3644. [Google Scholar] [CrossRef] [PubMed]
- Zhao, F.; Ming, J.; Zhou, Y.; Fan, L. Inhibition of Glut1 by WZB117 Sensitizes Radioresistant Breast Cancer Cells to Irradiation. Cancer Chemother Pharmacol 2016, 77, 963–972. [Google Scholar] [CrossRef] [PubMed]
- Morita, K.; Nishimura, Y.; Nakamura, S.; Arai, Y.; Numako, C.; Sato, K.; Nakayama, M.; Akasaka, H.; Sasaki, R.; Ogino, C.; et al. Titanium Oxide Nano-Radiosensitizers for Hydrogen Peroxide Delivery into Cancer Cells. Colloids Surf B Biointerfaces 2021, 198, 1–8. [Google Scholar] [CrossRef]
Figure 1.
Physical appearance of the mixture after H2O2 addition onto TiO2 NPs dispersed in (A) water and (B) PBS; (C) UV-Vis absorbance spectra of RutinG-TiOx NPs; (D) FT-IR spectra of RutinG-TiOx NPs.
Figure 1.
Physical appearance of the mixture after H2O2 addition onto TiO2 NPs dispersed in (A) water and (B) PBS; (C) UV-Vis absorbance spectra of RutinG-TiOx NPs; (D) FT-IR spectra of RutinG-TiOx NPs.
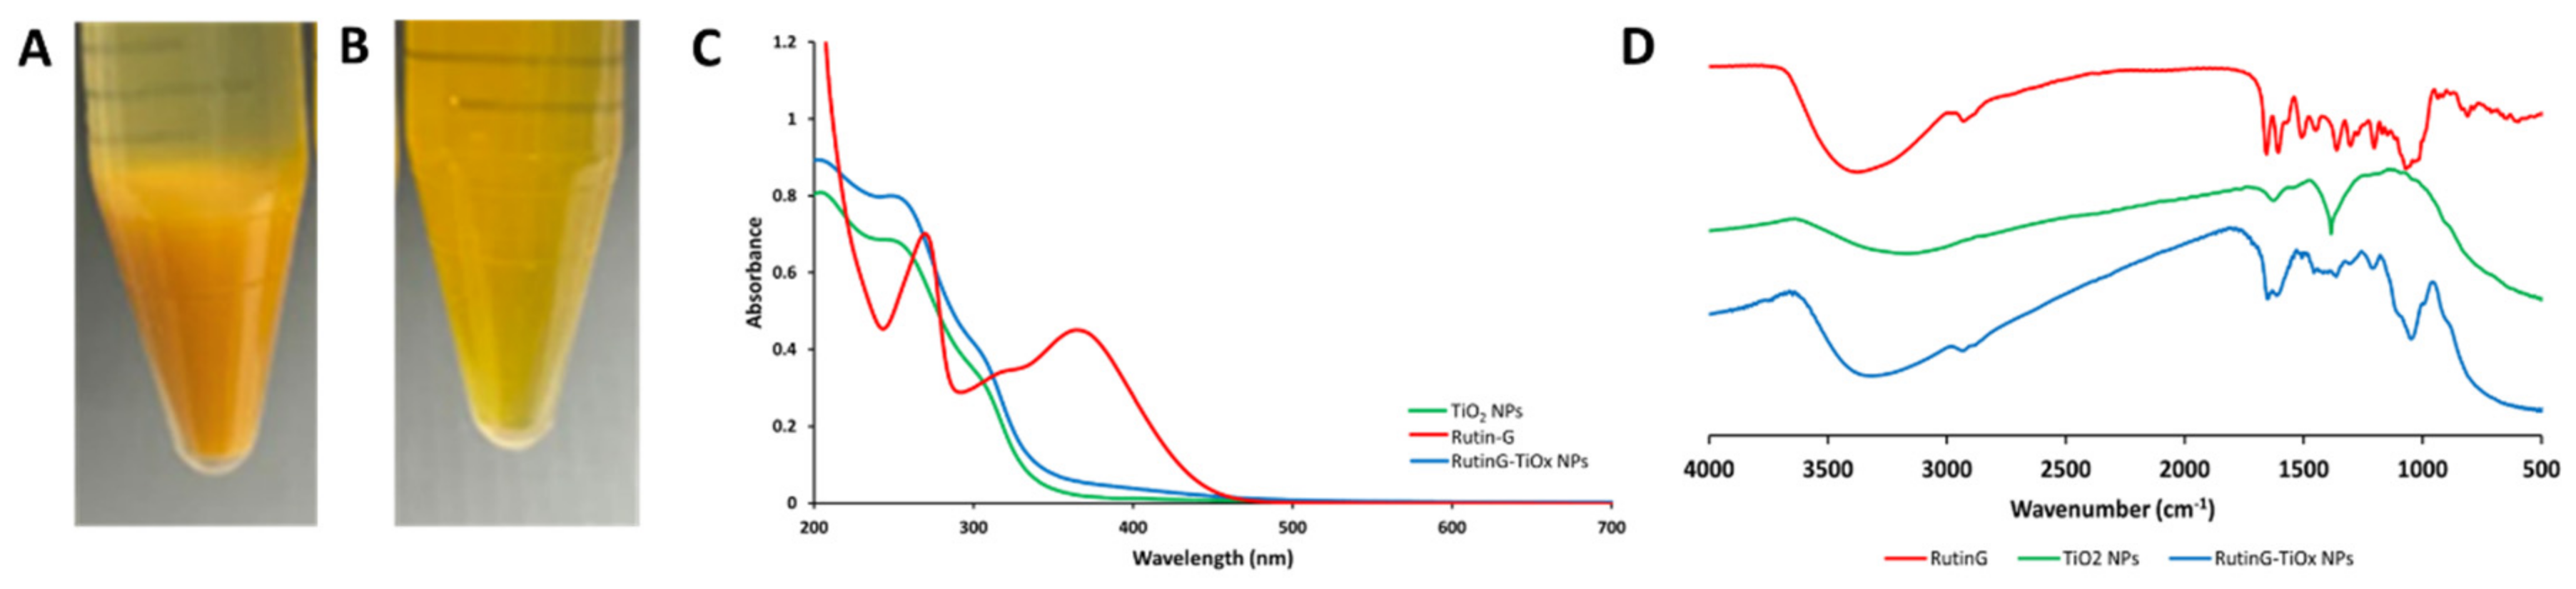
Figure 2.
(A) Concentration of H2O2 (µmol/g nanoparticles) adsorbed to RutinG-TiO2 NPs / PAA- TiO2 NPs (MW 5,000) (1 mg/mL) with 1 mM as H2O2 initial concentration; (B) Concentration of H2O2 released to dialysate from the mixture of RutinG-TiO2 NPs / PAA- TiO2 NPs (MW 5,000) and H2O2. Data represent the mean ± standard deviations from three replicates.
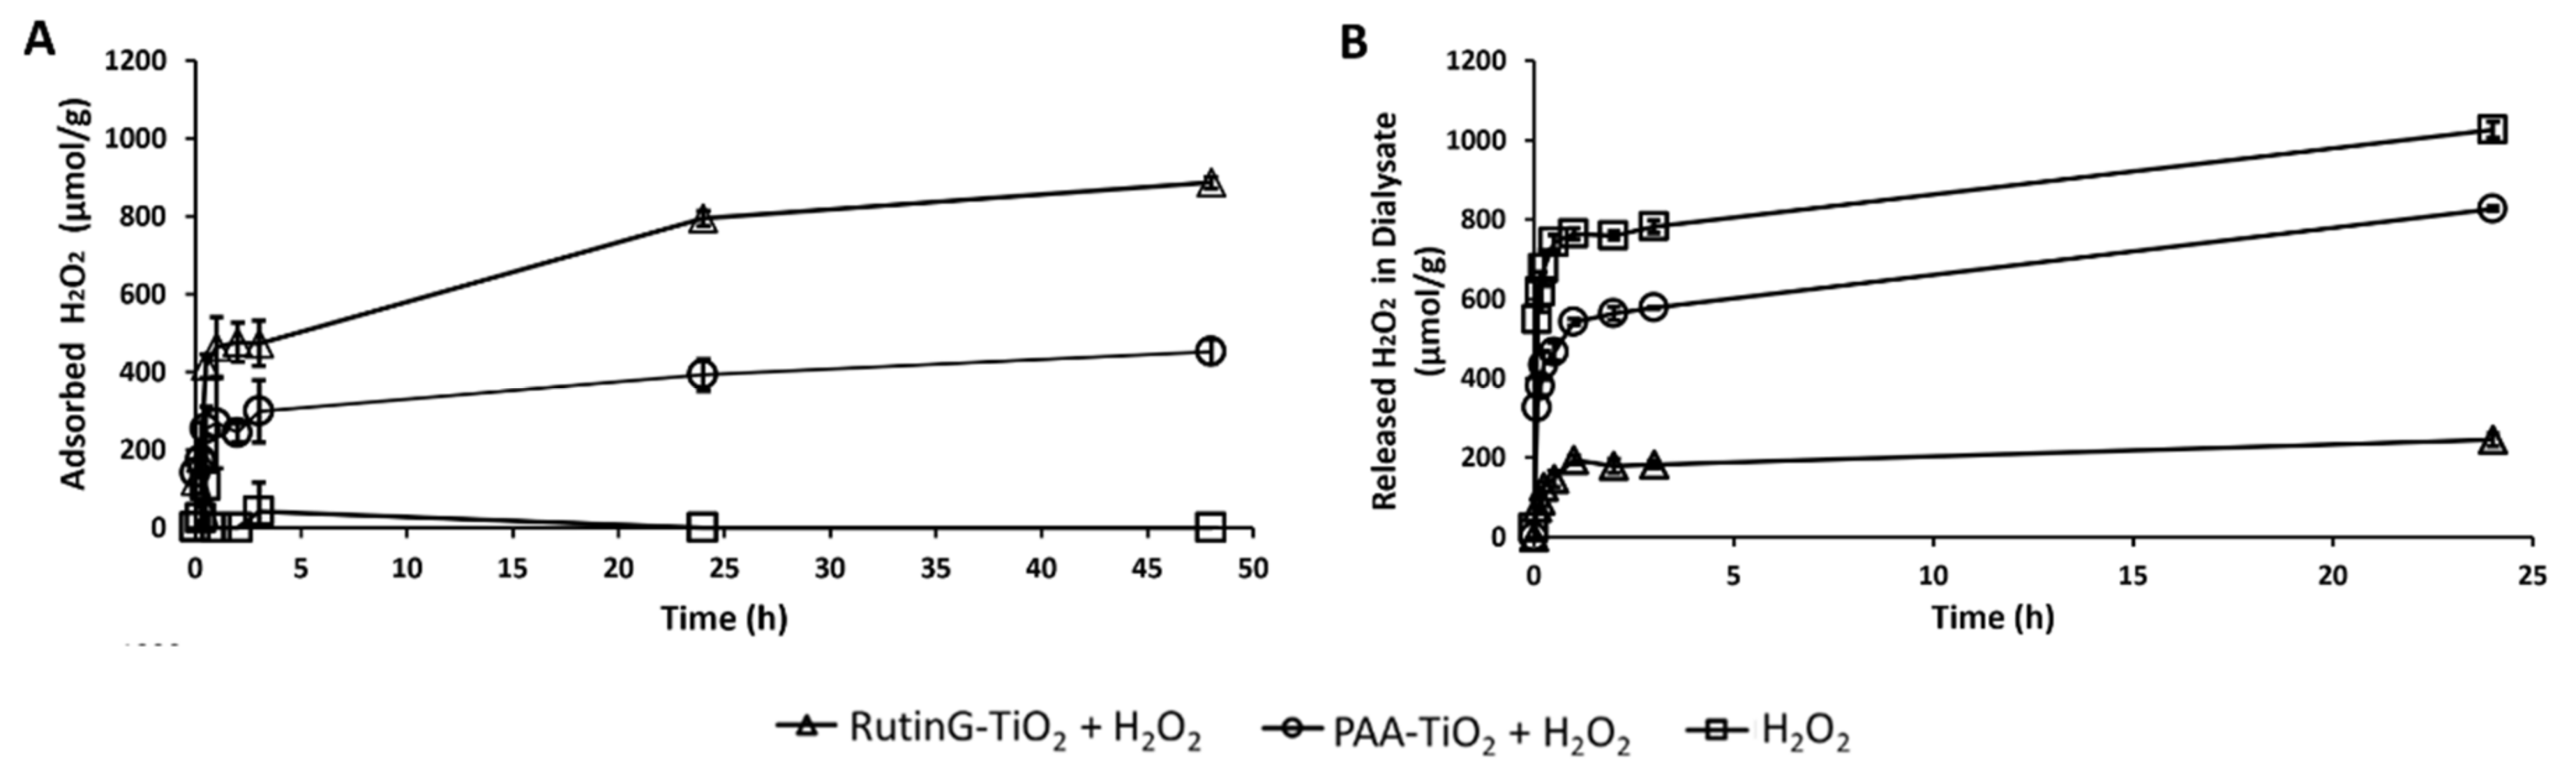
Figure 3.
Cytotoxicity effect of (A) RutinG-TiOx NPs and (B) PAA-TiOx NPs (MW 5,000) to MDA-MB-231 cells with incubation time of 1, 4, and 24 h. Data represent the mean ± standard deviations from three replicates.
Figure 3.
Cytotoxicity effect of (A) RutinG-TiOx NPs and (B) PAA-TiOx NPs (MW 5,000) to MDA-MB-231 cells with incubation time of 1, 4, and 24 h. Data represent the mean ± standard deviations from three replicates.
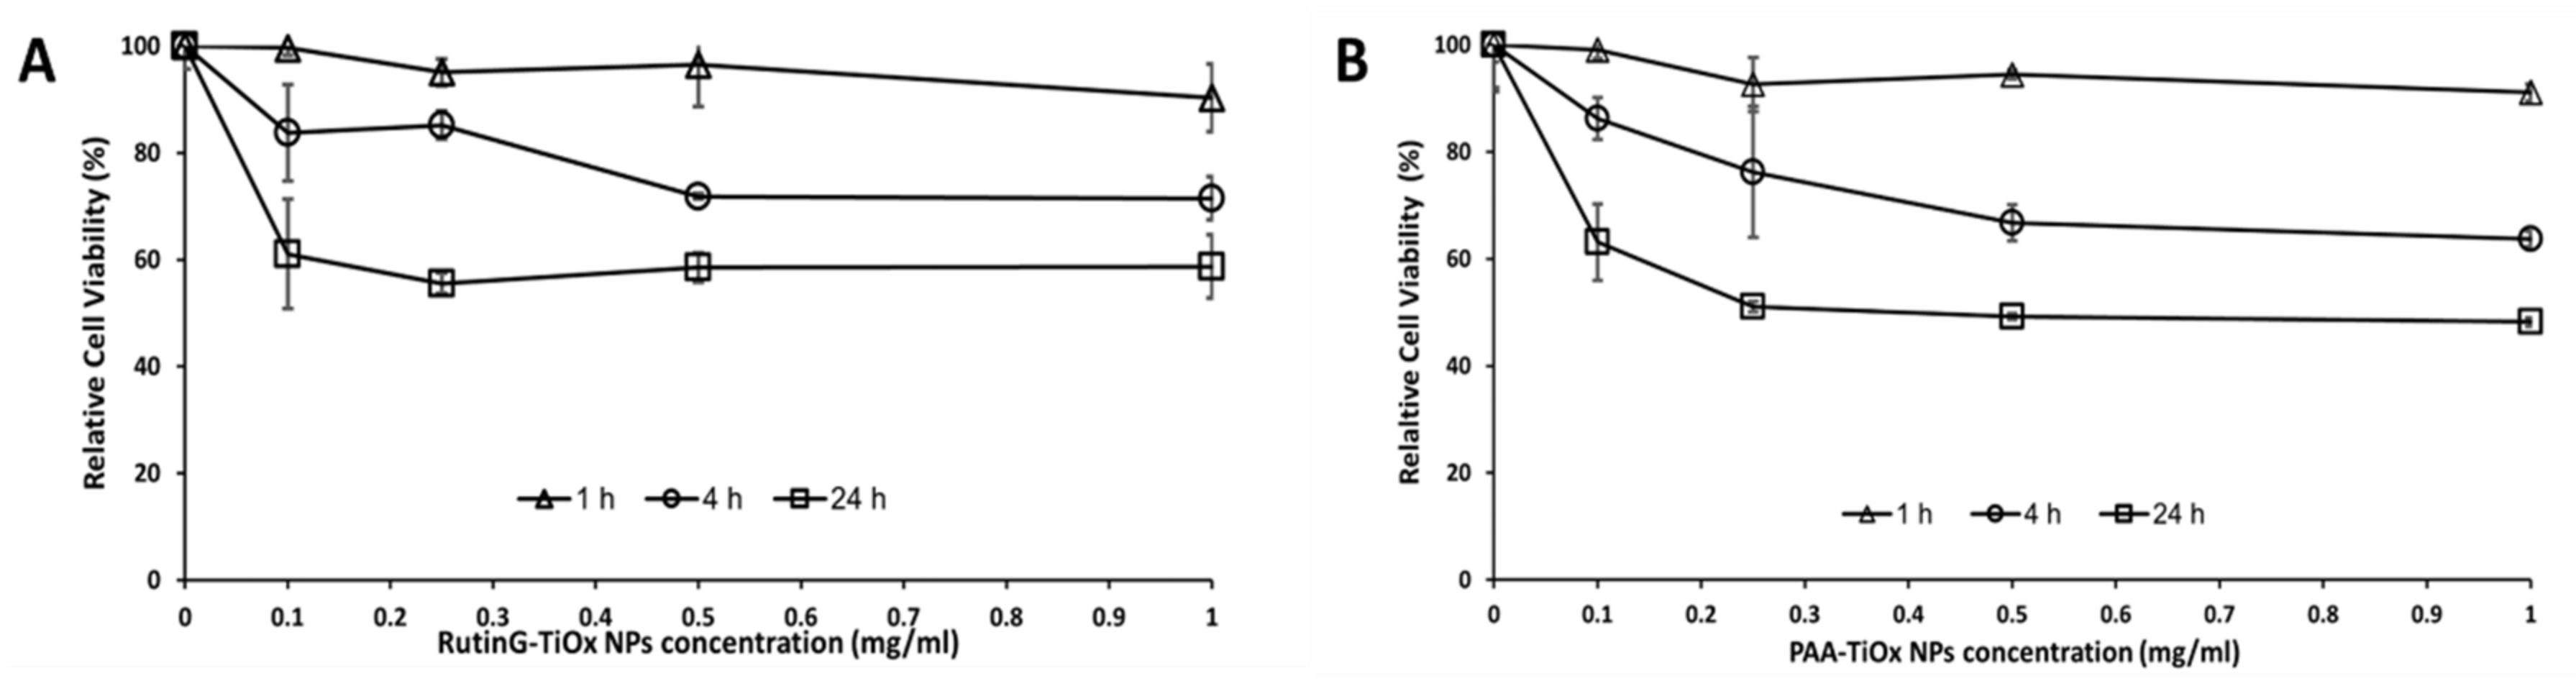
Figure 4.
Titanium amount in cell lysate of MDA-MB-231 cells treated with PAA-TiOx NPs and RutinG-TiOx NPs. Data represent the mean ± standard deviations from three replicates, ** p ≤ 0.01.
Figure 4.
Titanium amount in cell lysate of MDA-MB-231 cells treated with PAA-TiOx NPs and RutinG-TiOx NPs. Data represent the mean ± standard deviations from three replicates, ** p ≤ 0.01.
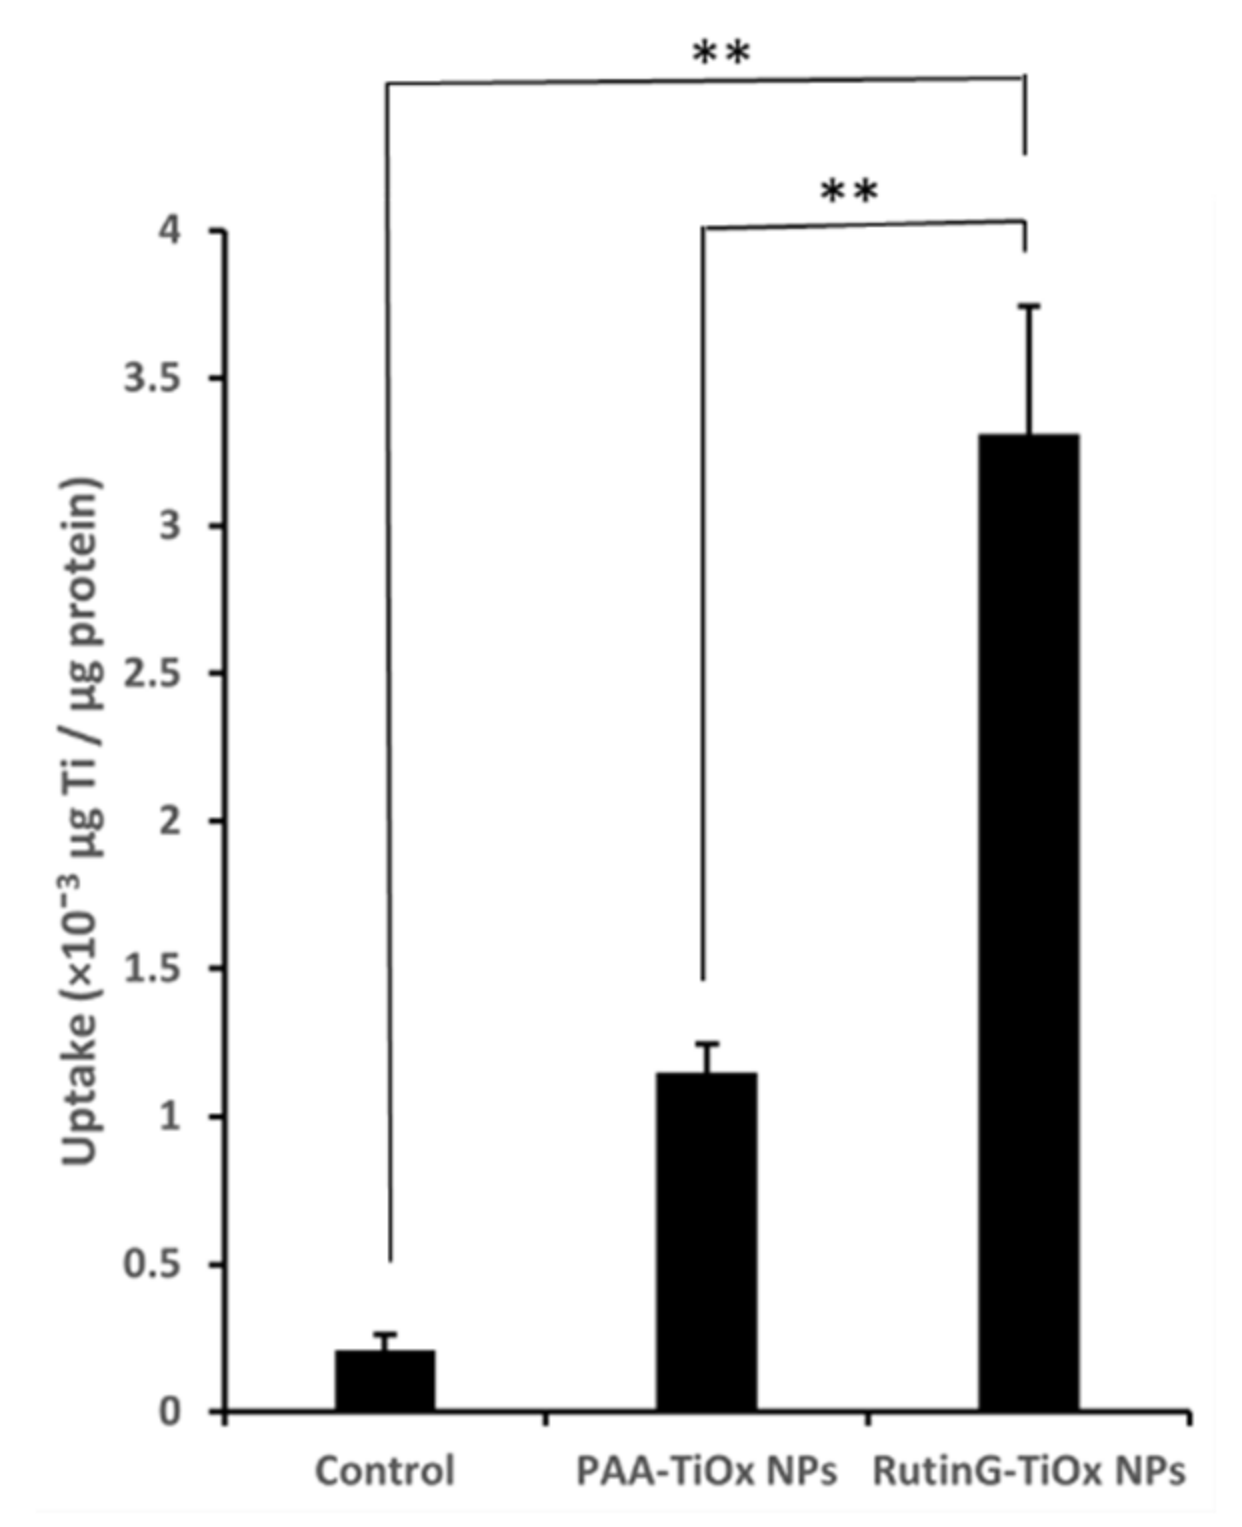
Figure 5.
(A) Survival fraction curve of MDA-MB-231 cells treated with NPs and X-ray radiation at 3 Gy and 5 Gy; (B) Survival fraction of the cells with RutinG-TiOx NPs treatment compared to PAA-TiOx NPs treatment in combination with X-ray radiation. Data represent the mean ± standard deviations from three replicates, * p ≤ 0.05, ** p ≤ 0.01.
Disclaimer/Publisher’s Note: The statements, opinions and data contained in all publications are solely those of the individual author(s) and contributor(s) and not of MDPI and/or the editor(s). MDPI and/or the editor(s) disclaim responsibility for any injury to people or property resulting from any ideas, methods, instructions or products referred to in the content. |
© 2025 by the authors. Licensee MDPI, Basel, Switzerland. This article is an open access article distributed under the terms and conditions of the Creative Commons Attribution (CC BY) license (http://creativecommons.org/licenses/by/4.0/).
Copyright: This open access article is published under a Creative Commons CC BY 4.0 license, which permit the free download, distribution, and reuse, provided that the author and preprint are cited in any reuse.


