
Submitted:
21 April 2025
Posted:
22 April 2025
You are already at the latest version
Abstract
This study aimed to design a new drug delivery system for long-term drug release for the treatment of various diseases. Bioactive glass preloaded with vancomycin (BG-V), synthesized without any thermal treatment, was designed to load higher percentages of the drug and release it slowly over time. In this study, BG-V was synthesized using a solution containing vancomycin to allow the glass to form around it. BG-V was then left to dry at room temperature to form a white powder with vancomycin trapped in the structure. The successful synthesis of BG-V was confirmed by X-ray diffraction, Fourier-transform infrared spectroscopy, scanning emission scanning microscopy, and nitrogen adsorption-desorption analysis. The results showed that BG-V was successfully developed using FTIR, showing vancomycin within the BG-V structure. After the drug release, BG-V shows great bioactivity as shown by XRD and bacterial studies.
Keywords:
bioactive glass
; vancomycin
; drug delivery
; release kinetics
; antimicrobial test
; sol gel synthesis
1. Introduction
Bioactive glass (BG) has emerged as a prominent biomaterial, gaining a lot of attention in the field of biomaterials due to its favourable characteristics including versatility, bioactivity, ease of synthesis, cost-effectiveness, and application in regenerative medicine and drug delivery [1]. BG can be synthesized through melt-quenching, sol-gel [2], flame synthesis [3] and microwave-assisted synthesis [4,5]. Each method results in BG with unique properties that can be used for different applications. Sol-gel BG has gained a lot of interest due to its higher porosity and increased surface area, which leads to improved bioactivity as the increased surface area allows for more rapid ion exchange with biological fluids and the formation of an apatite-like layer on its surface [6,7]. Specifically, the tertiary system of SiO2-CaO-P2O5 is one of the most widely utilized and studied BG systems due to its versatility and adaptability in various biomedical applications [8]. This versatility can be attributed to the inclusion of network formers, like SiO2 P2O5, which contribute to the structure of the glass and network modifiers such as CaO which enhance bioactivity and mechanical properties [9,10]. Typically, the synthesis of this system involves high thermal treatment to remove organics and nitrates [8]. However, recent studies have reported successful synthesis of bioactive glass without the need for thermal treatment [11,12]. This expands the uses and applications of bioactive glass to include pre-loaded drugs. This study will look at the ability of synthesizing BG-preloaded with antibiotics and to test its ability to deliver these drugs over a long time aimed to treat infections like biofilms that develop on prosthetics following prosthetic joint surgeries.
Biofilms are colonies of bacterial species that are protected by a self-produced polymeric matrix that can invade inert or living surfaces [13]. These colonies require prolonged antimicrobial exposure above the minimum inhibitory concentration (MIC). A drug delivery system that aims to treat these infections needs to load enough antibiotics to deliver them over at least a month with minimal burst release to not cause any toxicities locally at the infection site. BG can be designed to load antibiotics during synthesis to deliver them over an extended period as the matrix gradually degrades, making them ideal for the treatment of biofilm and biofilm-related infections. Vancomycin, a glycopeptide antibiotic, is often the antimicrobial of choice when treating these biofilm infections as it has proven to be effective in penetrating the biofilm matrix. Vancomycin acts by binding to cell precursors that are essential for the integrity of cell wall development, which is effective in killing bacterial cells [14]. The choice of antibiotics by surgeons trying to treat biofilms due to their familiarity and common use, the number of pathogens it can attack, its successful release from bone cement [15].
Vancomycin incorporation into BG has traditionally been achieved through post-synthesis depletion methods, with varying degrees of success. This approach involves immersing BG particles in drug solutions of different concentrations, with loading efficiency determined by UV-Vis spectroscopy measurements before and after immersion. Previous studies have demonstrated a wide range of loading efficiencies, heavily influenced by BG composition, synthesis methods, and templating techniques. Highly porous mesoporous bioactive glasses (MBGs) have shown antibiotic loading efficiencies ranging from 50-90%, with release durations spanning from a few hours to over 25 days [13]. Anand et al. reported loading efficiencies of approximately 40% for Ceftriaxone and sulbactam sodium in MBGs [16], while Xia et al. achieved 36-48% loading efficiency for gentamicin [17]. This study aims to enhance antimicrobial loading, specifically vancomycin, by incorporating the drug during the BG synthesis process. This approach is expected to promote stronger chemical interactions between vancomycin molecules and the BG matrix, potentially improving loading efficiency and releasing kinetics.
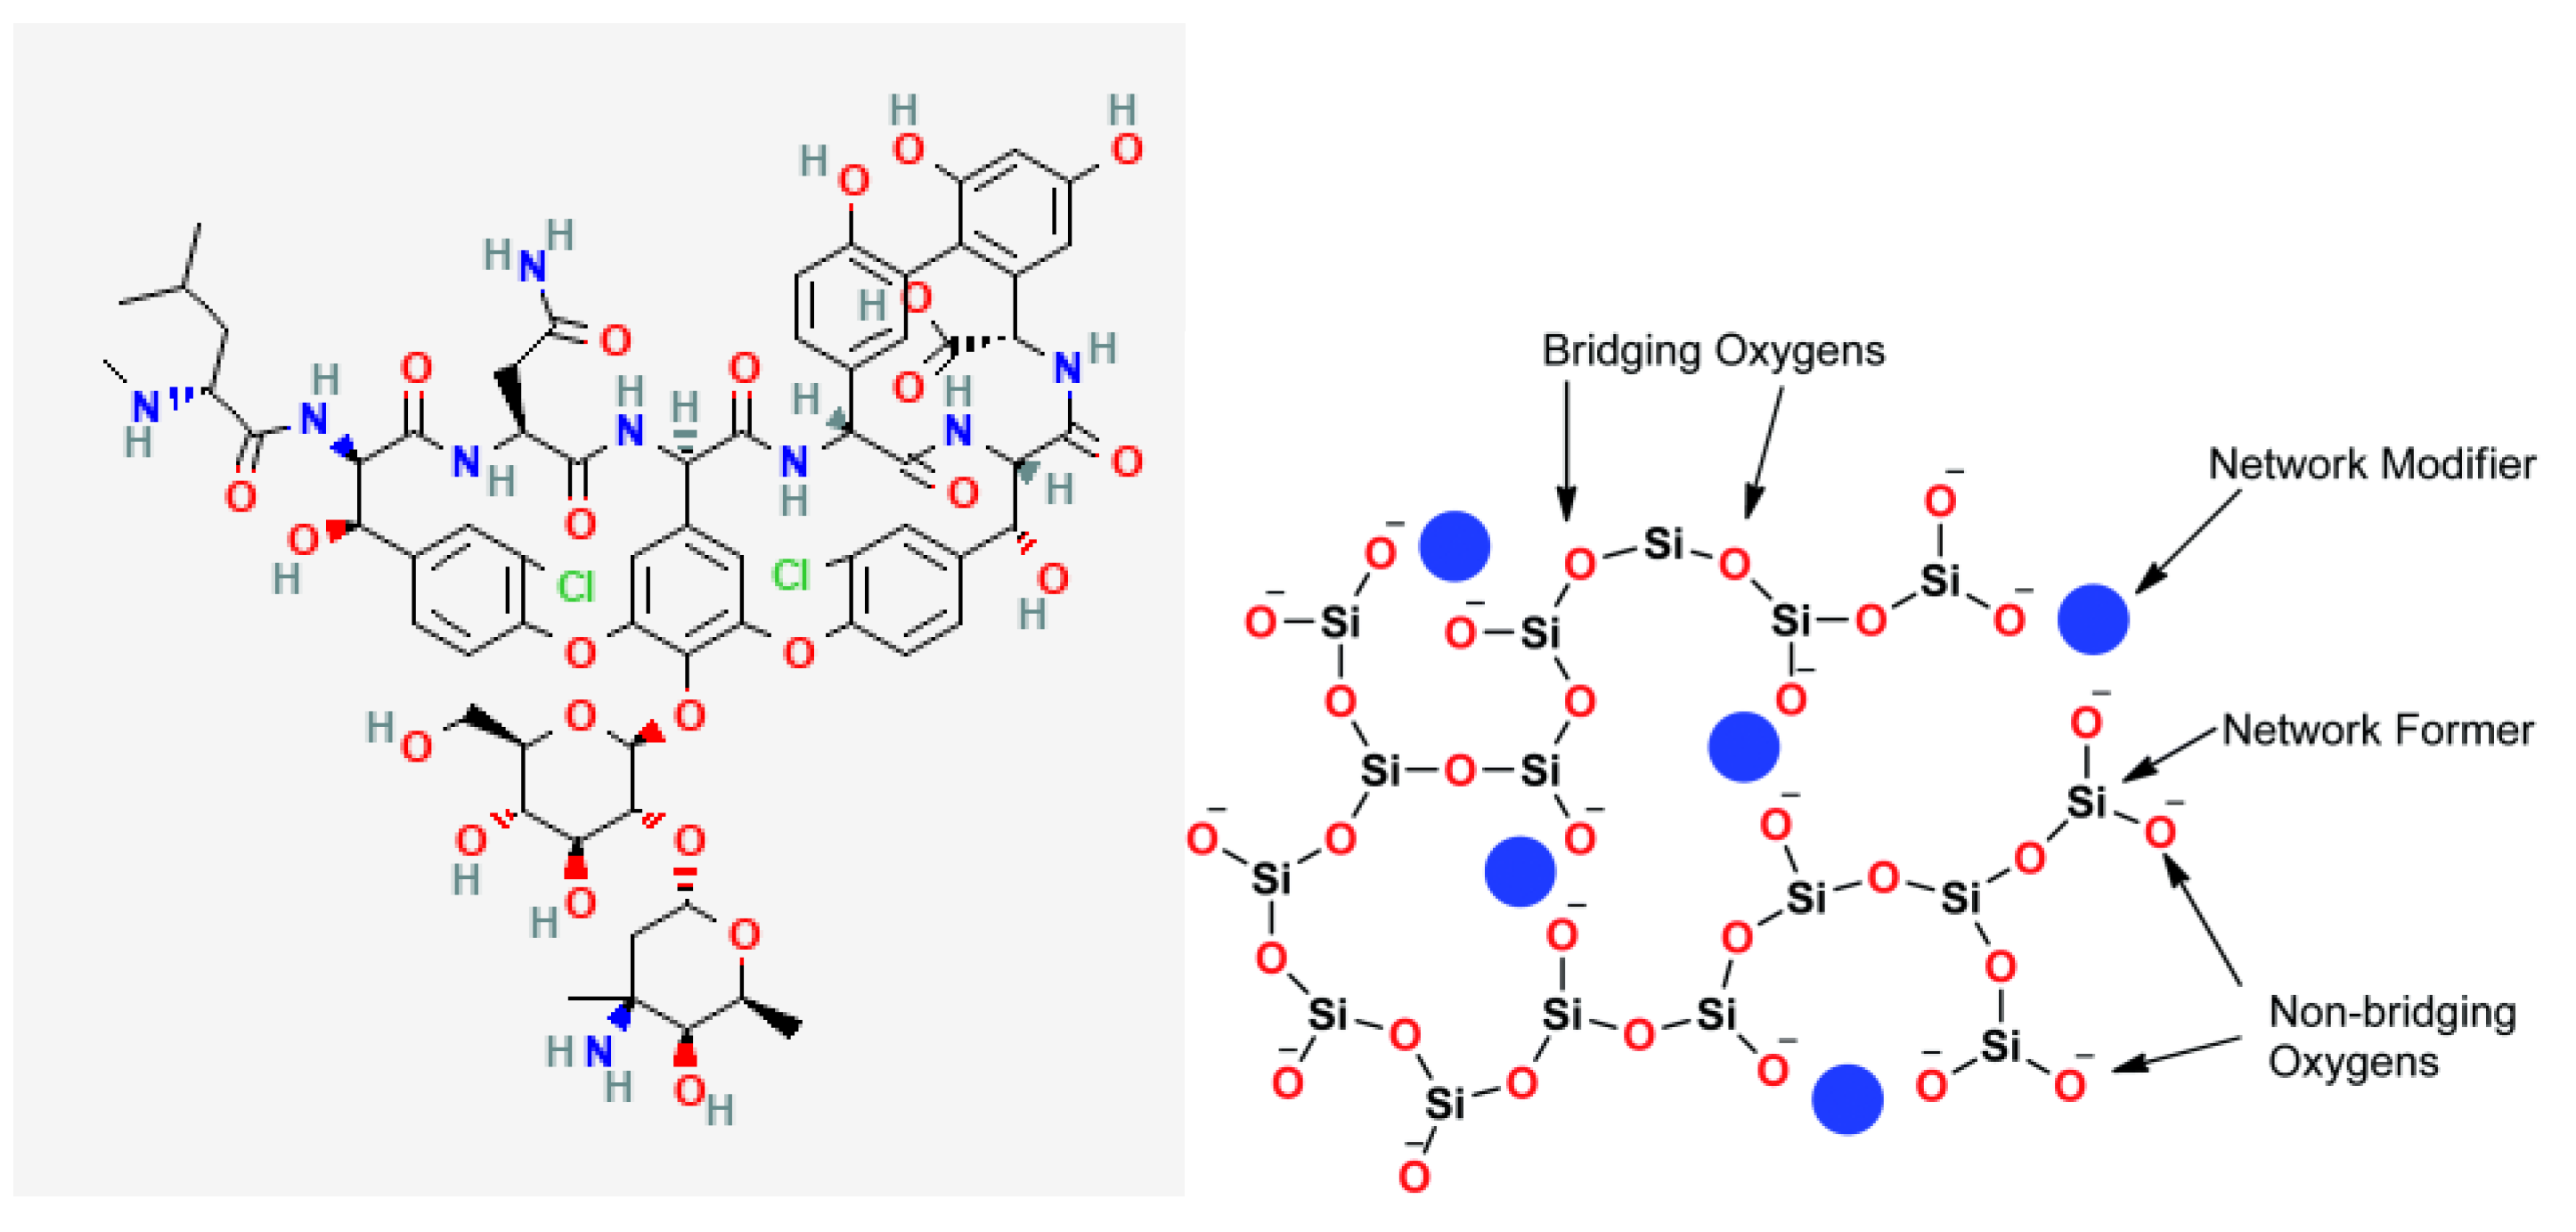
When BG is loaded with any drug, chemical bonds are expected to form between BG and the drug of choice based on their chemical structures. The interactions will strongly affect the encapsulation efficiency of the drug and subsequent release. For this study, vancomycin was chosen for the reasons previously stated. When BG is loaded with vancomycin there is a high potential of forming hydrogen bonds between the two. This is primarily due to the presence of multiple functional groups in vancomycin’s structure, such as amide, carboxyl, and hydroxyl groups [18], which can interact with the silanol groups (Si-OH) on the surface of the BG. These hydrogen bonds are stronger than simple physical adsorption forces, resulting in vancomycin being held more tightly within the BG matrix compared to surface adsorption alone.
Figure 1.
Structure of (a) Vancomycin molecule and (b) bioactive glass structure [19].
Figure 1.
Structure of (a) Vancomycin molecule and (b) bioactive glass structure [19].
This study aims to establish the ability of BG to load drugs during synthesis and its bioactivity and biocompatibility in vitro when it is synthesized without thermal treatment. BG is a versatile biomaterial that can be used in various applications including bone regeneration and drug delivery. BG properties such as porosity surface chemistry, and degradation rate are highly influenced by the synthesis method. These properties can be tailored differently based on the application, enabling customization and the creation of application-specific biomaterial.
2. Materials and Methods
2.1. Materials
Tetraorthosilicate (TEOS) is the silicon source, tetraethyl phosphate (TEP) as the phosphorous source and calcium nitrate tetrahydrate (CaN) as the calcium source. All synthesis occurred in Millipore ultrapure water. Phosphate-buffered saline (PBS) tablets (Sigma-Millipore) dissolved in deionized water were used for the drug release studies. Mount Sinai Hospital, Toronto, Canada generously gifted Vancomycin hydrochloride (sterile for IV injection, USP) used in the experiment. The materials were all purchased from Sigma-Millipore, Canada and were used without further purification or modifications.
2.2. Synthesis Procedure
A solution of ethanol, hydrochloric acid, and water (20 g) was prepared at room temperature, with a 10:5:1 ratio, to ensure hydrolysis and condensation control. Vancomycin was dissolved in a small amount of water and added to the solution to make different final concentrations of 2.5 mg/mL, 5 mg/mL, and 10 mg/mL. TEOS (6.7 g) was then added dropwise under continuous stirring, followed by a one-hour interval to allow hydrolysis. Calcium nitate tetrahydrate (1.4 g) was dissolved a small amount of water, was added next, and the solution was stirred for an additional hour. TEP (0.73 g) was then added dropwise, and the mixture was stirred overnight at 200 rpm to complete gelation. The resulting gel was then transferred to Petri dishes and dried at room temperature for 24–48 hours to avoid vancomycin degradation. Finally, the final powder was ground and sieved to ensure a uniform particle size.
2.3. Characterization of Samples
X-ray diffraction (XRD) and Fourier transfer infrared spectroscopy (FTIR) were used to determine the structure of the BG-Van after synthesis. A sample of the BG-Van was analyzed using MiniFlex 600 diffractometer (Rigaku Corporation, Japan) was used to collect X-Ray Dispersive patterns under Cu Kα radiation (40 kV, 15 mA) to determine crystallinity. Measurements were taken between 10°-60°C at an increment of 2°C. For FTIR, a Cary 630 spectrometer (Agilent, USA) was used to assess molecular vibrations using the KBr pellet method from 4500-400 cm-1 for the synthesized powder. Pore analysis including surface area, pore size and pore diameter were determined using the BET method which were done using a TriStar 3000 porosimeter (Micromeritics, USA). A sample of 0.1 g was used for analysis, with each sample degassed at 100 °C for 12 h to clear up the pores and allow for accurate measurements. Also, the surface of the powder was analyzed using SEM, JSM-6380LV (JEOL, Japan), where the samples were coated with gold to improve electronic conductivity. The same instrument was used to perform EDX analysis to investigate the elemental composition of the synthesized glass
2.4. Drug Release
10mg glass samples in 10 mL of phosphate buffer saline (PBS) in plastic tubes. The tubes were placed in a shaker at 37°C with continuous stirring for 600 h or until drug release reached 100% to mimic the physiological conditions. At 30-minute intervals and then 1-day intervals, 2 mL of the release medium was collected for analysis using UV-visible spectroscopy to quantify the amount of drug released. The removed volume was replenished with an equal volume of fresh PBS solution to maintain the drug concentration gradient driving the release.
BG-V drug release data were fitted to various mathematical models [20,21,22] and the goodness of fit was compared to determine the predominant release kinetics. The models applied in this study include:
Zero-order model: this model assumes a uniform drug release rate independent of concentration. It is calculated using the following equation:
where Ct is the amount of drug dissolved at time t, C0 is the initial amount of drug in solution, and k describes the zero-order rate constant.
First-order model: where the release rate is dependent on concentration in a linear manner. It is calculated using this equation:
Which can also be expressed as:
where C0 is the initial drug concentration and k describes the first-order rate constant.
Higuchi model, which describes drug release from matrix systems based on Fickian diffusion. It is calculated using the following equation:
where Q refers to the amount of drug released in time t. A is the unit area, C is the drug initial concentration, and the drug solubility is represented by Cs. D refers to the diffusivity of the drug [23].
The Higuchi Model can be simplified to describe drug release from matric and polymeric systems as follows:
where Mt/M¥ is the cumulative amount of drug released at time t, and k is the Higuchi constant.
Korsmeyer-Peppas: an empirical model combining diffusion and erosion effects. It is calculated using the following equation:
where Mt/M¥ is the cumulative amount of drug released at time t, k’ is the kinetic constant, and n is usually used to describe a specific diffusion mechanism. The exponent n is used to describe the diffusion mechanism of the system, where it represents Fickian diffusion if n = 0.5, non-Fickian transport if 0.45< n = 0.89. If n= 0.89 then it is zero order release (case II) transport. If n is higher than 0.89 then diffusion mechanism is Super case II transport [23].
2.5. In Vitro Disc Diffusion Test
The antibacterial activity of MBG samples was evaluated against Staphylococcus aureus (ATCC 25923) and Escherichia coli (ATCC 25922) using the disc diffusion method as described in the British Society for Antimicrobial Chemotherapy (BSAC) Disc Diffusion Method for Antimicrobial Susceptibility Testing, Version 4 (2005) [24]. Hinton Mueller agar plates were used as the testing medium. Bacterial strains (S. aureus and E. coli) were prepared by suspending them in a saline solution to achieve a suitable inoculum density. A volume of 50 µl of bacterial inoculum was evenly spread across the surface of the agar plates and allowed to dry for a few minutes to ensure proper adherence. Following the preparation of the plates, 50 µg of MBG sample was placed into wells on the agar plates. The plates were incubated at 37°C for 24 hours to allow for bacterial growth and interaction with BG-V. After the incubation period, the zone of inhibition (ZOI) surroundings was measured to determine the antibacterial efficacy
3. Results and Discussion
Figure 2 shows the FTIR of the as-synthesized BG-V (red), Vancomycin (black) and BG (blue). Vancomycin spectrum shows peaks at 424, 708, 1013, 1058, 1222, 1394, 1490, 1647, 2094, 2959 and 3265 cm-1 which signify the functional groups of vancomycin including the amide and hydroxyl stretch around 3265 cm-1, C=O stretching vibration from the amide bonds around 1647 cm-1 and C-N stretching and bending vibration peaks in the 1200-1500 cm-1 range [25]. The peaks observed at 2094 and 2959 cm-1 represent the R-NH-R and -CH2-CH3 functional groups, respectively. BG spectra peaks include 443, 790, 875, 1043 and 1468 cm-1, which signify the characteristics of silica, phosphate and carbonate peaks. The peaks observed at 790 and 1043 cm-1 represent Si-O-Si stretching and bending vibrations characteristic of the silicate glass, the peak observed at 875 represents the P-O bending vibration, and the peak at 1468 represents the carbonate group (CO3-2) [26]. BG-V spectra show peaks at 432, 797, 1036, 1341, 1416, 1640 and 3399 cm-1, which signify the characteristics of silica, phosphate and carbonate peaks similar to the BG spectra. Specifically, the peaks at 1036 and 797 cm-1 represent the Si-O-Si stretching and bending vibrations, characteristic of silicate glass structures. The broad peak at 3399 cm-1 suggests hydroxyl stretching with a shift of the peak for the BG-V, indicating interactions between the hydroxyl and amide groups. The higher intensity of the peaks observed at 1341, and 1416 cm-1 of the BG-V suggests the integration of vancomycin into the BG pores during synthesis. The peak at 1640 cm-1 suggests retained amide C=O stretching, indicating vancomycin’s integrity within the composite.
Figure 3 shows the XRD patterns of vancomycin and BG-V before and after drug release studies. The black amorphous pattern represents the glass before immersion in PBS for drug release, while the red pattern shows the crystalline phase after immersion in PBS. The blue patter shows the vancomycin spectrum which has an amorphous structure with a broad band that starts at ~10.2° and ends around ~38.8°which was also observed in other studies [27]. The black pattern shows the amorphous BG-V structure with a broad band ~10° and ~35° that is characteristic of bioactive glass before immersion in PBS [28]. The integration of vancomycin can be observed through the higher intensity of BG-V pattern as the two broad peaks overlap as observed in Figure 3 (b), which compares the XRD pattern of BG without vancomycin and BG-V. Figure 3 (b) shows BG-V which has a broad amorphous peak with an intensity going up to 1127 a.u. while the BG without vancomycin had the highest intensity at 680 a.u the intensities were measured starting at the same intensity of 0 a.u. but the figure shows both spectra to clarify differences between the spectra.
Figure 3 (a) also shows the XRD pattern of BG-V after the drug release (red) which revealed distinct crystalline structures formed on the BG after immersion, signifying the formation of hydroxyapatite (HA) and indicating the degradation of the glass as it releases vancomycin. The development of HA on the surface of BG-V is confirmed by the presence of the following diffraction peaks at θ =25.9°, 31.6°, 32.2°, 32.7°, 39.7° corresponding to the (002), (211) and (310) reflections of the HCA crystals [29].
Hydroxyapatite (HA) is the mineral component of bone and based on the International Centre for Diffraction Data (ICDF) 09-0432, when detected through XRD different peaks will appear at 25.87°, 31.77°, 32.19°, 32.9° and 39.81° representing the (h,k,l) diffraction planes (002), (211), (300) and (310) respectively. Additionally, peaks appearing at θ 45.3°, 46.5°,49.4°, 53.2° which represent the (203), (222), (213) and (004), (422) respectively [22]. After drug release in PBS, BG-V shows incredible bioactivity indicating that the glass is biodegrading as it releases the loaded vancomycin in vitro. The deposition of HA on BG-V emphasizes its suitability for bone regeneration and antimicrobial applications, demonstrating its dual function of enhancing bone integration while mitigating bacteria.
The nitrogen adsorption-desorption graph shown in Figure 4 represents the BG-V before drug release (black). It is observed that the graph shows type IV isotherm with no hysteresis, indicating that there is a lower surface area as the pores are blocked by adsorption of vancomycin onto the BG. The second graph in red shows that after the drug is released, the isotherm observed is type IV with hysteresis indicating a vertically oriented horn-shaped pore [30]. This shows that following drug release the pores of BG-V open up, and the surface area increases, this aids in the gradual release of the vancomycin from the BG as it allows it to release the physically adsorbed drug followed by drug entrapped inside that is being held by hydrogen bonds. The development of hydroxyapatite on the surface of BG also contributes to the increase in the surface area as the silanol layer (Si-OH) is being converted into HA.
Table 1 presents the data obtained from BET analysis, including surface area, pore volume, and pore size. Measurements were taken both before and after the drug release test to evaluate changes over time. A significant increase in surface area is observed from before drug release and after. On day 0, the surface area was measured at 20.23 m²/g, which increased to 156.64 m²/g after drug release, suggesting pore opening and drug release. This increase may also indicate the formation of HA on the surface or pore widening due to the biodegradation of BG-V when immersed in PBS.
The results further reveal changes in pore volume. At day 0, the pore volume was recorded at approximately 0.128 cm³/g, increasing to 0.613 cm³/g following the drug release study. This suggests that the release of the drug from the pores contributed to pore expansion, allowing more gas to adsorb on the surface during the second BET analysis.
Pore size measurements, recorded in nanometers, show a shift from 23.27 nm before drug release to 15.05 nm after drug release. This reduction may result from the deposition of HA on the surface, leading to the formation of numerous smaller pores. The reprecipitation of material on the glass surface could explain the simultaneous increase in surface area and decrease in average pore size.
Figure 5 shows the SEM images of the as-synthesized BG-V before and after drug release studies. The first image (a) shows a smooth and dense surface at day 0, while the second image (b) shows the crystallization of the apatite layer on the surface of the BG. Figure 4 (b) shows an increase in porosity which can be attributed to the degradation of BG as well as the release of the preloaded vancomycin.
Figure 6 shows the SEM-EDS, which also confirms the development of HA on the surface of BG-V as a spectrum of atom weight percentage of Si, Ca and P went from 49.3%, 45% and 10% respectively to 28.5%, 26.5% and 17.5% after the drug release test was done in around 30 days. The ratio of Ca/P was observed to be 1.51 after immersion in PBS, the same ratio reported in other studies indicating the crystallization of apatite on the surface of the BG. The formation of a Ca/P ratio around 1.5 is particularly significant as it closely resembles the stoichiometric ratio found in natural bone minerals, suggesting that the bioactive glass has effectively facilitated the biomimetic mineralization process [31,32]. Furthermore, the SEM-EDS analysis revealed the presence of a newly formed crystalline layer on the surface of the BG-V after immersion in PBS, which indicates the bioactive glass’s capability to promote the deposition of HA. This is consistent with the XRD findings as it shows the crystalline layer that developed on the surface of BG-V after immersion in PBS and provides evidence for the ability of this material to deliver drugs and repair bone defects.
Figure 7 (a) shows the drug release observed on day 1, demonstrating a rapid initial release where approximately 20% of the vancomycin was released within the first few hours. This is followed by a plateau phase, indicating that the initial burst corresponds to the release of drug molecules adsorbed on the surface, which occurs within 4 to 5 hours.
Figure 7 (b) illustrates the cumulative vancomycin release over 23 days. While the initial phase mirrors the burst release as seen in Figure 5 (a), the long-term profile reveals a more gradual and sustained release pattern. The near-linear progression of drug release beyond the first day suggests a controlled diffusion mechanism or gradual degradation of the bioactive glass matrix, facilitating continuous drug delivery. This extended-release profile is advantageous for maintaining therapeutic levels of vancomycin over extended periods, reducing the need for frequent dosing and enhancing the material’s suitability for applications in infection prevention and bone regeneration.
The data highlights the biphasic nature of drug release, where an initial rapid phase addresses acute therapeutic needs, followed by a sustained release phase that supports prolonged treatment efficacy. This release behaviour is characteristic of bioactive glass systems designed for localized drug delivery, reinforcing their potential in clinical applications.
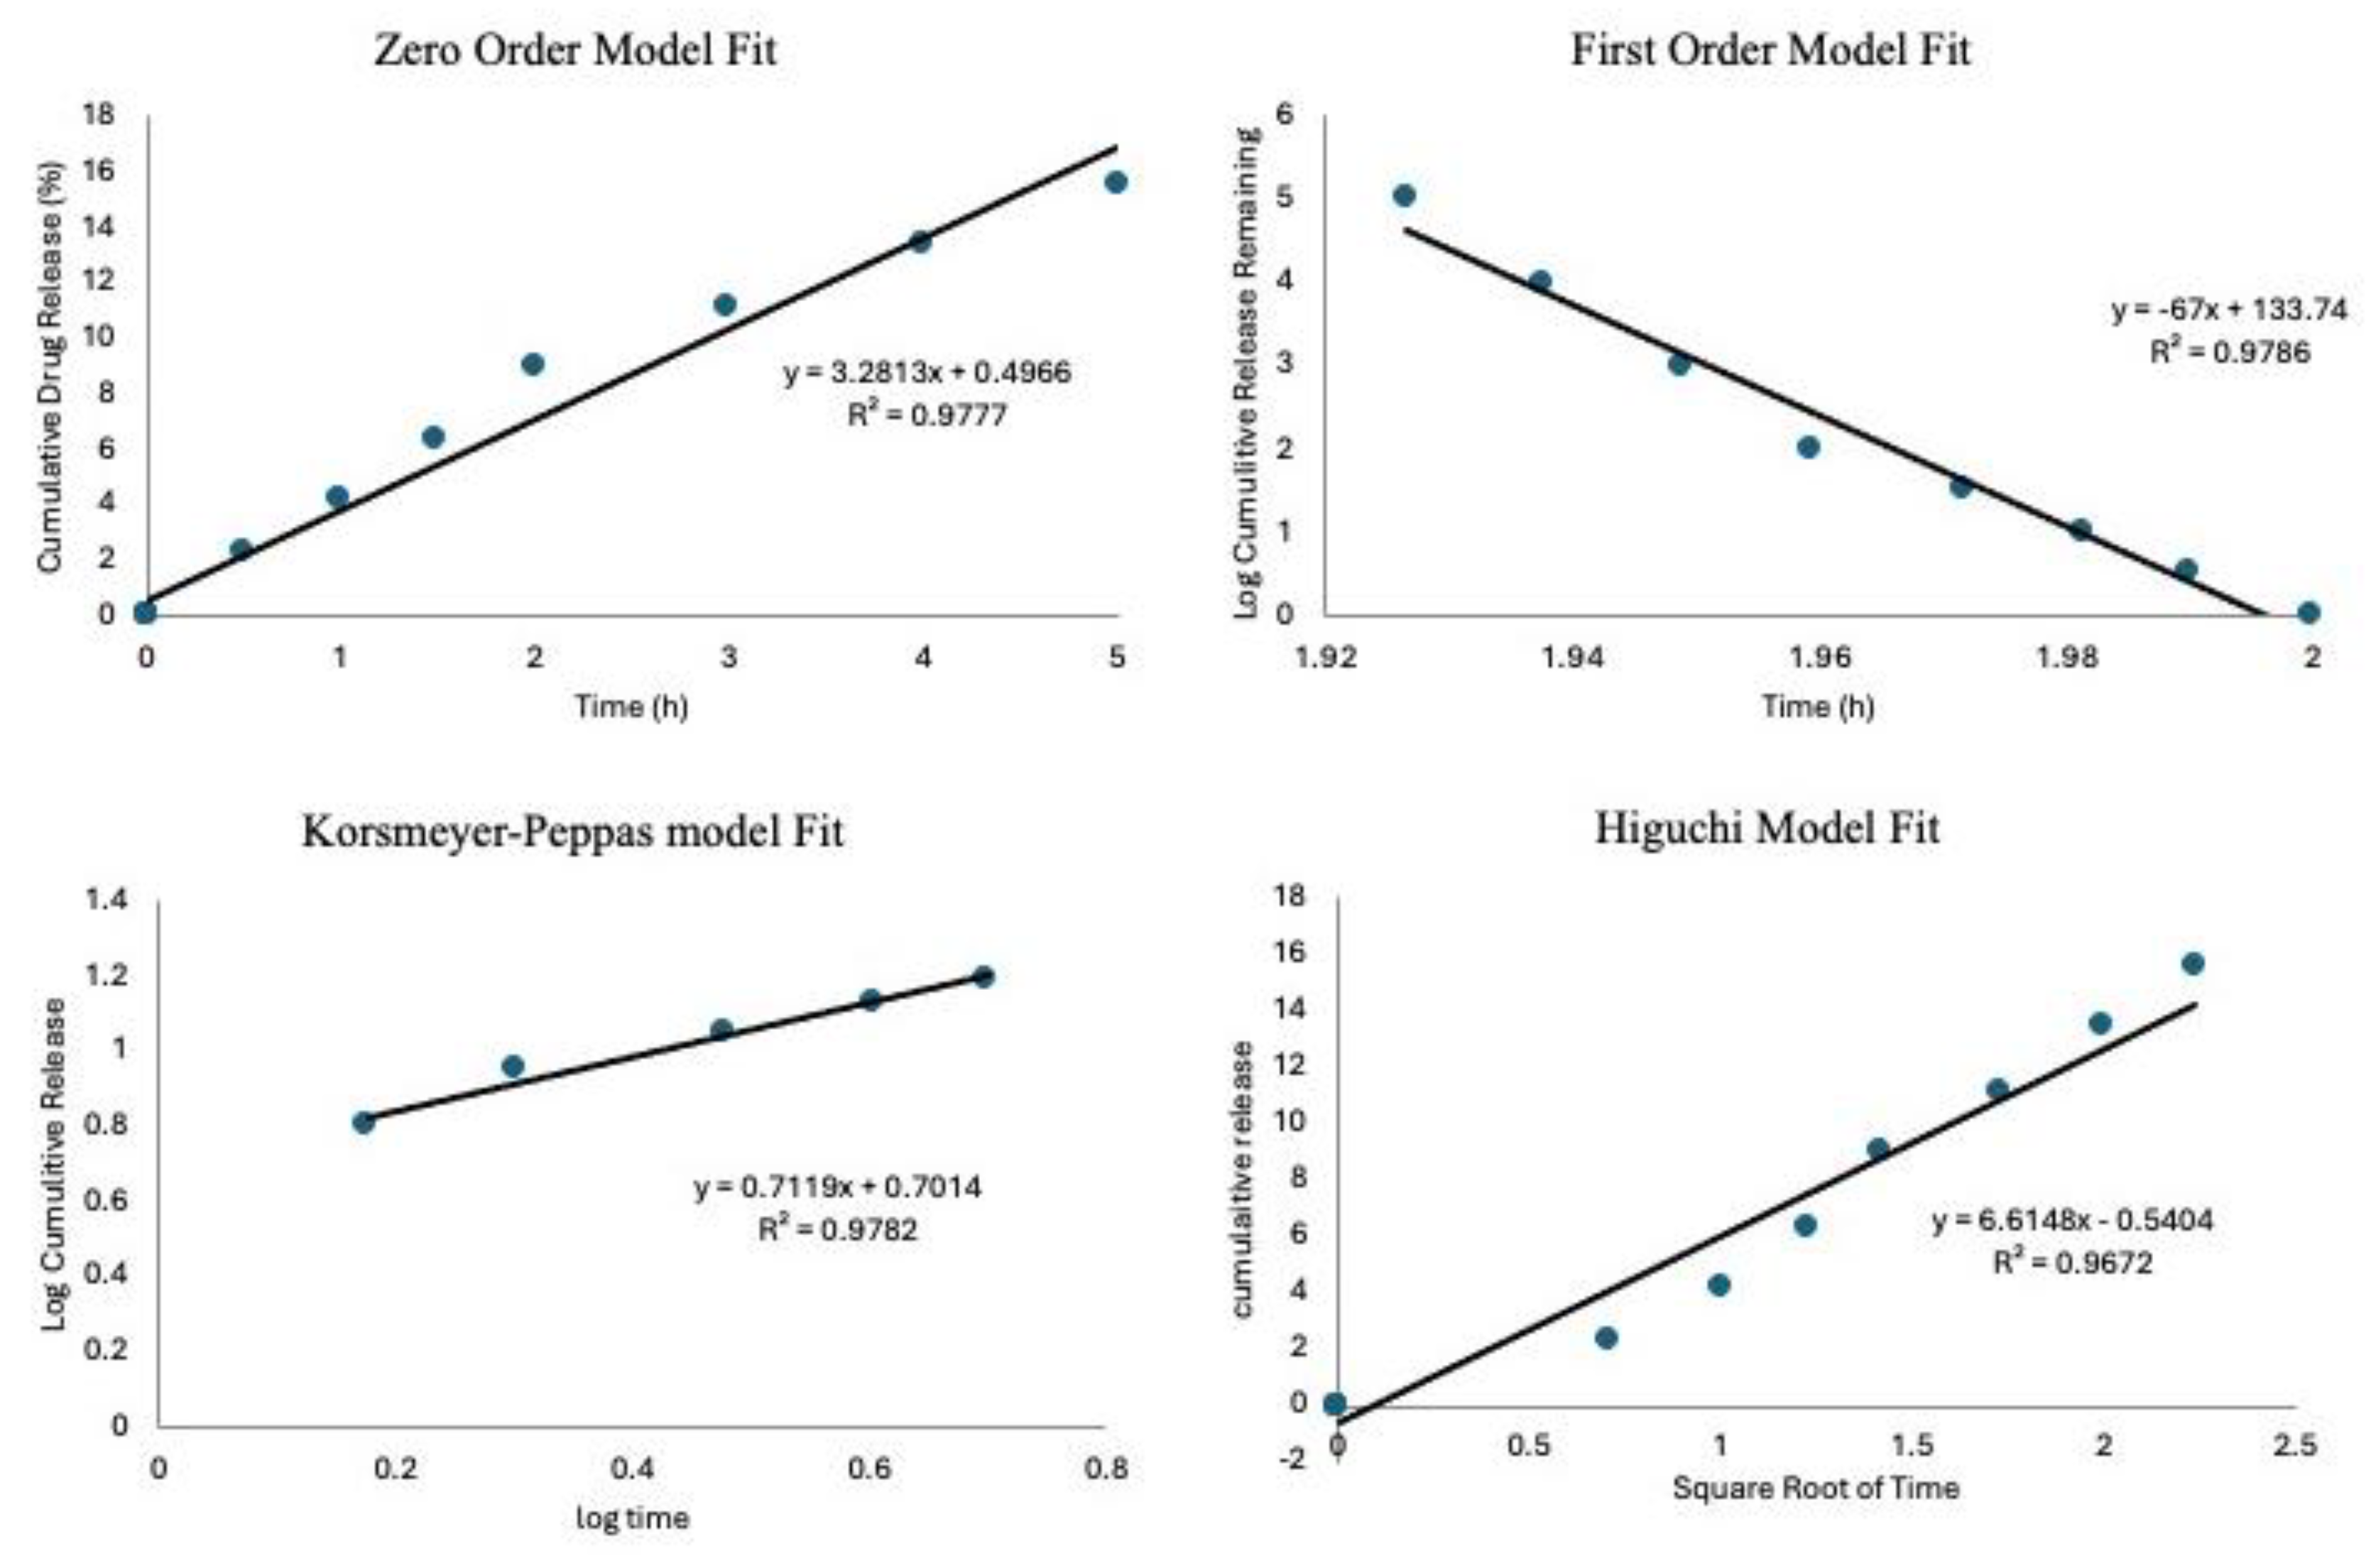
The drug release data were analyzed using kinetic models to describe the release mechanisms; this was done following previous studies [35,36]. To assess which model best fits the experimental data, the coefficient of determination (R2) was calculated for each model. The results show an R2 value of 0.977 for the Zero-Order model, while the First-Order model gave a negative R2 of 0.978. The Higuchi and Korsmeyer-Peppas models had R2 values of 0.967 and 0.978, respectively. The Korsmeyer-Peppas model had the highest R2 value, suggesting that drug release is governed by a combination of diffusion and matrix erosion, which are characteristic of anomalous transport. The Korsmeyer-Peppas model is usually applied to describe drug release from porous materials, where the release mechanism does not follow simple diffusion [37]. An important parameter in this model is the release exponent n, which provides insight into the drug release mechanism. In this study, the calculated n-value was 0.7119, indicating anomalous (non-Fickian) transport. This result implies that drug release is controlled by a combination of diffusion through the matrix and gradual erosion of the delivery system, aligning with findings from previous research on bioactive glass and polymeric drug delivery systems [38].
Figure 8.
The drug release kinetics models to show goodness of fit for the zero-order model, first-order mode, Korsmeyer-Peppas mode and Higuchi model.
Figure 8.
The drug release kinetics models to show goodness of fit for the zero-order model, first-order mode, Korsmeyer-Peppas mode and Higuchi model.
Biofilm infections require consistent and high concentration when detected on prosthetics because of their extracellular matrix, which impairs drug penetration. Given that the minimum inhibitory concentration (MIC) for S. aureus ranges from 2-16 μg/mL [33], biofilm infections require higher concentration and exposure for a longer time, BG-V needs to maintain a much higher concentration for a long period to achieve complete eradication of biofilms. In this study, BG-V was able to maintain an average of around 229.5 μg/mL daily in vitro which is below the toxic levels identified by Drouet et al. (2015) where they found a significant increase in human umbilical vein endothelial cell death from vancomycin concentrations of 2.5 mg/ml [34]. By maintaining this level of drug release, BG-V ensures the complete elimination of biofilms while simultaneously dissolving to rebuild bone damaged by the infection.
Antimicrobial susceptibility testing was conducted using the disc diffusion method. Sterilized BG-V samples were placed in wells within the agar to evaluate their antibacterial activity. The experiment was performed in triplicate to ensure the accuracy and reproducibility of the results. The plates were incubated at 37 °C for 24 hours, after which the zones of inhibition (ZOI) were measured [39]. The disc diffusion test against S. aureus on Mueller Hinton agar revealed a ZOI of 27 ± 0.2 mm, indicating a strong antibacterial effect. Similarly, the test against E. coli showed a ZOI of 35 ± 0.4 mm, demonstrating a strong antibacterial effect against this gram-negative bacterium. The well-defined circular shape of the ZOI reflects consistent diffusion of vancomycin from the BG-V, suggesting homogeneity in drug loading and release from the BG-V matrix.
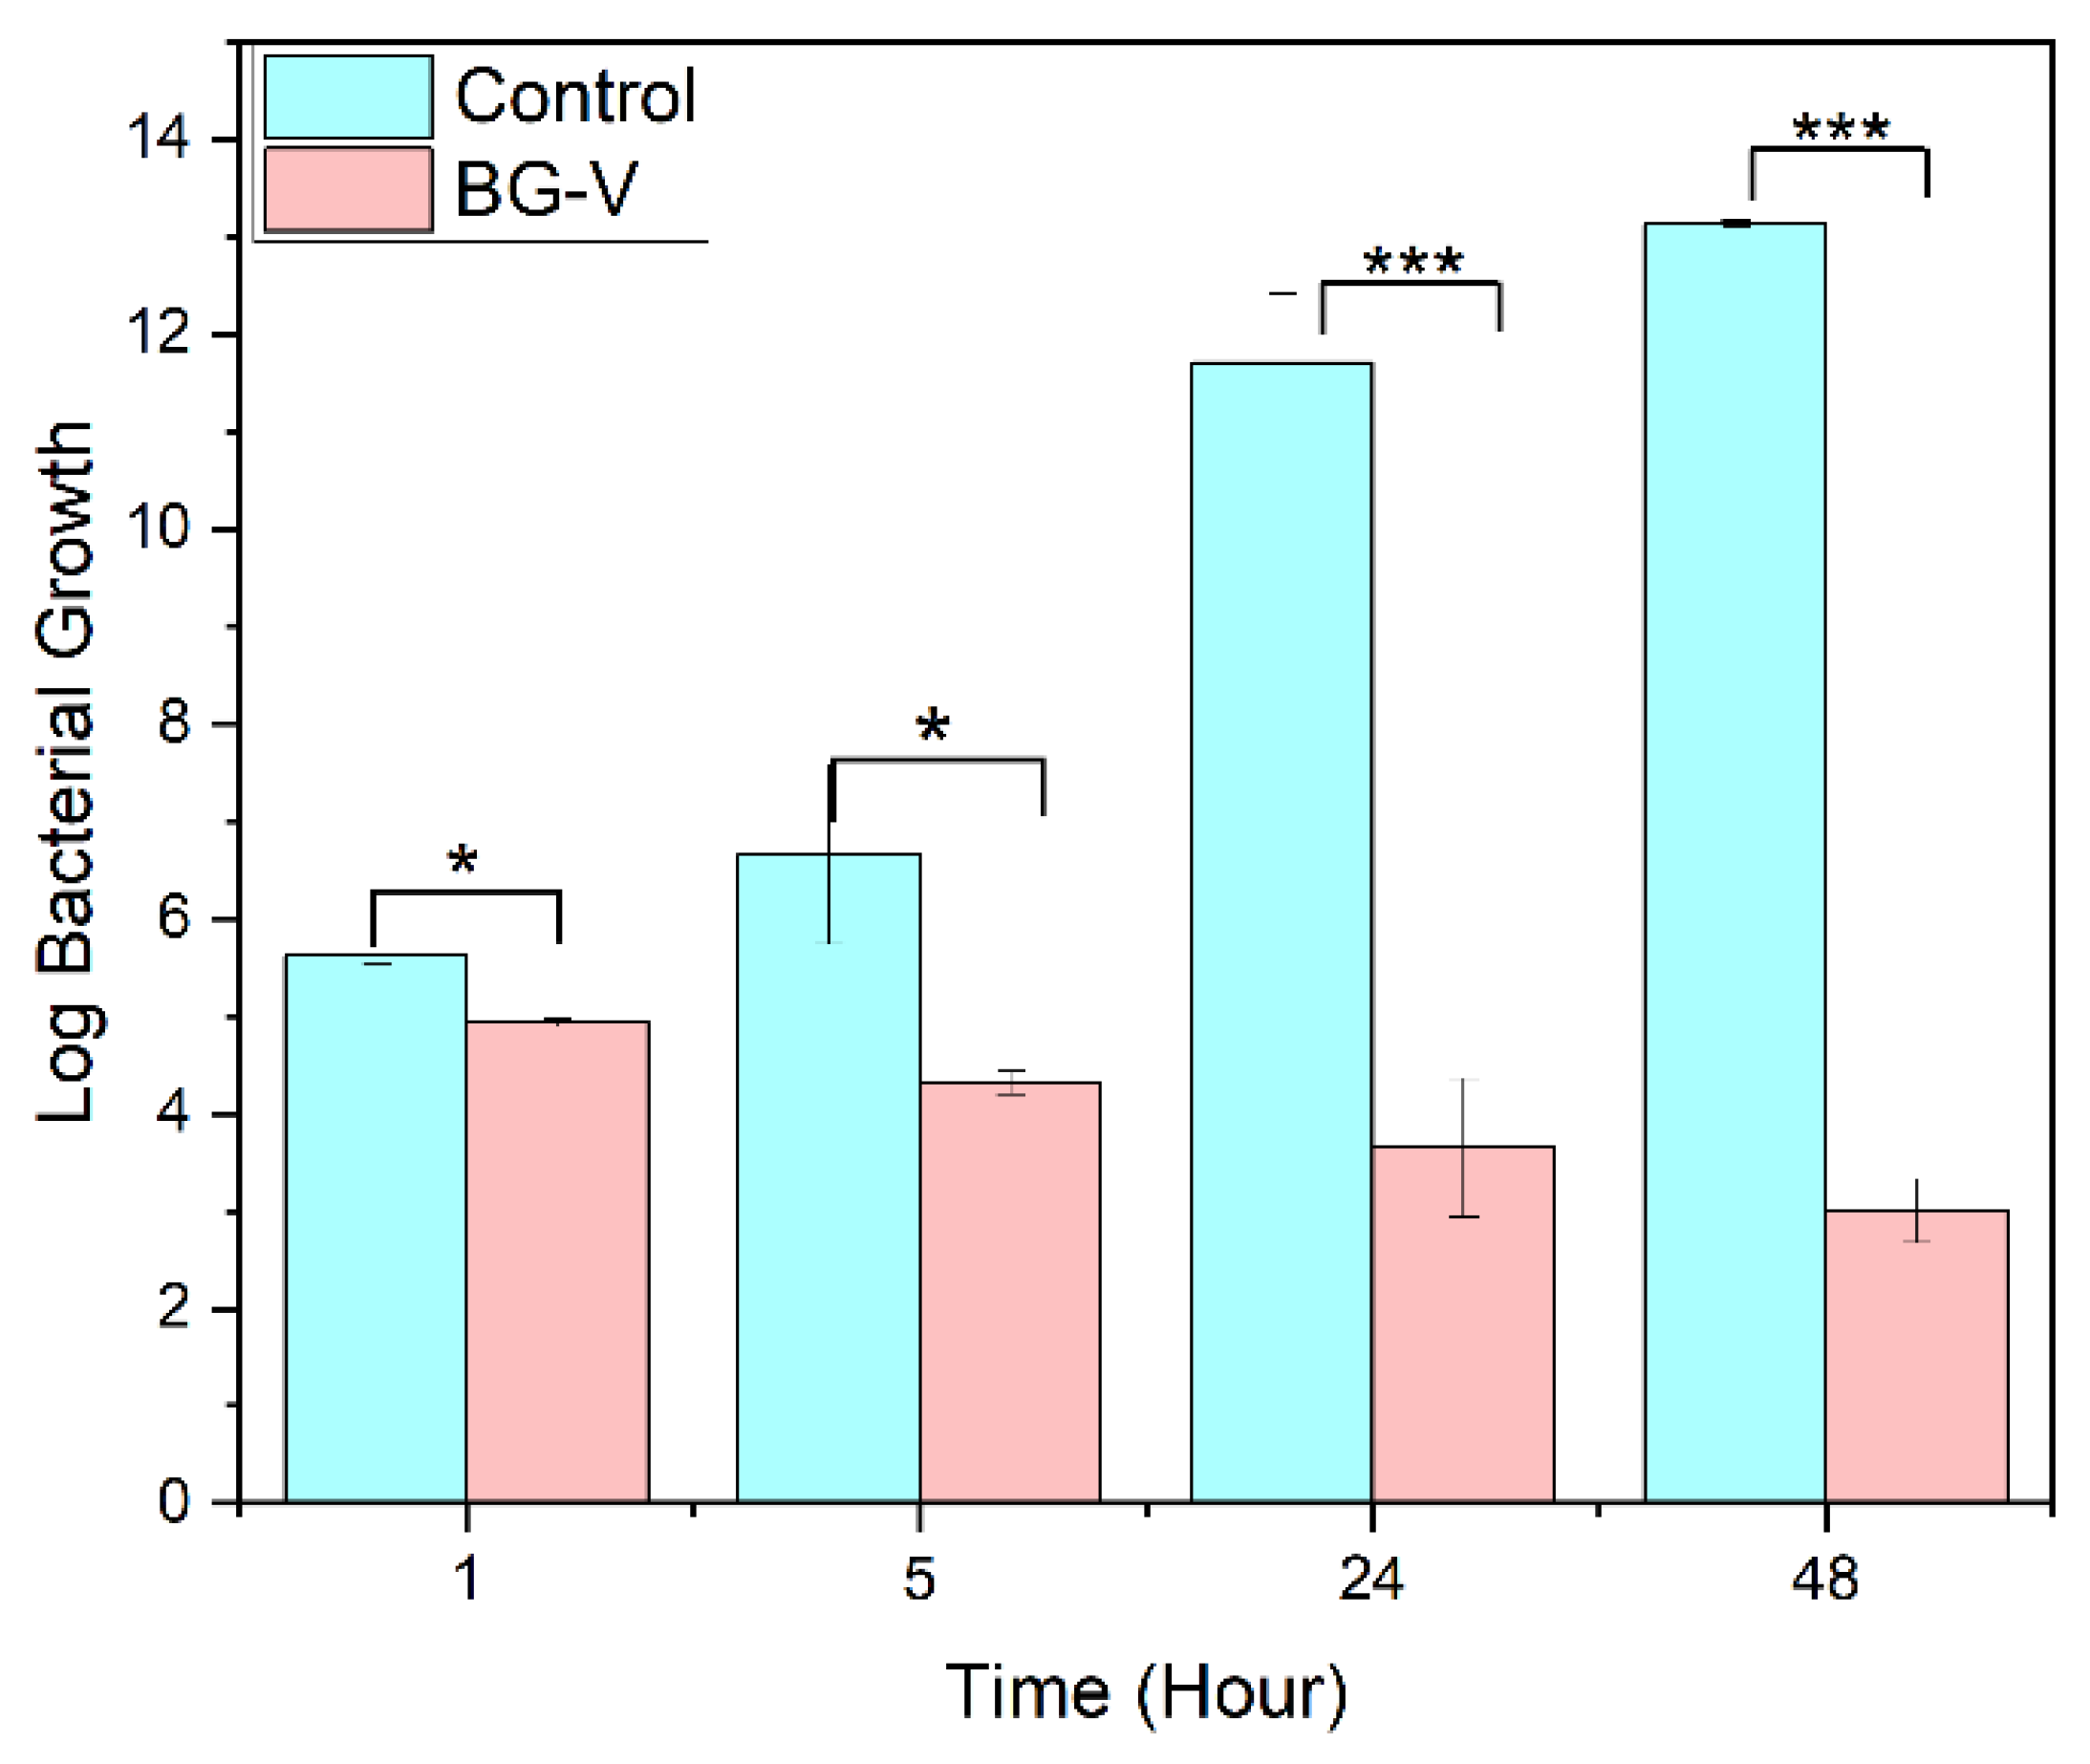
Figure 9 shows the antibacterial efficacy of BG-V was evaluated against S. aureus using a time-dependent bacterial killing assay. A bacterial culture of S. aureus (10⁶ CFU/mL) was treated with BG-V, and samples were withdrawn at 1h, 5h, 24h, and 48h for plating. The results show a significant reduction in colony counts for BG-V compared to the control. At 24 hours, BG-V showed 1,400 colonies, compared to 5 trillion in control. By 48 hours, BG-V exhibited lower colony counts even lower colony count, showing the effectiveness of BG-V in bacteria killing. The means of BG-V and control were tested for significant differences between the two groups, t-test shows that after 1 hour there is no significant difference between the two. After 5, 24 and 48 hours there was a log reduction of 3.73, 9.55, and 10.176 respectively, meaning that there is a significant reduction in bacterial growth with the application of BG-V. This time-dependent antibacterial activity highlights the potential of vancomycin-loaded MBGs for localized antibiotic delivery in biomedical applications.
Figure 9.
Disc diffusion of BG-V against S. aurues. It has a zone of inhibition of 2.7± 0.2 cm and E.coli with a ZOI of 3.5± 0.4 .
Figure 9.
Disc diffusion of BG-V against S. aurues. It has a zone of inhibition of 2.7± 0.2 cm and E.coli with a ZOI of 3.5± 0.4 .
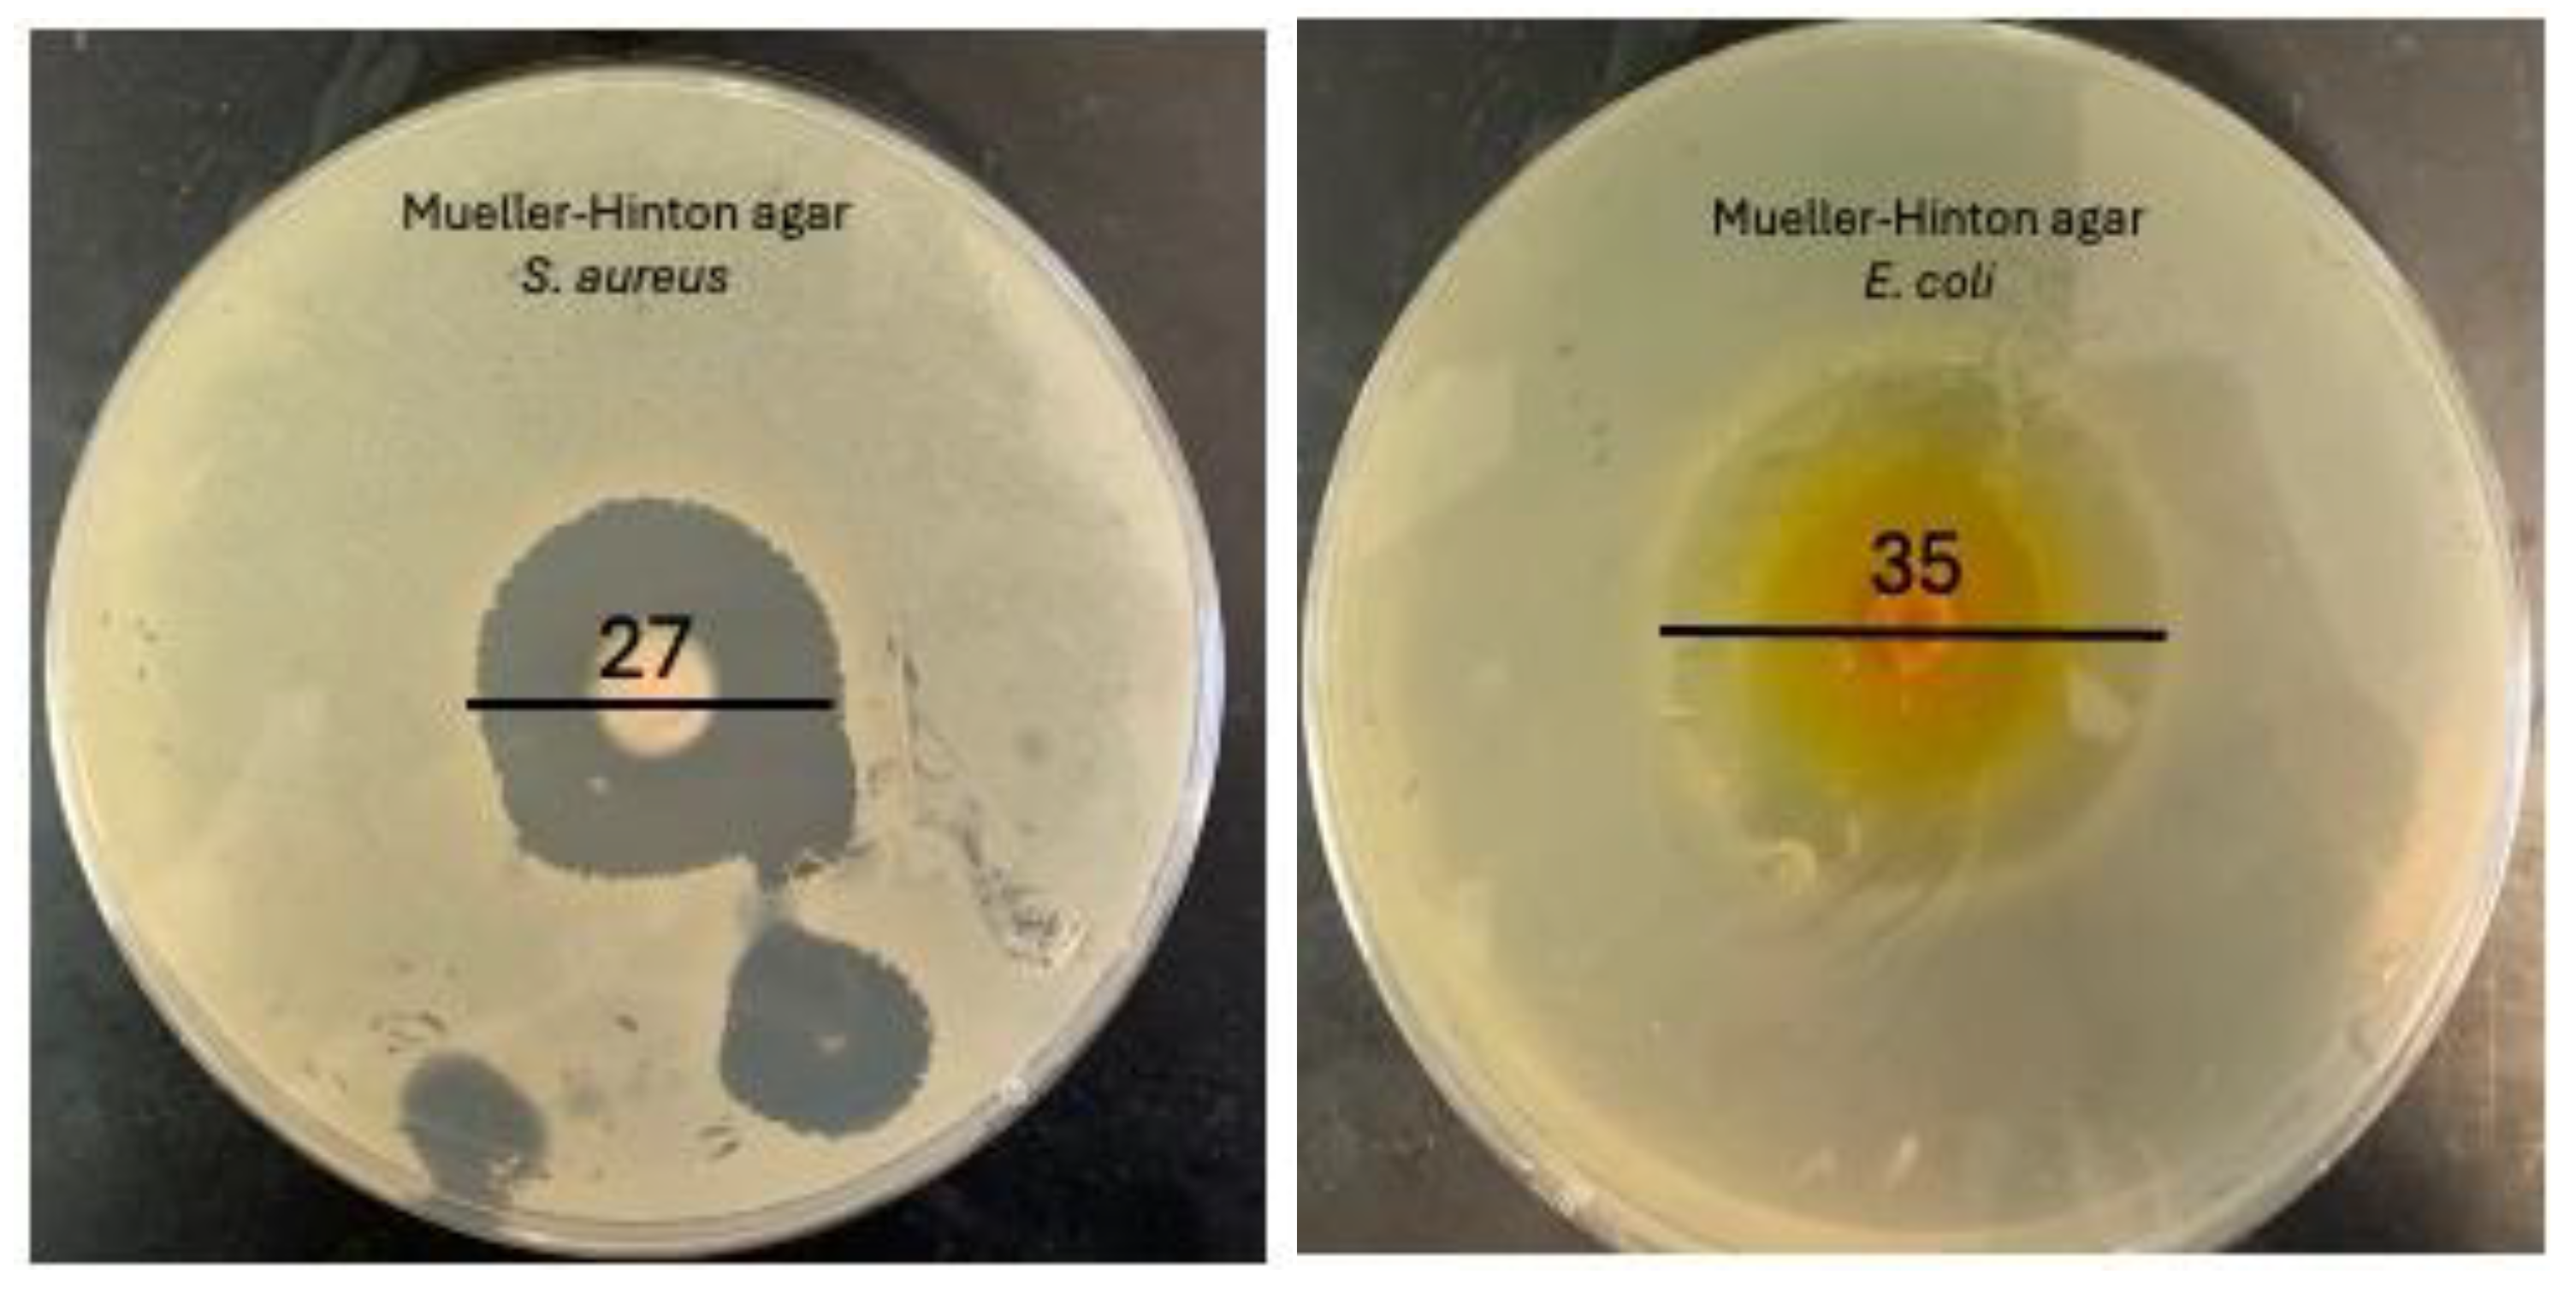
Figure 10.
Bacterial Killing assay comparing the control group to BG-V at 1 hour, 5 hours, 24 hours and 48 hours. The Figure shows the log bacterial growth of the control group compared to BG-V. The statistical difference is indicated by the * where * shows that the p>0.05 while *** shows that P>0.001.
4. Conclusions
This study investigates bioactive glass preloaded with vancomycin (BG-V) as a novel drug delivery system designed for long-term antibiotic delivery. BG-V was synthesized using a chemistry-based sol-gel method, where a vancomycin solution was prepared and mixed with different metal oxides, followed by overnight stirring. The mixture was then dried at room temperature to produce the final BG-V powder, which was used without further modifications. Fourier-transform infrared spectroscopy confirmed the successful incorporation of vancomycin into the BG-V structure. Scanning electron microscopy revealed a smaller surface area and blocked pores, indicating that vancomycin was entrapped within the BG-V. By the end of drug release studies, changes in surface area and BJH analysis showed an increase in surface area and the opening of pores post-release. In vitro drug release studies demonstrated an initial slight burst release, with approximately 20% of the drug released on the first day, followed by a steady release until the end of the experiment. Analysis of the drug release data using various kinetic models revealed that BG-V follows the Korsmeyer-Peppas model, suggesting that the drug was released through a combination of diffusion and matrix degradation. A disc diffusion test against S. aureus on Mueller Hinton agar showed a zone of inhibition (ZOI) of 35 ± 0.2 mm, indicating a strong antibacterial effect. Furthermore, investigation of the bacterial killing ability of BG-V demonstrated significant log reductions in bacterial growth after 5, 24, and 48 hours, with values of 3.73, 9.55, and 10.176, respectively. These results highlight the substantial reduction in bacterial growth achieved with the application of BG-V.
Author Contributions
Conceptualization, D.A. and Y.D.; methodology, D.A.; software, D.A.; validation, D.A. and Y.D.; formal analysis, D.A.; investigation, D.A.; resources, Y.D.; data curation, D.A.; writing—original draft preparation, D.A.; writing—review and editing, Y.D.; visualization, D.A.; supervision, Y.D. All authors have read and agreed to the published version of the manuscript.
Funding
This research received no external funding
Data Availability Statement
Data available upon request
Acknowledgments
Figures have been produced using OriginPro
Conflicts of Interest
The authors declare no conflicts of interest.”
Abbreviations
The following abbreviations are used in this manuscript:
| BET | Braunauer-Emmett-Teller |
| BG-V | Bioactive glass preloaded with vancomycin |
| BJH | Barrett, Joyner and Halenda |
| CMC | Critical micelle concentrations |
| FTIR | Fourier-transform infrared spectroscopy |
| HCA | hydroxyapatite |
| HCl | Hydrochloric acid |
| ICP-OES | Induced Coupled Optical Emission Spectroscopy Plasma |
| MBG | Mesoporous bioactive glass |
| NBO | Non-bridging Oxygens |
| SBF | Simulated body fluid |
| SDA | Surface-directing agents |
| SEM | scanning electron microscopy |
| XRD | X-Ray Diffraction |
| ZOI | Zone of inhibition |
References
- Dash, S. , Murthy, N. P., Nath, L., & Chowdhury, P. Kinetic modeling on drug release from controlled drug delivery systems. Acta poloniae pharmaceutica, 2010, 67, 217–223. [Google Scholar] [PubMed]
- Almasri, D. , & Dahman, Y. Prosthetic Joint Infections: Biofilm Formation, Management, and the Potential of Mesoporous Bioactive Glass as a New Treatment Option. Pharmaceutics, 2023, 15, 1401. [Google Scholar]
- Aminzadeh, Z. , Yadegarynia, D., Fatemi, A., Dehkordi, E. T., & Armaki, S. A. Vancomycin Minimum Inhibitory Concentration for Methicillin-Resistant Staphylococcus aureus Infections; Is There Difference in Mortality Between Patients? Jundishapur journal of microbiology, 2014, 7, e12831. [Google Scholar]
- Anand, A. , Das, P., Nandi, S. K., & Kundu, B. Development of antibiotic loaded mesoporous bioactive glass and its drug release kinetics. Ceramics International, 2020, 46, 5477–5483. [Google Scholar]
- Andrews, J. M2005 BSAC standardized disc susceptibility testing method (version4). J. Antimicrob. Chemother., 2005, 56, 60–76. [Google Scholar] [CrossRef] [PubMed]
- Araújo, M. , Miola, M., Baldi, G., González, J., & Verné, E. Bioactive glasses with low ca/p ratio and enhanced bioactivity. Materials, 2016, 9, 226. [Google Scholar] [PubMed]
- Auniq, R. , Boonyang, U., & Hirun, N. (2020). Three-Dimensionally Ordered Macroporous-Mesoporous Bioactive Glass Ceramics for Drug Delivery Capacity and Evaluation of Drug Release. In Ceramic Materials. IntechOpen.
- Baldovino-Medrano, V. G. , Niño-Celis, V., & Isaacs-Giraldo, R. Systematic analysis of the nitrogen adsorption-desorption isotherms recorded for a series of microporous – mesoporous amorphous aluminosilicates using classical methods. Journal of Chemical & Engineering Data, 2023, 68, 2512–2528. [Google Scholar]
- Brunner, T. J. , Grass, R. N., & Stark, W. J. Glass and bioglass nanopowders by flame synthesis. Chemical Communications,, 2006, 13, 1384–1386. [Google Scholar]
- Bruschi, M. L. (2015). Modify the Drug Release from Pharmaceutical Systems.
- Bruschi, M. L. (2015). Strategies to Modify the Drug Release from Pharmaceutical Systems.
- Costa, P., & Lobo, J. M. (2001). Modeling and comparison of dissolution profiles. European Journal of Pharmaceutical Sciences, 13(2), 123-133.
- Dash, S., Murthy, P. N., Nath, L., & Chowdhury, P. (2010). Kinetic modeling on drug release from controlled drug delivery systems . Acta poloniae pharmaceutica, 67(3), 217-223.
- Deshmukh, K., Kovářík, T., Křenek, T., Docheva, D., Stich, T., & Pola, J. (2020). Recent advances and future perspectives of sol–gel derived porous bioactive glasses: a review. RSC Advances, 10, 33782-33835.
- Drouet, M., Chai, F., Barthélémy, C., Lebuffe, G., Debaene, B., Décaudin, B., & Odou, P. (2015). Influence of Vancomycin Infusion Methods on Endothelial Cell Toxicity. Antimicrobial Agents and Chemotherapy, 59(2), 930-934.
- England, C. G., Miller, M. C., Kuttan, A., Trent , J. O., & Frieboes, H. B. (2015). Release kinetics of paclitaxel and cisplatin from two and three layered gold nanoparticles. European journal of pharmaceutics and biopharmaceutics : official journal of Arbeitsgemeinschaft fur Pharmazeutische Verfahrenstechnik e.V, 92, 120–129.
- Hench, L. L. (2006). The story of Bioglass. J Mater Sci Mater Med, 17(11), 967-978.
- Jones, J. R. (2013). Review of bioactive glass: From Hench to hybrids. Acta Biomaterialia, 9(1), 4457-4486.
- Ksouri, D. K., Khiereddine, H., Aksas, A., Bir, F., Slimani, , N., & Santos, J. (2018). Synthesis of ternary bioactive glass derived aerogel and xerogel: study of their structure and bioactivity. Nova Biotechnologica Et Chimica, 17(2), 150-159.
- Li, R., Clark, A. E., & Hench, L. L. (1991). An investigation of bioactive glass powders by sol-gel processing. Journal of Applied Biomaterials, 2(4), 231-239.
- Lin, C., Huang, L. C., & Shen, P. (2005). Na2CaSi2O6–P2O5 Based Bioactive Glasses. Part 1: Elasticity and Structure. Journal of Non-Crystalline Solids, 351(40-42), 3195-3203.
- Mukundan, L. M., Nirmal, R., Vaikkath, D., & Nair, D. (2013). A new synthesis route to high surface area sol gel bioactive glass through alcohol washing. Biomatter, 3(2), e24288.
- Park, K. (2014). Controlled drug delivery systems: Past forward and future back. Journal of Controlled Release, 190(28), 3-8.
- Peppas, N. A., & Narasimhan, B. (2014). Mathematical models in drug delivery: How modeling has shaped the way we design new drug delivery systems. Journal of Controlled Release, 190, 75-81.
- Post, V., Wahl, P., Richards, R. G., & Moriarty, T. (2016). Vancomycin displays time-dependent eradication of mature staphylococcus aureus biofilms. Journal of Orthopaedic Research, 35(2), 381-388.
- Rahaman, S. N., Ayyadurai, N., & Anandasadagopan, S. K. (2023). Synergistic effect of vancomycin and gallic acid loaded MCM-41 mesoporous silica nanoparticles for septic arthritis management. Journal of Drug Delivery Science and Technology, 82, 104353.
- Ranga, N., Poonia, E., Jakhar, S., Sharma, A. K., Kumar, A., Devi, S., & Duhan, S. (2018). Enhanced antimicrobial properties of bioactive glass using strontium and silver oxide nanocomposites. JOURNAL OF ASIAN CERAMIC SOCIETIES, 7(1), 75-81.
- Ranga, N., Poonia, E., Jakhar, S., Sharma, A. K., Kumar, A., Devi, S., & Duhan, S. (2019). Enhanced antimicrobial properties of bioactive glass using strontium and silver oxide nanocomposites. JOURNAL OF ASIAN CERAMIC SOCIETIES, 7(1), 75-81.
- Santhiya, D., Alajangi, H. k., Anjum, F., Murugavel, S., & Ganguli, M. (2013). Bio-inspired synthesis of microporous bioactive glass-ceramic using CT-DNA as a template . J. Mater. Chem. B, 1(45), 6329-6338.
- Schäfer, M., Schneider, T. R., & Sheldrick, G. M. (1996). Crystal structure of Vancomycin. Structure, 4(12), 1509–1515.
- Schumacher, M., Habibovic, P., & van Rijt, S. (2021). Mesoporous Bioactive Glass Composition Effects on Degradation and Bioactivity. Bioactive Materials, 6(7), 1921–1931.
- Sepulveda, P., Jones, J. R., & Hench, L. L. (2001). Characterization of melt-derived 45S5 and sol-gel-derived 58S bioactive glasses. Journal of biomedical materials research, 58(6), 734-740.
- Siepmann, J. , & Peppas, N. A. Modeling of drug release from delivery systems based on hydroxypropyl methylcellulose (HPMC). Advanced Drug Delivery Reviews, 2001, 48, 139–157. [Google Scholar]
- Sudipta, Mishra, S. , & Murugavel, S. Biomineralization behavior of ternary mesoporous bioactive glasses stabilized through ethanol extraction process. Journal of Non-Crystalline Solids, 2022, 589, 121630. [Google Scholar]
- Sun, J. , Li, J., Fan, H., & Ai, S. Ag nanoparticles and vancomycin comodified layered double hydroxides for simultaneous capture and disinfection of bacteria. Journal of Materials Chemistry B, 2013, 1, 5436–5442. [Google Scholar]
- Tabassum, S. , Saqib, M., Batool, M., Sharif, F., Gilani, M. A., & Huck, O. Eco-friendly synthesis of mesoporous bioactive glass ceramics and functionalization for drug delivery and hard tissue engineering applications. Biomed. Mater., 2024, 19, 035014. [Google Scholar]
- Vallet-Regi, M., & Acros, D. (2020). ioactive Glasses: Properties, Composition and Recent Applications. Madrid: Nova Science.
- Wang, F. , Zhou, H., Olademehin, O. P., & Kim, S. J. Insights into key interactions between vancomycin and bacterial cell wall structures. ACS Omega, 2018, 3, 37–45. [Google Scholar] [PubMed]
- Xia, W. , & Chang, J. Well-ordered mesoporous bioactive glasses (MBG): A promising bioactive drug delivery system. Journal of Controlled Release, 2006, 110, 522–530. [Google Scholar] [PubMed]
- Zheng, K. , & Boccaccini, A. R. Sol-gel processing of bioactive glass nanoparticles: A review. Adv Colloid Interface Sci., 2017, 249, 363–373. [Google Scholar] [PubMed]
- Zheng, Y., Xiong, C., Zhang, D., & Zhang, L. (2018). In vitro bioactivity evaluation of $$\upalpha $$ α -calcium sulphate hemihydrate and bioactive glass composites for their potential use in bone regeneration. Bulletin of Materials Science, 41(2).
Figure 2.
FT-IR of vancomycin (black) and BG-V (red) at day 0 and BG (blue). The peaks highlighted represent the functional groups of BG, BG-V and vancomycin.
Figure 2.
FT-IR of vancomycin (black) and BG-V (red) at day 0 and BG (blue). The peaks highlighted represent the functional groups of BG, BG-V and vancomycin.
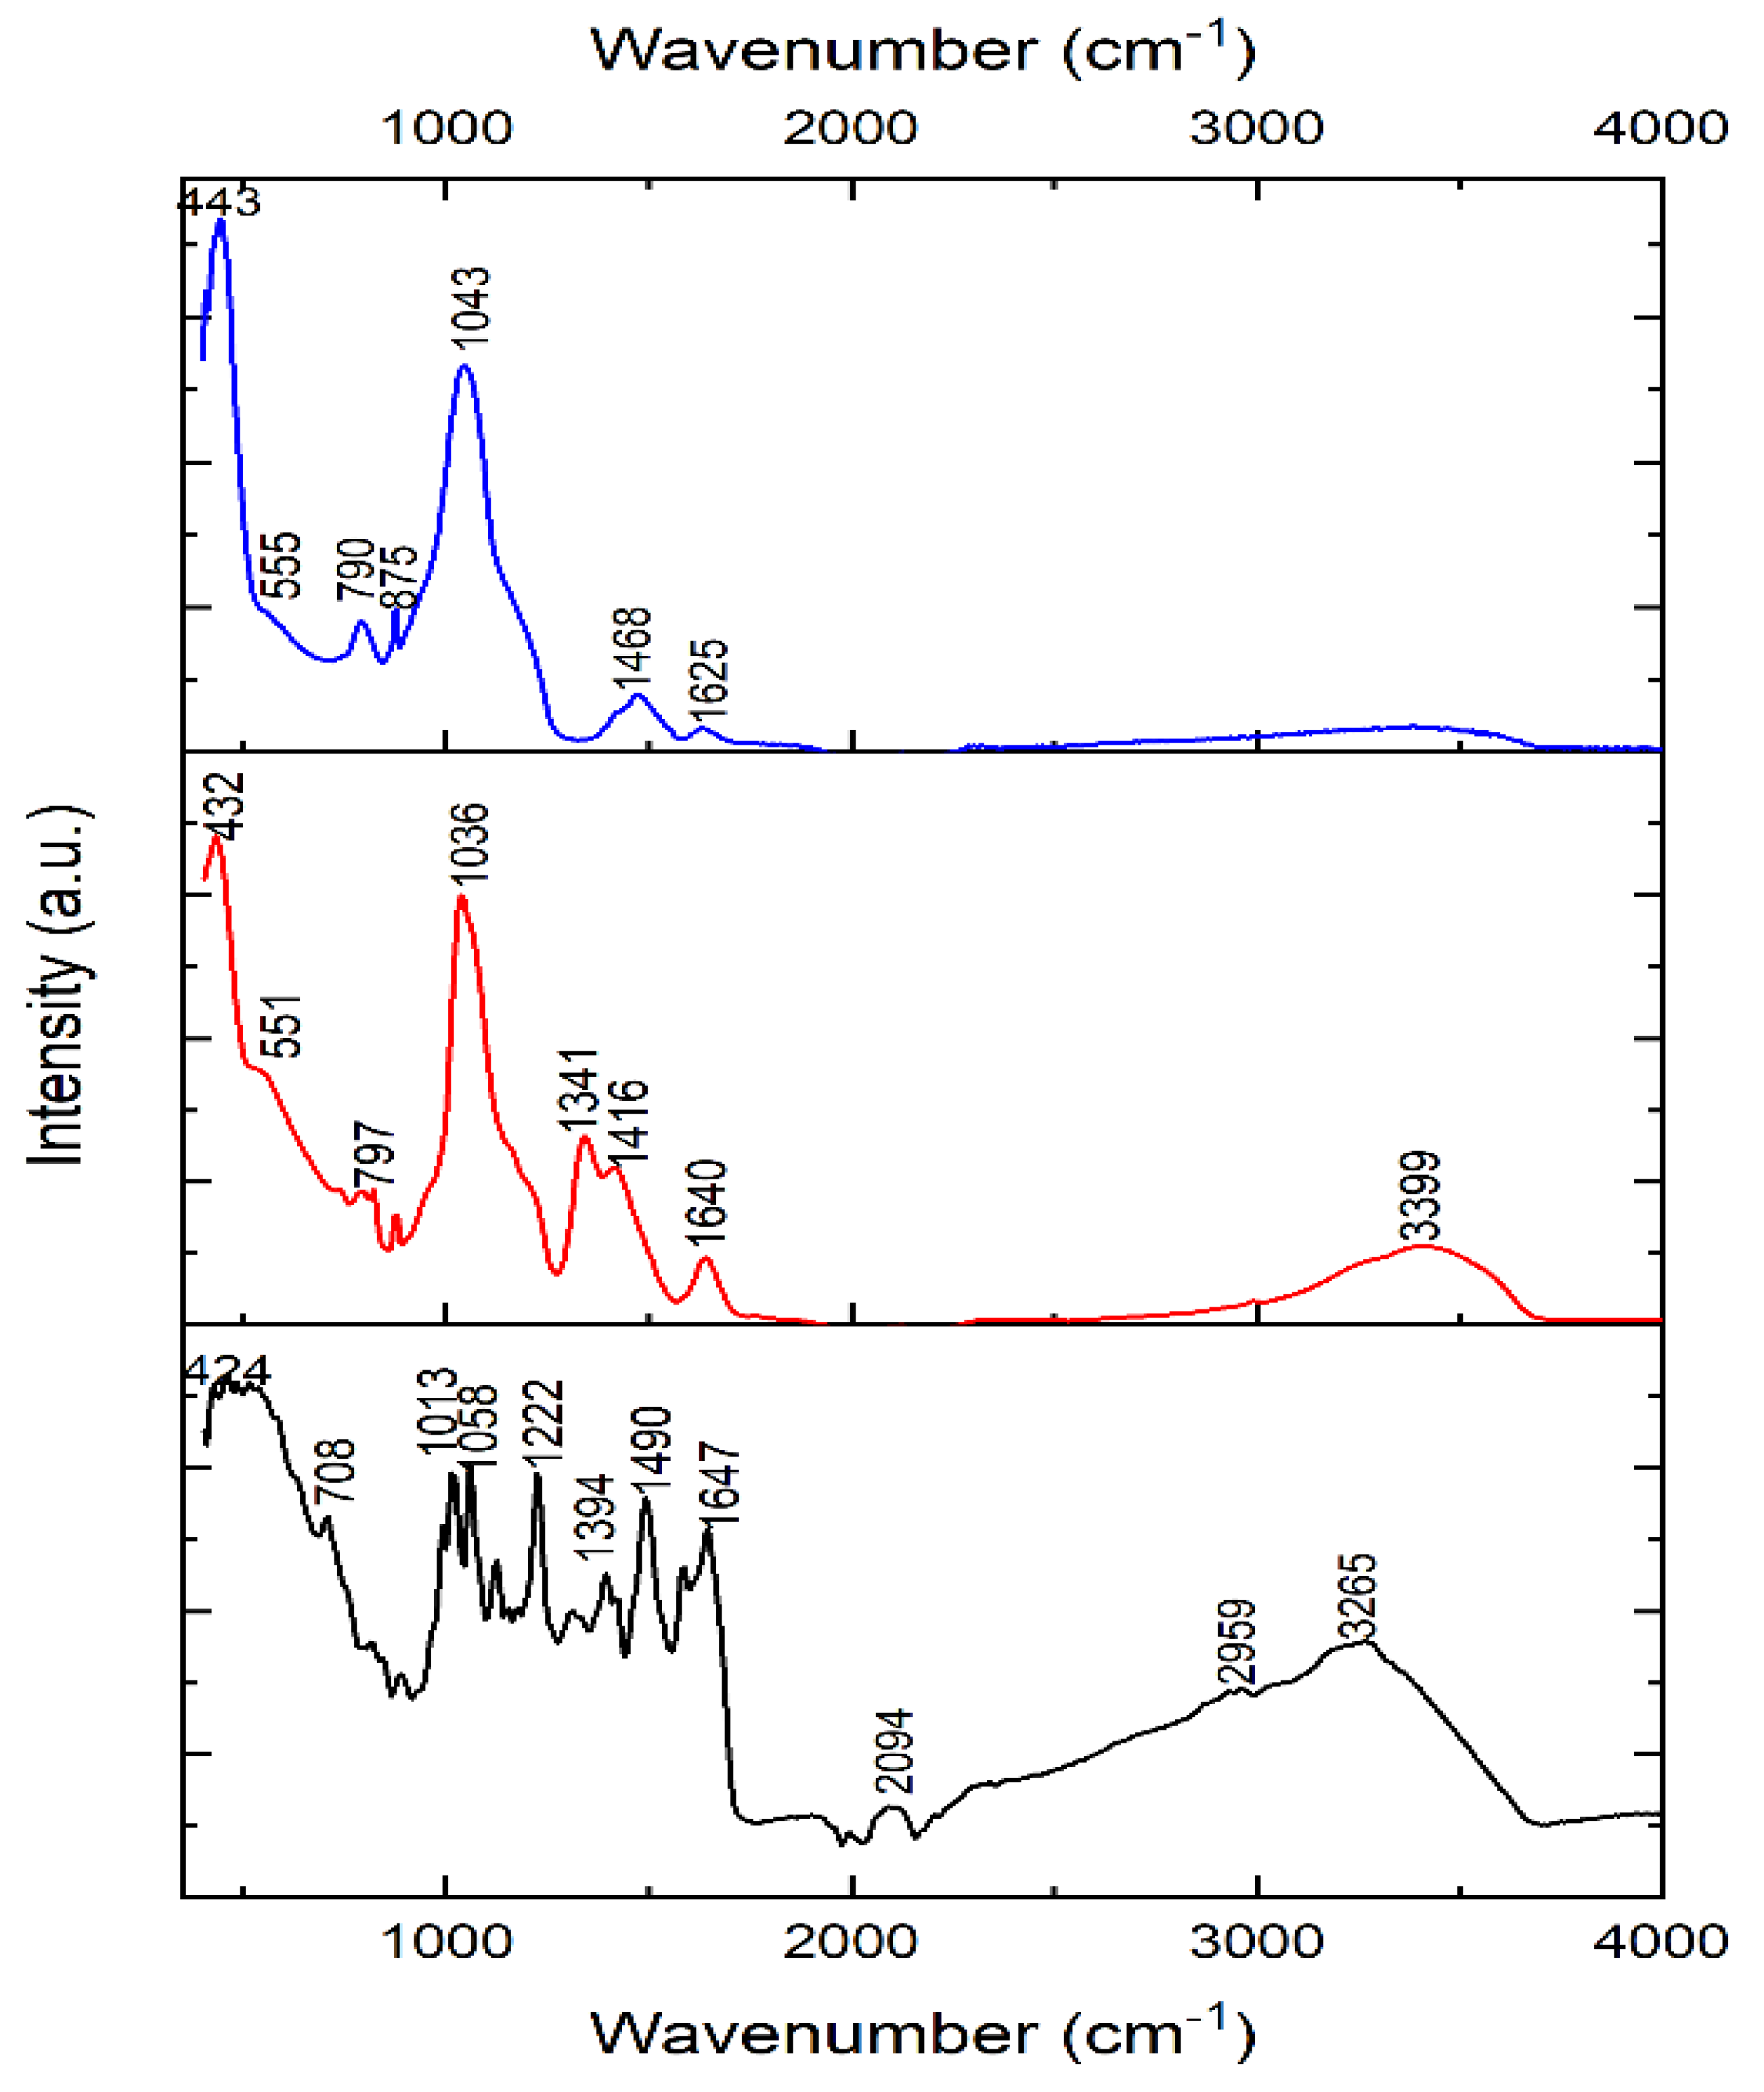
Figure 3.
(a) XRD of Vancomycin (blue), BG-V before drug release in PBS (black) and after drug release studies (red) while (b) shows BG-V and BG.
Figure 3.
(a) XRD of Vancomycin (blue), BG-V before drug release in PBS (black) and after drug release studies (red) while (b) shows BG-V and BG.
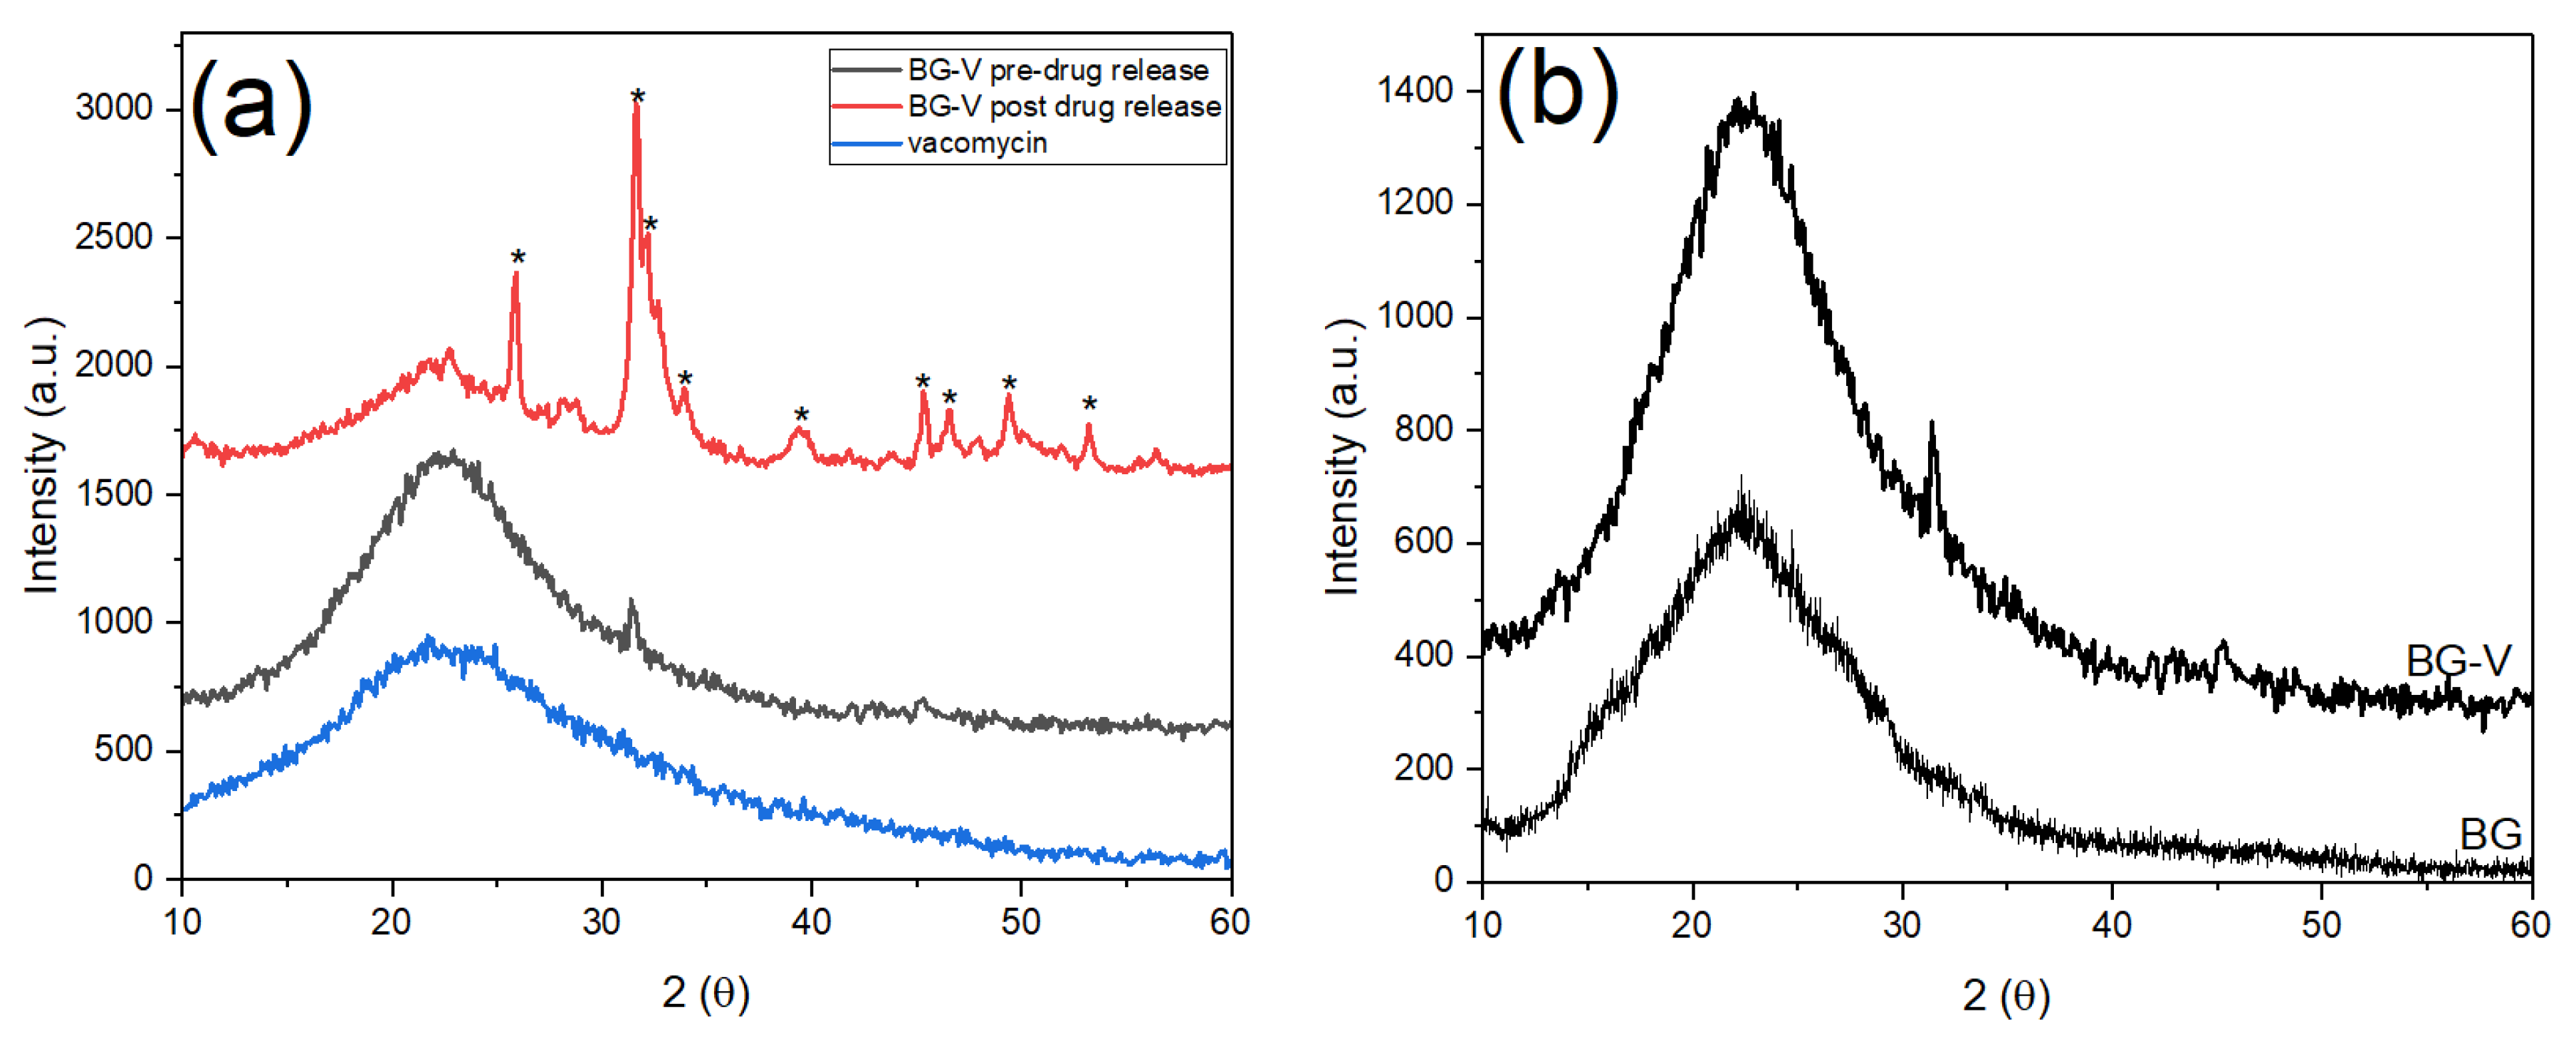
Figure 4.
Nitrogen Adsorption Desorption isotherm of as synthesized BG-loaded with Vancomycin before (black) and after (red) drug release studies.
Figure 4.
Nitrogen Adsorption Desorption isotherm of as synthesized BG-loaded with Vancomycin before (black) and after (red) drug release studies.
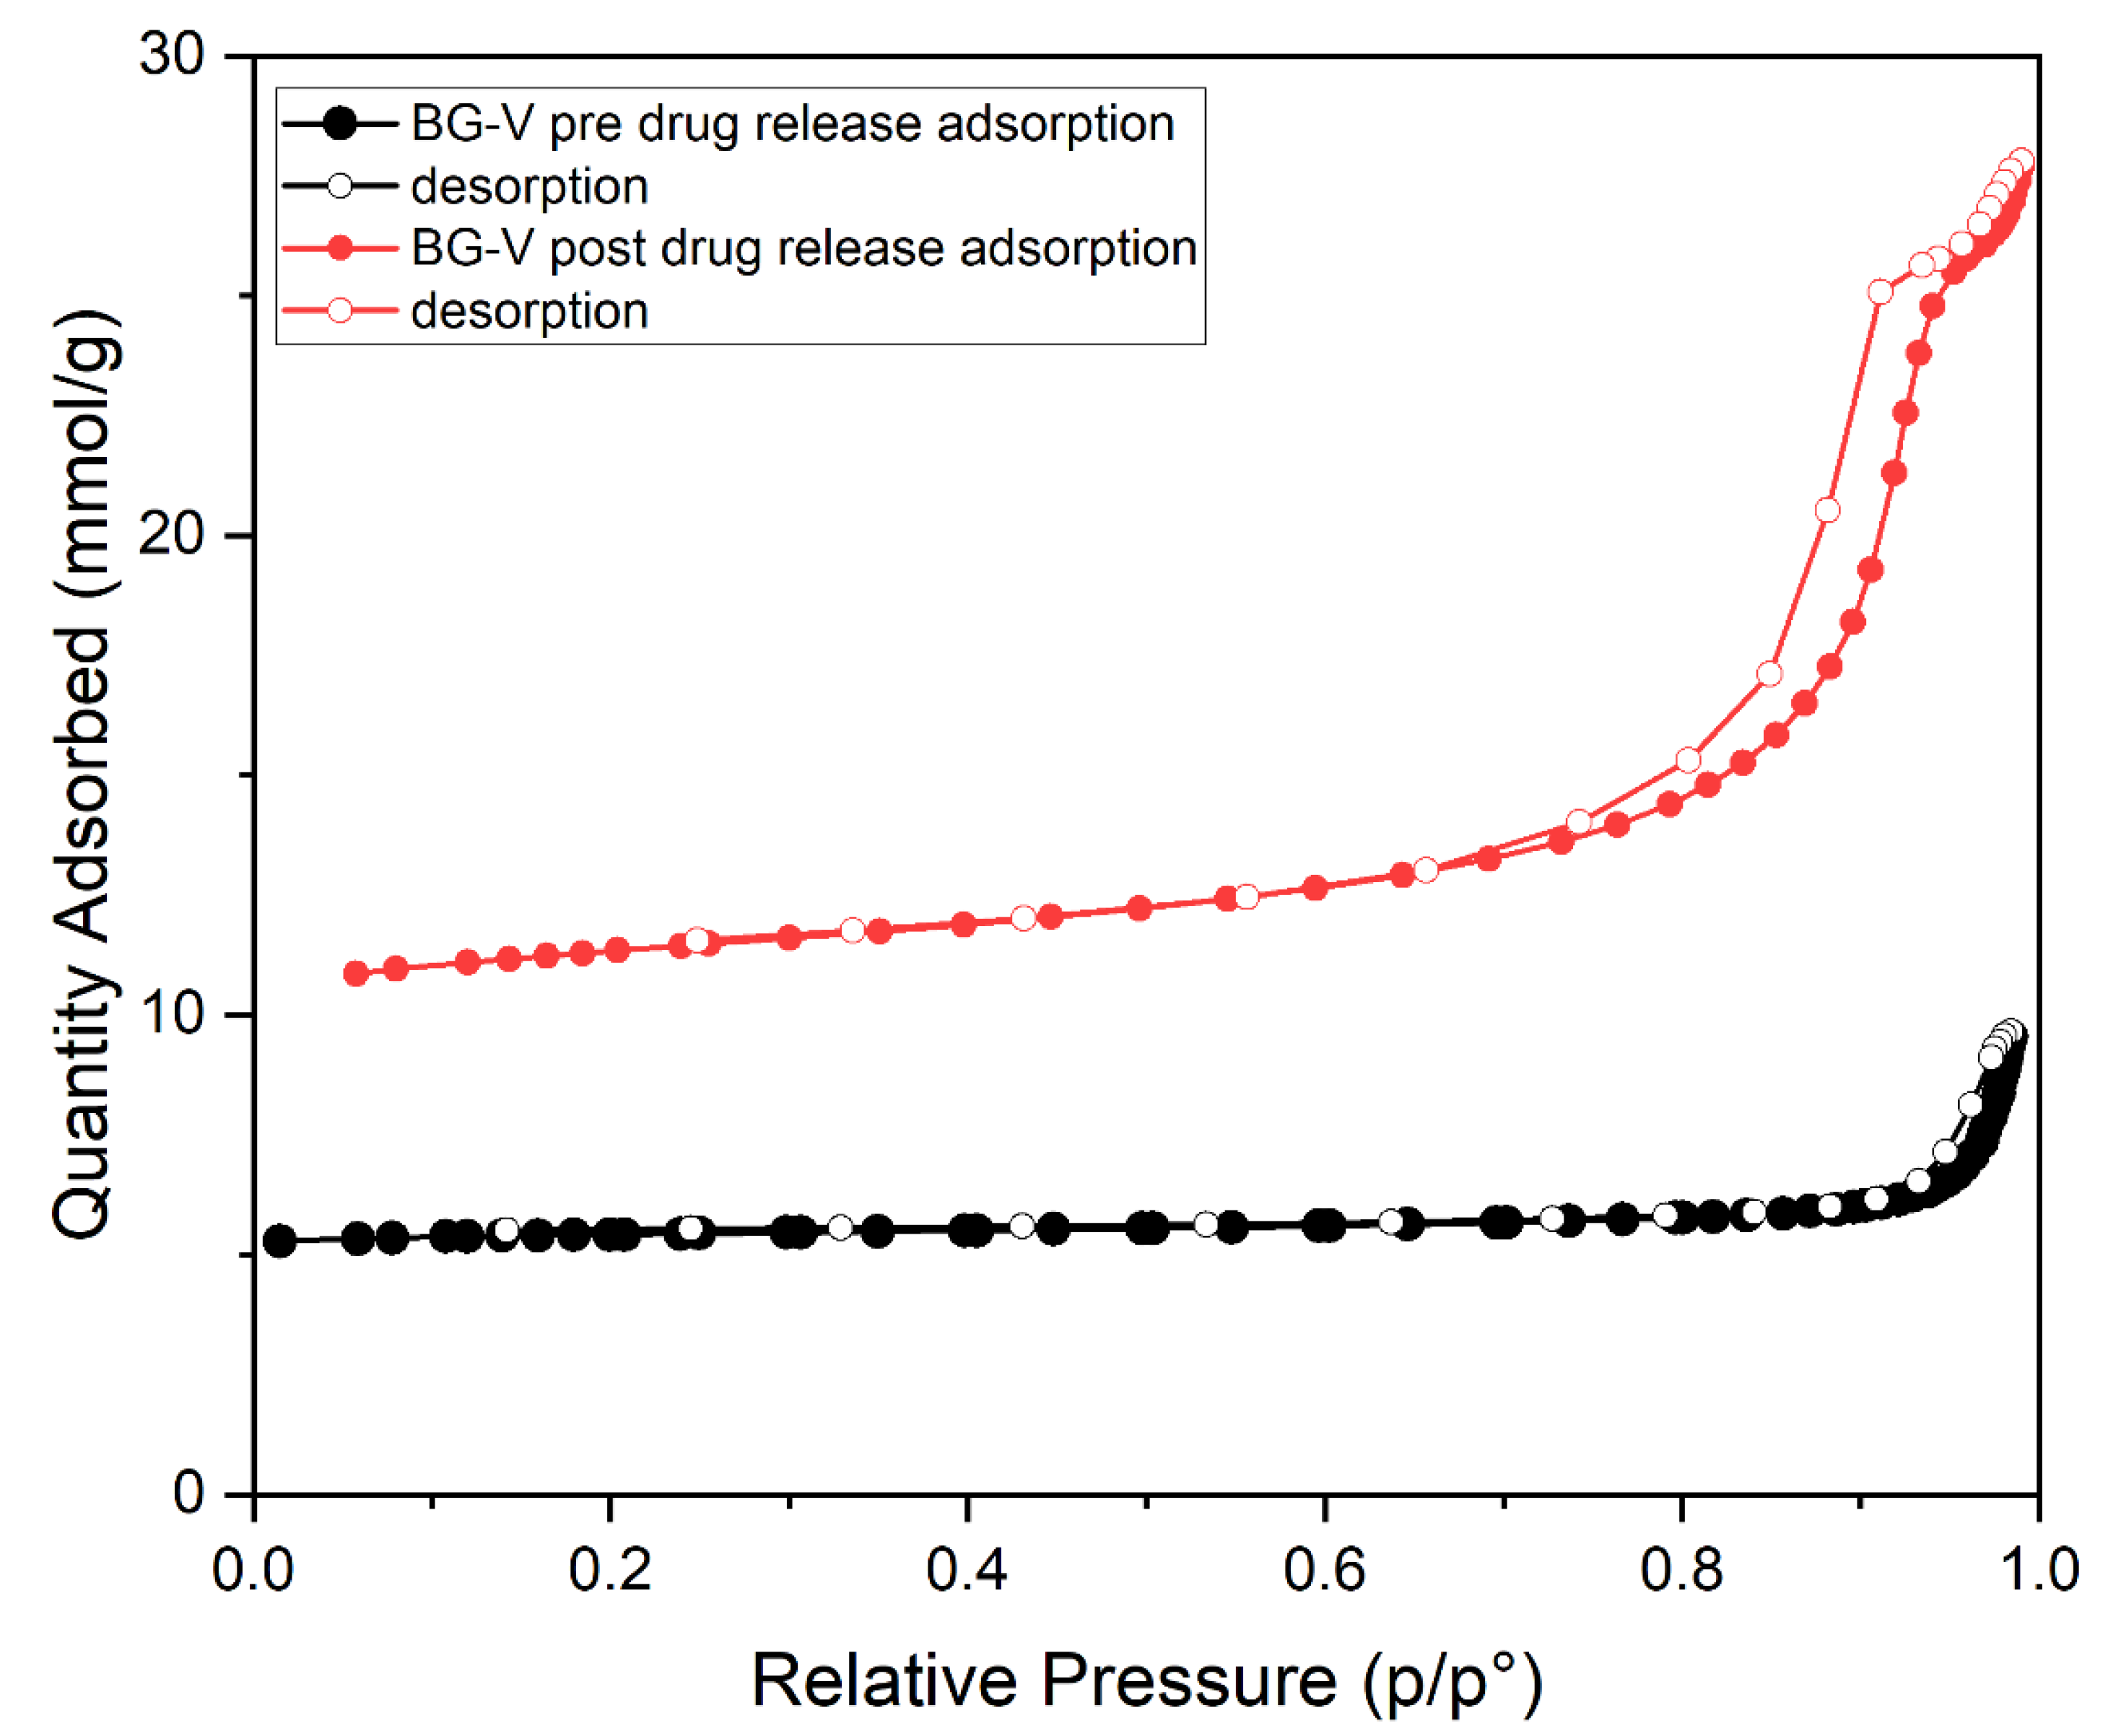
Figure 5.
SEM images of BG-V before (a) the drug release study and after (b) the drug release study. The image (b) shows a more porous structure after drug release.
Figure 5.
SEM images of BG-V before (a) the drug release study and after (b) the drug release study. The image (b) shows a more porous structure after drug release.
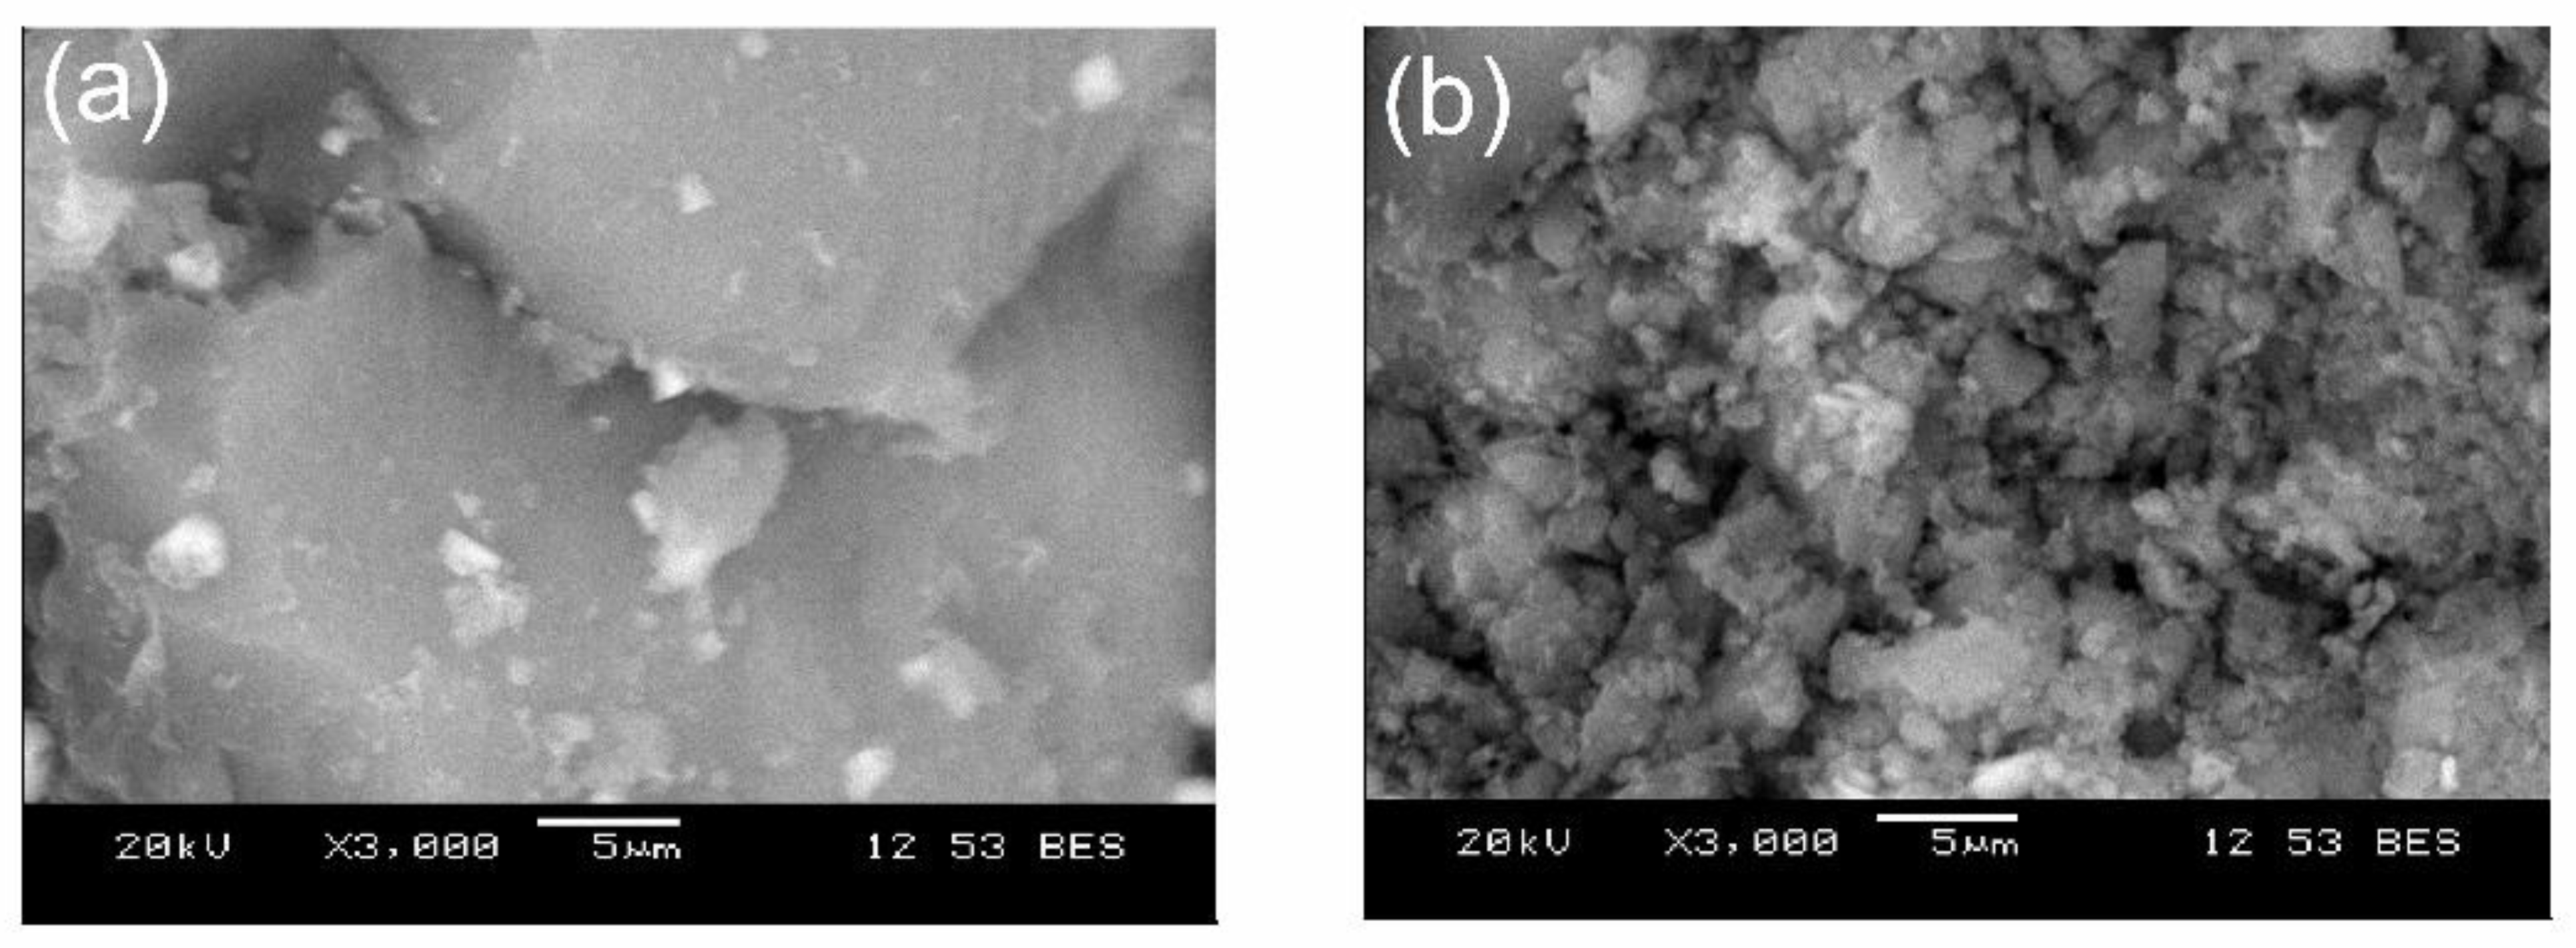
Figure 6.
Atomic Weight percentage of silicon, calcium, and phosphorous before and after drug release studies.
Figure 6.
Atomic Weight percentage of silicon, calcium, and phosphorous before and after drug release studies.
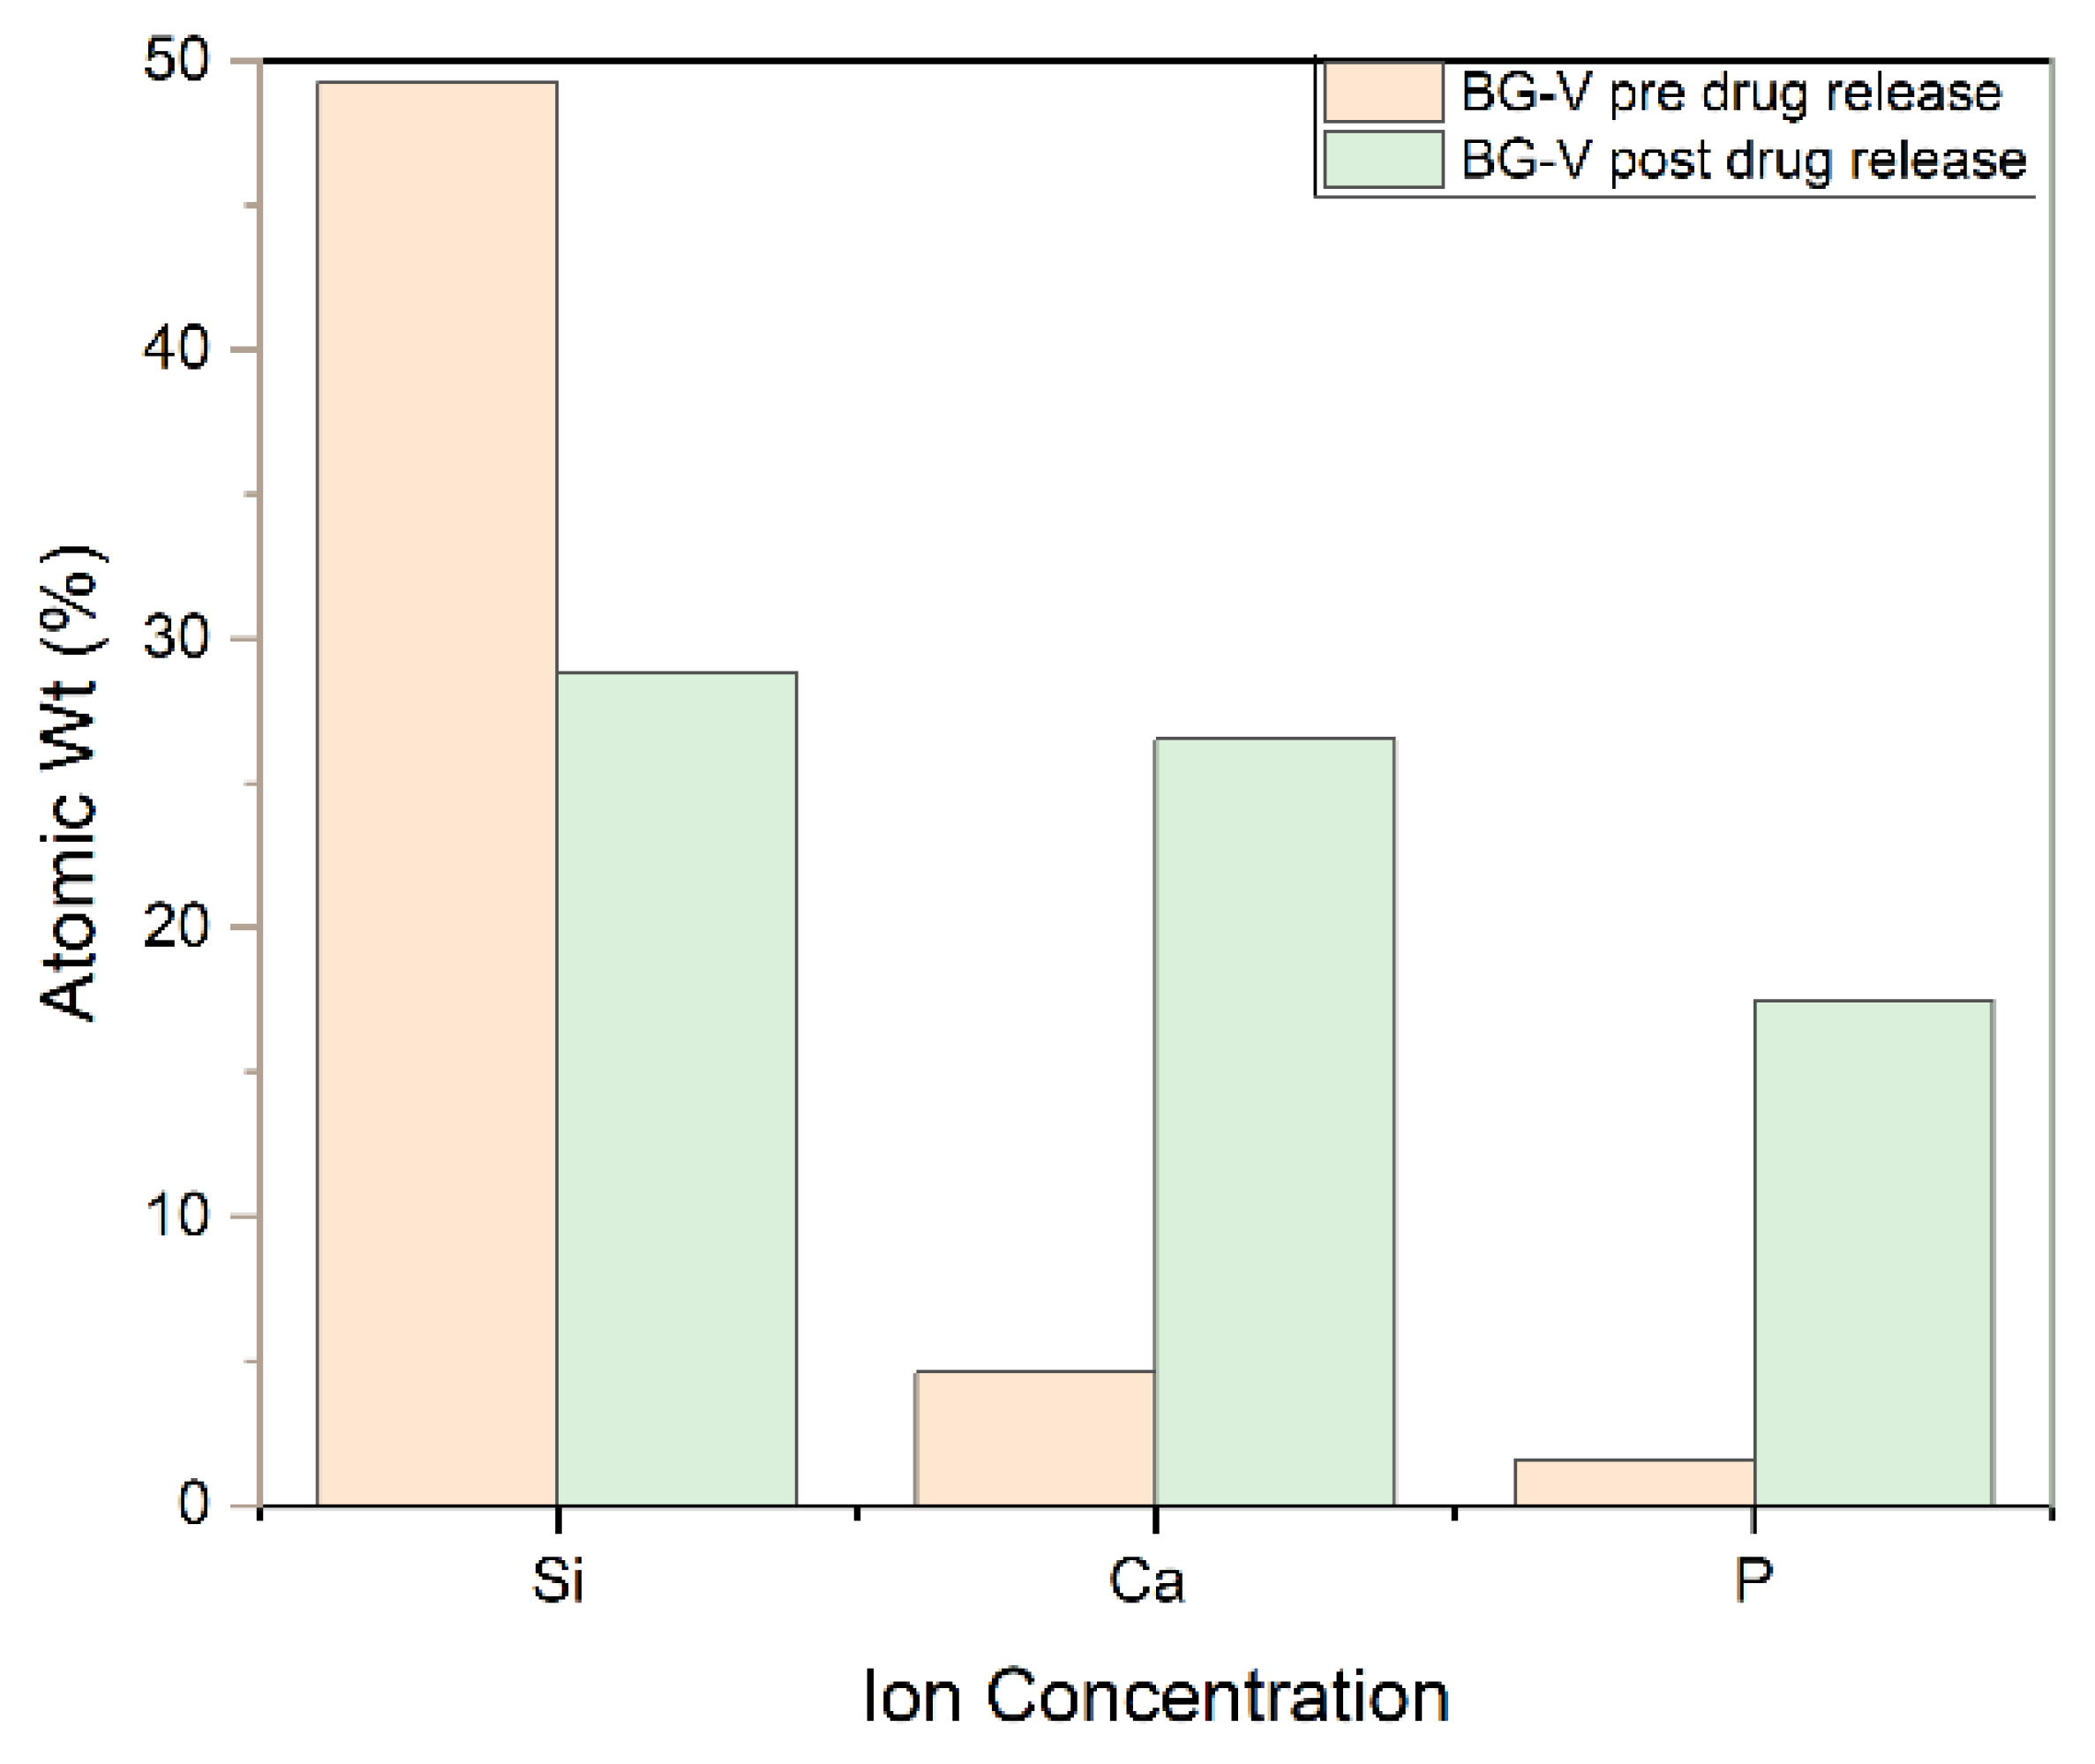
Figure 7.
Drug Release (%) of vancomycin from BG-V for the duration of the experiment (a) and release on the first day (b) drug release over 33 days.
Figure 7.
Drug Release (%) of vancomycin from BG-V for the duration of the experiment (a) and release on the first day (b) drug release over 33 days.
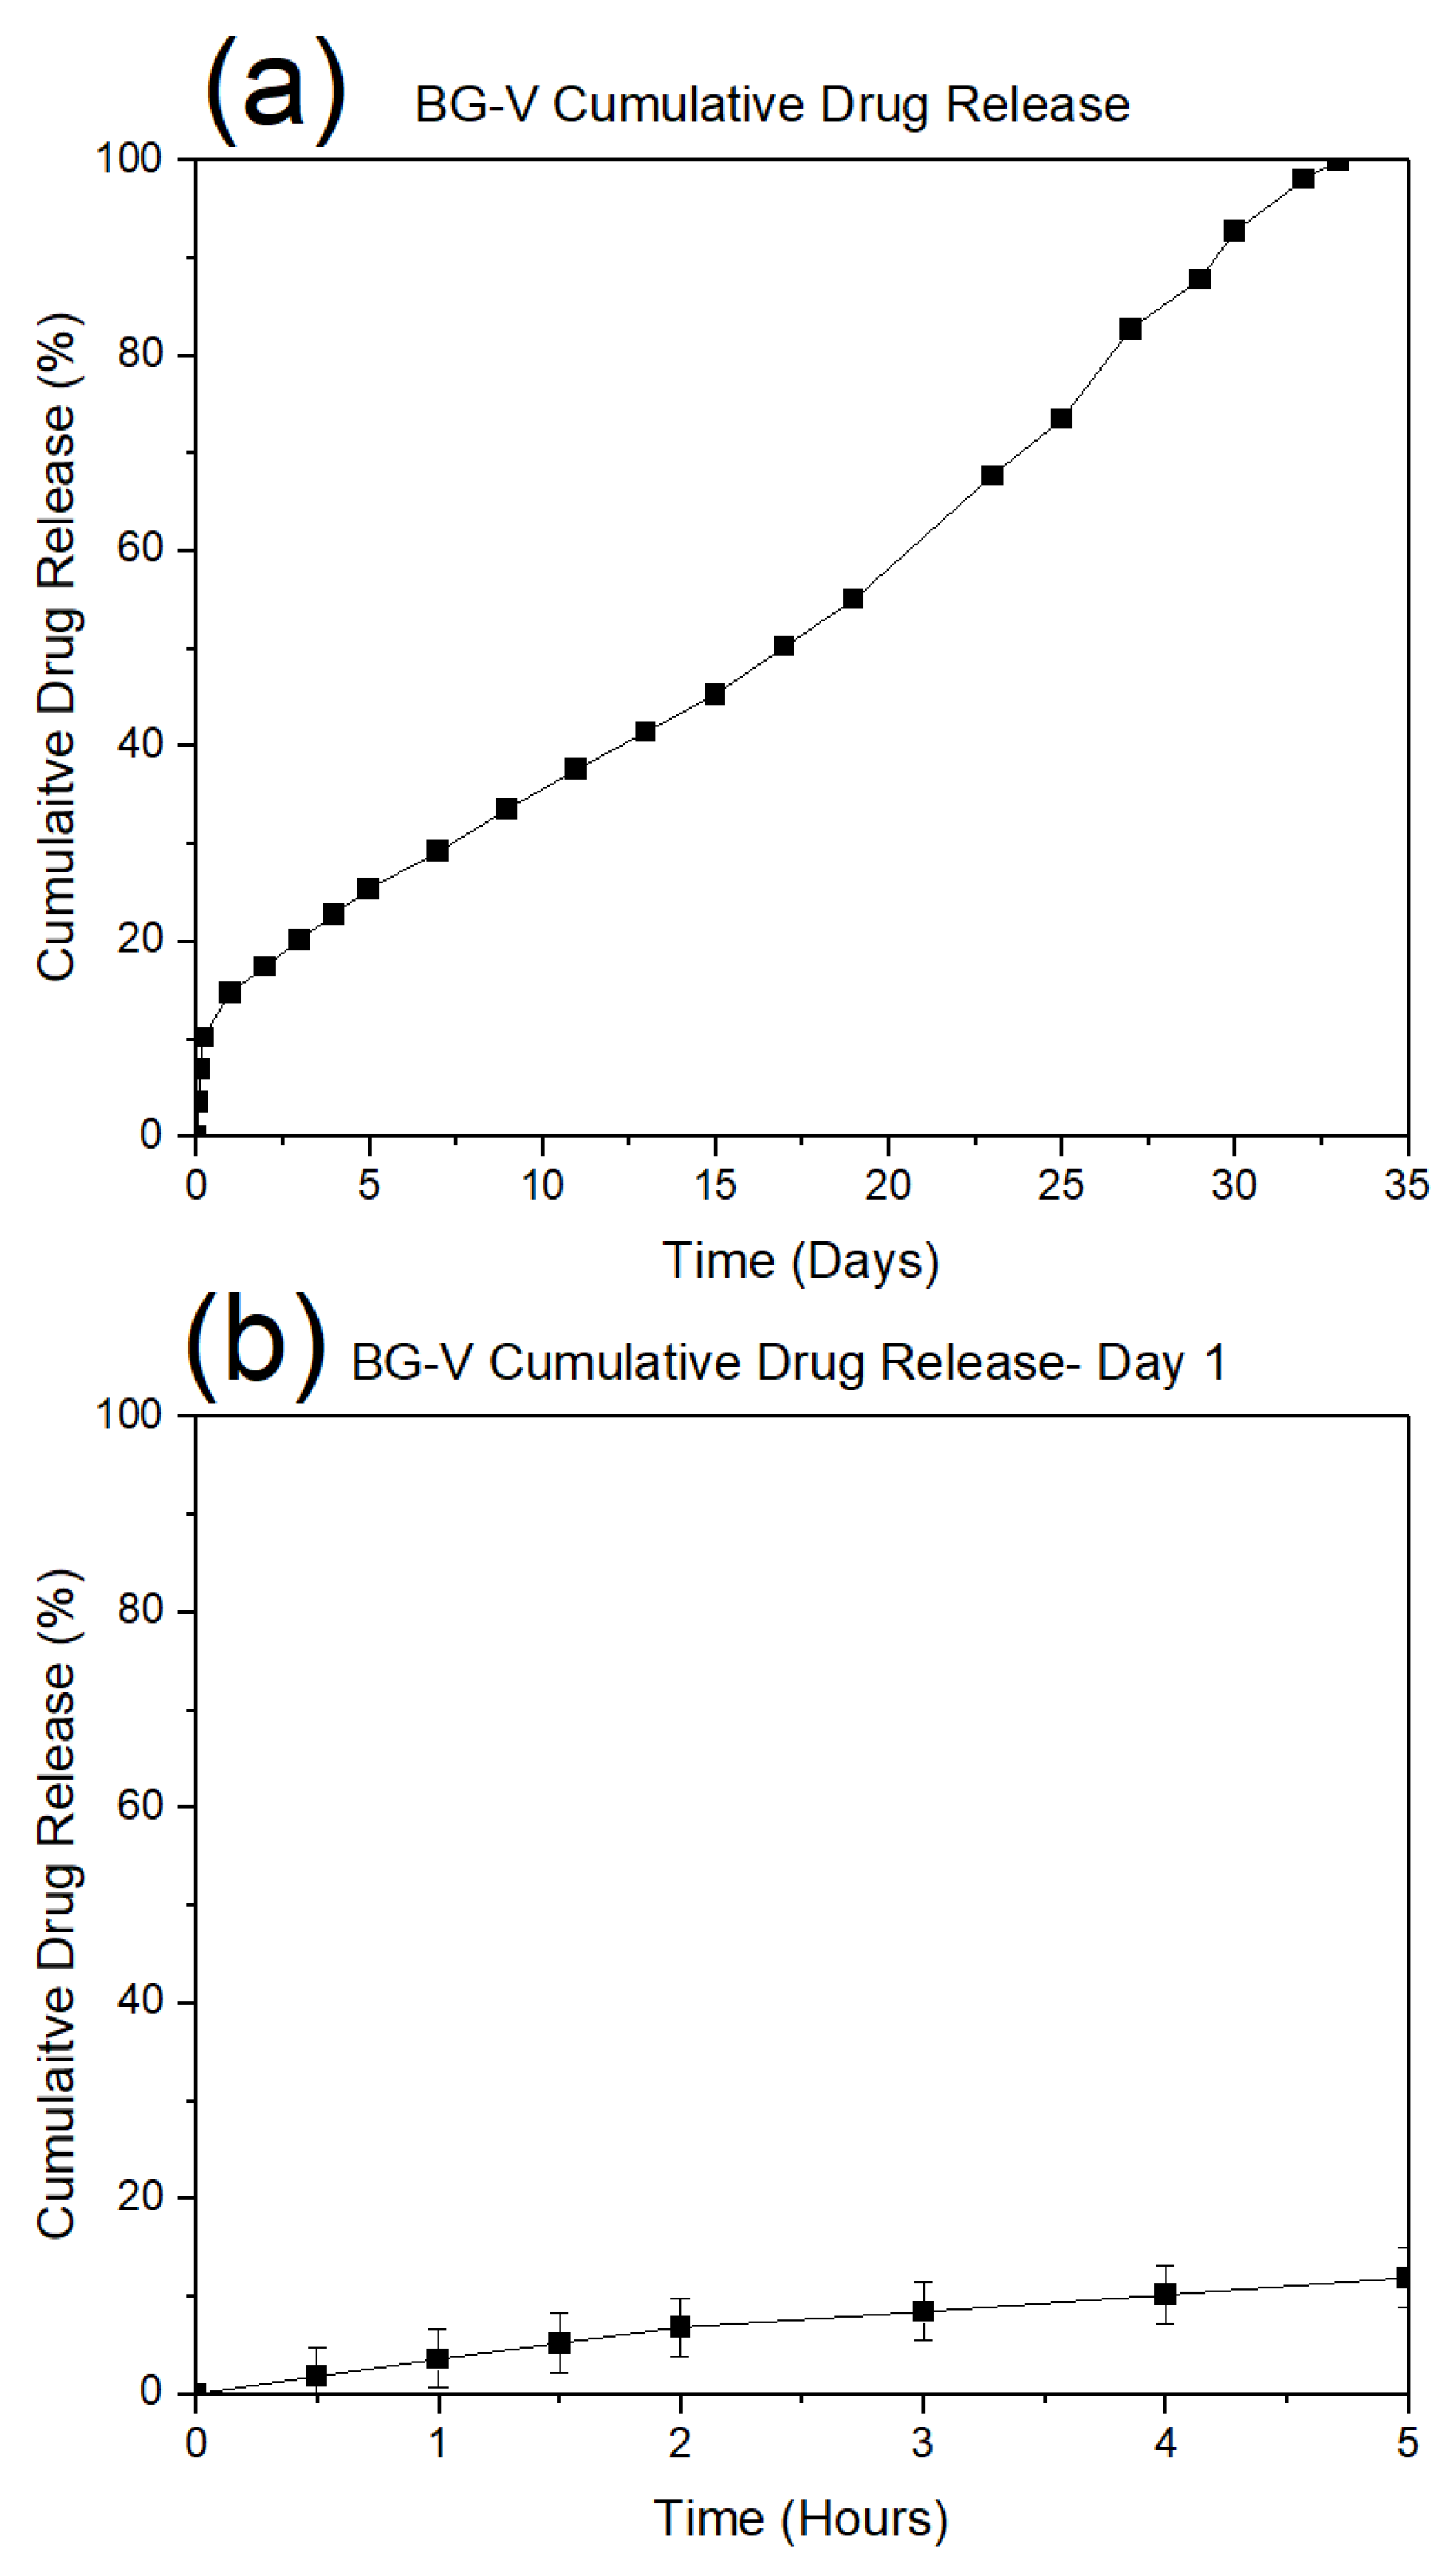

Table 1.
BET analysis of BG-V at day 0 (BG-V 0d) before drug release studies and at day 30 (BG-V 30d) after drug release study.
Table 1.
BET analysis of BG-V at day 0 (BG-V 0d) before drug release studies and at day 30 (BG-V 30d) after drug release study.
| BET Analysis | Surface Area (m2/g) | Pore volume (cm3/g) | Pore size (nm) |
|---|---|---|---|
| BG-V pre drug release | 20.23 | 0.13 | 23.27 |
| BG-V post drug release | 156.64 | 0.61 | 15.05 |
Disclaimer/Publisher’s Note: The statements, opinions and data contained in all publications are solely those of the individual author(s) and contributor(s) and not of MDPI and/or the editor(s). MDPI and/or the editor(s) disclaim responsibility for any injury to people or property resulting from any ideas, methods, instructions or products referred to in the content. |
© 2025 by the authors. Licensee MDPI, Basel, Switzerland. This article is an open access article distributed under the terms and conditions of the Creative Commons Attribution (CC BY) license (http://creativecommons.org/licenses/by/4.0/).
Copyright: This open access article is published under a Creative Commons CC BY 4.0 license, which permit the free download, distribution, and reuse, provided that the author and preprint are cited in any reuse.


