Submitted:
21 April 2025
Posted:
21 April 2025
You are already at the latest version
Abstract
Background: Environmental justice research in the United States (US) documents greater air pollution exposures for Hispanic/Latino vs. non-Hispanic White groups. This research has not focused on the intersection of race/ethnicity and older age nor short-term fine particular matter (PM2.5) exposures. We address those limitations in a study of US metropolitan area census tracts within 100 km of the US-Mexico border, a region with serious air quality issues.
Methods: We use US Census American Community Survey data to construct sociodemographic variables and Environmental Protection Agency Downscaler data to construct long-term and short-term measures of PM2.5 exposure. Using multivariable generalized estimating equations, we test for differences in PM2.5 exposures between census tracts with higher vs. lower proportions of Hispanic/Latino older residents and non-Hispanic White older residents.
Results: As the proportion of the Hispanic/Latino population ≥65 years of age increases, long-term and short-term PM2.5 exposures significantly increase. In contrast, as the proportion of the non-Hispanic White population ≥65 years of age increases, changes in long-term and short-term PM2.5 exposures are statistically non-significant.
Conclusion: Findings illuminate how race/ethnicity and older age intersect in shaping PM2.5 exposure disparities and may inform efforts to mitigate air pollution exposures for older Hispanic/Latino people along the US-Mexico border.
Keywords:
air pollution
; PM2.5
; hazards
; environmental justice
; older age
; race
; ethnicity
1. Introduction
Air pollution poses significant health risks to populations worldwide, with fine particulate matter 2.5 microns or less in diameter (PM2.5) being a key contributor to these risks. Globally, an estimated 8 million premature deaths annually (12% of total premature deaths) are attributable to air pollution, with PM2.5 accounting for 97% of those premature deaths (IHME, 2021). Not only is air pollution exceptionally harmful, but the environmental justice (EJ) literature has shown that it is distributed inequitably across social groups, with marked exposure inequities in the United States (US) occurring based on racial/ethnic minority and low socioeconomic statuses (Brulle et al., 2006; Collins et al., 2022; Collins and Grineski, 2022; Colmer et al., 2020; Jbaily et al., 2022; Tessum et al., 2021; Mohai et al., 2009; Nadybal et al., 2020).
Recent research has shown that racial/ethnic minorities and older adults in the United States and elsewhere exhibit heightened vulnerability to health risks of air pollution and PM2.5 exposures in particular (Bowe et al., 2019; Di et al., 2017; Geldzetzer et al., 2024; Josey et al., 2023; Ma et al., 2023; Power et al., 2011; Pun et al., 2017; Spiller et al., 2021; Weuve et al., 2012; Yin et al., 2021). Despite these unequal risks, environmental justice (EJ) research has largely focused on racial/ethnic disparities in air pollution exposure and overlooked the intersection of race/ethnicity and age in shaping differential exposures to PM2.5. An emphasis on this intersection aligns with calls to conduct intersectional EJ studies due to the importance of examining how different dimensions of social inequalities combine to shape risk (Malin and Ryder 2018). Quantitative intersectional EJ research has focused primarily on documenting how air pollution exposures increase based on the intersection of disadvantaged racial/ethnic status with foreign nativity (vs. US birth), specific ancestries (e.g., Dominican Hispanic/Latino, Ethiopian Black, Middle Eastern White), English-language deficiency (vs. proficiency), and lower (vs. higher) socioeconomic status (e.g., Liévanos, 2015; Rubio et al., 2020), neglecting the intersection of race/ethnicity with older age.
To our knowledge, only two EJ studies on air pollution have explored that intersection. The first study was conducted in the US-Mexico border locale of El Paso County, TX (Collins et al., 2011). It found that the chances of being in a neighborhood at high risk to carcinogenic air pollution was nearly four times higher if a neighborhood was in the highest (vs. the lowest) quartile for the percentage of Hispanic/Latino residents ≥64 years of age; conversely, neighborhoods in the highest (vs. lowest) quartile for the percentage of non-Hispanic White residents ≥64 were less likely to be at high risk (Collins et al., 2011). A study in Harris County similarly looked at ‘within racial/ethnic group’ differences in cancer risk from air pollution based on age, and found greater risks for tracts with higher concentrations of older adults (≥65) among both the Hispanic/Latino and non-Hispanic White populations (Loustaunau and Chakraborty, 2019).
Like Collins et al. (2011), other quantitative EJ studies conducted on the US-Mexico border have tended to focus on one metro area (Grineski et al., 2012; Grineski and Collins, 2010; Lara-Valencia et al., 2008; 2009). To our knowledge, just one study has examined the entirety of the border and found that increased concentrations of renter-occupants, Hispanic/Latino residents, mid-to-high socioeconomic status households, and foreign-born citizens were associated with elevated risks from long-term carcinogenic air pollution, and that older age was not associated with risk (Rubio et al., 2022). Despite the most prominent risks it poses, no prior studies have investigated PM2.5 pollution disparities along the entirety of US-Mexico border, a critical area of research given the unique challenges and vulnerabilities faced by communities there. The US-Mexico border faces air pollution problems because of the heavily trafficked cross-border points-of entry and the failure or reluctance of governments and industries to meet air quality standards (Colmer et al., 2020; Kelly et al., 2010; Lauer et al., 2009; Ordieres et al., 2005; Rubio et al., 2022; Quintana et al., 2014).
Nearly all EJ studies of air pollution have examined disparities in long-term exposures, overlooking potential disparities in exposures to short-term air pollution (see Collins et al., 2022 for a review). This is problematic, since short-term increases in PM2.5 are also associated with serious negative health impacts (Chen et al., 2018; Fajersztajn et al., 2017; Orellano et al., 2020; Yu et al., 2024). Two US nationwide studies found consistent racial/ethnic disparities across measures of long-term and short-term PM2.5 exposure, with disparities larger for measures of short-term (and more acute) vs. long-term (and less acute) PM2.5 exposures (Collins et al., 2022; Collins and Grineski, 2022). The racial/ethnic groups with the greatest long- and short-term PM2.5 exposures nationally across included Hispanic/Latino, non-Hispanic Asian, and non-Hispanic Black people, as well as people of color (i.e., those of Hispanic/Latino and/or any non-White race) overall. The non-Hispanic White group exhibited the lowest long- and short-term PM2.5 exposures (Collins et al., 2022; Collins and Grineski, 2022).
This study addresses limitations of prior work and advances knowledge by examining separate and intersectional associations of neighborhood-level racial/ethnic and older age statuses with long-term and short-term exposures to PM2.5 air pollution in US metropolitan areas along the US-Mexico border, contexts with well-documented PM2.5 pollution problems (Colmer et al., 2020; Kelly et al., 2010; Lauer et al., 2009; Ordieres et al., 2005; Quintana et al., 2014). We ask two research questions: What are the associations of race/ethnicity and age with long-term and short-term exposures to PM2.5? How do race/ethnicity and older age intersect to influence long-term and short-term exposures to PM2.5?
2. Materials & Methods
2.1. Study Area
The study area encompasses metropolitan US census tracts within 100 km of the US-Mexico border (Figure 1a). Census tracts were included in our analysis if they had a total population of 500 or greater and at least 100 residents ≥64 years of age, and were located in a metropolitan area core (i.e., rural-urban commuting area (RUCA) primary code 1 (USDA, 2019)). We focused on tracts in US metropolitan areas along the US-Mexico border, because those contexts have well-documented PM2.5 pollution problems (Colmer et al., 2020; Kelly et al. 2010; Lauer et al. 2009; Ordieres et al. 2005; Quintana et al. 2014). We excluded tracts with missing data for analysis variables. With those criteria, 294 census tracts were excluded, leaving 1208 in our analyses. We used census tracts as our analysis unit because they represent the finest resolution for which reliable sociodemographic data (independent variables) are available from the US Census and because they are the unit for which daily PM2.5 estimates are available from the US Environmental Protection Agency (EPA) Downscaler (dependent variables).
2.2. Dependent Variables
We developed three measures of PM2.5 to represent three dependent variables in our analysis. These measures are all derived from the USEPA Downscaler, which provides mean daily average concentration of PM2.5 in μg/m3 for each census tract in the United States (USEPA, 2025). The Downscaler PM2.5 concentration estimates are from a Bayesian space-time fusion mode developed by Berrocal et al. (2010). The Downscaler model combines data from the gridded atmospheric model also known as the Community Multi-Scale Air Quality Model or CMAQ and the air pollution point measurements from the National Air Monitoring Stations (NAMS/SLAMS). By explicitly accounting for the spatiotemporal dependence in PM2.5 concentrations, the Downscaler model performs well compared to direct PM2.5 observations (Berrocal et al., 2020; Kelly et al., 2021; Jin et al., 2019). Downscaler data have been widely employed in air pollution epidemiology and EJ studies (e.g., Bravo et al., 2017; Collins et al., 2022; Collins and Grineski, 2022; Son et al., 2020; Grineski et al., 2024). Archived Downscaler data with descriptive files are available from the USEPA (2025). We obtained Downscaler daily PM2.concentration estimates at 2010 census tract centroid locations.
We accessed Downscaler data for the years 2012-2016 to match the time frame of the ACS 5-year estimates used for our independent variables. PM2.5 concentrations exhibit substantial interannual variability, justifying our use of a 5-year period (O’Dell et al. 2019). For all three measures, we downloaded daily PM2.5 concentration estimates for all US census tracts from 2012-2016 and bound the data to the tracts of our study area described above. Next, we used those data to calculate long-term and short-term PM2.5 exposure measures for the 2012-2016 study period based on policy-relevant thresholds established by the World Health Organization (WHO) and the US Environmental Protection Agency’s (USEPA) National Ambient Air Quality Standards (NAAQS) that applied to the time period of study (USEPA 2012; WHO 2006). We calculated three census tract-level PM2.5 measures, one of long-term exposure and two gauging the frequency of short-term exposures. We used the (i) 2012-2016 mean daily average concentration of PM2.5 in μg/m3 as a measure of long-term exposure. Our short-term exposure measures include counts of days from 2012-2016 for which the tract-level 24-h estimated PM2.5 concentration equaled or exceeded (ii) 25 μg/m3 (WHO 24-h mean standard, 2006-2021) and (iii) 35 μg/m3 (USEPA 24-h mean NAAQS, 2012-present). Figure 1 maps of each of the PM2.5 measures.
2.3. Independent Variables
We downloaded Hispanic/Latino ethnicity by racial composition data from the American Community Survey for the years 2012-2016, which we used to calculate mutually exclusive race/ethnicity variables, for the proportions of the tract population that was Hispanic/Latino as well as non-Hispanic White, Black, American Indian, Asian, Pacific Islander or Other/Multi-race. While each of the non-Hispanic groups excludes the Hispanic/Latino population, we do not refer to those groups as “non-Hispanic” in what follows.
To examine tract-level exposure disparities based on older Hispanic/Latino and older White composition, we used data on age by sex by race to create two cross-classified variables that gauge the proportions of each tract’s Hispanic/Latino population and White population that were 65 years of age or older. We focus on the intersection of Hispanic/Latino vs. White race/ethnicity with older age in our analysis for two reasons. First, the tract-level Hispanic/Latino and White populations are the only racial/ethnic groups that are sufficiently large to do so across the US-Mexico border study area. Second, these are the only two populations for which age composition is distinguished by the ACS based on Hispanic/Latinx ethnicity and race (i.e., ACS data for age by sex do not distinguish (non)Hispanic/Latino ethnicity for non-White races).
Median household income and the proportion of renter-occupied housing units were included to represent socioeconomic status (SES). We also included median household income squared because of the potential for a non-linear relationship with air pollution exposure (Collins et al. 2017). Proportion renter-occupancy was included because it is representative of accumulated wealth and stability. A population density variable (total tract population divided by the area of the tract (sq. miles)) was also included in the models. Finally, to further control for the urban contextual effects, our models adjust for tract clustering based on the county of location and eight categories of age of housing stock.
2.4. Analysis Approach
We undertook our analysis in four steps. First, we mapped the dependent variable and key independent variables and calculated descriptive statistics for all analysis variables. Second, following methods described in Liu et al. (2021) and Collins and Grineski (2022), we calculated population-weighted mean PM2.5 long-term (2012-2016 average) and short-term (counts of days with average concentrations ≥25 and ≥35 μg/m3) exposures for the total population and our focal populations separately within each of the four US border states (CA, AZ, NM, TX). Our focal populations include people who are Hispanic/Latino (all ages), Hispanic/Latino ≥65 years of age, and White ≥65 years of age. For comparative purposes, we also calculated population-weighted mean PM2.5. exposures for White (all ages) people. Population-weighted means enable us to describe unadjusted exposures for the total and focal populations. We calculated these by: (a) multiplying the group-specific population (for the total population and for each focal group separately) in each census tract by the corresponding tract PM2.5 value (for the long-term and short-term measures separately); (b) summing the group-specific * PM2.5 measure-specific values separately for all census tracts; (c) summing the group-specific population values separately for all census tracts; and (d) dividing the values calculated in step (b) by the values calculated in step (c) separately for each group and PM2.5 measure combination. We did this separately for metropolitan census tracts in each border state (CA, AZ, NM, and TX).
Third, we performed a multivariable analysis using generalized estimating equations (GEEs). GEEs are useful for EJ research because they accommodate non-normally distributed variables and adjust for clustering (Collins et al. 2017; Grineski et al. 2017). We fit nine separate GEE models with the same model specifications. We tried all possible combinations of probability distributions and link functions to find the combination yielding the best model fit. The gamma distribution and logarithmic link function fit best for all models. The nine models consist of three subsets of three models. Each subset includes a separate model for each of the three PM2.5 measures (dependent variables). The first subset of three models includes race/ethnicity, SES, and population density variables as predictors of each dependent variable. The second subset of three models substitutes the “proportion Hispanic ≥65” variable for the “proportion Hispanic” and includes a new variable “proportion White.” The “proportion Hispanic ≥65” variable is interpretable in reference to the proportion of the Hispanic/Latino population <65 years of age, adjusting for the other variables in the model and clustering. The third subset of three models substitutes the “proportion White ≥65” variable for the “proportion Hispanic ≥65” variable and the “proportion Hispanic” variable for the “proportion White” variable. The “proportion White ≥65” variable in those 3 models is interpretable in reference to the proportion of the White population that is <65 years of age.
Fourth, to clarify the effects of key independent variables on long-term and short-term PM2.5 exposures in the GEEs, we calculated estimated marginal (EM) means. EM means provide value estimates of the dependent variables based on specified values for independent variables of interest, adjusting for covariates, clustering, and all other GEE specifications. Specifically, we calculated EM means for each PM2.5 measure at every 10th percentile (from 0th to 100th) for each race/ethnicity, older age, and each race/ethnicity by older age independent variable that was statistically significantly associated with each PM2.5 exposure measures. This included proportion Hispanic, proportion Black, proportion Asian, proportion total population ≥65, and proportion Hispanic/Latino ≥65. We used IBM SPSS Statistics v25 to conduct the analyses.
3. Results
3.1. Univariate Results
The three dependent variables mapped in Figure 1 show similar general patterns, although the long-term exposure variable (i.e., 2012-2016 mean PM2.5) displays more gradual spatial variation while the two short-term pollution exposure variables (i.e., number of days from 2012-2016 with PM2.5 ≥25 μg/m3 or ≥35 μg/m3) have more concentrated high values. The highest values are in the census tracts of the largest metropolitan areas along the border (San Diego, Imperial Valley, El Paso, and Brownsville); this is except for the count of days with a PM2.5 concentration ≥35 μg/m3, for which tracts in Brownsville have zero values. Within the large metropolitan areas, values are highest in urban centers and tend to decrease moving outward within metropolitan areas. While San Diego census tracts have the highest long-term PM2.5 concentrations, El Paso tracts exhibit the greatest number of days with PM2.5 concentrations exceeding the two short-term thresholds (i.e., 24-hour mean ≥25 μg/m3 or ≥35 μg/m3). Although California’s Imperial Valley is not a large population center, metropolitan tracts there exhibit high PM2.5 across all three variables, which is partly attributable to the nearby Mexican metropolis of Mexicali.
Maps of focal independent variables are displayed in Figure 2. Census tracts with the highest proportion of Hispanic/Latino residents were concentrated most heavily in Texas. Tracts in New Mexico, Arizona, and California had lower proportion Hispanic/Latino except for small clusters in San Diego, Imperial Valley, and Tucson. This pattern changes for the proportion Hispanic ≥65, with higher proportion tracts observed in all border states. For the proportion White ≥65, the pattern appears more random, with higher proportion tracts spread across the border region.
Descriptive statistics for each analysis variable are in Table 1. Our long-term air pollution dependent variable, mean PM2.5 (concentration in μg/m3), ranged from 5.735 to 9.916 with a mean of 8.675. Our first acute pollution variable, number of days with a 24-hour mean PM2.5 concentration ≥25 µg/m3, ranged from 0-20, with a mean of 7.010. Our second acute pollution variable, number of days with PM2.5 ≥35 µg/m3, had values ranging from 0-6 and a mean of 0.950. For our focal independent variables, proportion Hispanic ranged from 0.014-1 with a mean of 0.546, proportion Hispanic/Latino ≥65 had a range of 0-0.694 and a mean of 0.092, and proportion White ≥65 ranged from 0-1 with a mean of 0.234.
3.2. Population-Weighted Mean PM2.5 Results
Table 2 reports population-weighted mean exposure values for each of the three dependent variables for the total population and focal groups by US border state. Differences in population exposures between states for all three dependent variables were notable. California had the highest average total population exposure to mean PM2.5 (>9 µg/m3), followed by Texas (>8 µg/m3), New Mexico (>7 µg/m3), and Arizona (>6 µg/m3). The same pattern between states held for the two acute dependent variables. Differences in exposures between subgroups of focus within states were relatively small, but consistent across each states and measure of PM2.5. Specifically, Hispanic populations had higher, while White populations had lower, exposures to PM2.5 than the total population. Similarly, we found that Hispanic population ≥65 had higher, while the White population ≥65 had lower, exposure to PM2.5 than the total population.
3.3. Multivariable GEE Model Results
Table 3 includes results from the nine GEE models. For the base model variables, we found that increases in the proportions of the population that were Hispanic, Black, Asian, and ≥65, as well as housing units that were Renter Occupied, were associated with significant increases in PM2.5 values across the three dependent variables. This was with the exceptions of the proportion ≥65 for mean PM2.5 and the proportion Black for number of days with PM2.5 ≥35 µg/m3, both of which exhibited positive but statistically non-significant associations.
Exponentiated beta values (see Exp(B) column, Table 3) provide percentage increases or decreases in the dependent variable range based on the independent variable to assist with relative and comparative interpretation of GEE results. As the proportion of Hispanic/Latino residents increased by one standard deviation, Mean PM2.5 increased by 1.5% (B=0.015; 95% CI=0.008 to 0.022), the number of days with PM2.5 ≥25 µg/m3 increased by 23.4% (0.210; 0.123 to 0.297), and the number of days with PM2.5 ≥35 µg/m3 increased by 38.9% (0.329; 0.200 to 0.457). As the proportion Black increased, Mean PM2.5 increased by 0.6% (0.006; 0.003 to 0.008), and the number of days with PM2.5 ≥25 µg/m3 increased by 5.5% (0.053; 0.020 to 0.087). As the proportion Asian increased, Mean PM2.5 increased by 0.7% (0.007; 0.006 to 0.009), the number of days with PM2.5 ≥25 µg/m3 increased by 7.3% (0.070; 0.052 to 0.088), and the number of days with PM2.5 ≥35 µg/m3 increased by 12.7% (0.120; 0.080 to 0.159). As the proportion of the total population ≥65 years of age increased, the number of days with PM2.5 ≥25 µg/m3 increased by 0.2% (0.057; 0.019 to 0.094), and the number of days with PM2.5 ≥35 µg/m3 increased by 5.8% (0.076; 0.031 to 0.120). As the proportion of renter-occupied housing units increased, Mean PM2.5 increased by 0.8% (0.008; 0.004 to 0.012), the number of days with PM2.5 ≥25 µg/m3 increased by 21.8% (0.197; 0.141 to 0.253), and the number of days with PM2.5 ≥35 µg/m3 increased by 24.7% (0.221; 0.162 to 0.280). An isolated finding was that as the proportion Pacific Islander increased, the number of days with PM2.5 ≥25 µg/m3 increased by 1.3% (0.013; 0.002 to 0.024).
Additionally, we found a significant and positive association between median household income and each of the PM2.5 measures, such that higher income was associated with increased exposure. The effect was nonlinear in the case of the number days with PM2.5 ≥35 µg/m3, such that there was a slight decline in that acute exposure measure at the highest levels of median household income. Adjusting for other variables in the GEEs, the population density control had relatively weak positive associations with the PM2.5 measures.
Continuing with Table 3 in three models using the older Hispanic/Latino variables, we found that a standard deviation increase in the proportion of Hispanic/Latino residents ≥65 years of age was associated with a 0.1% increase in Mean PM2.5 (0.001; 0.000 to 0.002), a 5.9% increase in the number of days with PM2.5 ≥25 µg/m3 (0.058; 0.032 to 0.084), and a 5.1% increase in the number of days with PM2.5 ≥35 µg/m3 (0.050; 0.016 to 0.083). The results for proportion Hispanic ≥65 are in reference to the proportion of the Hispanic population <65 years of age. We also found an inverse relationship between the proportion of White residents and PM2.5 values. That is, as the proportion White increased, Mean PM2.5 exposure decreased by 1.1% (-0.011; -0.017 to -0.006), the number of days with PM2.5 ≥25 µg/m3 decreased by 86.1% (-0.150; -0.22 to -0.080), and the number of days with PM2.5 ≥35 µg/m3 decreased by 78.6% (-0.241; -0.341 to -0.142). We found that the associations between the proportion of White residents ≥65 years age and PM2.5 exposures were not statistically significant. Results for the proportion White ≥65 variable are in reference to the proportion of White population <65.
The EM means results help describe the associations for the race/ethnicity, older age, and race/ethnicity by older age variables exhibiting statistically significant associations with the PM2.5 measures. Figure 3 graphs EM means for those variables (derived from the GEE results in Table 3) holding the other independent variables at their means. Results show significant spikes in exposure for all three PM2.5 exposure dependent variables past the 90th percentile for the proportions Black, Asian, 65 and Over, and Hispanic 65 and Over variables. As the proportion Hispanic increased, there was a steady increase in PM2.5 exposure for all three dependent variables. As the proportion White increased, there was a steady decrease in PM2.5 exposure for all three dependent variables.
4. Discussion
In response to our first research question—What are the associations of race/ethnicity and age with long-term and short-term exposures to PM2.5?—we found that greater proportions of Hispanic and Asian residents in US census tracts along the Mexican border are associated with worse PM2.5 air pollution, with respect to long-term exposures (5-year mean) and short-term exposures (measured based on exceedances of WHO and NAAQS 24-hour standards applicable during the study period). A greater proportion of Black residents was associated with worse long-term exposure as well as short-term exposure using the WHO measure but not the NAAQS measure. We found that a higher proportion of Pacific Islander residents was associated with and greater short-term exposure based on the WHO measure only. Conversely, we found that a greater proportion of White residents was associated with less exposure to PM2.5, with respect to both long-term and short-term exposures. While these results generally correspond with findings from the EJ literature, the only prior study of the entirety of the US side of the US-Mexico border found increased risk to carcinogenic air pollution based on greater Hispanic/Latino composition but not based on Black, Asian, or Pacific islander composition, and it did not examine exposure disparities based on age (Rubio et al., 2022).
In terms of age, we found that an increasing proportion of older adults was associated with greater short-term PM2.5 exposures (based on both WHO and NAAQS measures), but not long-term exposure. Relationships between older age and air pollution have not been extensively examined in the EJ literature. Our findings of greater PM2.5 exposures for older adults along the US-Mexico border, however, align with results from studies of long-term carcinogenic air pollution in El Paso (Collins et al., 2011), and long-term PM10 air pollution in Phoenix (Pope et al., 2016). Given the vulnerability of older adults to the health effects of air pollution exposure (which we discuss below), and the relative lack of prior scholarship examining disparate exposures based on older age, age-based disadvantage should be more thoroughly investigated in future EJ research.
With respect to our second research question—How do race/ethnicity and older age intersect to influence long-term and short-term exposures to PM2.5?—we found that older age intersects with Hispanic/Latino status, but not White status, to increase exposures to long- and short-term PM2.5. These findings suggest that Hispanic/Latino status amplifies risks of PM2.5 exposures in older age while Whiteness protects against such risks. This is similar to the bivariate pattern found in El Paso, Texas (Collins at al., 2011) and different from the pattern observed in Harris County, Texas (Loustaunau and Chakraborty, 2019). EM Means graphed in Figure 3 clarify how increases until around the 90th percentile in the tract proportion of the Hispanic/Latino population ≥65 years of age are associated with small and gradual increases in PM2.5 exposures, with PM2.5 exposures then spiking among tracts above the 90th percentile for the proportion of the Hispanic/Latino population ≥65. This helps contextualize the GEE result by revealing that census tracts with very high proportions of older Hispanic/Latino individuals tend to experience dramatically elevated PM2.5 exposures. This pattern holds across the long- and short-term measures of PM2.5 exposure.
Based on our findings and the interpretation of similar patterns by Collins et al. (2011), we can speculate how Hispanic/Latino vs. White status intersects with older age to shape unequal exposures to long- and short-term PM2.5. In metropolitan contexts along the US side of the US-Mexico border, racial/ethnic status has intersected in complex ways with older age to shape divergent relationships with PM2.5 exposures for older Hispanic/Latino vs. older White people. First, Hispanic/Latino ethnicity is associated with significantly increased PM2.5 exposures while Anglo Whiteness is associated with significantly decreased PM2.5 exposures. Along the metropolitan US-Mexico border, higher proportions of Hispanic/Latino people tend to concentrate in central city census tracts and tracts most proximate to the Mexican border (Figure 2). In contrast, the highest proportions of Whites are located in suburban (and relatively affluent) census tracts and tracts further from the border. In particular, the higher proportions Hispanic/Latino people in barrios adjacent to city centers and nearer the border (and the lower proportions of non-Hispanic White people residing in those contexts) underlie the PM2.5 exposure disparities we found. The pattern of (poorer) racial/ethnic minority groups concentrating in city centers and (more affluent) White-Anglos residing in suburbs is common in the US. Pulido (2000) argues that this pattern is a product of the ideology of White privilege that has structured urbanization in the US, particularly following World War II, and underpins contemporary race-based environmental injustices.
Moreover, our results indicate that Hispanic/Latino ethnicity has a multiplicative influence on PM2.5 exposures while Anglo-Whiteness protects against PM2.5 exposure disparities based on older age. In other words, results indicate that disadvantages associated with older age amplify PM 2.5 exposures for Hispanic/Latino people along the metropolitan US-Mexico border, but not for White people. Specifically, a process of aging in place within central city barrios along border contributes to disparate PM2.5 exposures for census tracts with high proportions of older Hispanic/Latino people. In contrast, non-Hispanic White residents along the metropolitan US-Mexico border are more likely to concentrate in suburbs, where PM2.5 exposures are reduced. Thus, the socio-spatiality of aging along the metropolitan US-Mexico border may reinforce disparate PM2.5 exposures for older Hispanic/Latino people and alleviate exposures for older White people. We presume that, if border communities more aggressively market themselves as national retirement destinations (as Tucson, AZ; Las Cruces, NM; San Diego, CA; and McAllen, TX have successfully done), the PM2.5 exposure disparities we observed between (aging) Hispanic/Latino and (retiring) White people will widen, since new retirement communities will almost exclusively locate in suburban rather than central city areas. More research is needed to determine whether the patterns found here—in which Hispanic ethnic status intersects with older age as a risk factor while Anglo-Whiteness articulates as a protective factor—derive more from general processes that shape environmental injustices in the US or more from regional particularities.
In terms of the public health significance of these results, >60% of premature deaths from all environmental/occupational risks worldwide are attributable to PM2.5 air pollution exposures, according to the most recent Global Burden of Disease Study (IHME, 2021). And recent research has firmly established that small increases in PM2.5 at relatively low exposure levels—which characterize the exposure disparities and levels we observed here—have larger effects on negative health outcomes than small increases in PM2.5 at relatively high levels of exposure (Bowe et al., 2019; Brauer et al., 2022; Brunekreef et al., 2021; Burnett, 2018; Dominici et al., 2022; Pope et al., 2009; Yazdi et al., 2021). Additionally, the disparate PM2.5 exposures we found based on Hispanic/Latino (vs. White), older (vs. younger), and older Hispanic/Latino statuses likely underpin compounding negative health outcomes due to heightened vulnerability to PM2.5 exposures among racial/ethnic minority and older people, which is well-documented (Bowe et al., 2019; Di et al., 2017; Geldzetzer et al., 2024; Josey et al., 2023; Ma et al., 2023; Power et al., 2011; Pun et al., 2017; Spiller et al., 2021; Weuve et al., 2012; Yin et al., 2021).
It is important to note there are a few limitations of this study. First, we used aggregated (as opposed to individual) population data and measures of PM2.5 at the census tract level. Future research should analyze data for the population at an individual level, including measures of hyperlocal air pollution exposures. Additionally, our analysis cannot clarify if the disparate exposures we documented contribute to health inequities; future research that integrates health outcome data and examines those linkages is needed. Lastly, we could not include indoor, workplace, and commuting exposures in our analyses as data from the ACS identify location of residence only and available air pollution data with complete population coverage measure outdoor exposures only. Future research addressing these limitations is needed to advance fundamental knowledge of social disparities in air pollution exposures.
5. Conclusions
In sum, our findings regarding disparities based on race/ethnicity, older age, and the intersection of race/ethnicity and age in long- and short-term exposures to PM2.5 advance understanding of EJ issues at the US-Mexico border. Practical interventions to reduce these exposure disparities should focus on neighborhoods with relatively high PM2.5 exposures and high composition of social groups experiencing disparate exposures, including neighborhoods home to high concentrations of Hispanic, Asian, and Black people as well as older Hispanic/Latino people in particular. With that in mind, our analysis is useful for screening geographic areas of particular concern where high levels of PM2.5 intersect with high concentrations of such residents. For example, Figure 1 and Figure 2 reveal high exposures to long- and short-term PM2.5 as well as high composition of older Hispanic/Latino people in central El Paso (TX) census tracts. In those central El Paso neighborhoods, a substantial component of PM2.5 emissions are attributable to heavily-trafficked cross-border transportation routes spanning several major international ports of entry. In El Paso, collaborative efforts at international, federal, and local levels could most effectively reduce transportation emissions at border crossings, in order to reduce the exposure disparities that we documented here. Additionally, since the economic health cost per capita of PM2.5 exposure for the older population is ~10 times that for the younger population (Yin et al., 2021), such strategies could also focus on targeting enhanced health-care services for older Hispanic/Latino people in central El Paso neighborhoods, many of whom experience barriers to health-care access. Future research and practice could more systematically seek to identify areas where targeted interventions can most effectively address air pollution exposure disparities along the US-Mexico border and elsewhere.
Author Contributions
Conceptualization, T.W.C and C.M.C.; methodology, T.W.C.; formal analysis, T.W.C. and C.M.C.; resources, T.W.C and S.E.G.; data curation, C.M.C and T.W.C.; writing—original draft preparation, T.W.C., C.M.C., S.E.G., and M.S.; writing—review and editing, T.W.C., C.M.C., S.E.G., and M.S.; visualization, C.M.C and T.W.C.; supervision, T.W.C. and S.E.G. All authors have read and agreed to the published version of the manuscript.
Funding
This research received no external funding.
Data Availability Statement
All data used in this analysis are publicly available. Publicly archived datasets analyzed are available from: https://www.epa.gov/hesc/rsig-related-downloadable-data-files (USEPA Downscaler data for PM2.5 exposure measures), https://www.nhgis.org/ (US Census Bureau American Community Survey data from the National Historical Geographic Information System), and https://www.ers.usda.gov/data-products/rural-urban-commuting-area-codes (USDA rural-urban community area code data on metropolitan area core census tracts). Analyzed data will be made available on request.
Acknowledgments
C.M.C. acknowledges the University of Utah Undergraduate Research Opportunities Program, which supported his contribution to this research.
Conflicts of Interest
The authors declare no conflicts of interest.
References
- Berrocal, V.J.; Gelfand, A.E.; Holland, D.M. A spatio-temporal downscaler for output from numerical models. Journal of Agricultural, Biological, and Environmental Statistics 2010, 15, 176–197. [Google Scholar] [CrossRef] [PubMed]
- Berrocal, V.J.; Guan, Y.; Muyskens, A.; Wang, H.; Reich, B.J.; Mulholland, J.A.; Chang, H.H. A comparison of statistical and machine learning methods for creating national daily maps of ambient PM2.5 concentration. Atmospheric Environment 2020, 222, 117130. [Google Scholar] [CrossRef]
- Bowe, B.; Xie, Y.; Yan, Y.; Al-Aly, Z. Burden of cause-specific mortality associated with PM2.5 air pollution in the United States. JAMA Network Open 2019, 2, e1915834. [Google Scholar] [CrossRef]
- Brauer, M.; Brook, J.R.; Christidis, T.; Chu, Y.; Crouse, D.L.; Erickson, A.; ... & Burnett, R.T. Mortality–air pollution associations in low exposure environments (MAPLE): Phase 2. Research Reports: Health Effects Institute https://pmc.ncbi.nlm.nih.gov/articles/PMC9556709/pdf/hei-2022-212.pdf. 2022, 2022, 212–2022.
- Brulle, R.J.; Pellow, D.N. Environmental justice: human health and environmental inequalities. Annual review of public health 2006, 27, 103–124. [Google Scholar] [CrossRef]
- Brunekreef, B.; Strak, M.; Chen, J.; Andersen, Z.J.; Atkinson, R.; Bauwelinck, M.; ... & Hoek, G. Mortality and morbidity effects of long-term exposure to low-level PM2. 5, BC, NO2, and O3: an analysis of European cohorts in the ELAPSE project. Research Reports: Health Effects Institute 2021, 2021, 208, https://pmc.ncbi.nlm.nih.gov/articles/PMC9476567/pdf/hei-2021-208.pdf.
- Burnett, R.; Chen, H.; Szyszkowicz, M.; Fann, N.; Hubbell, B.; Pope III, C.A.; ... & Spadaro, J.V. Global estimates of mortality associated with long-term exposure to outdoor fine particulate matter. Proceedings of the National Academy of Sciences 2018, 115, 9592–9597.
- Chen, C.; Zhu, P.; Lan, L.; Zhou, L.; Liu, R.; Sun, Q.; ... & Li, T.Short-term exposures to PM2.5 and cause-specific mortality of cardiovascular health in China. Environmental Research 2018, 161, 188–194.
- Cohen, A.; M. Brauer, R. Burnett, H. Anderson, J. Frostad, K. Estep, K. Balakrishnan, B. Brunekreef, L. Dandona, R. Dandona, and V. Feigin. Estimates and 25-year trends of the global burden of disease attributable to ambient air pollution: An analysis of data from the Global Burden of Diseases Study 2015. The Lancet 2017, 389, 1907–1918.
- Collins, T.W.; Grineski, S.E.; Shaker, Y.; Mullen, C.J. Communities of color are disproportionately exposed to long-term and short-term PM2.5 in metropolitan America. Environmental Research 2022, 214, 114038. [Google Scholar] [CrossRef]
- Collins, T.W.; Grineski, S.E. Racial/ethnic disparities in short-term PM 2.5 air pollution exposures in the United States. Environmental Health Perspectives 2022, 130, 087701. [Google Scholar] [CrossRef] [PubMed]
- Collins, T.W.; Grineski, S.E.; Morales, D.X. Sexual orientation, gender, and environmental injustice: Unequal carcinogenic air pollution risks in greater Houston. Annals of the American Association of Geographers 2017, 107, 72–92. [Google Scholar] [CrossRef]
- Collins, T.W.; Grineski, S.E.; Chakraborty, J.; McDonald, Y.J. Understanding environmental health inequalities through comparative intracategorical analysis: Racial/ethnic disparities in cancer risks from air toxics in El Paso County, Texas. Health & Place 2011, 17, 335–344. [Google Scholar]
- Colmer, J.; Hardman, I.; Shimshack, J.; Voorheis, J. Disparities in PM2. 5 air pollution in the United States. Science 2020, 369, 575–578. [Google Scholar] [CrossRef] [PubMed]
- Di, Q.; Wang, Y.; Zanobetti, A.; Wang, Y.; Koutrakis, P.; Choirat, C.; ... & Schwartz, J.D. Air pollution and mortality in the Medicare population. New England Journal of Medicine 2017, 376, 2513–2522.
- Dominici, F.; Zanobetti, A.; Schwartz, J.; Braun, D.; Sabath, B.; Wu, X. Assessing adverse health effects of long-term exposure to low levels of ambient air pollution: implementation of causal inference methods. Research Reports: Health Effects Institute 2022, 2022, 211, https://pmc.ncbi.nlm.nih.gov/articles/PMC9530797/pdf/hei-2022-211.pdf. [Google Scholar]
- Fajersztajn, L.; Saldiva, P.; Pereira, L.A.A.; Leite, V.F.; Buehler, A.M. Short-term effects of fine particulate matter pollution on daily health events in Latin America: a systematic review and meta-analysis. International Journal of Public Health 2017, 62, 729–738. [Google Scholar] [CrossRef]
- Geldsetzer, P.; Fridljand, D.; Kiang, M.V.; Bendavid, E.; Heft-Neal, S.; Burke, M.; ... & Benmarhnia, T. Disparities in air pollution attributable mortality in the US population by race/ethnicity and sociodemographic factors. Nature Medicine 2024, 30, 2821–2829.
- Grineski, S.E.; Collins, T.W.; Morales, D.X. Asian Americans and disproportionate exposure to carcinogenic hazardous air pollutants: A national study. Social Science & Medicine 2017, 185, 71–80. [Google Scholar]
- Grineski, S.E.; Collins, T.W.; Ford, P.; Fitzgerald, R.; Aldouri, R.; Velázquez-Angulo, G.; ... & Lu, D. Climate change and environmental injustice in a bi-national context. Applied Geography 2012, 33, 25–35.
- Grineski, S.E.; Renteria, R.A.; Collins, T.W.; Bakian, A.V.; Bilder, D.; VanDerslice, J.A.; ... & Ramos, K.D. PM2. 5 threshold exceedances during the prenatal period and risk of intellectual disability. Journal of Exposure Science & Environmental Epidemiology 2024, 34, 861–867.
- Grineski, S.E.; Collins, T.W. Environmental injustices in transnational context: Urbanization and industrial hazards in El Paso/Ciudad Juárez. Environment and Planning A 2010, 42, 1308–1327. [Google Scholar] [CrossRef]
- Hoek, G.; R. Krishnan, R. Beelen, A. Peters, B. Ostro, B. Brunekreef, and J. Kaufman. Long-term air pollution exposure and cardio-respiratory mortality: A review. Environmental Health 2013, 12, 43. [CrossRef] [PubMed]
- IHME (Institute for Health Metrics and Evaluation). (2021). Global Burden of Disease Study 2021 Results. Retrieved from: http://ghdx.healthdata.org/gbd-results-tool (Accessed 11 April 2025).
- Jbaily, A.; Zhou, X.; Liu, J.; Lee, T.H.; Kamareddine, L.; Verguet, S.; Dominici, F. Air pollution exposure disparities across US population and income groups. Nature 2022, 601, 228–233. [Google Scholar] [CrossRef]
- Jin, X.; Fiore, A.M.; Civerolo, K.; Bi, J.; Liu, Y.; Van Donkelaar, A.; ... & Kinney, P.L. Comparison of multiple PM2.5 exposure products for estimating health benefits of emission controls over New York State, USA. Environmental Research Letters 2019, 14, 084023.
- Josey, K.P.; Delaney, S.W.; Wu, X.; Nethery, R.C.; DeSouza, P.; Braun, D.; Dominici, F. Air pollution and mortality at the intersection of race and social class. New England Journal of Medicine 2023, 388, 1396–1404. [Google Scholar] [CrossRef] [PubMed]
- Kelly, J.T.; Jang, C.; Timin, B.; Di, Q.; Schwartz, J.; Liu, Y.; ... & Bell, M.L. Examining PM2.5 concentrations and exposure using multiple models. Environmental Research 2021, 196, 110432.
- Kelly, K.E.; Jaramillo, I.C.; Quintero-Núñez, M.; Wagner, D.A.; Collins, K.; Meuzelaar, H.L.; Lighty, J.S. Low-wind/high particulate matter episodes in the Calexico/Mexicali region. Journal of the Air & Waste Management Association 2010, 60, 1476–1486. [Google Scholar]
- Lara-Valencia, F.; Declet-Barreto, J.; Keys, E. Spatial equity and transportation hazard along cross-border trade corridors: The case of Ambos Nogales. Journal of Borderlands Studies 2008, 23, 1–18. [Google Scholar] [CrossRef]
- Lara-Valencia, F.; Harlow, S.D.; Lemos, M.C.; Denman, C.A. Equity dimensions of hazardous waste generation in rapidly industrialising cities along the United States–Mexico border. Journal of Environmental Planning and Management 2009, 52, 195–216. [Google Scholar] [CrossRef]
- Lauer, F.T.; Mitchell, L.A.; Bedrick, E.; McDonald, J.D.; Lee, W.Y.; Li, W.W.; ... & Currey, R. Temporal–spatial analysis of US–Mexico border environmental fine and coarse PM air sample extract activity in human bronchial epithelial cells. Toxicology and Applied Pharmacology 2009, 238, 1–10.
- Liévanos, R.S. Race, deprivation, and immigrant isolation: The spatial demography of air-toxic clusters in the continental United States. Social Science Research 2015, 54, 50–67. [Google Scholar] [CrossRef]
- Liu, J.; Clark, L.P.; Bechle, M.J.; Hajat, A.; Kim, S.Y.; Robinson, A.L.; ... & Marshall, J.D. Disparities in air pollution exposure in the United States by race/ethnicity and income, 1990–2010. Environmental Health Perspectives 2021, 129, 127005.
- Loustaunau, M.G.; Chakraborty, J. Vehicular air pollution in Houston, Texas: an intra-categorical analysis of environmental injustice. International Journal of Environmental Research and Public Health 2019, 16, 2968. [Google Scholar] [CrossRef]
- Ma, Y.; Zang, E.; Opara, I.; Lu, Y.; Krumholz, H.M.; Chen, K. Racial/ethnic disparities in PM2. 5-attributable cardiovascular mortality burden in the United States. Nature Human Behaviour 2023, 7, 2074–2083. [Google Scholar] [CrossRef]
- Malin, S.A.; Ryder, S.S. Developing deeply intersectional environmental justice scholarship. Environmental Sociology 2018, 4, 1–7. [Google Scholar] [CrossRef]
- Mohai, P.; Pellow, D.; Roberts, J.T. Environmental justice. Annual review of environment and resources 2009, 34, 405–430. [Google Scholar] [CrossRef]
- Mullen, C.; S. Grineski, T. Collins, W. Xing, K. Kelly, R. Whitaker, T. Sayahi, T. Becnel, P. Goffin, P. Gaillardon, and M. Meyer. Patterns of distributive environmental inequity under different PM2.5 air pollution scenarios for Salt Lake County public schools. Environmental Research 2020, 186, 109543.
- Nadybal, S.; Grineski, S.; Collins, T.; Castor, A.; Flores, A.; Griego, A.; Mullen, C.; and Rubio, R. (2020). Environmental justice in the US and beyond: Frameworks, evidence, and social action. In Geographies of Behavioral Health, Crime, and Disorder, Lersch, K.; and Chakraborty, J. (Ed.) (pp. 187-209). New York: Springer.
- O’Dell, K.; Ford, B.; Fischer, E.V.; Pierce, J.R. Contribution of wildland-fire smoke to US PM2. 5 and its influence on recent trends. Environmental Science & Technology 2019, 53, 1797–1804. [Google Scholar]
- Ordieres, J.B.; Vergara, E.P.; Capuz, R.S.; Salazar, R.E. Neural network prediction model for fine particulate matter (PM2.5) on the US–Mexico border in El Paso (Texas) and Ciudad Juárez (Chihuahua). Environmental Modelling & Software 2005, 20, 547–559. [Google Scholar]
- Orellano, P.; Reynoso, J.; Quaranta, N.; Bardach, A.; Ciapponi, A. Short-term exposure to particulate matter (PM10 and PM2.5), nitrogen dioxide (NO2), and ozone (O3) and all-cause and cause-specific mortality: Systematic review and meta-analysis. Environment International 2020, 142, 105876. [Google Scholar] [CrossRef]
- Pope, R.; Wu, J.; Boone, C. Spatial patterns of air pollutants and social groups: a distributive environmental justice study in the phoenix metropolitan region of USA. Environmental Management 2016, 58, 753–766. [Google Scholar] [CrossRef] [PubMed]
- Pope III, C.A.; Burnett, R.T.; Krewski, D.; Jerrett, M.; Shi, Y.; Calle, E.E.; Thun, M.J. Cardiovascular mortality and exposure to airborne fine particulate matter and cigarette smoke: shape of the exposure-response relationship. Circulation 2009, 120, 941–948. [Google Scholar] [CrossRef] [PubMed]
- Power, M.C.; Weisskopf, M.G.; Alexeeff, S.E.; Coull, B.A.; Spiro III, A.; Schwartz, J. Traffic-related air pollution and cognitive function in a cohort of older men. Environmental Health Perspectives 2011, 119, 682–687. [Google Scholar] [CrossRef]
- Pun, V.C.; Kazemiparkouhi, F.; Manjourides, J.; Suh, H.H. Long-term PM2.5 exposure and respiratory, cancer, and cardiovascular mortality in older US adults. American Journal of Epidemiology 2017, 186, 961–969. [Google Scholar] [CrossRef]
- Quintana, P.J.; Dumbauld, J.J.; Garnica, L.; Chowdhury, M.Z.; Velascosoltero, J.; Mota-Raigoza, A.; ... & Irby, T. Traffic-related air pollution in the community of San Ysidro, CA, in relation to northbound vehicle wait times at the US–Mexico border Port of Entry. Atmospheric Environment 2014, 88, 353–361.
- Rubio, R.; Grineski, S.; Collins, T.; Morales, D.X. Ancestry-based intracategorical injustices in carcinogenic air pollution exposures in the United States. Society & Natural Resources 2020, 33, 987–1005. [Google Scholar]
- Rubio, R.; Grineski, S.; Collins, T. Carcinogenic air pollution along the United States’ southern border: neighborhood inequities in risk. Environmental Research 2022, 212, 113251. [Google Scholar] [CrossRef]
- Spiller, E.; Proville, J.; Roy, A.; Muller, N.Z. Mortality risk from PM 2.5: a comparison of modeling approaches to identify disparities across racial/ethnic groups in policy outcomes. Environmental Health Perspectives 2021, 129, 127004. [Google Scholar] [CrossRef]
- Tessum, C.W.; Paolella, D.A.; Chambliss, S.E.; Apte, J.S.; Hill, J.D.; Marshall, J.D. PM2.5 polluters disproportionately and systemically affect people of color in the United States. Science Advances 2021, 7, eabf4491. [Google Scholar] [CrossRef]
- USDA (United States Department of Agriculture). 2019. 2010 Rural-urban commuting area codes. Retrieved from: https://www.ers.usda.gov/data-products/rural-urban-commuting-area-codes/ (11 April 2025).
- USEPA (United States Environmental Protection Agency). 2025. Fused Air Quality Surface Using Downscaling (FAQSD) Files, Downscaling Output Files. Retrieved from: https://www.epa.gov/hesc/rsig-related-downloadable-data-files (11 April 2025).
- USEPA (United States Environmental Protection Agency). 2012. Revised Air Quality Standards For Particle Pollution And Updates To The Air Quality Index (AQI). Office of Air Quality Planning and Standards. Retrieved from: https://www.epa.gov/sites/production/files/2016-04/documents/2012_aqi_factsheet.pdf (11 April 2025).
- Weuve, J.; Puett, R.C.; Schwartz, J.; Yanosky, J.D.; Laden, F.; Grodstein, F. Exposure to particulate air pollution and cognitive decline in older women. Archives of Internal Medicine 2012, 172, 219–227. [Google Scholar] [CrossRef] [PubMed]
- WHO. 2006. Air Quality Guidelines for Particulate Matter, Ozone, Nitrogen Dioxide and Sulfur Dioxide: Global update 2005 – Summary of risk assessment. Copenhagen, Denmark: World Health Organization.
- Yazdi, M.D.; Wang, Y.; Di, Q.; Requia, W.J.; Wei, Y.; Shi, L.; ... & Schwartz, J.D.Long-term effect of exposure to lower concentrations of air pollution on mortality among US Medicare participants and vulnerable subgroups: a doubly-robust approach. The Lancet Planetary Health 2021, 5, e689–e697.
- Yin, H.; Brauer, M.; Zhang, J.J.; Cai, W.; Navrud, S.; Burnett, R.; ... & Liu, Z. Population ageing and deaths attributable to ambient PM2.5 pollution: a global analysis of economic cost. The Lancet Planetary Health 2021, 5, e356–e367.
- Yu, W.; Xu, R.; Ye, T.; Abramson, M.J.; Morawska, L.; Jalaludin, B.; ... & Guo, Y. Estimates of global mortality burden associated with short-term exposure to fine particulate matter (PM2.5). The Lancet Planetary Health 2024, 8, e146–e155.
Figure 1.
Census tract-level maps of the study area and dependent variables, 2012-2016: (a) Study area, (b) Mean PM2.5 exposure (long-term), (c) Number of days with PM2.5 concentration ≥25 μg/m3 (short-term), and (d) Number of days with PM2.5 concentration ≥35 μg/m3 (short-term). Note: To facilitate visualization, the map includes pollution values for non-metropolitan core area tracts, which are excluded from the statistical analyses (n=1502).
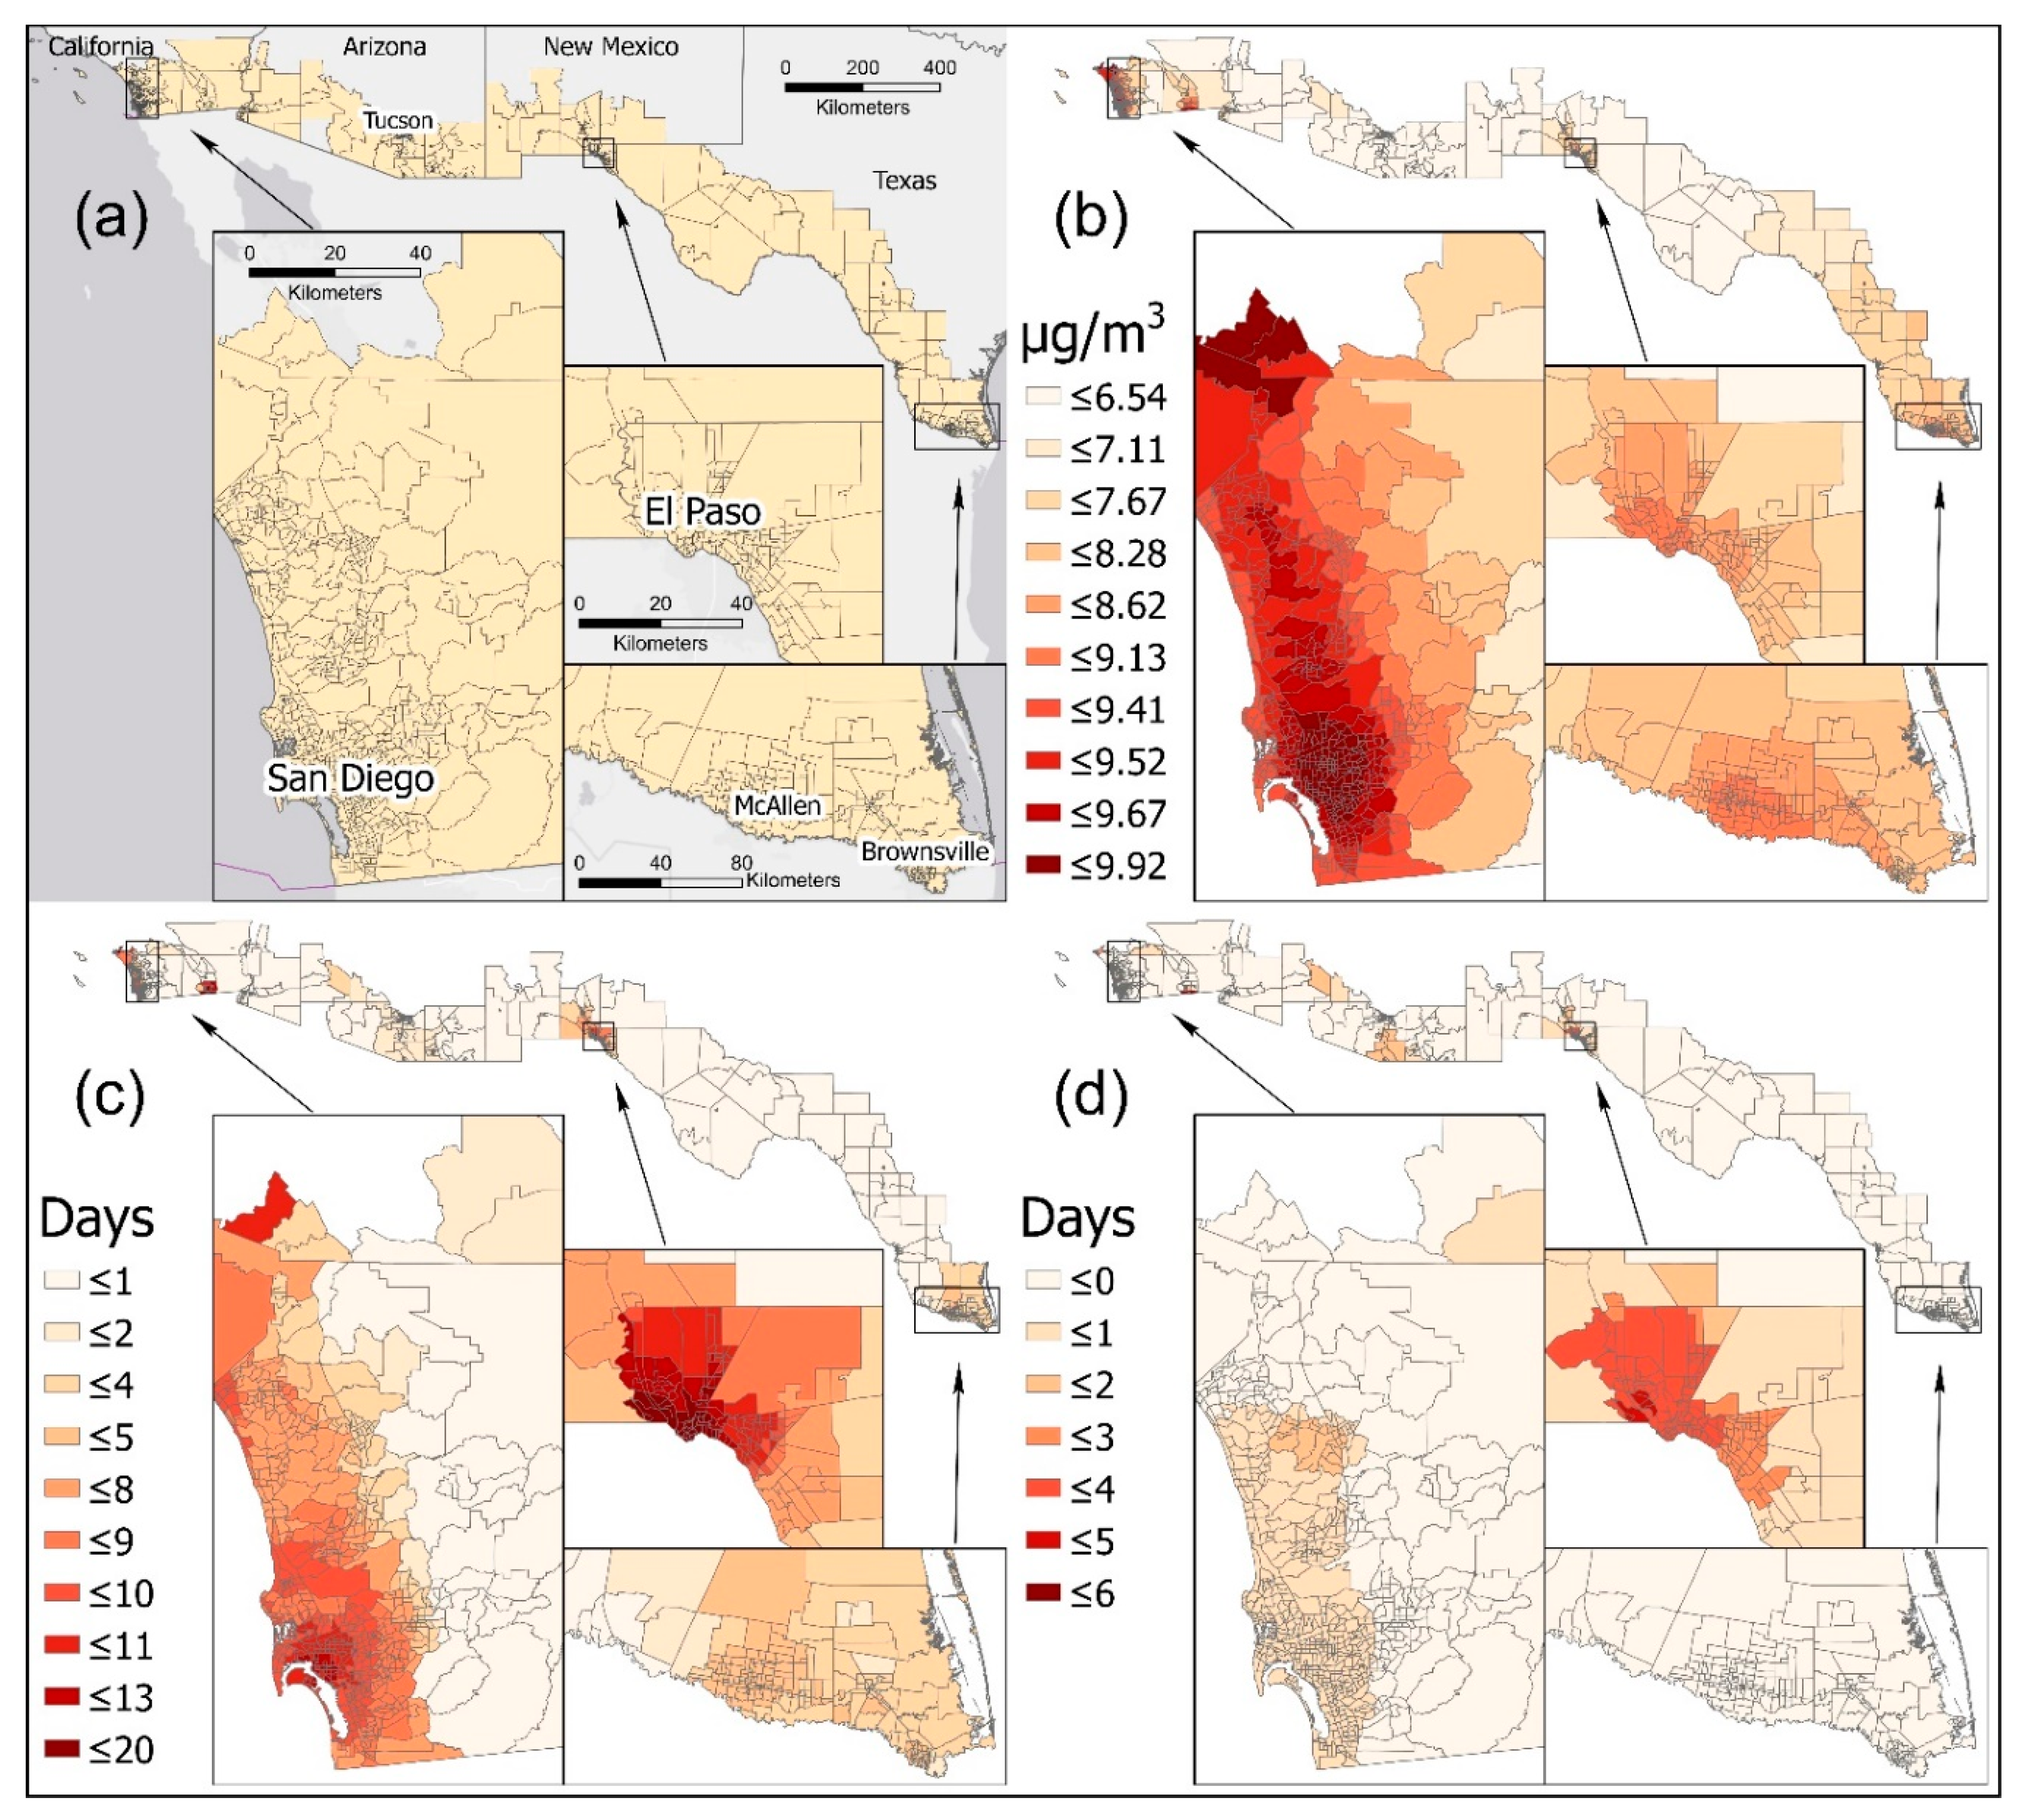
Figure 2.
Census tract-level maps of focal independent variables, 2012-2016: (a) Proportion Hispanic/Latino, (b) Proportion of the Hispanic/Latino population ≥65 years of age, (c) Proportion of the non-Hispanic White population ≥65 years of age. Note: To facilitate visualization, the map includes values for non-metropolitan core area tracts, which are excluded from the statistical analyses (n=1502).
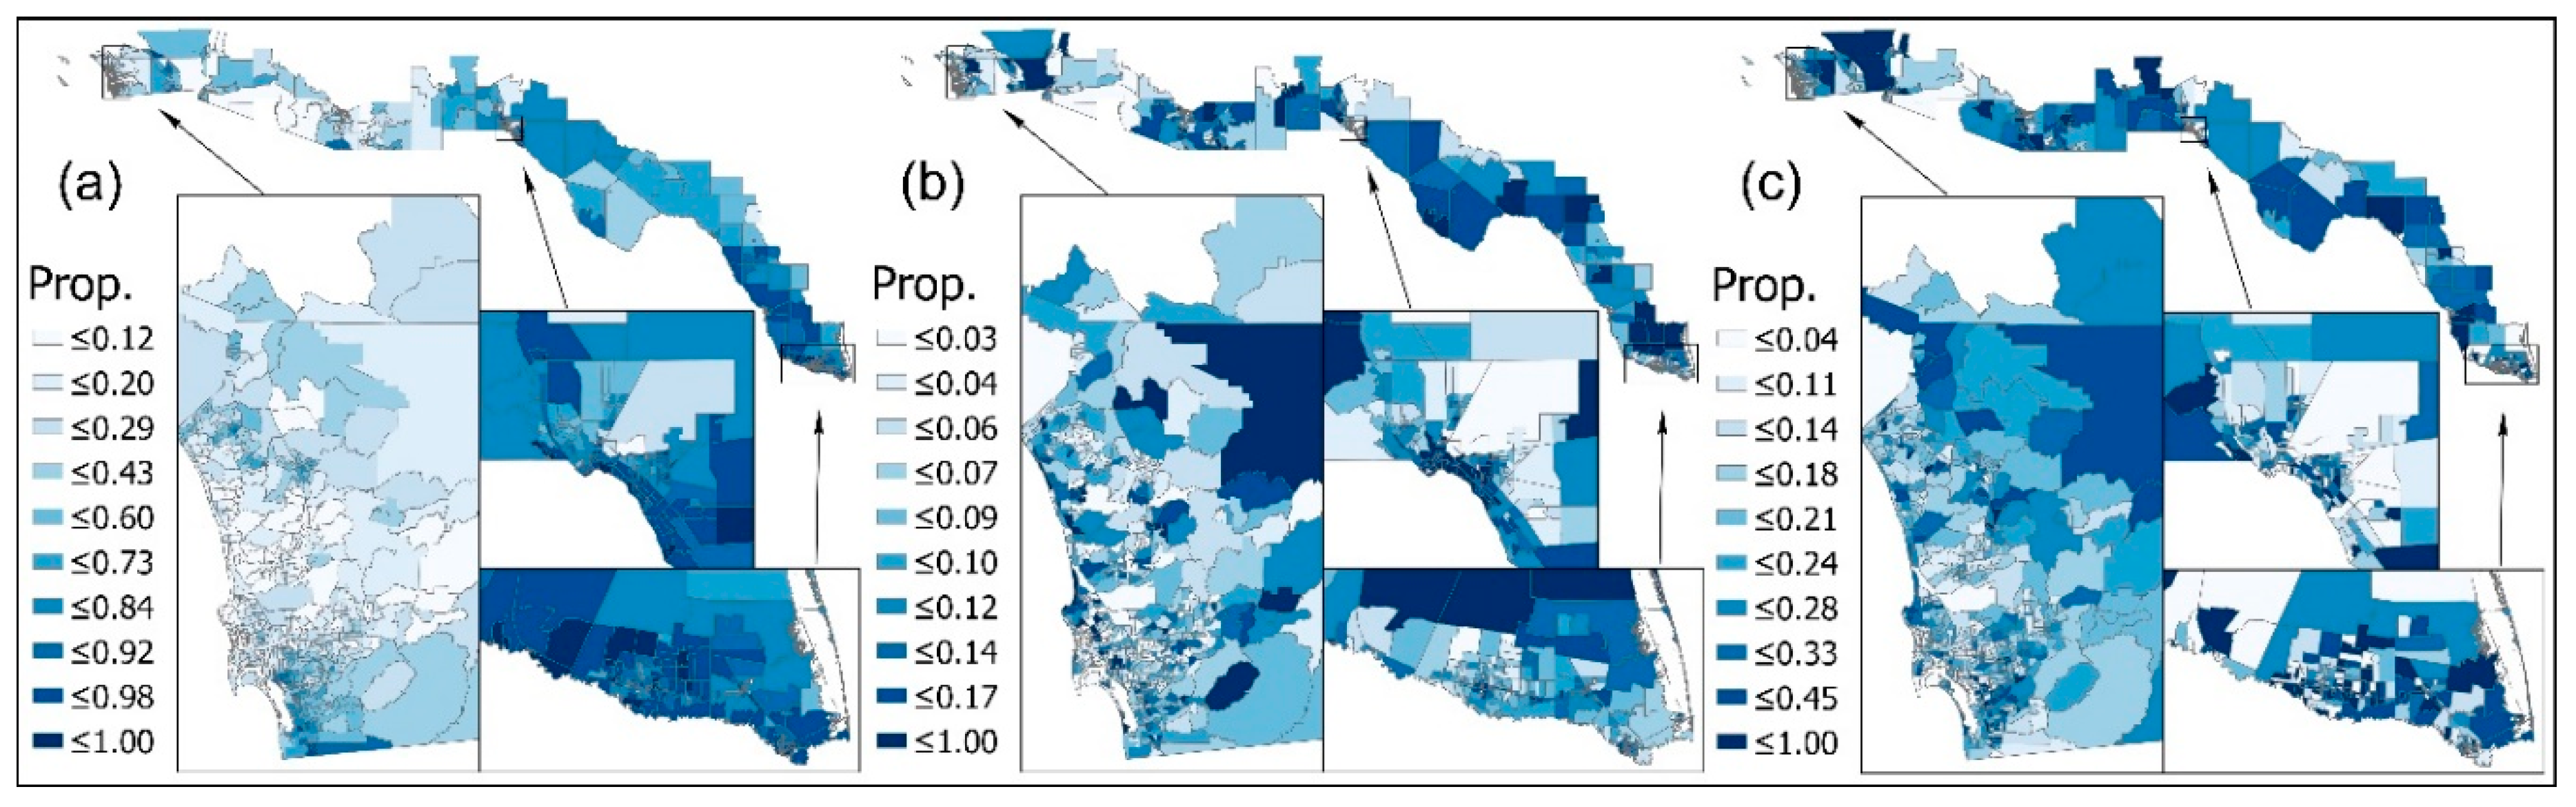
Figure 3.
Estimated marginal means of the PM2.5 measures based on significant race/ethnicity, older age, and race/ethnicity by older age variables in percentiles, 2012-2016 (n=1208 census tracts). Note: Values derived from Table 3 and predicted holding each other independent variable in the generalized estimating equations at its mean.
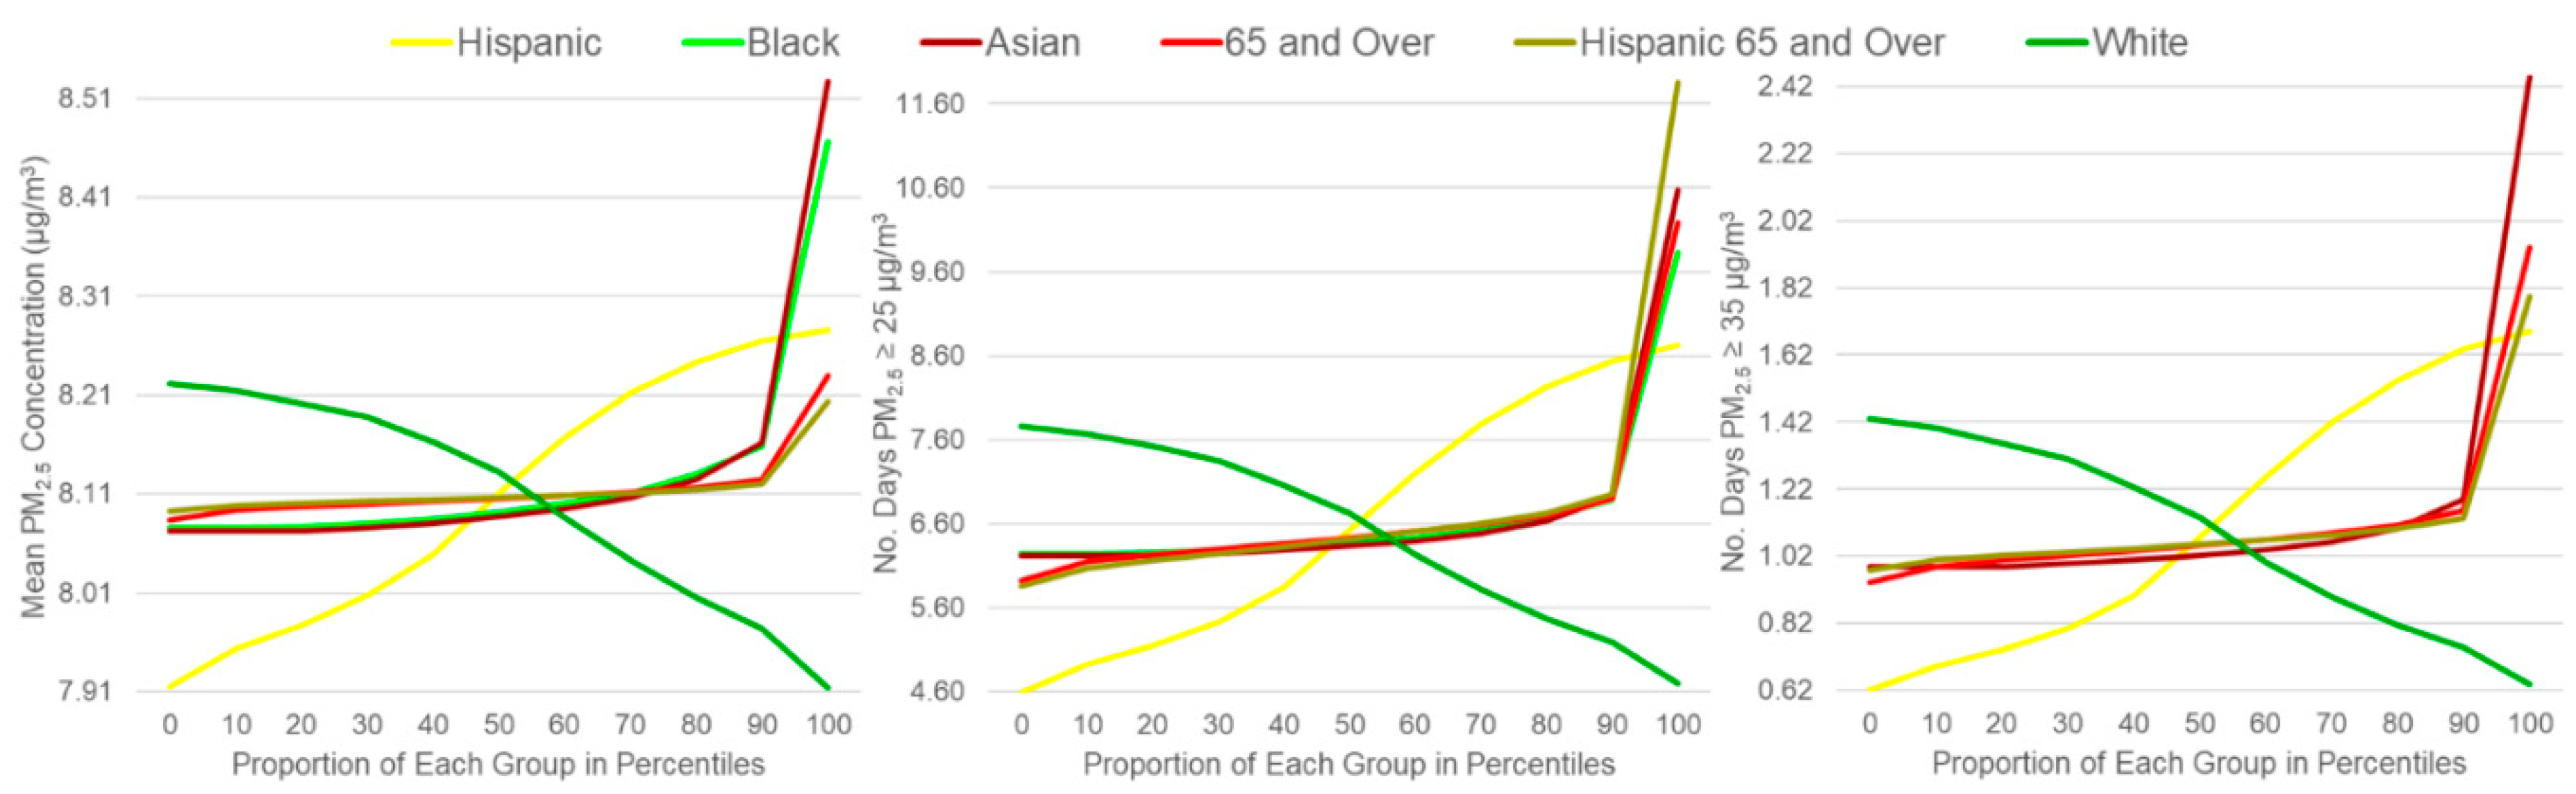

Table 1.
Descriptive statistics for variables analyzed, 2012-2016 (n=1208 census tracts).
| Analysis Variable | Min.–Max. | Mean (Std. Dev.) |
|---|---|---|
| Dependent Variables | ||
| Mean PM2.5 (μg/m3) | 5.735-9.916 | 8.675 (1.023) |
| Number of days PM2.5 ≥25 µg/m3 | 0-20 | 7.010 (3.983) |
| Number of days PM2.5 ≥35 µg/m3 | 0-6 | 0.950 (1.189) |
| Independent Variables | ||
| Prop. Hispanic ≥65 years of age | 0.000-0.694 | 0.092 (0.057) |
| Prop. White ≥65 years of age | 0.000-1.000 | 0.234 (0.167) |
| Prop. Hispanic | 0.014-1.000 | 0.546 (0.323) |
| Prop. White (non-Hispanic) | 0.000-0.918 | 0.336 (0.275) |
| Prop. Black (non-Hispanic) | 0.000-0.373 | 0.031 (0.044) |
| Prop. American Indian (non-Hispanic) a | 0.000-0.646 | 0.005 (0.029) |
| Prop. Asian (non-Hispanic) | 0.000-0.717 | 0.058 (0.095) |
| Prop. Pacific Islander (non-Hispanic) b | 0.000-0.074 | 0.002 (0.007) |
| Prop. Other/Multi-Race (non-Hispanic) | 0.000-0.112 | 0.021 (0.021) |
| Prop. Total Population ≥65 years of age | 0.011-0.753 | 0.143 (0.077) |
| Median Household Income (2016 US $) | 11,497-185,724 | 56,144.073 (29464.540) |
| Prop. Renter Occupancy | 0.034-0.945 | 0.428 (0.216) |
| Population Density (people per sq. mile) | 7.740-50,077.918 | 5,544.455 (4820.609) |
a Includes Alaska Native. b Includes Native Hawaiian.
Table 2.
Metropolitan population-weighted mean PM2.5 exposures by focal group and US-Mexico border state, 2012-2016.
Table 2.
Metropolitan population-weighted mean PM2.5 exposures by focal group and US-Mexico border state, 2012-2016.
| Focal Group by State | Mean PM2.5 (μg/m3) | Number of days PM2.5 ≥25 µg/m3 | Number of days PM2.5 ≥35 µg/m3 |
|---|---|---|---|
| California | |||
| Total Population | 9.470 | 8.239 | 0.822 |
| White | 9.438 | 7.846 | 0.756 |
| Hispanic | 9.479 | 8.602 | 0.925 |
| White ≥65 years | 9.432 | 7.745 | 0.751 |
| Hispanic ≥65 years | 9.465 | 9.102 | 1.071 |
| Arizona | |||
| Total Population | 6.489 | 1.838 | 0.451 |
| White | 6.342 | 1.771 | 0.373 |
| Hispanic | 6.631 | 1.914 | 0.541 |
| White ≥65 years | 6.284 | 1.689 | 0.533 |
| Hispanic ≥65 years | 6.600 | 1.912 | 0.602 |
| New Mexico | |||
| Total Population | 7.199 | 4.273 | 1.490 |
| White | 7.018 | 3.298 | 1.260 |
| Hispanic | 7.277 | 4.736 | 1.587 |
| White ≥65 years | 6.911 | 3.078 | 1.160 |
| Hispanic ≥65 years | 7.254 | 4.677 | 1.542 |
| Texas | |||
| Total Population | 8.166 | 5.556 | 0.961 |
| White | 8.086 | 6.299 | 1.353 |
| Hispanic | 8.173 | 5.412 | 0.890 |
| White ≥65 years | 8.143 | 5.701 | 0.994 |
| Hispanic ≥65 years | 8.175 | 5.708 | 1.033 |
Table 3.
Results of generalized estimating equations predicting PM2.5 exposure measures for metropolitan US-Mexico border census tracts, 2012-2016 (n=1208 census tracts).
Table 3.
Results of generalized estimating equations predicting PM2.5 exposure measures for metropolitan US-Mexico border census tracts, 2012-2016 (n=1208 census tracts).
| (a) Mean PM2.5 (μg/m3) b | (b) Number of days PM2.5 ≥25 µg/m3 c | (c) Number of days PM2.5 ≥35 µg/m3 c | |||||||
|---|---|---|---|---|---|---|---|---|---|
| Parameter a | B (95% CI) | Exp(B) | p | B (95% CI) | Exp(B) | p | B (95% CI) | Exp(B) | p |
| Base Model Variables | |||||||||
| Intercept | 2.093 (2.060, 2.125) | 8.108 | <0.001 | 1.871 (1.716, 2.026) | 6.493 | <0.001 | 0.063 (-0.210, 0.337) | 1.065 | 0.649 |
| Prop. Hispanic/Latino | 0.015 (0.008, 0.022) | 1.015 | <0.001 | 0.210 (0.123, 0.297) | 1.234 | <0.001 | 0.329 (0.200, 0.457) | 1.389 | <0.001 |
| Prop Black | 0.006 (0.003, 0.008) | 1.006 | <0.001 | 0.053 (0.020, 0.087) | 1.055 | 0.002 | 0.027 (-0.017, 0.072) | 1.028 | 0.230 |
| Prop. American Indian | -0.003 (-0.009, 0.002) | 0.997 | 0.242 | -0.034 (-0.095, 0.027) | 0.967 | 0.277 | 0.012 (-0.048, 0.071) | 1.012 | 0.697 |
| Prop. Asian | 0.007 (0.006, 0.009) | 1.007 | <0.001 | 0.070 (0.052, 0.088) | 1.073 | <0.001 | 0.120 (0.080, 0.159) | 1.127 | <0.001 |
| Prop. Pacific Islander | 0.000 (-0.001, 0.001) | 1.000 | 0.557 | 0.013 (0.002, 0.024) | 1.013 | 0.016 | -0.019 (-0.045, 0.007) | 0.981 | 0.147 |
| Prop. Other/Multi-Race | 0.000 (-0.004, 0.005) | 1.000 | 0.850 | -0.006 (-0.054, 0.042) | 0.994 | 0.794 | -0.060 (-0.131, 0.011) | 0.942 | 0.096 |
| Prop. Total Pop. ≥65 years | 0.002 (-0.001, 0.005) | 1.002 | 0.182 | 0.057 (0.019, 0.094) | 1.058 | 0.003 | 0.076 (0.031, 0.120) | 1.079 | 0.001 |
| Med. Household Income | 0.015 (0.0062, 0.003) | 1.016 | 0.013 | 0.471 (0.303, 0.639) | 1.602 | <0.001 | 0.458 (0.250, 0.665) | 1.580 | <0.001 |
| Med. Household Income (sq.) | -0.006 (-0.014, 0.002) | 0.994 | 0.119 | -0.186 (-0.305, -0.067) | 0.830 | 0.002 | -0.126 (-0.256, 0.004) | 0.881 | 0.058 |
| Prop. Renter Occupancy | 0.008 (0.004, 0.012) | 1.008 | <0.001 | 0.197 (0.141, 0.253) | 1.218 | <0.001 | 0.221 (0.162, 0.280) | 1.247 | <0.001 |
| Population Density | 0.000 (-0.001, 0.002) | 1.000 | 0.841 | 0.041 (0.001, 0.081) | 1.042 | 0.044 | 0.041 (0.002, 0.081) | 1.042 | 0.039 |
| Older Hispanic/Latino Variablese | |||||||||
| Prop. Hispanic/Latino ≥65 e | 0.001 (0.000, 0.002) | 1.001 | 0.031 | 0.058 (0.032, 0.084) | 1.059 | <0.001 | 0.050 (0.016, 0.083) | 1.051 | 0.004 |
| Prop White e | -0.011 (-0.017, -0.006) | 0.989 | <0.001 | -0.150 (-0.22, -0.080) | 0.861 | <0.001 | -0.241 (-0.341, -0.142) | 0.786 | <0.001 |
| Older White Variablef | |||||||||
| Prop. White ≥65 g | 0.002 (0.000, 0.004) | 0.060 | 0.025 (-0.004, 0.055) | 0.093 | 0.044 (-0.003, 0.090) | 0.066 | |||
Notes: a Each independent variable is standardized. b Model (a) uses an exchangeable correlation matrix, gamma distribution and log link function, and adjusts for clustering by county and age of housing stock; reference for the race/ethnicity variables is Prop. White; reference for Prop. Total Pop. ≥65 years is Prop Total Pop. <65 years; reference for Prop. Renter Occupancy is Prop Owner Occupancy. c Models (b) and (c) use an exchangeable correlation matrix, negative binomial distribution and log link function, and adjust for clustering by county and housing age. d Separate model results with Prop. Hispanic/Latino replaced by the Prop. Hispanic/Latino ≥65 and Prop. White variables and otherwise identical specifications to base model; associations for Percent Renter Occupancy, Median Household Income (quadratic), and Population Density are the same in terms of direction and significance. e Reference: Prop. Hispanic <64 years of age. f Separate model results including the Prop. White ≥65 variable and otherwise identical specifications to base model; associations for Percent Renter Occupancy, Median Household Income (quadratic), and Population Density are the same in terms of direction and significance. g Reference: Prop. White age 64 and less.
Disclaimer/Publisher’s Note: The statements, opinions and data contained in all publications are solely those of the individual author(s) and contributor(s) and not of MDPI and/or the editor(s). MDPI and/or the editor(s) disclaim responsibility for any injury to people or property resulting from any ideas, methods, instructions or products referred to in the content. |
© 2025 by the authors. Licensee MDPI, Basel, Switzerland. This article is an open access article distributed under the terms and conditions of the Creative Commons Attribution (CC BY) license (http://creativecommons.org/licenses/by/4.0/).
Copyright: This open access article is published under a Creative Commons CC BY 4.0 license, which permit the free download, distribution, and reuse, provided that the author and preprint are cited in any reuse.


