
Submitted:
19 April 2025
Posted:
21 April 2025
You are already at the latest version
Abstract
The Luki Biosphere Reserve landscape is located in the southwest of the Democratic Republic of Congo. Illicit anthropogenic activities in this landscape have contributed to the degradation of forest massifs, which are edible caterpillar habitats. Accordingly, based on five Landsat images covering the period from 2004 to 2024, we analysed the dynamics of edible caterpillar habitats in the Luki Biosphere Reserve, its periphery, and the landscape. The study was complemented by the calculation of class area, number of class patches, dominance, and disturbance index. The results show that fragmentation and attrition have caused forest areas to decline by 46.13%, 21.17%, and 23.54% in the Reserve, its periphery, and at the landscape level, respectively. The dynamics of caterpillar habitats are reflected in the replacement of forest and fallow land by savannah. Consequently, the level of disturbance has risen from 0.3 to 1.6 in the Reserve, from 2.5 to 13.9 in the periphery, and from 2.0 to 9.2 on a landscape scale. These results are mainly attributed to the expansion of agricultural land. Our observations imply an extent of disturbance in caterpillar habitats that might cause their scarcity, and strongly indicates the need for promoting effective strategies for preserving and restoring forest ecosystems in this landscape.
Keywords:
Anthropization
; Biodiversity
; Ecosystem
; Food security
; Luki Biosphere Reserve
1. Introduction
Human action on natural landscapes inevitably leads to spatiotemporal disturbances, whose magnitude may compromise ecosystem health [1]. Particularly, in forest landscapes, such disturbances are caused by deforestation and degradation and are frequently aggravated by sociocultural, demographic, economic, technical, and political factors [2,3,4,5]. Moreover, deforestation and degradation have caused significant loss of biodiversity around the world [6]. Indeed, it has been estimated that, between 2015 and 2022, the annual global loss of forest cover amounts to approximately 25 million hectare [7]. Further, the Intergovernmental Science-Policy Platform on Biodiversity and Ecosystem Services (IPBES) reports that 27,000 plant and animal species are lost annually as a result of human activities [8,9]. At the regional level, particularly in the Congo Basin, deforestation and land degradation are responsible for the loss of 1.79 million hectares of forest land every year [10].
Forest cover in the Democratic Republic of the Congo (DRC) has not been spared from human activities. Thus, more than half a million hectares of primary forest are lost every year in the DRC [11,12]. Moreover, most forest losses are owing to unsustainable agricultural practices and aggravated by population growth [7]. Such as to mitigate these anthropogenic pressures on forest resources, almost 11% of the Congolese territory has been established as a protected area [13]. However, owing to weak law enforcement and socioeconomic challenges faced by local populations, the conservation of forest ecosystems in these protected areas remains precarious [14]. Several studies conducted in protected areas in the DRC have revealed forest cover losses, with notable consequences for plant and animal habitats [13,15,16].
Similar to other protected areas in the country, the Luki Biosphere Reserve (LBR) landscape is under great anthropogenic pressure. Indeed, in this area, forest cover is threatened by bush farming, bush fires [17,18], and the artisanal exploitation of wood for energy supply [19]. These activities have been observed elsewhere to be responsible for changes in the spatial structure of the landscape, materialised by the fragmentation, removal, and replacement of certain land-use categories by others [20,21]. Studies showed that different development zones within the LBR (core, buffer, and transition zones) are subject to regressive vegetation-cover dynamics, with negative impacts on climate and carbon storage [22,23]. This disruption of natural ecosystems in the LBR landscape creates conditions conducive to the loss of plant and animal biodiversity [24,25,26].
Edible caterpillars are among the wildlife resources under threat in the LBR landscape. However, caterpillar collection and consumption practices in this area have existed only since the early 2000s [27]. Edible caterpillars in the LBR landscape are collected in forests, savannahs under protection, fallow land, and on certain tree species found in residential areas (villages). However, the population living in this region explains that over the years, edible caterpillars have become increasingly rare, random, and episodic at the times when they are supposed to be available [28]. Unfortunately, few studies have analysed the issues surrounding the availability of edible caterpillars in this landscape. Elsewhere in the country, in areas where caterpillar consumption is traditional, research has been conducted on the pressures affecting caterpillars, their domestication, and practices for sustainable management [29,30]. A recent study showed that edible caterpillar habitats in the LBR landscape had low specific diversity, with caterpillar-host trees becoming rarer, and several species locally threatened with extinction [26]. This observation suggests the possible instability of edible caterpillar habitats in the LBR landscape, the dynamics of which need to be studied. Hence, this study focused on analysing landscape dynamics and the impact of anthropisation on edible caterpillar habitats in the LBR landscape.
In this study, we used remote sensing via the analysis of Landsat images and landscape ecology tools through the calculation and analysis of spatial structure indices. These tools offer an interesting perspective for an in-depth understanding of various landscape components and their eco-geographical interactions [31]. Furthermore, remote sensing remains an essential method for obtaining large-scale data, thus facilitating the understanding of landscape change, and guiding decision-making in land management and environmental conservation [32]. Hence, in order to propose strategies for the availability of edible caterpillars, we adopted an approach that allows spatial alterations within and at the periphery of the Reserve to be considered at three levels of spatial scale: LBR, LBR periphery, and landscape (LBR + LBR periphery), with the aim to highlight unfavourable spatiotemporal dynamics for edible caterpillar habitats at the three spatial scales defined. Specifically, we tested the hypothesis that human activities in the LBR landscape affect the stability of ecosystems that shelter edible caterpillars, thereby creating habitats that are not conducive to their availability. Over the years, the resulting instability is reflected in the LBR, its periphery, and on a landscape scale by, (i) a continuous trend towards deforestation and the expansion of savannahs, agricultural areas, and the installation of human settlements to the detriment of forests and fallow lands; (ii) the fragmentation of forests and the removal of fallow land, accompanied by the creation and aggregation of patches of savannah, agricultural land, and inhabited areas; (iii) a landscape matrix that reveals a decline in forest dominance and increasing savannah dominance; and (iv) an increase in the disturbance index value.
2. Materials and Methods
2.1. Characteristics of the Study Area
The LBR landscape is located in Kongo Central Province in the western DRC, within the geographical region of Mayombe. The designated LBR landscape includes the reserve and the surrounding area, extending approximately 20 km beyond it (Figure 1). Additionally, there are approximately 50 villages and seven urban and rural centres in the LBR periphery, in which the population livelihood relies mainly on the resources harvested from the forest [33,34].
With an area of approximately 3,514.20 Km2, the entire region comprised by the LBR landscape lies between 5°00'00''S and 6°00'00''S and 12°50'00''E and 13°40'00''E. The climate of the region is humid tropical, (AW5), according to Köppen's classification, with a five-month dry season from mid-May to mid-October, and a seven-month rainy season from mid-October to mid-May. The vegetation in the LBR landscape is evergreen and of the semi-deciduous type [35]; it forms part of the extreme southern tip of the Mayombe Guinean forest, with forest flora comprising mature and secondary forest species and non-forest flora composed of grassy and shrubby savannahs [35]. The population of the LBR landscape has grown from 82,000 in the early 2000s to 138,000 in 2014 and 237,000 in 2020 [28,33]. The economy of this region is based on slash-and-burn subsistence farming of cassava, maize, and groundnuts growing on clay and sandy clay soils [35], charcoal production and trading, pit sawing [19,34], and non-timber forest product collection [28].
2.2. Satellite Data
In this study, we used five Landsat images taken during the dry season (June-August) covering the following years: 2004, with the Landsat 5 “Thematic Mapper (TM)” sensor; 2011, with the Landsat 7 “Enhanced Thematic Mapper plus (ETM+)” sensor; 2015, 2020, and 2024, with the Landsat 8 “Operational Land Imager (OLI)” sensor. These images were obtained from the USGS website (https://glovis. usgs. gov) and represent surface reflectance data from the Level 2 Collection 2 Tier 1 dataset. The choice of these images was influenced by several parameters, such as availability and quality (absence of clouds and scratches), and the objectives of our study [21]. Thus, the need to work over a long period (20 years) to better monitor spatial dynamics and changes in socioeconomic phenomena justifies the choice of a reduced time step (five to seven years). The periods to which these images correspond were defined as follows: 2004-2011, 2011-2015, 2015-2020, and 2020-2024. The starting period (2004-2011) coincides with the period during which caterpillar collection and consumption began in the study area. The 2015-2020 period corresponds to the time when people began to complain about a gradual reduction in the availability of the caterpillars they consumed. The 2020-2024 period corresponds with the time when scarcity of edible caterpillars was reported. Hence, there is a need to assess the evolution of caterpillar habitats from the early 2000s, such as to better appreciate the decreasing potential of caterpillar availability in the LBR landscape.
2.3. Pre-Processing of Landsat Images
To optimize the quality of satellite images and improve their reflectance, radiometric corrections were made using the ENVI 5.3 software [36]. These corrections eliminated biases associated with the spectral sensitivity of the sensors and variations in illumination, thereby ensuring greater accuracy in the analysis of the data. In addition, the imperfections specific to the 2011 images resulting from failure of the Landsat 7 satellite sensor in 2003 were corrected. This failure generated so-called “gaps” in the spectral bands. To address this issue, band-specific gap mask files (“Gap_mask”) included in Landsat 7 data products were used to fill the gaps. This method, which is commonly recommended in the literature, has been shown to be effective in reconstructing damaged images [37,38]. Finally, the last pre-processing step involved delimiting the area of interest directly on the satellite images. This delimitation was performed using shape files supplied by the Observatoire Satellitaire des Forêts d'Afrique Centrale (OSFAC). These shapefiles, incorporating precise spatial information, made it possible to precisely circumscribe the study perimeter, thus facilitating a targeted analysis of spatial dynamics in the area of concern.
Unsupervised classification of Landsat images was performed after false-colour compositing by combining the mid-infrared (MIR), near-infrared (NIR), and red (RED) bands. This specific combination of bands was selected because of its proven effectiveness in discriminating landscape features, particularly vegetation, urban areas, and bare soil [39]. Further, NIR is particularly sensitive to NIR radiation and can be used to differentiate vegetation types, whereas MIR radiation is useful for identifying variations in soil and plant moisture contents. The red band, on the other hand, offers optimum contrast for detecting vegetation owing to its strong absorption by chlorophyll. This combination enhanced our ability to analyse the spectral characteristics of landscape features, making transitions between land-use classes more visible and distinct. This first step enabled the initial visual identification of the main land cover classes in the study area, which was a crucial step in guiding the actual classification process [21,40]. Subsequently, supervised classification of the Landsat images was performed using the maximum likelihood algorithm as described by [41]. This algorithm, which is widely used in remote sensing studies, relies on a probabilistic approach to assign each pixel to the most likely class based on the statistics of the training samples, thus ensuring high accuracy in the classification of different land-cover types.
Furthermore, to understand the reasons for the scarcity of caterpillars as described by the population, the land-use class comprising open fields and bare soils were combined to form a single class to avoid confusion between these two classes. Population growth not only increases the need for housing but also, the need for agricultural land. When vegetation can no longer regenerate on the land, it gives way to bare soil. As a result, six land-use classes were selected for the study: forests, savannahs, fallow land, inhabited areas, open fields, bare soil, and other land uses, including features not identifiable in the images (Table 1). In line with the objective of this study, the last land-use class was not considered while interpreting the data.
To check the reliability of the classifications and construct confusion matrices, geographical coordinates independent of those used for the supervised classification were collected in the field using Garmin St64 GPS, with an accuracy of approximately 5 m. The team collecting these geographic coordinates was accompanied by a local guide with knowledge of the habitats of the caterpillars consumed by the population. Based on the confusion matrix, the observer and user accuracies, as well as the overall accuracy, were calculated to assess the reliability of the classification results, in line with the works of [42], and [43]. The observer precision (or error of omission) measures the proportion of pixels belonging to a category that has been correctly classified. Therefore, it assesses the ability of the model not to exclude elements that should belong to a given class, such as all savannah areas identified herein. User accuracy (or commission error), on the other hand, indicates the proportion of pixels classified in a given category that actually belong to that category. For example, if an area is classified as a forest, this precision estimate indicates the extent to which the classification is correct and does not include pixels from other categories (such as agriculture). Finally, overall accuracy measures the total proportion of correctly classified pixels in relation to the total number of pixels analysed. Our study validated the overall effectiveness of the classification model as it faithfully reproduced land-use classes present in the study area.
2.4. Assessment of Landscape Dynamics
To assess the human impact on caterpillar habitats and consider the possible drivers of such impact as they relate to the type of predominant economic activities in the LBR region, we examined: (i) trends in deforestation and the extension of agricultural land and savannahs; (ii) changes in land use; (iii) spatial transformation processes that took place during the period covered by the study; and (iv) changes in the landscape matrix and the level of anthropization of the latter. Several spatial structure indices were calculated [44].
Specifically, to analyse the trend towards deforestation and the expansion of savannah and farmland, the evolution of the total area (a) of patches for each land-use class was assessed. Class area refers to the relative extent of specific land-use types within a defined landscape. The category helps in understanding the landscape composition by identifying the predominant land-use matrix for a given period. Changes in occupancy were assessed by calculating the area gains and losses in each land-use class between the two dates (2004-2011, 2011-2015, 2015-2020, 2020-2024, and 2004-2024) of the five land-use maps.
Spatial transformation processes were identified using the decision tree proposed by [45]. This tree is based on the evolution between two dates (the initial (0) and final date (1)), number of patches (n), total area (a), and total perimeter of a land-use class. The number of patches (n) plays a crucial role in assessing landscape fragmentation, as a high number of patches indicates fragmentation and dispersed distribution, whereas a low number suggests patch aggregation. The forward decision tree identified the following spatial transformation processes (Figure 2): aggregation (merging of patches in a land-use class), creation (setting up new patches), enlargement (increase in the area of a class), attrition (reduction of the area of a class), dissection (subdivision of a class by lines), and fragmentation (breaking patches in a class into small fragments of varying sizes). To distinguish the process of fragmentation from that of dissection, the value of t, derived from the ratio between the total area of land use on the final date and that on the initial date, was compared using a threshold of t = 0.75. Values greater than 0.75 suggest dissection, while those less than or equal to 0.75 indicate the prevalence of fragmentation. Meanwhile, values greater than or equal to 1.0 indicate the prevalence of creation or aggregation [46].
Finally, the evolution of the landscape matrix was determined by calculating the Largest Patch Index (LPI), which defines the ratio between the largest area of a class and the total area of the class [47,48,49,50] while providing information on the fragmentation of land cover following its reduction. Lastly, we calculated the disturbance index, defined as the ratio between the cumulative area of anthropogenic land cover in the landscape and the total forest area [20,21], to assess the level of anthropization of the landscape.
3. Results
3.1. Accurate Classification and Mapping
Supervised classification of Landsat images from 2004, 2011, 2015, 2020, and 2024 covering the LBR landscape revealed overall accuracies ranging from 90.90% to 97.47%, whereas user and producer accuracies varied from 68% to 100% (Table 2). These results indicate a statistically robust differentiation between different land-use classes with a low confusion rate, thus demonstrating the effectiveness of the classification process. The high accuracy-rate observed confirms that the classification algorithm effectively distinguished between land-use types.
Visual analysis of the land cover maps (Figure 3) revealed significant changes between 2004 and 2024. Savannahs, fields and bare soil, and inhabited areas have progressively increased to the detriment of forests and fallow land, the cover area of which has steadily decreased. This dynamic is taking place against the backdrop of increasing anthropogenic pressure, often linked to agricultural expansion and urban growth, which are common drivers of deforestation in tropical regions.
3.2. Landscape Composition Dynamics and Land-Use Change
The analysis of the composition of land cover classes revealed that from 2004 to 2024, forest cover at the regional level declined sharply from 33.10% to 9.52%, decreasing by 23.54%. In contrast, fields and bare soils increased from 3.50% to 23.76%, representing an increase of 20.29%. In turn, the savannah area also increased from 56.55% to 58.46%, while fallow land almost disappeared (Table 3). In fact, over the 20-year period under consideration, there was a reduction in forest area from 86.51% to 38.37% and from 27.70% to 6.48% in the LBR and the periphery, respectively (Table 3). Concomitantly, the areas of fields and bare soils increased by 1.87% in the LBR and 22.25% in the peripheral zone over the same period, respectively. Similarly, the savannah area increased in the LBR, reaching almost 59%, while urbanisation remained limited. Meanwhile, in the periphery, the savanna reached 58.42% in 2024, while urbanisation expanded significantly, rising from 0.93% in 2004 to 5.91% in 2024, representing a 4.97% increase in occupied area. Overall, these results indicate that many forests and fallow lands in the study area have been transformed into fields and bare soils, savannahs, and urbanised areas because of human activity. This loss of vegetation cover has very likely compromised the availability of edible caterpillars in the study area.
3.3. Spatial Structure of Caterpillar Habitats and Anthropization of the LBR Landscape
Concomitant with an increase in the number of forest patches at the landscape and reserve scales, the forest area decreased in all three zones between 2004 and 2011. Consequently, the value of the spatial transformation process (STP) of the forest class during this period was determined to be greater than 0.75. This phenomenon of dissection was not observed in the peripheral zone, which instead experienced a reduction in the number of patches, indicating the attrition of the forest class in favour of other land-use classes over the same period of time (Table 4). Simultaneously, savannahs increased in size in all three studied zones of the LBR, with the creation of new patches and aggregation in the LBR landscape and its periphery. Our analysis revealed a notable reduction in fallow land area and number of patches, indicating a process of attrition. Meanwhile, inhabited areas regressed in area and number of patches in the LBR perimeter, whereas in the peripheral zone and, more generally, at the landscape level, patches of this land-use class increased in overall area as a result of aggregation (Table 4).
From 2011 to 2015, the forest area continued to decrease in all three zones, accompanied by an increase in the number of patches, reflecting fragmentation in the LBR (ratio < 0.75) and dissection at the peripheral and landscape scales (ratio >0.75). Simultaneously, the savannah area increased but the number of patches decreased in all zones, indicating aggregation. Fallow land continued to decrease in area and number of patches (Table 4). However, inhabited areas increased in all zones, suggesting spot creation followed by aggregation in the peripheral zone and at the landscape scale.
In turn, between 2015 and 2020, the forest, savannah, and fallow areas decreased, concomitant with an increase in the number of patches, signalling a dissection of the latter in all zones (ratio > 0.75). Similarly, inhabited areas continued to increase, a trend marked by a simultaneous increase in covered area and number of patches.
Finally, between 2020 and 2024, forests experienced a attrition process in all three zones, with a simultaneous reduction in area and number of patches. In contrast, savannahs have undergone an increase in both area and number of patches, indicating a process of creation. Meanwhile, fallow land has continued to be suppressed, whereas new patches of inhabited area were created in all three zones under study, with a simultaneous increase in area and number of patches (Table 4).
Overall, it appears that from 2004 to 2024, forests and fallow land have been severely affected by human activities, with the dominant STPs being fragmentation and removal. Fields and bare soil, as well as savannah and inhabited area classes have all experienced an increase in the corresponding number of patches and total area. This finding suggests a conversion of caterpillar-collecting ecosystems into habitats that do not favour caterpillar population growth. Overall, edible caterpillar-collecting habitats in the LBR landscape as a whole have been severely disturbed during the study period.
Between 2004 and 2024, the dominance index (D) indicated significant changes in land use within the LBR, in the peripheral zone, and at the regional scale (Table 5). In particular, in the LBR, the forest dominance index dropped from 80.68% in 2004 to 32.65% in 2024, illustrating significant fragmentation of forest areas. Simultaneously, the savannah dominance index rose sharply from 6.77% to 50.47%, marking a notable expansion of the savannah. Fallow land has maintained a very low index (not exceeding 0.048%), while inhabited areas, although marginal, show a slight increase from 0.0083% to 0.0683%, signalling the slow but steady growth of urbanised areas.
This situation is even more pronounced in the peripheral zone, where the forest dominance index has decreased drastically, from 11.74% in 2004 to 0.70% in 2024, indicating a severe loss of the forest continuity. In contrast, the savannah dominance index remains high, fluctuating slightly before reaching 52.61% by 2024, and indicating stabilisation (Table 5). Meanwhile, the dominance index for fallow land remains very low (less than 0.10%), whereas that of inhabited areas has increased from 0.40% to 1.28%, reflecting marked urban growth.
The trends observed in and around the LBR were mirrored at the regional level. Within the entire region, the forest dominance index decreased from 22.99% in 2004 to 4.24% in 2024, indicating an increase in fragmentation. In turn, after an initial decline, by 2024 savannah had experienced a rise in dominance index to 52.77%. Similarly, fallow areas maintained a low dominance index (not exceeding 0.09%), whereas inhabited areas recorded a slight increase from 0.36% to 1.16% during the same period.
Between 2004 and 2024, the evolution of the anthropization index showed a gradual increase in the three zones studied: the LBR, peripheral zone, and LBR Landscape (Figure 4). In 2004, the index was low for the LBR (0.3), it was 2.5 in the peripheral zone, and 2.0 in for the region. Then, by 2011, these values had increased to 0.6, 3.8, and 3.0, respectively, reflecting moderate anthropization in the LBR and are greater elsewhere. Then, in 2015, the index doubled in the LBR (1.2) and continued to increase in the peripheral zone (5.0) and on the landscape scale (4.1). Later, in 2020, the trend stabilised in the LBR (1.2) but increased in the peripheral zone (6.7) and on the landscape scale (5.1). Lastly, in 2024, a recovery was observed in the LBR (1.6), while the peripheral area (13.9) and the landscape scale (9.2) showed strong intensification of human activities. Overall, anthropization has clearly increased in the peripheral zone and more globally on the landscape scale, whereas the LBR remains the zone least affected by human activities. Thus, the disturbance levels were much higher for all three zones during the periods 2015-2020 and 2020-2024. These results provide ample evidence that edible caterpillar habitats in the LBR landscape are characterised by instability due to anthropogenic activities aggravated by population growth.
4. Discussion
4.1. Methodological Approach
Many studies have used Landsat images to quantify land-cover dynamics because of their accessibility [48,51,52,53]. The influence of anthropization on edible caterpillar-collection ecosystems in the LBR landscape required the processing of five Landsat images (2004, 2011, 2015, 2020, and 2024). However, it is appropriate to point out that the use of Landsat sensor images has some limitations for monitoring the dynamics of landscapes whose main degradation factor is slash-and-burn agriculture and fuel-wood harvesting [15]. These limitations are primarily linked to low spatial resolutions. Images from SPOT sensors and tools, such as unmanned remote-controlled vehicles, can provide images with very high spatial resolution, thereby offering great opportunities for land monitoring at the local level [54,55,56]. This approach offers great potential for improving management strategies and decision-making processes. However, such technologies were not used in this study owing to their high acquisition costs. Therefore, to limit errors in the analysis of the Landsat images used herein, same-season images were used to reduce seasonal effects [57]. In addition, the deletion of lines resulting from Landsat 7 satellite alignment errors in the 2011 images improved their quality and enabled the extraction of the results described above [38]. Based on the professional experience of edible caterpillar collectors, the choice of the study period (2004 -2024) enabled us to be in close proximity to the reality experienced by them.
In addition, the short timeframe (5-7-year intervals) made it possible to measure dynamics while considering socioeconomic facts that are highly evolutive in time and space. Indeed, in the particular context of the LBR landscape, where the population harvests forest resources and a dynamic implementation of conservation projects has taken place, land use can reveal quite different realities from one period to the next, depending on the phases of project intervention. Supervised classification was used to describe the vegetation formations in terms of their physiognomy. The classification of Landsat images using the Maximum Likelihood algorithm, combined with field verification, whose overall accuracies are statistically reliable, testify to the quality of image processing and the importance of knowledge of the study area when performing a diachronic analysis of a landscape [58].
4.2. A Landscape with Disturbed Edible Caterpillar Habitats
The composition of landscape dynamics at the spatial scales studied was marked by the loss of vegetation cover in the edible caterpillar habitats. This loss of vegetation cover gives way to the development of savannahs, fields and bare soils, and inhabited areas, all of which are unfavourable habitats for edible caterpillars [26]. The degradation of vegetation cover can largely be explained by the expansion of anthropogenic activities, notably, agriculture and energy-wood exploitation [19,34]. These factors at the root of deforestation and forest cover degradation in our study area are not only aggravated by unchecked population growth but by contradictory policies as well. Indeed, the lack of a more conducive decision-making process regarding natural resource management and conservation observed in the study area is thought to be the result to a two-headed management direction that involves the two institutions responsible for managing the LBR, whose policies are marked by insufficient coherence and synergy of proposed and implemented conservation actions [33]. This places the LBR in an apparent state of a property without a master and exposes its vegetation to intensive and illegal exploitation. In addition, the approach to implementing development projects in the study area since 2004 has made little room for community participation and socioeconomic development, which has not led to any real appropriation by the people living in this landscape [59]. The results of our study on landscape composition dynamics in the area do not contradict those of previous studies conducted in the same landscape by [18] and on the LBR [22], which suggest deforestation in the study area as a major challenge. The same result was demonstrated in the Yangambi Biosphere Reserve landscape [60] and the Kundelungu Reserve landscapes [38], where regressive forest-cover dynamics were clearly demonstrated. In Africa, several authors have observed severe deforestation in forest ecosystems [53,61], indicating significant anthropogenic pressure on plant resources. The extension of savannahs in the study area was considered by [18], as the establishment of secondary forests, probably because their study considered as the savannah class, savannahs under protection for the natural regeneration of forest species. However, the protected savanna in our study was included in the forest class to limit confusion between the two classes. This was because it was difficult to differentiate between the forest and regenerated savannah [22], showed evidence of savannisation in the LBR. This was confirmed by our results regarding the evolution of vegetation in the LBR, its periphery, and at the landscape level.
Structural dynamics revealed that fragmentation (caused by the fragmentation of forest patches into small fragments) and attrition (caused by the reduction in area and eradication of vegetation patches) were the main STPs underlying the disturbances in edible caterpillar habitats in our study. Previously, several studies have reported the detrimental effects of fragmentation and attrition on forest ecosystems [62,63]. These two processes are often responsible for the absence of certain diameter classes in plant species, resulting in significant reduction rates in the specific diversity and density of woody species in a given population [64,65]. This is likely the case in the study area. Indeed, in the absence of individuals of forest species that host edible caterpillars in several diameter classes, there is an irregularity in the distribution of these species in different habitats, as well as low specific diversity [26]. In their study of the management zones of the LBR (core, buffer, and transition zones) in relation to forest species diversity, [24], demonstrated that the core zone, which is the conservation zone restricted to all human activities, was less disturbed and had a higher index of species diversity than the transition zone, which had been heavily disturbed.
Furthermore, no economic (road building) or natural phenomena occurring in our study area explained the dissection observed in the forests. These dissections are, therefore, fragmentations with regard to the types of socioeconomic activities (slash-and-burn agriculture, charcoal, and logging) that prevail in the landscape. This observation reflects the difficulty in distinguishing between fragmentation and dissection when studying forest disturbances in tropical Africa [41,50].
Moreover, fallow land has been eliminated because of land pressure for agricultural purposes [66]. Indeed, owing to population growth, fallow periods have decreased. The hope for the regeneration of vegetation cover in edible caterpillar-collecting habitats lies in the restoration of degraded habitats but the fact that, between 2015-2020 and 2020-2024, fragmentation/dissection and an increase in the disturbance index were observed in the three areas studied might soon dash this hope. This period corresponds to the slackening of conservation projects in the LBR, when many households and young people were receiving remuneration for their involvement in reforestation activities. The increase in the areas occupied by fields and bare soils in the reserve after several years of conservation project implementation highlights the issues of ownership of development projects and rural employment in relation to the conservation of natural resources.
4.3. Implications of the Study Results and Practical Application
Overall, this study revealed the instability of edible caterpillar habitats in the LBR, its periphery, and the entire landscape in general. This instability was evidenced by the increase in the disturbance index over the years of the study period, the growing dominance of savannahs, the increase in the area of fields and bare soils, and inhabited areas, and the reduction in the areas of forests and fallow lands. However, it has been shown that, as edible caterpillar habitats, forests and fallow lands are richer and more diverse than inhabited areas, where several caterpillar-host species have become rare or even locally threatened with extinction [26]. This may explain the complaints of caterpillar collectors regarding the scarcity of caterpillars. Thus, for example, in their study on the status of terrestrial mammal populations in the LBR, [25] showed that, following the disturbance of the LBR, the mammalian community consisted of only a small relict population of chimpanzees located in the least anthropized habitats of the reserve. Additionally, the authors found a large population of rodents, which are bio-indicators of forest ecosystem disturbance, in the most anthropized habitats of the LBR. Consequently, it appears that the least anthropized habitats have healthy biodiversity, unlike habitats where human impact is high [67,68,69].
Based on the results of the study, it appears that the research hypotheses proposed at the outset were verified. This study can be used by decision-makers to find out ways of integrating ecosystem goods and services in protected area management and local development community plans. This study can also be replicated in other landscape of protected area in other to assess changes on forest ecosystems and the availability of livelihood on which depend rural communities in the context of population growth and poverty. Although the research hypotheses were verified, this study is far from complete, which leads to the formulation of further research perspectives with a view to its completion. Therefore, it is important to study the effects of fragmentation on the phenology and reproductive capacity of edible caterpillar host plants. Similarly, it is important to analyse the impact of the fragmentation of the Luki Biosphere Reserve landscape on the local climate and its implications on the availability of edible caterpillars. Finally, systematic studies should be performed on the domestication conditions of edible caterpillar-host trees with a view to their integration into community development plans of villages located in the periphery of the Luki Biosphere Reserve and the management plan of the Reserve as a whole
5. Conclusions
Changes to natural ecosystems have both positive and negative effects on the livelihoods of people who derive most of their sustenance from nature. By using landscape ecology methods in combination with remote sensing and a Geographic Information System, this study highlighted the spatiotemporal dynamics affecting edible caterpillar-habitats. The study covered an area that was subdivided into three spatial scales: the Luki Biosphere Reserve, its periphery, and the entire landscape comprising the LBR and its periphery. The results showed that, the composition of land use between 2004 and 2024 in the study area was marked by deforestation, the expansion of savannahs, fields and bare soils. The major spatial transformation processes identified included fragmentation and attrition of forests and fallow land. These spatial transformation processes have been accompanied by the creation and expansion of savannahs and inhabited areas, which are unfavourable habitats for caterpillars consumed by the population in this part of the Democratic Republic of Congo. Drivers of this transformation include the expansion of agriculture and human settlements driven by population growth. This study suggests that, any strategy aimed at a sustainable supply of edible caterpillars in the Luki Biosphere Reserve landscape will need to adopt an approach that must consider both the LBR and its management scheme, as well as the lands of local communities located in villages in the peripheral zone of the reserve.
Author Contributions
Conceptualization, Ernestine Lonpi Tipi, Raoul Sambieni Kouagou, Joseph Lumande Kasali, Damase Khasa and Jan Bogaert; Data curation, Ernestine Lonpi Tipi; Formal analysis, Ernestine Lonpi Tipi and Médard Mukenza Mpanda; Investigation, Ernestine Lonpi Tipi; Methodology, Ernestine Lonpi Tipi, Médard Mukenza Mpanda, Yannick Useni Sikuzani and Jan Bogaert; Project administration, Ernestine Lonpi Tipi; Resources, Ernestine Lonpi Tipi and Médard Mukenza Mpanda; Software, Ernestine Lonpi Tipi and Médard Mukenza Mpanda; Supervision, Yannick Useni Sikuzani, François Malaisse, Joseph Lumande Kasali, Damase Khasa and Jan Bogaert; Validation, Yannick Useni Sikuzani, Jean-Pierre Messina Ndzomo, François Malaisse, Damase Khasa and Jan Bogaert; Visualization, Ernestine Lonpi Tipi; Writing – original draft, Ernestine Lonpi Tipi; Writing – review & editing, Ernestine Lonpi Tipi, Médard Mukenza Mpanda, Yannick Useni Sikuzani, Jean-Pierre Messina Ndzomo, Raoul Sambieni Kouagou, François Malaisse, Damase Khasa and Jan Bogaert. All authors have read and agreed to the published version of the manuscript.
Data Availability Statement
The original contributions presented in this study are included in the article. Further inquiries can be directed to the corresponding author.
Acknowledgments
We thank the European Union for its financial support for the project ‘Strengthening Climate Change Resilience of Local Communities in Luki and Mai-Ndombe, Democratic Republic of Congo, implemented by the Regional Postgraduate School for Integrated Management of Forests and Tropical Territories (ERAIFT) and the World Wide Fund for Nature. Support for the NSERC Discovery Grant is gratefully acknowledged. We also extend our gratitude to the local communities living in and around the Luki Biosphere Reserve.
Conflicts of Interest
The authors declare that they have no competing financial interests or personal relationships that could have appeared to influence the work reported in this paper.
References
- Giradoux, p. La santé des écosystèmes: quelle définition ? Bull. Acad.Vet, 2022, France, 175: 120-139. https://www.persee.fr/doc/bavf_0001-4192_2022_num_175_1_15831.
- Amar, R. Impact de l’anthropisation sur la biodiversité et le fonctionnement des écosystèmes marins. Exemple de la Manche-mer du nord. Vertigo 2010, 8 : 1-13. https://www.erudit.org/en/journals/vertigo/2010-n8-vertigo3983/045528ar/abstract/.
- Teyssèdre, A. Les services écosystémiques, notion clé pour explorer et préserver le fonctionnement des (socio)écosystèmes. Regard R4 SFE2 2010. sfecologie.org. Available online : https://sfecologie.org/wp-content/uploads/2010/10/R4-Teyssedre-2010.pdf (Accessed on 02.01.2025). [CrossRef]
- Bitamba, F.J.; Bazirukize, K.E.; Zikama, N.L.; Ntahondi, H.A. Impact des activités humaines sur les écosystèmes forestiers du groupement Kamuronza en territoire de Massisi, Nord-Kivu. Bull. Inf. Tour. et env. 2012, 122-132. https://www.istougoma.ac.cd/pdf/publication/640f295d51fd2.pdf.
- Brun, L. E.; Sinasson, G.; Azihou, A.F.; Gibigaye, M.; Tente, B.A.H. Perceptions des facteurs déterminants de dégradation de la flore des zones humides dans la commune d’Allada, Sud – Bénin. Afri. sci. 2020, 16(4) : 52 – 67. http://afriquescience.net/PDF/16/4/5.pdf.
- FAO; PNUD. La situation des forêts dans le monde 2020. Forêts, biodiversité et activités humaines. Rome 2020. Fao.org. Available online : (Accessed on 02.01.2025). [CrossRef]
- Global Forest Watch. Global Annual Tree Cover Loss. Global Forest Watch, 2023. https://www.globalforestwatch.org/dashboards/global/.
- IPBES. Summary for policymakers of the global assessment report on biodiversity and ecosystem services of the Intergovernmental Science-Policy Platform on Biodiversity and Ecosystem Services 2019. 39p https://www.dropbox.com/.
- Vancutsem, C.; Achard, F.; Pekel, J-F.; Vieilledent, G.; Carboni S.; Simonetti, D.; Gallego, J.; Aragão, L.E.O.C.; Nasi, R. Long-term (1990–2019) monitoring of forest coverchanges in the humid tropics. Sci. Adv. 2021, 7(10) : 1-21. [CrossRef]
- Dalimier, J.; Achard, F.; Delhez, B.; Desclée, D.; Bourgoin, C.; Eva, H.; Gourlet,-Fleury, S.; Hansen, M.; Kibambe, J.P.; Mortier, M.; Ploton, P.; Réjou-Méchain, M.; Vancutsem, C.; Langner, A.; Sannier, C.; Ghomsi, H.; Jungers, Q.; Defourny, P. Répartition des types de forêts et évolution selon leur affectation. Etat des forêts de l’Afrique centrale, UC-Louvain-Geomatics, Louvain, Belgique 2022 ; pp. 1-36. https://www.cifor-icraf.org/publications/pdf_files/Books/Etat-des-forets-2021.pdf.
- Molinaro, G.; Hansen, M.C.; Patapov, P. Forest cover dynamics of shifting cultivation in the Democratic Republic of Congo: remote sensing-based assessment for 2000-2010. Environ. Res. Lett. 2015, 10, 094009. https://www.researchgate.net/publication/281671562.
- Molinaro, G.; Hansen, M.C.; Patapov, P.; Tyukavina, A.; Stehman, S. Contextualizing landscape-scale forest cover loss in the Democratic Republic of Congo (DRC) between 2000 and 2015. Land 2020, 9(1) :23. https://www.mdpi.com/2073-445X/9/1/23.
- Kyale, Koy, J.; Wardell, D. A.; Mikwa, J.-F.; Kabuanga, J. M.; Monga, Ngonga, A.M.; Oszwald, J.; Doumenge, C. Dynamique de la déforestation dans la Réserve de biosphère de Yangambi (République démocratique du Congo) : variabilité spatiale et temporelle au cours des 30 dernières années. BFT 2019, n° 341 : 15-28.
- Tingu, C.; Mathunabo, A. Analyse de la situation socio- économique et alimentaire des ménages des provinces du Nord et Sud Ubangi en RDC. Rev. Mar. Sci. Agron. Vét. 2019, 7: 203-211. https://www.agrimaroc.org/index.php/Actes_IAVH2/article/view/683/739.
- Semeki, N.J.; Linchant, J.; Quevauvillers, S.; Kahindo, M. J-M.; Lejeune, P.; Vermeulen, C. Cartographie de la dynamique de terroirs villageois à l’aide d’un drone dans les aires protégées de la République démocratique du Congo. BFT 2016, 330(4) : 70-83. https://revues.cirad.fr/index.php/BFT/article/view/31320.
- Nyembo, F.; Mertens, B.; Cherif, M.; Inza, K. Menaces d’origine anthropique et Habitat de Pan Paniscus dans La reserve naturelle de Sankuru, en République démocratique du Congo. Eur. Sci. J. 2021, 16 (21) : 290-309. https://hal.science/hal-03285049/document.
- Cirezi, C. N.; Tshibasu, E.; Lutete, E.; Mushagalusa, A.; Mugumaarhahama, Y.; Ganza, D.; Karume, K.; Michel, B.; Lumbuenamo, R.; Bogaert, J. Fire risk assessment, spatiotemporal clustering and hotspot analysis in the Luki biosphere reserve region, Western DR Congo. Trees For. People 2021, vol 5, 22p. [CrossRef]
- Cirezi, C.N.; Bastin, J.F.; Tsibasu, E.; Lonpi, T.E.; Chuma, G.B.; Mugumaarhahama Y.; Sambieni K.R.; Karume K-C.; Lumbuenamo S.R.; Bogaert J. Contribution of human induced fires to forest and savannah land conversion dynamics in the Luki biosphere reserve landscape, western Democratic Republic of Congo. Int. J. Remote Sens. 2022, 43(17) :6406-6429. [CrossRef]
- Semeki, N.J.; Tongo, Y. M. Livelihoods Means and Local Populations Strategies of the Luki’s Biosphere Reserve in Democratic Republic of Congo. IJNREM 2019, 4(2): 42-49.https://article.sciencepublishinggroup.com/pdf/10.11648.j.ijnrem.20190402.12.pdf.
- Kaleba, C.S.; Sikuzani, U.Y.; Sambieni, K.R.; Bogaert, J.; Munyemba, K.F. Dynamique des écosystèmes forestiers de l’arc cuprifère katangais en République Démocratique du Congo. Causes, transformations spatiales et ampleur. Tropicultura 2017, 35(3) : 192-202. https://popups.uliege.be/2295-8010/index.php?file=1&id=1266.
- Sikuzani, U.Y.; Malaisse, F.; Kaleba, C.S.; Munyemba, K.F.; Bogaert, J. Rayon de déforestation autour de la ville de Lubumbashi (Haut-Katanga, RD. Congo), Synthèse. Tropicultura 2017, 35(3) : 215-221. https://www.researchgate.net/publication/320258544.
- Opelele, O.M.; Ying, Y.; Wengi, F.; Chen, C.; Kachaka, S.K. Examining land use/land cover and its prediction based on a multilayer perception Markov Approach in the Luki biosphere reserve, Democratic Republic of Congo. Sustainability 2021a, 13 (12):68-98. [CrossRef]
- Opelele, O.M.; Ying,Y.; Wenyi, F.; Lubalega, T.; Chen, C.; Kachaka, S.K. Analysis of the impact of land-use/land-cover change on land-surface temperature in the villages withing the Luki biosphere reserve. Sustainability 2021b, 13 (20):11242. https://www.mdpi.com/2071-1050/13/20/11242.
- Opelele, O.M.; Ying, Y.; Wenyi, F.; Lubalega, T.; Chen, C.; Kachaka, S.K.C. Impact of land use change on tree diversity and aboveground carbon storage in the Mayumbe Tropival forest of the Democratic Republic Congo. Land 2022, 11:787. https://www.researchgate.net/publication/360914210.
- Kwidja, D.Y; Fonteyn, D.; Semeki, N.J.; Mvuezolo, N.M.; Poulain, P.; Lonpi, T.E.; Vermeulen, C. État des populations des mammifères terrestres dans la Réserve de Biosphère de Luki (République démocratique du Congo). Biotechnol. Agron. Soc. Environ. 2023, 27(4), 13p. https://popups.uliege.be/1780-4507/index.php?id=20430.
- Lonpi, T.E.; Sambieni, K. R.; Messina, N. J-P.; Nsevolo, M.P.; Boyombe, L.L.; Kasali, J.L.; Khasa D.; Malaisse F.; Bogaert J. Diversity and availability of edible caterpillar host plants in the Luki biosphere reserve landscape in the Democratic Republic of the Congo. Trees For. People 2024, 18, 100719, 12p. [CrossRef]
- Lonpi, T.E. RDC: comment les atteintes à la biodiversité affectent les habitudes alimentaires. The Conversation, 2022. https://theconversation.com/en-rdc.
- Lonpi, T. E.; Sambieni, K. R.; Khasa, D.; Bogaert, J.; Kasali, J. L.; Huart, A.; Konda, K. M. A.; Malaisse, F. Les chenilles consommées dans la région de la réserve de biosphère de Luki en République démocratique du Congo : acteurs, connaissances locales et pressions. BFT 2023, 355 : 21-34.
- Bomolo, O.; Niassy, S.; Chocha, A.; Longanza, B.; Bugeme, D.M.; Ekesi S. & Tanga C.M. Ecological diversity of edible insects and their potential contribution to household food security in Haut-Katanga Province, Democratic Republic of Congo. Afri. J. of Ecol. 2017, 55(4): 640-653. https://www.gov.uk. [CrossRef]
- Looli B.L.; Dowiga, B.; Bosela, O.; Salamu, P.; Manzenga, J.C.; Posho, B.; Mabossy-Mobouna, G.; Latham, P.; Malaisse, F. Techniques de récolte et exploitation durable des chenilles comestibles dans la région de Yangambi, R.D. Congo. Geo-Eco-Trop 2021, 45(1): 113-129. https://www.geoecotrop.be/uploads/publications/pub_451_10.pdf.
- Koua, K. A. N.; Bamba, I.; Barima, Y. S. S.; Kouakou, A. T. M.; Kouakou, K.A.; Sangne, Y.C. Echelle spatiale et dynamique de la forêt classée du Haut-Sassandra (Centre Ouest de la Côte d’Ivoire) en période de conflits. Rev. Env. et Bio. 2017,-PASRES 2 (1) : 54 - 68.
- Mama, A.; Bamba, I.; Sinsin, B.; Bogaert, J.; De Cannière, C. Déforestation, savanisation et développement agricole des paysages de savanes-forêts dans la zone soudano-guinéenne du Bénin. BFT 2014, 322(4) : 65-75. https://www.researchgate.net/publication/321638655.
- Nyangue, N.M. Participation des communautés locales et gestion durable de forêts : cas de la réserve de la biosphère de Luki en République Démocratique du Congo. Thèse de Doctorat en Sciences forestières 2014, Université Laval Québec, 205 p. Available online :https://corpus.ulaval.ca/jspui/bitstream/20.500.11794/25349/1/30892.pdf (Accessed on 15.09.2024).
- Desclee, D.; Michel, B.; Trefon, T. Enquête et étude de diagnostic des capitaux et stratégies d’existence des ménages dépendant de ressources de la Réserve de Biosphère de Luki en République Démocratique du Congo. Tropicultura 2018, 36(3): 492-505. http://www.tropicultura.org/text/v36n3/492.pdf.
- Lubini, A. La végétation de la réserve de biosphère de Luki au Mayombe (Zaïre). Opera Botanica Belgica 1997, 10: 155 p. ISBN 90-72619-33-1/ ISSN 0775-9592.
- Kergomard, C. Pratique des corrections atmosphériques en télédétection : utilisation du logiciel 5S-PC. Eur.J.Geogr. 1996, document 181. http://journals.openedition.org/cybergeo/1679 ;
- Nkwunonwo, U.C. Land use/Land cover mapping of the Lagos Metropolis of Nigeria using 2012 SLC-off Landsat ETM+ Satellite Images. Int. J. Sci. Eng. Res. 2013, 4(11) : 1217–1223. https://www.ijser.org/.
- Sikuzani, U.Y.; Mukenza, M.M.; Malaisse, F.; Kazaba, K.P.; Bogaert, J. The spatiotemporal changing dynamics of Miombo deforestation and illegal human activities for forest fire in Kundelungu National park, Democratic Republic of the Congo. Fire 2023, 6(5):174. https://www.mdpi.com/2571-6255/6/5/174.
- Barima, Y.S.S.; Barbier, N.; Bamba, I.; Traore, D.; Lejoly, J.; Bogaert, J. Dynamique paysagère en milieu de transition forêt-savane ivoirienne. BFT 2009, 299(1) : 15-25. https://www.researchgate.net/publication/323203516.
- Mama, A.; Sinsin, B.; De Cannière, C.; Bogaert, J. Anthropisation et dynamique des paysages en zone soudanienne au Nord du Bénin. Tropicultura 2013, 31(1) :78-88. http://www.tropicultura.org/text/v31n1/78.pdf.
- Kabuanga, M.J.; Guguya, B.A.; Okito, N.E.; Maestripieri, N.; Saqalli, M.; Rossi, V.; Iyongo, W.M.L. Suivi de l’anthropisation du paysage dans la région forestière de Babagulu, République Démocratique du Congo. Vertigo 2020, 20(2) : 1-27. https://www.erudit.org/en/journals/vertigo/2020-v20-n2-vertigo06186/1079241ar.pdf.
- Skupinski, G.; Tran, D.B.; Weber C. Les images satellites Spot multi-dates et la métrique spatiale dans l’étude du changement urbain et suburbain: le cas de la basse vallée de la Bruche (Bas-Rhin, France). EJG, 2009. Systèmes, Modélisation, Géostatistiques, document 439. https://www.researchgate.net/publication/49133802.
- Mukenza, M.M.; Muteya, K.H.; Nghonda, N.D.; Sambieni, K.R.; Malaisse, F.; Kaleba, C.S.; Bogaert, J.; Sikuzani, U.Y. Uncontrolled Exploitation of Pterocarpus tinctorius Welw. and Associated Landscape Dynamics in the Kasenga Territory: Case of the Rural Area of Kasomeno (DR Congo). Land 2022, 11, 1541. [CrossRef]
- O’Neill, R.V.; Krumme, J.R.; Gardner, R.H.; Sugihara, G.; Jackson, B.; DeAngelist, D.L. Indices of landscape pattern. JLECOL 1988, 1(3) : 153-162. https://turnerlab.ibio.wisc.edu/wp-content/uploads/sites/43/2021/12/ONeill1988LE.pdf.
- Bogaert, J.; Ceulemans, R.; Salvador-Van, E.D. Decision Tree Algorythm in landscape transformation. JEM 2004, 33 :62-73. https://www.researchgate.net/publication/8932193_.
- De Haulleville, T.; Rakotondrasoa, O.L.; Rakoto, R.H.; Bastin, J.F.; Brostaux, Y.; Verheggen, F.J.; Rajoelison, L.G.; Malaisse, F. ; Bogaert, J. et al. Fourteen years of anthropization dynamics in the Uapaca bojeri Baill. forest of Madagascar. Landsc. Ecol. Eng. 2018, 14:135–14. https://www.researchgate.net/publication/322764337.
- Kabulu, D.J.; Bamba, I.; Munyemba, K.F.; Defourny, P.; Vancutsem, C.; Nyembwe, N.S.; Ngongo, L.M.; Bogaert, J. Analyse de la structure spatiale des forêts du Katanga. Ann.for.Sci.Agro. 2008, 1(12) :12-18. http://bakasbl.org/news/doc/177.pdf.
- Mohamed, M.E.; Abdelghani H.; Mohamed E.F. Apport de la télédétection et du SIG au suivi de la dynamique spatiotemporelle des forêts des massifs numidien de Jbel Outka (Rift central, Maroc). GOT 2017, 1(11): 171-187. [CrossRef]
- Mcgarigal, K. FRAGSTATS Help. Department of Environmental Conservation, University of Massachusetts, Amherst, 2015. www.Researchgate.net. Available online:http://www.umass.edu/landeco/research/fragstats/documents/fragstats.help.4.2.pdf (Accessed on 15.02.2024).
- Mama, A.; Oumorou, M.; Sinsin, B.; De Canniere, C.; Bogaert, J. Anthropisation des paysages naturels des aires protégées au Bénin : cas de la forêt classée de l’Alibori Supérieur (FC-AS). AJIRAS 2020, ISSN 2429-5396. www.american-jiras.com.
- Girou, D.; Deschamps, N.; Delorme, M. Apports et limites de la télédétection aérienne et satellitale pour la gestion des milieux en Guyane : exemple du zonage écologique et humain de la région de Saül. JATBA 40ème bulletin 1998, 1(2) : 423-432. https://www.persee.fr/doc/jatba_0183-5173_1998_num_40_1_3683.
- Mihai, B.; Savulescu, I.; Sandric, I.; Oprea, R. Application de la télédétection des changements de l’étude de la dynamique de la végétation des monts de Becegi (Carpates méridionales, Roumanie). Télédétection 2006, 6(3) :215-231. https://www.academia.edu/2920144/.
- Soro, G.; Ahoussi, K.E.; Koudio, K.E.; Soro, D.T.; Oulare, S.; Saley, B.M.; Soro, N.; Biemi, J. Apport de la télédétection à la cartographie de l’évolution spatiotemporelle de la dynamique de l’occupation du sol dans la région des lacs (centre de la Côte d’Ivoire). Afrique Science 2014, 10(3) :146-160, ISSN 1813-548X. http://www.afriquescience.info/docannexe.php?id=3925.
- Koh, L.P.; Wich, S.A. Dawn of Drone Ecology: Low-Cost Autonomous Aerial Vehicles for Conservation. Tropical Conservation Science 2012, 5 : 121-132. [CrossRef]
- Vermeulen, C.; Lejeune, P.; Lisein, J. ; Sawadogo, P.; Bouché, P. Unmanned aerial survey of elephants. PLoS ONE 2013, 8: e54700. https://www.researchgate.net/publication/235605299.
- Linchant, J.; Lisein, J.; Semeki, J.; Lejeune, P.; Vermeulen, C. Are unmanned aircraft systems (UAS) the future of wildlife monitoring? A review of the accomplishments and challenges. Mammal Review 2015, 45: 239-252. https://www.oipr.net/storage/publications/1674725676.pdf.
- Andrieu, J.; Mering C. Cartographie par télédétection des changements de la couverture végétale sur la bande littorale ouest-africaine: exemple des Rivières du Sud du delta du Saloum au Rio Geba. Télédétection 2008, 8 (2) : 93-118. https://shs.hal.science/halshs-00388170/.
- Nicet, J-B.; Porcher, M.; Pennober, G.; Mouquet, P.; Alloncle, N.; et al. Aide pour la réalisation et la commande de cartes d’habitats normalisées par télédétection en milieu récifal sur les territoires français. Guide de mise en œuvre à l’attention des gestionnaires. Document de synthèse IFRECOR 2016. https://hal.science/hal-01467027/.
- Kilensele, M.T. Limites des stratégies de conservation forestière en République Démocratique du Congo. Cas de la réserve de biosphère de Luki. Thèse de doctorat, faculté des sciences institut de gestion de l’environnement et d’aménagement du territoire, Université Libre de Bruxelles, Bruxelles, Belgique, 2015. www.academia.edu. Available online : https://www.academia.edu/85872793/Limites (Accessed on 15.09.2024).
- Bwazani, B.J.; Meniko To Hulu, J.P.P.; Bogaert, J. Anthropisation et modélisation prospective des paysages forestiers dans la Province de la Tshopo, RD Congo « Cas de la Réserve de Biosphère de Yangambi et de la Réserve Forestière de Masako ». Mémoire de Master de l’Université de Kinshasa, Kinshasa, RD Congo 2023. Researchgate.net. Available online : https://www.researchgate.net/publication/375756179 (Accessed on 15.09.2024).
- Abdou, K.I.; Abasse, T.A.; Massaoudou, M.; Rabiou, H.; Soumana, I.; Bogaert, J. Influence des pressions anthropiques sur la dynamique paysagère de la réserve partielle de faune de Dosso (Niger). IJBCS 2016, 13(2):1094-1108. https://www.researchgate.net/publication/334884515.
- Inoussa, M.M.; Mahamane, A.; Mbow, C.; Saadou, M.; Yvonne, B. Dynamique spatio-temporelle des forêts claires dans le Parc national du W du Niger (Afrique de l’Ouest). JLE 2011, 22(2) : 108-116, 10.1684/sec.2011.0305.
- Toyi, M.S.S.; Andre, M.; Sikuzani, Y.U.I.; Bogaert, J.; Sinsin, B. Trente ans d’anthropisation des paysages forestiers au sud du Bénin (Afrique de l’Ouest). AJOL 2019, 23 (2) : 183-197, ISSN 1659 – 5009. https://orbi.uliege.be/bitstream/2268/289325/1/toyi_asa_2019.pdf.
- Razafimahefa, A. L. Impact de la fragmentation d’habitat chez Adansonia rubrostipa dans la région Menabe. Mémoire de master en biologie végétale, université d’Antananarivo, Madagascar, 2016. Protectedareas.mg. Available online : https://protectedareas.mg/ (Accessed on 15.09.2024).
- Bouko, B.S.; Dossous, P. J.; Amadou, B.; Sinsin, B. Exploitation des ressources biologiques et dynamique de la forêt classée de la Mekrou au Benin. ESJ 2016, 12(36) : 228-244.
- Dejace, D. Perspectives de mise en place de la Régénération Naturelle Assistée pour l'amélioration de jachères apicoles, en périphérie de la Réserve de Biosphère de Luki (RDC). Mémoire de Master en bioingénieur, Université de Liège, Gembloux, Belgique, 2019. www.ulb-coopération.org. Available online : https://www.ulb-cooperation.org/wp-content/uploads/2020/06/ (Accessed on 15.09.2022).
- Boissier, O. Impact des pressions anthropiques sur les communautés de frugivores et la dispersion des graines en forêt guyanaise. Museum national d'histoire naturelle, Paris, France, 2012.www.researchgate.net. Available online : https://www.researchgate.net/ (Accessed on 15.10.2024).
- Cateau, E. Reponse des coleopteres saproxyliques apteres aux perturbations anthropiques des forets et des paysages. Thèse de doctorat, université de Toulouse, France, 2016. Available online : https://hal.inrae.fr/tel-02796092v2/file/Cateau_Eugenie.pdf (Accessed on 15.09.2024).
- Alongo, S.; Kombele, F.; Bogaert, J. Etude des relations sol-plante après la fragmentation de la forêt par l’agriculture itinérante sur abattis brûlis dans la région de Yangambi, R.D. Congo. JAECOLER 2022, 1(2) : 74-83. https://laecolie.org/wp-content/uploads/2023.
Figure 1.
Luki Biosphere Reserve landscape. The green polygon represents the LBR. The periphery is the area between the LBR and the purple polygon. In the periphery, there are several villages and urban centres marked on the map by small black dots, while the names of the localities are written in white. The landscape consists of the LBR and its periphery, whose boundary is marked on the map by the purple polygon. This is crossed by roads represented by yellow lines on the map.
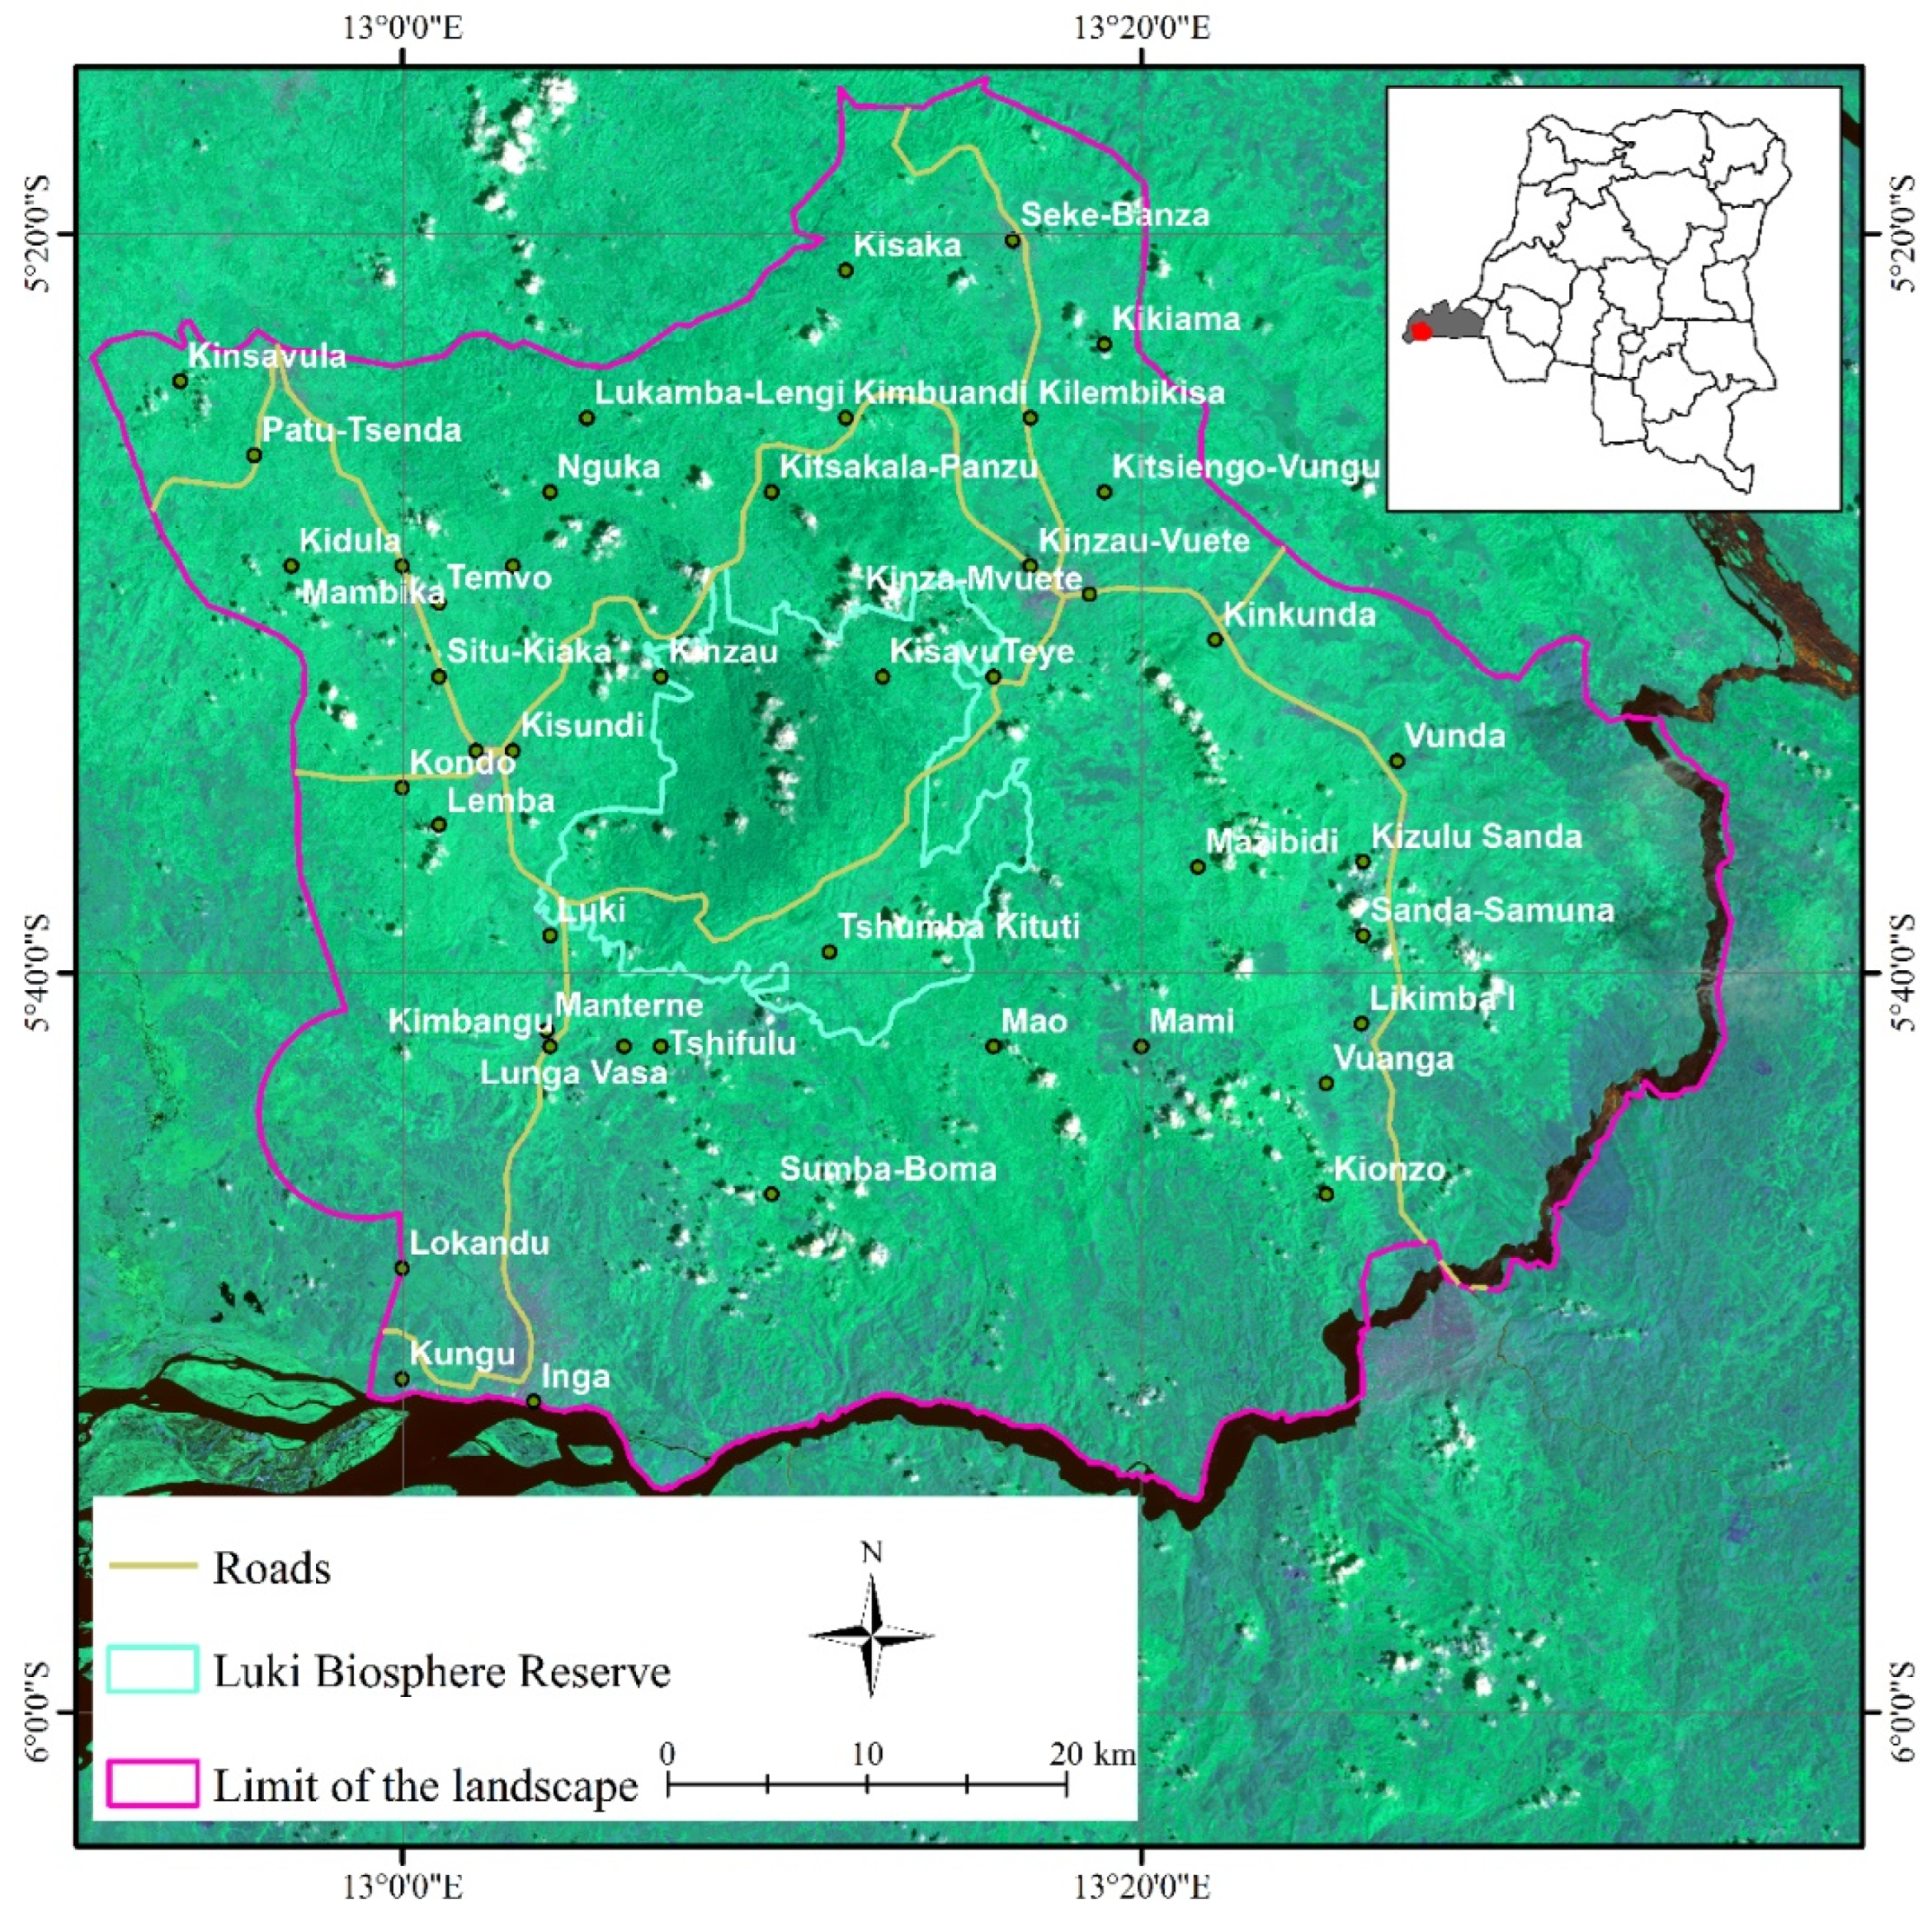
Figure 2.
Identification of spatial transformation processes [45]. a0, n0, and p0, and a1, n1, and p1 represent the area, number, and perimeter of class patches, respectively, in the first (0) and the last year (1) of each study period. Spatial transformation processes were identified for each class at all study periods (2004-2011, 2011-2015, 2015-2020 and 2020-2024). To separate fragmentation from dissection, tobs = a1/a0 was calculated and compared with the predefined threshold of t = 0.75.
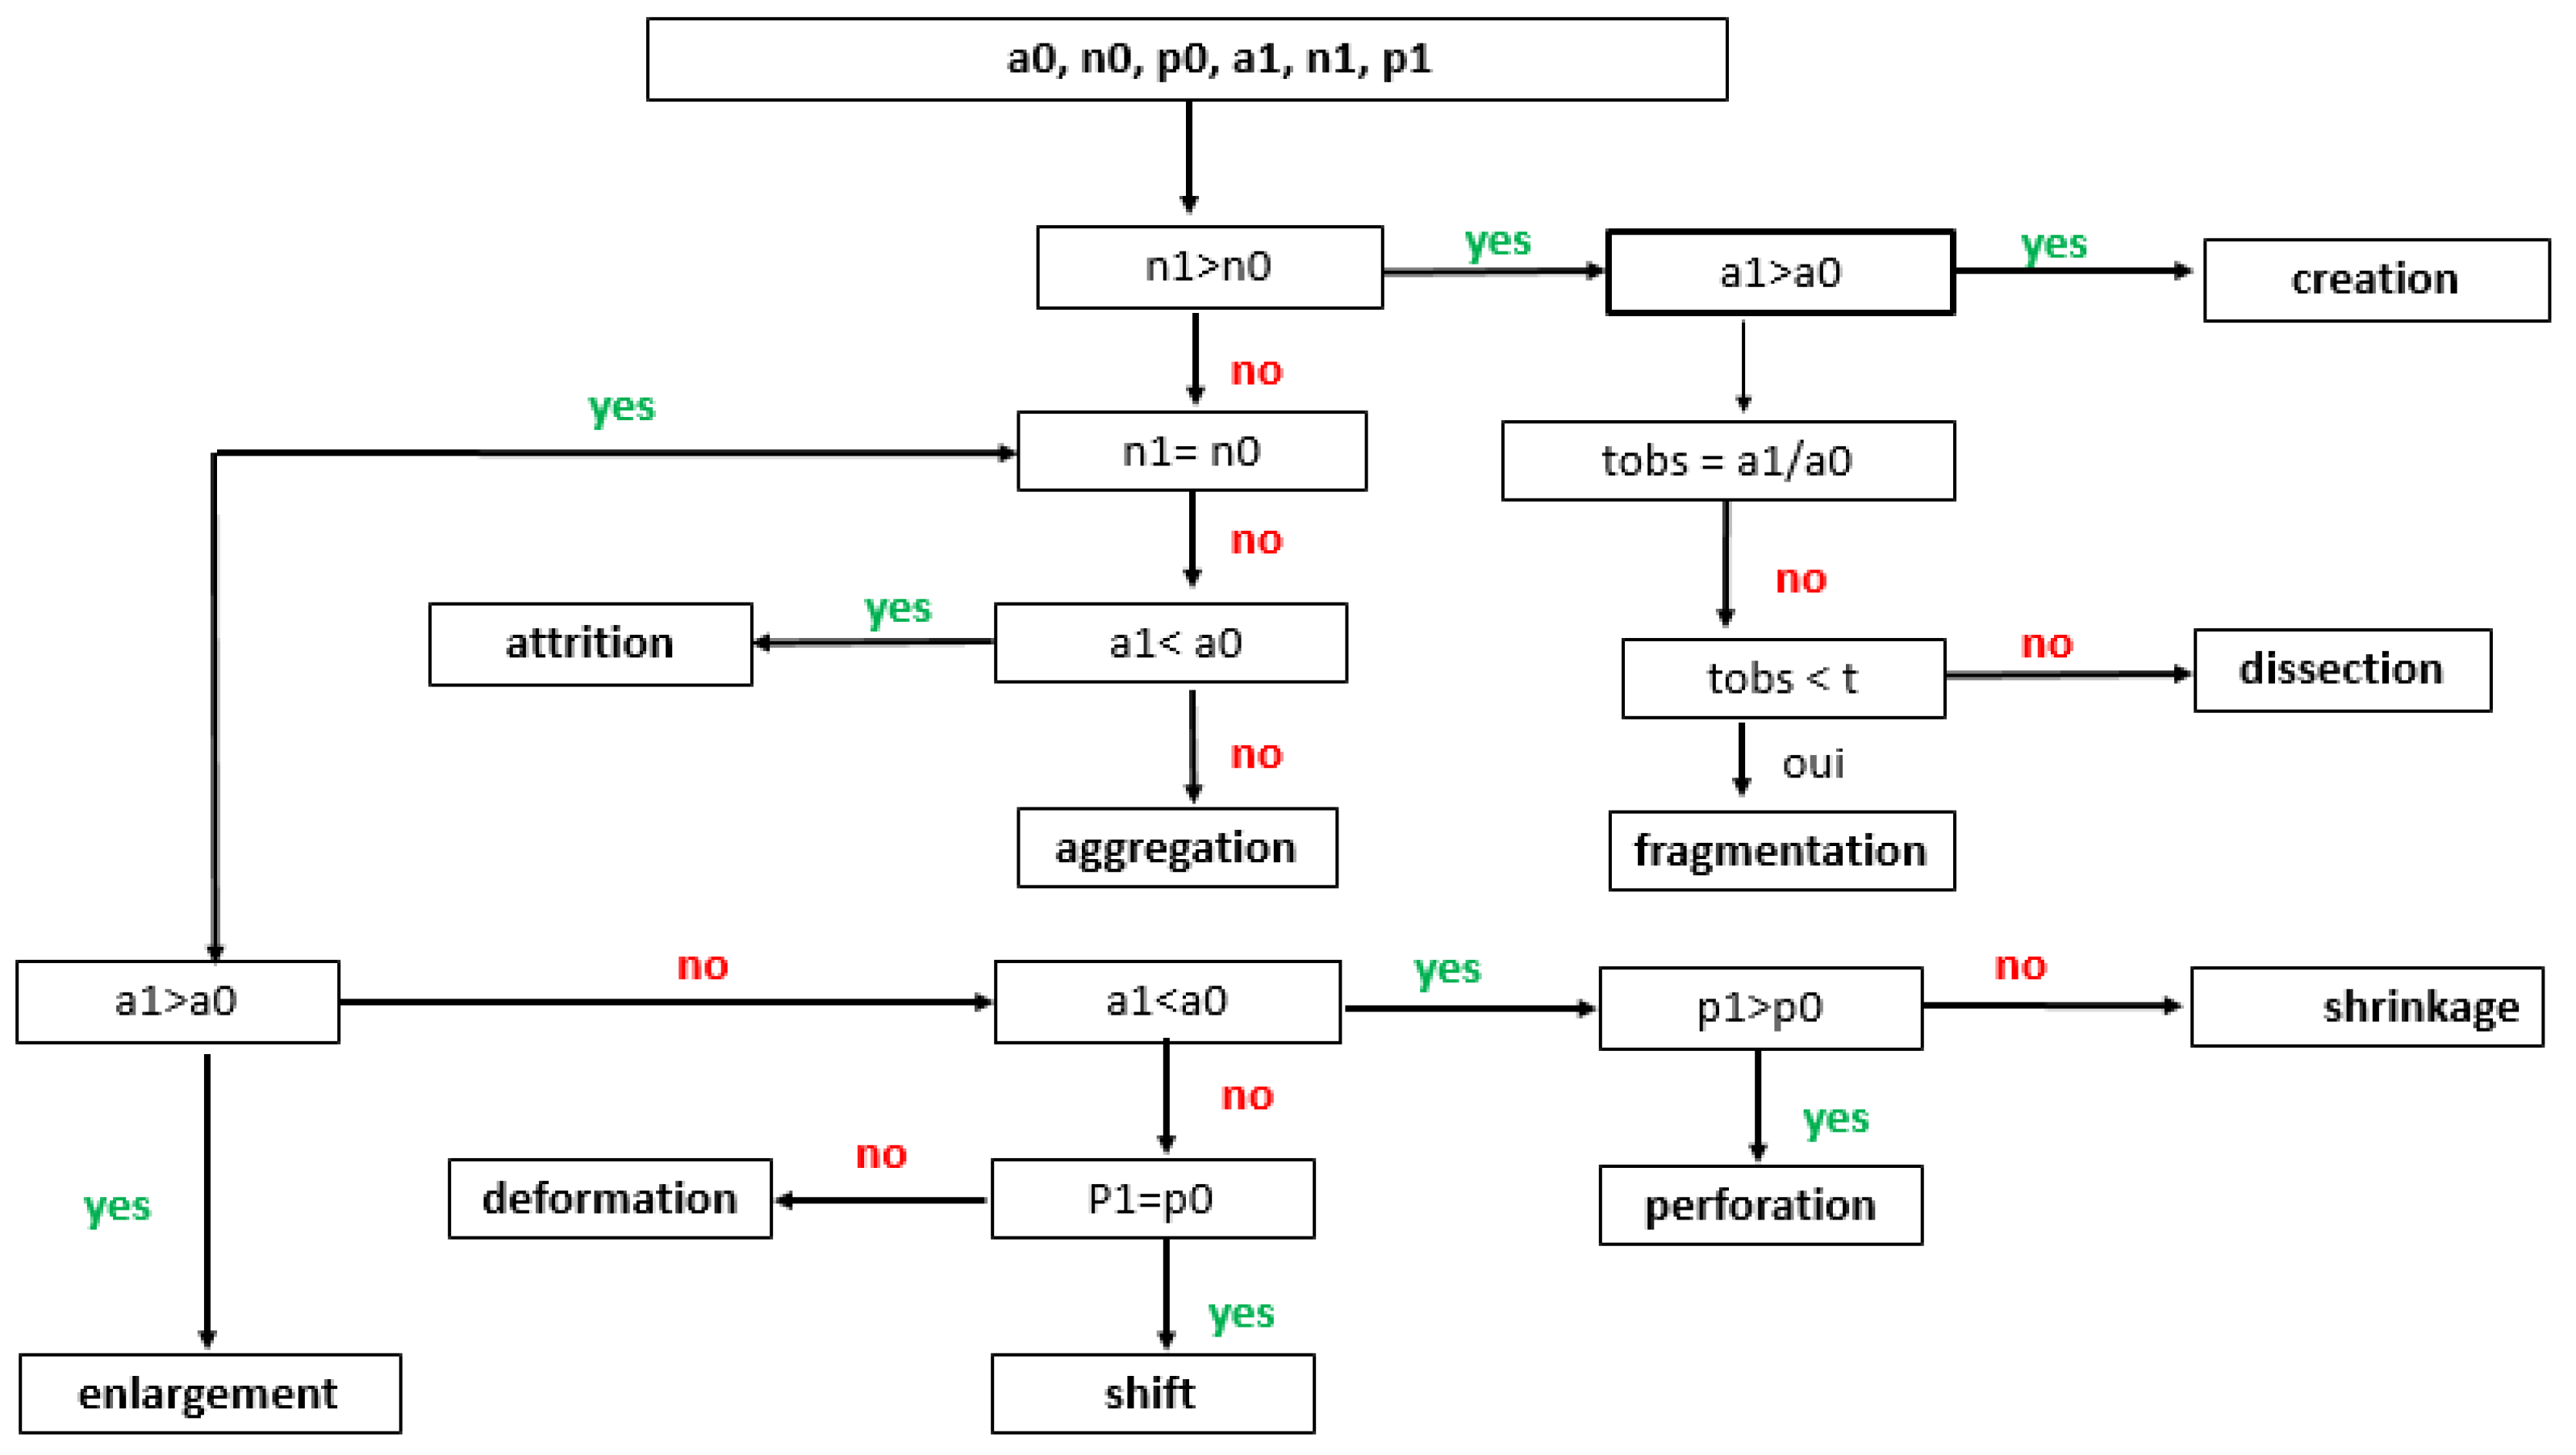
Figure 3.
Map of land cover dynamics in the Luki Reserve landscape from 2004 to 2024, derived from supervised classification of Landsat images using the “maximum likelihood” algorithm. The 2004 map shows a preponderance of dark green (forest) versus light green (savannah) and brown (fields and bare soils). The pink colour (fallow land) was also well represented in 2004, and red dots (inhabited areas) were scarce. These different hues evolved gradually up to 2024, when light green dominated the landscape and the brown hue increased, as did the size and number of red dots. The pink hue had disappeared by 2024.
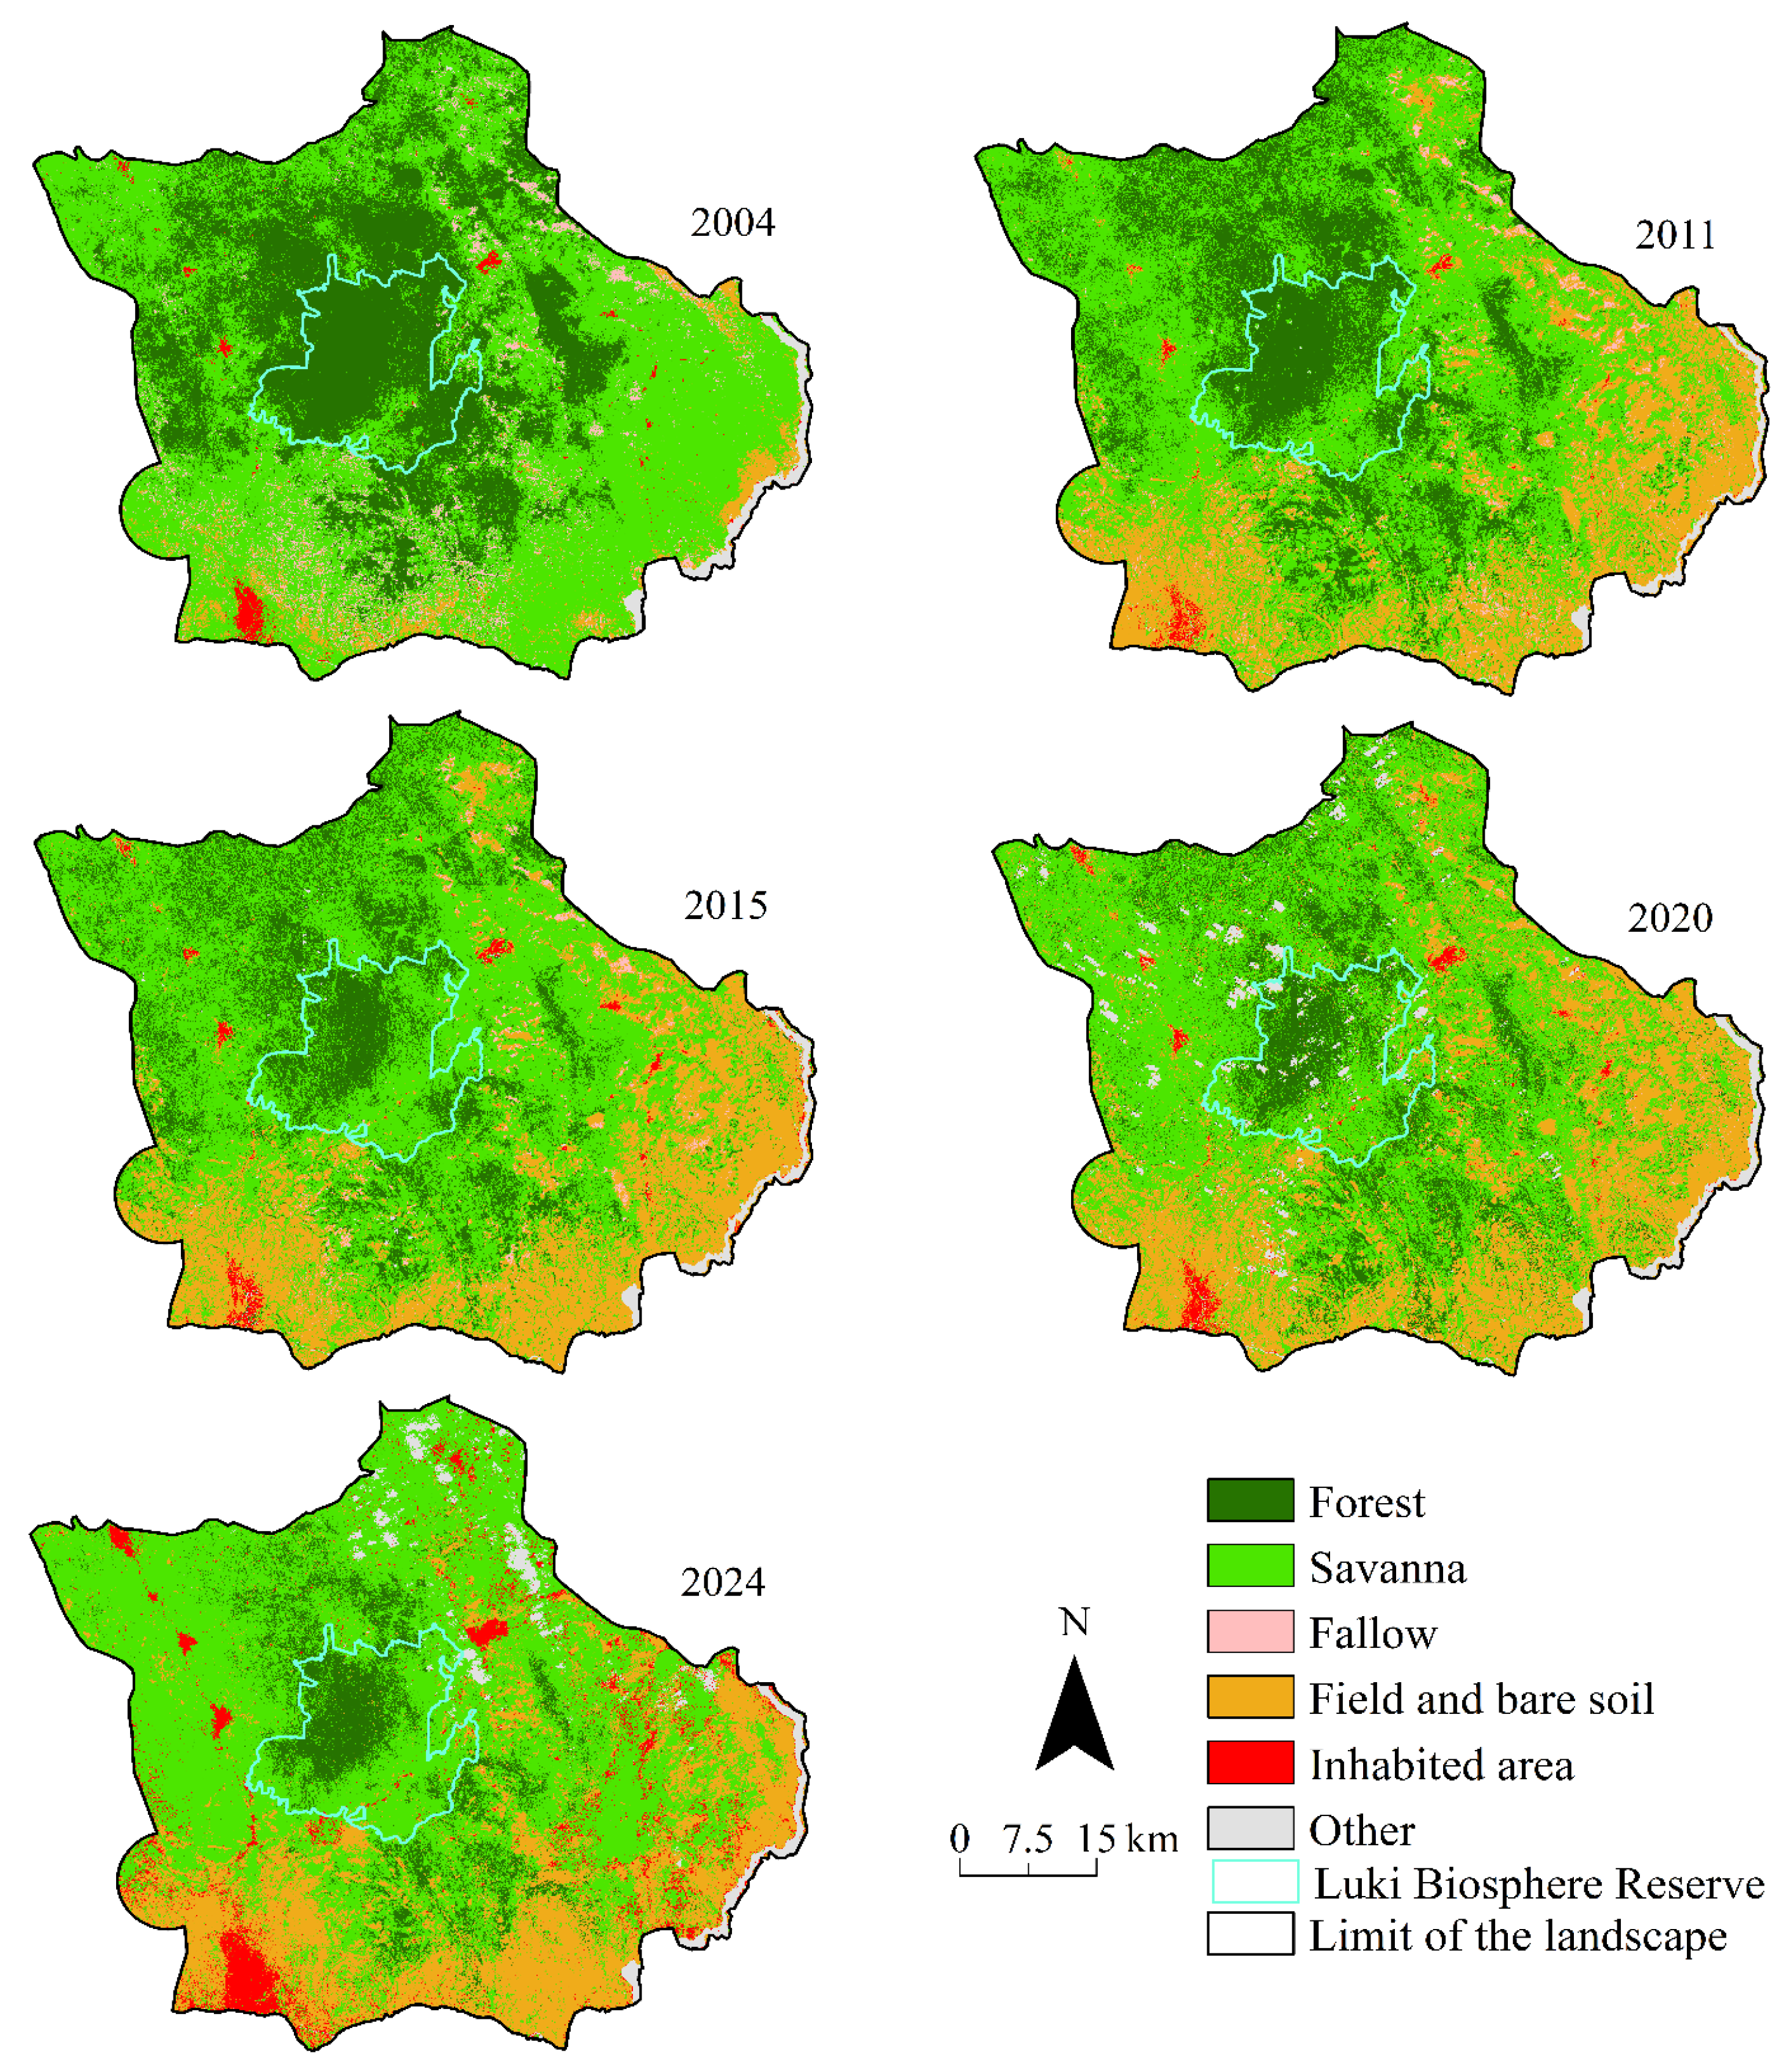
Figure 4.
Evolution of the anthropization index in the LBR, its periphery and, in entire landscape. The LBR remains the least anthropized area, unlike its periphery. The scarcity of forest resources in the peripheral zone will undoubtedly put pressure on the LBR. LBR, Luki Biosphere Reserve; PZ, peripheral.
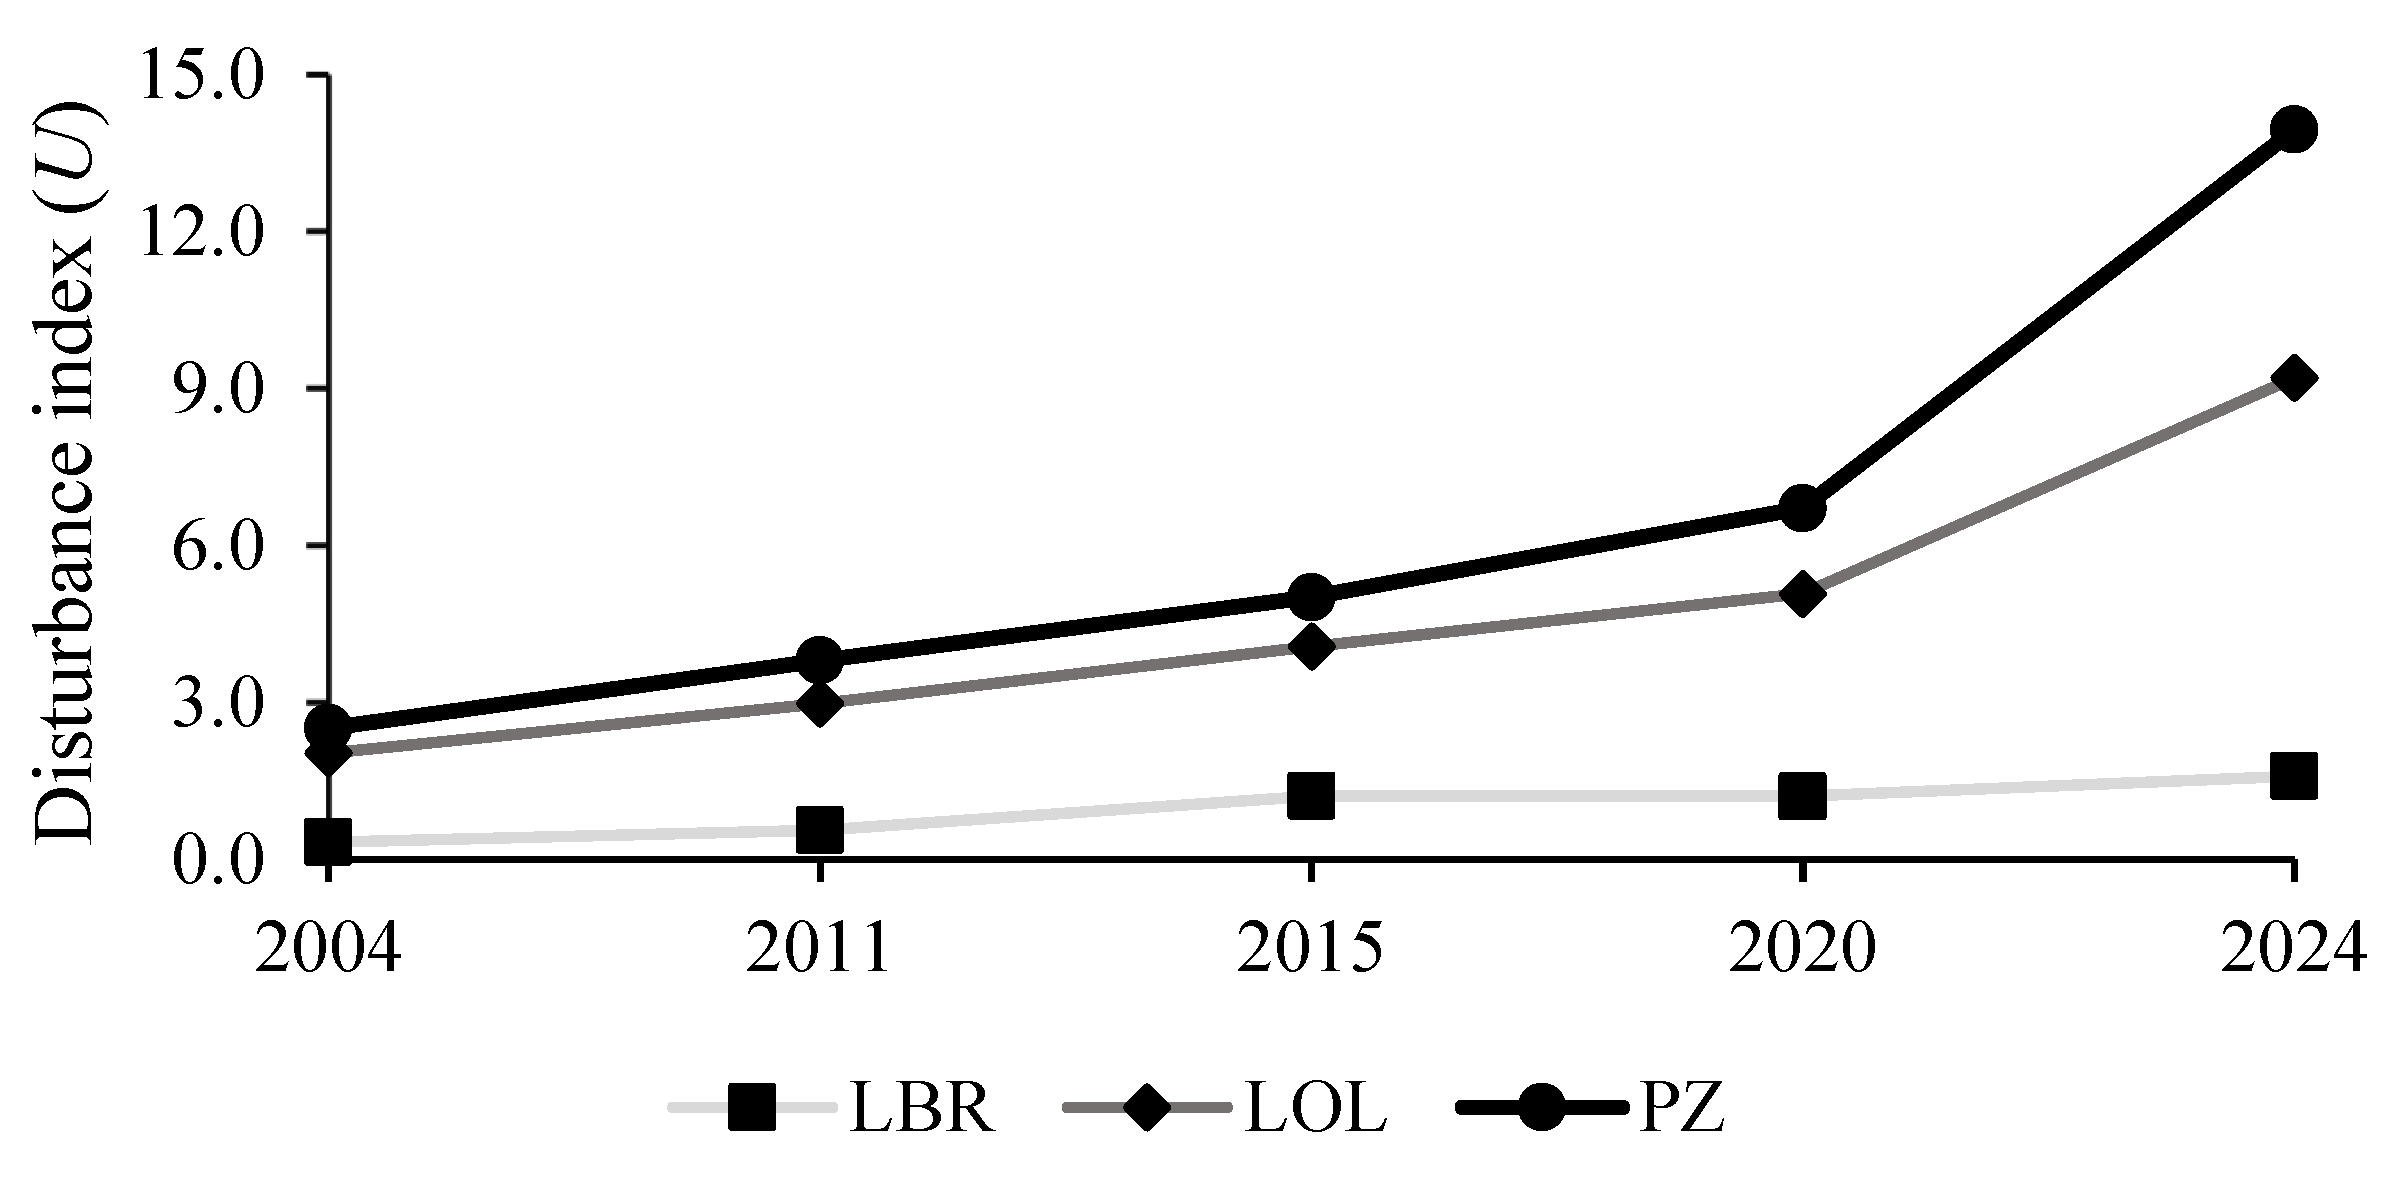

Table 1.
Land use classes obtained by supervised classification of Landsat images using the maximum likelihood algorithm in the region of interest.
Table 1.
Land use classes obtained by supervised classification of Landsat images using the maximum likelihood algorithm in the region of interest.
| Land use | Characteristics | ROI* | |
|---|---|---|---|
| Forests | Forests are habitats for edible caterpillars in the study area, with a high diversity of host trees (Lonpi et al., 2024). They include primary forest, secondary forest (plantations and savannahs under protection for natural regeneration) and forest galleries. | 30 | |
| Savannahs | Savannahs were considered to be grassy savannahs and shrub savannahs of anthropogenic origin, regularly subjected to bush fires and without fencing. The caterpillars consumed by the population in the study area are not dependent on the grasses of grassy savannahs. Also, repeated bushfires in anthropogenic savannahs do not allow the regeneration of forest forage species for the caterpillars consumed by the population. | 36 | |
| Fallow land | Fallows are pioneer vegetation that recolonizes bare soils. Like forests, fallow lands in the study area are a preferred habitat for caterpillar feeding populations in the LBR landscape. | 39 | |
| Fields and bare soil | These are areas where cassava, groundnuts, maize, and other crop plants are grown. According to the regional agricultural calendar, from mid-May to mid-October, there is a long dry season marked by field preparation operations (tree felling, clearing, and burning) leaving the soil devoid of plant cover. Because of their agricultural vocation and the need for charcoal, generally, the fields in the study area have no woody vegetation providing fodder for edible caterpillars, as trees are systematically felled during field preparation. | 59 | |
| Inhabited areas | Inhabited areas are settlements that were mostly established before and during the creation of the LBR. More recent settlements have been established over the last 30 years as a result of population growth. These settlements are surrounded by tree vegetation characterized by low diversity and irregularity of edible caterpillar host species (Lonpi et al., 2024). | 36 | |
*Region of interest.
Table 2.
Classification accuracy of Landsat 2004, 2011, 2015, 2020 and 2024 images based on the Maximum Likelihood Algorithm. Classification is statistically reliable. “Ua” stands for user accuracy (%) and ‘Pa’ for producer accuracy.
Table 2.
Classification accuracy of Landsat 2004, 2011, 2015, 2020 and 2024 images based on the Maximum Likelihood Algorithm. Classification is statistically reliable. “Ua” stands for user accuracy (%) and ‘Pa’ for producer accuracy.
| Image classification results:2004 | ||||||||
|---|---|---|---|---|---|---|---|---|
| Forests | Savannahs | Fallow lands | Fields and bare soils | Inhabited areas | Others | |||
| Ua | 100.0 | 95.0 | 82.5 | 97.5 | 72.5 | 100.0 | ||
| Pa | 95.2 | 95.0 | 97.1 | 68.4 | 72.5 | 100.0 | ||
| Overall accuracy 2004 : 90.90% | ||||||||
| Image classification results : 2011 | ||||||||
| Ua | 85.1 | 91.9 | 97.4 | 98.4 | 100.0 | 100.0 | ||
| Pa | 94.0 | 86.0 | 98.4 | 94.9 | 100.0 | 100.0 | ||
| Overall accuracy: 94.91% | ||||||||
| Image classification results : 2015 | ||||||||
| Ua | 100.0 | 100.0 | 93.5 | 91.7 | 94.9 | 100.0 | ||
| Pa | 100.0 | 100.0 | 100.0 | 91.7 | 89.2 | 100.0 | ||
| Overall accuracy: 97.47% | ||||||||
| Image classification results : 2020 | ||||||||
| Ua | 100.0 | 95.7 | 100.0 | 95.9 | 97.9 | 100.0 | ||
| Pa | 97.9 | 95.9 | 100.0 | 97.9 | 97.9 | 100.0 | ||
| Overall accuracy 2020 : 93.89% | ||||||||
| Image classification results : 2024 | ||||||||
| Ua | 100.0 | 96.7 | 98.0 | 93.9 | 94.9 | 100.0 | ||
| Pa | 98.6 | 92.6 | 100.0 | 94.7 | 98.6 | 100.0 | ||
| Overall accuracy2024 : 95.70% | ||||||||
Table 3.
Composition of the Luki Biosphere Reserve Landscape in 2004, 2011, 2015, 2020 and 2024 and proportion of changes in the 2004-2011, 2011-2015, 2015-2020, 2020-2024, 2004-2024 periods. Values are expressed in Km2 and as a percentage of the total area of each zone studied. At all three spatial scales, the area of savannah, fields and bare soil increased at the expense of forests and fallow lands.
| Changes in % | |||||||||||||||
|---|---|---|---|---|---|---|---|---|---|---|---|---|---|---|---|
| 2004 | 2011 | 2015 | 2020 | 2024 | 2011-2004 | 2015-2011 | 2020-2015 | 2024-2020 | 2024-2004 | ||||||
| Km2 | % | Km2 | % | Km2 | % | Km2 | % | Km2 | % | ||||||
| Luki Biosphere Reserve | |||||||||||||||
| Forest | 283.14 | 84.51 | 215.67 | 64.38 | 151.53 | 45.2 | 145.45 | 43.39 | 128.56 | 38.37 | -20.14 | -19.17 | -1.81 | -5.01 | -46.13 |
| Savannah | 49.44 | 14.76 | 115.88 | 34.59 | 180.25 | 53.77 | 158.54 | 47.29 | 196.59 | 58.68 | 19.82 | 19.18 | -6.47 | 11.39 | 43.93 |
| Fallow | 2.11 | 0.63 | 0.43 | 0.13 | 0.33 | 0.1 | 0.15 | 0.04 | 0.04 | 0.01 | -0.5 | -0.02 | -0.05 | -0.03 | -0.61 |
| Field & bare soil | 0.05 | 0.02 | 2.44 | 0.73 | 2.53 | 0.75 | 14.83 | 4.43 | 6.32 | 1.9 | 0.71 | 0.02 | 3.67 | -2.53 | 1.87 |
| Inhabited area | 0.25 | 0.08 | 0.04 | 0.01 | 0.18 | 0.06 | 0.63 | 0.2 | 2.17 | 0.64 | -0.06 | 0.04 | 0.13 | 0.46 | -0.07 |
| Other | 0.00 | 0.00 | 0.55 | 0.16 | 0.39 | 0.12 | 15.59 | 4.65 | 1.28 | 0.4 | 0.16 | -0.04 | 4.53 | -4.26 | 0.38 |
| Total | 335.00 | 100 | 335.00 | 100.00 | 335.00 | 100.00 | 335.00 | 100.00 | 335.00 | 100 | |||||
| Peripheral zone | |||||||||||||||
| Forest | 878.40 | 277 | 655 | 20.62 | 521.55 | 16.42 | 398.00 | 12.52 | 206.00 | 6.48 | -7.03 | -4.2 | -3.89 | -6.04 | -21.17 |
| Savanna | 1937.58 | 61 | 1650 | 51.94 | 1698.83 | 53.48 | 1666.70 | 52.46 | 1856.00 | 58.42 | -9.06 | 1.53 | -1 | 5.96 | -2.57 |
| Fallow | 160.40 | 5.04 | 57.28 | 1.8 | 39.29 | 1.23 | 8.72 | 0.27 | 0.71 | 0.02 | -3.24 | -0.56 | -0.96 | -0.25 | -5.02 |
| Field & bare soil | 121.63 | 3.82 | 764 | 24.05 | 847.12 | 26.66 | 962.49 | 30.29 | 828.40 | 26.1 | 20.22 | 2.61 | 3.63 | -4.21 | 22.25 |
| Inhabited area | 29.51 | 0.93 | 17.22 | 0.54 | 29.25 | 0.92 | 33.73 | 1.06 | 188.00 | 5.9 | -0.38 | 0.37 | 0.14 | 4.84 | 4.97 |
| Other | 49.00 | 1.54 | 33.3 | 1.05 | 41.01 | 1.29 | 107.42 | 3.4 | 97.97 | 3.08 | -0.49 | 0.24 | 2.09 | -0.29 | 1.54 |
| Total | 3177.00 | 100.00 | 3177.00 | 100.00 | 3177.00 | 100.00 | 3177.00 | 100.00 | 3177.00 | 100 | |||||
| Landscape | |||||||||||||||
| Forest | 1162.41 | 33.1 | 871.16 | 24.8 | 673.36 | 19.16 | 543.56 | 15.47 | 334.70 | 9.5 | -8.28 | -5.61 | -3.69 | -5.94 | -23.54 |
| Savanna | 1987.91 | 56.55 | 1766.7 | 50.26 | 1879.8 | 53.5 | 1826.00 | 51.96 | 2053.77 | 58.4 | -6.29 | 3.24 | -1.53 | 6.48 | 1.89 |
| Fallow | 162.62 | 4.63 | 57.746 | 1.64 | 39.619 | 1.12 | 8.87 | 0.25 | 0.75 | 0.02 | -2.98 | -0.51 | -0.87 | -0.23 | -4.6 |
| Field & bare soil | 121.79 | 3.501 | 766.82 | 21.81 | 849.85 | 24.2 | 977.55 | 27.82 | 835.02 | 23.76 | 18.35 | 2.37 | 3.63 | -4.05 | 20.29 |
| Inhabited area | 29.78 | 0.84 | 17.27 | 0.5 | 29.443 | 0.83 | 34.37 | 1 | 189.92 | 5.4 | -0.35 | 0.34 | 0.14 | 4.42 | 4.55 |
| Other | 49.26 | 1.40 | 34.058 | 1 | 41.517 | 1.2 | 123.18 | 3.5 | 99.60 | 3 | -0.43 | 0.21 | 2.32 | -0.67 | 1.43 |
| Total | 3514.00 | 100 | 3514.00 | 100.00 | 3514.00 | 100.00 | 3514.00 | 100.00 | 3514.00 | 100 | |||||
Table 4.
Land-use class configuration indices in 2004, 2011, 2020, 2024, and identification of the spatial transformation process (STP) based on the decision tree of Bogaert et al. (2004).
Table 4.
Land-use class configuration indices in 2004, 2011, 2020, 2024, and identification of the spatial transformation process (STP) based on the decision tree of Bogaert et al. (2004).
| Spatial scales | Forest | Savannah | Fallow land | Inhabited area | ||||
|---|---|---|---|---|---|---|---|---|
| a | n | a | n | a | n | a | n | |
| LBR2004 | 283.14 | 864 | 49.45 | 2366 | 2.11 | 311 | 0.25 | 42 |
| Peripheral zone2004 | 878.40 | 18804 | 1937.58 | 19872 | 160.40 | 32379 | 29.51 | 2246 |
| Landscape2004 | 1162.41 | 19561 | 1987.91 | 22107 | 162.62 | 32730 | 29.78 | 2289 |
| LBR2011 | 215.67 | 1440 | 115.88 | 3373 | 0.43 | 89 | 0.04 | 13 |
| Peripheral zone2011 | 655.00 | 18729 | 1650.95 | 17647 | 57.28 | 8866 | 17.82 | 1770 |
| Landcape2011 | 871.16 | 20011 | 1766.7 | 20820 | 57.74 | 8945 | 17.27 | 1781 |
| LBR2015 | 151.53 | 3123 | 180.25 | 3102 | 0.33 | 74 | 0.2 | 33 |
| Peripheral zone2015 | 521.55 | 26999 | 1698.83 | 15598 | 39.29 | 7011 | 29.25 | 1495 |
| Landscape2015 | 673.36 | 29900 | 1879.8 | 18526 | 39.61 | 7082 | 29.44 | 1526 |
| LBR2020 | 145.45 | 3601 | 158.54 | 3778 | 0.15 | 112 | 0.63 | 160 |
| Peripheral zone2020 | 398.00 | 39268 | 1666.70 | 15834 | 8.72 | 7353 | 33.73 | 3057 |
| Landscape2020 | 543.56 | 42631 | 1826.00 | 19427 | 8.87 | 7466 | 34.37 | 3213 |
| LBR2024 | 128.56 | 3022 | 196.59 | 3844 | 0.04 | 49 | 2.17 | 725 |
| Peripheral zone2024 | 206.1 | 18248 | 1856.00 | 20386 | 0.7 | 569 | 188.00 | 29870 |
| Landscape2024 | 334.7 | 21125 | 2053.77 | 24103 | 0.75 | 618 | 189.92 | 30631 |
Table 5.
Evolution of the dominance index of land-use classes between 2004 and 2024 within the Luki Biosphere Reserve, its periphery, and the LBR Landscape. For each spatial scale, savannah dominated. Until 2015, in the LBR, the landscape matrix was forest. Subsequently, from 2015 to 2024, the opposite situation was observed, with forests increasingly giving way to savannah.
| Luki Biosphere Reserve | |||||
|---|---|---|---|---|---|
| 2004 | 2011 | 2015 | 2020 | 2024 | |
| Forest | 80.68 | 54.96 | 32.43 | 30.41 | 32.65 |
| Fallow | 0.05 | 0.01 | 0.03 | 0.00 | 0.00 |
| Savanna | 6.77 | 18.14 | 38.88 | 30.95 | 50.47 |
| Inhabited area | 0.01 | 0.01 | 0.02 | 0.03 | 0.07 |
| Peripheral zone | |||||
| Forest | 11.74 | 8.16 | 2.61 | 0.91 | 0.70 |
| Fallow | 0.10 | 0.03 | 0.06 | 0.00 | 0.00 |
| Savanna | 55.45 | 43.30 | 47.34 | 44.58 | 52.61 |
| Inhabited area | 0.40 | 0.15 | 0.25 | 0.39 | 1.28 |
| Landscape | |||||
| Forest | 22.99 | 7.74 | 3.92 | 2.48 | 4.24 |
| Fallow | 0.09 | 0.02 | 0.03 | 0.00 | 0.00 |
| Savanna | 51.13 | 25.28 | 28.67 | 26.63 | 52.77 |
| Inhabited area | 0.36 | 0.08 | 0.14 | 0.21 | 1.16 |
Disclaimer/Publisher’s Note: The statements, opinions and data contained in all publications are solely those of the individual author(s) and contributor(s) and not of MDPI and/or the editor(s). MDPI and/or the editor(s) disclaim responsibility for any injury to people or property resulting from any ideas, methods, instructions or products referred to in the content. |
© 2025 by the authors. Licensee MDPI, Basel, Switzerland. This article is an open access article distributed under the terms and conditions of the Creative Commons Attribution (CC BY) license (https://creativecommons.org/licenses/by/4.0/).
Copyright: This open access article is published under a Creative Commons CC BY 4.0 license, which permit the free download, distribution, and reuse, provided that the author and preprint are cited in any reuse.


