Submitted:
16 April 2025
Posted:
17 April 2025
You are already at the latest version
Abstract
In this study, we examined the literature for cross section calculations from 2019 to 2023 using the ISI Web of Science (WOS) database to understand the dynamics of scientific communication. Our primary objective was to perform a bibliometric analysis and model networks among authors, texts, sources, citations, keywords, organizations, and countries. Using the R tool "Bibliometrix" and descriptive statistical techniques, we identified significant publication trends in co-authorship, citation patterns, institutional collaborations, and the geographic distribution of authorship. Our findings highlight the importance of international collaboration and interdisciplinary research. Our analysis for cross section calculations has uncovered significant publication trends, particularly regarding co-authorships, citation patterns, institutional collaborations, and the geographic origins of authors.
Keywords:
Bibliometric mapping
; Citation analysis
; Cross section
; R programming
1. Introduction
In the field of nuclear physics, both theoretical and experimental studies have played a pivotal role in the development of 20th-century physics. Experimental results from nuclear physics laboratories have contributed significantly to solving numerous intriguing problems. Quantitatively determining the probability of a nuclear reaction occurring has been elucidated through the cross-section concept. This quantitative parameter provides insights into the interaction between a projectile and a target, apart from the subsequent products. Therefore, it serves as a crucial source of information in various applications and fields involving nuclear processes. In its simplest definition, the cross-section represents the likelihood of a nuclear reaction process that takes place and is related to the characteristic properties of the target nucleus and projectile particles, such as energy, charge, and mass number.
The inherent complexity of problems in nuclear physics renders analytical solutions virtually impossible. Advances in science and technology have increased the intricacy of the issues. Progress in technology and computer systems has enabled the establishment of virtual nuclear physics laboratories and the execution of desired experiments and calculations in a computerized environment. Experimental results of nuclear reaction studies are vital for understanding fundamental nuclear physics. Since the energy dependence of nuclear reactions is not always well-known in detail, it is needed to investigate cross sections and spectral emission shapes for a wide variety of energy sources. Transient nuclei typically produced in reactors often have short half-lives, making its directly measuring cross sections and spectral emissions difficult. The most crucial step is to calculate these cross sections theoretically to save time.
Computer codes represent significant tools that facilitate ease and timesaving in theoretical research. Over time, one has developed various computer codes incorporating diverse approaches and nuclear models (e.g., GEANT, LAHET, FLUKA, ALICE91, ALICE-IPPE, GNASH, EMPIRE, TALYS, PCROSS, CEM95, etc.) to aid researchers in their studies. Researchers commonly utilize codes such as TALYS, ALICE/ASH, and EMPIRE, particularly in cross section studies, for two fundamental purposes: examining reactions without experimental data and validating theoretical models. TALYS and EMPIRE programs are the most widely used codes in contemporary research for these purposes [1-9].
Bibliometric studies are highly significant research methods for monitoring, analyzing, and evaluating scientific literature. Such studies provide a powerful tool for understanding changes, trends, and developments in the scientific world. Particularly for scientists, researchers, and decision-makers, bibliometric analyses help answer crucial questions such as which areas require more research, what topics are gaining more attention, and which research groups are leading the way. Bibliometric studies are also used to assess the impact and quality of scientific publications. Metrics like citation frequency, journal impact factors, and researcher H-indices have become significant criteria for evaluating scientific achievements. Therefore, researchers and institutions can use bibliometric analyses to assess their scientific performance and impact, guiding their research strategies. In this context, a good example of bibliometric studies is the study of radiation shielding investigated by Kılıçoğlu and Mehmetçik [10]. In this study, bibliometric analysis of reaction cross section calculations for the last five years has been investigated using R code.
2. Materials and Methods
Bibliometric analyses typically include the following key components: Data Collection, academic publications, articles, or other scientific sources. One usually obtains this data from bibliographic databases or libraries of research institutions. In Data Processing and Analysis, the collected data is processed and analyzed according to a specific methodology. At this stage, one evaluates impact factors, citations, topics, and other characteristics of publications using specific metrics and indicators. In Interpretation of Results, analysis results are interpreted and presented through various graphs, tables, and reports. One uses these comments to highlight trends and significant findings in the research field. In Application of Results, the results of bibliometric analysis can be used by academic institutions, funding agencies, and policymakers to develop academic strategies and direct resources [11-14]. Bibliometric analysis is a powerful tool for assessing the evolution and impact of scientific research, helping researchers better understand their work and track the overall development of the scientific community [15].
Bibliometric analysis is a method used to analyze scientific studies, academic publications, journals, and developments in research fields. This type of analysis is a significant tool for examining the size, development, impact, and trends of research fields. The data utilized in the bibliometric analysis comes from the SCI (Science Citation Index), a component of the Web of Science (WoS) core database, and functions as both a bibliographic and a citation database. WoS offers lists of articles and citations assigned to specific authors, institutions, or nations by minimizing differences and potential inaccuracies across various indices [16]. It also contains readily available tools that enable users to create bibliometric indicators for use in assessments. Furthermore, routines for performing bibliometric analysis, creating networks for co-citation, coupling, collaborative research, and co-word analysis are all part of bibliometrics [15].
In this study, one located the bibliometric data using the search term "Reaction Cross-section Calculation" on WoS from 2019 to 2003. Furthermore, one examined data manually pulled from WoS using the open-source R-tool "Bibliometrix," which automates data analysis and visualization.
Selecting source data for the document network adds to the complexity of scientific mapping. The citation-link method's crucial step is finding the pertinent document collection. The science cartographer then provides many possibilities. In Semantic similarity, the title may be based on many factors, such as keywords, extended keywords, Web of Science's Keyword Plus, and specialist headings or terminology, such as cross-section Headings.
Further development can be seen in linguistic parallels found in titles, abstracts, or entire works. Many papers listed in Scopus' and WoS's indexes have titles, abstracts, and keyword versions available. To do this, one downloaded all scientific studies from online databases or journal websites. Utilizing the studies in the archive and adding them to the bibliographic database makes extracting the pertinent contents from PDF, XML, or HTML files feasible. Within the scope of the study, one extracted bibliometric data from articles prepared on the subject of the cross-section from an online database under certain restrictions following the definition of bibliometric analysis, and one carried out the analyses with this data set. One can use the WoS database for bibliometric analysis study.
The dataset was utilized with the following restrictions: scanned in the WOS database, articles containing cross-section reaction calculations as keywords, published and accepted articles, and those published or accepted for publication between 2019, and September 2023 were considered for this study. Both "article" and "early access article" were included in the data filter, resulting in a total assessment of 1769 items sourced from 271 references. 23 of these 1769 items fall under the early access category. 108 of the examined publications are single authors, written by 87 different authors. Table 1 provides a comprehensive summary of the data extraction from the WoS database.
One used R programming language and RStudio editor to code the model created for analyzing the obtained bibliometric data. While the features of the R programming language were listed, it was stated that ready-made packages and functions could be used for different analyses. One has also developed these packages and functions to perform bibliometric analyses [15], [17].
3. Results
Data visualization is a way of graphically representing quantitative information. In this sense, one carried out different data visualization studies in different fields [18-20]. For the academic community, using data visualization has given rise to an analysis called "Bibliometric analysis." In the bibliometric analysis, one visualizes data of a specific research field, such as the number of citations, most productive countries, academic collaboration networks, most productive authors, etc. Then, one reports the last situation and trends in this field by analyzing the visualized data. The research field of this study is "Reaction Cross Section Calculation.
3.1. Analysis of Annual Production and Average Citations
Figure 1 represents the annual number of scientific publications produced between 2019 and 2023. The number of publications related to nuclear cross-section studies started to decrease after 2021, although it didn’t remarkably change between 2019 and 2021, as seen in Figure 1. This change began by decreasing from approximately 400 publications in 2021 to approximately 350 publications in 2022. This decline continued sharply with the number of publications remaining below 250 between 2022 and 2023.
When examining the average citations of these publications per year (Figure 2), it is seen that the average citations between 2021 and 2023 support the decrease in the number of nuclear cross-section publications between 2021 and 2023. Although there was a decrease in the annual average citations between 2019 and 2021, one determined a drastic decrease after 2021, like the analysis of the number of studies.
3.2. Analysis of Authors and Their Countries, Affiliations and Collaborations
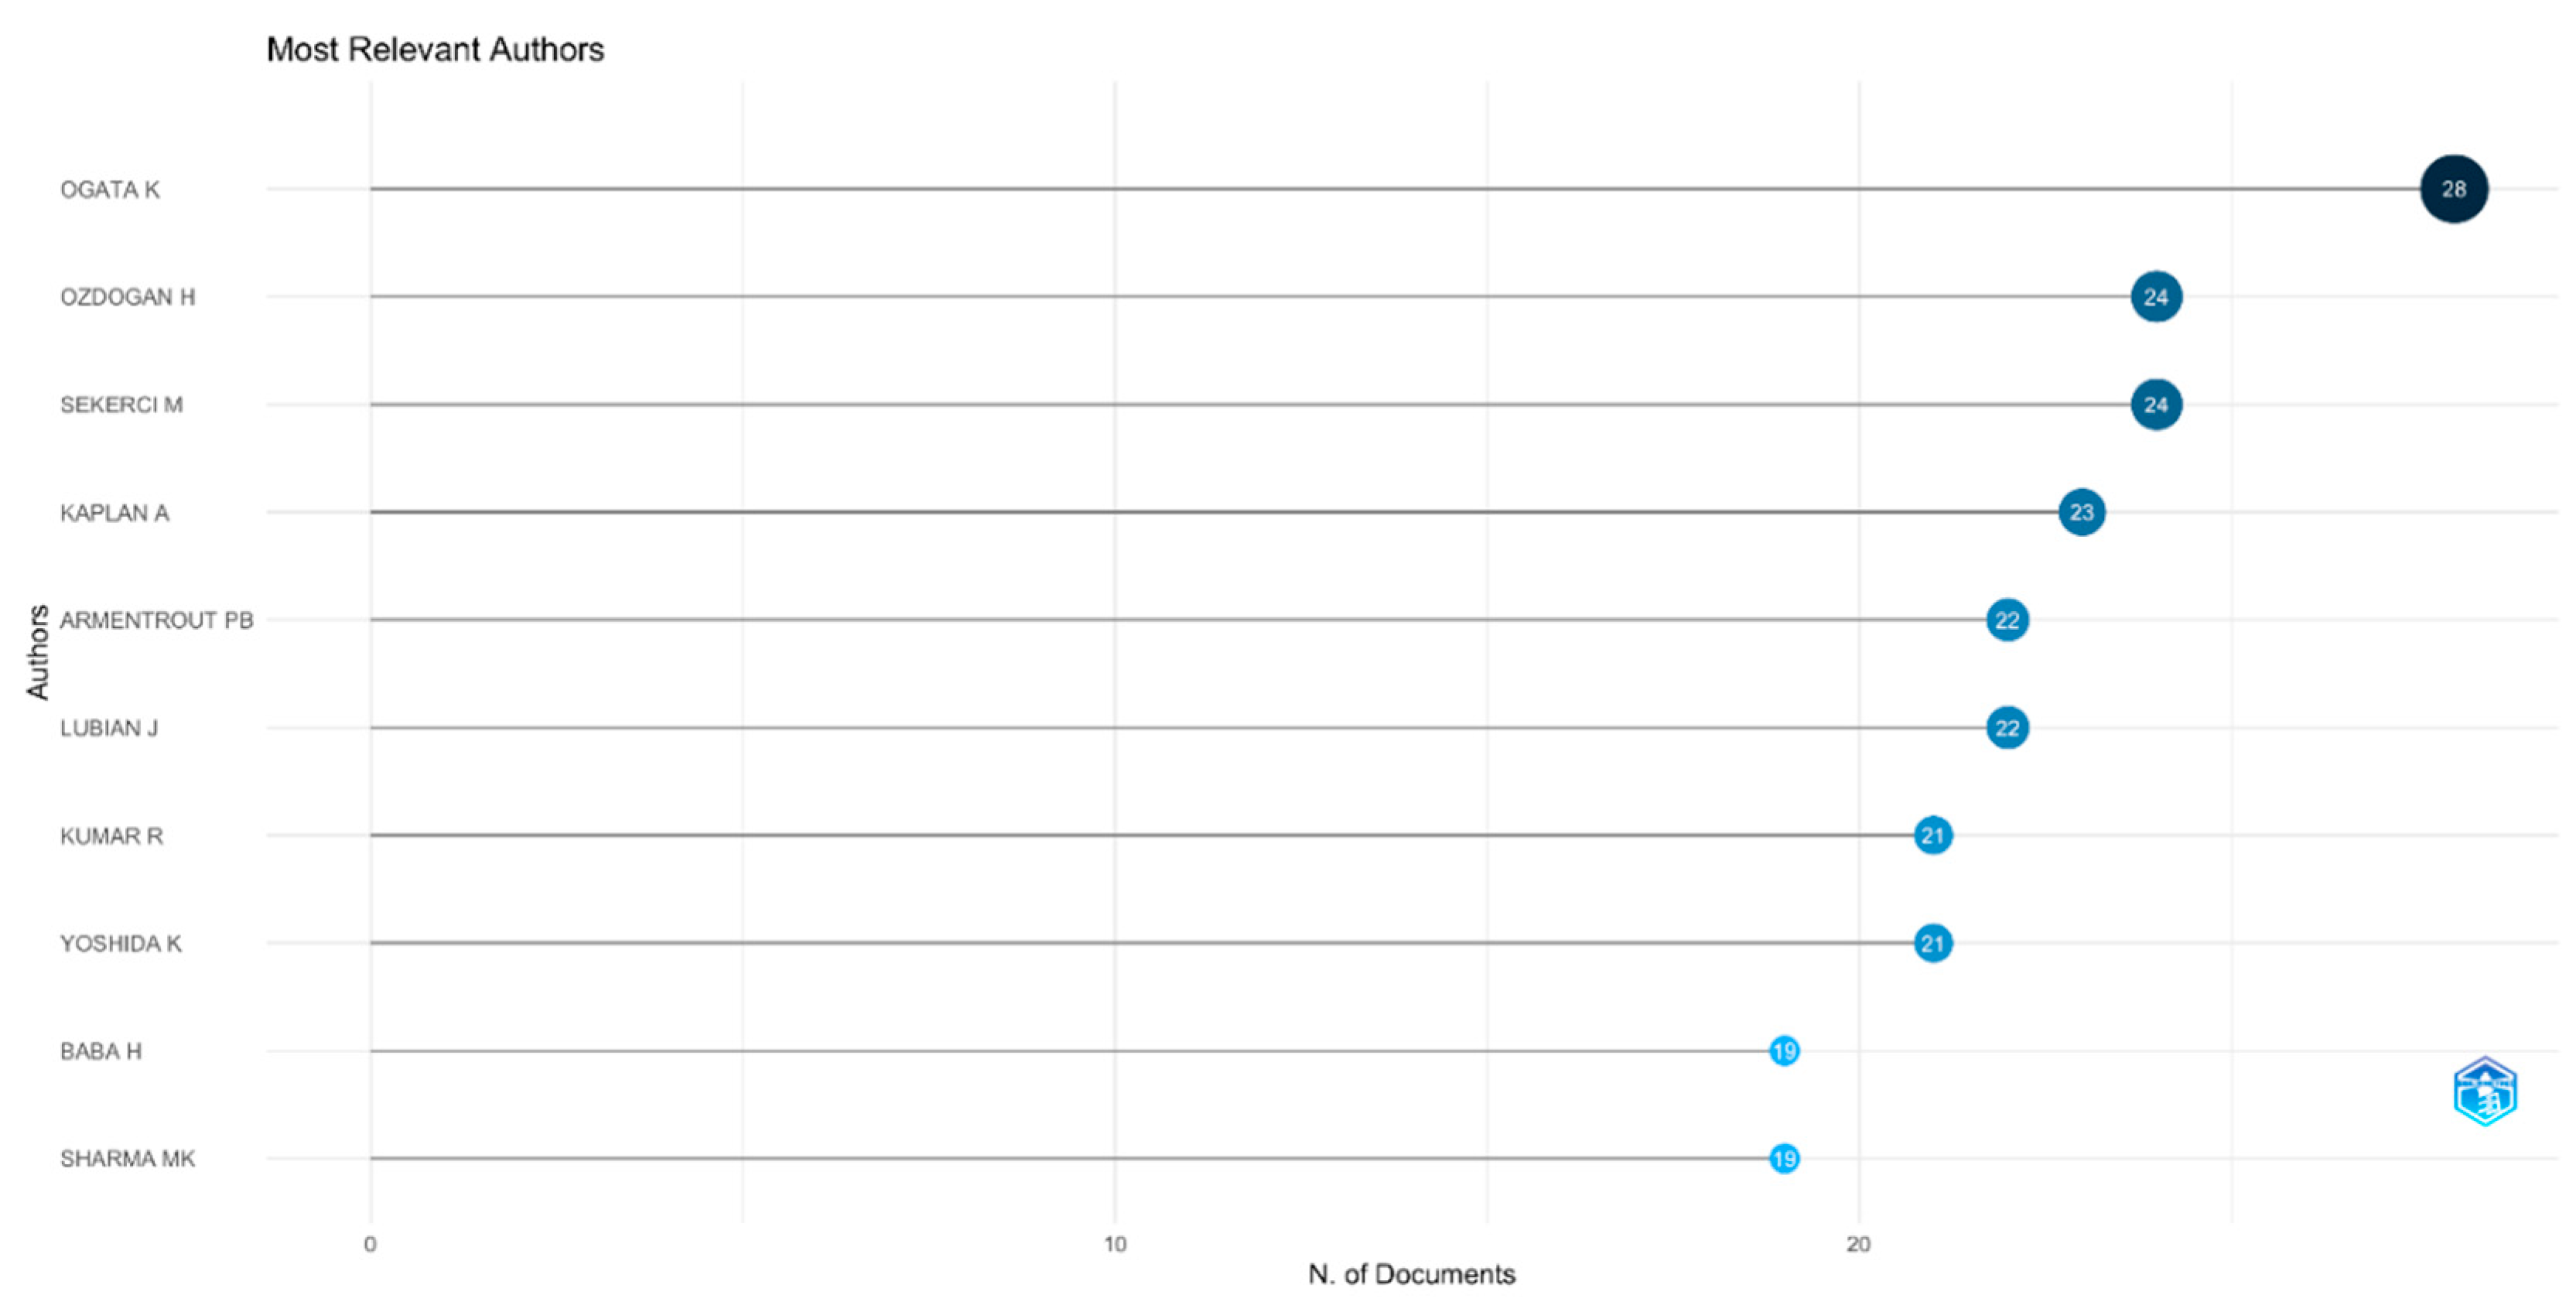
Figure 3. shows the authors who have contributed the most to the field of nuclear cross-section by actively producing publications in the last five years. Generally, there is not much difference in the number of publications between the first eight authors. However, the author who published the most in this field (with 28 publications) is Ogata, K. The other authors who contributed the most to the field (with 24 publications each) are Özdoğan, H. And Şekerci, M. The third author who contributed the most to the field (with 23 publications) is Kaplan, A.
Figure 3.
The number of scientific publications produced in terms of author between 2019 and 2023.
However, when examining Figure 4, which shows the productivity of authors over time, Ogata K. stood out with both the number of articles and citations in 2019, while there was a decrease in the number of his articles in 2023. Figure 4 shows Kumar R. as the most productive author in 2023. When examining the productivities of Özdoğan H., Şekerci M, and Kaplan A., the second and third most productive authors in this field between 2019 and 2023, they have maintained their publication stability in terms of productivity without any explicit changes.
Figure 3.
Top authors’ production over the time (between 2019-2023)
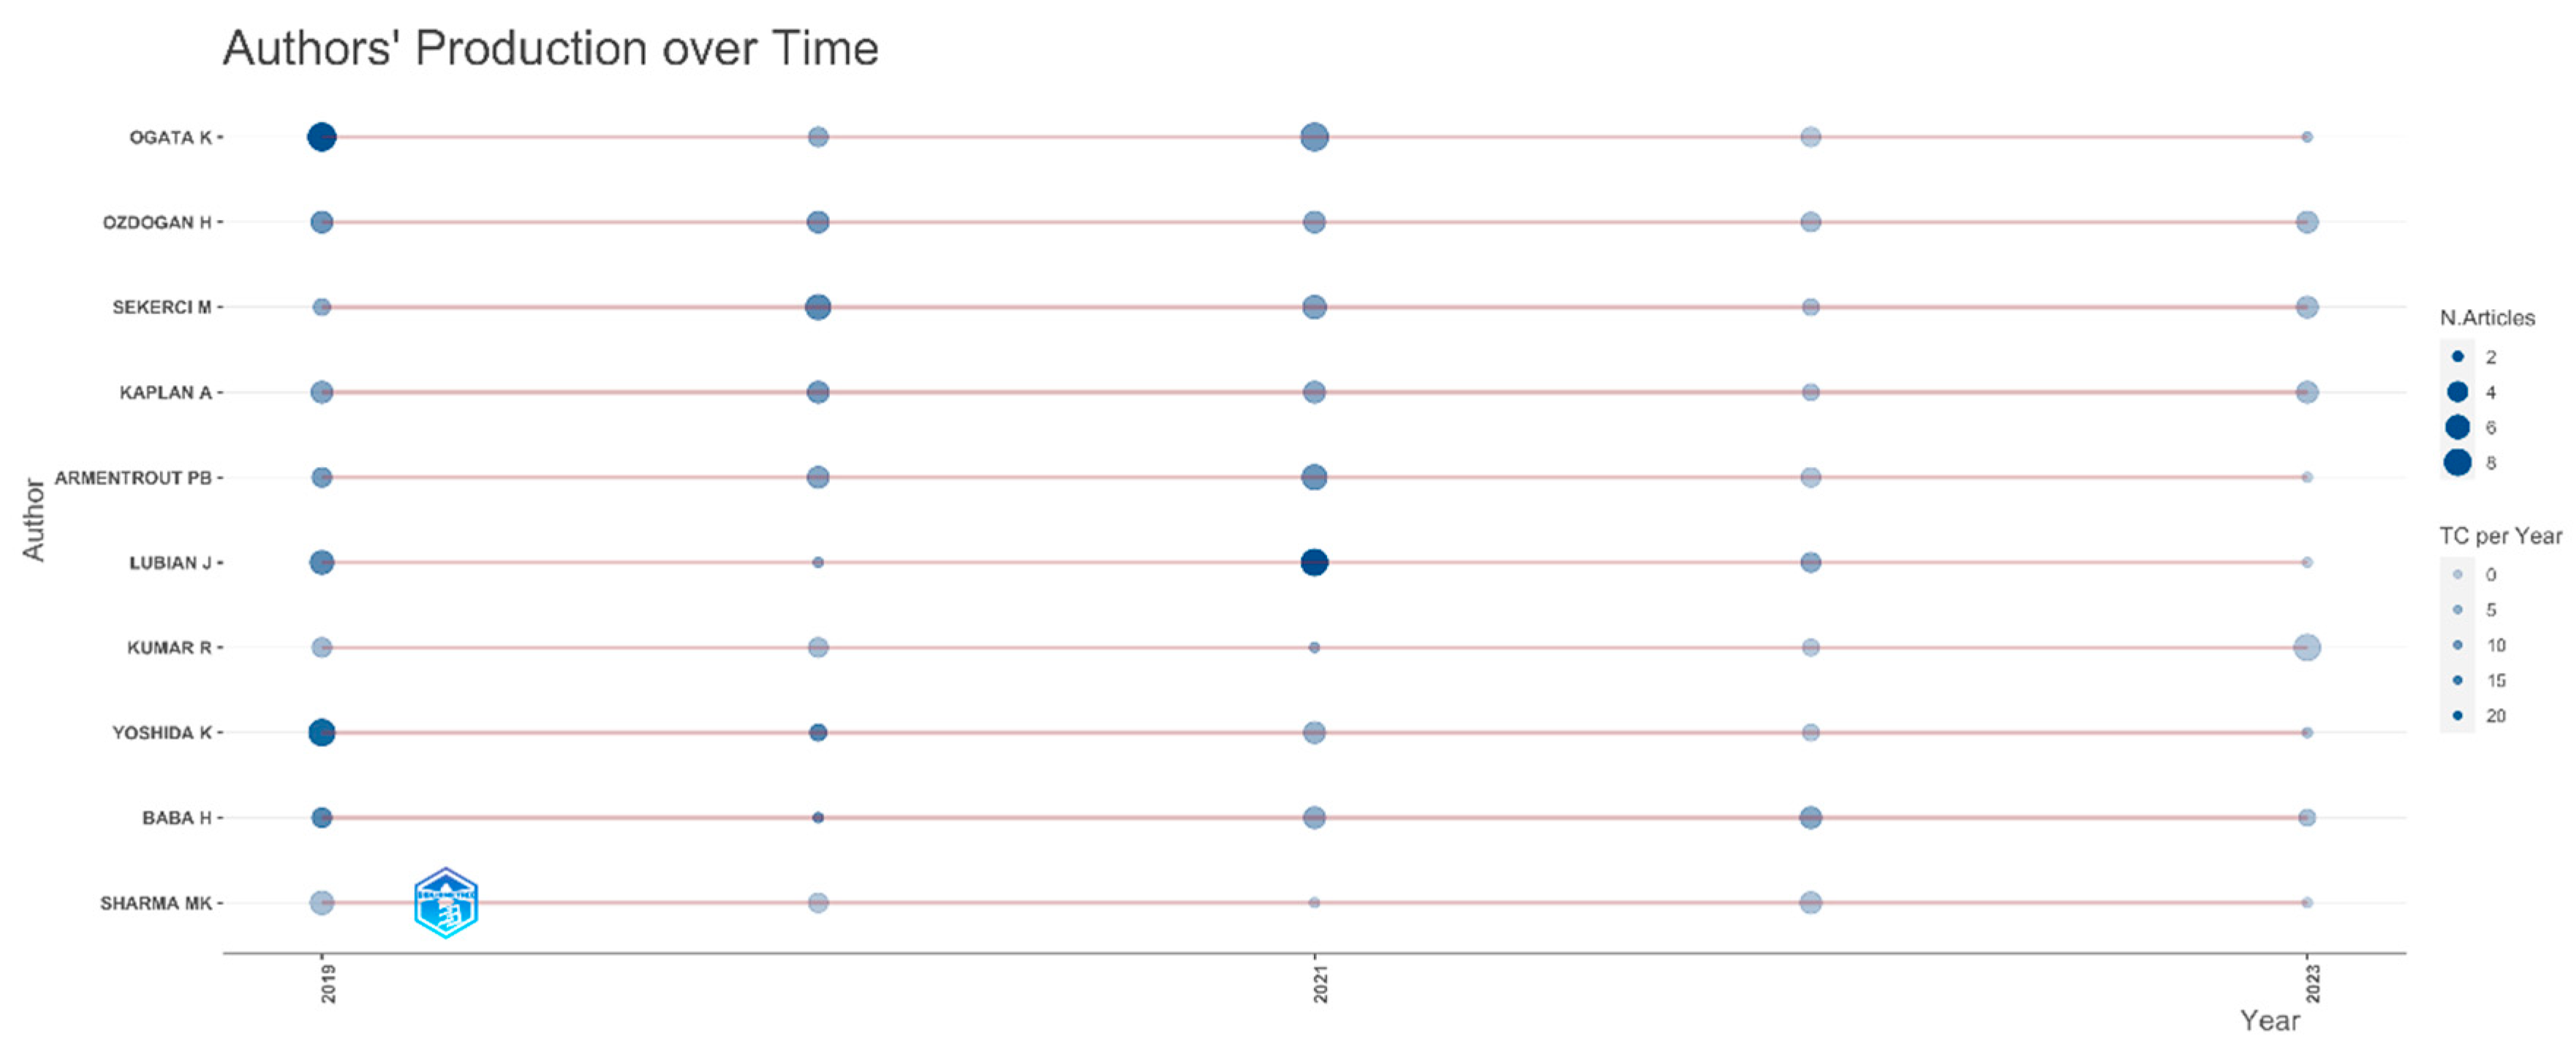
Lotka’s law, one of the bibliometric analysis methods, logarithmically describes the relationship between the number of authors and the number of authors’ contributions [21]. In this context, when examining Figure 4, one can see the number of each author’s contributions ranging from one to approximately twenty-eight papers. However, in this process, it is noticeable that although more than 60 authors produced only one manuscript in this field, very few authors produced a noteworthy number of articles for this research field.
Figure 5 shows the corresponding countries for the reaction cross-section calculations between 2019 and 2023. In this figure, the country that has the most publications is China. However, most of its publications are single-country publications. Also, China has the most single country publication between these countries. Despite that, one sees clearly that the USA, the second country with the most publications, has the most multiple-country publications. In addition, it is seen that the vast majority of publications in Turkey are single-country publications. That is why the most interesting data in this figure has belonged to Turkey.
In brief, one concludes that researchers in the USA tend to conduct collaborative studies in the reaction cross-section calculations field more than researchers in other countries. In Figure 6, one shows a map of these collaborations. The "Country Collaboration Map" presents a visual representation of the scientific collaborations between countries in the field of research, presumably related to cross-section calculations or another specific academic domain. The countries are represented by the landmasses in light blue, and the connections between them are indicated by lines. The density of lines between the two countries signifies the intensity of their collaboration. The thickest and most numerous lines are colored in deep red, suggesting a high volume of collaborations. These connections appear most prominently between North American and European countries, indicating a strong network of research collaboration across the Atlantic. There are also significant connections within Europe, suggesting a robust intracontinental collaborative research network. The map shows notable connections extending from North America and Europe towards East Asia, particularly to countries like China and Japan, indicating active international collaborations. Lines connecting to and from Australia, although fewer, suggest that it is also engaged in international research collaborations, albeit to a lesser extent than the aforementioned regions. South America, Africa, and parts of Asia show a sparser network of lines, implying that while there is an international collaboration, it is less dense compared to the North American-European-East Asian axis. It’s important to note the directional aspect of the lines which could indicate the flow or balance of collaboration; however, this map does not seem to provide directional arrows. This map can be instrumental for researchers and policymakers to visualize and understand the global landscape of scientific partnerships. The extent of collaborations can reflect not only the current state of research ties but also potential areas for future development. Moreover, it can highlight the importance of international cooperation in advancing scientific knowledge and innovation.
Figure 7 reports the most cited countries in this field between 2019 and 2023. In this figure, it is clearly seen that the country with the most citations is the USA, with 1450 citations. China follows the USA with 1400 citations. The third most cited country is Germany. Considering Figure 5 and Figure 6, the result shows that countries that work collaboratively are more likely to receive more citations.
The most global cited documents and the most locally cited documents were presented in Figure 8 and Figure 9, respectively. Also, the top ten documents with global and local citations were given in Table 2 with DOI numbers. As seen in Figure 8, the document by Alvarado et. al., in the journal Energy Environ Sci, leads with 258 global citations, indicating a high level of international recognition and influence within the scientific community [22]. Following this, both document written by Güsten and published in Nature [23], and other one written by Vuitton et. al. and published in Icarus [25] have also received a significant number of global citations (105 and 104, respectively), suggesting these works are also widely acknowledged and referenced in the field.
The most local cited documents, which might refer to citations within a specific region, country, or community, were given in Figure 9. The document written by Özdoğan et. al. and published in Applied Radiation and Isotopes [6] has the highest local citation count at 15, indicating its prominence within the local or specialized scholarly community. Close behind are documents, written by Kawano et. al. and published in Nuclear Data Sheets [24], and written by Xu et. al. and published in Physical Review C [38], with 14 and 13 local citations, respectively, which suggests these documents are also significant in local or specialized discussions and research.
Figure 10 shows the most locally cited authors in the field of cross-section calculations. Özdoğan H. leads with the highest number of local citations, totaling 99. This suggests that Ozdogan H.'s contributions to the field are highly recognized and referenced within the local or specific academic community. Sekerci M. follows as the second most cited author, with 89 local citations, and Kaplan A. has received 86 local citations, placing this author third in terms of local impact, which underlines their crucial role in the research community's local context. Authors Lubian J., Souliotis G., and Soukeras V. show a substantial number of citations, with 76, 70, and 70, respectively, demonstrating their strong presence and influence in local scholarly work. The graph continues with Torresi D., Cappuzzello F., Pakou A., and Acosta L., who have received fewer citations compared to the top-tier authors but still show notable local influence with citation counts ranging from 64 to 31. The distribution of citations reflects the prominence and influence of specific researchers within local scientific circles. High local citation counts typically indicate that the author's work has been well-received and frequently utilized by peers within a specific region or community, suggesting a focused impact that may or may not extend to the global scientific community.
3.3. Analysis of Journals
When examining the journal that published the manuscripts in Figure 11, data shows that Physical Review C is the top journal with the highest number of articles published in this field, with 365 articles between 2019 and 2023. The second most published journal in this field is European Physical Journal A with 67 articles. It is seen that third place is shared by Applied Radiation and Isotopes and Journal of Physical Chemistry A with 60 publications. Bradford’s Law is used to analyze the productivity of journals in more detail and to determine the core journals in this field (Figure 12).
Accordingly, one ranks journals according to the number of articles they publish periodically. In this way, while fundamental journals are in particular numbers in the first rows, an increasing number of journals are observed in the following regions, as in Figure 12. In parallel with Figure 11, Bradford’s Law reports that Journal of Physical Review C stands out in the nuclear reaction cross section, as in Figure 12. According to this figure, the European Physical Journal, Applied Radiation and Isotopes, Journal of Physical Chemistry A, and Physical Chemistry Chemical Physics are the core journals for publication in this field.
3.4. Analysis of Co-Words
One can use trend topics to predict the topics covered by periodically produced studies in this field or current issues. One uses keywords of the publications to determine trend topics for this research field. For example, in Figure 13, while the trend topics of the manuscripts published in this field in 2019 were related to transition state, coefficients, and forces, it is seen that "cross-section calculations" and "nat" were discussed only between 2022 and 2023.
Using common word networks, one can analyze the relationship between keywords used in publications and their usage in the field. In this context, common words associated with publications also provide information about the topics in the publications. The most commonly used terms for the nuclear reaction cross-section area are visualized as a word map tree in Figure 14. The first five words that stand out in this field are cross-sections, scattering, model, excitation functions, and nuclei.
In addition to common word analysis, as in Figure 15, one can obtain a thematic relationship-development graph of the relevant field using different relationships for analysis and looking at them from a broad perspective. In this way, one can make clearer inferring about the development direction of the field. As in Figure 15, this thematic map consists of four fundamental themes: engine, basic, emerging and disappearing, and niche. Niche theme refers to very specific themes. This graph shows that the words "state, chemistry, and potential-energy surfaces" are in the niche region. On the other hand, the words "cross-section, scattering, dynamics" are located in the basic field. The words "excitation-function, library, nuclear-data sheets" are located in both niche and motor themes, as in Figure 15.
4. Conclusions
In this study, one carried out a careful examination of the most influential cross-section research studies, employing sophisticated bibliometric analyses. Also, one transcended mere scrutiny of cross-section publications, journals, and authors and endeavored to unravel intricate intellectual and social networks through a comprehensive descriptive-analytical framework. In addition, one meticulously identified and analyzed the most prolific contributors to cross-section research at the author level. With the advanced bibliometric techniques, one delved into their collaboration and citation networks, meticulously quantifying and qualifying their impact on the field.
The employment of R programming in this analysis enhances the depth of a study, allowing for the examination of coding practices, analytical methodologies, and trends shaping the computational landscape within cross-section studies. In this study, one carried out a granular assessment, considering citation counts, reference lists, and the intricate network of connections between distinct articles. Here, the integration of R programming becomes particularly useful as one unravels the nuances of data manipulation, statistical analyses, and visualization techniques employed in cross-section research. In source-level metrics, our study discerns key journals hosting cross-section studies and evaluates their impact factors. The integration of R programming in this context allows us to scrutinize the role of data-driven decision-making in the selection of journals, providing insights into the intersection of computational methodologies and editorial choices.
Our multifaceted approach resulted in a holistic view covering annual scientific production, citation-based accolades for notable papers, identifying the most productive researchers, analyzing influential countries, and determining average citations per country. Noteworthy is that a group of well-established authors has recently come together in a cross-section research environment, increasing their scientific prominence since 2019. In addition to these quantitative analyses, this study reveals intriguing insights into social and intellectual clusters within the cross-section research field. Network analysis, a quintessential aspect of bibliometrics, reveals the dynamic structure at micro (individuals), meso (institutions), and macro (systemic/country) levels. The integration of R programming in network analysis unveils the computational intricacies governing collaborative patterns, information flow, and knowledge exchange within cross-section research. Through this comprehensive analysis, one contributes perspectives to the evolving landscape of cross-section studies, shedding light on the quantitative and computational dimensions that shape this dynamic field.
Author Contributions
Conceptualization, H.Ö. and Y.A.Ü.; Methodology, H.Ö., Y.A.Ü. and G.S.; Software, H.Ö.; Validation, H.Ö., Y.A.Ü. and G.S.; Formal Analysis, H.Ö., Y.A.Ü. and G.S.; Investigation, H.Ö..; Resources, H.Ö., Y.A.Ü. and G.S.; Data Curation, H.Ö.; Writing – Original Draft Preparation, H.Ö., Y.A.Ü. and G.S.; Writing – Review & Editing, H.Ö., Y.A.Ü. and G.S..; Visualization, H.Ö., Y.A.Ü. and G.S.; Supervision, H.Ö.; Project Administration, H.Ö.;
Funding
The present research received no specific grant from any funding agency in the public, commercial, or not-for-profit sectors.
Institutional Review Board Statement
Not applicable.
Data Availability Statement
The original contributions presented in the study are included in the article, further inquiries can be directed to the corresponding author.
Acknowledgments
The present research received no specific grant from any funding agency in the public, commercial, or not-for-profit sectors.
Conflicts of Interest
The authors declare no conflicts of interest.
References
- Kaplan, A.; Özdoğan, H.; Aydın, A.; and Tel, E. (γ,2n) Reaction Cross Section Calculations on Several Structural Fusion Materials. Journal of Fusion Energy, 2013, 32, 431–436. [Google Scholar] [CrossRef]
- Yettou, L. and Belgaid M., Calculation of pre-equilibrium effects in neutron-induced cross section on 32,34 S isotopes using the EMPIRE 3.2 code. EPJ Web Conf 2015, 100, 01009. [Google Scholar] [CrossRef]
- Azizakram, H.; Sadeghi, M.; Ashtari, P.; and Zolfagharpour, F. An overview of 124I production at a medical cyclotron by ALICE/ASH, EMPIRE-3.2.2 and TALYS-1.6 codes. Applied Radiation and Isotopes 2016, 112, 147–155. [Google Scholar] [CrossRef] [PubMed]
- Gandhi, A.; et al. Cross section calculation of (n,p) and (n,2n) nuclear reactions on Zn, Mo and Pb isotopes with ∼14 MeV neutrons, J Radioanal Nucl Chem 2019, 322, 89–97. [Google Scholar] [CrossRef]
- Özdoğan, H. , Theoretical calculations of production cross–sections for the 201Pb, 111In 18F and 11C radioisotopes at proton induced reactions, Applied Radiation and Isotopes, 2019, 143, 1–5.
- Özdoğan, H.; Şekerci, M.; and Kaplan, A. , Investigation of gamma strength functions and level density models effects on photon induced reaction cross–section calculations for the fusion structural materials 46,50Ti, 51V, 58Ni and 63Cu, Applied Radiation and Isotopes, 2019, 143, 6–10.
- Özdoğan, H.; Şekerci, M.; and Kaplan, A. , A new developed semi-empirical formula for the (α,p) reaction cross-section at 19±1 MeV, Mod Phys Lett A, 2019, 34, 1950044.
- Olorunsola A., B.; Bamikole J., A.; Bello A., A.; Ikumapayi O., M.; and Adaramola B., A. Model calculation and evaluation of neutron induced reaction cross-section on 237Np, 241Am and 245Cm using EMPIRE 3.2 code. AIP Conf Proc 2023, 2754, 030010. [Google Scholar]
- Kaplan, A.; Sarpün İ., H.; Aydın, A.; Tel, E.; Çapalı, V.; and Özdoǧan, H. , (γ, 2n)-Reaction cross-section calculations of several even-even lanthanide nuclei using different level density models, Physics of Atomic Nuclei, 2015, 78, 53–64.
- Kilicoglu, O. and Mehmetcik H., Science mapping for radiation shielding research, Radiation Physics and Chemistry, 2021, 189, 109721.
- Lawani S., M. , Bibliometrics: Its Theoretical Foundations, Methods and Applications, 1981, 31(Jahresband), 294–315.
- Andrés, A. , Measuring Academic Research: How to Undertake a Bibliometric Study. 2009.
- Martin, B. What can bibliometrics tell us about changes in the mode of knowledge production? Prometheus 2011, 29, 455–479. [Google Scholar] [CrossRef]
- Mering, M. , In Lay Terms: Bibliometrics: Understanding Author-, Article- and Journal- Level Metrics, Serials Review, 2017, 43, 0.
- Aria, M. and Cuccurullo C., bibliometrix: An R-tool for comprehensive science mapping analysis, J Informetr, 2017, 11, 959–975.
- Neuhaus, C. and Daniel H.-D., Data Sources for Performing Citation Analysis: An Overview. Journal of Documentation 2008, 64, 193–210. [Google Scholar] [CrossRef]
- McLean, M. , RefManageR: Import and Manage BibTeX and BibLaTeX References in R, The Journal of Open Source Software, 2017, 2.
- Healy, K. and Moody J., Data Visualization in Sociology, Annu Rev Sociol, 2014, 40, 105–128.
- Perin, C.; Vuillemot, R.; Stolper C., D.; Stasko J., T.; Wood, J.; and Carpendale, S. , State of the Art of Sports Data Visualization, Computer Graphics Forum, 2018, 37, 663–686.
- Zakaria M., S. , Data visualization as a research support service in academic libraries: An investigation of world-class universities, The Journal of Academic Librarianship, 2021, 47, 102397.
- Kawamura, M.; Thomas C. D., L.; Tsurumoto, A.; Sasahara, H.; and Kawaguchi, Y. , Lotka’s law and productivity index of authors in a scientific journal, J Oral Sci, 2000, 42, 75–78.
- Alvarado, J.; et al. Bisalt ether electrolytes: a pathway towards lithium metal batteries with Ni-rich cathodes. Energy Environ Sci 2019, 12, 780–794. [Google Scholar] [CrossRef]
- Güsten, R.; et al. , Astrophysical detection of the helium hydride ion HeH+, Nature, 2019, 568, 357–359.
- Kawano, T.; et al. , IAEA Photonuclear Data Library 2019, Nuclear Data Sheets, 2020, 163, 109–162.
- Vuitton, V.; Yelle R., V.; Klippenstein S., J.; Hörst S., M.; and Lavvas, P. Simulating the density of organic species in the atmosphere of Titan with a coupled ion-neutral photochemical model. Icarus 2019, 324, 120–197. [Google Scholar] [CrossRef]
- Xu, Y.; Han, Y.; Liang, H.; Wu, Z.; Guo, H.; and Cai, C. , Global optical model potential for the weakly bound projectile Be 9, Phys Rev C, 2019, 99, 034618.
- Liu, X.; Huang, Y.; Ding, L.; Zhao, X.; Liu, P.; and Li, T. , Synthesis of covalently bonded reduced graphene oxide-Fe3O4 nanocomposites for efficient electromagnetic wave absorption, J Mater Sci Technol, 2021, 72, 93–103.
- Evoli, C.; Aloisio, R.; and Blasi, P. , Galactic cosmic rays after the AMS-02 observations, Physical Review D, 2019, 99, 103023.
- Wu, Z. and Guo L., Microscopic studies of production cross sections in multinucleon transfer reaction $^{58}\mathrm{Ni}+^{124}\mathrm{Sn}$, Phys Rev C, 2019, 100, 14612.
- Mossa, V.; et al. The baryon density of the Universe from an improved rate of deuterium burning. Nature 2020, 587, 210–213. [Google Scholar] [CrossRef] [PubMed]
- Duer, M.; et al. , Direct observation of proton-neutron short-range correlation dominance in heavy nuclei, Phys Rev Lett, 2019, 122, 172502.
- Carbone, D.; et al. , Analysis of two-nucleon transfer reactions in the Ne 20+ Cd 116 system at 306 MeV, Phys Rev C, 2020, 102, 044606.
- Liang, Y.; et al. Benzene decomposition by non-thermal plasma: A detailed mechanism study by synchrotron radiation photoionization mass spectrometry and theoretical calculations. J Hazard Mater 2021, 420, 126584. [Google Scholar] [CrossRef] [PubMed]
- Parashari, S.; et al. , Systematic analysis of the neutron-induced reaction cross sections for natMo isotopes within 10--20 MeV, Phys Rev C, 2019, 99, 44602.
- Elmaghraby E., K.; Mohamed G., Y.; and Al-abyad, M. , Experimental investigation and nuclear model calculations for proton induced reactions on indium around thresholds, Nucl Phys A, 2019, 984, 112–132.
- Rocco, N.; Barbieri, C.; Benhar, O.; De Pace, A.; and Lovato, A. , Neutrino-nucleus cross section within the extended factorization scheme, Phys Rev C, 2019, 99, 25502.
- Spatafora, A.; et al. Ne 20+ Ge 76 elastic and inelastic scattering at 306 MeV. Phys Rev C 2019, 100, 034620. [Google Scholar] [CrossRef]
- Xu, Y.; Han, Y.; Liang, H.; Wu, Z.; Guo, H.; and Cai, C. , Global optical model potential for the weakly bound projectile $^{9}\mathrm{Be}$, Phys Rev C, 2019, 99, 34618.
Figure 1.
The annual number of scientific publications produced between 2019 and 2023.
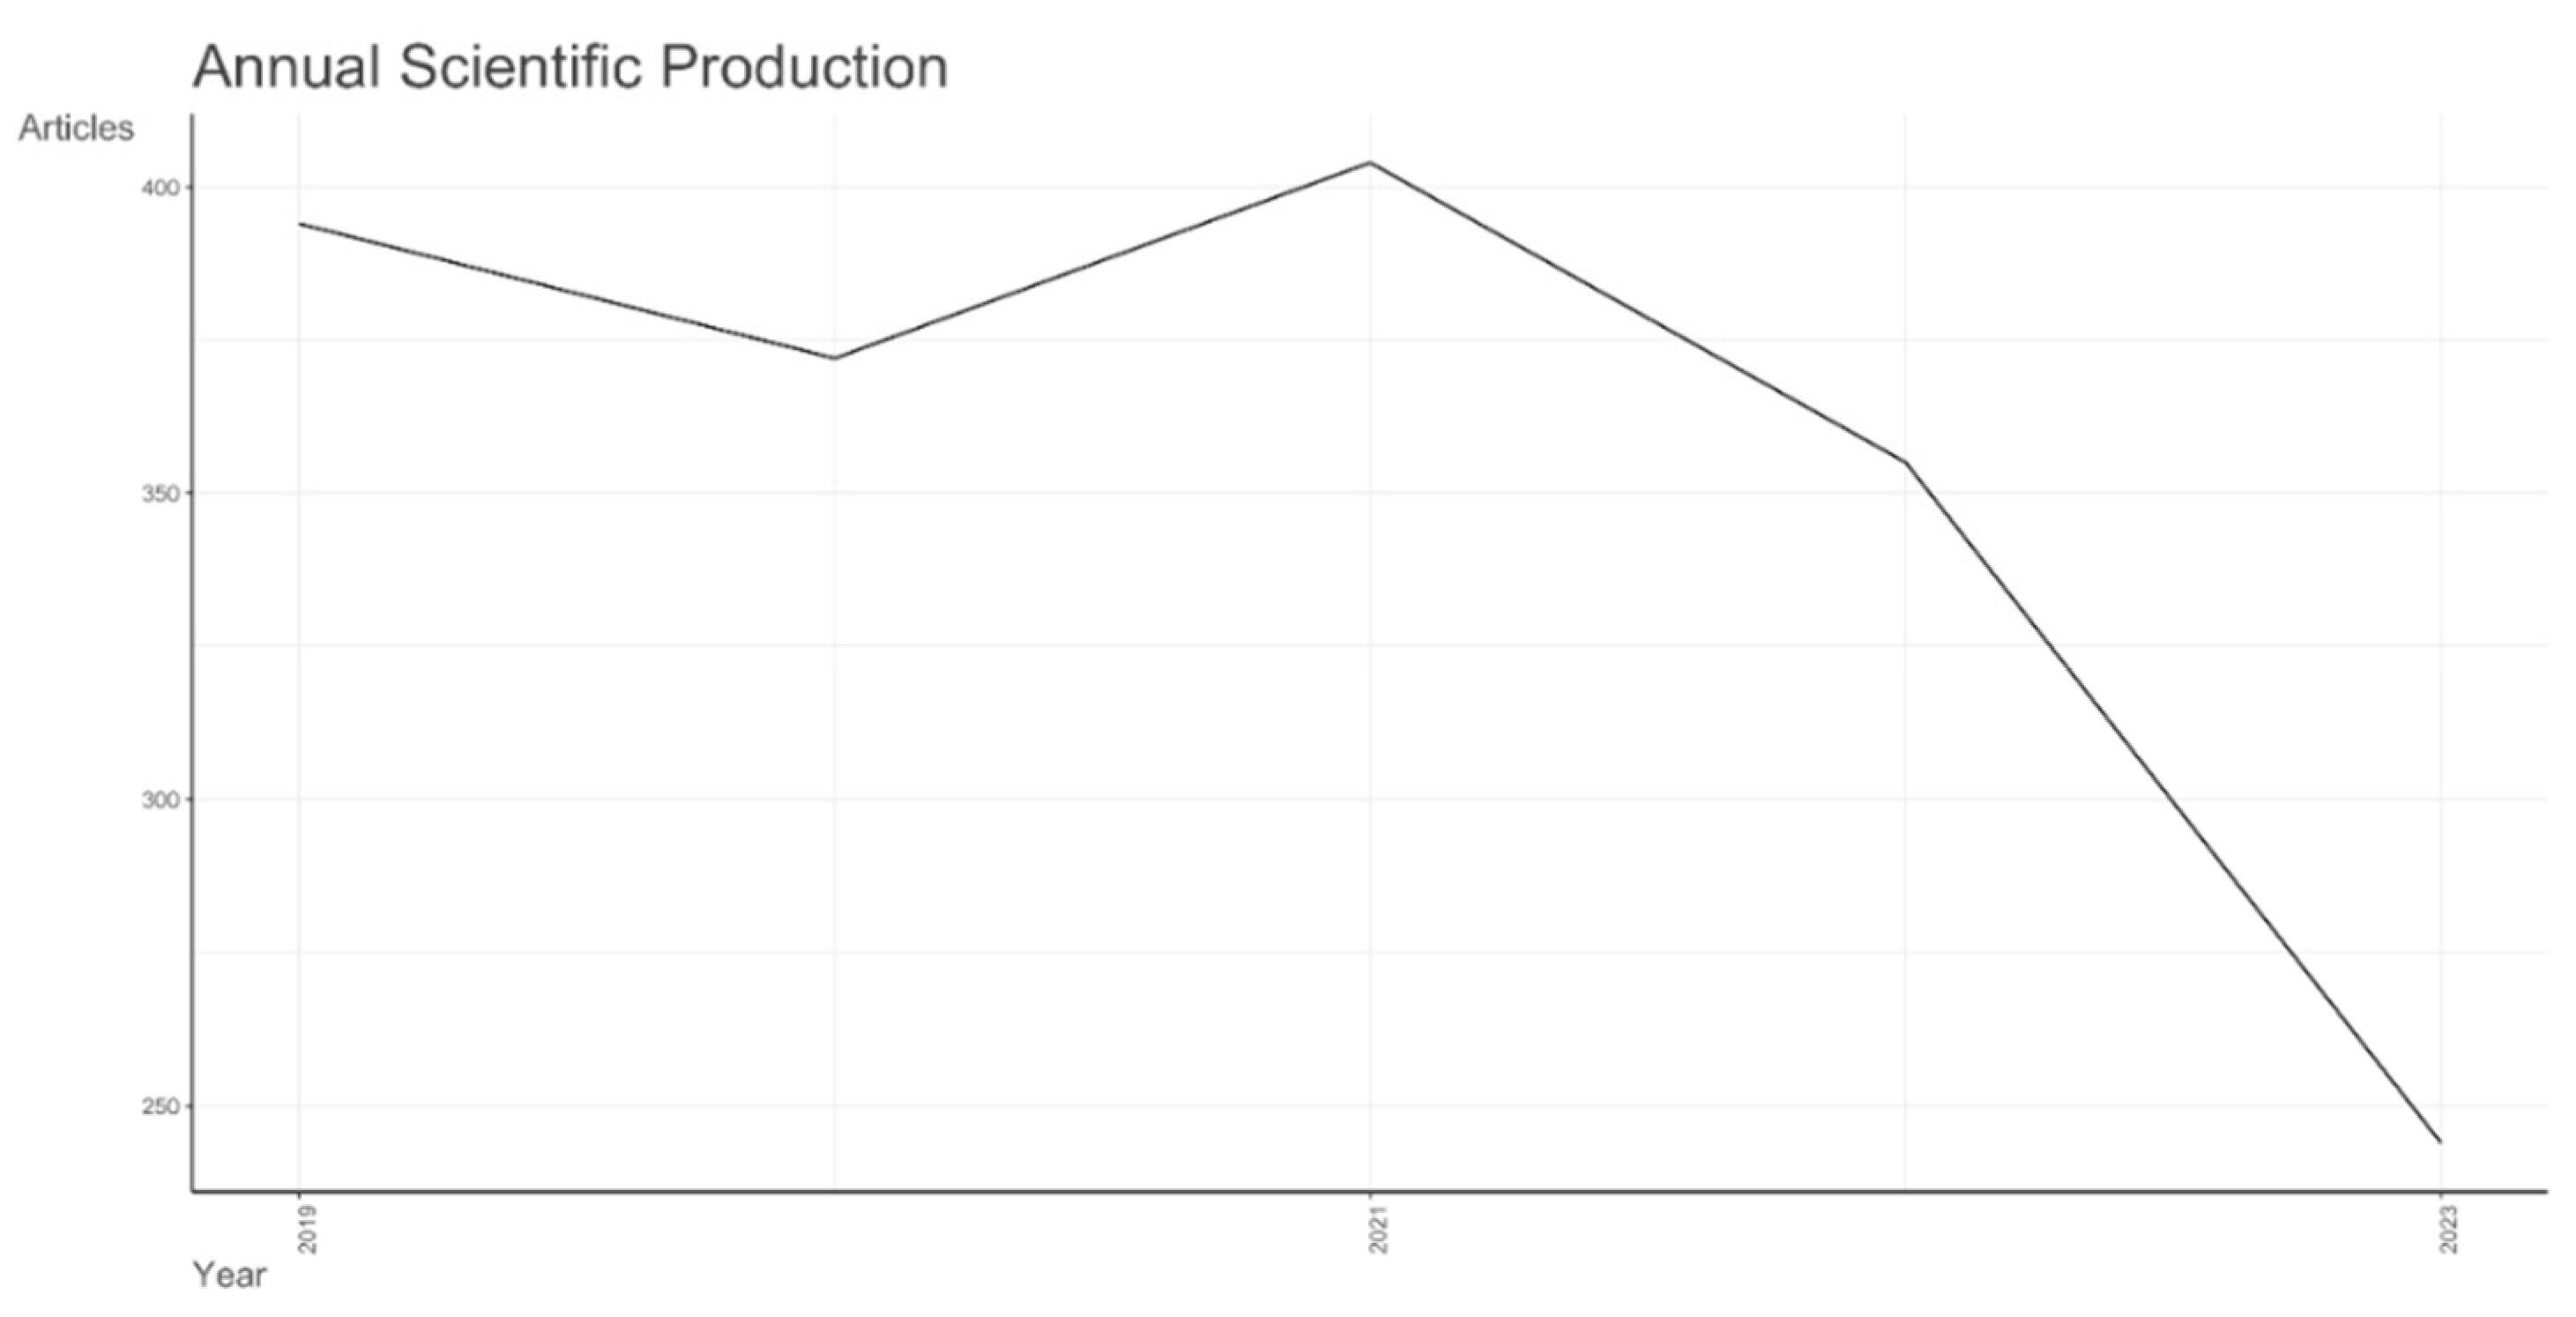
Figure 2.
The annual average citations of publications produced between 2019 and 2023.
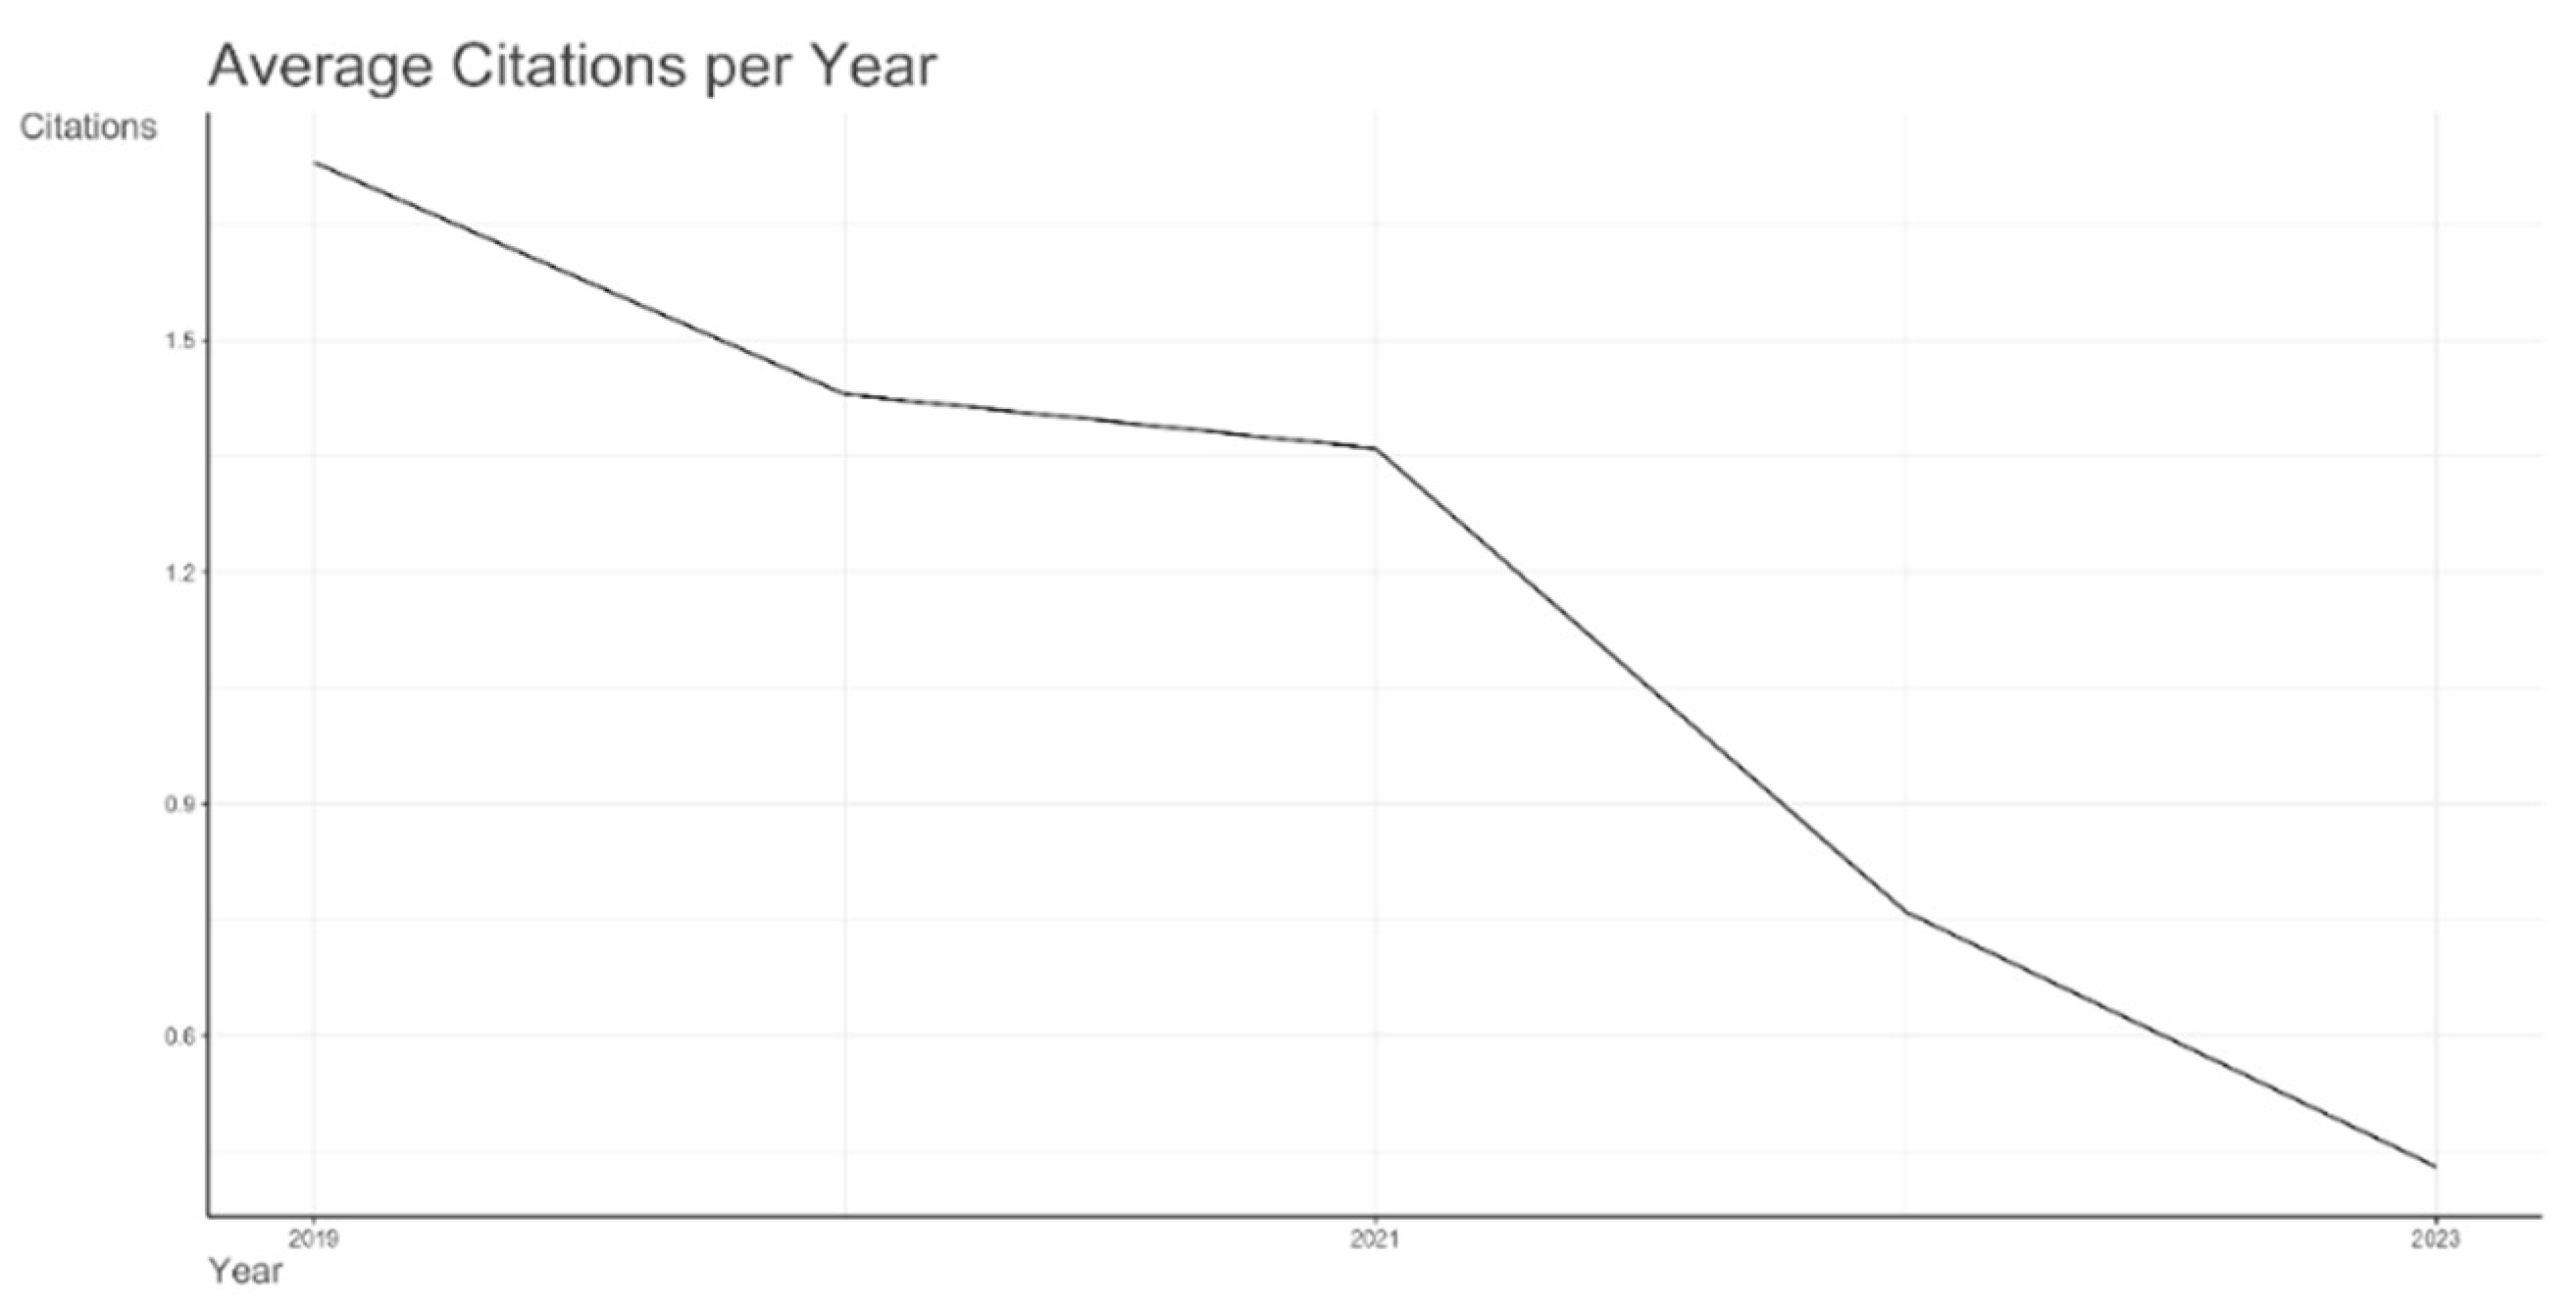
Figure 4.
Author productivity through Lotka’s Law.
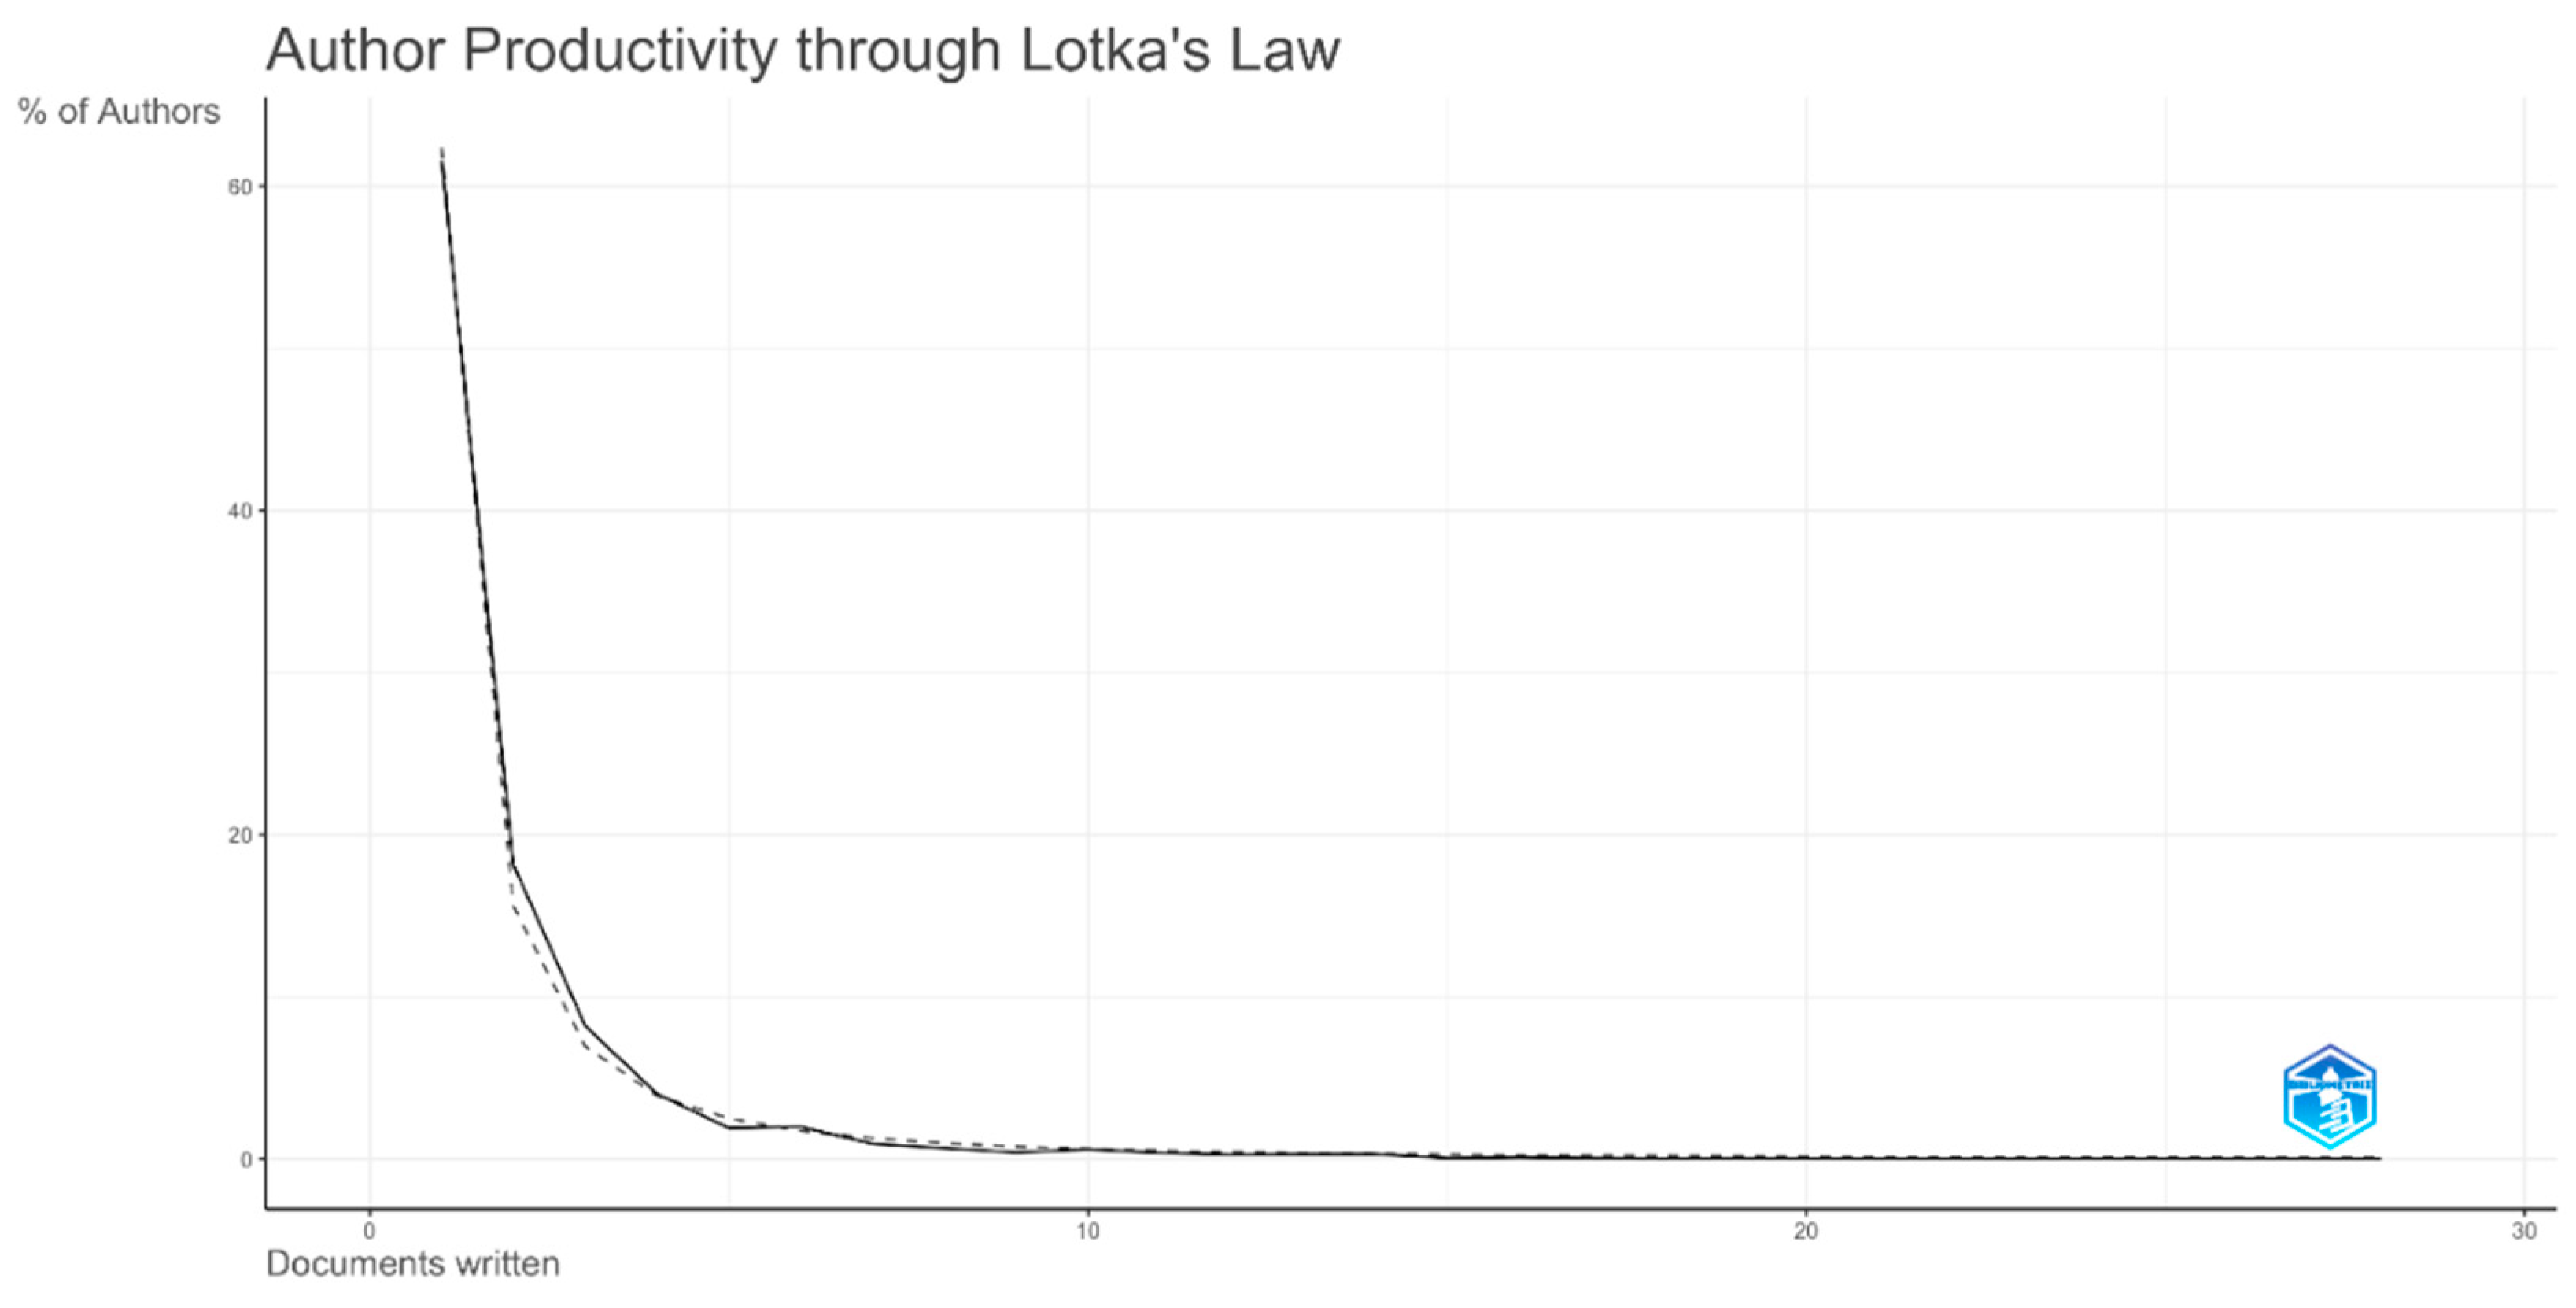
Figure 5.
The corresponding Author’s Country between 2019-2023.
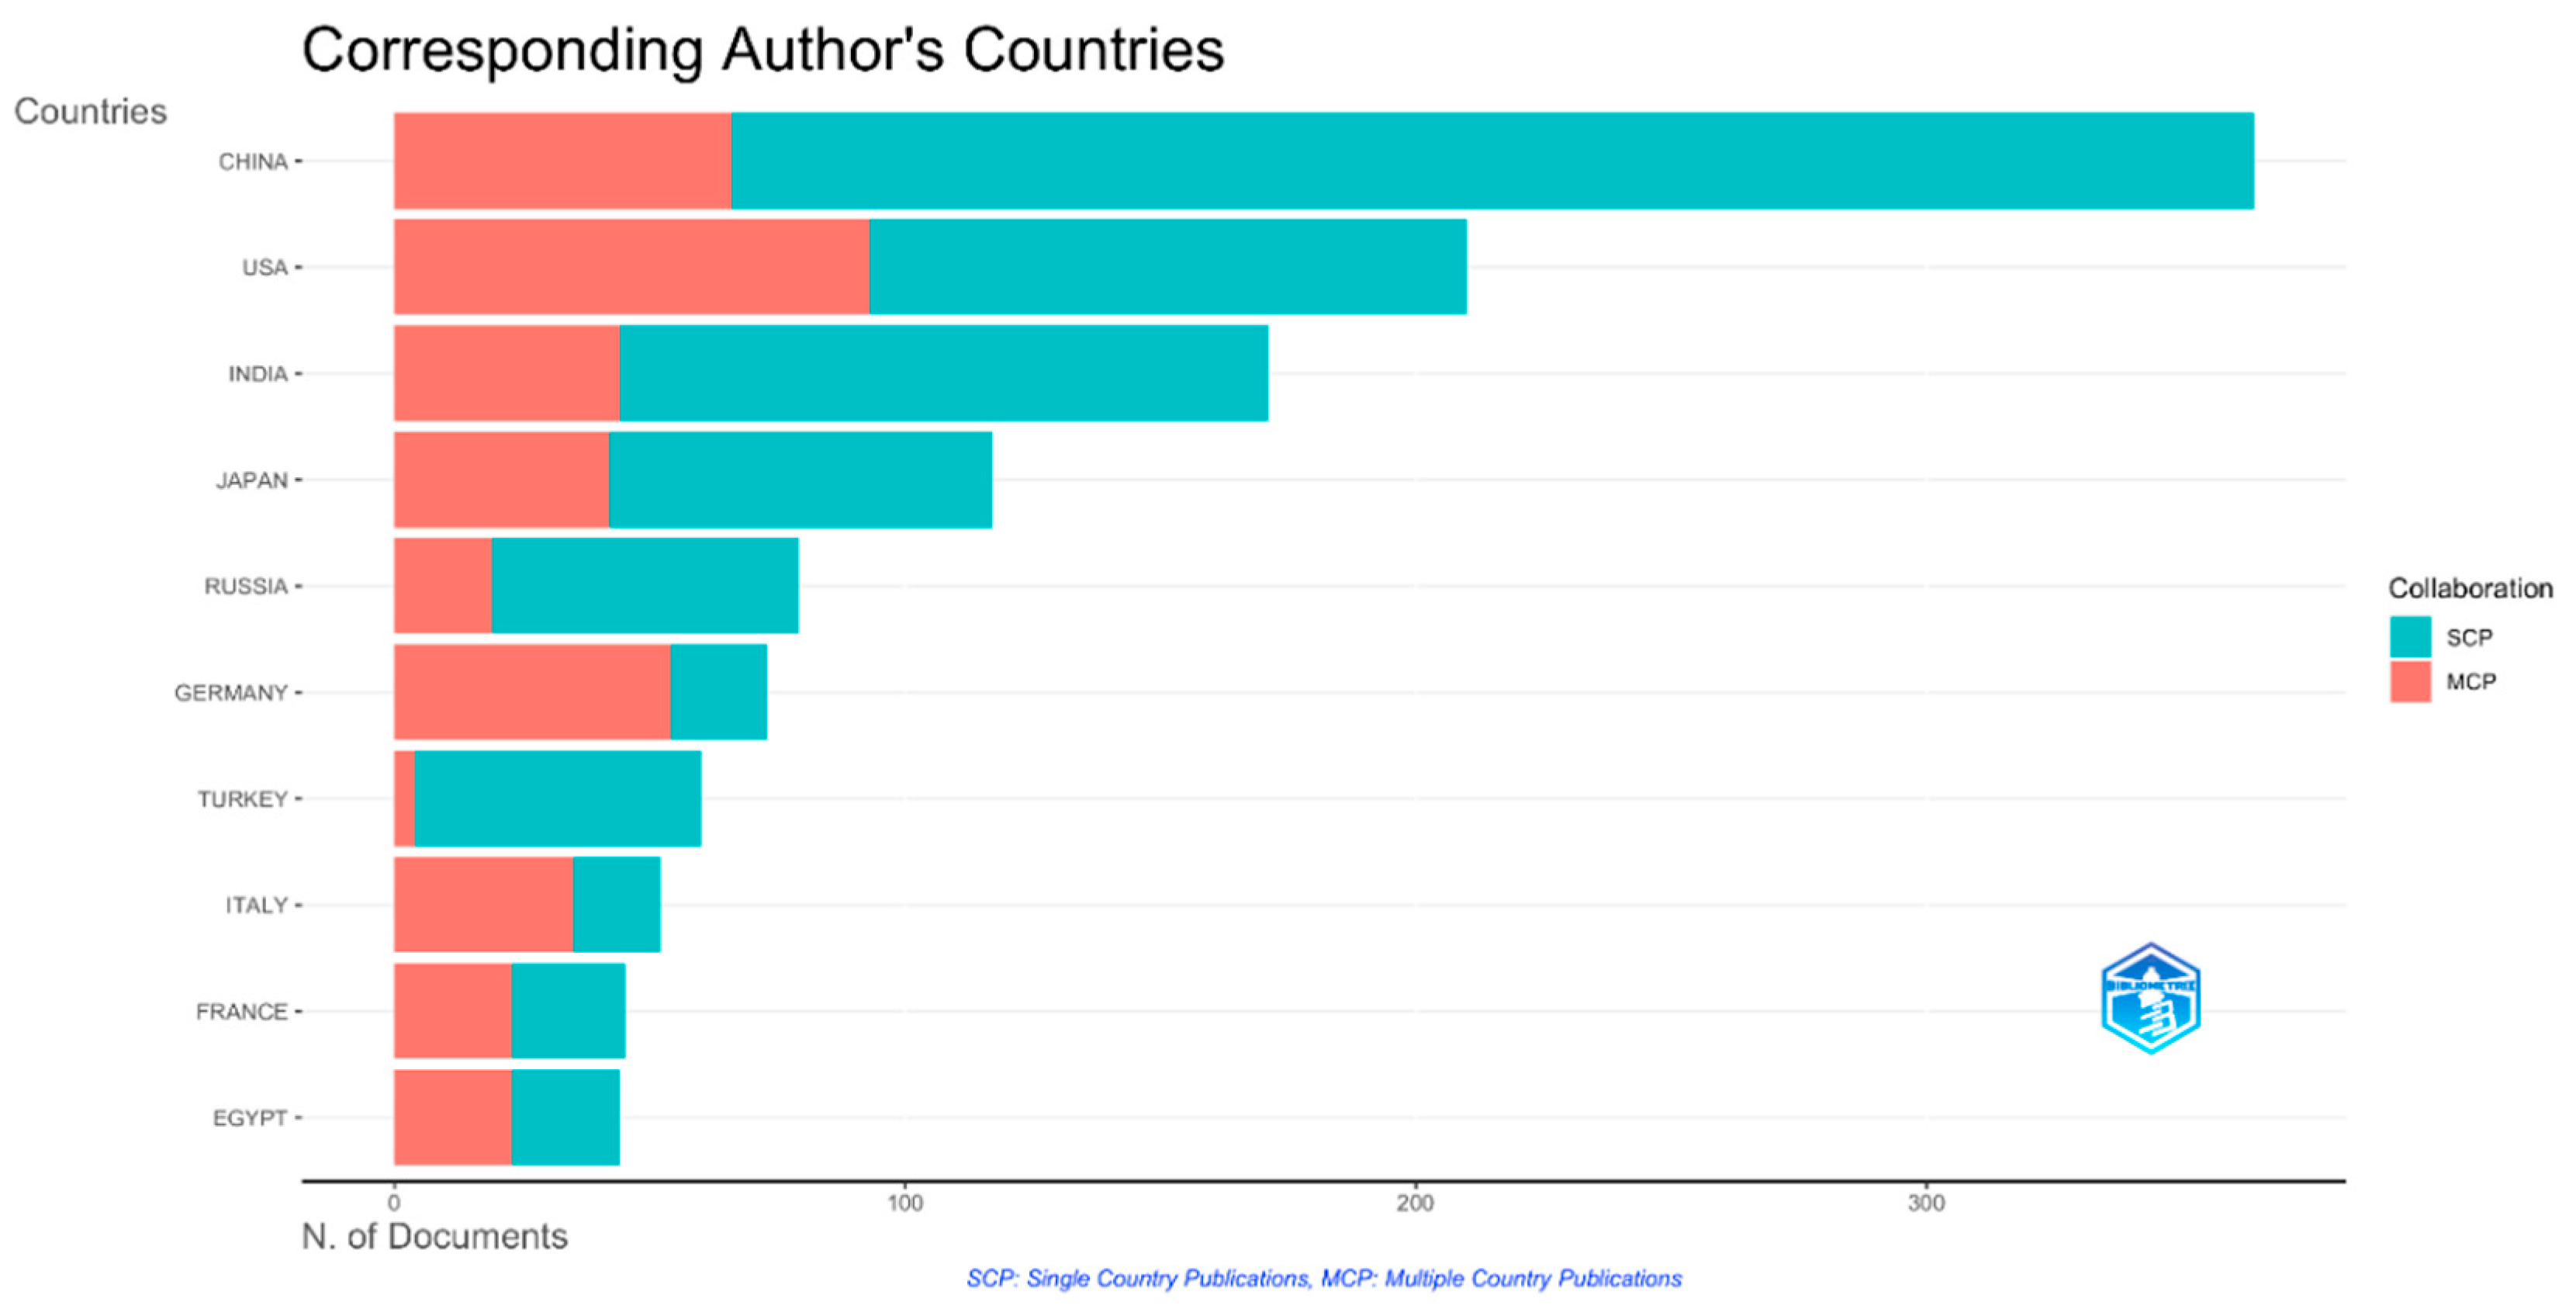
Figure 6.
The graph of the country collaboration map of the reaction cross section calculations’ field between 2019-2023.
Figure 6.
The graph of the country collaboration map of the reaction cross section calculations’ field between 2019-2023.
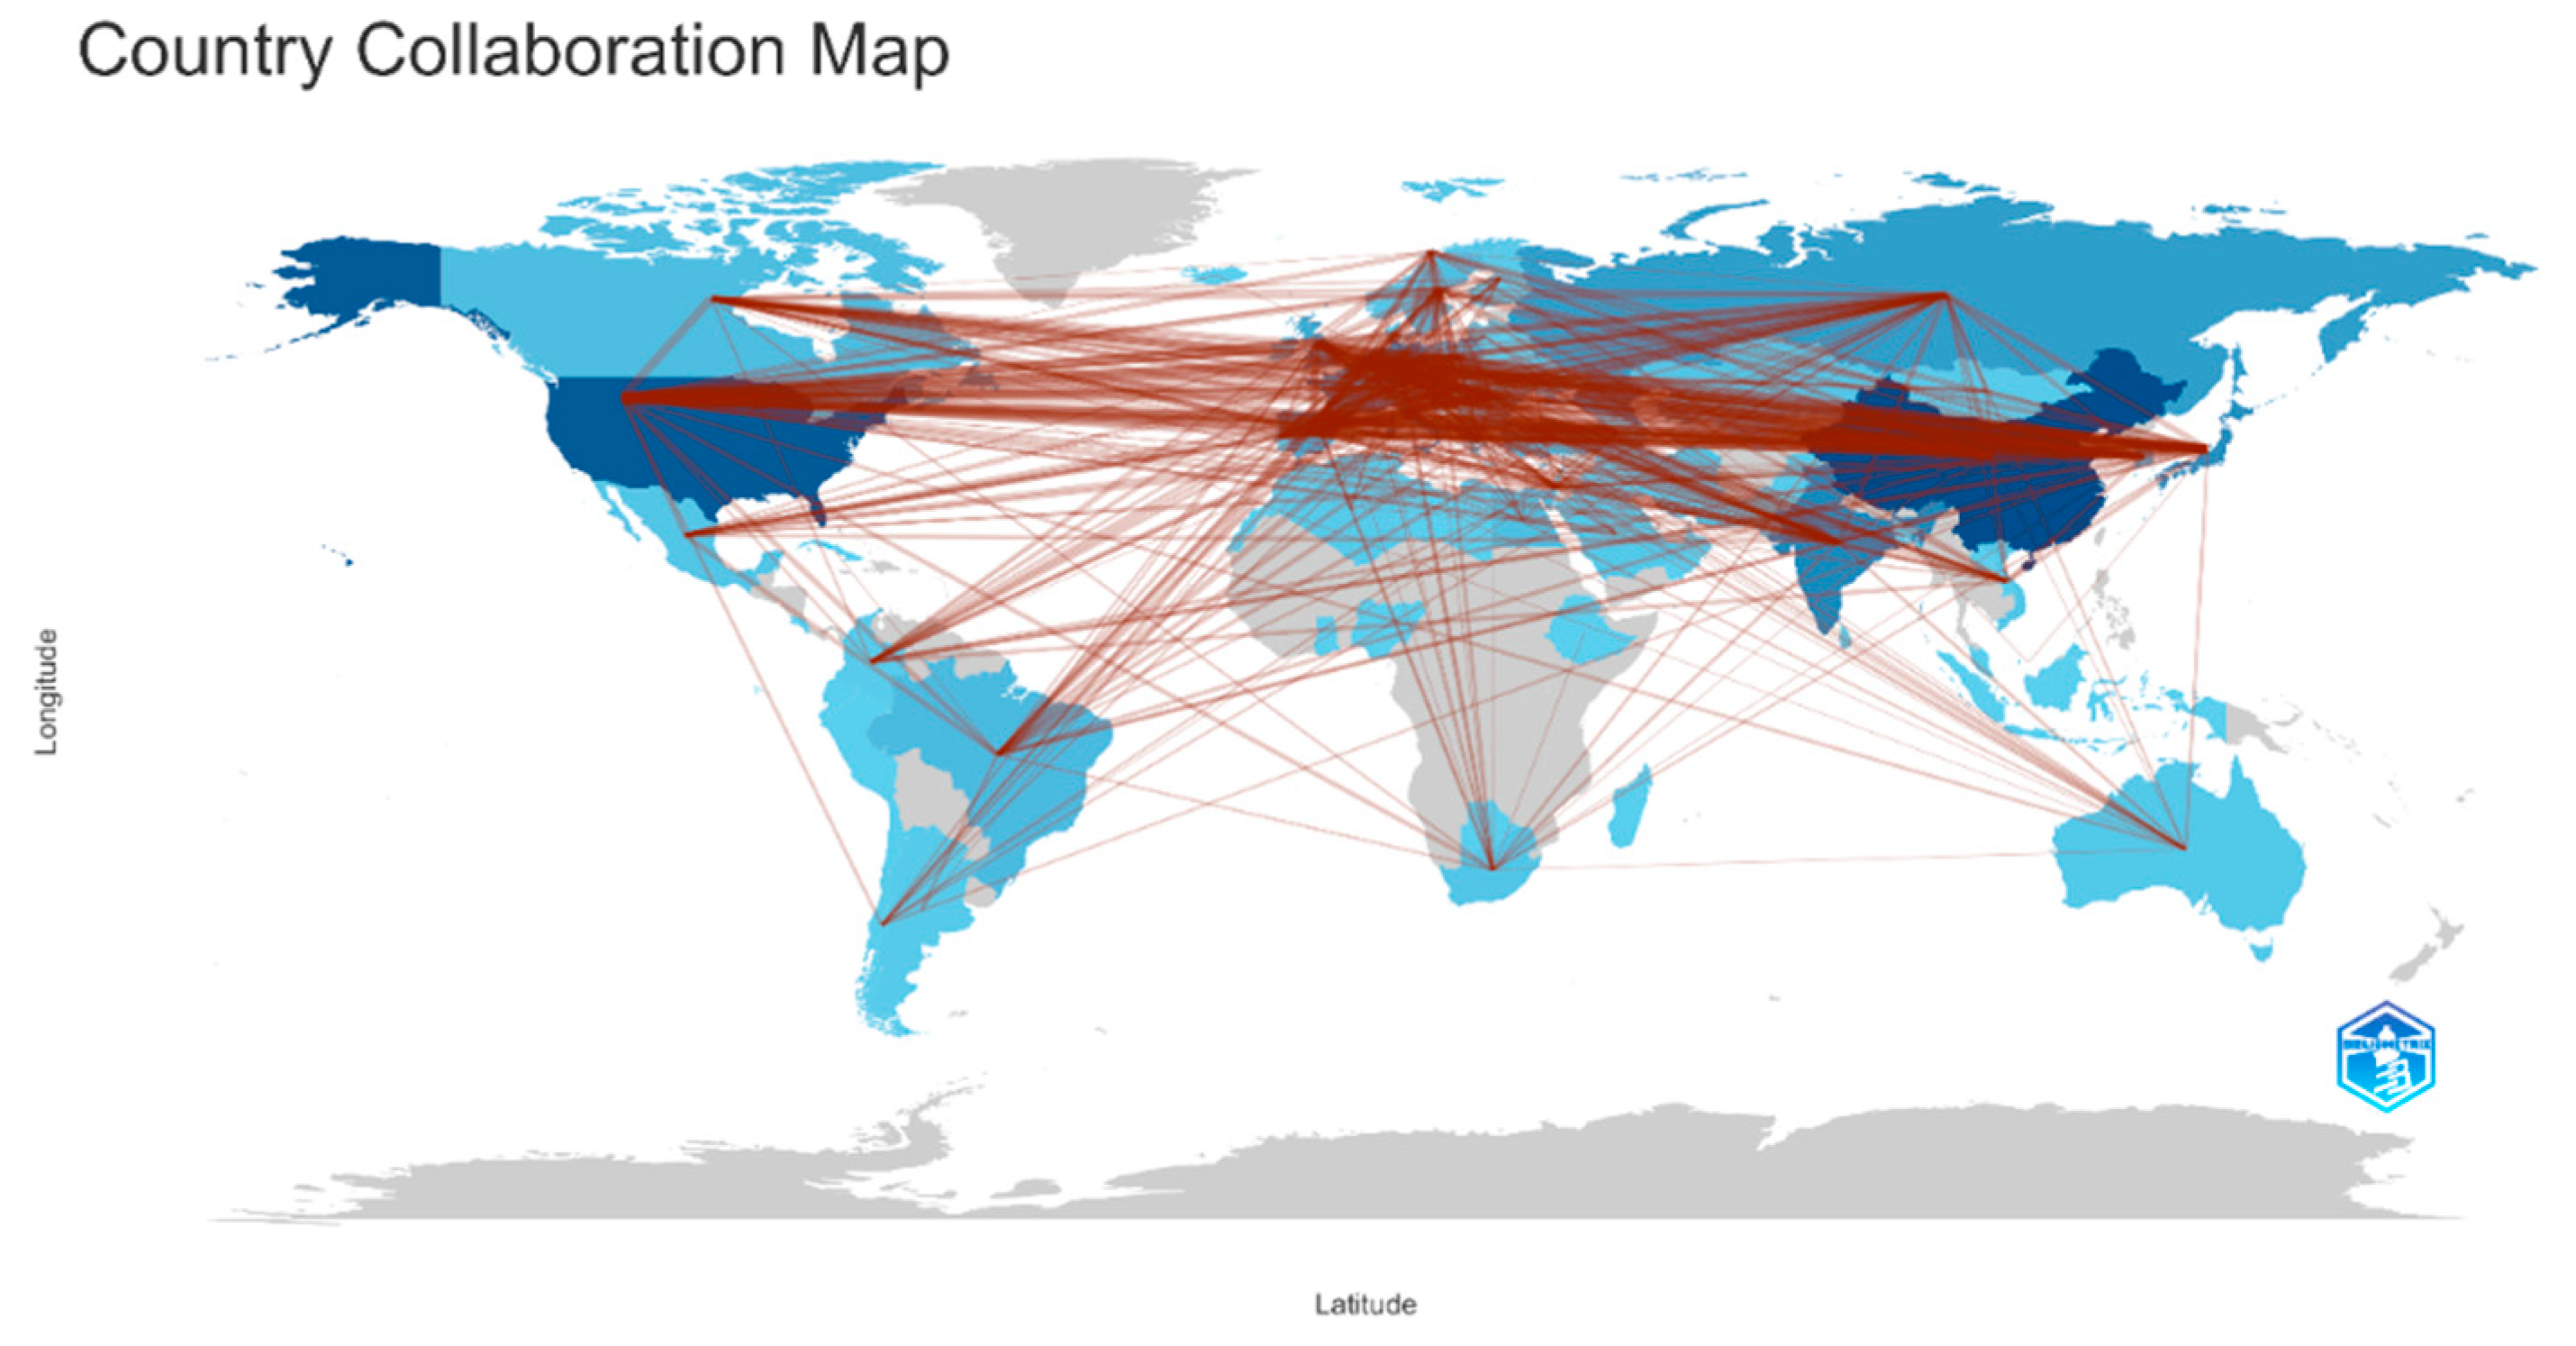
Figure 7.
The most cited countries in the reaction cross section calculations between 2019-2023.
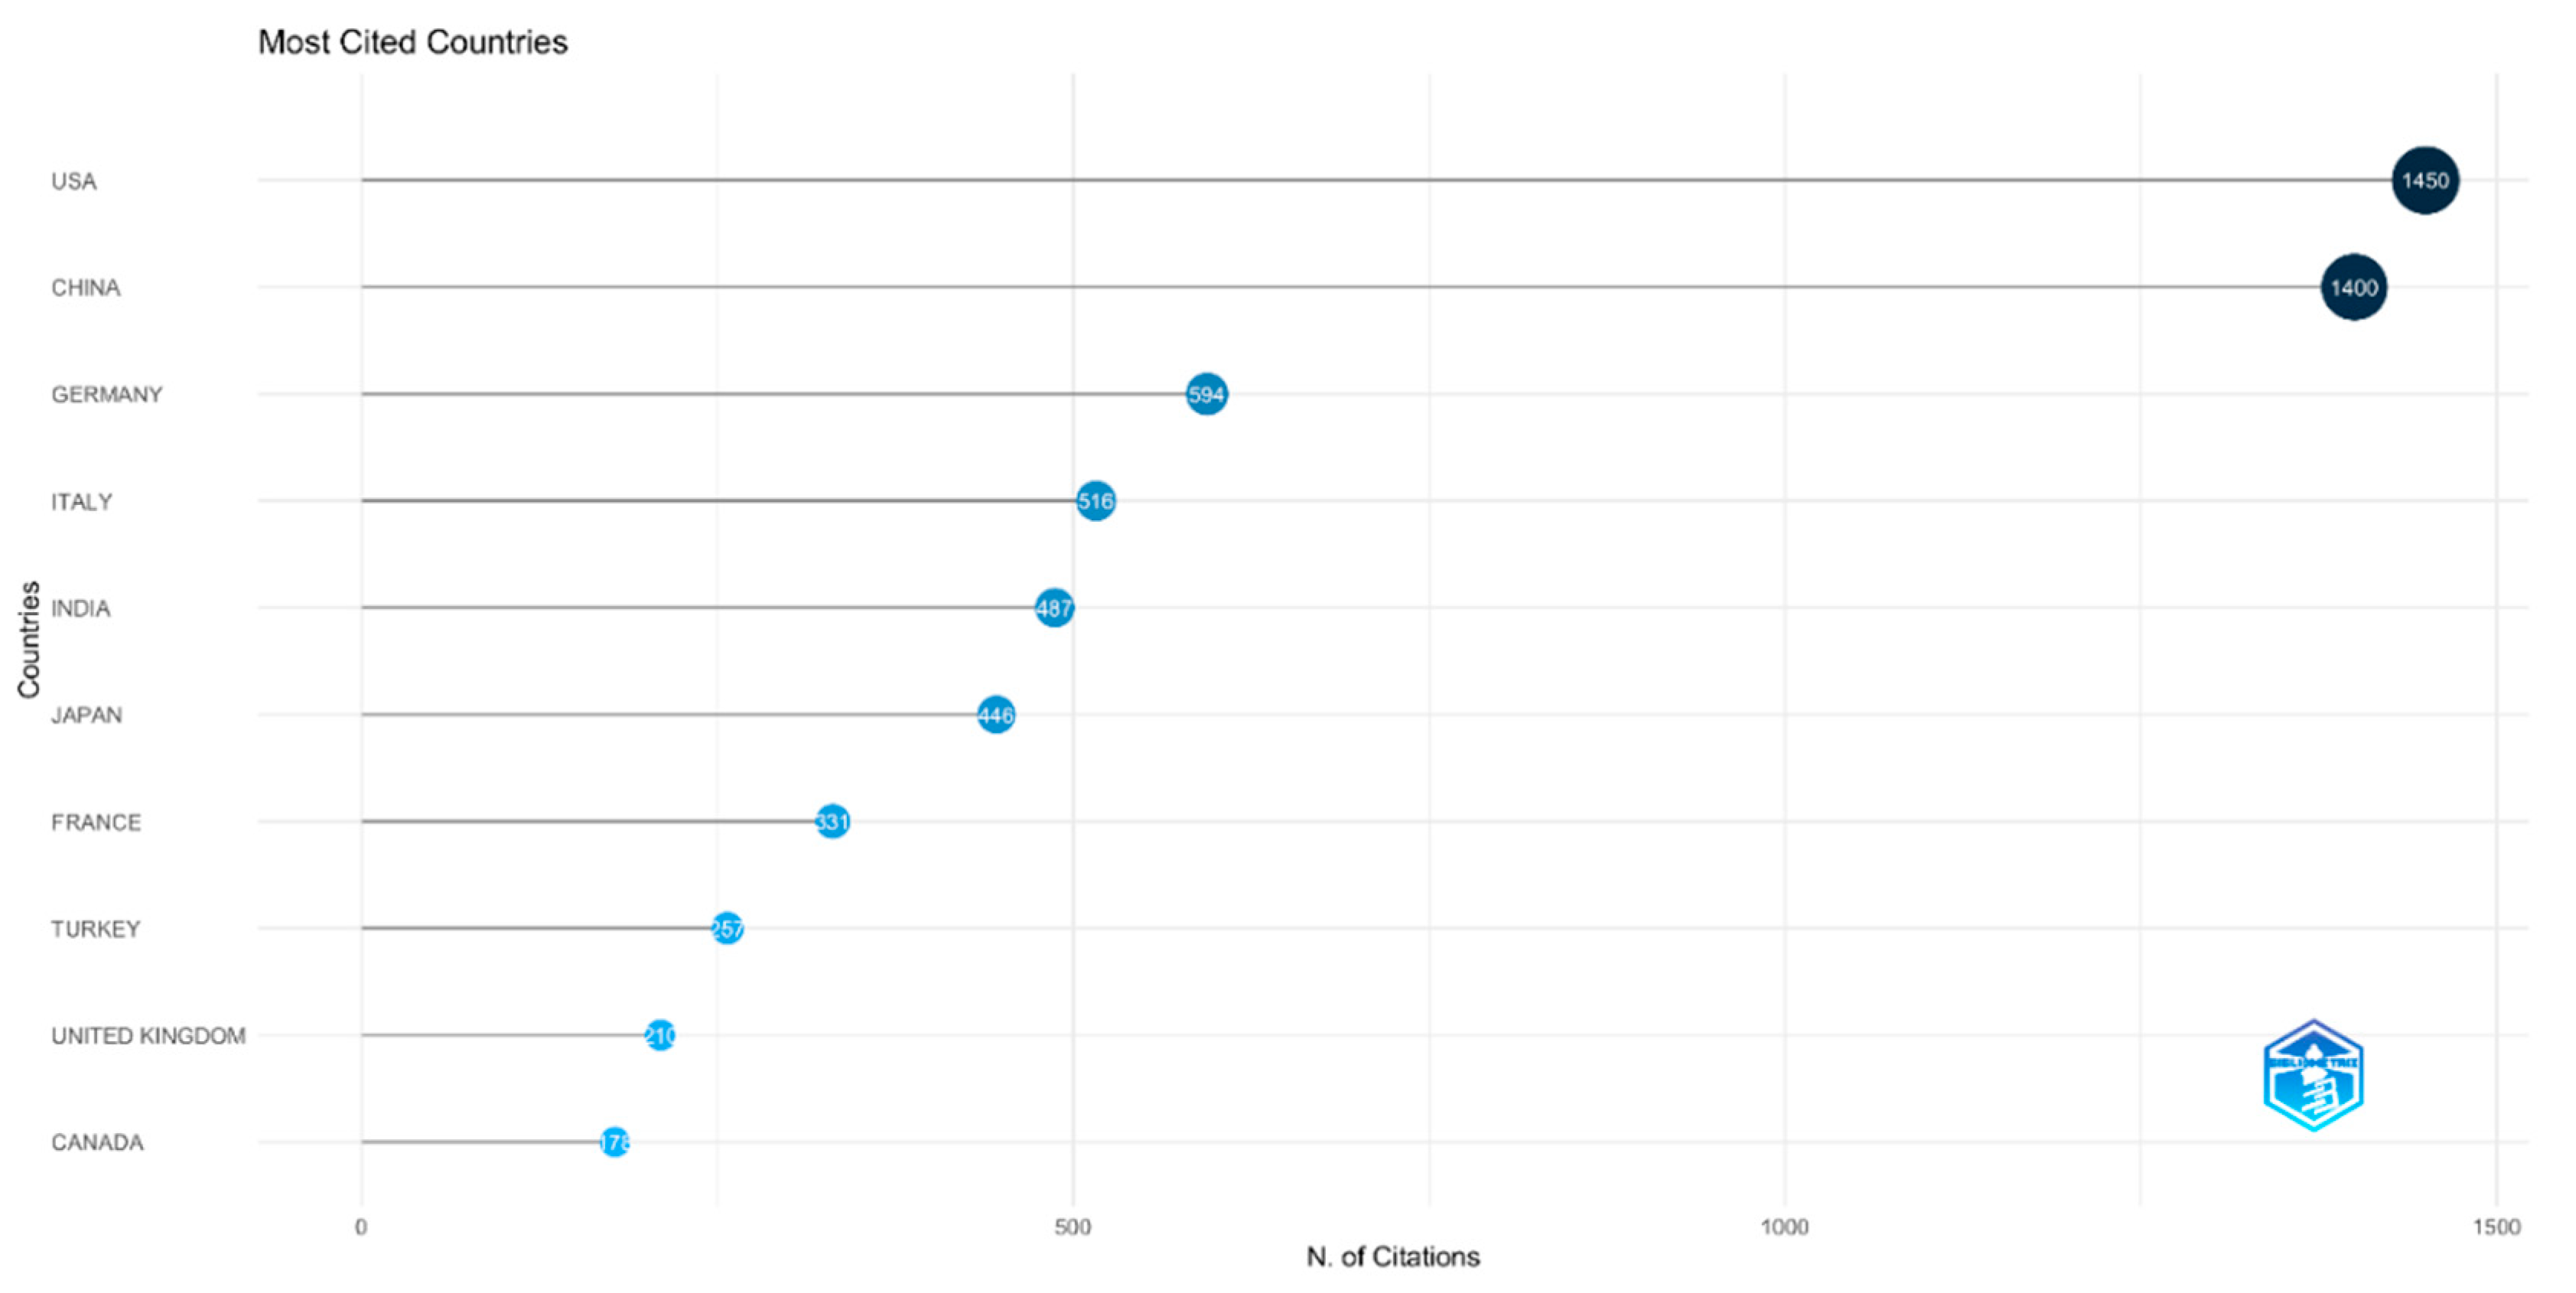
Figure 8.
The most global cited documents in the reaction cross section calculations between 2019-2023.
Figure 8.
The most global cited documents in the reaction cross section calculations between 2019-2023.
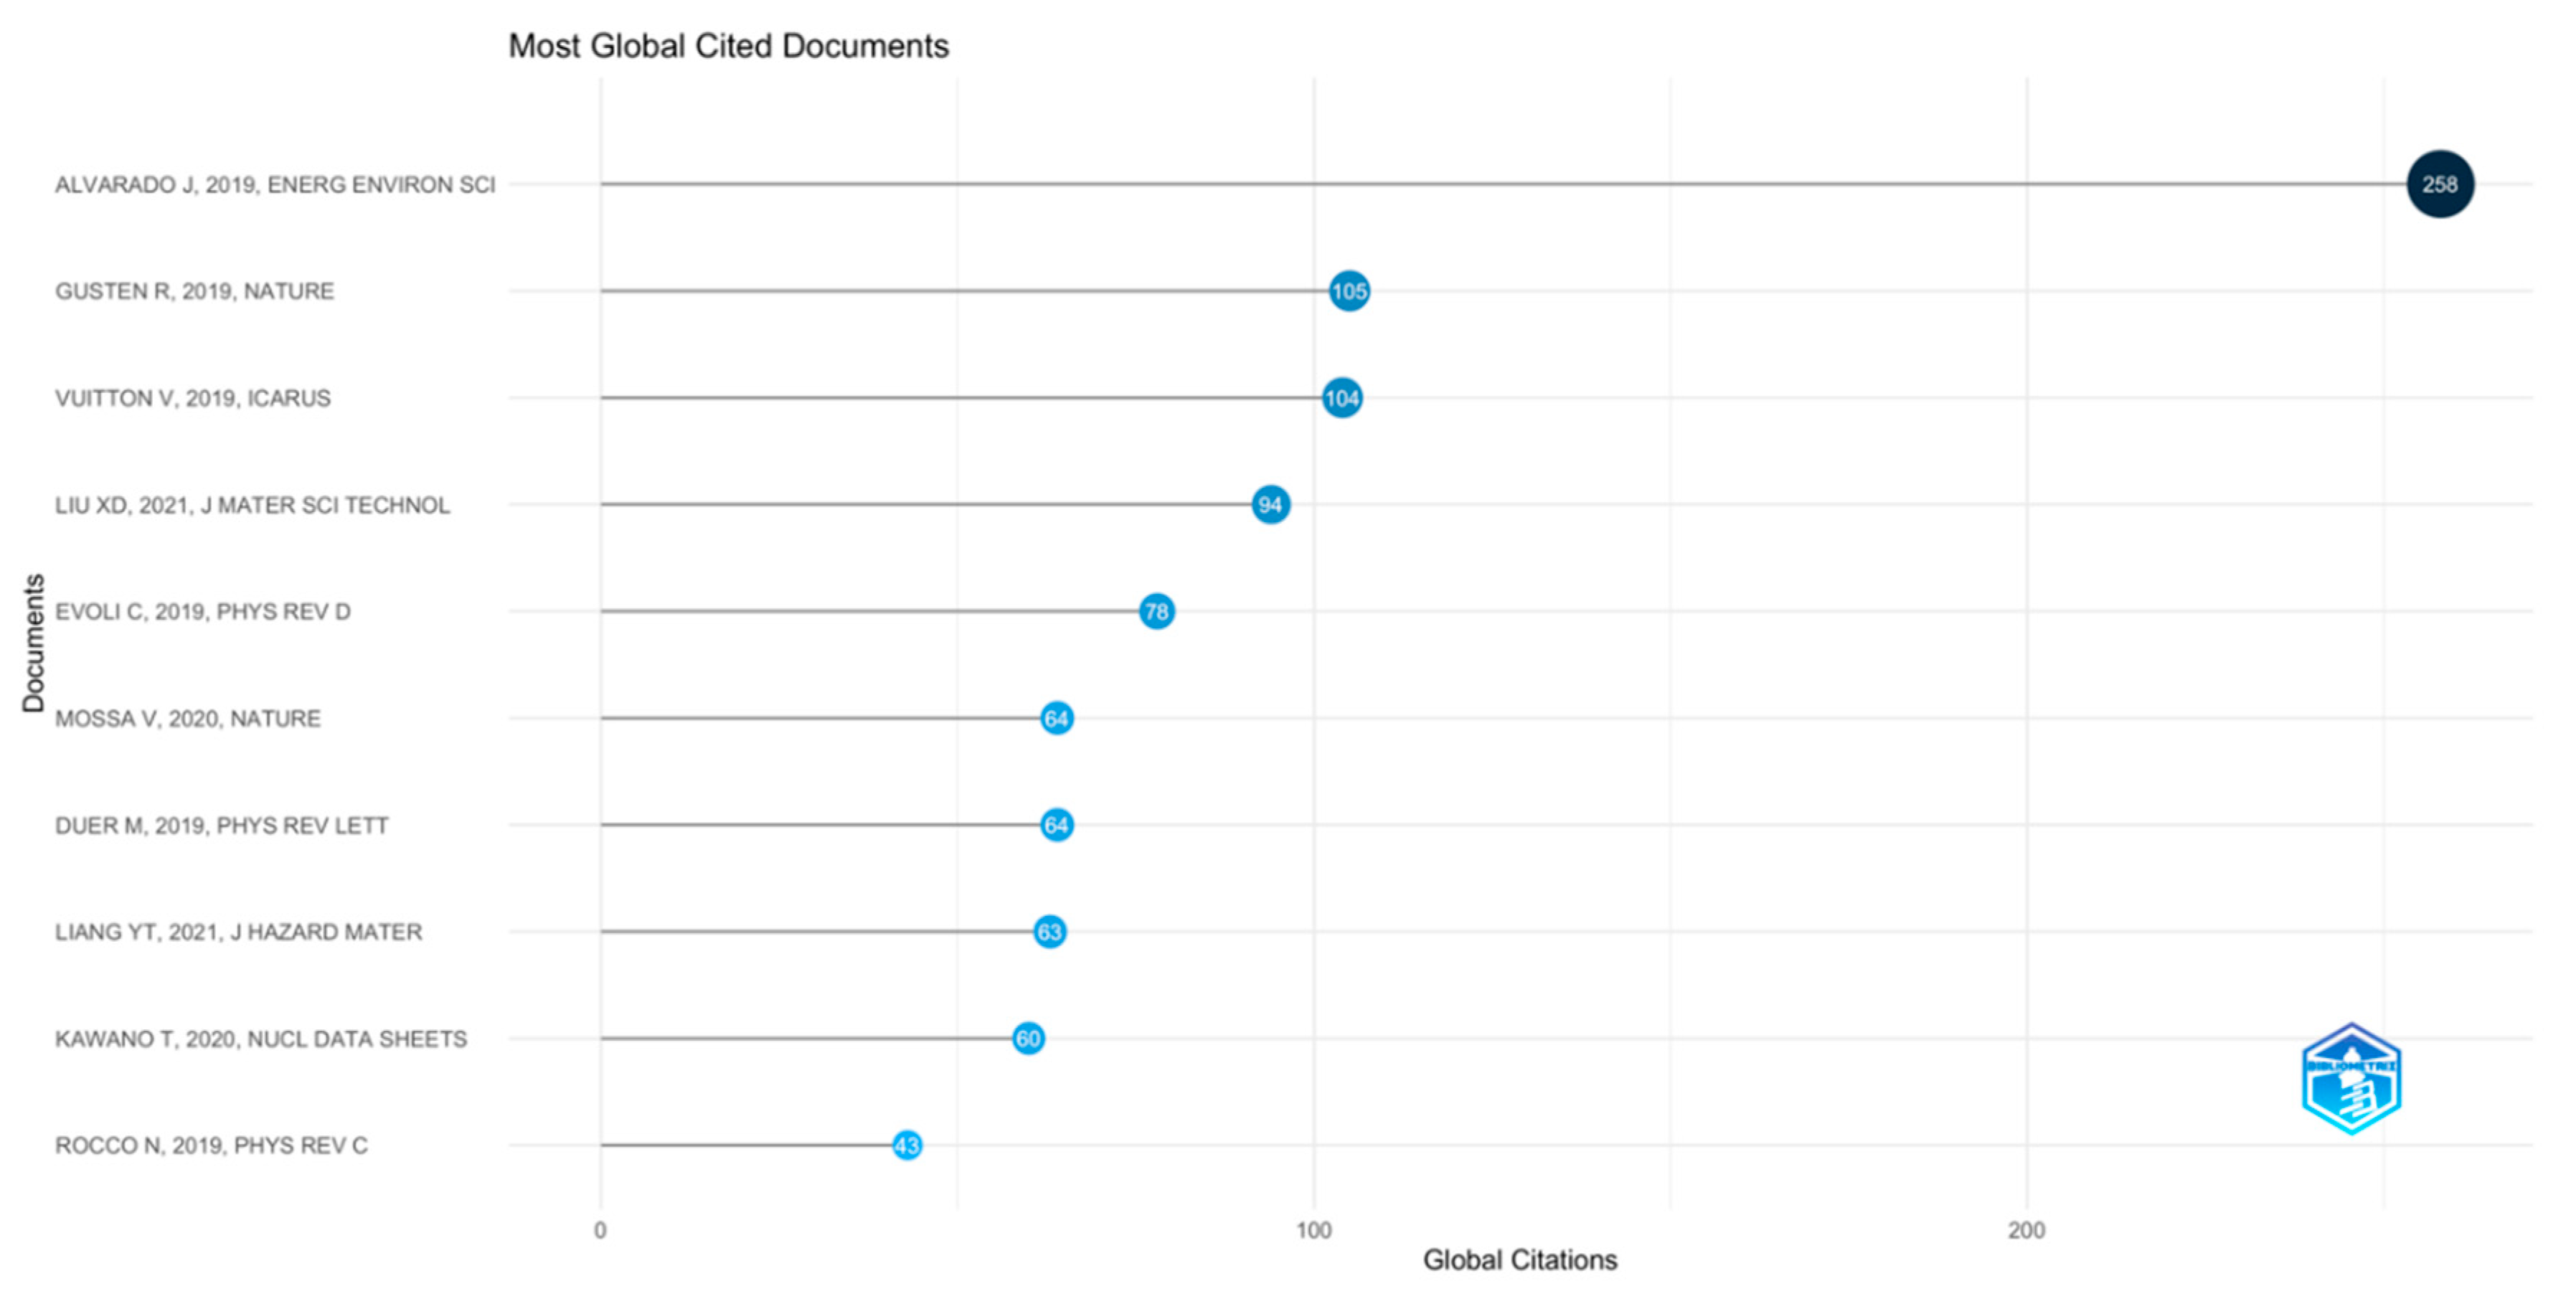
Figure 9.
The most local cited documents in the reaction cross section calculations between 2019-2023.
Figure 9.
The most local cited documents in the reaction cross section calculations between 2019-2023.
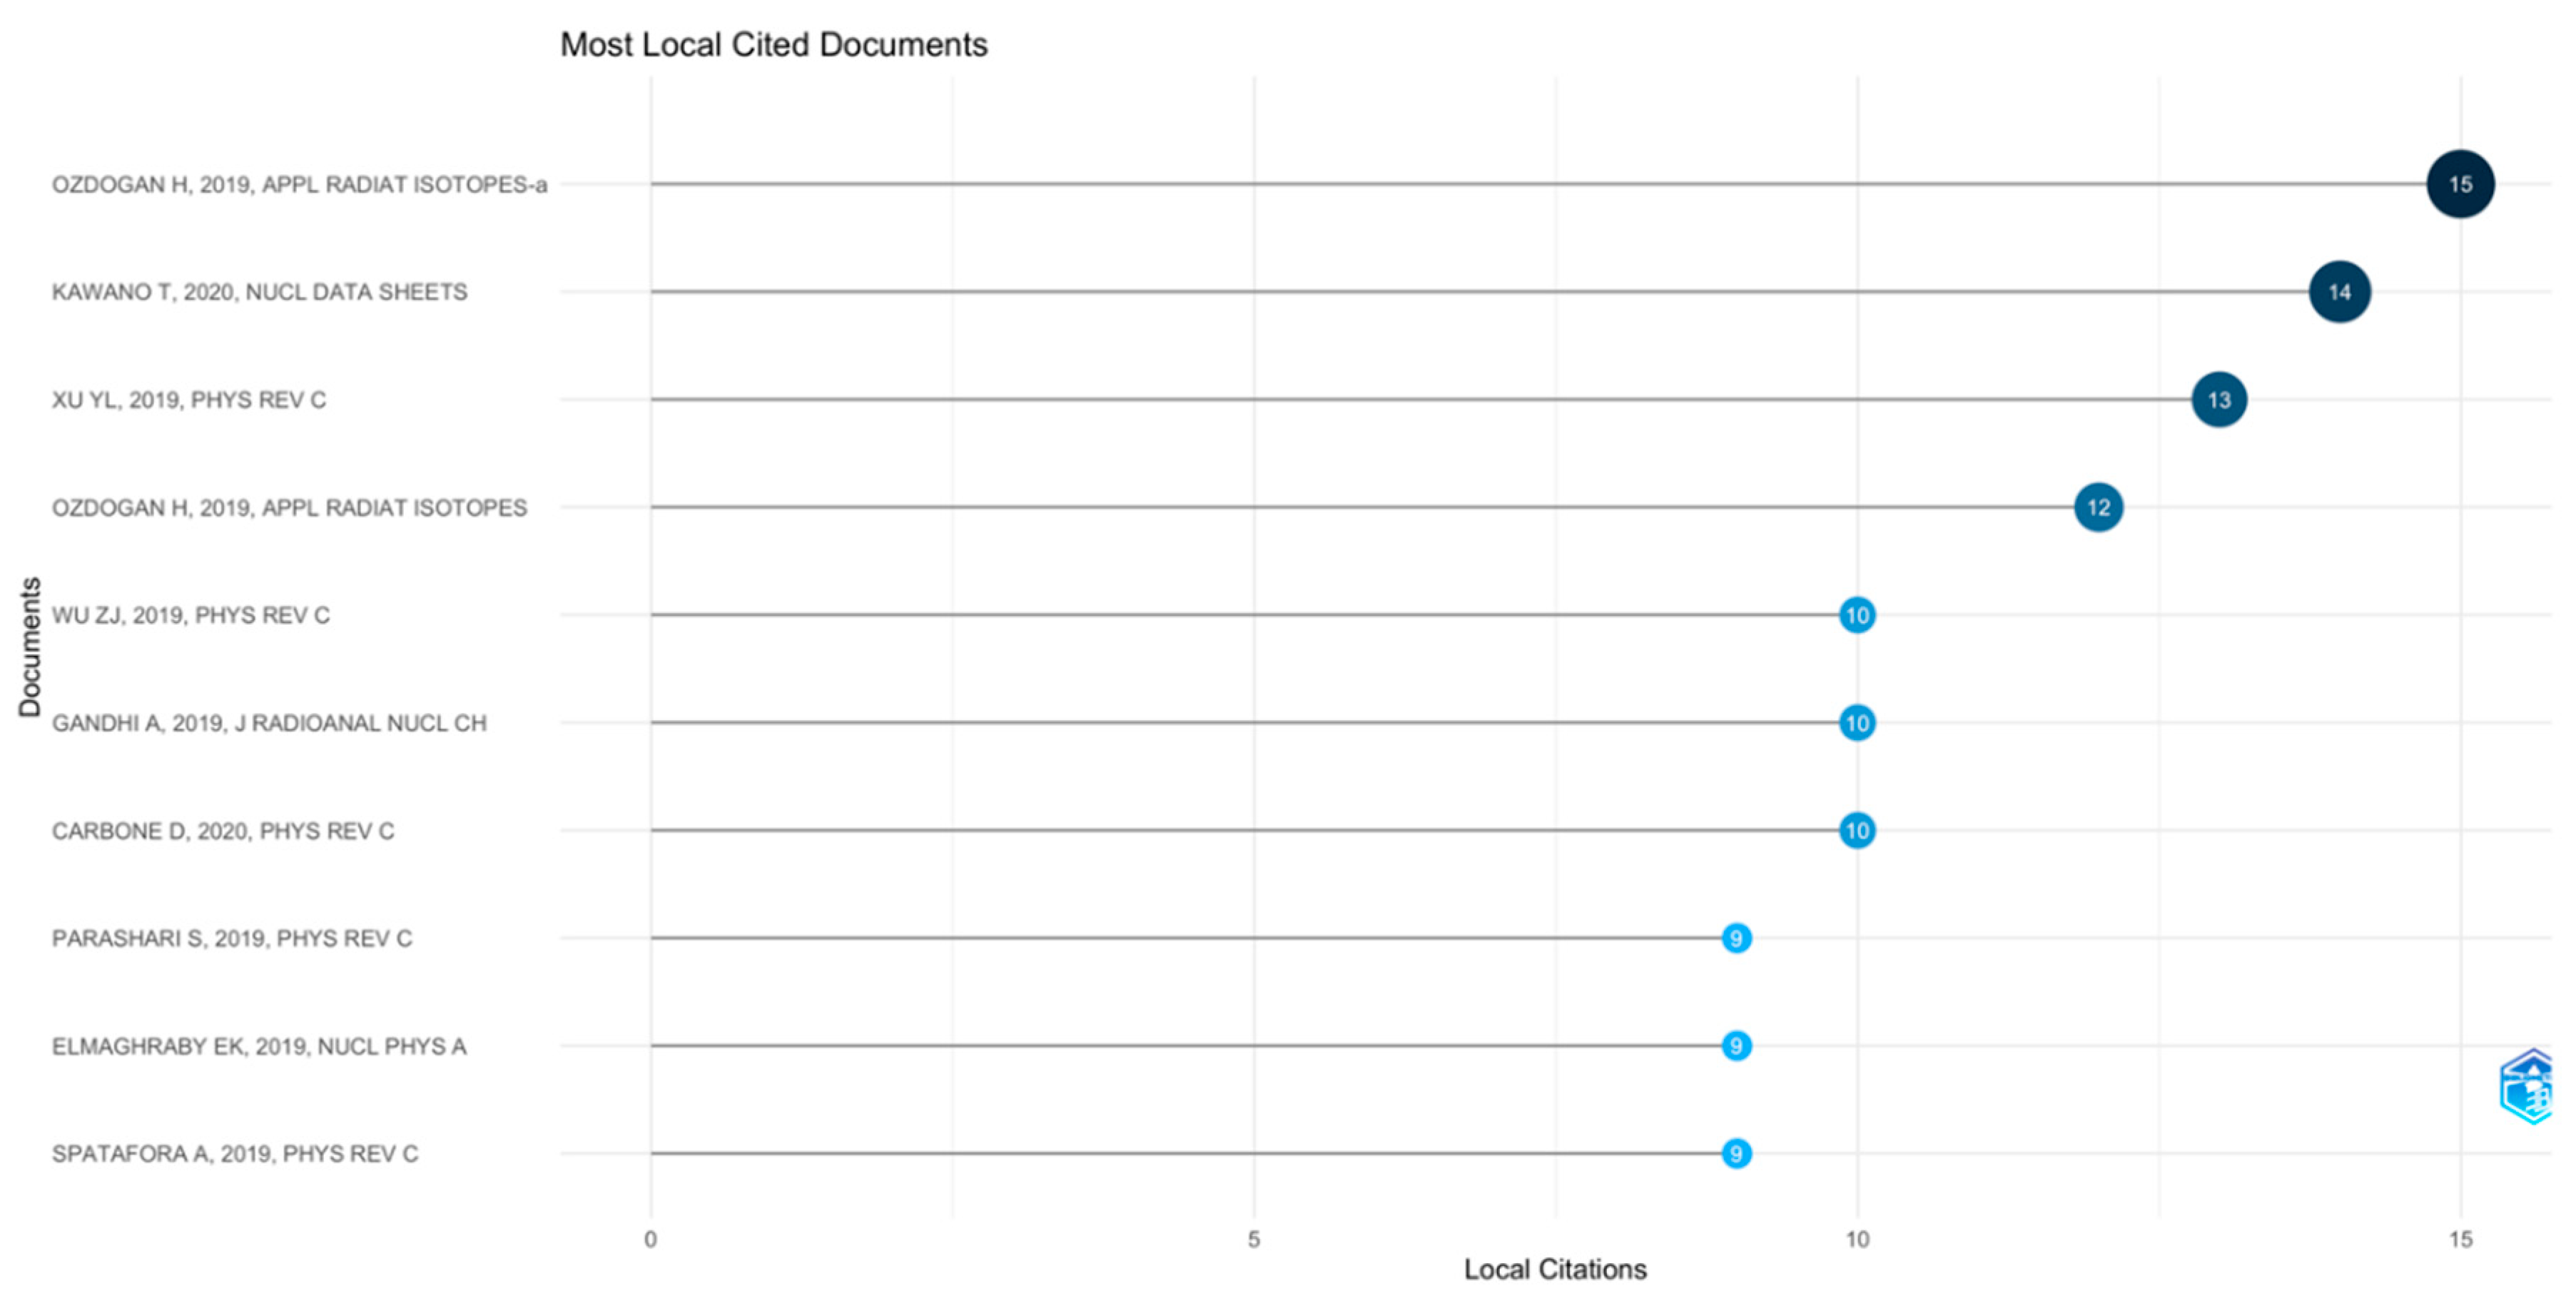
Figure 10.
The most local cited authors in the reaction cross section calculations between 2019-2023.
Figure 10.
The most local cited authors in the reaction cross section calculations between 2019-2023.
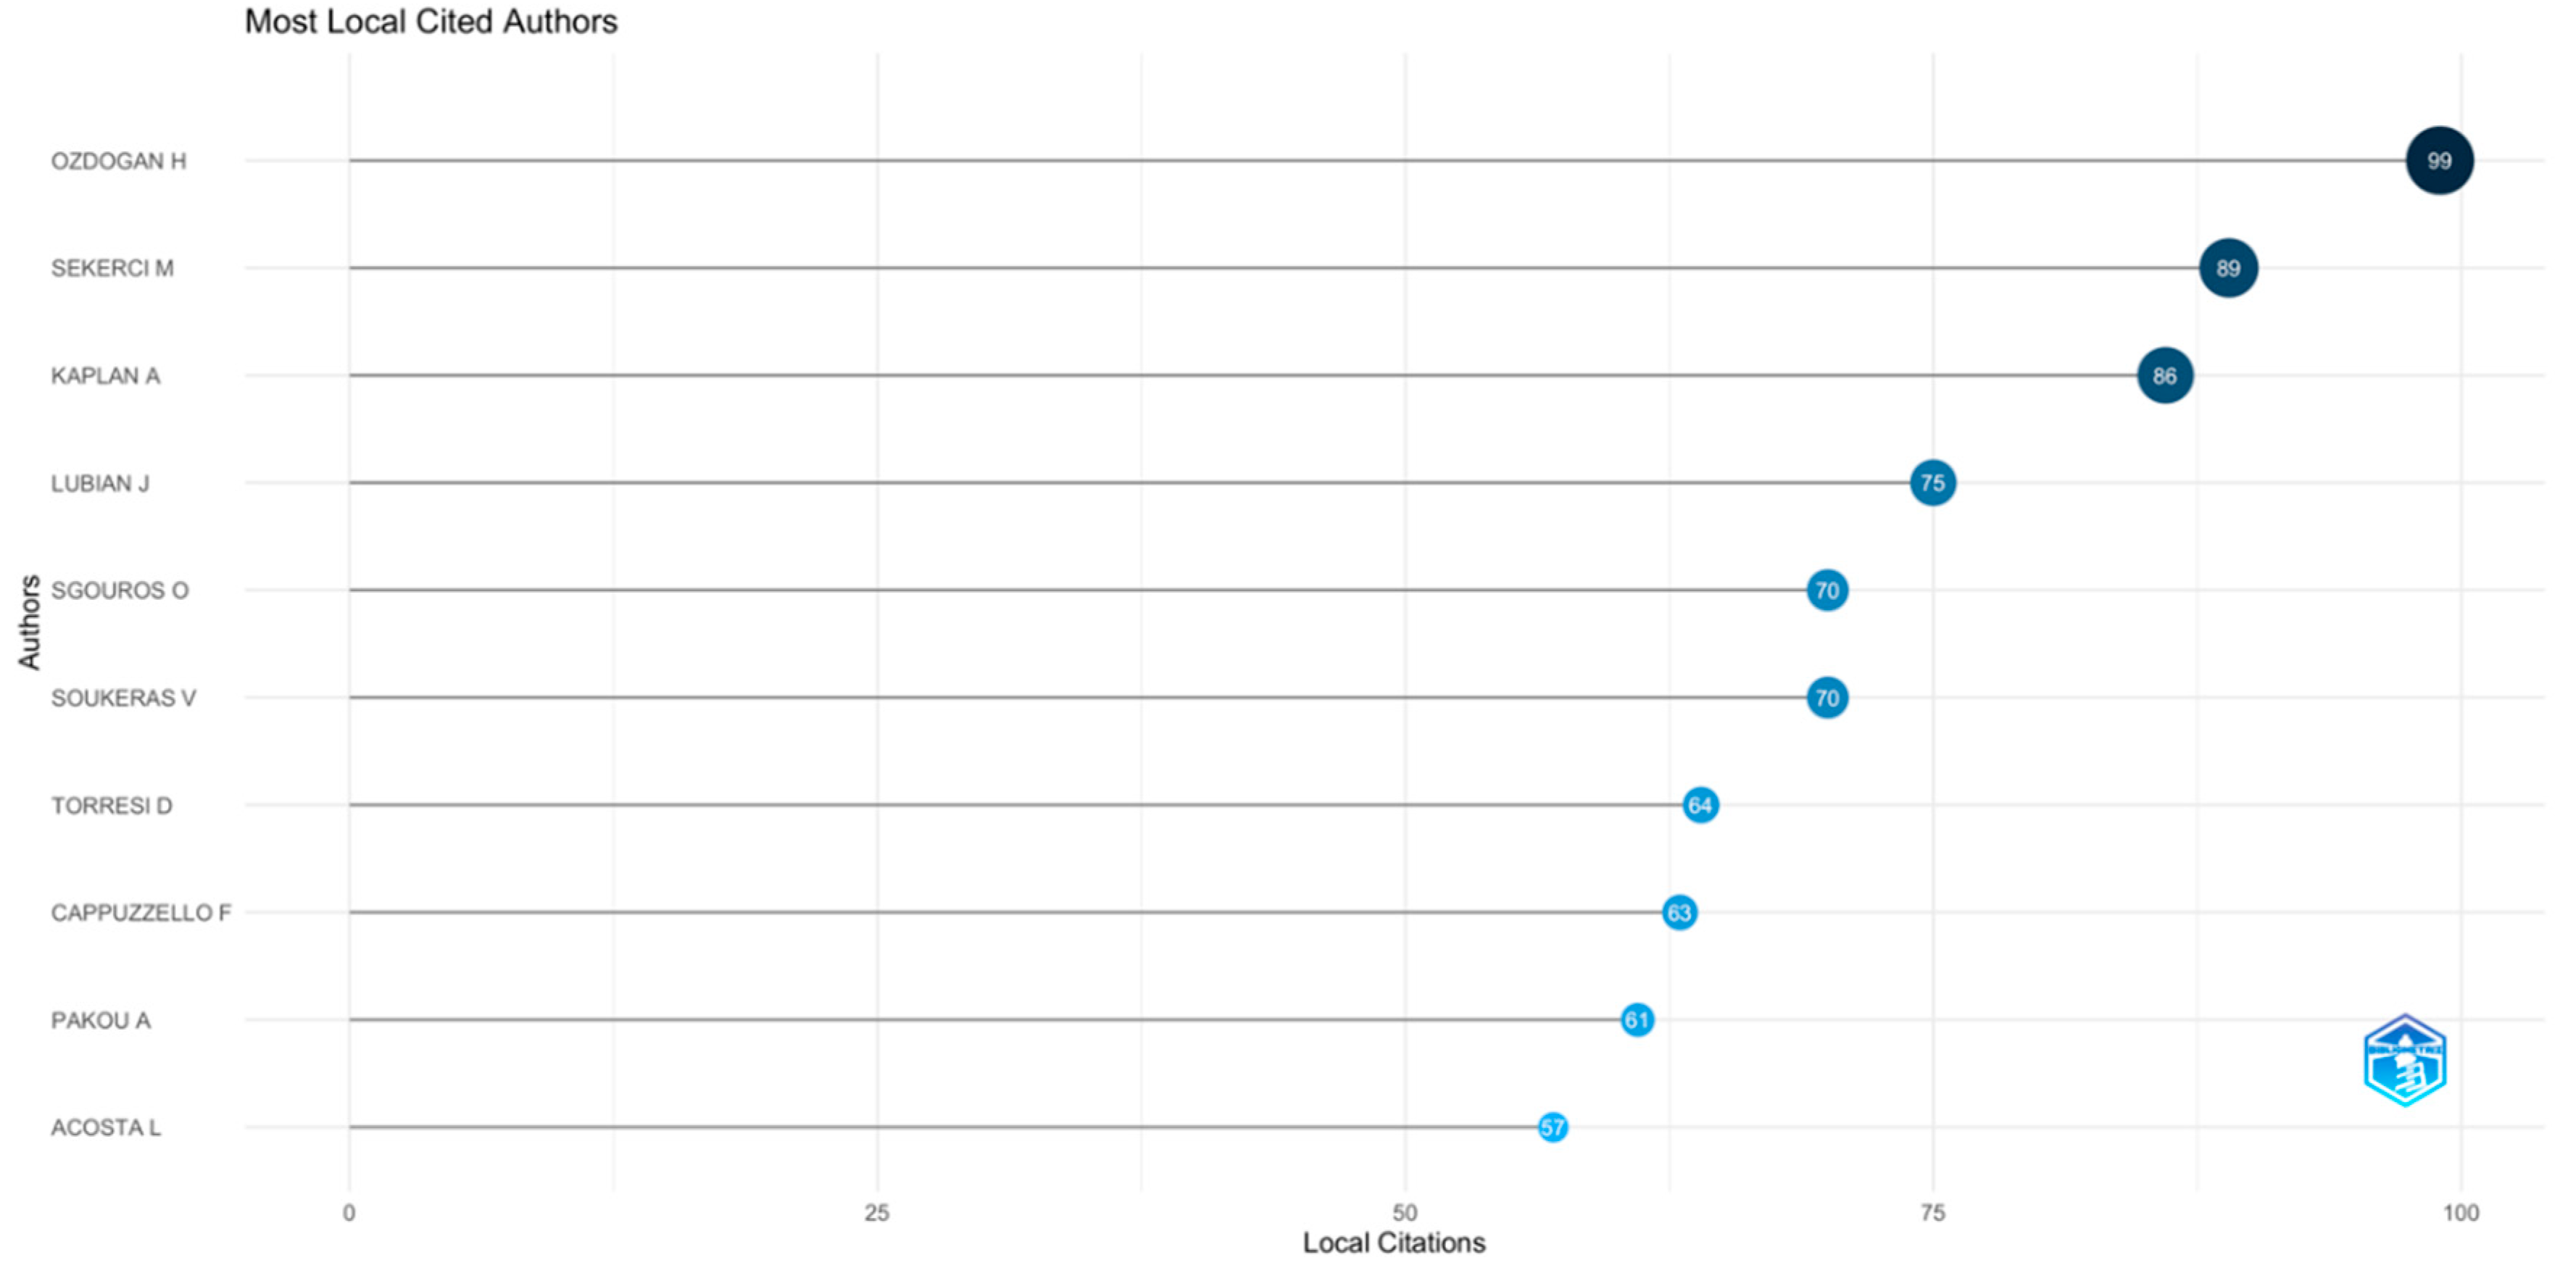
Figure 11.
Most relevant sources to nuclear reaction cross section between 2019-2023.
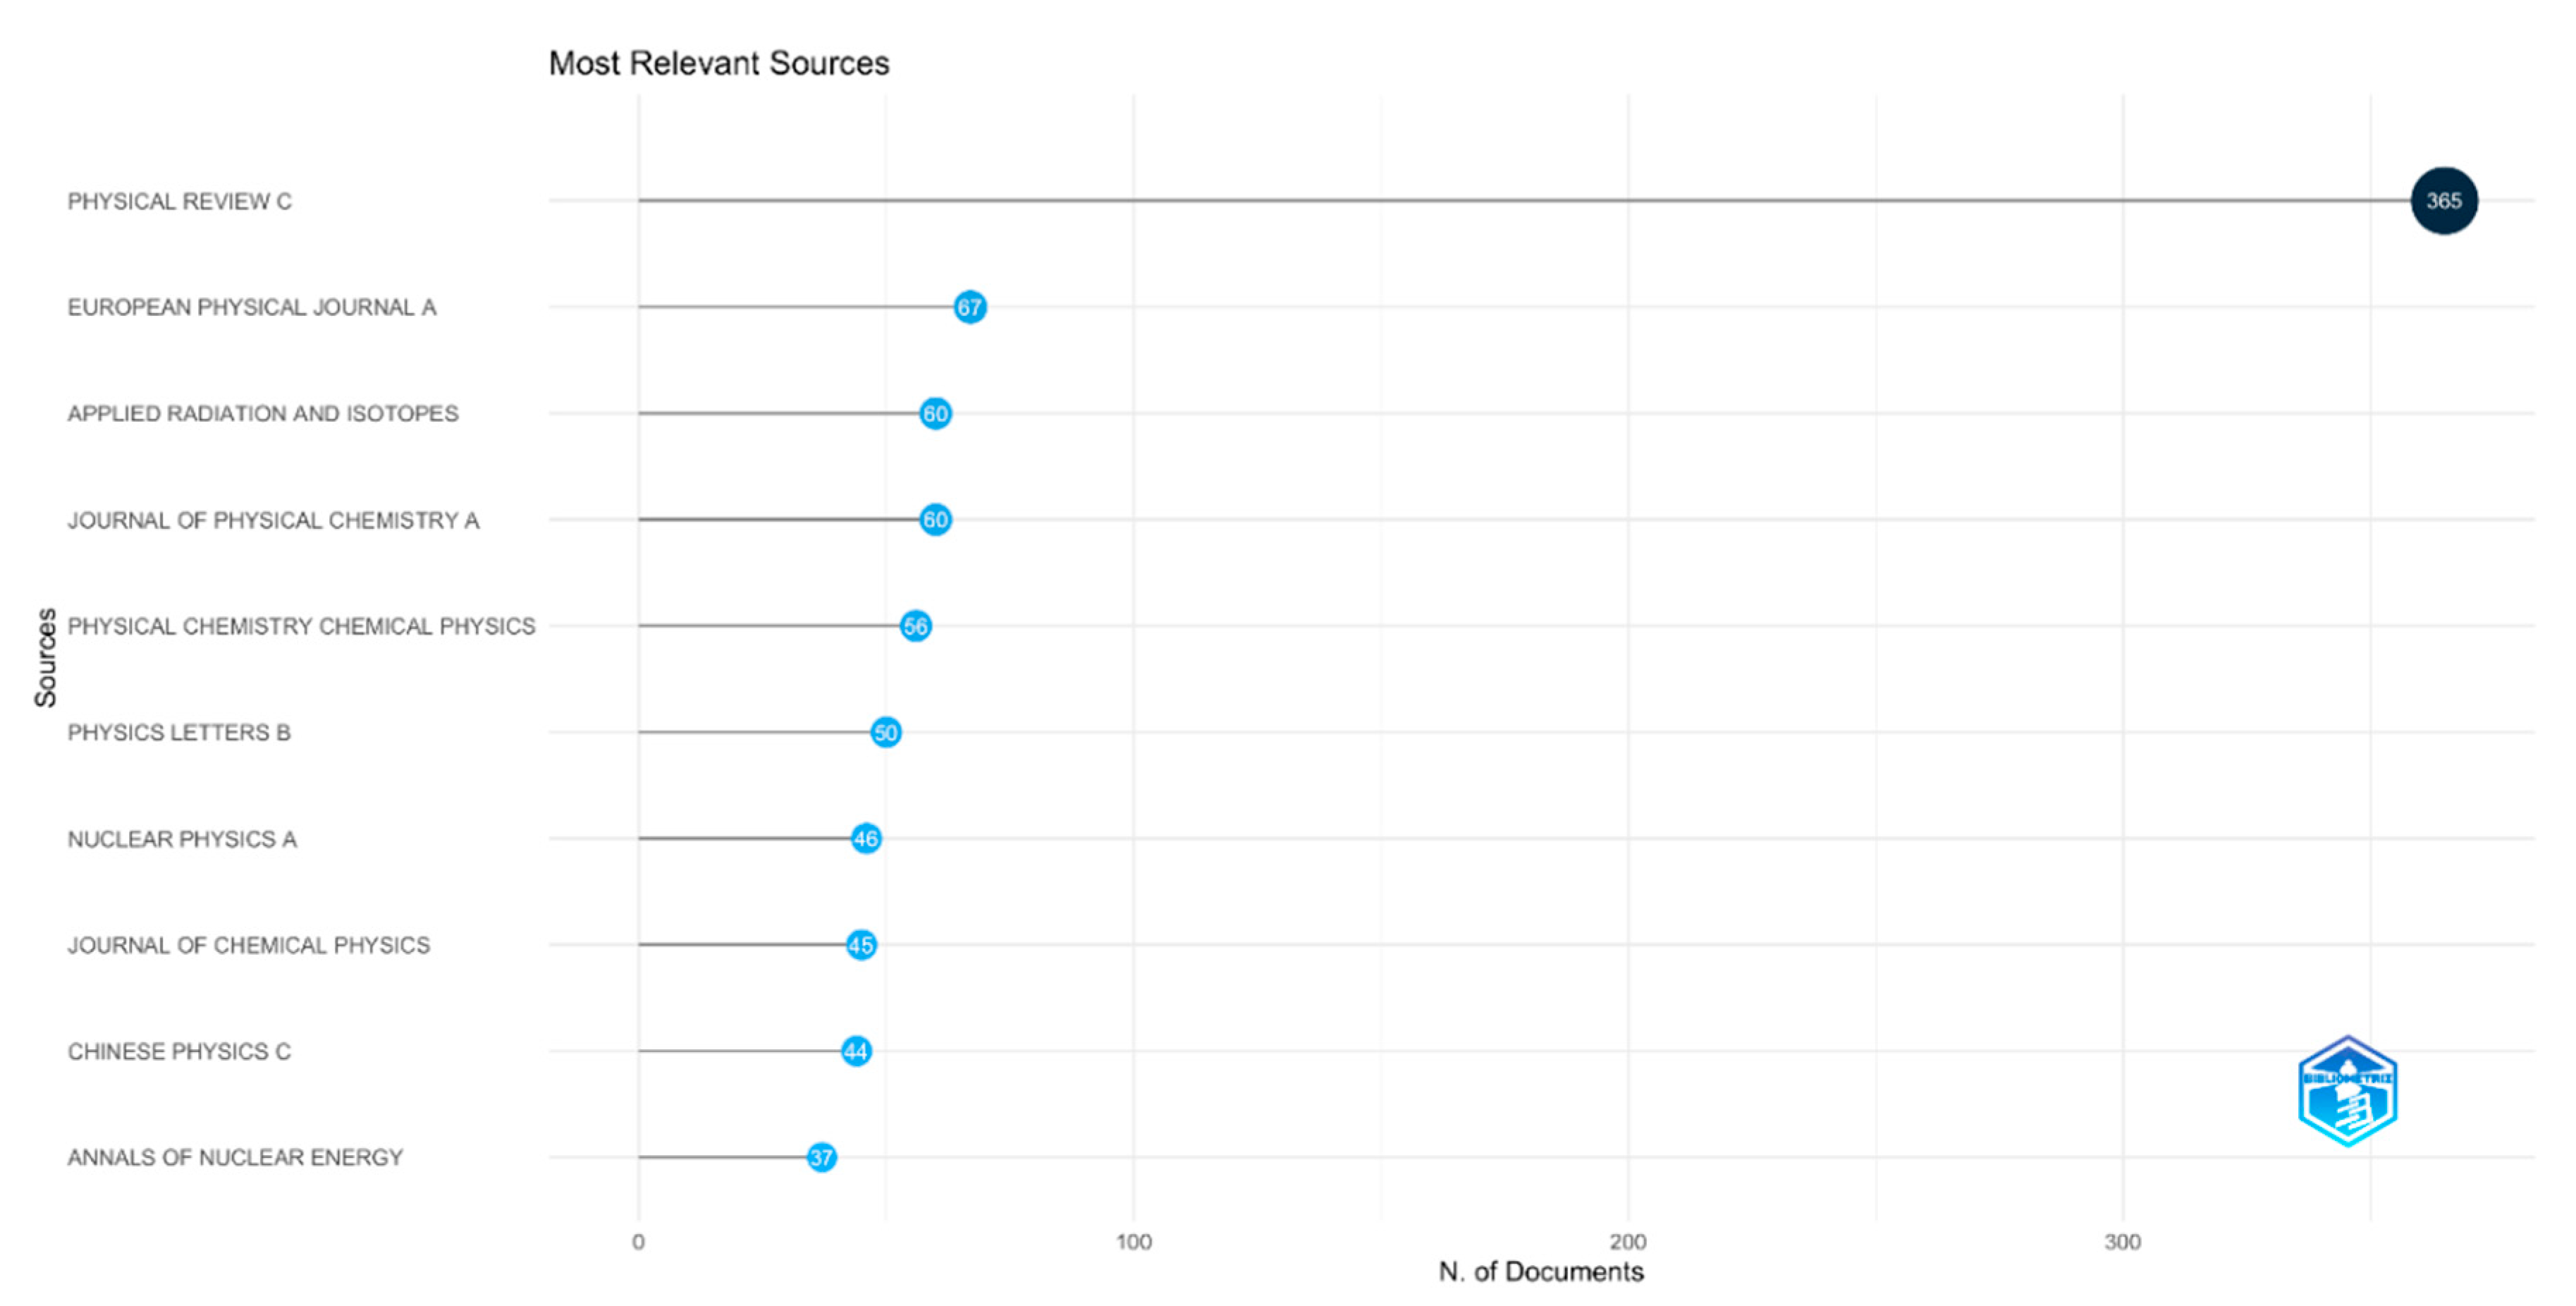
Figure 12.
Core journal by Bradford’s Law between 2019-2023.
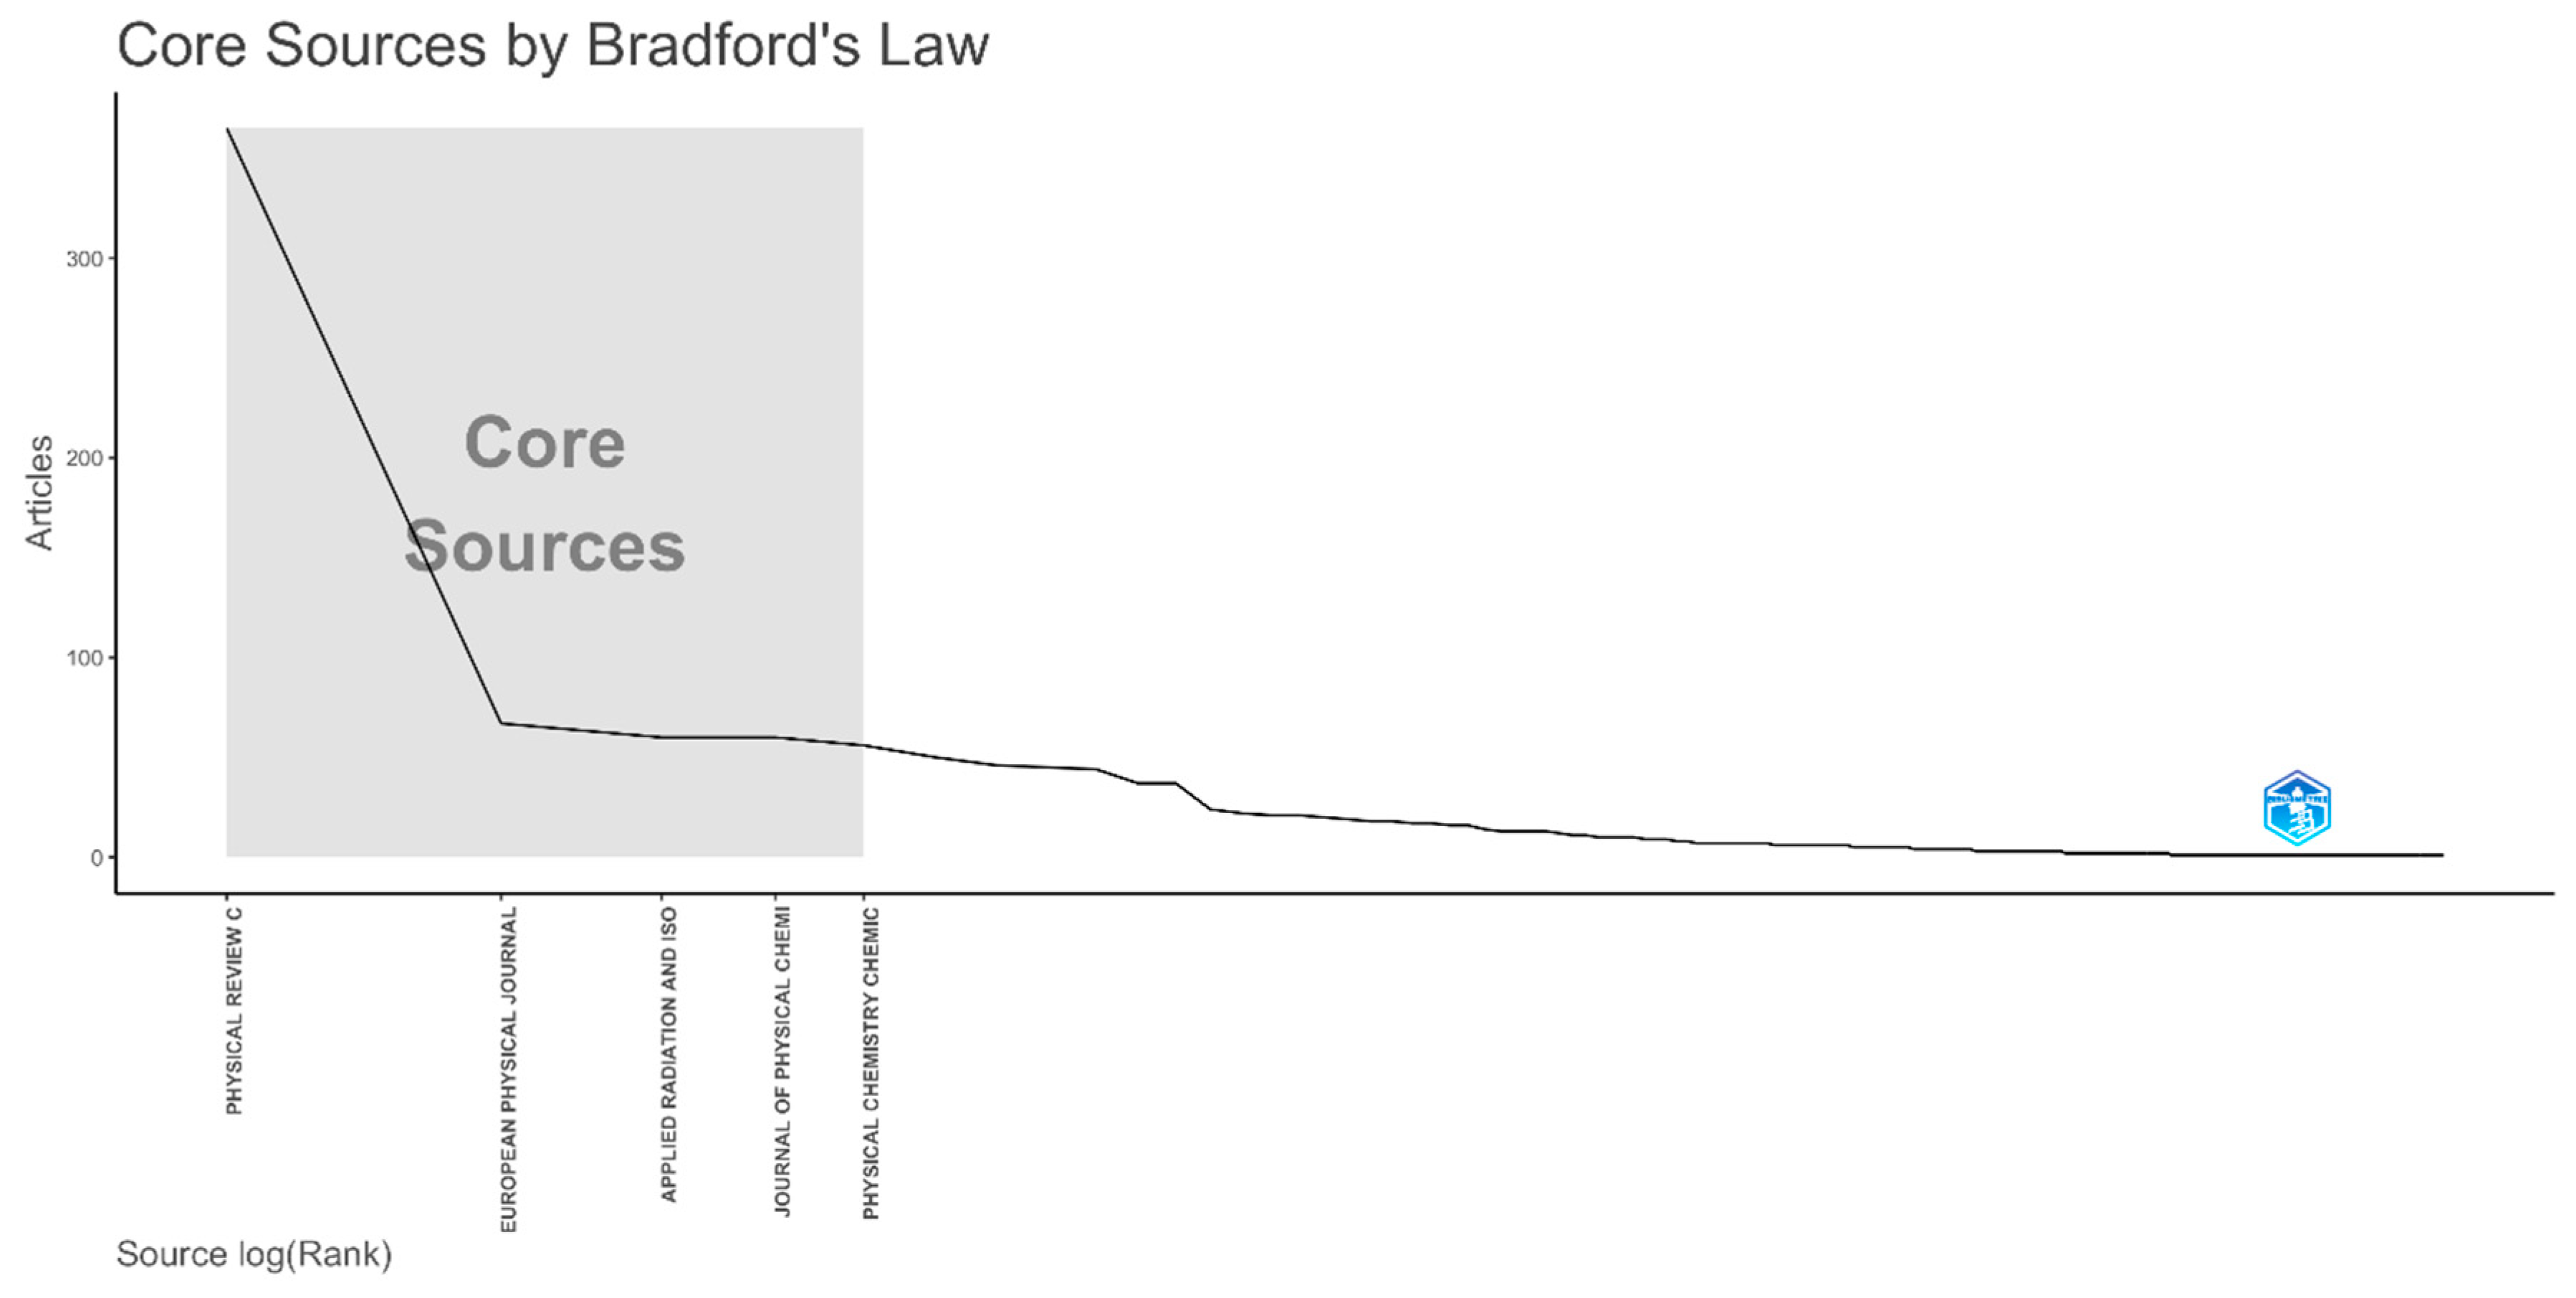
Figure 13.
Trend topics in nuclear reaction cross section between 2019-2023.
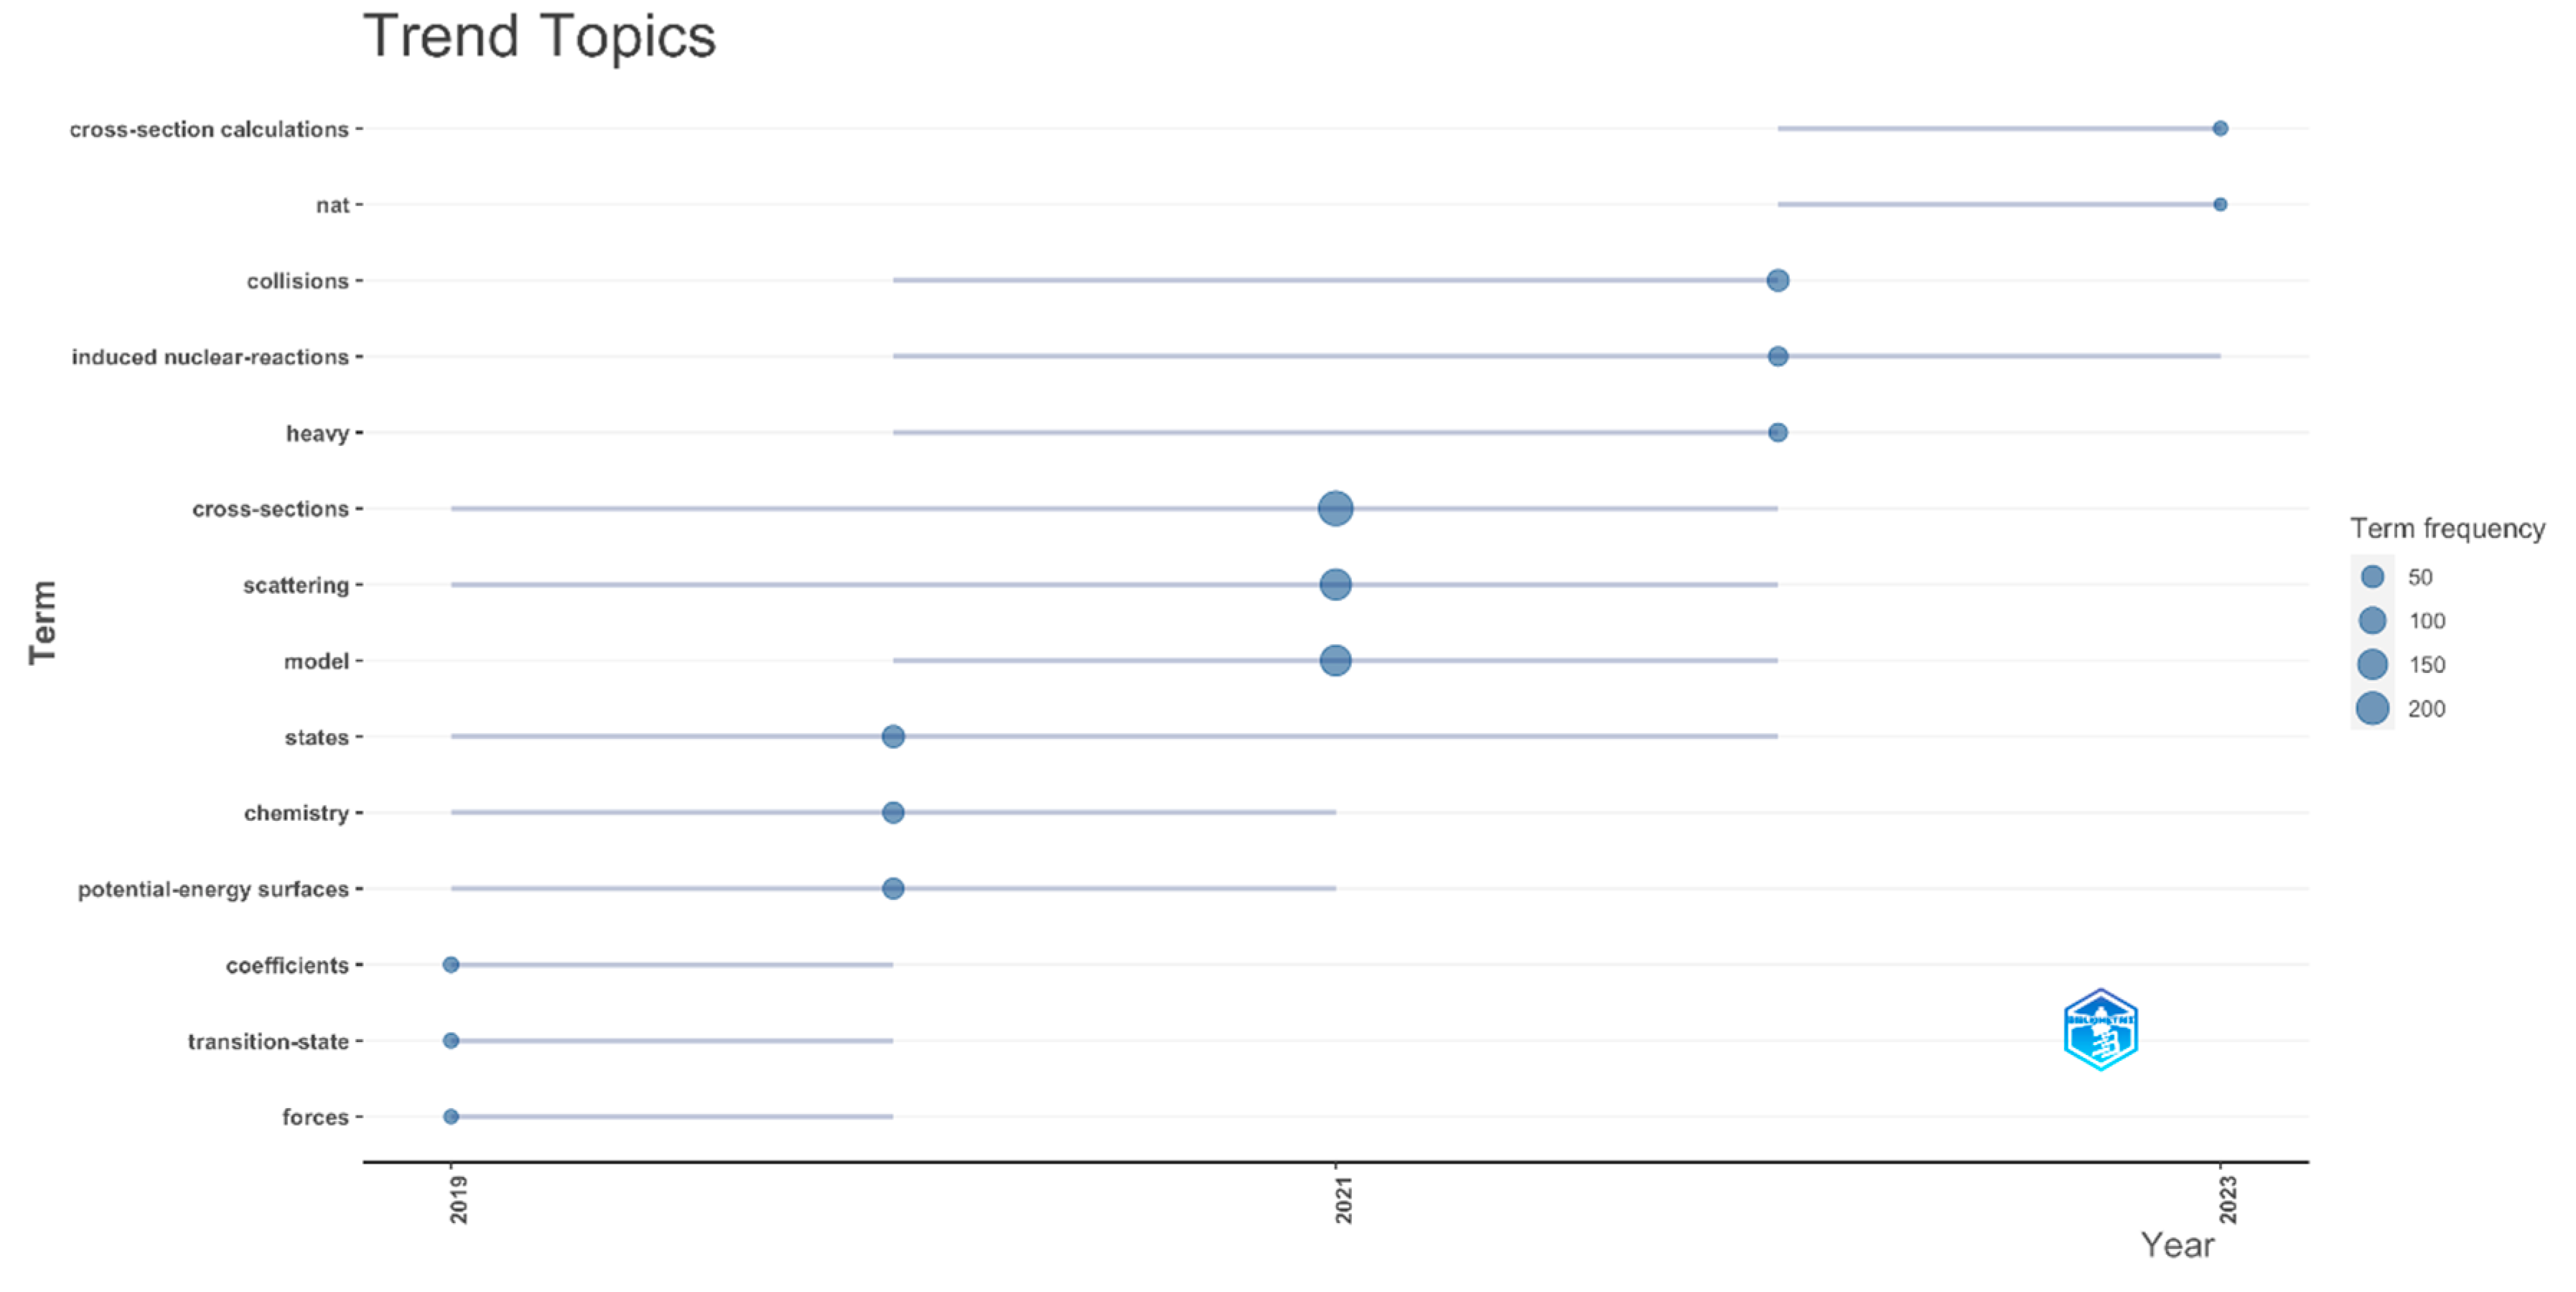
Figure 14.
Word tree map for field of nuclear reaction cross section between 2019-2023.
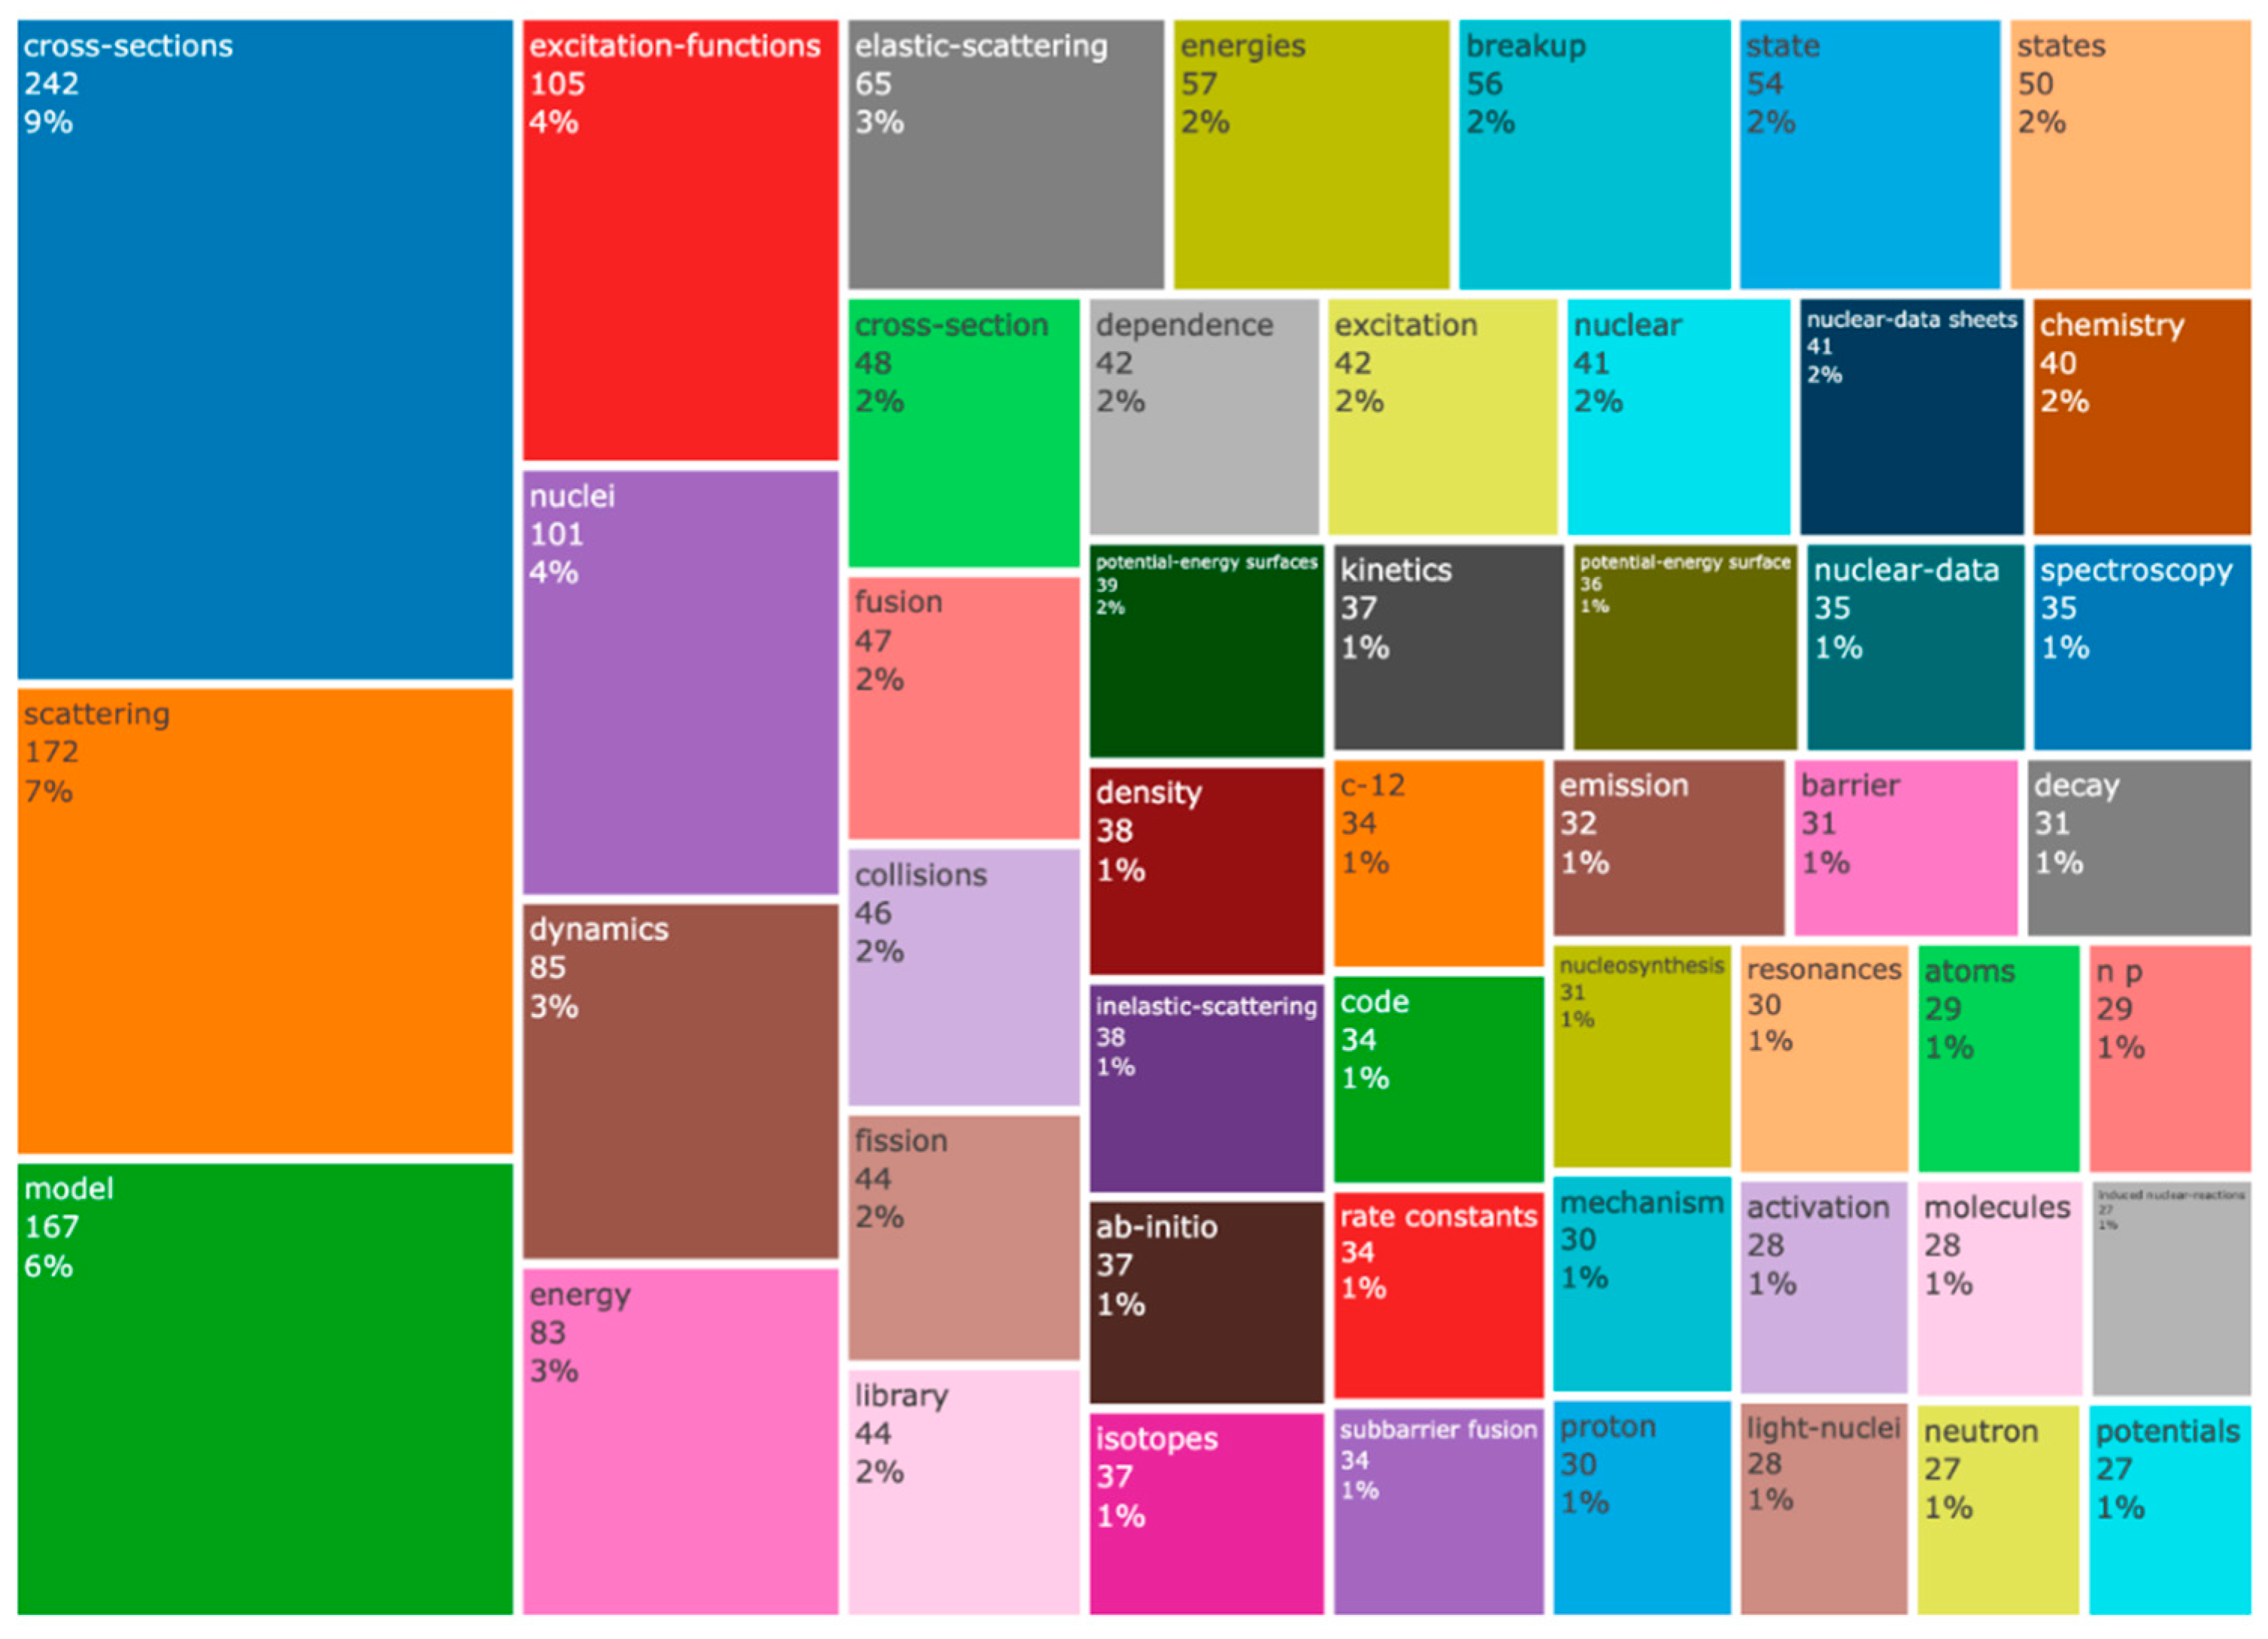
Figure 15.
Thematic map for nuclear reaction cross section.
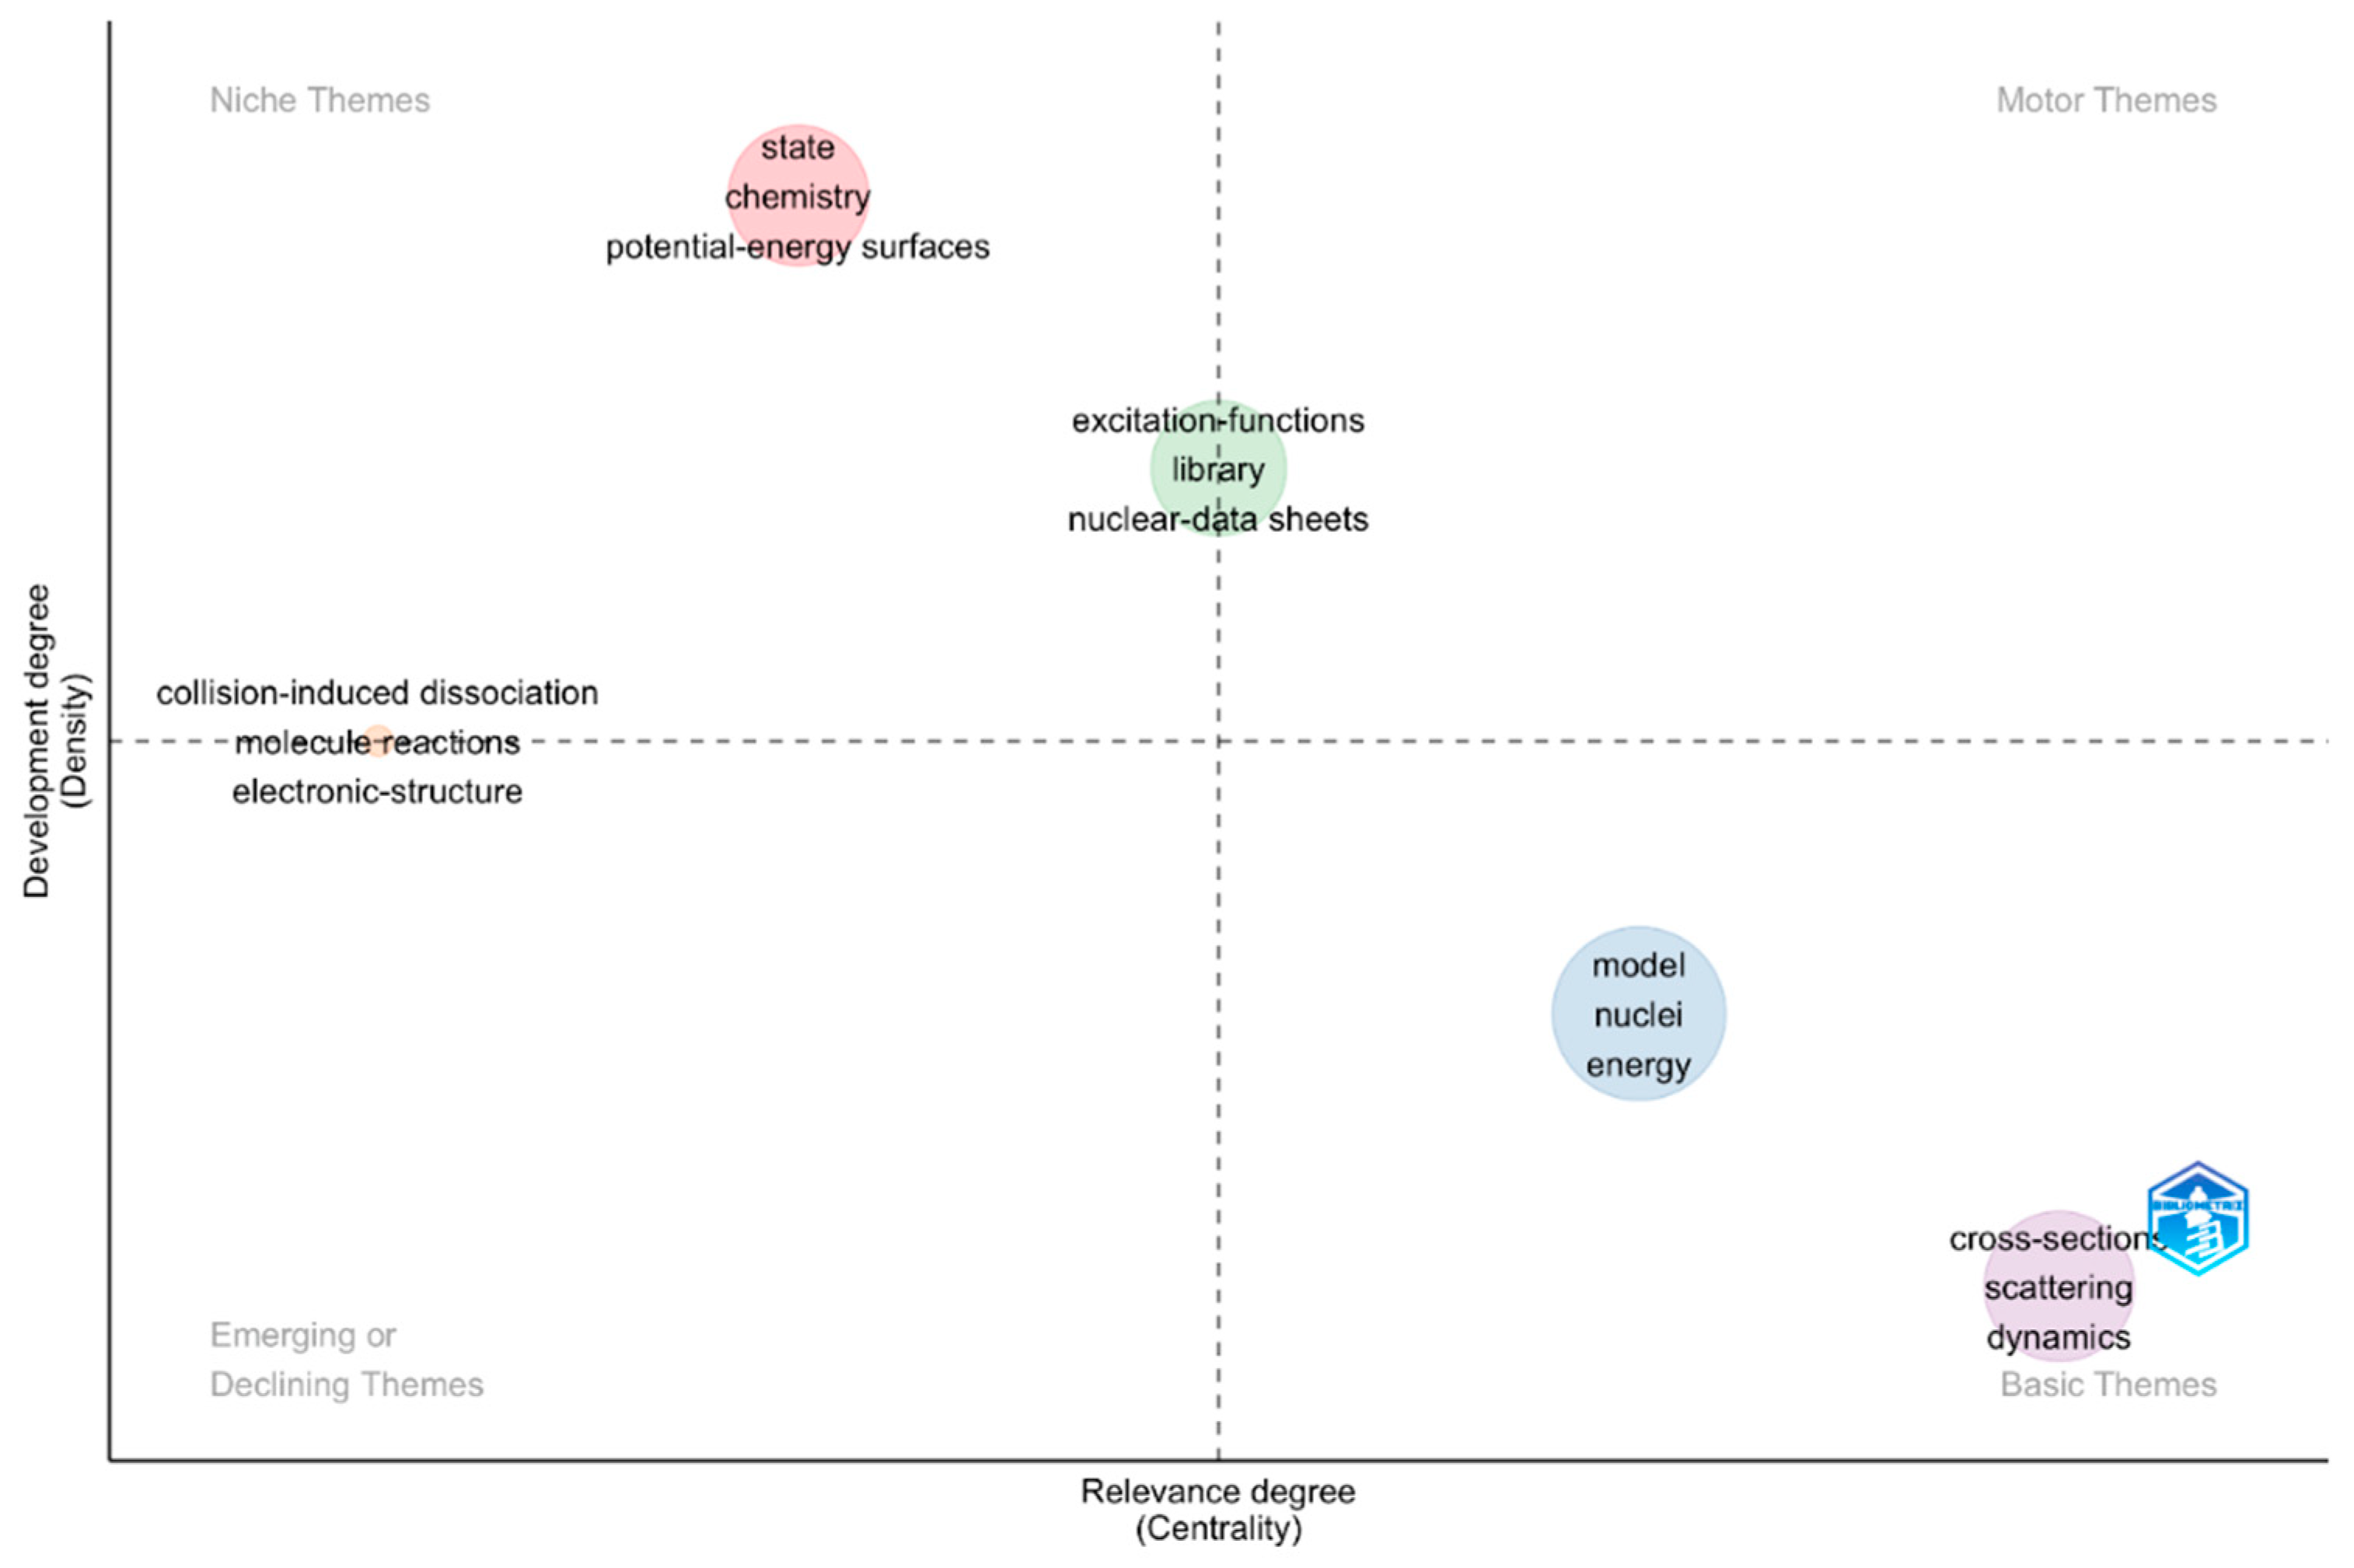

Table 1.
Main Information about Web of Science (WOS) Data.
| Description | Results |
|---|---|
| Timespan | 2019-2023 |
| Sources (Journals, Books, etc.) | 271 |
| Documents | 1769 |
| Annual Growth Rate % | -11.29 |
| Document Average Age | 2.18 |
| Average citations per doc | 4.42 |
| References | 53851 |
| DOCUMENT CONTENTS | |
| Keywords Plus (ID) | 3438 |
| Author's Keywords (DE) | 3048 |
| AUTHORS | |
| Authors | 7609 |
| Authors of single-authored docs | 87 |
| AUTHORS COLLABORATION | |
| Single-authored docs | 108 |
| Co-Authors per Doc | 8.75 |
| International co-authorships % | 39.63 |
| DOCUMENT TYPES | |
| Article | 1717 |
| Article; data paper | 2 |
| Article; early access | 23 |
| Article; proceedings paper | 27 |
Table 2.
The top 10 documents with the highest global and local citations.
| Global Citation | Local Citation | |||||
| Documents | TC | Doi | Document | LC | GC | Doi |
| [22] | 258 | 10.1039/c8ee02601g | [6] | 15 | 20 | 10.1016/j.apradiso.2018.10.011 |
| [23] | 105 | 10.1038/s41586-019-1090-x | [24] | 14 | 60 | 10.1016/j.nds.2019.12.002 |
| [25] | 104 | 10.1016/j.icarus.2018.06.013 | [26] | 13 | 18 | 10.1103/PhysRevC.99.034618 |
| [27] | 94 | 10.1016/j.jmst.2020.09.012 | [5] | 12 | 13 | 10.1016/j.apradiso.2018.10.007 |
| [28] | 78 | 10.1103/PhysRevD.99.103023 | [29] | 10 | 41 | 10.1103/PhysRevC.100.014612 |
| [30] | 64 | 10.1038/s41586-020-2878-4 | [4] | 10 | 15 | 10.1007/s10967-019-06533-6 |
| [31] | 64 | 10.1103/PhysRevLett.122.172502 | [32] | 10 | 28 | 10.1103/PhysRevC.102.044606 |
| [33] | 63 | 10.1016/j.jhazmat.2021.126584 | [34] | 9 | 19 | 10.1103/PhysRevC.99.044602 |
| [24] | 60 | 10.1016/j.nds.2019.12.002 | [35] | 9 | 11 | 10.1016/j.nuclphysa.2019.01.009 |
| [36] | 43 | 10.1103/PhysRevC.99.025502 | [37] | 9 | 23 | 10.1103/PhysRevC.100.034620 |
| TC: Total Citation, LC: Local Citation, GC: Global Citation | ||||||
Disclaimer/Publisher’s Note: The statements, opinions and data contained in all publications are solely those of the individual author(s) and contributor(s) and not of MDPI and/or the editor(s). MDPI and/or the editor(s) disclaim responsibility for any injury to people or property resulting from any ideas, methods, instructions or products referred to in the content. |
© 2025 by the authors. Licensee MDPI, Basel, Switzerland. This article is an open access article distributed under the terms and conditions of the Creative Commons Attribution (CC BY) license (http://creativecommons.org/licenses/by/4.0/).
Copyright: This open access article is published under a Creative Commons CC BY 4.0 license, which permit the free download, distribution, and reuse, provided that the author and preprint are cited in any reuse.


