
Submitted:
09 October 2025
Posted:
14 October 2025
You are already at the latest version
Abstract
In flooded soils, the concentrations of exchangeable Mn2+ and, mainly, Fe2+ can be high and need to be considered in determining the cation exchange capacity (CEC) of the soil under flooded conditions. However, these reduced forms of Mn and Fe are oxidized and precipitated during the extraction process used by traditional methods for determining CEC. This procedure underestimates the exchangeable portion of these cations and, consequently, the CEC value of the flooded soil. The objective of this study is to propose an alternative to estimate the exchangeable Fe2+ and the effective CEC (ECEC) of flooded soils. To achieve this goal, 21 surface samples (0-20 cm) of soils from rice fields were collected, distributed in the cultivation regions of Southern Brazil. The soils were flooded for 50 days. The soil solution was collected on the first day and after 50 days of flooding. and, pH, Na, K, Ca, Mg, Fe and Mn were determined. In these samples, exchangeable cations (K, Na, Ca, Mg, Mn, Al and H+Al) were determined to calculate ECEC and CEC at pH 7 of unflooded soil and after 50 days of flooding. The results were used to develop models to predict ECEC and exchangeable Fe content after 50 days of flooding. The estimation of the ECEC after flooding by the gradient of pH increase before and after flooding generated values closer to CEC pH 7.0, correcting the possible underdetermination of the ECEC during flooding. The amount of exchangeable Fe estimated was higher than the exchangeable Fe determined, correcting the possible underestimation of these quantities determined during flooding. It is concluded that the estimatives of ECEC after flooding through the equation ECECafter=ECEC+pHsol.after- pHsol.before . (CECpH7- ECEC)(7- pHsol.before) and the exchangeable Fe2+ after flooding through the equation Feexc.after.estimated=ECECafter- Ca+Mg+K+Na+Mn corrected the problem of underestimating the values of these variables by analythical methods, demonstrating its viability for the use in flood prone soils.
Keywords:
irrigated rice
; flooding
; ion retention in soil
; iron
; manganese
1. Introduction
Rice cultivation in Brazil is characterized by the flood irrigation system [1,2]. Under these conditions, a series of physical, chemical and biological transformations take place in the soil [3], resulting in a change from an aerobic (oxidized) environment to an anaerobic (reduced) environment [4]. The main chemical change that occurs during flooding is the reduction of poorly soluble Fe3+ to highly soluble Fe2+, with a consequent increase in pH to values close to 6.5-7.0 in 3 to 4 weeks time [5,6]. The pH in acid soils increases with flooding, since reduction reactions occur with the consumption of H+ [4]. Manganese (Mn) is another cation whose oxidation-reduction is altered by flooding, changing from Mn (IV) (oxidized form) to more soluble Mn (II) (reduced form), and significant amounts of Mn2+ begin to accumulate in the exchange complex [7]. However, the determination of these exchangeable cations in soil samples after flooding is normally underestimated, since in this reduced condition they are very susceptible to oxidation during sampling and analysis. This occurs especially with Fe2+, which is very unstable, causing serious determination errors. The cations Na+, K+, Ca2+ and Mg2+ are not directly involved in the oxidation-reduction reactions and what generally occurs is a displacement of these cations from the exchange sites to the soil solution [8]. As the pH increases to values above 6.0, almost all of the exchangeable Al will precipitate and disappear from the exchangeable phase [9].
The CEC of soils under dryland conditions is composed mainly of the cations K+, Na+, Ca2+, Mg2+ and Al3+ [8]. However, with the changes caused by flooding, the ECEC of a soil after three to four weeks of flooding will be composed of K+, Na+, Ca2+, Mg2+, Mn2+ and Fe2+. Fe2+ is able to occupy a very significant portion of the exchange complex due to the large amounts of this element that can be reduced during flooding [4]. Another change caused by the increase in pH is the increase in variable soil charges or pH-dependent charges. Thus, the ECEC after flooding is expected to assume values close to those of the potential CEC (pH 7.0) [10].
The process of chemically reducing Mn and Fe and increasing the concentration of these elements in the soil solution are beneficial for rice, as they increase the pH, the availability of Mn and Fe, also displacing other cations into the soil solution. Additionally, they are important because they increase the availability of phosphorus [7]. All these changes favor the growth and development of rice by increasing the availability of nutrients to plants [11,12]. However, under certain circumstances, Fe can reach toxic levels, impairing plant growth and rice yield [5,13]. Fe toxicity in irrigated rice is one of the most important abiotic stresses limiting rice production worldwide [14]. In severe cases, it can cause plant death and reduce rice production up to 100%, depending on the intensity of toxicity and the cultivar's tolerance [15]. Predicting the occurrence of Fe toxicity in flood irrigated soils can lead to better measures in order to avoid or minimize this disturbance. However, the simple interpretation of the analysis of soil samples carried out under dryland conditions does not fit with the condition after flooding, given all the transformations caused by it. In order to solve this problem, it may be possible to estimate the cation levels in the flooded soil through soil characteristics that are related to the chemical transformations during flooding. This can be determined in samples under dryland conditions. However, to establish all these relationships, it is necessary to have the amount of Fe2+ accumulated during flooding. Since acquiring this variable is very difficult, obtaining this data via estimation would allow one to establish the changes when comparing before and after flooding and, consequently, a way to predict the occurrence of Fe toxicity [5,16].
Thus this work makes the assumption that , based on a sample collected before flooding, it is possible to estimate the ECEC after flooding through a linear relationship between the variation of pH before and after flooding with the variation of the ECEC and CEC pH 7.0, and assigning the difference between this estimated ECEC and the sum of the cations Ca, Mg, Mn, K and Na to the amount of exchangeable Fe2+ that starts to occupy the exchange sites after flooding. Based on what was previously mentioned, this paper aims to propose an alternative for estimating exchangeable Fe2+ and ECEC after flooding.
2. Materials and Methods
2.1. Experimental Design
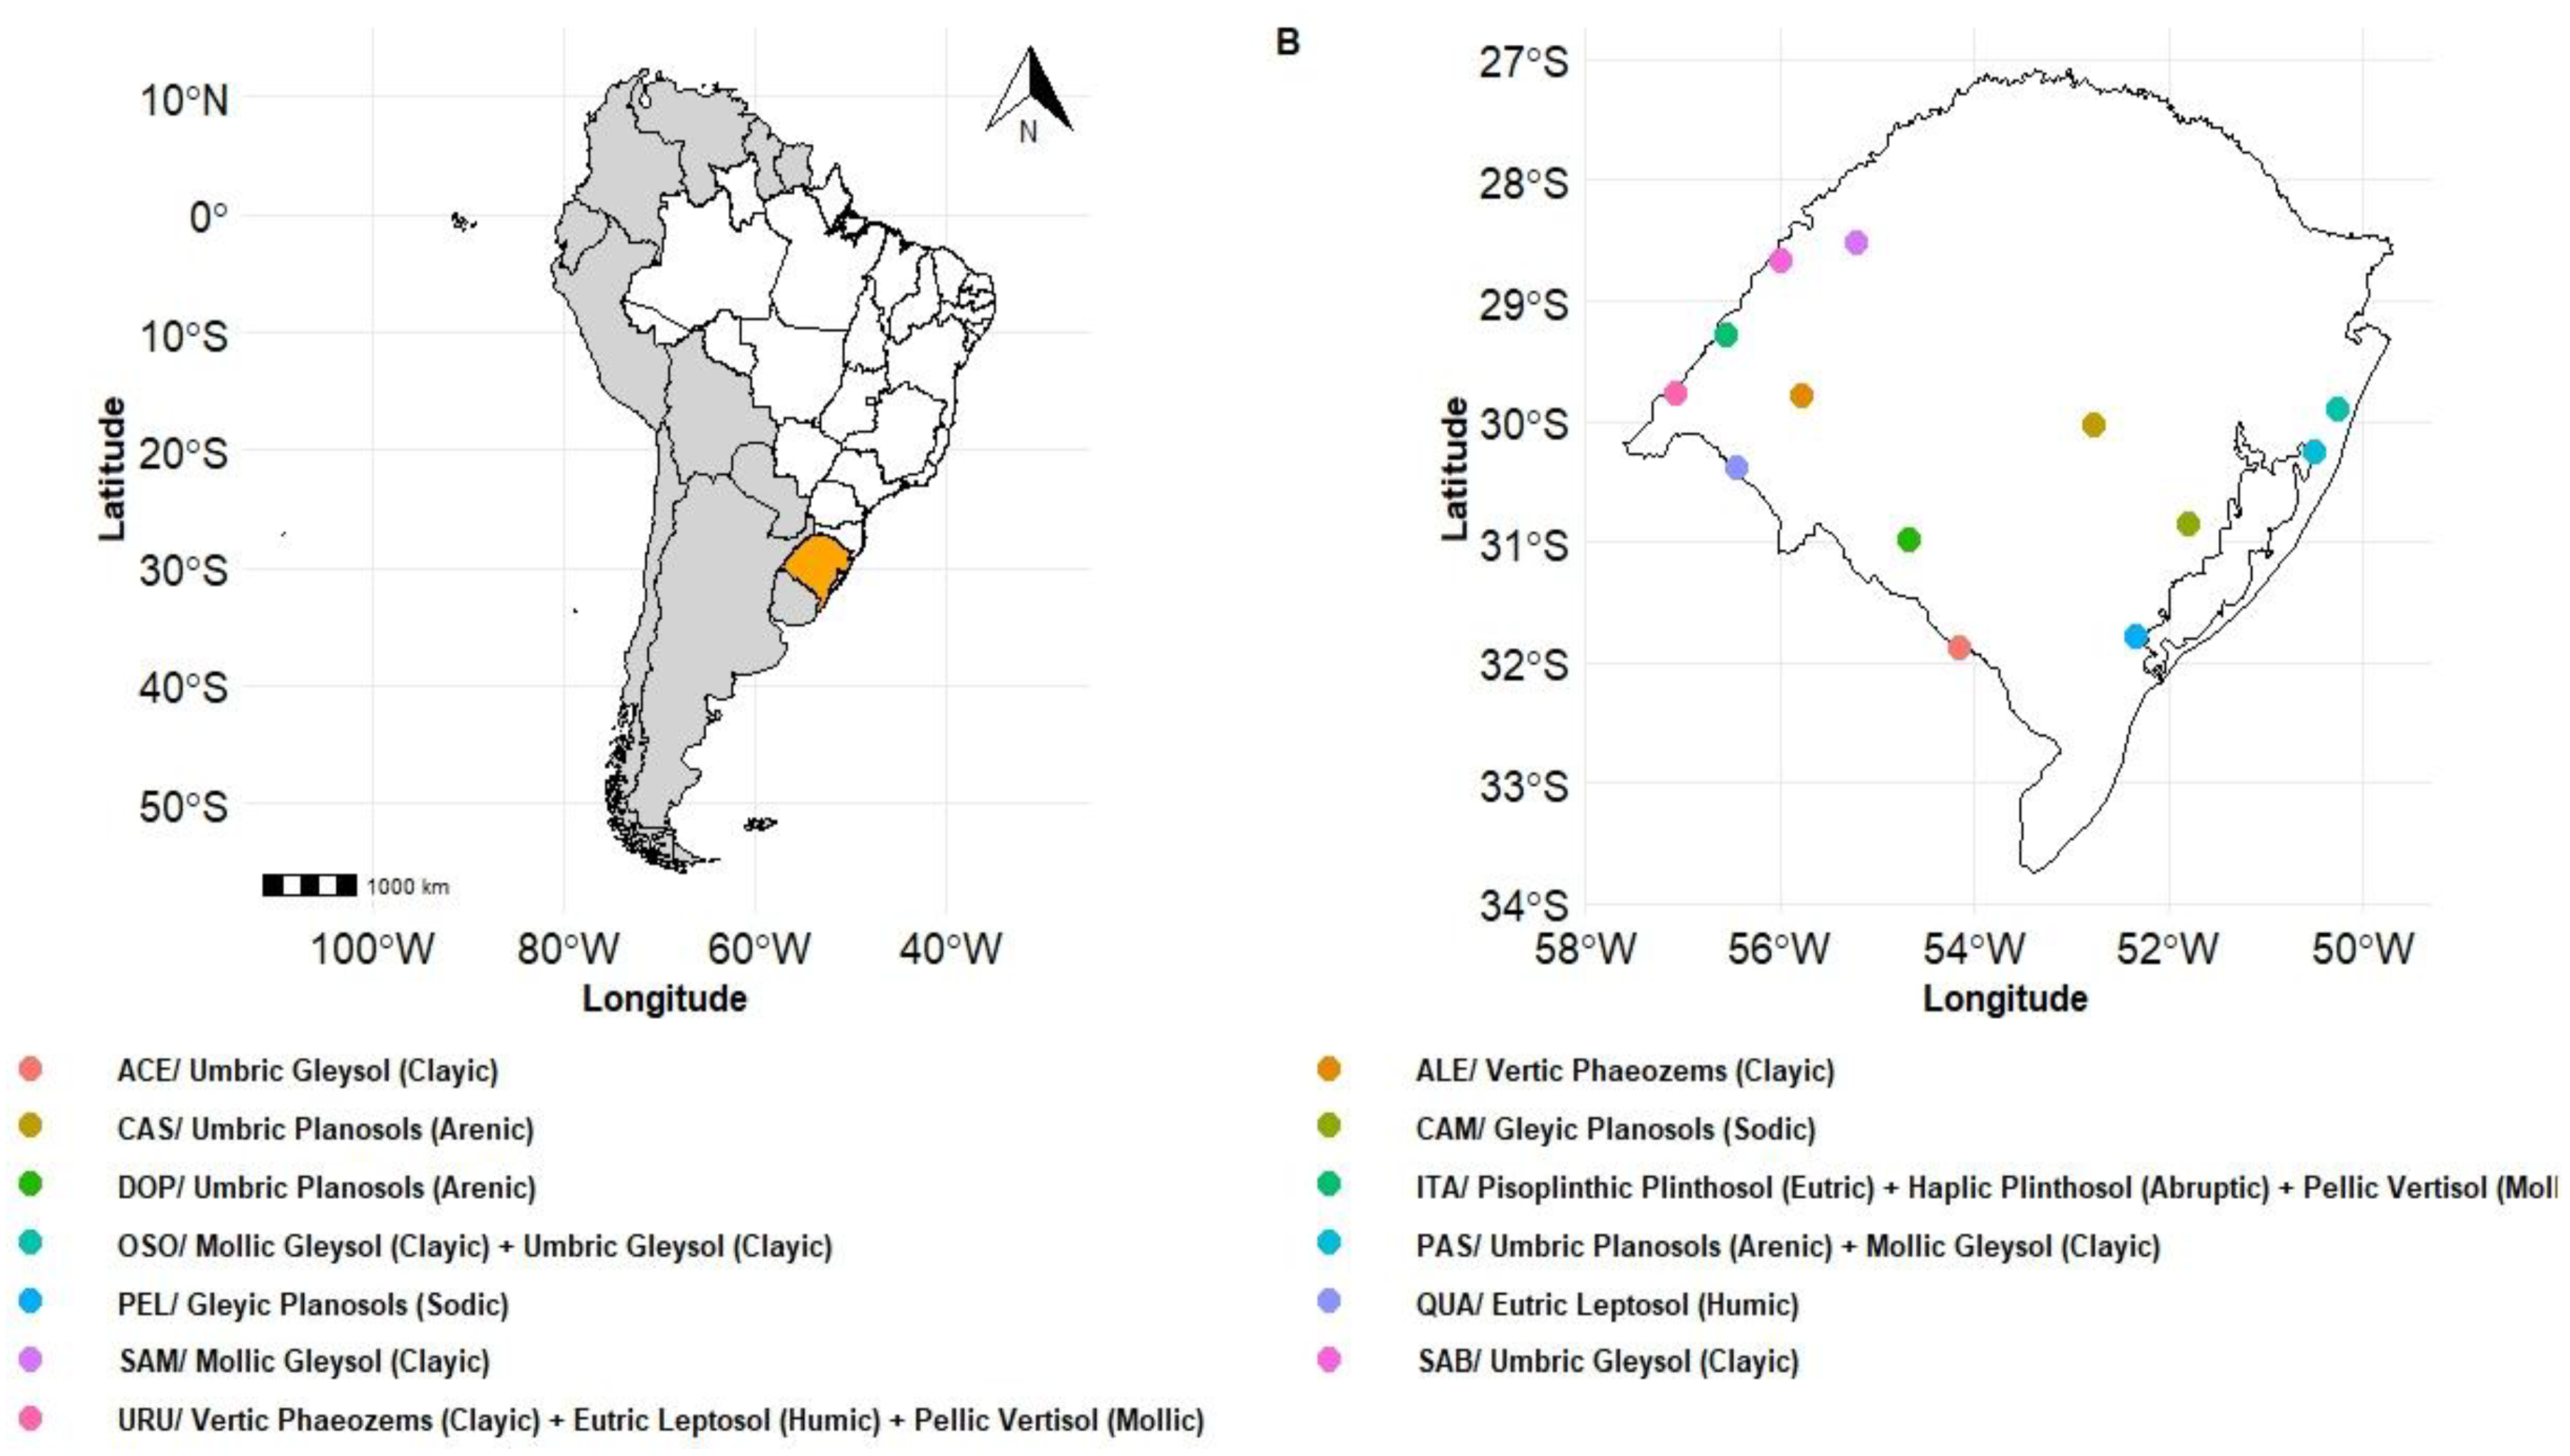
For this study, 21 surface samples (0-20 cm) of soils from rice fields were collected, distributed from the cultivation regions of southern Brazil. The proportion of soil classes sampled was carried out in an attempt to reproduce what happens in the environment, collecting in greater numbers the soils most cultivated with rice. Thus, most of the soils are located in floodplains, but some in gently undulating relief. Table 1 describes the soil samples, together with the mapping unit. After collection, the samples were air-dried, sieved through a 4 mm mesh and stored in plastic bags.
2.2. Soil Analysis
To evaluate the effect of soil flooding on the quantities of exchangeable cations and to determine these cations in the soil solution, subsamples of 0.85 L of sieved soil were placed in duplicate in PVC pots measuring 7.5 cm in diameter and 30 cm in height. In order to facilitate the soil reduction process, ground corn straw (shoots) was added to the soils in quantities equivalent to 2 t ha-1 (0.85 g pot-1). The straw was mixed with the soils before placing them in the pots, together with enough water to raise the moisture content to values close to field capacity. After this procedure, the subsamples were placed in the incubation pots (the soil was placed gradually, gently tapping the bottom of the pots on the table to accommodate it conveniently). All pots were kept in this field capacity condition for 13 days and were then flooded with distilled water. The water level was maintained at a depth of 5 cm above the soil surface for 50 days.
Figure 1.
Geographical distribution of soil sample collection points in paddy fields in southern Brazil. Figure made by the authors.
Figure 1.
Geographical distribution of soil sample collection points in paddy fields in southern Brazil. Figure made by the authors.
Collection tubes similar to those described elsewhere [4] were used to collect the soil solution and were installed in the incubation vessels at the time of placing the soil. The solution was sucked from these tubes using a plastic syringe. Samples of the soil solution were collected at one day and at 50 days after flooding. The solution collected after one day of flooding was considered to represent the oxidized conditions of the soils.
As the samples were placed in the pots, a subsample of each soil was collected, which was air-dried again and used to determine the contents of exchangeable cations before flooding (K, Na, Ca, Mg, Mn, Al and H+Al). The K and Na cations were extracted with 1 mol L-1 NH4OAc pH 7.0, the cations Ca, Mg, Mn and Al with 1 mol L-1 KCl and the H+Al cations with 1 mol L-1 CaOAc pH 7.0 [18]. The cations were extracted with a single extraction. In all cases, a soil:extractor ratio of 1:10 was used with one hour of shaking. After extraction, the determination of Na and K in the extracts was performed by flame photometry, the determination of Ca, Mg and Mn by atomic absorption spectrophotometry, and the determination of Al and H+Al by titration with NaOH. The ECEC of the soil was determined by the sum of K, Na, Ca, Mg, Mn and Al, while the CEC at pH 7.0 was determined by the sum of K, Na, Ca, Mg, Mn and H+Al [18].
At the end of the soil flooding period (50 days), the exchangeable cation contents were determined again. To do this, a second collection of subsamples was performed using a plastic syringe with the end cut to form a collection tube. This tube was inserted into the soil through a hole in the wall of the incubation vessel of a diameter such that the collection tube would fit snugly (this hole was made before placing the soils in the vessels and was kept closed during the incubation period using a rubber stopper). The collection of subsamples of approximately 3 cm3 was performed under a N2 jet, spraying the gas over the samples when removing them from the soil until they were released into a centrifuge tube containing 30 mL of the 1 mol L-1 KCl extraction solution. The tubes were immediately capped and weighed to determine the weight of the soil (the tare weight of the tubes was determined previously). They were then shaken for 1 hour and centrifuged. A 10 mL aliquot of the supernatant was then removed with a pipette and placed in a glass with 1 mL of 1.1 mol L-1 HCl, so that the final concentration of the acid was 0.1 mol L-1. Subsequently, the exchangeable Fe and Mn contents were determined by atomic absorption spectrophotometry. Exchangeable K was determined by the same procedure as that used for the sample before flooding. Part of the subsample corresponding to the middle of the incubation tube was used, and for this purpose the upper half of the soil from the tubes was eliminated. Since it was found that exchangeable K did not vary after flooding in relation to the initial levels, it was assumed that the exchangeable cations Ca and Mg did not vary either, and these cations were not determined after flooding. In all cases, the moisture content of the soil was determined and the cation levels were calculated on a dry soil basis, and the concentration of the soil solution was subtracted when determining the exchangeable levels.
The pH of the soil solution was determined on the first and 50 days after flooding in samples collected with a syringe, as previously described. For this purpose, 20 mL aliquots of the solution were injected immediately after collection into an electrometric cell containing a combined electrode for pH measurement. The electrometric cell was constructed with an acrylic flask and a rubber stopper with holes for installing electrodes, as described in [4]. The volume of solution in the cell equipped with the electrode was 18 mL. The solution was injected into the cell with the same syringe in which it had been collected from the incubation vessels, through a small feeding tube inserted flush with the bottom of the cell. This was performed until it filled the entire volume of the cell and the excess exited through the discharge hose connected to the lid, releasing the excess into a beaker. This was intended to minimize any contact between the solution and oxygen.
The soil solution was collected in the same manner as for pH determinations. It was filtered through a 0.45 µm Millipore filter immediately after collection, under vacuum and receiving the filtrate in a glass vial with 1 mL of 1.1 mol L-1 HCl. The aliquots had a volume of 10 mL, so that the final acid concentration was 0.1 mol L-1. To calculate exactly the sample dilution with acidification, the glass vials were weighed before adding the acid and after adding the acidified soil solution. In the solution thus collected and acidified, the concentrations of Na, K, Ca, Mg, Fe and Mn were determined: the first two by flame photometry and the others by atomic absorption spectrophotometry. Soluble Al3+ was considered insignificant. In three of the 21 samples (1, 10, 19), solution measurements were taken weekly to determine approximately the time at which the transformations reached their peak, which was observed at 49 days of flooding, and then all samples were collected and analyzed. To estimate the amount of exchangeable Fe accumulated during flooding, the ECEC after flooding of the soil (ECECafter) was first estimated, based solely on the variation in the cation exchange capacity determined in the dry soil samples and the variation in pH resulting from soil reduction. In this sense, the calculation of the estimated ECEC after flooding was performed using equation 1.
(Equation 1)
The estimation of exchangeable Fe is based on the estimated ECEC and the contents of exchangeable cations, both after flooding. Since exchangeable Ca, Mg, K and Na do not change much after flooding and, with the increase in pH, Al3+ is neutralized, it is assumed that any increase in CEC due to the increase in pH resulting from flooding is reflected in the contents of Mn and Fe. Therefore, the difference between the estimated ECEC after flooding and the sum of Ca, Mg, K, Na and Mn can be attributed to the exchangeable Fe content after flooding. Thus, the calculation of the estimated exchangeable Fe content after flooding was performed according to equation 2.
(Equation 2)
2.3. Statistical Analysis
The results of the cation fractions in the soil solution, in the ECEC and in the estimated ECEC, both after flooding, were subjected to analysis of variance using the F test and, when significant, were compared using the Duncan mean comparison test at p ≤ 0.05 (qualitative factor).
3. Results
3.1. pH, Mn, Fe, K, Ca and Mg in Soil Solution
The concentrations of Mn and Fe in the solution of the 21 soil samples are presented in Figure 2, before and after flooding. The Mn concentration increased in all soil samples with flooding. On average, it went from 0.03 mmol L-1 before to 1.12 mmol L-1 after flooding. Soil flooding promoted an increase in the Fe concentration in the soil solution, on average from 0.06 mmol L-1 before to 3.19 mmol L-1 after flooding.
The pH values after a 50-day flooding period increased in all samples on average, it went from 4.89 before to 6.71 after the flooding (Figure 2).
The data on the concentrations of K, Ca and Mg in the solution of the soil samples before and after flooding are presented (Figure 3).
The concentrations of Ca and Mg increased in all samples with flooding (Figure 3), on average going from 1.30 to 5.07 mmol L-1 and from 0.73 to 2.57 mmol L-1 after flooding, respectively.
3.2. Exchangeable Cation Contents, ECEC and CEC at pH 7.0
Exchangeable cation contents of the soil samples before flooding are presented (Figure 4). There was a wide range of variation in the contents among the soil samples. The K contents ranged from 0.12 to 0.54 cmolc kg-1, the Na contents from 0.00 to 1.18 cmolc kg-1, the Ca contents from 0.48 to 37.31 cmolc kg-1, the Mg contents from 0.10 to 15.53 cmolc kg-1, the Mn contents from 0.01 to 0.36 cmolc kg-1, the Al contents from 0.10 to 1.74 cmolc kg-1 and the H+Al contents from 2.01 to 8.42 cmolc kg-1.
There was a wide range of variation in the CEC values in the soil samples (Figure 4), both for the effective and for pH 7.0, which is necessary in studies such as this. The values of the ECEC ranged from 1.27 to 54.43 cmolc kg-1, while those of the CEC at pH 7.0 ranged from 2.93 to 56.54 cmolc kg-1. In both cases, the CEC was lower in soil 5 and higher in soil 21.
The values of exchangeable cations and ECEC of the 21 soil samples subjected to 50 days of flooding are shown (Figure 5). It should be noted that the exchangeable H content was not determined, since the pH of the soils after flooding was on average 6.7 (Figure 2). When the soil reaches pH values above 6.0, the exchangeable H is completely neutralized [9].
Flooding of the soil did not cause pronounced effects on the exchangeable K contents, which showed small variations both upwards and downwards in the samples, but the average of all soils after flooding remained the same as before flooding, 0.23 cmolc kg-1 (Figure 4 and Figure 5).
The exchangeable Na contents performed similarly to K, presenting small variations both upwards and downwards in the samples, and on average went from 0.45 cmolc kg-1 before (Figure 4) to 0.41 cmolc kg-1 after flooding (Figure 5), not being as affected by soil reduction. The Ca and Mg contents decreased in the exchangeable phase with the reduction of the soil due to flooding (Figure 5).
The Mn contents in the exchangeable phase increased in all samples with soil reduction. On average, they went from 0.11 cmolc kg-1 before flooding (Figure 4) to 1.17 cmolc kg-1 after 50 days of flooding (Figure 5). The exchangeable Fe content after flooding showed wide variation in the samples, ranging from 0.04 to 3.76 cmolc kg-1 (Figure 5).
The ECEC of soils after flooding is determined by the sum of the exchangeable contents of K, Na, Ca, Mg, Fe and Mn. The values found varied widely, from 1.34 to 54.25 cmolc kg-1 (Figure 5).
3.3. CEC and Fe2+ Estimates
The values of exchangeable Fe2+ and ECEC estimated in flooded soils were higher than the observed by the analytical method (Table 2). The ECEC values estimated after flooding, with an average of 18.41 cmolc kg-1, 1.97 cmolc kg-1 higher than the ECEC determined after flooding are presented (Table 2). The estimated exchangeable Fe values were, on average, 1.19 cmolc kg-1. The exchangeable Fe contents estimated were also higher than the contents estimated analytically.
4. Discussion
4.1. pH, Mn, Fe, K, Ca and Mg in Soil Solution
The increase in Mn concentration with soil flooding was also observed before [4], due to the reduction of Mn (IV) (manganic oxides) to Mn (II) (manganous oxides) and the consequent release into the soil solution [7]. Other authors also observed an increase in Fe concentrations due to soil flooding, with peak Fe concentration varying between soils [4]. The increase in the concentration of this cation in the soil solution is due to the reduction of Fe (III) (ferric oxides) to Fe (II) (ferrous oxides) and the consequent release into the soil solution [5] The increase in pH in flooded acidic soils is due to the reduction reactions of oxidized compounds in the soil, which always occur with the consumption of H+ ions [19]. The increase in pH promotes the increase of negative charges in the soil (pH-dependent charges), through the dissociation of organic and mineral functional groups. In the case of the soils under study, organic matter is the main contributor to these variable soil charges [19].
With soil flooding, the pH of acidic soils converges to values close to 7.0, except for soils with low Fe contents [4]. Such an example may be soil 5, which had a pH of 5.44, well below the average of 6.71, and was the only soil with a pH value after flooding lower than 6.0. The concentrations of both Mn and Fe in the soil solution are low in this soil (Figure 2), i.e., as there are few reduction products, soil reduction was probably low and H+ consumption was small, consequently the pH after flooding was well below that of other soils.
The optimum pH of the soil solution for rice plants is approximately 6.6 [20], since at this pH value the supply of most nutrients is adequate and the concentration of toxic substances is below the levels capable of causing toxicity. The soil solution samples in the present study maintained their pH after flooding close to this optimum value, with the exception of sample 5, which had a pH well below, as already mentioned. In general, K was less affected by flooding, with an average concentration of 0.20 mmol L-1 before and 0.24 mmol L-1 after flooding. Although the cations K, Ca and Mg are not directly involved in the oxidation-reduction reactions of flooded soils, their behavior are closely related to the behavior of Fe and Mn, being displaced from the exchange complex to the soil solution by these cations. Fe, Mn and Ca have similar selectivity for adsorption on the surface of clays [21], so when there is an increase in Fe or Mn in the solution, the exchange and displacement of Ca from the exchange site to the soil solution will occur concurrently [22].
4.2. Exchangeable Cation Contents, ECEC and CEC at pH 7.0
A study carried out with 16 samples of floodplain soils from Southern Brazil, K levels ranging from 0.08 to 0.48 cmolc kg-1, Ca levels from 0.60 to 20.80 cmolc kg-1, Mg levels from 0.60 to 9.30 cmolc kg-1 and Al levels from 0.00 to 2.60 cmolc kg-1 were observed [23]. In another study, with 57 soil samples from floodplains in southern Brazil [24], observed variations in K levels from 0.03 to 0.75 cmolc kg-1, Na levels from 0.02 to 1.32 cmolc kg-1, Ca levels from 0.00 to 20.40 cmolc kg-1, Mg levels from 0.00 to 8.33 cmolc kg-1 and H+Al levels from 1.19 to 16.93 cmolc kg-1. Comparing the results with data in the literature, it is observed that the levels obtained in this work are within the range cited in the literature, except in two soil samples (19 and 21), whose maximum values of Ca and Mg are above the limits observed by [23] and [24].
As the floodplain soils used in irrigated rice cultivation in Southern Brazil originate from a very wide variety of rocks and sediments associated with environmental factors, soils with very distinct chemical and physical characteristics were formed [25].
The lowest CEC values were observed in Planosol samples, while the highest were observed in Gleysols. Planosols generally have a sandy texture and low organic matter content, while Gleysols have a medium to clayey texture with high organic matter content, which gives them a high CEC [25]. Similar results [24], in which a range of 3.01 to 42.07 cmolc kg-1 of CEC at pH 7.0 in 57 soil samples from Southern Brazil, were found.
Exchangeable K and Na were not much affected by flooding (Figure 5) This result is consistent, since K and Na are not directly involved in oxidation-reduction reactions, and since there were no major changes in the concentrations in the soil solution (Figure 3), exchangeable K and Na were not affected.
The Ca and Mg cations are not directly involved in the soil reduction reactions, but there was a displacement of these elements to the soil solution, mainly by Fe [20], decreasing the values in the exchangeable phase (Figure 5).
The exchangeable Mn2+ content is low in most soils, but as flooding promotes an increase in the concentration of this cation in the soil solution (Figure 5), due to the reduction of Mn from manganic to manganous oxides [7], the adsorption of Mn2+ from the soil solution to the exchangeable phase begins to occur, considerably increasing its quantities.
In soil under aerobic conditions, Fe does not participate significantly in the exchange complex, due to its low solubility and small quantity in free form, but with soil reduction, Fe changes from valence 3+ to 2+, increasing its solubility and quantity (Figure 5). The Chemical reduction of Fe and the consequent increase of its concentration in the soil solution and in the exchangeable phase is considered the major change occurring in a flooded soil [4,20].
On average, the CEC was 16.44 cmolc kg-1, a value that was below expectations, since on average the ECEC of samples under rainfed conditions was 15.11 cmolc kg-1 and the average CEC at pH 7.0 was 18.85 cmolc kg-1 (Figure 4), with a difference of 3.74 cmolc kg-1. As the soil pH had an average value of 6.71 after the flooding period (Figure 2), being 1.82 higher than before the flooding and close to pH 7.0, a higher ECEC was expected after flooding, closer to the CEC pH 7.0. These results confirm that the analytical determination of CEC in flooded soils is inaccurate and support the idea that these values need to be corrected somehow.
4.3. CEC and Fe2+ Estimate
Considering that after flooding there are no significant concentrations of exchangeable Al3+ due to the increase in pH and that the concentrations of exchangeable K, Na, Ca and Mg do not change significantly, it is believed that there are no errors in the determination of these cations. Thus, it is expected that the differences may be related to the determination of Mn and Fe, which are the cations that increase greatly with soil reduction. Possibly, the difference between the measured and estimated CEC values are in these cations, that is, they must be underestimated despite the care taken to sample and analyze them, considering that in the reduced form these elements are not stable, since they oxidize easily in contact with oxygen. Since soils generally have higher amounts of Fe than Mn and because Fe is much less stable than Mn, most of the difference should be in the determination of Fe. Thus, we attempted to correct this possible underestimation of Fe and the consequent ECEC by estimating the ECEC after flooding, based on the ECEC and CEC at pH 7.0 determined in dry soil, and the pH variation before and after flooding, according to equations 1 and 2. The values of the ECEC estimated after flooding, with an average of 18.41 cmolc kg-1, 1.97 cmolc kg-1 higher than the ECEC determined after flooding are presented (Table 2). These values were closer to the CEC determined at pH 7.0, which was 18.85 cmolc kg-1 (Figure 4), which is expected since the pH of the solution after flooding was on average 6.7, close to the CEC value of 7.0.
The exchangeable Fe values estimated after flooding (Table 2) were higher than those determined, indicating a certain correction, since the determined values presented possible underestimation by the determination method, as discussed previously.
The cations Fe2+, Mn2+ and Ca2+ have similar selectivity coefficients, that is, there is no adsorption preference in the solid phase between these cations [21]. Thus, it is assumed that the molar fraction between these divalent cations in the soil solution is proportional to the percentage they occupy in the exchangeable phase. Therefore, if we compare the molar fractions of these between the soil solution and the fraction in the exchangeable phase, the values should be very similar.
The molar fractions of the cations in the soil solution and in the exchangeable phase are shown (Table 3). Comparing the fractions in the soil solution with the fractions in the CEC determined after flooding, the fractions are very similar for Mn and Mg, but there is a discrepancy between the fractions for Ca and Fe (Table 3). Taking the two methods of determining Fe (soil solution and exchange complex) as a basis, it is possible that in both cases the levels are underestimated. However, it is likely that this underestimation is much smaller in the determination of the solution, considering all the care that is taken at the time of collection to avoid contact of the sample with oxygen in the air. It is also worth mentioning that the quantity in the solution is much smaller than in the exchangeable phase. With this evaluation, it is clear that most of the error is in fact in the exchangeable Fe after flooding, since the fraction in the solution of Mn was very similar to the molar fraction in the exchange complex.
Now comparing the molar fractions in the solution with the fractions estimating the ECEC and exchangeable Fe (Table 3), an improvement in the results is noted, where the proportion of Mg, Fe and Mn are equal in the soil solution with the exchangeable phase, confirming the correction of the amounts of Fe underestimated by the determination.
In summary, there are three assumptions that contribute to demonstrating the effectiveness of the proposed method: i) Iron and manganese change their oxidation-reduction state with flooding. In the valence 2+, they are more soluble, and their concentrations in the soil solution and exchangeable phase increase. However, during the extraction process for CEC analysis during flooding, part of Fe2+ return to its oxidized form, which is less soluble and therefore precipitates. This does not happen for other cations. iii) Since there is a linear relationship between the effective CEC and the CEC at pH 7, this linear relationship allows the calculation of the CEC that soils present at any pH value, including the pH value of flooded soil. iii) Considering that there is no adsorption preference between the cations Ca2+, Fe2+, Mg2+ and Mn2+ [21], it is assumed that the mole fraction of these divalent cations in the soil solution is proportional to the percentage they occupy in the exchangeable phase. Therefore, if we compare the mole fractions of these cations between the soil solution and the fraction in the exchangeable phase, the values should be very similar. Particularly regarding iron, it is observed that there is no statistical difference between the mole fraction values of the soil solution and the proposed CEC estimation method, which indicates that the estimate of exchangeable iron was effective in correcting the error caused by the traditional CEC measurement method. This suggests that this is a reliable method and, so far, the best alternative to accurately measure iron content in the soil solution in flooded soils.
5. Conclusions
The ECEC estimatives after flooding through the equation and the exchangeable Fe2+ after flooding through the equation corrected the problem of subestimating the values of these variables by analytical methods, demonstrating its viability for use in flood prone soils.
Author Contributions
“Conceptualization, L.D.V and R.O.S.; methodology, R.O.S..; validation, R.C.D.W. and R.O.S..; formal analysis, R.C.D.W.; investigation, R.C.D.W.; resources, R.O.S..; data curation, R.B.R.; writing—original draft preparation, R.C.D.W.; writing—review and editing, A.C.O.; F.S.C.; L.D.V and R.O.S. ; supervision, R.O.S.; project administration, R.O.S.; funding acquisition, R.O.S.. All authors have read and agreed to the published version of the manuscript.”.
Funding
“This research was funded by the Brazilian Council for Research and Development (CNPq), grant number 2013”and fellowships to A.C.O.; the Coordination of Improvement of Superior Personel (CAPES), fellowship to R.C.D.W. and Rio Grande do Sul State Agency for Support to Research (FAPERGS).
Institutional Review Board Statement
“Not applicable”.
Informed Consent Statement
“Not applicable.”.
Data Availability Statement
The original data presented in the study are openly available in https://figshare.com/articles/dataset/Original_data_Study_Estimation_of_Effective_Cation_Exchange_Capacity_and_Exchangeable_Iron_in_Rice_Fields_After_Soil_Flooding/29949608.
Acknowledgments
The authors are thankful to the Universidade Federal de Pelotas.
Conflicts of Interest
“The authors declare no conflicts of interest.”.
Abbreviations
The following abbreviations are used in this manuscript:
| CEC | Cation Exchange Capacity |
| ECEC | Effective Cation Exchange Capacity |
References
- SOSBAI. (2022). Arroz Irrigado - Recomendações técnicas da pesquisa para o Sul do Brasil. In Sociedade Sul brasileira de arroz irrigado.
- Sousa, R. O. de, Carlos, F. S., Silva, L. S. da, Scivittaro, W. B., Ribeiro, P. L., & Lima, C. L. R. de. (2021). No-tillage for flooded rice in Brazilian subtropical paddy fields: history, challenges, advances and perspectives. Revista Brasileira de Ciência Do Solo, 45. [CrossRef]
- Freitas, A. S. de, Carlos, F. S., Martins, G. L., Monteiro, G. G. T. N., & Roesch, L. F. W. (2024). Bacterial Resilience and Community Shifts Under 11 Draining-Flooding Cycles in Rice Soils. Microbial Ecology, 87(1), 149. [CrossRef]
- Sousa, R. O. de; Bohnen, H.; Meurer, E. J. Composição da solução de um solo alagado conforme a profundidade e o tempo de alagamento, utilizando novo método de coleta. Revista Brasileira de Ciência do Solo, [S.L.], v. 26, n. 2, p. 343-348, jun. 2002. FapUNIFESP (SciELO). [CrossRef]
- Carmona, F. de C., Adamski, J. M., Wairich, A., Carvalho, J. B., Lima, G. G., Anghinoni, I., Jaeger, I. R., Silva, P. R. F., Terra, T. de F., Fett, J. P., & Carlos, F. S. (2021). Tolerance mechanisms and irrigation management to reduce iron stress in irrigated rice. Plant and Soil, 469(1–2), 173–191. [CrossRef]
- Suriyagoda, L. D. B., Sirisena, D. N., Somaweera, K. A. T. N., Dissanayake, A., De Costa, W. A. J. M., & Lambers, H. (2017). Incorporation of dolomite reduces iron toxicity, enhances growth and yield, and improves phosphorus and potassium nutrition in lowland rice (Oryza sativa L). Plant and Soil, 410(1–2), 299–312. [CrossRef]
- Sparrow, L. A., Uren, N. C. (2014). Manganese oxidation and reduction in soils: effects of temperature, water potential, pH and their interactions. Soil Research, 52(5), 483–494. [CrossRef]
- Nel, T., Bruneel, Y., & Smolders, E. (2023). Comparison of five methods to determine the cation exchange capacity of soil. Journal of Plant Nutrition and Soil Science, 186(3), 311–320. [CrossRef]
- Martins, A. P., Denardin, L. G. de O., Tiecher, T., Borin, J. B. M., Schaidhauer, W., Anghinoni, I., Carvalho, P. C. de F., & Kumar, S. (2020). Nine-year impact of grazing management on soil acidity and aluminum speciation and fractionation in a long-term no-till integrated crop-livestock system in the subtropics. Geoderma, 359, 113986. [CrossRef]
- Barrow, N. J., & Hartemink, A. E. (2023). The effects of pH on nutrient availability depend on both soils and plants. Plant and Soil, 487(1–2), 21–37. [CrossRef]
- Borin, J. B. M., Carmona, F. de C., Anghinoni, I., Martins, A. P., Jaeger, I. R., Marcolin, E., Hernandes, G. C., & Camargo, E. S. (2016). Soil solution chemical attributes, rice response and water use efficiency under different flood irrigation management methods. Agricultural Water Management, 176, 9–17. [CrossRef]
- Carlos, F. S., Denardin, L. G. de O., Martins, A. P., Anghinoni, I., Carvalho, P. C. F., Rossi, I., Buchain, M. P., Cereza, T., Carmona, F. C., & Camargo, F. A. de O. C. (2020). Integrated crop–livestock systems in lowlands increase the availability of nutrients to irrigated rice. Land Degradation & Development, 31(18), 2962–2972. [CrossRef]
- Holzschuh, M. J., Carlos, F. S., Carmona, F. C., Bohnen, H., & Anghinoni, I. (2014). Iron oxidation on the surface of adventitious roots and its relation to aerenchyma formation in rice genotypes | Oxidação do Fe na superfície de raízes adventícias e sua relação com a formação de aerênquima em genótipos de arroz. Revista Brasileira de Ciencia Do Solo, 38(1). [CrossRef]
- Schmidt, F., Fortes, M. de Á., Wesz, J., Buss, G. L., & Sousa, R. O. de. (2013). The impact of water management on iron toxicity in flooded rice. Revista Brasileira de Ciência Do Solo, 37(5), 1226–1235. https://doi.org/. [CrossRef]
- Sahrawat, K.L. (2004) Iron Toxicity in Wetland Rice and the Role of Other Nutrients. Journal of Plant Nutrition, 27, 1471-1504. [CrossRef]
- Ullah, H., Ahmed, S. F., Santiago-Arenas, R., Himanshu, S. K., Mansour, E., Cha-um, S., & Datta, A. (2023). Tolerance mechanism and management concepts of iron toxicity in rice: A critical review. Advances in Agronomy, 177, 215–257. [CrossRef]
- IUSS Working Group WRB. (2022). World reference base for soil resources. International soil classification system for naming soils and creating legends for soil maps ( 4th ed.). International Union of Soil Sciences (IUSS). https://www3.ls.tum.de/boku/?id=1419.
- Tedesco, M., Gianello, C., Bissani, C., Bohnen, H., & Volkwiess, S. (1995). Análises de solo, plantas e outros materiais (2nd ed.).
- Ding, C., Du, S., Ma, Y., Li, X., Zhang, T., & Wang, X. (2019). Changes in the pH of paddy soils after flooding and drainage: Modeling and validation. Geoderma, 337, 511–513. [CrossRef]
- Ponnamperuma, F. N. (1972). The Chemistry of Submerged Soils. Advances in Agronomy, 24(C), 29–96. [CrossRef]
- Saeki, K.; Wada, S.; Shibata, M. Ca2+-Fe2+ and Ca2+-Mn2+ exchange selectivity of kaolinite, montmorillonite, and ilite. Soil Science 169(2):p 125-132, February 2004. [CrossRef]
- Orucoglu, E., Grangeon, S., Gloter, A., Robinet, J. C., Madé, B., & Tournassat, C. (2022). Competitive Adsorption Processes at Clay Mineral Surfaces: A Coupled Experimental and Modeling Approach. ACS Earth and Space Chemistry, 6(1), 144–159. [CrossRef]
- Silva, L. S., Ranno, S, K., Rhoden, A. C., Santos, D. R., Graupe, F. A. Avaliação de métodos para estimativa da disponibilidade de fósforo para arroz em solos de Várzea do Rio Grande do Sul. Revista Brasileira de Ciência do Solo, v. 32, p. 207-216, 2008. [CrossRef]
- REIS, Cecília Estima Sacramento dos. Caracterização química e disponibilidade de enxofre em solos de várzea do Rio Grande do Sul. Orientador: Rogério Oliveira de Sousa. Dissertação (Mestrado em Agronomia) - Faculdade de Agronomia Eliseu Maciel, Pelotas-RS, 2008. p. 88.
- Streck, E. V., Kampf, N., Dalmolin, R. S. D., Klamt, E., Nascimento, P. C. do, Schneider, P., Giasson, E., Pinto, L. F. S. (2008). Solos do Rio Grande do Sul (2nd ed.).
Figure 2.
pH values, Mn and Fe concentrations in the soil solution of 21 soil samples from rice fields in Southern Brazil, before and after 50 days of flooding.
Figure 2.
pH values, Mn and Fe concentrations in the soil solution of 21 soil samples from rice fields in Southern Brazil, before and after 50 days of flooding.
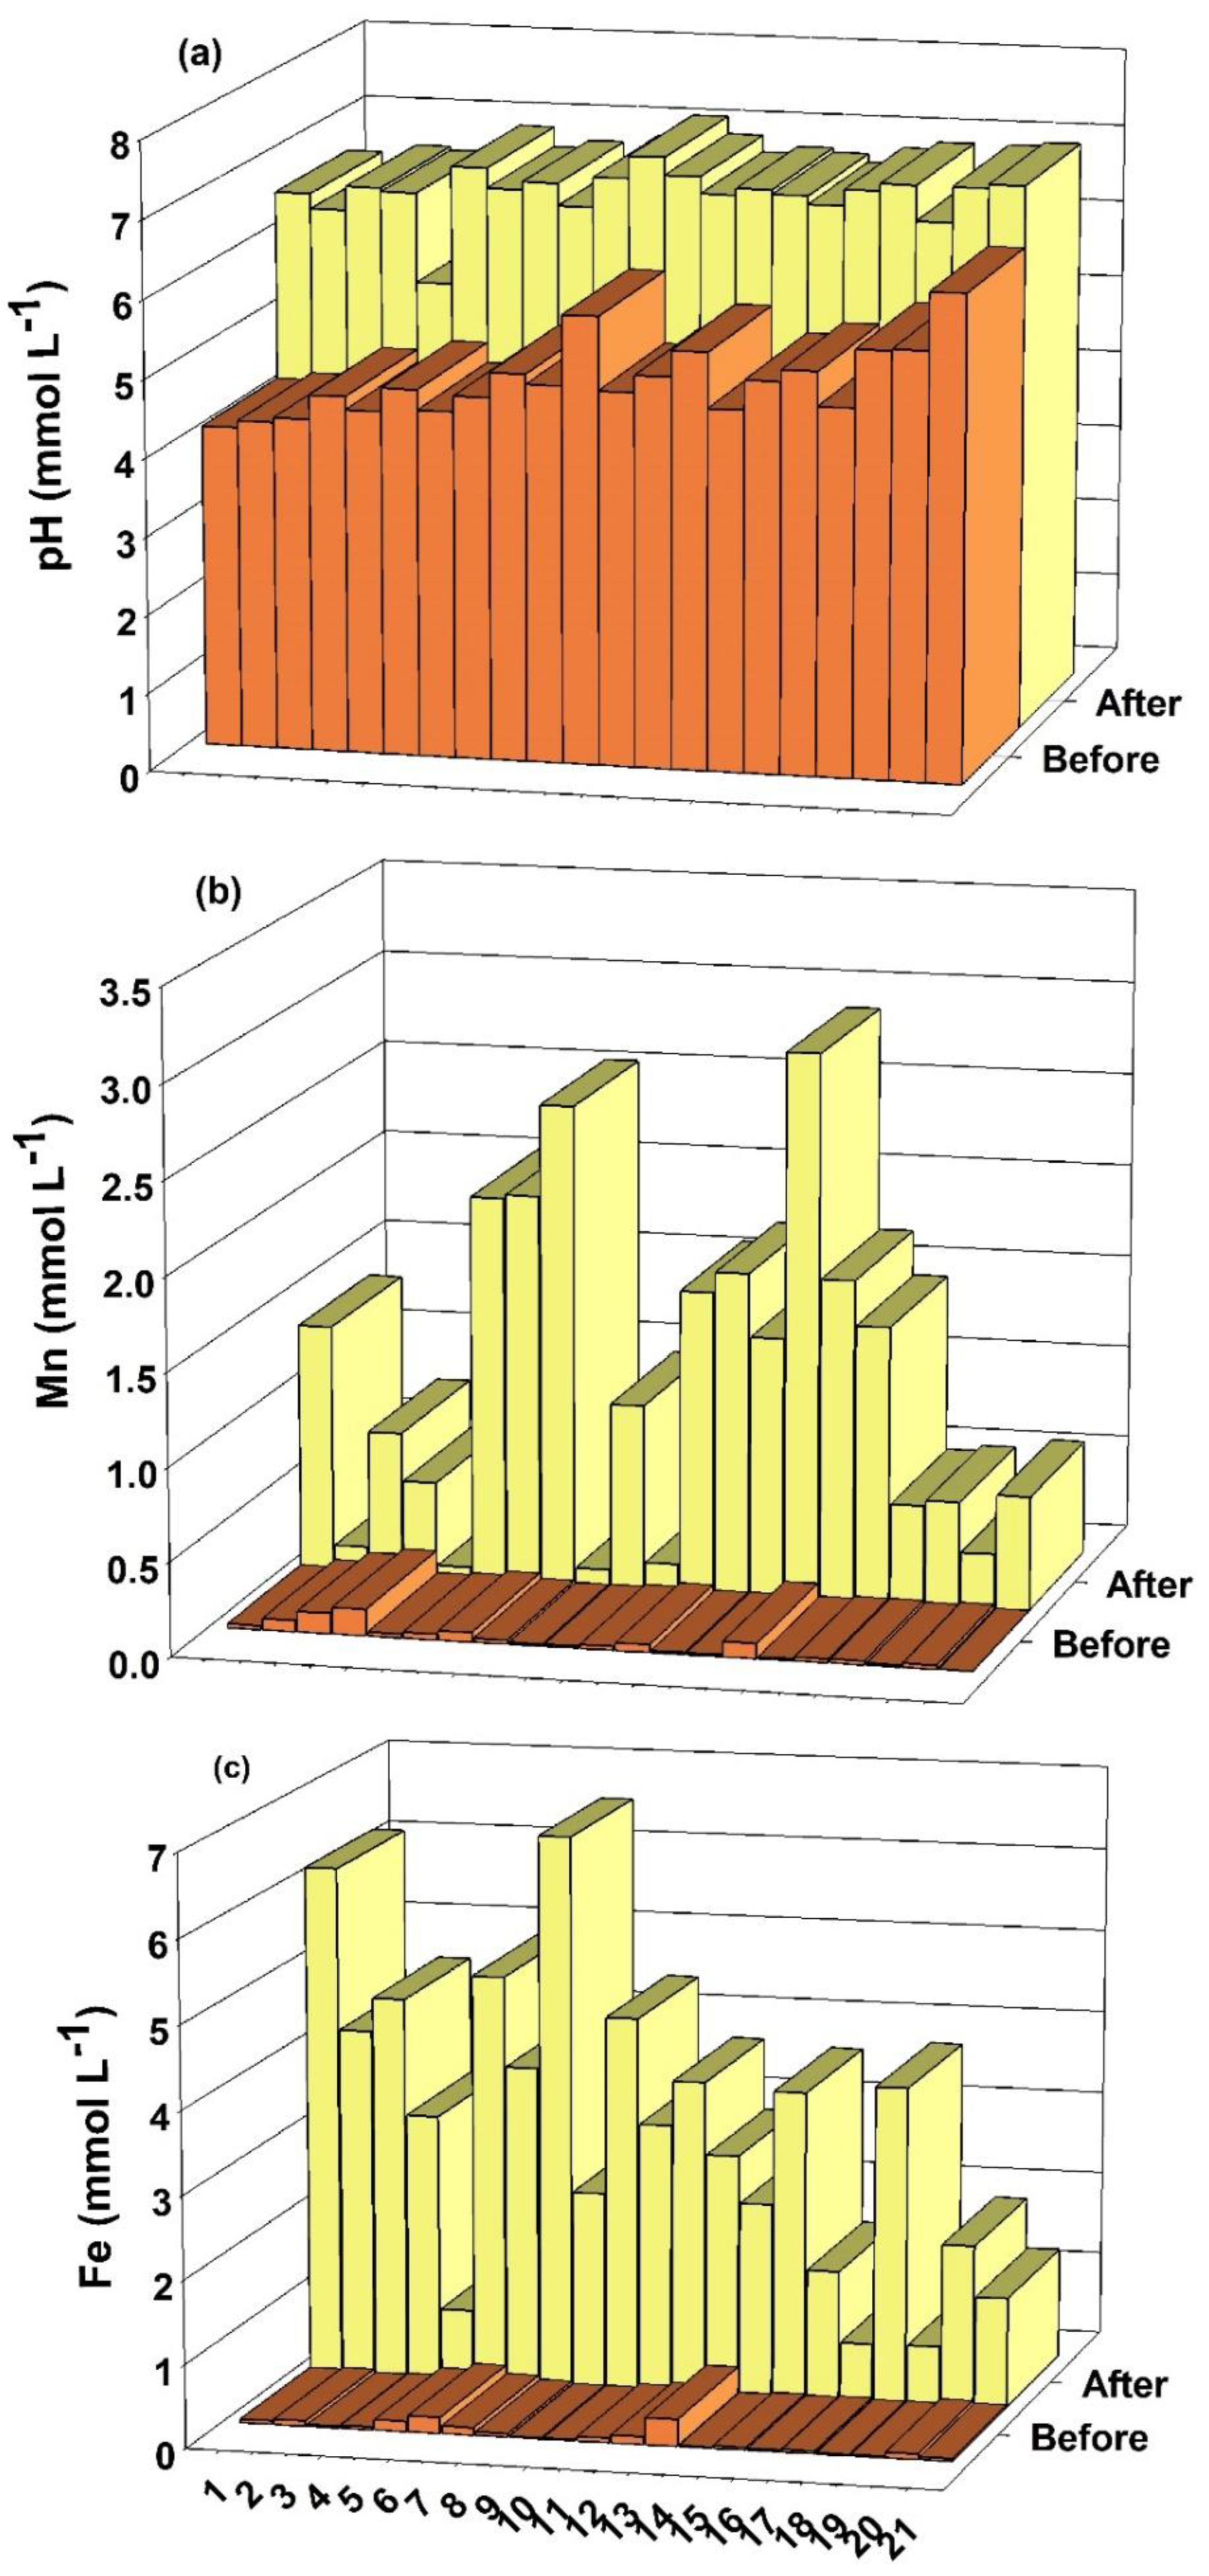
Figure 3.
Concentrations of K, Ca and Mg in the soil solution of 21 soil samples from rice fields in Southern Brazil, before and after 50 days of flooding.
Figure 3.
Concentrations of K, Ca and Mg in the soil solution of 21 soil samples from rice fields in Southern Brazil, before and after 50 days of flooding.
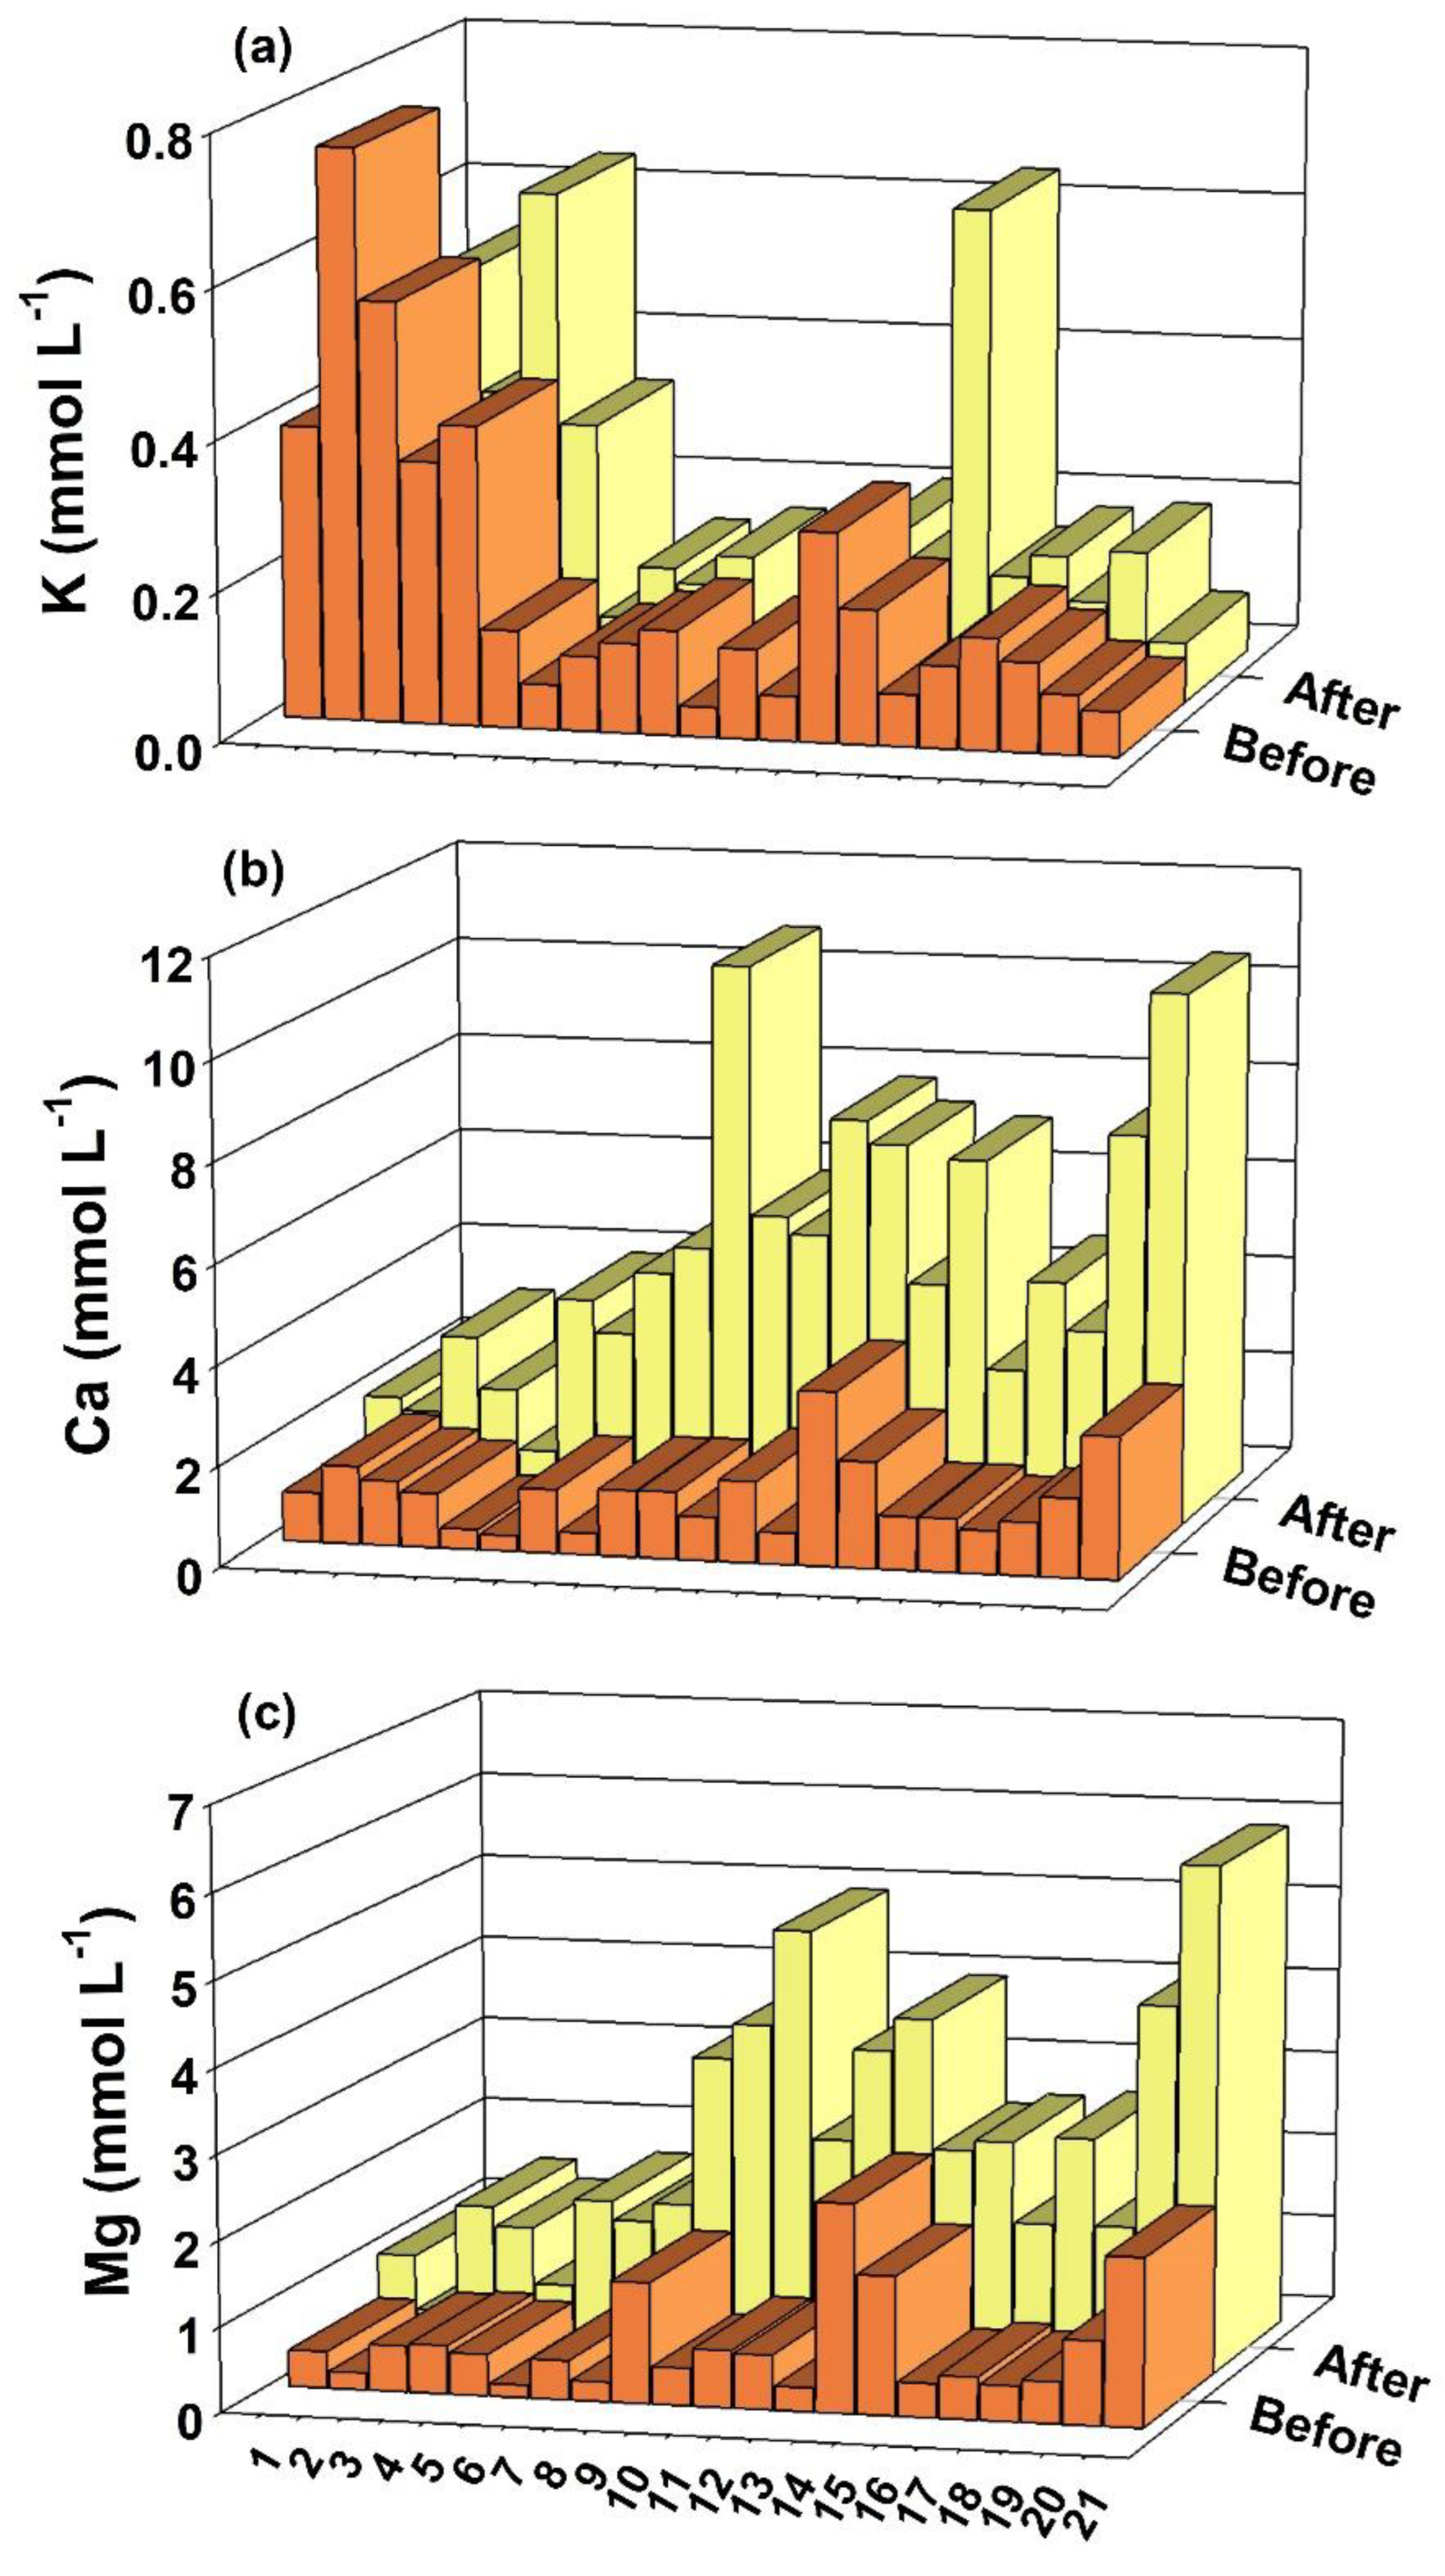
Figure 4.
Exchangeable cation contents, effective cation exchange capacity and pH 7.0 of 21 soil samples from rice fields in Southern Brazil, before flooding.
Figure 4.
Exchangeable cation contents, effective cation exchange capacity and pH 7.0 of 21 soil samples from rice fields in Southern Brazil, before flooding.
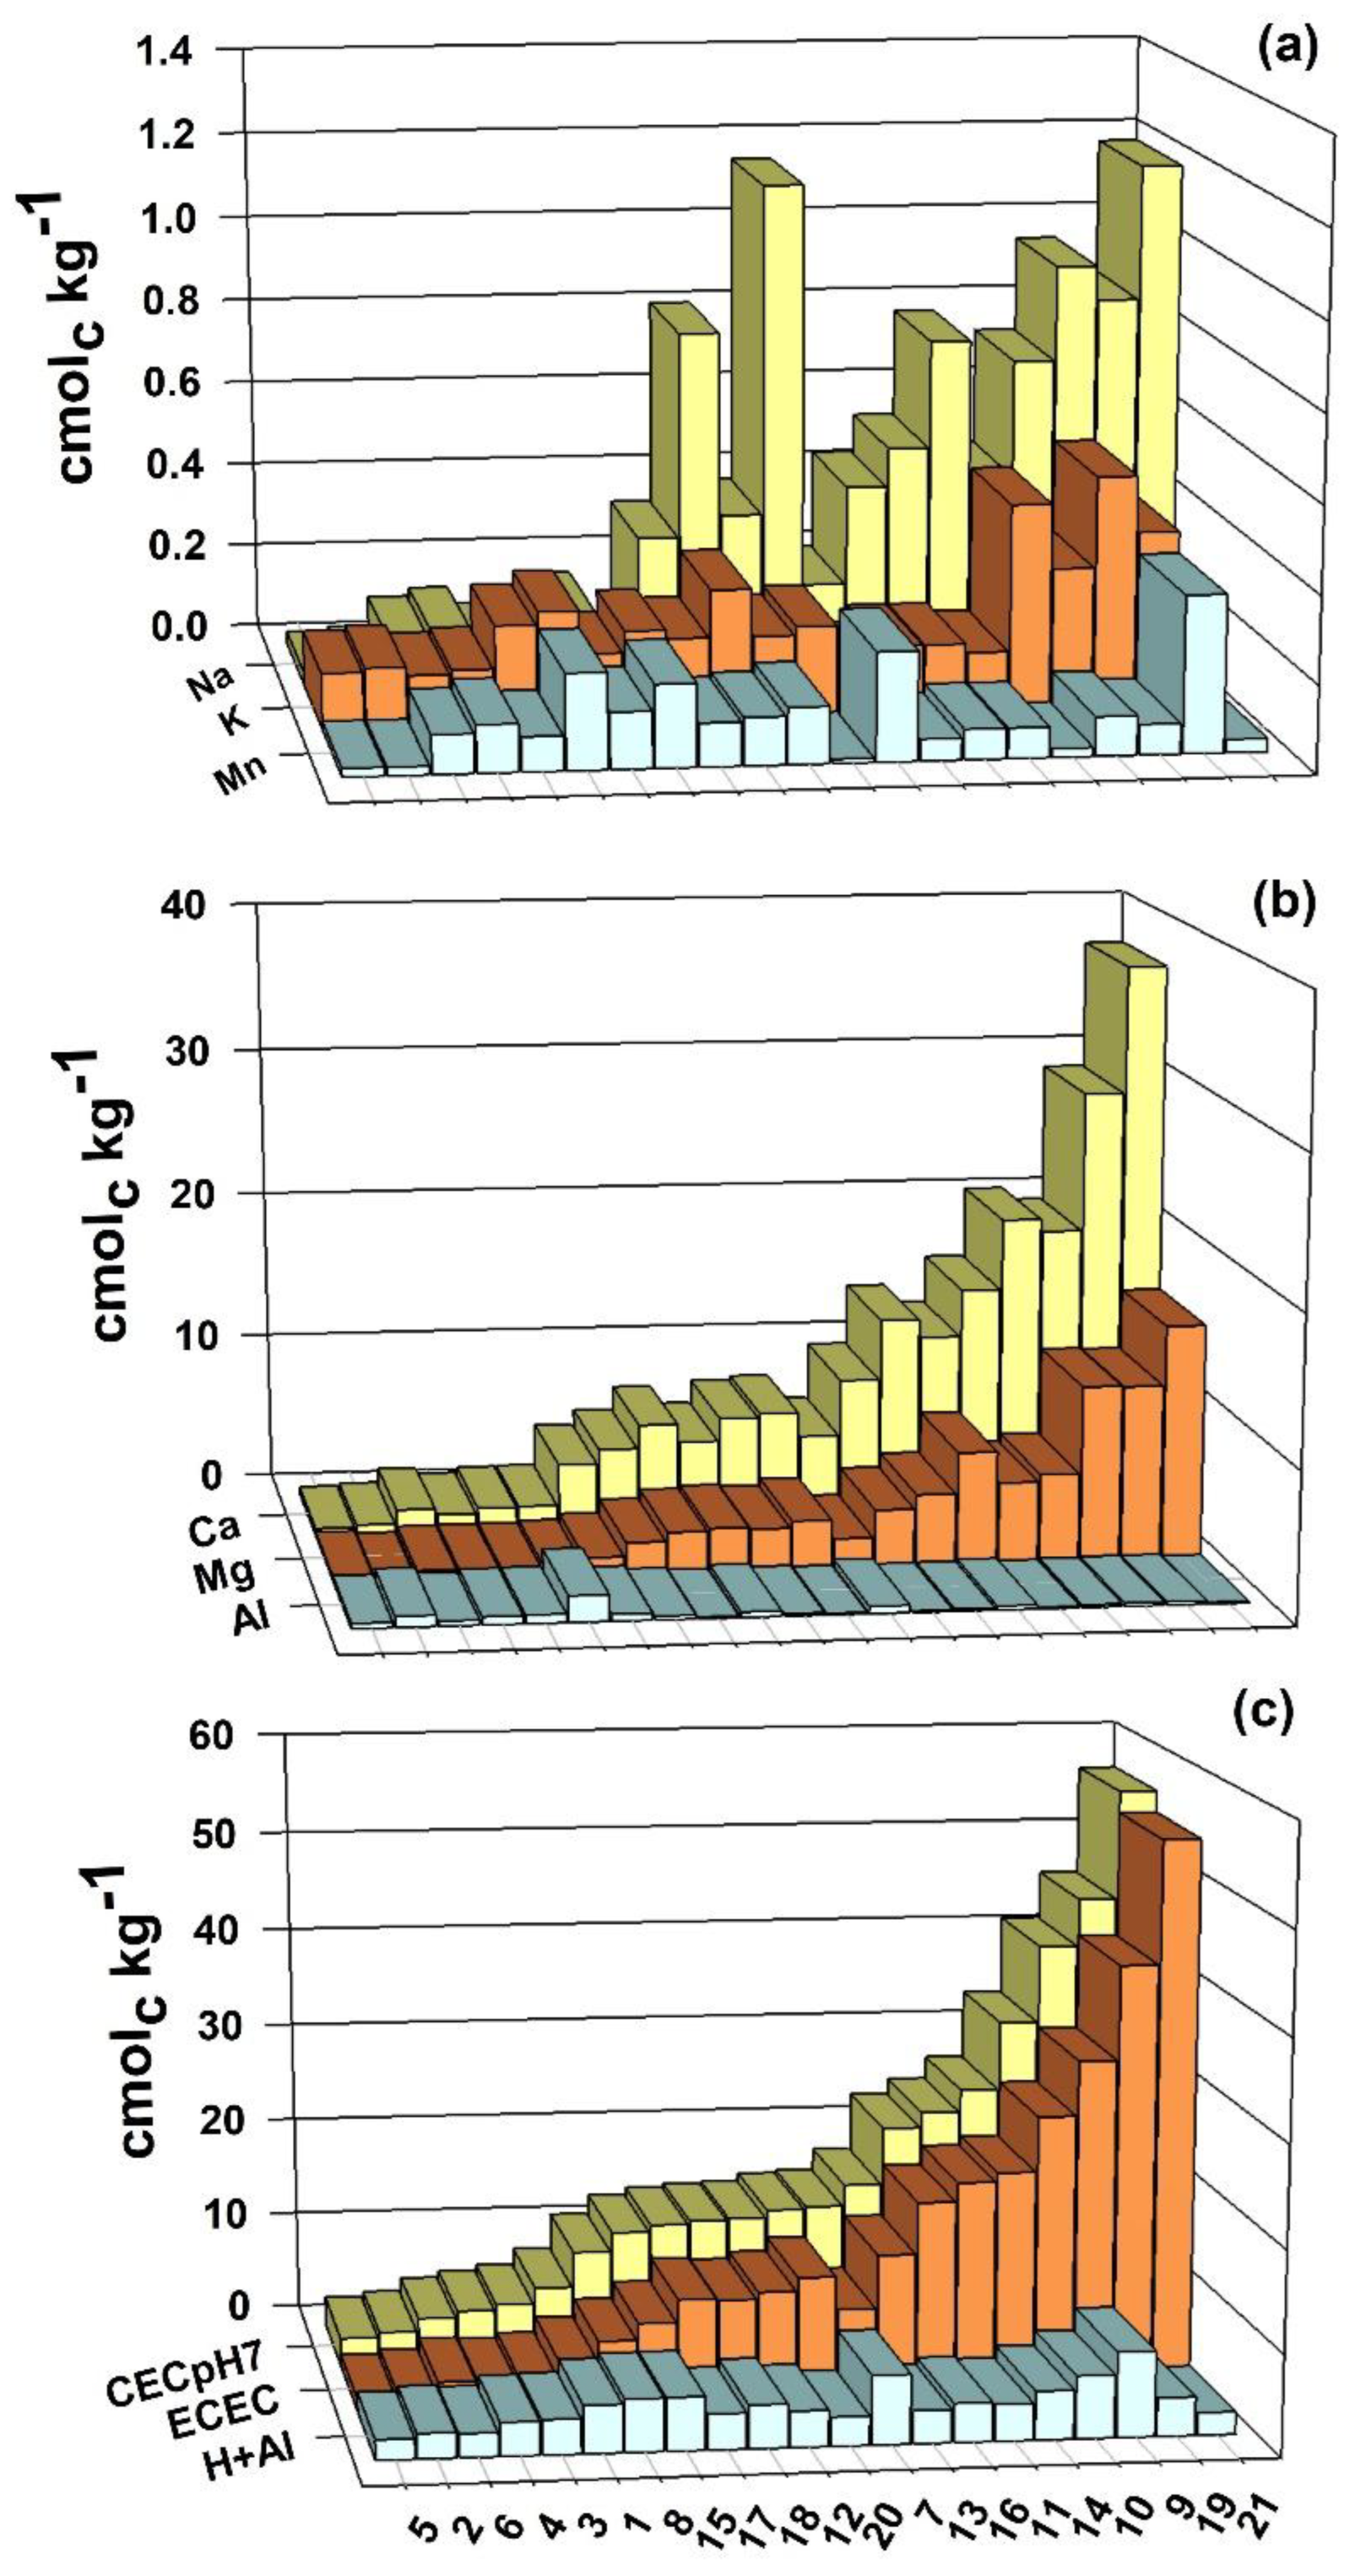
Figure 5.
Exchangeable cation contents and ECEC of 21 soil samples from rice fields in Southern Brazil, after 50 days of flooding, in the laboratory.
Figure 5.
Exchangeable cation contents and ECEC of 21 soil samples from rice fields in Southern Brazil, after 50 days of flooding, in the laboratory.
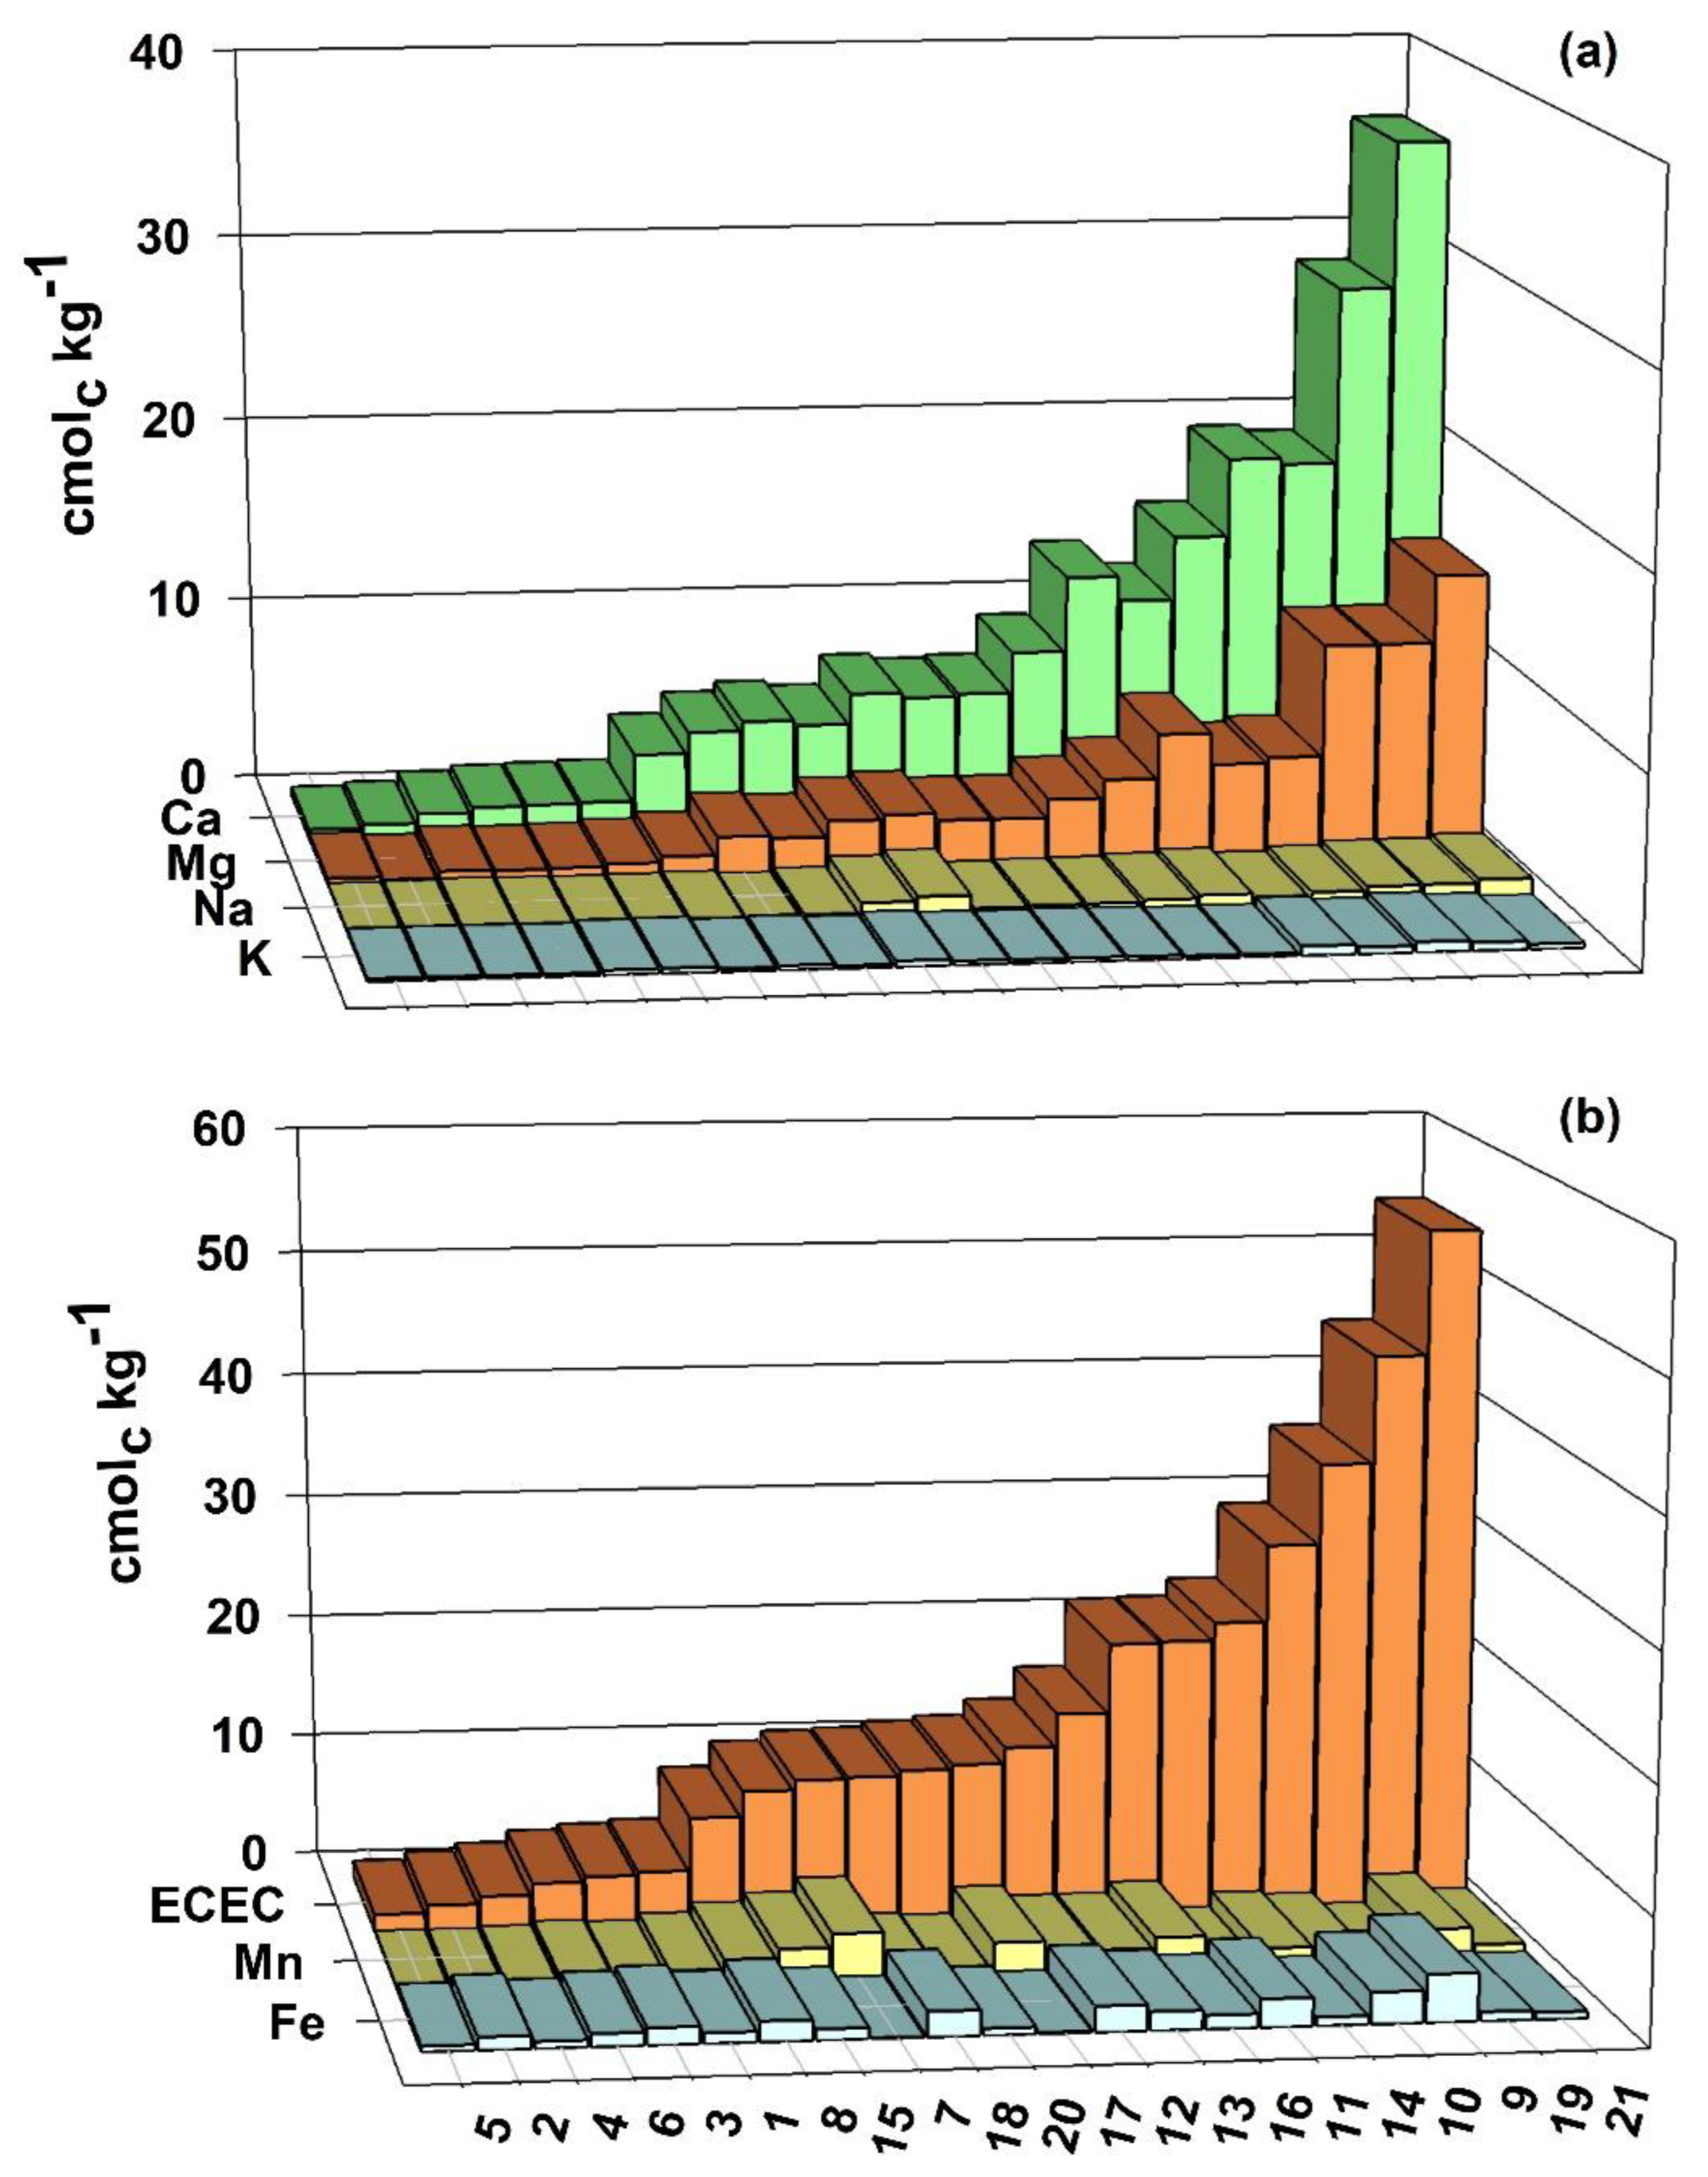

Table 1.
Samples of 21 soils from rice fields in southern Brazil used in the experiment and their respective municipalities collected, classified by World Reference Base for Soil Resources (WRB) [17], CEC at pH 7.0 and organic carbon content.
Table 1.
Samples of 21 soils from rice fields in southern Brazil used in the experiment and their respective municipalities collected, classified by World Reference Base for Soil Resources (WRB) [17], CEC at pH 7.0 and organic carbon content.
| ID No. | County | Classification (WRB) | Organic C (g kg-1) |
CECpH7 (cmolc kg-1) |
| 1 | Cachoeira do Sul | Umbric Planosols (Arenic) | 9.2 | 7.59 |
| 2 | Dom Pedrito | Umbric Planosols (Arenic) | 8.2 | 3.44 |
| 3 | Camaquã | Gleyic Planosols (Sodic) | 11.4 | 5.98 |
| 4 | Pelotas | Gleyic Planosols (Sodic) | 12.9 | 5.42 |
| 5 | Palmares do Sul | Umbric Planosols (Arenic) | 7.7 | 2.93 |
| 6 | Itaqui | Pisoplinthic Plinthosol (Eutric) | 10.9 | 4.77 |
| 7 | Itaqui | Haplic Plinthosol (Abruptic) | 20.0 | 15.24 |
| 8 | Itaqui | Haplic Plinthosol (Abruptic) | 19.5 | 11.15 |
| 9 | Osório | Mollic Gleysol (Clayic) | 24.5 | 41.23 |
| 10 | Alegrete | Vertic Phaeozems (Clayic) | 17.3 | 33.62 |
| 11 | Osório | Umbric Gleysol (Clayic) | 18.2 | 24.63 |
| 12 | Uruguaiana | Vertic Phaeozems (Clayic) | 46.8 | 14.26 |
| 13 | Uruguaiana | Vertic Phaeozems (Clayic) | 19.2 | 17.37 |
| 14 | Quaraí | Eutric Leptosol (Humic) | 18.8 | 26.84 |
| 15 | Uruguaiana | Eutric Leptosol (Humic) | 11.8 | 13.07 |
| 16 | Uruguaiana | Pellic Vertisol (Mollic) | 18.2 | 23.10 |
| 17 | Itaqui | Vertic Phaeozems (Clayic) | 11.5 | 13.75 |
| 18 | Aceguá | Umbric Gleysol (Clayic) | 26.4 | 14.08 |
| 19 | São Borja | Umbric Gleysol (Clayic) | 39.1 | 45.87 |
| 20 | Palmares do Sul | Mollic Gleysol (Clayic) | 32.3 | 14.98 |
| 21 | Santo Antônio das Missões | Mollic Gleysol (Clayic) | 29.4 | 56.54 |
Table 2.
Estimated and analyzed ECEC and exchangeable Fe content of 21 soil samples from rice fields in southern Brazil, after 50 days of flooding, in the laboratory.
Table 2.
Estimated and analyzed ECEC and exchangeable Fe content of 21 soil samples from rice fields in southern Brazil, after 50 days of flooding, in the laboratory.
| ID No | ECECanalysed | ECEC estimated | Fe2+analysed | Fe2+ estimated |
| --------------------------- cmolc kg-1 ------------------------------- | ||||
| 1 | 4.25 | 7.12 | 0.81 | 3.68 |
| 2 | 1.97 | 3.03 | 1.00 | 2.06 |
| 3 | 3.98 | 5.61 | 1.33 | 2.96 |
| 4 | 2.59 | 4.96 | 0.53 | 2.90 |
| 5 | 1.34 | 1.93 | 0.43 | 1.02 |
| 6 | 3.54 | 4.75 | 1.00 | 2.21 |
| 7 | 11.39 | 14.49 | 0.04 | 3.14 |
| 8 | 8.55 | 10.76 | 1.58 | 3.79 |
| 9 | 35.88 | 39.26 | 3.76 | 7.14 |
| 10 | 29.52 | 33.34 | 2.49 | 6.31 |
| 11 | 21.94 | 25.14 | 2.19 | 5.39 |
| 12 | 13.64 | 14.21 | 2.02 | 2.59 |
| 13 | 16.27 | 16.96 | 1.46 | 2.15 |
| 14 | 23.37 | 26.36 | 0.65 | 3.64 |
| 15 | 10.61 | 12.57 | 0.86 | 2.82 |
| 16 | 21.83 | 22.46 | 1.06 | 1.69 |
| 17 | 12.36 | 13.52 | 0.10 | 1.26 |
| 18 | 11.54 | 14.01 | 1.98 | 4.45 |
| 19 | 44.41 | 44.70 | 0.70 | 0.99 |
| 20 | 11.98 | 14.91 | 0.54 | 3.47 |
| 21 | 54.25 | 56.57 | 0.52 | 2.84 |
Table 3.
Molar fractions of cations in the soil solution, in the exchangeable phase and estimating the CEC, on average from 21 soil samples from rice fields in southern Brazil, after a 50-day flooding period.
Table 3.
Molar fractions of cations in the soil solution, in the exchangeable phase and estimating the CEC, on average from 21 soil samples from rice fields in southern Brazil, after a 50-day flooding period.
| Cations | Relative ratios | ||
|---|---|---|---|
| Soil solution | ECEC | Estimated ECEC | |
| K | 0.02A | 0.03A | 0.02A |
| Na | 0.15A | 0.03B | 0.02B |
| Ca | 0.34C | 0.51A | 0.43B |
| Mg | 0.17A | 0.20A | 0.17A |
| Fe | 0.24A | 0.14B | 0.28A |
| Mn | 0.08A | 0.10A | 0.08A |
* Means followed by distinct capital letters in the rows differ statistically by Duncan's test at p ≤ 0.05.
Disclaimer/Publisher’s Note: The statements, opinions and data contained in all publications are solely those of the individual author(s) and contributor(s) and not of MDPI and/or the editor(s). MDPI and/or the editor(s) disclaim responsibility for any injury to people or property resulting from any ideas, methods, instructions or products referred to in the content. |
© 2025 by the authors. Licensee MDPI, Basel, Switzerland. This article is an open access article distributed under the terms and conditions of the Creative Commons Attribution (CC BY) license (http://creativecommons.org/licenses/by/4.0/).
Copyright: This open access article is published under a Creative Commons CC BY 4.0 license, which permit the free download, distribution, and reuse, provided that the author and preprint are cited in any reuse.


