Submitted:
15 April 2025
Posted:
17 April 2025
You are already at the latest version
Abstract
Exosomes are extracellular vesicles of 30-150 nm that play crucial roles in intercellular communication and hold significant potential as biomarkers for non-invasive liquid biopsy. However, current isolation methods face limitations including time-consumption, low yield, and high cost. This study presents a novel automated exosome isolation method using EGCG-modified magnetic beads (EGCG@T) optimized for diverse biofluids including plasma, serum, urine, and saliva. We systematically investigated optimal conditions for EGCG:T-Fe₃O₄ ratio (0.1:1), binding time, elution parameters, and extraction buffer composition for each biofluid type. The developed protocol was successfully integrated into an automated workflow using the Nextractor® NX-Junior platform, combining exosome isolation and protein extraction into a single step. Western blot and ELISA analyses confirmed that the EGCG@T method yielded significantly higher recovery of exosomal markers (CD9, CD63, CD81, TSG101, ALIX) compared to conventional PEG precipitation, with biofluid-dependent efficiency. Notably, CD63-positive exosomes were isolated with approximately two-fold higher efficiency from urine and 1.3-fold higher from saliva using the EGCG@T method. Our findings demonstrate biofluid-specific optimization is essential for effective exosome isolation, as exosome subpopulations exhibit distinct physicochemical properties across different sample types. This automated, rapid, and efficient exosome isolation method provides a valuable platform for future clinical applications in non-invasive disease diagnosis and monitoring through liquid biopsy.
Keywords:
exosome isolation
; EGEC@T complex
; automated platform
; diverse biofluids
1. Introduction
Exosomes are extracellular vesicles of 30-150 nm in size, derived from intracellular multivesicular bodies and secreted by all cells, existing in body fluids [1,2]. They contain various biomolecules including proteins, lipids, and nucleic acids (mRNA, miRNA), and specifically express membrane proteins of the tetraspanin family (CD9, CD63, CD81, etc.) [3,4]. These biological characteristics of exosomes play important roles not only in normal physiological processes but also in the development and progression of diseases.
Exosomes are present in various body fluids such as blood, urine, and saliva, and their composition and quantity change in several diseases including cancer, neurodegenerative disorders, and cardiovascular diseases [5,6]. Therefore, exosomes hold great potential as non-invasive diagnostic biomarkers through liquid biopsy [7]. Additionally, exosomes are gaining attention as potential drug delivery vehicles due to their excellent biocompatibility and high cell membrane permeability [8]. Recently, research on therapeutic applications of stem cell-derived exosomes has also been actively conducted [9,10].
However, the development of efficient isolation and concentration techniques must precede the clinical utilization of exosomes. The currently most widely used ultracentrifugation method has limitations such as being time-consuming, requiring expensive equipment, and yielding low recovery rates [11,12]. Size exclusion chromatography and immunoaffinity-based methods also have disadvantages including limited throughput or high costs [13]. Therefore, for application as markers for early diagnosis, the development of rapid, economical, and efficient exosome concentration techniques from large sample volumes is required.
Recently, the polyphenolic compound EGCG ((−)-epigallocatechin-3-gallate) has gained attention as a new approach for exosome isolation [14]. EGCG, a major component of green tea containing catechol and gallol functional groups, is known to strongly interact with biomolecules [15]. In particular, it has the characteristic of aggregating exosomes by binding to phospholipids in the exosome membrane, and is being evaluated as a novel approach that can overcome the limitations of conventional ultracentrifugation or immunoaffinity methods [16,17,18]. Additionally, the EGCG-based isolation method is simple, economical, and capable of isolating exosomes with high yield, making it promising for clinical diagnostic applications [19].
In this study, we developed a composite material by combining EGCG with magnetic particles for application in automated systems [20]. Using this approach, we present a novel automated extraction method that can efficiently and rapidly isolate and concentrate exosomes from various biofluids including plasma, serum, urine, and saliva. Furthermore, we established an automated extraction method that integrates the typically two-step process of exosome isolation followed by protein extraction into a single step, enabling the entire process from exosome isolation to protein extraction directly from samples. Finally, along with the characterization of the isolated exosomes, we evaluated their potential as biomarkers for cancer diagnosis [21].
2. Materials and Methods
2.1. Synthesis and Characterization of EGCG-Modified Magnetic Beads (EGCG@T)
Magnetic beads (T-Fe₃O₄) were functionalized with epigallocatechin gallate (EGCG) by incubating various concentrations of EGCG (0.1X, 1X, 10X) with the beads under stirring for 2 hours at room temperature. The resulting EGCG@T complexes were washed with deionized water and lyophilized for further use.
To evaluate surface morphology, scanning electron microscopy (SEM; EM-30AX, Coxem, Korea) was performed at ×10,000 magnification after gold coating (Ion Coater; SPT-20, Coxem, Korea). Elemental composition (Fe, C, O) was analyzed using energy-dispersive X-ray spectroscopy (EDS; SCU, Bruker, USA). Fourier-transform infrared spectroscopy (FT-IR; Vertex 70, Bruker, Germany) was conducted over the 4000–500 cm⁻¹ range using KBr pelletized samples to identify EGCG-related functional groups. Optical absorbance profiles were obtained via UV–Vis spectroscopy (UV-2600, Shimadzu, Japan) from 200 to 900 nm to confirm EGCG conjugation. Zeta potential and hydrodynamic diameter were measured using a Zetasizer Ultra (ZSU3305, Malvern Instruments, UK) to assess colloidal stability and particle size distribution
2.2. Preparation of Magnetic Bead+EGCG
EGCG (TCI, E0694)-modified magnetic beads were synthesized through a two-step process. Initially, EGCG (500 mg) was dissolved in 500 mL of deionized water (DW) and sonicated for 10 minutes to ensure complete dispersion. Subsequently, T-Fe₃O₄ magnetic nanoparticles (500 mg) were added to the EGCG solution and further sonicated for 10 minutes to achieve uniform dispersion. The mixture was continuously stirred at room temperature at 1,500 rpm for 1 hour to facilitate the surface modification of magnetic nanoparticles by EGCG. After the reaction, the EGCG-modified magnetic beads were separated using a magnetic field and centrifuged at 5,000 rpm for 5 minutes. The supernatant was carefully removed while maintaining the magnetic field. The precipitated beads were washed three times with 400 mL of DW to remove unbound EGCG. Each washing step consisted of sonication for 10 minutes followed by magnetic separation and centrifugation at 5,000 rpm for 5 minutes. Finally, the purified EGCG@T core beads were thinly spread on a tray and dried in a vacuum oven at 60°C until completely dry. The synthesized magnetic beads and EGCG complex were analyzed using Scanning Electron Microscope (SEM), Energy-dispersive X-ray spectroscopy (EDS), Zetasizer, Fourier transform infrared spectroscopy (FT-IR), and Thermogravimetry Differential Thermal Analysis (TG-DTA).
2.3. Optimization of Magnetic Bead+EGCG Complex Concentration
Various EGCG:T-Fe₃O₄ weight ratios were investigated to determine the optimal composition of EGCG-modified magnetic beads. The synthesis was performed using the same protocol described above but with adjusted relative concentrations of EGCG and T-Fe₃O₄ magnetic nanoparticles. Three different weight ratios (10:1, 0.1:1, 1:1) were evaluated. For the 10:1 ratio, 1 mg of EGCG and 0.1 mg of T-Fe₃O₄ were used. The 0.1:1 ratio utilized 0.1 mg of EGCG and 1 mg of T-Fe₃O₄, while the 1:1 ratio employed equal amounts of EGCG and T-Fe₃O₄ (1 mg each). All other synthesis conditions remained consistent across the different ratio preparation processes.
The optimal concentration of EGCG-modified magnetic beads for exosome isolation was investigated using urine samples. Three different magnetic bead concentrations were evaluated: 0.1X (1 mg EGCG and 0.1 mg T-Fe₃O₄), 1X (1 mg each of EGCG and T-Fe₃O₄), and 10X (0.1 mg EGCG and 1 mg T-Fe₃O₄). During the isolation process, urine samples were mixed with magnetic beads of different concentrations under identical conditions (room temperature incubation, constant rotation speed, fixed incubation time). The only variable was the concentration ratio of the magnetic beads. Comparative analysis of exosome isolation efficiency among the three different bead concentrations revealed that the 10X ratio (0.1 mg EGCG: 1 mg T-Fe₃O₄) yielded optimal exosome capture efficiency.
2.4. Optimization of Exosome Isolation and Protein Extraction Using EGCG+Bead
Various experimental parameters were evaluated to determine the optimal conditions for exosome isolation using EGCG-modified magnetic beads (EGCG@T). First, bead concentrations of 2 mg and 12 mg were compared. For urine samples, a bead concentration of 12 mg/ml (1.2 ml) was applied at a ratio of 1.2:1 relative to the sample volume.
To optimize bead binding time, conditions of 10 and 20 minutes were compared for urine samples, while 5-, 10-, 20-, and 30-minute conditions were compared for plasma and serum samples. At each time point, samples and beads were incubated at room temperature without mixing. To assess the impact of the washing step, conditions with and without a 1X PBS wash were compared, and elution times were evaluated at 10-, 20-, and 30-minute intervals.
All comparative experiments were performed with PEG precipitation as a control. The quality and quantity of exosomes obtained under each condition were evaluated by comparing the expression of key exosomal marker proteins (THP, ALB, TSG101, CD9, CD63, CD81, ALIX) through Western blot analysis. Various parameters including bead concentration, binding time, temperature, number of washing steps, and elution buffer composition were systematically evaluated, confirming that the protocol presented here provides the most efficient conditions for isolating exosomes from various biological specimens.
2.5. Exosome Isolation from Multiple Biofluids Using EGCG-Modified Magnetic Beads
Optimized EGCG@T core beads (12 mg/mL) were used to isolate exosomes from four human-derived biological fluids. The isolation protocols for each biofluid were as follows:
2.6. Plasma Exosome Isolation
Plasma (200 μL) was mixed with EGCG@T beads (1 mL) and incubated at room temperature for 10 minutes. The magnetic bead-exosome complexes were separated by magnetic separation and then eluted with 50 μL elution buffer at room temperature for 20 minutes.
2.7. Serum Exosome Isolation
Serum (200 μL) was incubated with EGCG@T beads (1 mL) at room temperature for 30 minutes. After magnetic separation, the complexes were eluted with 50 μL elution buffer at room temperature for 10 minutes.
2.8. Urine Exosome Isolation
Urine (1 mL) was pretreated by centrifugation at 2,000g for 30 minutes at room temperature. The pretreated sample was incubated with EGCG@T beads (1 mL) at room temperature for 10 minutes. After magnetic separation, the complexes were eluted with 50 μL elution buffer with sonication at room temperature for 20 minutes.
2.9. Saliva Exosome Isolation
Saliva (1 mL) was pretreated by centrifugation at 2,000g for 10 minutes at room temperature. The pretreated sample was incubated with EGCG@T beads (1 mL) at room temperature for 10 minutes. After magnetic separation, the complexes were eluted with 50 μL elution buffer at room temperature for 30 minutes.
For all sample types, the magnetic bead complexes were transferred to new tubes after each separation step to maintain sample purity.
2.10. Optimization of Protein Extraction Buffer Composition
The lysis buffer (10 ml) for protein extraction was composed of 7M Urea (4.2g), 2M Thiourea (1.5g), 1mM EDTA (1 ml of 10mM EDTA solution), 150mM NaCl (1.5 ml of 1M NaCl solution), and 50mM Tris (500μl of 1M Tris pH 7.5 solution). This buffer composition was optimized based on previous research (Kim et al., 2023) that demonstrated effective protein extraction for proteomic analysis.
To determine the optimal extraction conditions, experiments were conducted with various mixture ratios of RIPA buffer (Thermo Fisher Scientific, 89900) and the prepared lysis buffer for protein extraction. Five different mixing ratios were tested as follows: Sample 1 used only 50μl of RIPA buffer, Sample 2 used only 50μl of lysis buffer, and Sample 3 used a 1:1 ratio (25μl:25μl) of RIPA and lysis buffer. Sample 4 employed a 2:1 ratio (33.3μl RIPA:16.7μl lysis), and Sample 5 applied a 3:1 ratio (37.5μl RIPA:12.5μl lysis).
2.11. Application of Reagents to the NX-Jr Instrument
Protein extraction was performed using the automated nucleic acid extraction instrument Nextractor NX-Junior (Genolution Inc., Seoul, Korea). To compare the efficiency of various extraction buffer conditions, RIPA buffer alone, lysis buffer alone, and a mixture of RIPA and lysis buffer (2:1 ratio, 33.3μl RIPA:16.7μl lysis) were applied. Sample extraction was conducted using dedicated cartridges for the Nextractor NX-Junior as follows: EGCG-modified magnetic beads mixed with urine samples were dispensed into the first well, the respective extraction buffer was dispensed into the second well, and then bead binding and protein elution steps were carried out by the automated system. All extraction processes were performed at room temperature, with optimized speed and time settings according to the built-in automated program of the instrument.
2.12. Assessment of Exosome Marker Proteins via Western Blot
Proteins (15-20 μg) were separated by SDS-PAGE using 4-15% Mini-Protean TGX gradient gels (Bio-Rad) and transferred to PVDF membranes. The membranes were blocked with TBST containing 5% skim milk for 1 hour at room temperature, then incubated overnight at 4°C with primary antibodies against THP (1:200, sc-271022), ALB (1:200, sc-271604), α-AMY (1:1,000, #4017), CD81 (1:200, NBP2-53318), CD63 (1:500, NBP2-32830), TSG101 (1:500, ab125011), and CD9 (1:500, ab263019). After washing with TBST, membranes were incubated with HRP-labeled goat anti-mouse IgG (1:1,000 or 1:500, #31430, Invitrogen) for detection of CD63, CD81, ALB, and THP, and goat anti-rabbit IgG H&L (1:1,000 or 1:500, A120-101P) for detection of α-AMY, TSG101, and CD9 for 2 hours at room temperature. Protein bands were detected using ECL solution.
2.13. Enzyme-Linked Immunosorbent Assay (ELISA)
CD63 protein levels in biofluids including urine, plasma, serum, and saliva were measured using two commercially available ELISA kits.
For urine and saliva samples, a human CD63 ELISA kit (Cusabio, ELISA-CD63-CSB-E14107h) was used following the manufacturer’s instructions. Briefly, standard dilutions (0.625–40 ng/mL) and samples (100 μL/well) were incubated at 37°C for 2 hours. Without washing, biotin-conjugated detection antibody was added and incubated at 37°C for 1 hour. After three washes, HRP-avidin was added and incubated at 37°C for another hour. Following five washes, TMB substrate was added and incubated in the dark for 15–30 minutes at 37°C. Stop solution (50 μL) was added, and absorbance was measured at 450 nm with wavelength correction at 540 nm. Concentrations were calculated using a four-parameter logistic (4-PL) curve fitting model.
For plasma and serum samples, the Human AN30 (Tetraspanin 30) ELISA Kit (ELK, ELK3433) was used. The experimental procedure was performed according to the manufacturer’s instructions, including sample and standard preparation, incubation, washing, and detection steps. Absorbance was measured at 450 nm, and CD63 concentrations were calculated based on the provided standard curve.
3. Results
3.1. Surface Morphological Analysis of Magnetic Beads Before and After EGCG Modification
The surface morphology of magnetic beads was observed using scanning electron microscopy (SEM) to evaluate the effect of EGCG surface modification (Figure 1). SEM images at a magnification of ×10,000 revealed clear differences between unmodified and EGCG-modified beads.
The unmodified magnetic beads (left panel) exhibited a relatively smooth and compact surface structure with densely packed spherical particles. In contrast, the EGCG-modified magnetic beads (right panel) showed a more irregular and rough surface morphology, with increased surface texture and apparent aggregation of particles. This morphological change suggests successful surface functionalization with EGCG, which may enhance the binding capacity and interaction with target biomolecules during exosome isolation.
These observations support that EGCG coating alters the physical surface of the beads, potentially contributing to the improved isolation efficiency observed in subsequent functional assays.
The synthesized magnetic beads and EGCG complex (EGCG@T) were analyzed using Scanning Electron Microscope (SEM) and Energy-dispersive X-ray spectroscopy (EDS). It was confirmed that EGCG was aggregated with the spherical magnetic beads to form clusters. Also EDS analysis results showed that EGCG@T bead_1 was composed of 11.54% Fe, 70.20% C, and 18.26% O, and EGCG@T bead_2 was composed of 11.62% Fe, 69.43% C, and 18.95% O, confirming that the magnetic beads and EGCG were mixed and existed.
3.2. Fourier Transform Infrared Spectroscopy (FT-IR) Analysis of EGCG-Modified Magnetic Beads
To confirm the chemical bonding and surface modification of magnetic beads with EGCG, Fourier transform infrared (FT-IR) spectroscopy was performed on T-Fe₃O₄, pure EGCG, and two different EGCG-coated bead preparations (EGCG@T beads_1 and EGCG@T beads_2) (Figure 2).
The FT-IR spectrum of pure EGCG displayed characteristic absorption peaks corresponding to carbonyl stretching (C=O) near 1691 cm⁻¹, alkene C=C stretching at 1545 cm⁻¹, and methyl group (CH₃) deformation at 1375 cm⁻¹. These signals are consistent with the polyphenolic structure of EGCG. In contrast, the T-Fe₃O₄ sample lacked these distinct organic peaks, exhibiting only the typical metal-oxide-related bands.
Upon modification with EGCG, both EGCG@T beads_1 and EGCG@T beads_2 exhibited new peaks in the 1300–1700 cm⁻¹ region that correspond to those observed in the pure EGCG spectrum. The appearance of the C=O, C=C, and CH₃-related peaks in the coated beads indicates successful surface functionalization of the magnetic beads with EGCG molecules.
These findings confirm the chemical incorporation of EGCG onto the bead surface, which may contribute to enhanced binding interactions with exosomal components in downstream applications.
The T-Fe3O4, EGCG, and EGCG@T complexes were analyzed using FT-IR at Korea Basic Science Institute(KBSI). As a result, the C=O peak of EGCG in the EGCG@T mixture was confirmed at the peak position of 1691 [cm-1]. Also the C=C peak at 1545 [cm-1], and the CH3 peak at 1375 [cm-1] were confirmed. So that EGCG was mixed in T-Fe3O4.
3.3. UV–Vis Spectral Analysis of EGCG-Modified Magnetic Beads
To investigate the optical properties and confirm the surface modification of magnetic beads with EGCG, UV–Vis absorption spectroscopy was performed on T-Fe₃O₄, pure EGCG, and two types of EGCG-coated magnetic beads (EGCG@T beads_1 and EGCG@T beads_2) (Figure 3).
The T-Fe₃O₄ sample exhibited a broad absorption band in the 550–900 nm region, which is characteristic of iron oxide nanoparticles. This peak was retained in both EGCG@T beads_1 and EGCG@T beads_2, indicating that the core magnetic properties of Fe₃O₄ were maintained after EGCG surface modification.
Pure EGCG showed a sharp and intense absorption peak near 270–280 nm, corresponding to the π–π* transition of aromatic rings in its polyphenolic structure. This prominent peak was also observed in both EGCG@T bead samples, confirming the presence of EGCG molecules on the bead surface.
Notably, EGCG@T beads_1 showed relatively higher absorption intensity at ~280 nm compared to EGCG@T beads_2, suggesting a denser or more homogeneous EGCG coating. Meanwhile, EGCG@T beads_2 displayed enhanced absorbance in the visible region (600–900 nm), likely due to changes in nanoparticle aggregation state or surface plasmon interactions after modification.
These UV–Vis spectral features collectively support the successful conjugation of EGCG onto the magnetic beads and the retention of optical properties from both EGCG and T-Fe₃O₄ components.
The T-Fe3O4, EGCG, and EGCG@T complexes were analyzed using TG-DTA at NICEM.
It was confirmed that the peak of EGCG@T Beads was formed due to the 100 nm peak of EGCG. In addition, it was confirmed that EGCG@T Beads were shifted compared to the T-Fe3O4 peak due to the 280 nm peak of EGCG. Therefore, it was confirmed once again that T-Fe3O4 and EGCG exist in a complex form.
3.4. Effect of EGCG Concentration on Surface Morphology, Elemental Composition, and Colloidal Properties of Magnetic Beads
To evaluate the influence of EGCG concentration on bead surface characteristics and physicochemical properties, scanning electron microscopy (SEM), elemental analysis, zeta potential, and dynamic light scattering (DLS) measurements were performed under three conditions: 0.1X, 1X, and 10X EGCG treatment (Figure 4).
SEM images revealed that at 0.1X concentration, the bead surfaces exhibited relatively loose and porous morphology. As the EGCG concentration increased to 1X, the surface appeared more aggregated and coated. At 10X, the morphology became even more compact and uniformly covered, suggesting progressive surface saturation with EGCG.
Elemental analysis showed a clear increase in carbon content (C) with increasing EGCG concentration, confirming successful surface coating. At the atomic level, the C content peaked at 66.53% in the 0.1X condition and gradually decreased with higher concentrations (61.86% at 1X and 31.14% at 10X), possibly due to surface densification or EGCG layer rearrangement. Meanwhile, Fe and O signals shifted accordingly, reflecting changes in surface exposure of the magnetic core.
Zeta potential measurements revealed increasingly negative surface charges from –31.49 mV (0.1X) to –33.18 mV (10X), indicating enhanced colloidal stability with increasing EGCG modification. DLS analysis showed a consistent reduction in hydrodynamic particle size with increasing EGCG concentration, from 356.1 nm (0.1X) to 188.3 nm (10X), supporting the notion of improved dispersion and reduced aggregation.
These results collectively suggest that increasing EGCG concentration enhances surface coverage and colloidal stability of magnetic beads, while modulating surface chemistry and particle size in a concentration-dependent manner.
In the complex of EGCG and T-Fe₃O₄ magnetic beads, it was confirmed that the C content % was relatively high at 0.1X and decreased as it went to 1X and 10X. Conversely, the Fe content % was confirmed to be highest at 10X and lowest at 0.1X. In addition, it was confirmed that the aggregation frequency was low as the EGCG content decreased, resulting in a smaller size at 10X and an increased Zeta potential.
3.5. Optimization of Magnetic Bead+EGCG Complex Concentration: Comparative Efficiency Analysis
Western blot analysis was performed to evaluate the effect of different concentration ratios of EGCG and T-Fe₃O₄ magnetic beads (0.1X, 1X, 10X) on exosome isolation efficiency from plasma samples (Figure 5). The detection patterns of exosomal marker proteins were analyzed in comparison with the conventional PEG precipitation method.
Western blot results showed that albumin (ALB, ~50kDa) was highly detected in the PEG method and at 0.1X concentration, but exhibited decreased levels at 1X and 10X concentrations. This suggests that high concentrations of EGCG may reduce the isolation of non-specific proteins such as albumin. The tetraspanin family protein CD9 (~22kDa) was detected with stronger bands at all concentrations (0.1X, 1X, 10X) compared to the PEG method, with the most pronounced band observed at 0.1X. CD63 (~45kDa) was strongly expressed at similar levels across all samples. CD81 (~20-25kDa) showed the strongest expression with the PEG method, while generally displaying weaker expression with the magnetic bead methods. ALIX (~75kDa) exhibited the highest expression with the PEG method and was detected at similar levels across the magnetic bead concentrations (0.1X, 1X, 10X). For TSG101 (~45kDa), the strongest expression was observed with the PEG method, while among the magnetic bead methods, 1X and 10X concentrations showed somewhat stronger expression than 0.1X.
These results demonstrate that the EGCG-modified magnetic bead method can be particularly effective for isolating specific exosomal markers such as CD9, while the detection efficiency of other marker proteins may vary depending on the bead concentration ratio.
Western blot analysis of exosomal marker proteins isolated from urine samples using conventional PEG precipitation method and EGCG-modified magnetic beads at three different concentration ratios (0.1X, 1X, and 10X). The expression of typical exosomal markers (CD9, CD63, CD81, ALIX, and TSG101) and albumin (ALB) was compared across different isolation methods. Molecular weights are indicated on the left in kilodaltons (kDa).
3.6. Optimization of Exosome Isolation Conditions from Various Biological Specimens
To establish optimized protocols for exosome isolation from urine, plasma, and serum samples, we evaluated various conditions, including magnetic bead concentration, incubation time, washing procedures, and elution duration, based on the expression levels of key exosomal markers (Figure 6).
For urine samples, marker expression was compared under different bead concentrations and incubation times. Compared with the 2 mg bead condition, the 12 mg bead condition resulted in significantly higher expression of all exosomal markers, including THP, TSG101, CD9, ALIX, CD63, and CD81. Extending the incubation time from 10 to 20 minutes further enhanced marker expression. Notably, TSG101 expression was minimal at the 2 mg bead condition but reached levels comparable to those obtained by the conventional PEG method under the 12 mg/20 min condition. Additionally, omitting the washing step consistently increased the expression of all markers compared to the conventional method. Therefore, the optimal conditions for urine-derived exosome isolation were defined as follows: bead concentration of 12 mg/ml (1.2 ml), representing a 1.2-fold increase relative to sample volume, bead binding for 10 minutes, omission of the washing process, and a 20-minute elution time.
For plasma samples, we assessed exosomal marker expression at bead binding times of 5, 10, and 20 minutes. Western blot analysis indicated strong ALB (50.66 kDa) expression with the PEG method, whereas the EGCG-modified magnetic bead method significantly reduced ALB expression, suggesting reduced co-isolation of non-specific proteins such as albumin. Tetraspanin markers (CD9 at 22 kDa, CD63 at 35-60 kDa, and CD81 at 22-24 kDa) exhibited optimal expression at a 10-minute bead binding time, with CD63 and CD81 levels surpassing those obtained by the PEG method. Internal markers such as ALIX (95 kDa) and TSG101 (47.52 kDa) showed increased expression with extended binding time, achieving greater levels than the PEG method at the 20-minute binding condition. Based on these results, optimal conditions for plasma-derived exosome isolation were determined as a bead binding time of 30 minutes with a 10-minute elution period.
Similarly, serum samples were analyzed at bead binding times of 10, 20, and 30 minutes. CD63 (35-60 kDa) displayed the strongest expression using the PEG method but showed increased levels with longer bead binding durations when using magnetic beads. CD81 (22-24 kDa) reached expression levels comparable to the PEG method at the 30-minute binding condition. ALIX (96 kDa) was maximally expressed at the 10-minute binding time, while TSG101 (47.52 kDa) maintained consistent expression across all binding durations. Conversely, CD9 (22 kDa) expression slightly decreased with prolonged incubation. Comparing elution durations, a 10-minute elution consistently yielded optimal results. Therefore, for serum-derived exosome isolation, the ideal conditions were defined as a bead binding time of 30 minutes combined with a 10-minute elution period.
Western blot analysis of exosomal markers from (A) urine, (B) plasma, and (C) serum samples isolated using PEG precipitation (PEG) and EGCG-modified magnetic beads under varying conditions as indicated. Molecular weights (kDa) are shown on the left. Optimal isolation conditions were determined based on marker expression intensity.
3.7. Optimization of Protein Extraction Buffer
In this study, we evaluated exosome isolation efficiency from urine under various elution conditions (Elution 1-5), using the PEG method and RIPA buffer as controls. To assess the characteristics of exosomes isolated under each condition, we examined the expression of key exosomal marker proteins through Western blot analysis (Figure 7).
Western blot results showed that THP exhibited significantly higher expression in all bead-based extraction conditions (Elution 1-5) compared to the PEG precipitation method and RIPA buffer. This indicates that bead-based extraction methods can effectively concentrate THP from urine samples.For TSG101, it was barely detectable in the PEG precipitation method and RIPA buffer, but showed the strongest expression in elution 2 and 3 of the bead-based extraction method. This suggests that the bead-based approach, particularly the conditions in elution 2 and 3, is effective for isolating TSG101-positive exosomes. CD81 showed clear expression in the PEG precipitation method, RIPA buffer, and Sample 1, but was barely detectable in elution 2. In contrast, strong expression was observed again in elution 3, 4, and 5. CD63 exhibited weak expression in most conditions, but a uniquely strong band was observed only in elution 2 of the bead-based extraction method. CD9 showed strong expression in the PEG precipitation method used as a control, while among the bead-based extraction methods, it showed moderate expression in elution 1 and minimal expression in elution 2. However, strong expression was observed again in elution 3, 4, and 5.
Collectively, these results demonstrate that bead-based extraction methods and various elution conditions can affect the selective isolation of exosomes from urine. In particular, TSG101 and CD63 were effectively isolated in elution 2, while CD81 and CD9 were effectively isolated in elution 3, 4, and 5. This suggests that optimal elution conditions can be selected depending on the target exosomal markers.
Western blot analysis of exosomal markers (THP, TSG101, CD81, CD63, and CD9) isolated from urine samples using PEG precipitation (control), RIPA buffer, and five different elution conditions with varying RIPA:lysis buffer ratios (Elution 1: RIPA only; Elution 2: lysis buffer only; Elution 3: 1:1; Elution 4: 2:1; Elution 5: 3:1). Different elution conditions show distinct enrichment patterns of exosomal markers, suggesting buffer composition affects the isolation of specific exosome subpopulations.
3.8. Automated Exosome Isolation: Evaluation of Buffer Systems Using the NX-Jr Platform
To effectively isolate exosomes from various biological samples, buffer conditions were optimized using the automated Nextractor NX-Junior platform with EGCG-modified magnetic beads. Western blot analysis compared exosomal marker expression under different extraction conditions against the conventional PEG precipitation method (Figure 8).
For urine samples, buffers evaluated included RIPA, Lysis, and a mixed buffer (RIPA+Lysis). THP (~100 kDa) was strongly expressed in all NX-Jr conditions compared to PEG. TSG101 (~45 kDa) showed the highest expression with PEG and was detectable with Lysis and mixed buffers, but not with RIPA alone. Tetraspanins CD81, CD63, and CD9 (~20–60 kDa) had strong expression in PEG, RIPA, and mixed buffer conditions but weaker expression with Lysis buffer alone. Thus, the mixed buffer (RIPA+Lysis) provided optimal balanced extraction of urine-derived exosomes.
For plasma samples, ALIX (~75 kDa) was most strongly expressed with Lysis buffer and moderately with mixed buffer, but weakly expressed with PEG and RIPA alone. CD63 (~45 kDa) showed strong expression with RIPA and mixed buffers and moderate with PEG. CD9 (~20–25 kDa) was highest with Lysis buffer and minimal with RIPA alone. TSG101 (~45 kDa) had strong expression with PEG and RIPA buffer and moderate with mixed buffer. Therefore, the mixed buffer condition offered balanced extraction; however, specific buffer choices can selectively concentrate individual markers.
In serum samples, ALIX (~75 kDa) and TSG101 (~45 kDa) exhibited highest expression in PEG, with moderate expression in Lysis and mixed buffer conditions, but weak expression with RIPA alone. CD63 (~50 kDa) was strongest with PEG and weaker in all NX-Jr conditions. CD9 (~22 kDa) showed strong expression with PEG and Lysis buffer, but minimal with RIPA or mixed buffer conditions. CD81 was undetectable in all conditions. Overall, PEG yielded the highest expression for most markers, with Lysis or mixed buffer preferable among NX-Jr conditions.
For saliva samples, TSG101 (~50 kDa) expression was significantly stronger in all NX-Jr conditions compared to PEG, indicating NX-Jr effectiveness. CD81 (~25 kDa) showed highest expression with RIPA buffer, moderate with mixed buffer, and weaker with Lysis. CD63 (~50 kDa) and CD9 (~22 kDa) displayed strong expression consistently across all conditions, slightly favoring RIPA and mixed buffers. Thus, saliva-derived exosomes exhibited stable extraction patterns across different buffer conditions, with the mixed buffer being most practical.
In conclusion, the RIPA+Lysis mixed buffer provided balanced and effective extraction across urine, plasma, serum, and saliva samples, with selective buffer adjustments recommended for targeted marker enrichment.
Western blot analysis of exosomal markers isolated from (A) urine, (B) plasma, (C) serum, and (D) saliva samples using conventional PEG precipitation (PEG) and automated extraction by NX-Jr instrument with different buffers: RIPA, LYS, and mixed RIPA/LYS. Molecular weights (kDa) indicated on the left. Optimal buffer conditions varied by sample type and target marker.
3.9. Comparative Analysis of CD63 Expression in Exosomes Isolated from Urine, Saliva, Plasma, and Serum Samples Using Different Methods
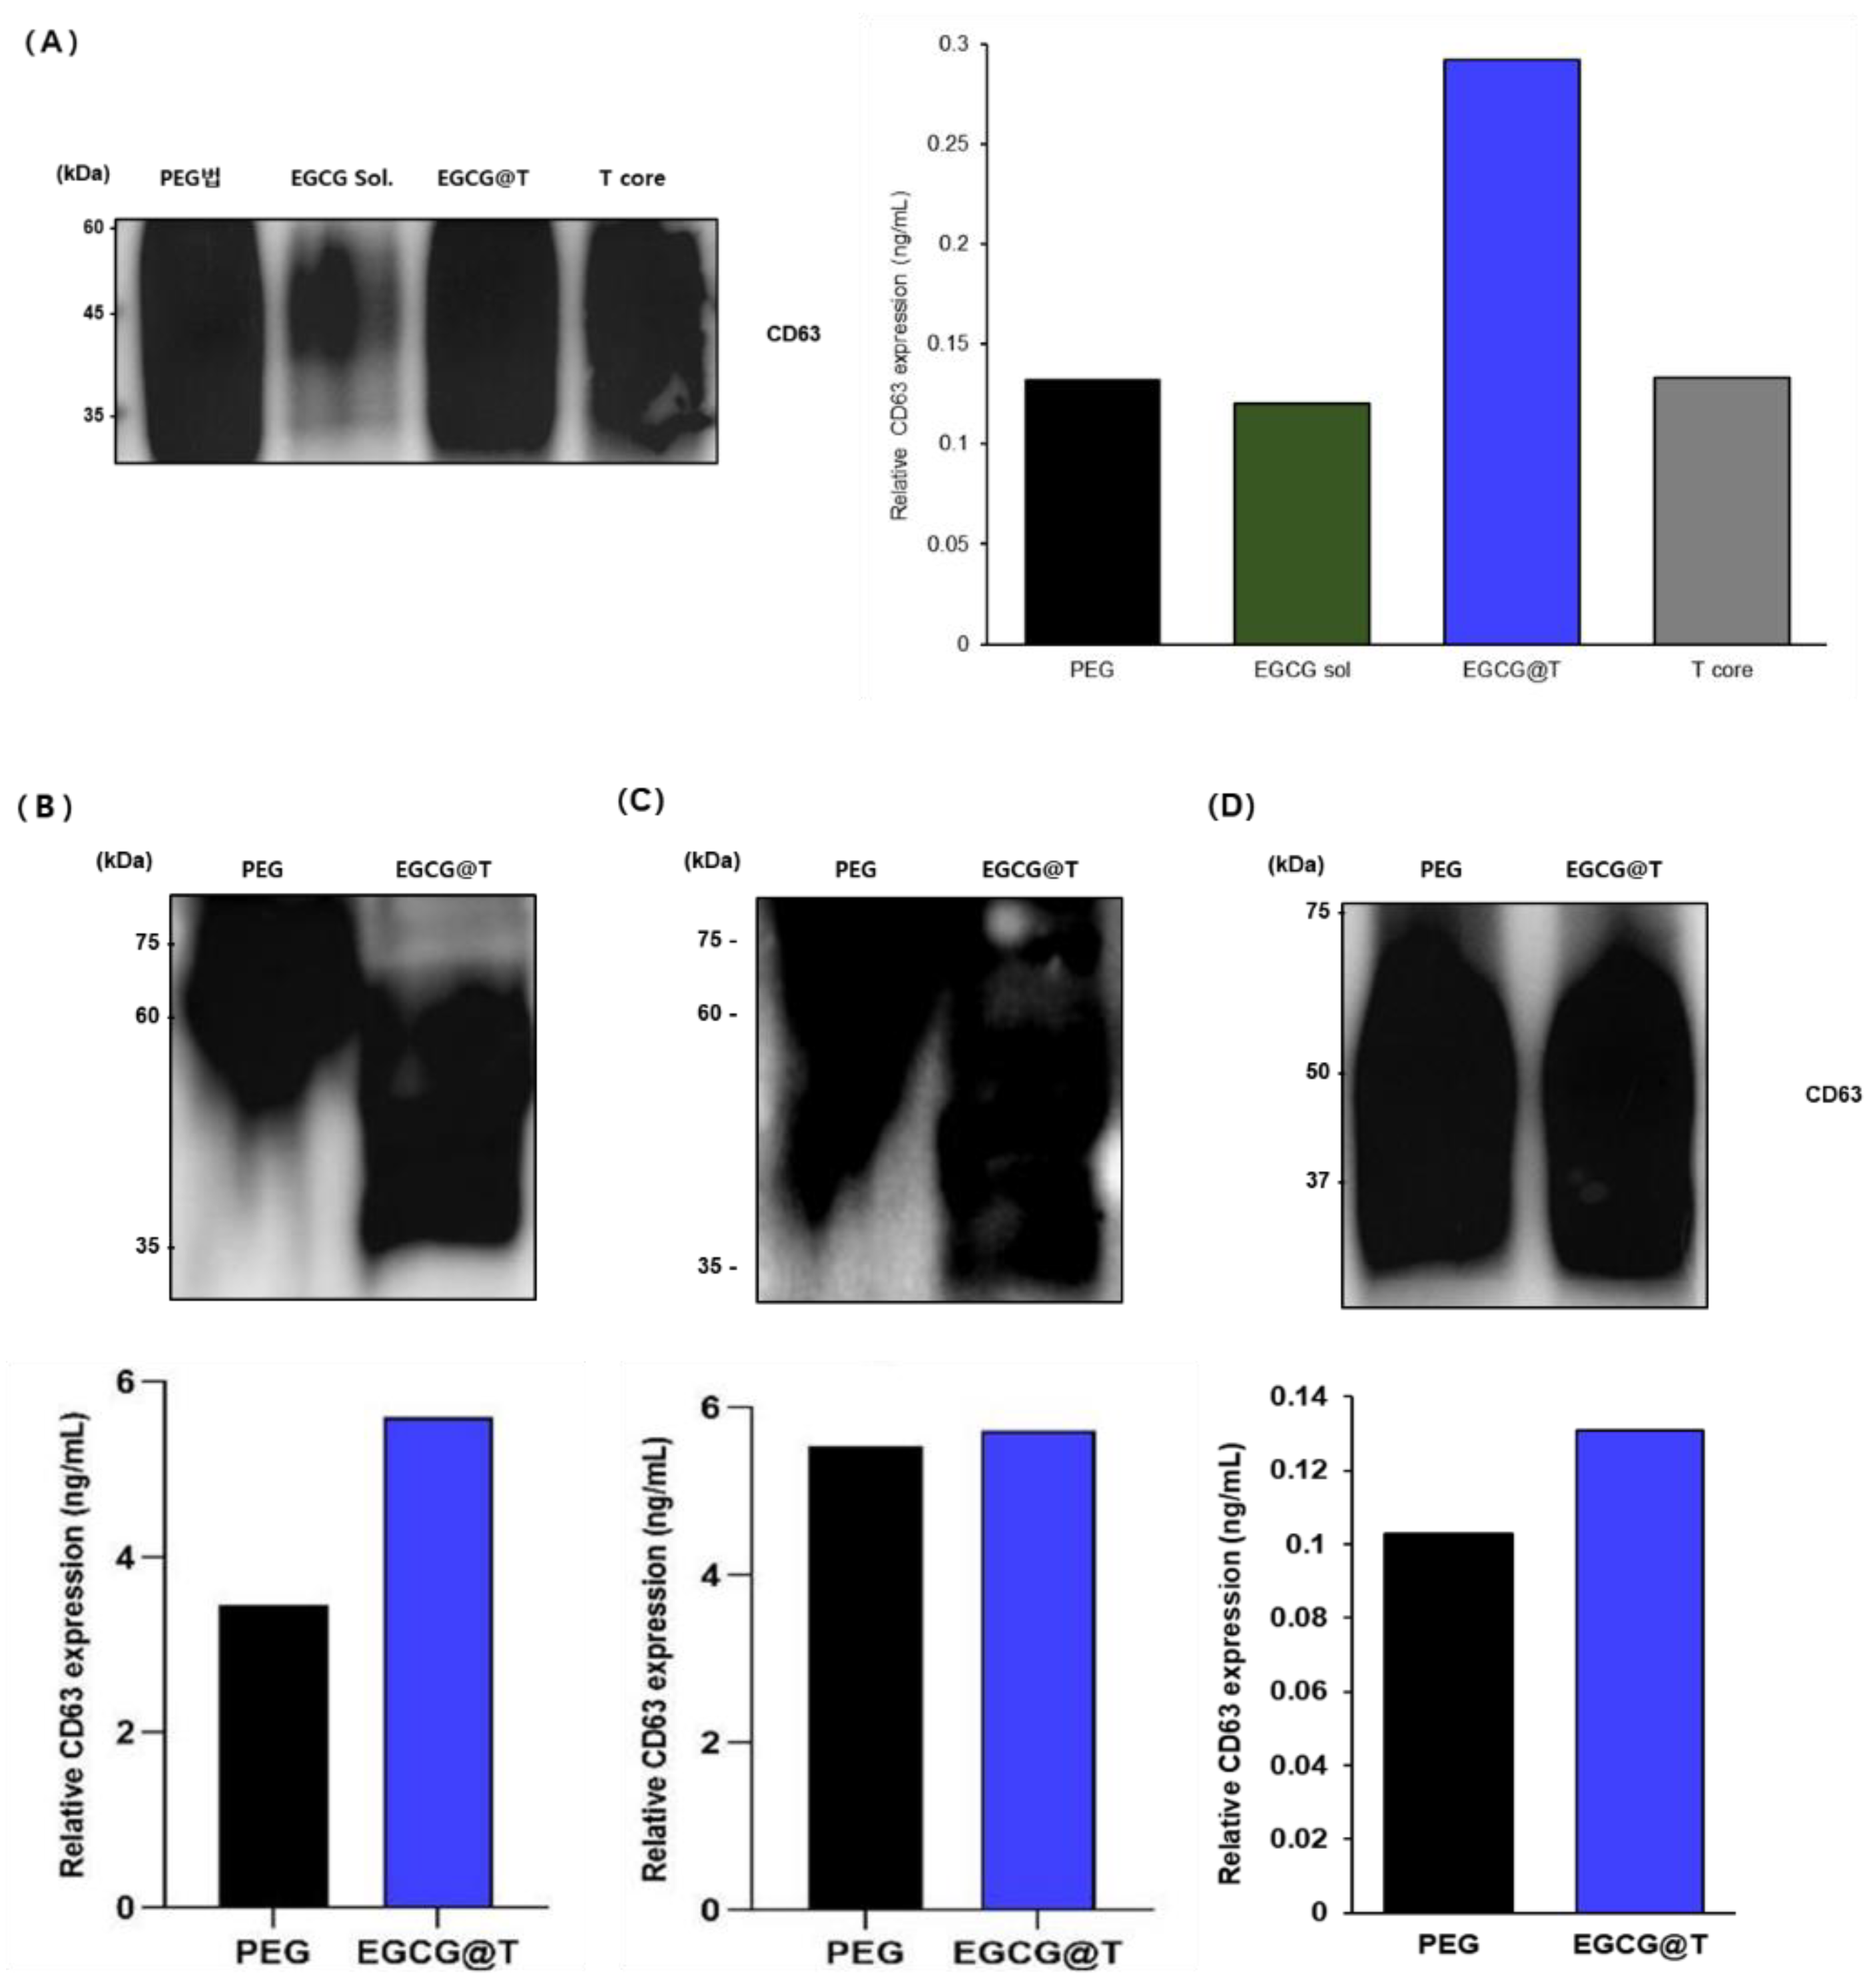
To evaluate differences in CD63 expression based on exosome isolation methods, both Western blot and ELISA analyses were performed across four biological samples: urine, saliva, plasma, and serum (Figure 9). For urine samples, exosomes were isolated using PEG precipitation, EGCG solution (EGCG Sol.), EGCG-modified magnetic beads (EGCG@T), and magnetic bead core (T core). Western blot analysis showed detectable CD63 (~45–60 kDa) expression in all methods, with particularly strong bands observed in PEG, EGCG@T, and T core groups. The EGCG Sol. group showed relatively weak expression. Among them, the EGCG@T method yielded the most intense and distinct CD63 bands. ELISA quantification confirmed this trend, revealing the highest CD63 level with EGCG@T (0.29 ng/mL), over twice that of PEG (0.13 ng/mL), EGCG Sol. (0.12 ng/mL), and T core (0.13 ng/mL). These results suggest a synergistic effect of EGCG and magnetic beads in enhancing CD63-positive exosome isolation from urine.
Building on these findings, plasma samples were assessed using PEG and EGCG@T. Western blot analysis demonstrated stronger CD63 bands with the EGCG@T method than PEG. ELISA quantification supported this result, with the EGCG@T method yielding a CD63 level of approximately 5.7 ng/mL, compared to 3.4 ng/mL for PEG. This indicates that EGCG@T significantly improves the isolation efficiency of CD63-positive exosomes from plasma.
In serum samples, both PEG and EGCG@T methods showed strong CD63 bands in Western blot, with similar intensities. ELISA results showed comparable CD63 levels in both methods, with 5.6 ng/mL for PEG and 5.8 ng/mL for EGCG@T. These findings suggest that while both methods are effective for serum-derived exosome isolation, EGCG@T provides slightly improved performance.
saliva samples were also analyzed using the PEG and EGCG@T methods. Western blot results showed broad and strong CD63 bands (~37–75 kDa) in both methods, suggesting the presence of abundant CD63-positive exosomes in saliva. ELISA analysis indicated a higher CD63 level with the EGCG@T method (0.13 ng/mL) than PEG (0.10 ng/mL), consistent with the trend observed in urine, though with a smaller difference. This may reflect matrix effects or intrinsic differences in salivary exosome characteristics.
In summary, across all four biological samples, the EGCG@T method consistently demonstrated enhanced or comparable isolation efficiency of CD63-positive exosomes relative to the PEG method. The effect was most pronounced in urine and plasma samples, indicating that EGCG-modified magnetic beads are a promising tool for high-efficiency exosome isolation from diverse biological fluids.
Western blot and ELISA analyses were performed to compare CD63 expression in exosomes isolated from urine, saliva, plasma, and serum samples. Four different isolation methods were evaluated in urine: PEG precipitation (PEG), EGCG solution (EGCG sol), EGCG-modified magnetic beads (EGCG@T), and magnetic bead core (T core). EGCG@T demonstrated the highest CD63 expression in both Western blot and ELISA (0.29 ng/mL). For saliva, plasma, and serum samples, exosomes were isolated using PEG and EGCG@T methods. Western blot results showed comparable or stronger CD63 expression with EGCG@T, and ELISA confirmed higher CD63 levels in EGCG@T-treated samples compared to PEG, particularly in plasma. These results indicate that EGCG@T is a broadly effective method for isolating CD63-positive exosomes across diverse biofluids.
4. Discussion
The collective physicochemical analyses confirmed the successful surface modification of magnetic beads with EGCG. SEM and elemental analysis revealed increased surface coverage and carbon content with higher EGCG concentrations, indicating efficient surface coating. FT-IR and UV–Vis spectra further supported the presence of EGCG-specific functional groups while preserving the optical characteristics of Fe₃O₄, suggesting stable composite formation. In addition, zeta potential and DLS measurements demonstrated enhanced colloidal stability and reduced aggregation with increasing EGCG concentration. These findings are consistent with previous studies reporting polyphenol-based nanoparticle functionalization to improve biomolecular interactions and isolation performance [22].
Building upon these physicochemical properties, we developed a novel EGCG-modified magnetic bead-based method (EGCG@T) for efficient isolation and concentration of exosomes from diverse biofluids. The EGCG@T complex demonstrated superior performance in capturing exosomes compared to conventional methods, with optimization of composition ratio (10X ratio of 0.1 mg EGCG:1 mg T-Fe₃O₄) yielding the highest efficiency. Our approach addresses several limitations of existing isolation techniques such as ultracentrifugation, which is time-consuming and equipment-intensive [23,24], and precipitation methods, which often co-isolate non-specific proteins [25]. The automated protocol developed using the Nextractor NX-Junior platform successfully integrated exosome isolation and protein extraction into a single workflow, significantly reducing processing time while maintaining or enhancing isolation efficiency across multiple biofluid types.
We demonstrated that biofluid-specific optimization of the isolation protocol is essential, as the physicochemical properties of exosomes vary between sample types. For urine samples, a bead concentration of 12 mg/ml with 10-minute binding and 20-minute elution without washing steps proved optimal. In contrast, plasma and serum samples required longer binding times (30 minutes) and shorter elution times (10 minutes) to maximize recovery of various exosomal markers. The combination of RIPA and lysis buffer (RIPA+Lysis) consistently showed balanced extraction of diverse exosomal markers (CD9, CD63, CD81, TSG101, ALIX) across sample types, although the efficiency varied by biofluid. These findings align with previous studies reporting heterogeneity in exosome populations across different biofluids [26,27] and the importance of optimizing isolation conditions according to sample characteristics [28,29].
One of the key findings of our study is that exosomal marker expression patterns vary significantly depending on the biofluid type. In urine samples, CD9 and CD63 showed high expression with the EGCG@T method, while TSG101 and ALIX expression was more prominent in plasma and serum samples. These differences likely reflect the heterogeneity of exosome subpopulations present in each biofluid [30]. Kowal et al. reported that extracellular vesicles can be classified into several subpopulations based on the expression of tetraspanins and ESCRT complex components [31]. Our results confirm that this heterogeneity exists across different biofluids and suggest that isolation methods targeting specific markers should be optimized according to biofluid type.
Notably, the EGCG@T method showed stable and consistent expression of all exosomal markers in saliva samples. This suggests that salivary exosomes may have more homogeneous physicochemical properties compared to other biofluids. Han et al. reported that salivary exosomes possess distinct membrane compositions and surface properties that could affect isolation efficiency [32]. Additionally, the lower protein complexity of saliva may facilitate interactions between EGCG and exosome membranes, enhancing isolation efficiency [11]. In contrast, plasma and serum samples may require longer binding times for optimal isolation due to interference from abundant proteins such as albumin with EGCG interactions. Li et al. reported that protein-EGCG interactions in plasma could affect exosome isolation efficiency [33]. The optimized protocols developed in this study have been adjusted for these biofluid-specific differences, providing an important methodological advancement for exosome research and diagnostic applications across various biofluids.
In this study, we systematically evaluated the impact of various extraction buffer compositions on the recovery of exosomal marker proteins. Testing RIPA buffer, Lysis buffer, and various ratio combinations of the two revealed that buffer composition critically influences the expression levels of specific exosomal markers. Notably, we found that a 2:1 ratio mixture of RIPA and Lysis buffers provided balanced recovery of diverse exosomal markers in most biofluids. This aligns with findings reported by Shao et al., who demonstrated that composite buffer systems may be more effective for extracting various membrane and cytosolic proteins than single lysis buffers [1].
Interestingly, ESCRT(Endosomal Sorting Complex Required for Transport) complex-associated proteins such as TSG101 and ALIX responded more sensitively to Lysis buffer components, while tetraspanin proteins including CD9, CD63, and CD81 were more effectively extracted with RIPA buffer components. This suggests differences in protein composition and membrane characteristics among exosome subpopulations. Zhang et al. reported that tetraspanins are predominantly located in lipid rafts, and these membrane microdomains may be more effectively solubilized by detergents included in RIPA buffer [34].
In contrast, Urabe et al. demonstrated that ESCRT-related proteins could be more effectively extracted in buffers containing denaturants such as urea [35]. The RIPA+Lysis mixed buffer system developed in this study leverages these properties to efficiently extract a broad range of marker proteins from various exosome subpopulations simultaneously. This could be an important advantage for future clinical applications such as disease diagnosis through liquid biopsy. Peterson et al. showed that analyzing diverse exosomal markers simultaneously could significantly improve diagnostic accuracy compared to relying on single markers [36].
In this study, we established an integrated workflow for efficient exosome isolation from various biofluids using a combination of the Nextractor NX-Junior automated system and EGCG-modified magnetic beads. One of the major advantages of this automated platform is the integration of exosome isolation and protein extraction steps, which traditionally have been performed as separate processes, into a single procedure. This not only significantly reduces sample processing time but also minimizes sample loss that can occur during multi-step isolation processes. Whiteside et al. reported that additional exosome isolation steps can substantially reduce final recovery rates [5].
Quantitative assessment through ELISA analysis confirmed that the automated system using the EGCG@T method isolated CD63-positive exosomes from urine samples more than twice as efficiently as the conventional PEG precipitation method. This suggests that the synergistic effect of EGCG's specific binding ability to exosome membrane phospholipids [37] and the efficient magnetic separation characteristics of magnetic beads enables high-efficiency exosome isolation. Moreover, the system is applicable to various biofluids and can isolate exosomes from small sample volumes (200-1000 μL), indicating high potential for application in clinical diagnostic settings. Kosaka et al. emphasized that effective exosome isolation from small volumes of biofluids could make liquid biopsy using exosomes an innovative tool for early diagnosis and monitoring of various diseases including cancer [38].
Particularly noteworthy is that in saliva samples, the system detected various exosomal markers such as CD9, CD63, CD81, and TSG101 at uniformly high levels. According to Raposo et al., saliva is a non-invasively obtainable sample that can contain biomarkers for not only oral diseases but also systemic diseases, making it diagnostically valuable [39]. The automated system developed in this study can effectively isolate various exosome subpopulations in saliva, which is expected to greatly enhance the potential clinical application of saliva-based liquid biopsy in the future.
While this study validated the efficiency of exosome isolation using EGCG-modified magnetic beads across various biofluids, several limitations exist. First, we primarily evaluated exosome isolation efficiency based on protein marker expression. However, to fully understand the integrity and functional characteristics of exosomes, additional characterization through morphological analysis via electron microscopy, size distribution measurement via nanoparticle tracking analysis (NTA), and analysis of RNA content in isolated exosomes is necessary. Witwer et al. emphasized the importance of diverse characterization methods in exosome research [40]. Second, follow-up studies comparing healthy controls and patient samples with various disease states are needed to further clarify the clinical utility of the method developed in this study. In particular, analyzing differences in exosome profiles across various pathological conditions such as cancer, neurodegenerative diseases, and cardiovascular diseases is crucial for demonstrating the diagnostic value of this method. Zhang et al. reported that serum exosome profiles from cancer patients could show significant differences compared to healthy controls [41]. Third, while the current automated system is optimized for small-scale research environments, scaling up to systems with higher throughput and reproducibility is necessary for large-scale clinical applications. Gardiner et al. emphasized that the development of standardized high-throughput isolation methods is essential for the clinical application of exosome-based biomarkers [42].
Future research should focus on improving the chemical stability of the EGCG@T complex and developing techniques for selective isolation of specific exosome subpopulations through surface functionalization. In particular, the development of EGCG@T complexes conjugated with antibodies or aptamers that can selectively capture exosomes related to specific cancers or diseases could greatly enhance the specificity and sensitivity of liquid biopsy. Zhao et al. reported a method for selectively isolating specific cancer-related exosomes using magnetic beads coupled with targeting antibodies [9]. These future studies are expected to further expand the potential clinical applications of EGCG-modified magnetic bead-based exosome isolation methods.
5. Conclusions
In summary, the EGCG-modified magnetic bead-based integrated system for exosome isolation and protein extraction developed in this study provides a novel method for efficiently isolating exosomes from various biofluids. The introduction of biofluid-specific optimized protocols and automated systems enables reproducible exosome isolation and is expected to provide an important foundation for clinical diagnostic applications. Future development of techniques for selectively isolating disease-specific exosome subpopulations will further expand the clinical utility of exosome-based liquid biopsies.
Author Contributions
Conceptualization and methodology, H.S. and E.J.; writing—original draft preparation, H.S. and E.J.; writing—review and editing, S.L.; supervision, S.L. All authors have read and agreed to the published version of the manuscript.
Funding
This work was supported by grants from the Ministry of SMEs and Startups of Korea (no. RS-2024-00487736).
Acknowledgments
This study was supported by Genolution Inc.
Conflicts of Interest
The authors declare no conflict of interest.
References
- Shao, H.; Im, H.; Castro, C.M.; Breakefield, X.; Weissleder, R.; Lee, H. New Technologies for Analysis of Extracellular Vesicles. Chem. Rev. 2018, 118, 1917–1950. [CrossRef]
- Rani, S.; Ritter, T. The Exosome - A Naturally Secreted Nanoparticle and its Application to Wound Healing. Adv. Mater. 2015, 28, 5542–5552. [CrossRef]
- Wang, Y.; Sun, S.; Zhang, Z.; Shi, D. Nanomaterials for cancer precision medicine. Advanced materials 2018, 30, 1705660.
- Tay, H.M.; Kharel, S.; Dalan, R.; Chen, Z.J.; Tan, K.K.; O Boehm, B.; Loo, S.C.J.; Hou, H.W. Rapid purification of sub-micrometer particles for enhanced drug release and microvesicles isolation. NPG Asia Mater. 2017, 9, e434–e434. [CrossRef]
- Whiteside, T.L. Tumor-Derived Exosomes and Their Role in Cancer Progression. Adv. Clin. Chem. 2016, 74, 103–141. [CrossRef]
- Cesi, G.; Walbrecq, G.; Margue, C.; Kreis, S. Transferring intercellular signals and traits between cancer cells: extracellular vesicles as “homing pigeons”. Cell Commun. Signal. 2016, 14, 1–12. [CrossRef]
- Shao, H.; Chung, J.; Lee, K.; Balaj, L.; Min, C.; Carter, B.S.; Hochberg, F.H.; Breakefield, X.O.; Lee, H.; Weissleder, R. Chip-based analysis of exosomal mRNA mediating drug resistance in glioblastoma. Nat. Commun. 2015, 6, 6999. [CrossRef]
- Woo, H.-K.; Sunkara, V.; Park, J.; Kim, T.-H.; Han, J.-R.; Kim, C.-J.; Choi, H.-I.; Kim, Y.-K.; Cho, Y.-K. Exodisc for Rapid, Size-Selective, and Efficient Isolation and Analysis of Nanoscale Extracellular Vesicles from Biological Samples. ACS Nano 2017, 11, 1360–1370. [CrossRef]
- Zhao, Z.; Yang, Y.; Zeng, Y.; He, M. A microfluidic ExoSearch chip for multiplexed exosome detection towards blood-based ovarian cancer diagnosis. Lab. Chip 2016, 16, 489–496. [CrossRef]
- Weng, Y.; Sui, Z.; Shan, Y.; Hu, Y.; Chen, Y.; Zhang, L.; Zhang, Y. Effective isolation of exosomes with polyethylene glycol from cell culture supernatant for in-depth proteome profiling. Anal. 2016, 141, 4640–4646. [CrossRef]
- Li, P.; Kaslan, M.; Lee, S.H.; Yao, J.; Gao, Z. Progress in Exosome Isolation Techniques. Theranostics 2017, 7, 789–804. [CrossRef]
- Deregibus, M.C.; Figliolini, F.; D'Antico, S.; Manzini, P.M.; Pasquino, C.; De Lena, M.; Tetta, C.; Brizzi, M.F.; Camussi, G. Charge-based precipitation of extracellular vesicles. Int. J. Mol. Med. 2016, 38, 1359–1366. [CrossRef]
- Contreras-Naranjo, J.C.; Wu, H.-J.; Ugaz, V.M. Microfluidics for exosome isolation and analysis: enabling liquid biopsy for personalized medicine. Lab a Chip 2017, 17, 3558–3577. [CrossRef]
- Jang, M.; Choi, G.; Choi, Y.Y.; Lee, J.E.; Jung, J.-H.; Oh, S.W.; Han, D.H.; Lee, H.; Park, J.-H.; Cheong, J.-H.; et al. Extracellular vesicle (EV)-polyphenol nanoaggregates for microRNA-based cancer diagnosis. NPG Asia Mater. 2019, 11, 1–10. [CrossRef]
- Sileika, T.S.; Barrett, D.G.; Zhang, R.; Lau, K.H.A.; Messersmith, P.B. Colorless Multifunctional Coatings Inspired by Polyphenols Found in Tea, Chocolate, and Wine. Angew. Chem. Int. Ed. Engl. 2013, 52, 10766–10770. [CrossRef]
- Xiao, J.; Kai, G. A Review of Dietary Polyphenol-Plasma Protein Interactions: Characterization, Influence on the Bioactivity, and Structure-Affinity Relationship. Crit. Rev. Food Sci. Nutr. 2012, 52, 85–101. [CrossRef]
- Uekusa, Y.; Kamihira-Ishijima, M.; Sugimoto, O.; Ishii, T.; Kumazawa, S.; Nakamura, K.; Tanji, K.-I.; Naito, A.; Nakayama, T. Interaction of epicatechin gallate with phospholipid membranes as revealed by solid-state NMR spectroscopy. Biochim. et Biophys. Acta (BBA) - Biomembr. 2011, 1808, 1654–1660. [CrossRef]
- Pires, F.; Geraldo, V.P.; Antunes, A.; Marletta, A.; Oliveira Jr, O.N.; Raposo, M. On the role of epigallocatechin-3-gallate in protecting phospholipid molecules against UV irradiation. Colloids and Surfaces B: Biointerfaces 2019, 173, 312-319.
- Liang, K.; Chung, J.E.; Gao, S.J.; Yongvongsoontorn, N.; Kurisawa, M. Highly Augmented Drug Loading and Stability of Micellar Nanocomplexes Composed of Doxorubicin and Poly(ethylene glycol)–Green Tea Catechin Conjugate for Cancer Therapy. Adv. Mater. 2018, 30, e1706963. [CrossRef]
- Wittrup, A.; Zhang, S.-H.; Svensson, K.J.; Kucharzewska, P.; Johansson, M.C.; Mörgelin, M.; Belting, M. Magnetic nanoparticle-based isolation of endocytic vesicles reveals a role of the heat shock protein GRP75 in macromolecular delivery. Proc. Natl. Acad. Sci. 2010, 107, 13342–13347. [CrossRef]
- Yu, D.; Li, Y.; Wang, M.; Gu, J.; Xu, W.; Cai, H.; Fang, X.; Zhang, X. Exosomes as a new frontier of cancer liquid biopsy. Mol. Cancer 2022, 21, 1–33. [CrossRef]
- Chen, Y.; Tang, Y.; Li, Y.; Rui, Y.; Zhang, P. Enhancing the Efficacy of Active Pharmaceutical Ingredients in Medicinal Plants through Nanoformulations: A Promising Field. Nanomaterials 2024, 14, 1598. [CrossRef]
- Thery, C.; Clayton, A.; Amigorena, S.; Raposo, G. Isolation and characterization of exosomes from cell culture supernatants and biological fluids. Curr. Protoc. Cell Biol. 2006, 3. doi.org/10.1002/0471143030.cb0322s30.
- Livshits, M.A.; Khomyakova, E.; Evtushenko, E.G.; Lazarev, V.N.; Kulemin, N.A.; Semina, S.E.; Generozov, E.V.; Govorun, V.M. Isolation of exosomes by differential centrifugation: Theoretical analysis of a commonly used protocol. Sci. Rep. 2015, 5, 17319–17319. [CrossRef]
- Helwa, I.; Cai, J.; Drewry, M.D.; Zimmerman, A.; Dinkins, M.B.; Khaled, M.L.; Seremwe, M.; Dismuke, W.M.; Bieberich, E.; Stamer, W.D.; et al. A Comparative Study of Serum Exosome Isolation Using Differential Ultracentrifugation and Three Commercial Reagents. PLOS ONE 2017, 12, e0170628. [CrossRef]
- Yáñez-Mó, M.; Siljander, P.R.-M.; Andreu, Z.; Bedina Zavec, A.; Borràs, F.E.; Buzas, E.I.; Buzas, K.; Casal, E.; Cappello, F.; Carvalho, J.; et al. Biological properties of extracellular vesicles and their physiological functions. J. Extracell. Vesicles 2015, 4, 27066. [CrossRef]
- Willms, E.; Cabañas, C.; Mäger, I.; Wood, M.J.A.; Vader, P. Extracellular Vesicle Heterogeneity: Subpopulations, Isolation Techniques, and Diverse Functions in Cancer Progression. Front. Immunol. 2018, 9, 738. [CrossRef]
- Buschmann, D.; Kirchner, B.; Hermann, S.; Märte, M.; Wurmser, C.; Brandes, F.; Kotschote, S.; Bonin, M.; Steinlein, O.K.; Pfaffl, M.W.; et al. Evaluation of serum extracellular vesicle isolation methods for profiling miRNAs by next-generation sequencing. J. Extracell. Vesicles 2018, 7, 1481321. [CrossRef]
- Konoshenko, M.Y.; Lekchnov, E.A.; Vlassov, A.V.; Laktionov, P.P. Isolation of Extracellular Vesicles: General Methodologies and Latest Trends. BioMed Res. Int. 2018, 2018, 8545347. [CrossRef]
- Kowal, J.; Arras, G.; Colombo, M.; Jouve, M.; Morath, J.P.; Primdal-Bengtson, B.; Dingli, F.; Loew, D.; Tkach, M.; Théry, C. Proteomic comparison defines novel markers to characterize heterogeneous populations of extracellular vesicle subtypes. Proc. Natl. Acad. Sci. USA 2016, 113, E968–E977. [CrossRef]
- Kowal, J.; Tkach, M.; Théry, C. Biogenesis and secretion of exosomes. Curr. Opin. Cell Biol. 2014, 29, 116–125. [CrossRef]
- Han, Y.; Jia, L.; Zheng, Y.; Li, W. Salivary Exosomes: Emerging Roles in Systemic Disease. Int. J. Biol. Sci. 2018, 14, 633–643. [CrossRef]
- Shin, H.; Han, C.; Labuz, J.M.; Kim, J.; Kim, J.; Cho, S.; Gho, Y.S.; Takayama, S.; Park, J. High-yield isolation of extracellular vesicles using aqueous two-phase system. Sci. Rep. 2015, 5, srep13103. [CrossRef]
- Zhang, H.; Freitas, D.; Kim, H.S.; Fabijanic, K.; Li, Z.; Chen, H.; Mark, M.T.; Molina, H.; Martin, A.B.; Bojmar, L.; et al. Identification of distinct nanoparticles and subsets of extracellular vesicles by asymmetric flow field-flow fractionation. Nat. Cell Biol. 2018, 20, 332–343. [CrossRef]
- Urabe, F.; Kosaka, N.; Ito, K.; Kimura, T.; Egawa, S.; Ochiya, T. Extracellular vesicles as biomarkers and therapeutic targets for cancer. Am. J. Physiol. Physiol. 2020, 318, C29–C39. [CrossRef]
- Peterson, M.F.; Otoc, N.; Sethi, J.K.; Gupta, A.; Antes, T.J. Integrated systems for exosome investigation. Methods 2015, 87, 31–45. [CrossRef]
- Wang, Q.; Zhuang, X.; Mu, J.; Deng, Z.-B.; Jiang, H.; Zhang, L.; Xiang, X.; Wang, B.; Yan, J.; Miller, D.; et al. Delivery of therapeutic agents by nanoparticles made of grapefruit-derived lipids. Nat. Commun. 2013, 4, 1–13. [CrossRef]
- Kosaka, N.; Iguchi, H.; Ochiya, T. Circulating microRNA in body fluid: a new potential biomarker for cancer diagnosis and prognosis. Cancer Sci. 2010, 101, 2087–2092. [CrossRef]
- Raposo, G.; Stoorvogel, W. Extracellular vesicles: exosomes, microvesicles, and friends. Journal of Cell Biology 2013, 200, 373-383.
- Witwer, K.W.; Buzás, E.I.; Bemis, L.T.; Bora, A.; Lässer, C.; Lötvall, J.; Nolte-'t Hoen, E.N.; Piper, M.G.; Sivaraman, S.; Skog, J.; et al. Standardization of sample collection, isolation and analysis methods in extracellular vesicle research. J. Extracell. Vesicles 2013, 2, 20360. [CrossRef]
- Zhang, W.; Xia, W.; Lv, Z.; Ni, C.; Xin, Y.; Yang, L. Liquid biopsy for cancer: circulating tumor cells, circulating free DNA or exosomes? Cellular Physiology and Biochemistry 2017, 41, 755-768.
- Gardiner, C.; Di Vizio, D.; Sahoo, S.; Théry, C.; Witwer, K.W.; Wauben, M.; Hill, A.F. Techniques used for the isolation and characterization of extracellular vesicles: Results of a worldwide survey. J. Extracell. Vesicles 2016, 5, 32945 . [CrossRef]
Figure 1.
Morphological analysis using SEM.
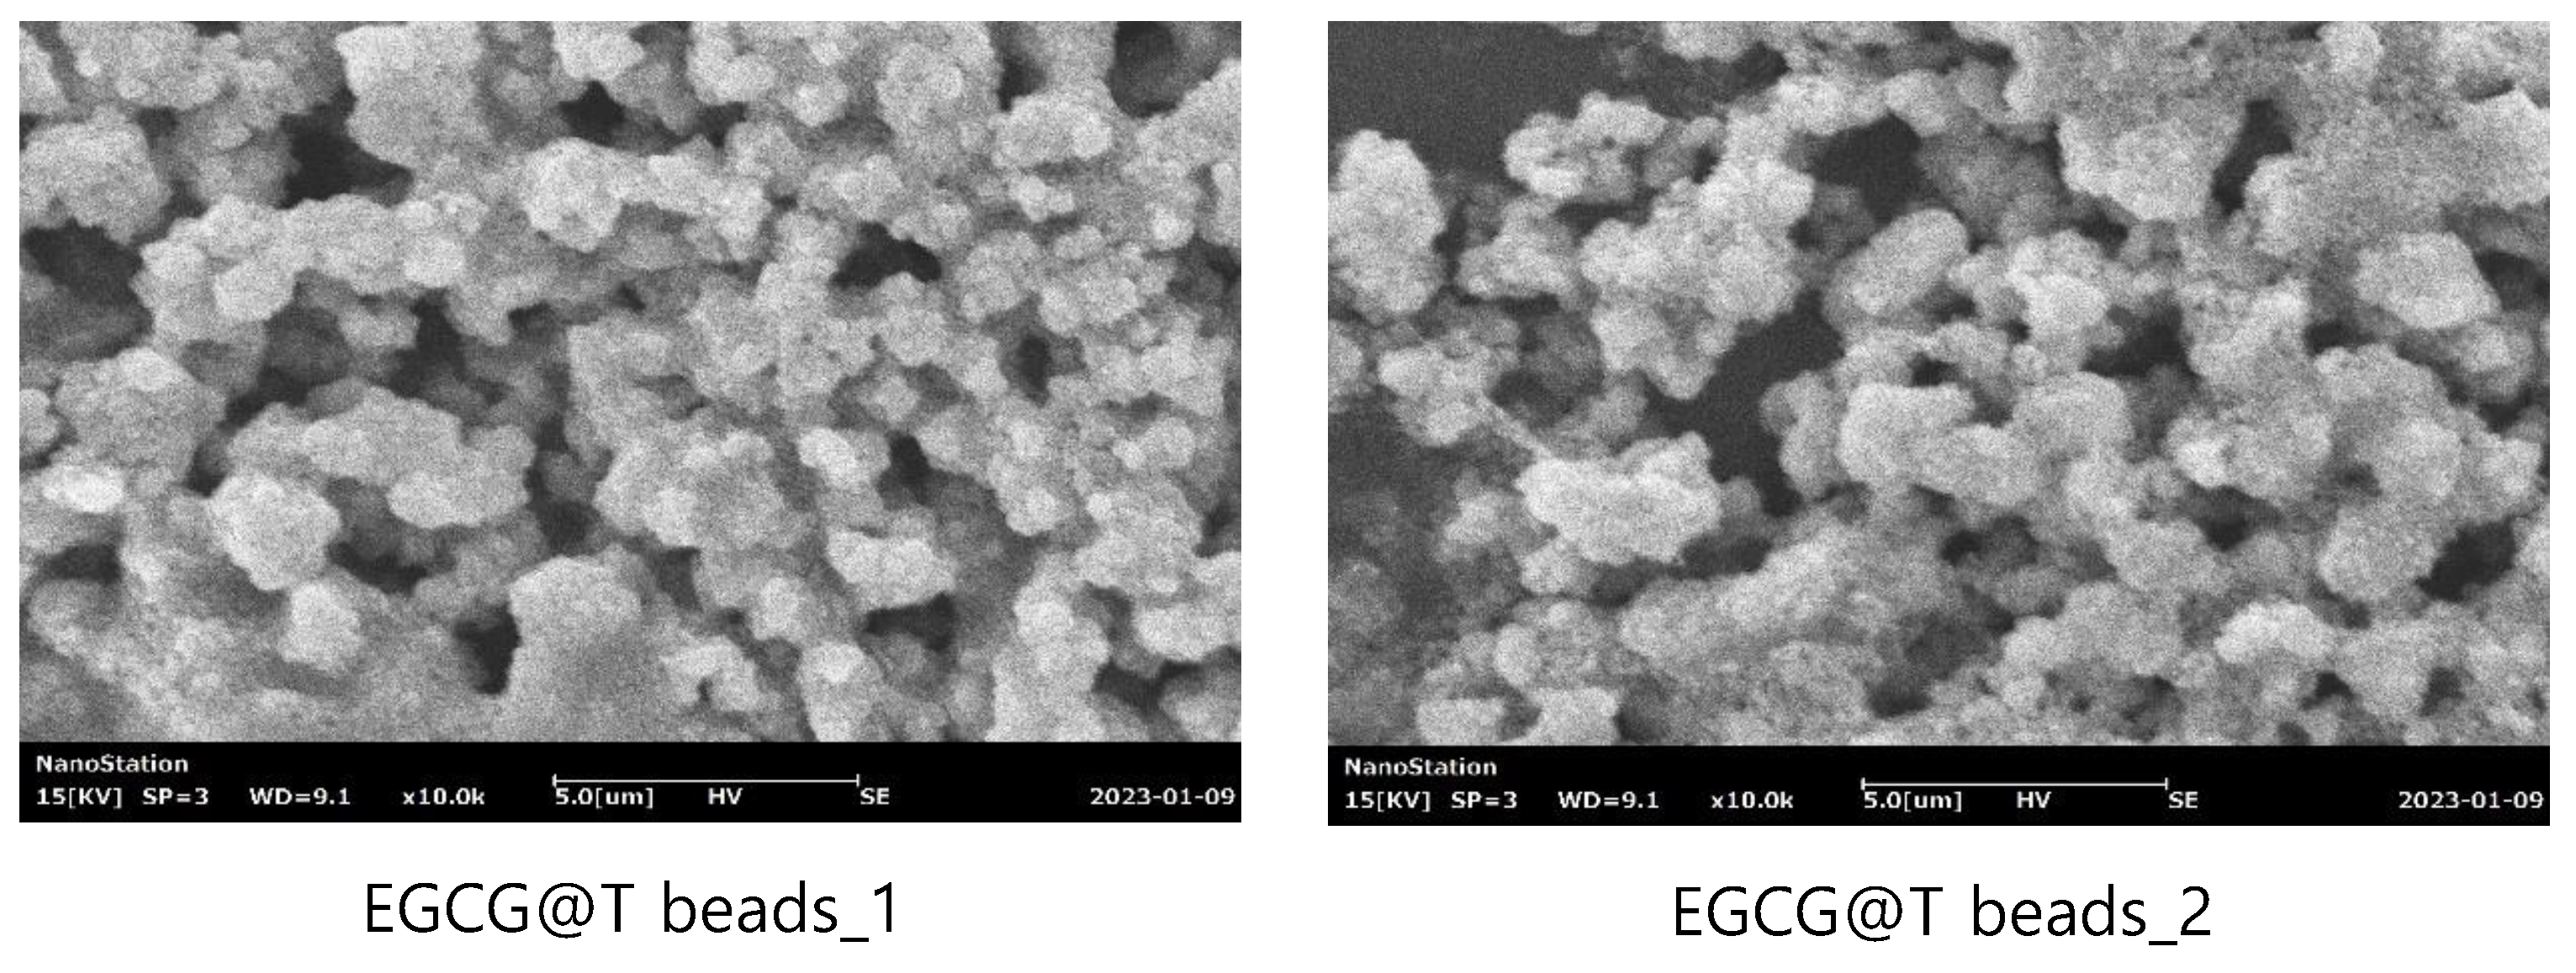
Figure 2.
Chemical composition and molecular structure analysis using FT-IR. (A) Overall analysis results for T-Fe3O4, EGCG, EGCG@T Beads_1, EGCG@T Beads_2 (B) Magnified analysis of the red dotted line area.
Figure 2.
Chemical composition and molecular structure analysis using FT-IR. (A) Overall analysis results for T-Fe3O4, EGCG, EGCG@T Beads_1, EGCG@T Beads_2 (B) Magnified analysis of the red dotted line area.
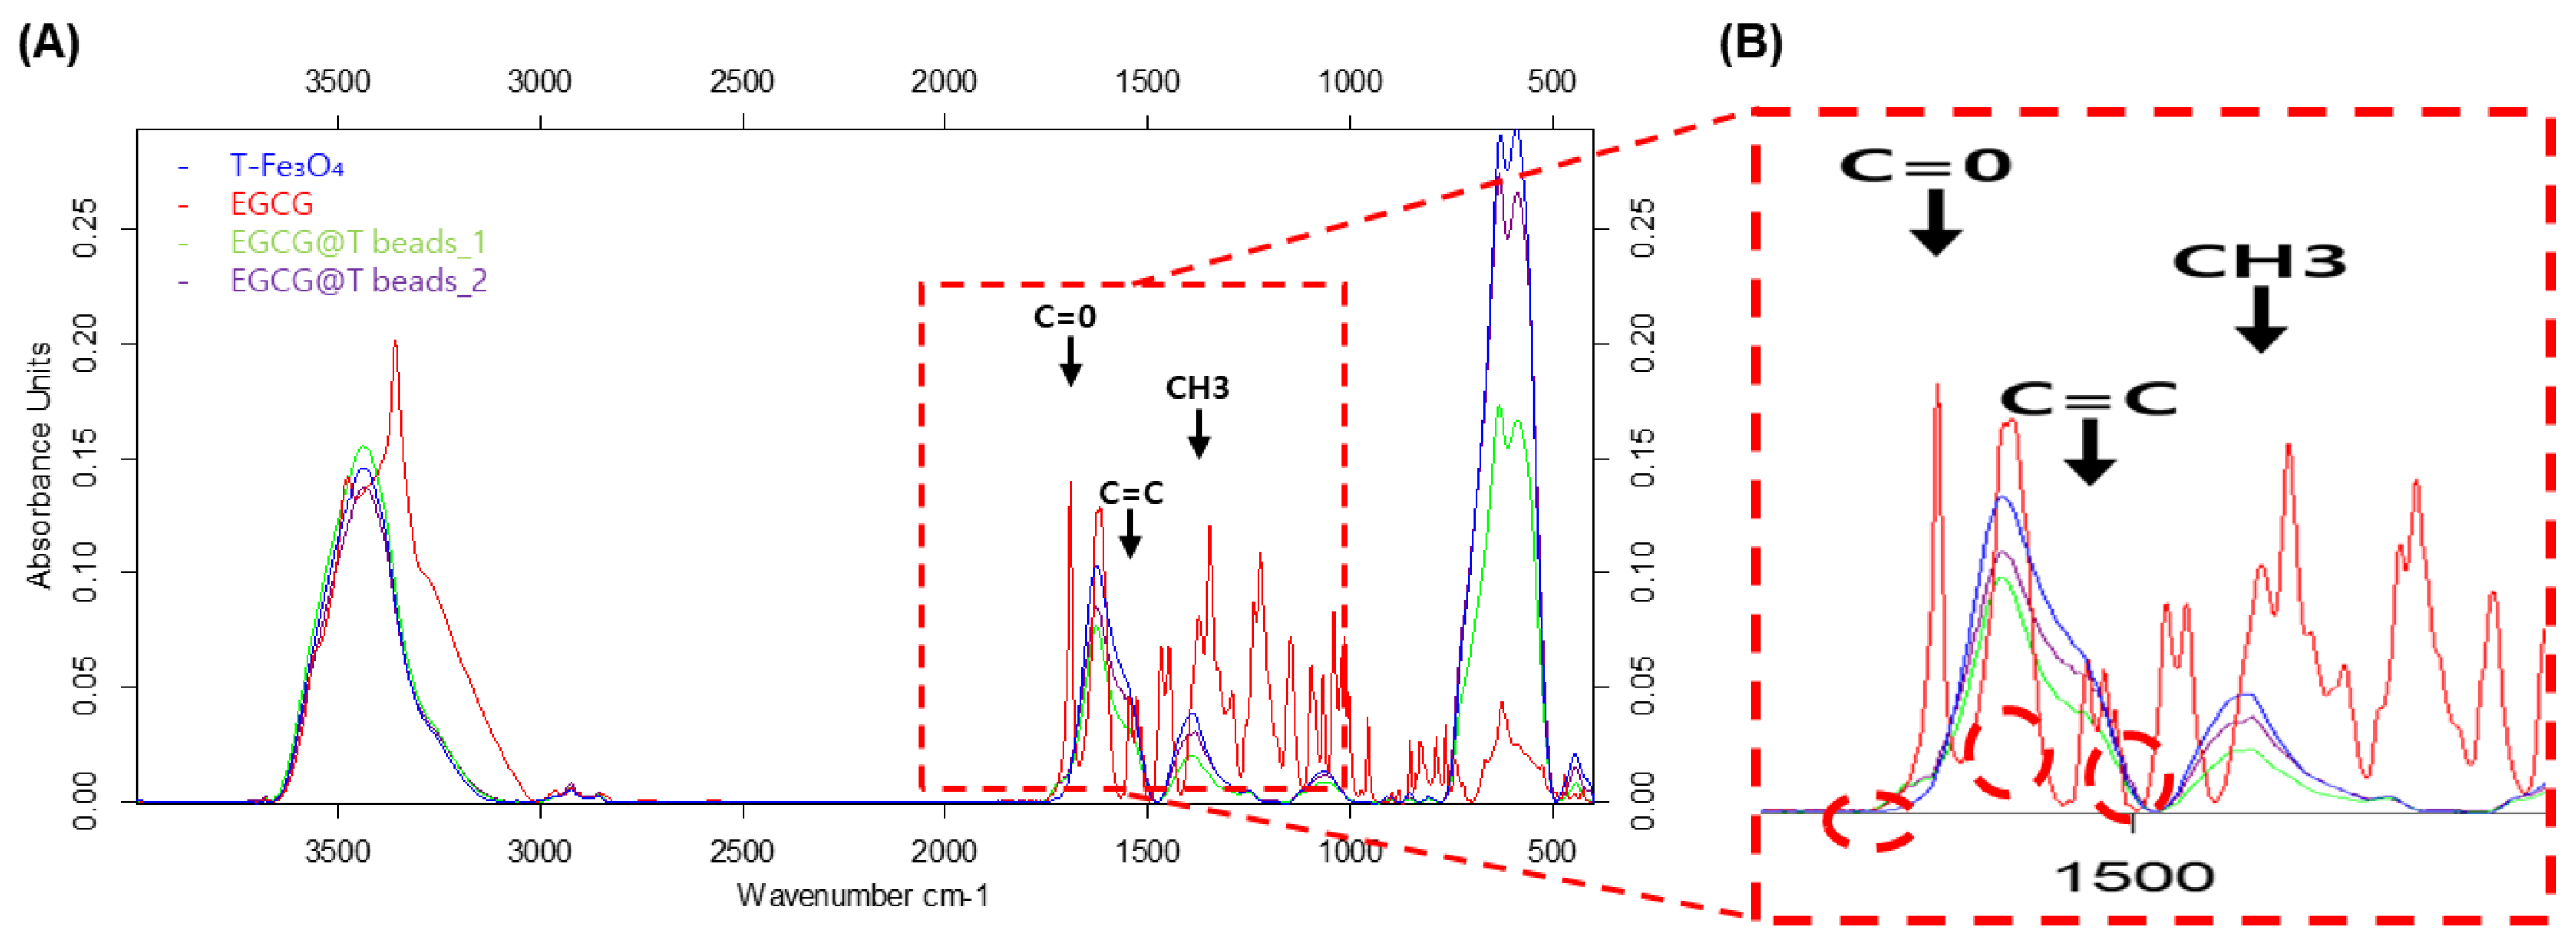
Figure 3.
molecular structure analysis using TG-DTA.
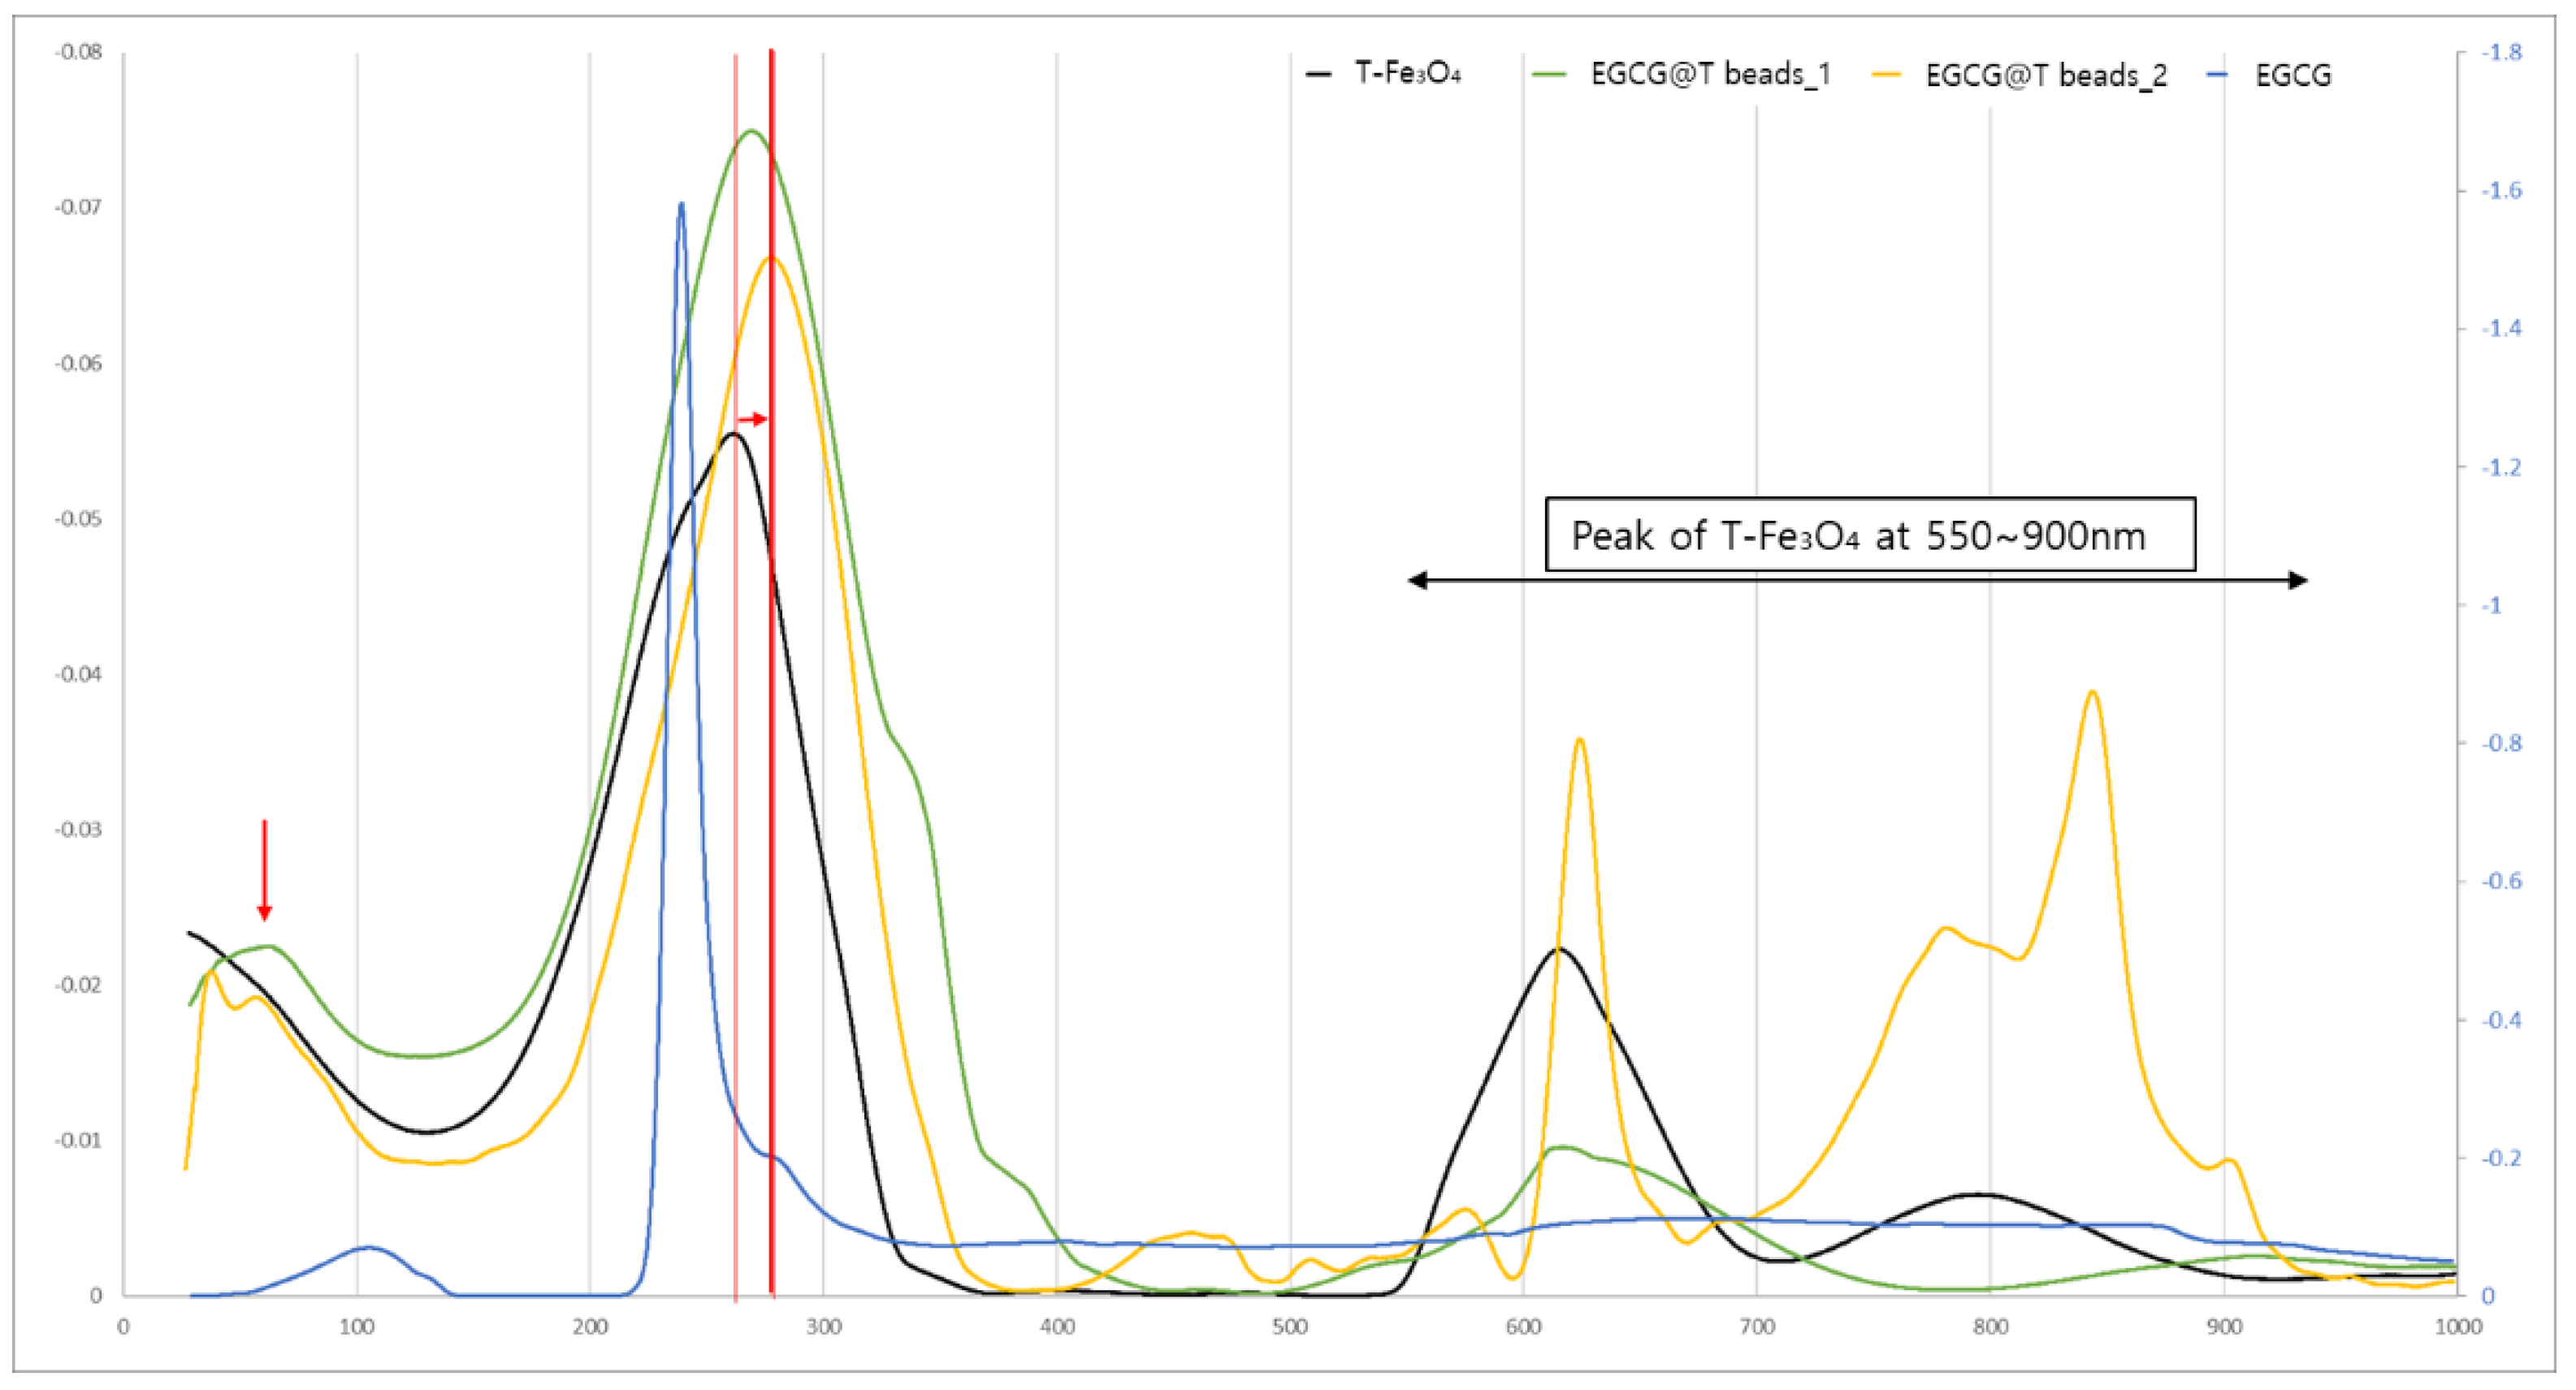
Figure 4.
Analysis of synthesized magnetic bead+ECGC complex according to mixed ratio.
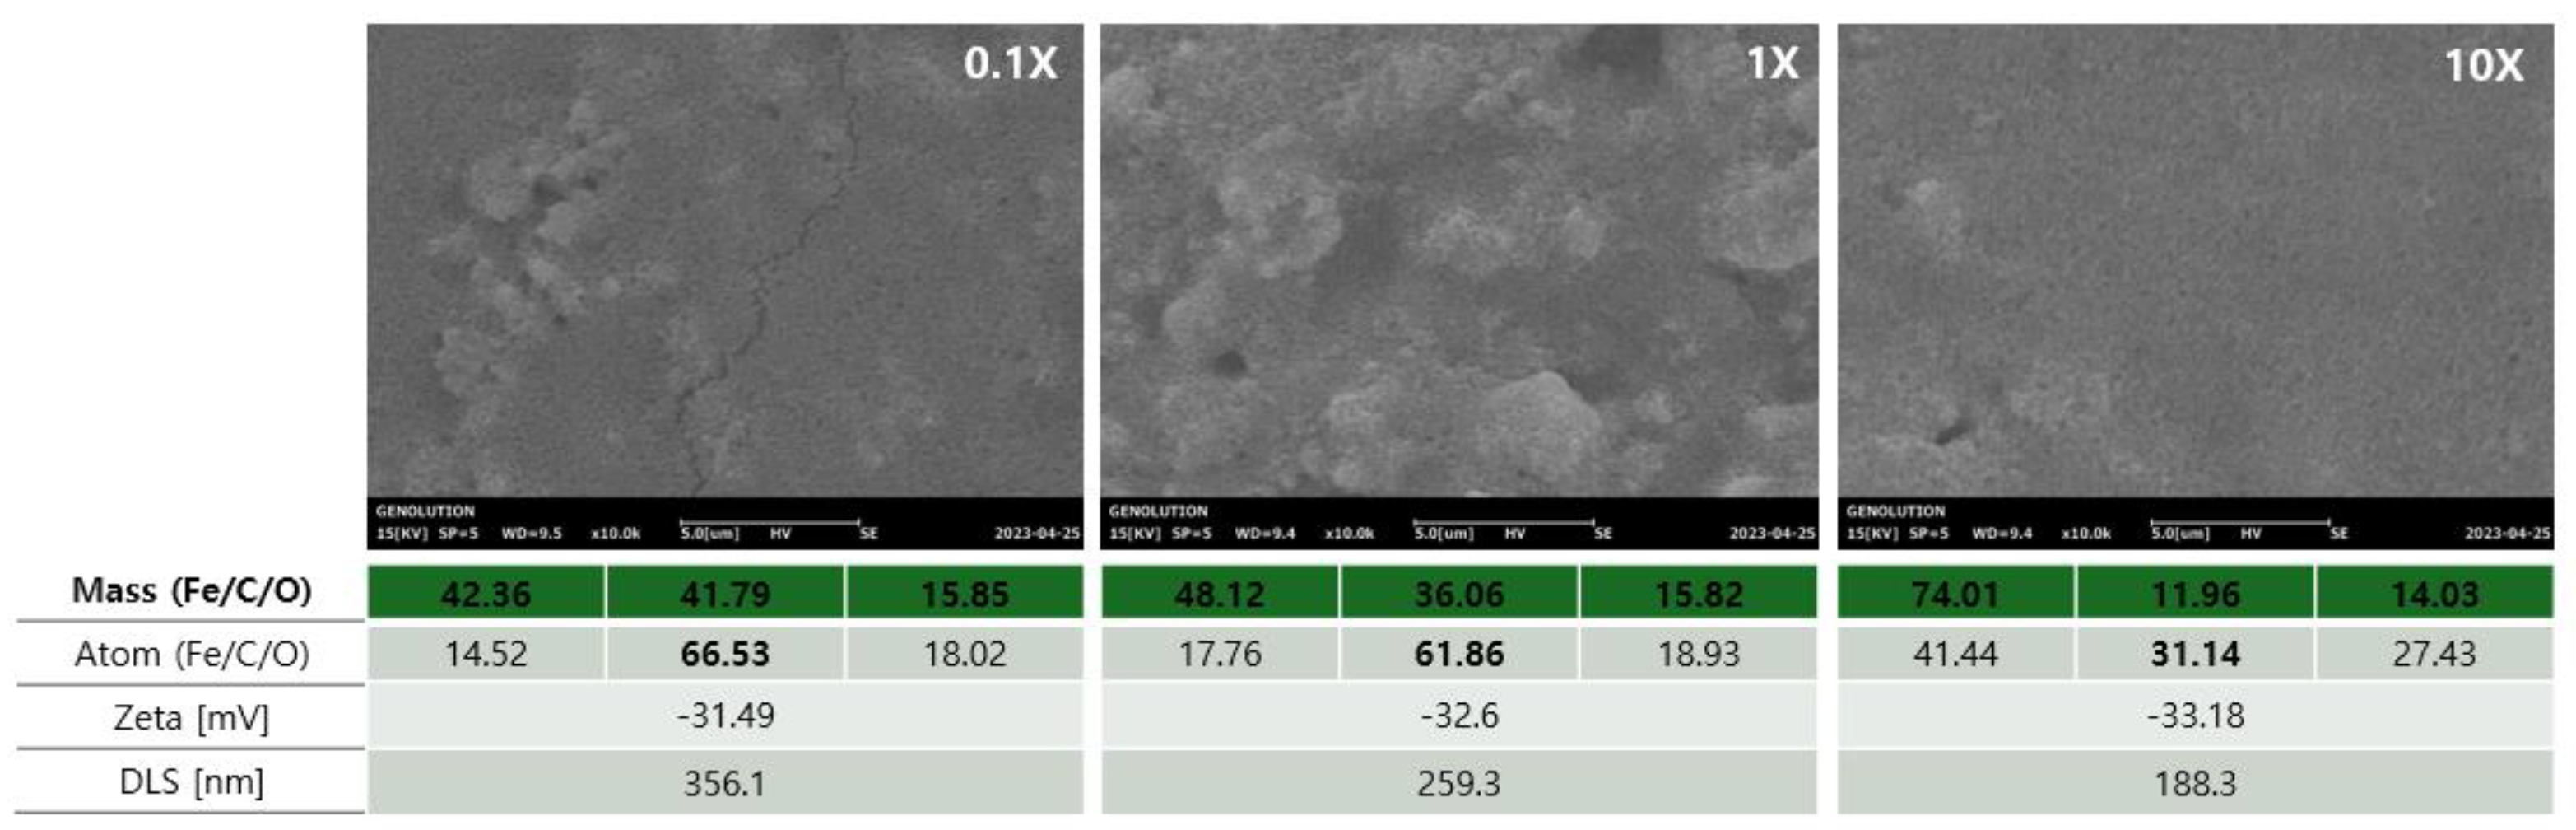
Figure 5.
Comparison of exosome isolation efficiency using different EGCG-modified magnetic bead concentrations.
Figure 5.
Comparison of exosome isolation efficiency using different EGCG-modified magnetic bead concentrations.
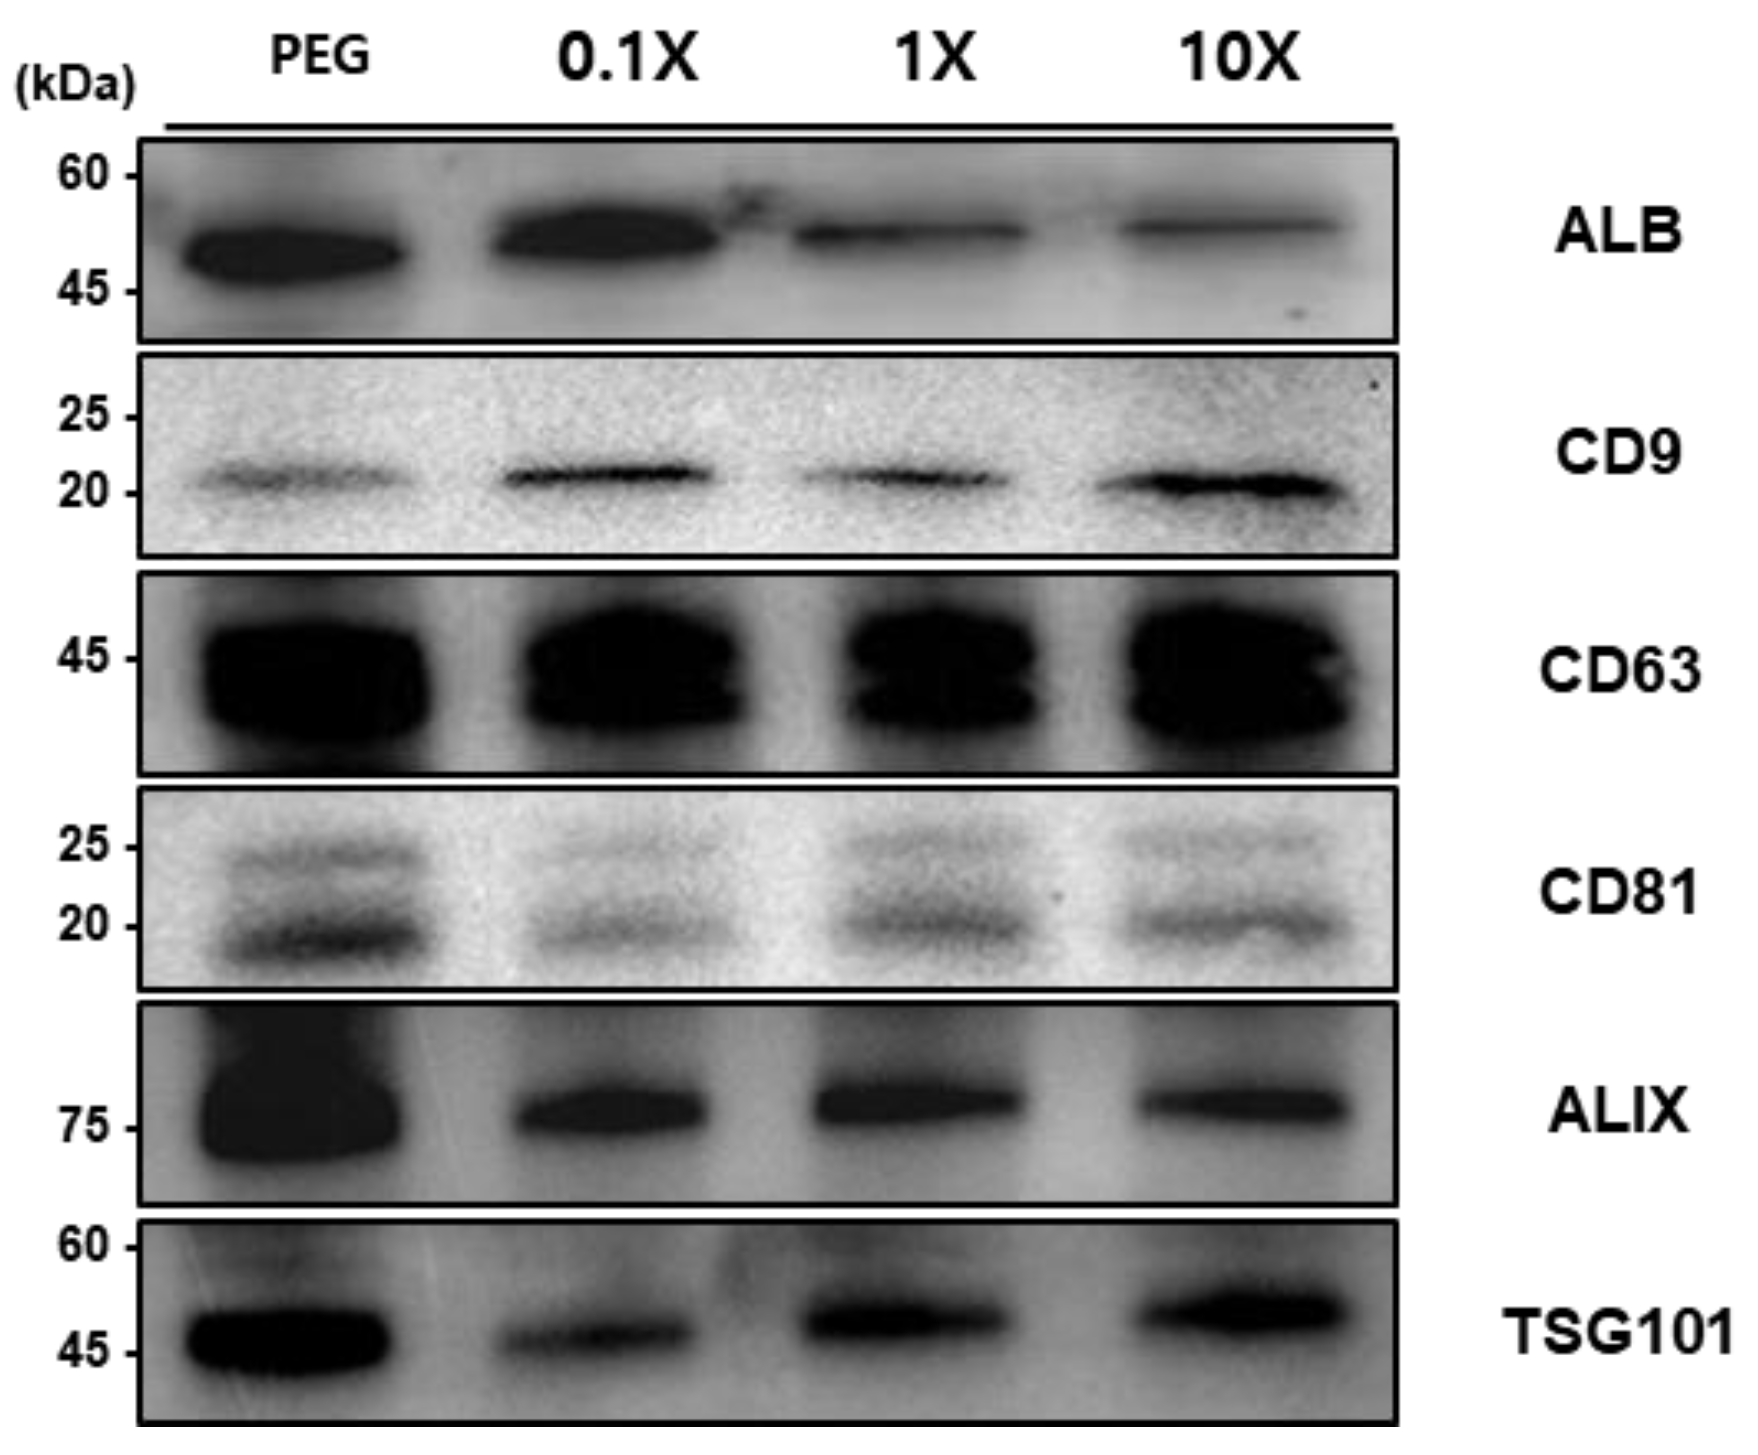
Figure 6.
Optimization of exosome isolation conditions from biological samples.
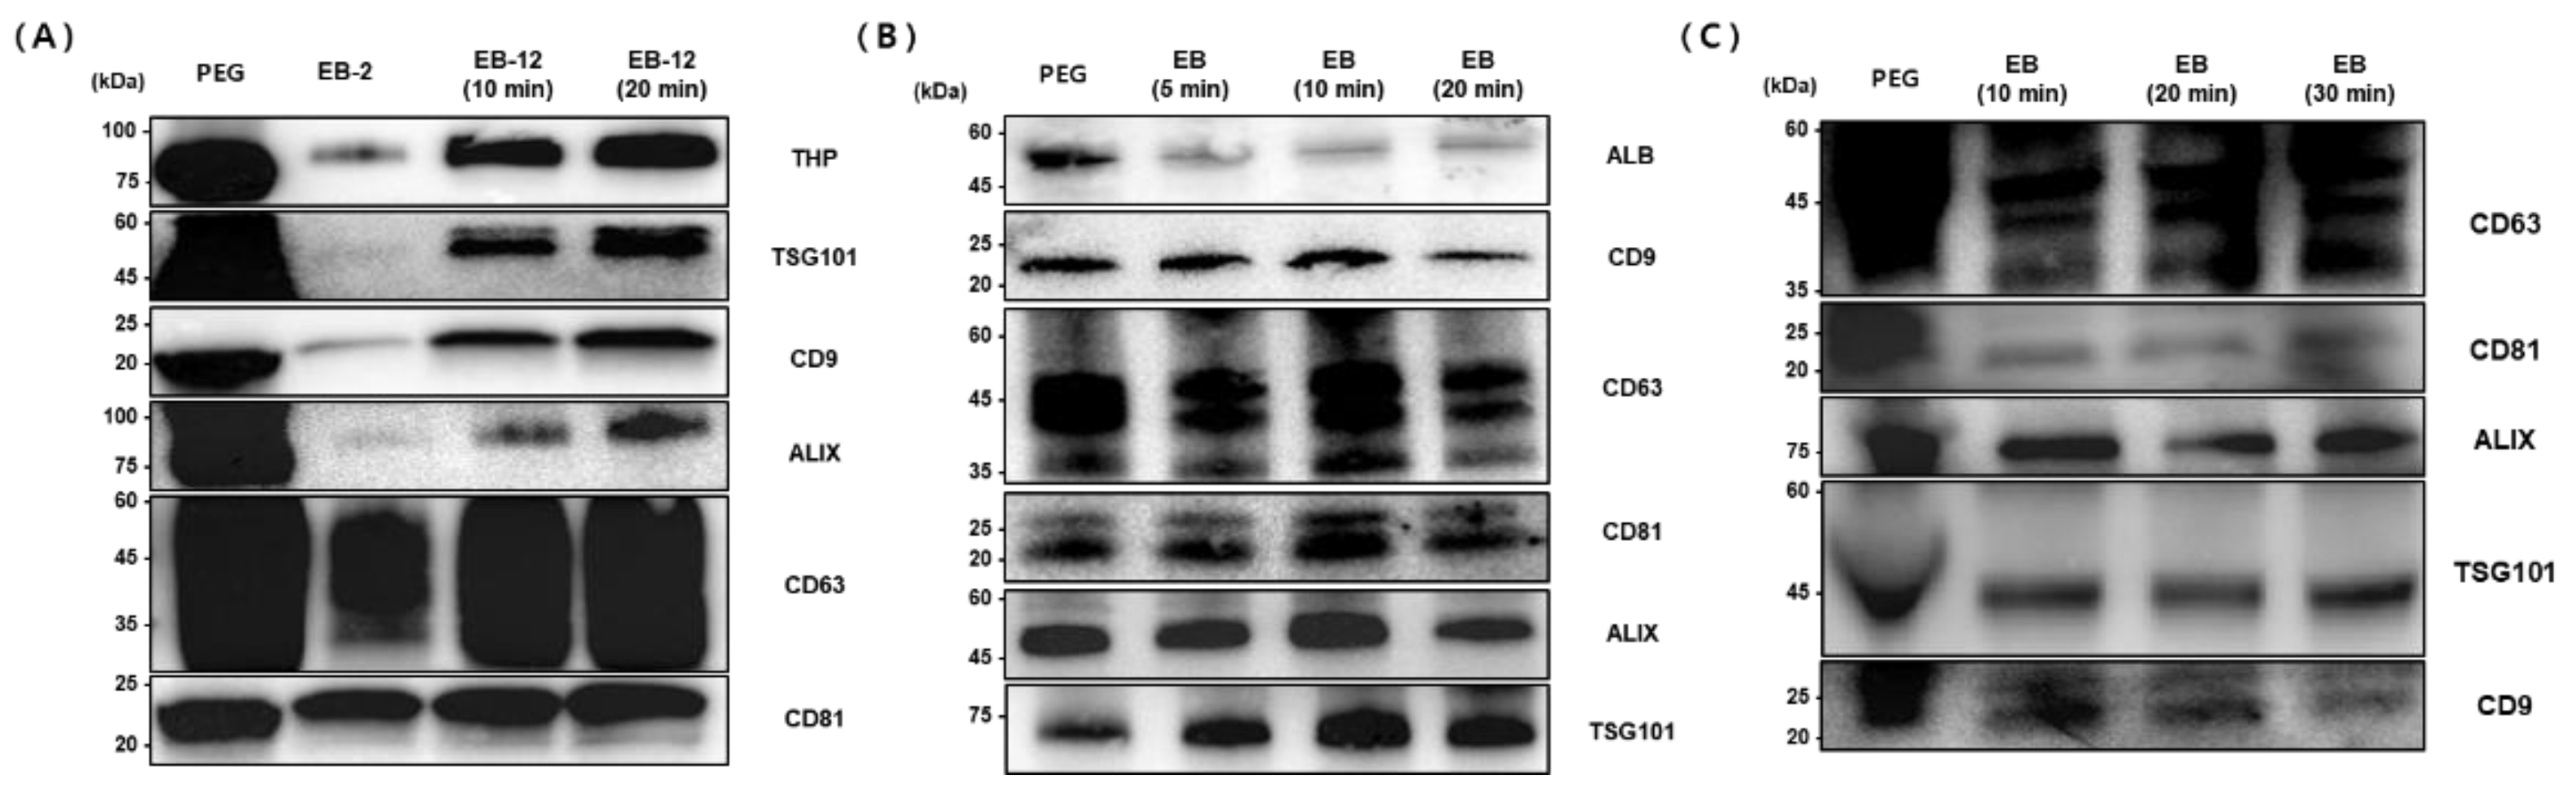
Figure 7.
Comparison of exosomal marker expression profiles under different extraction buffer conditions.
Figure 7.
Comparison of exosomal marker expression profiles under different extraction buffer conditions.

Figure 8.
Evaluation of extraction buffer systems for automated exosome isolation.
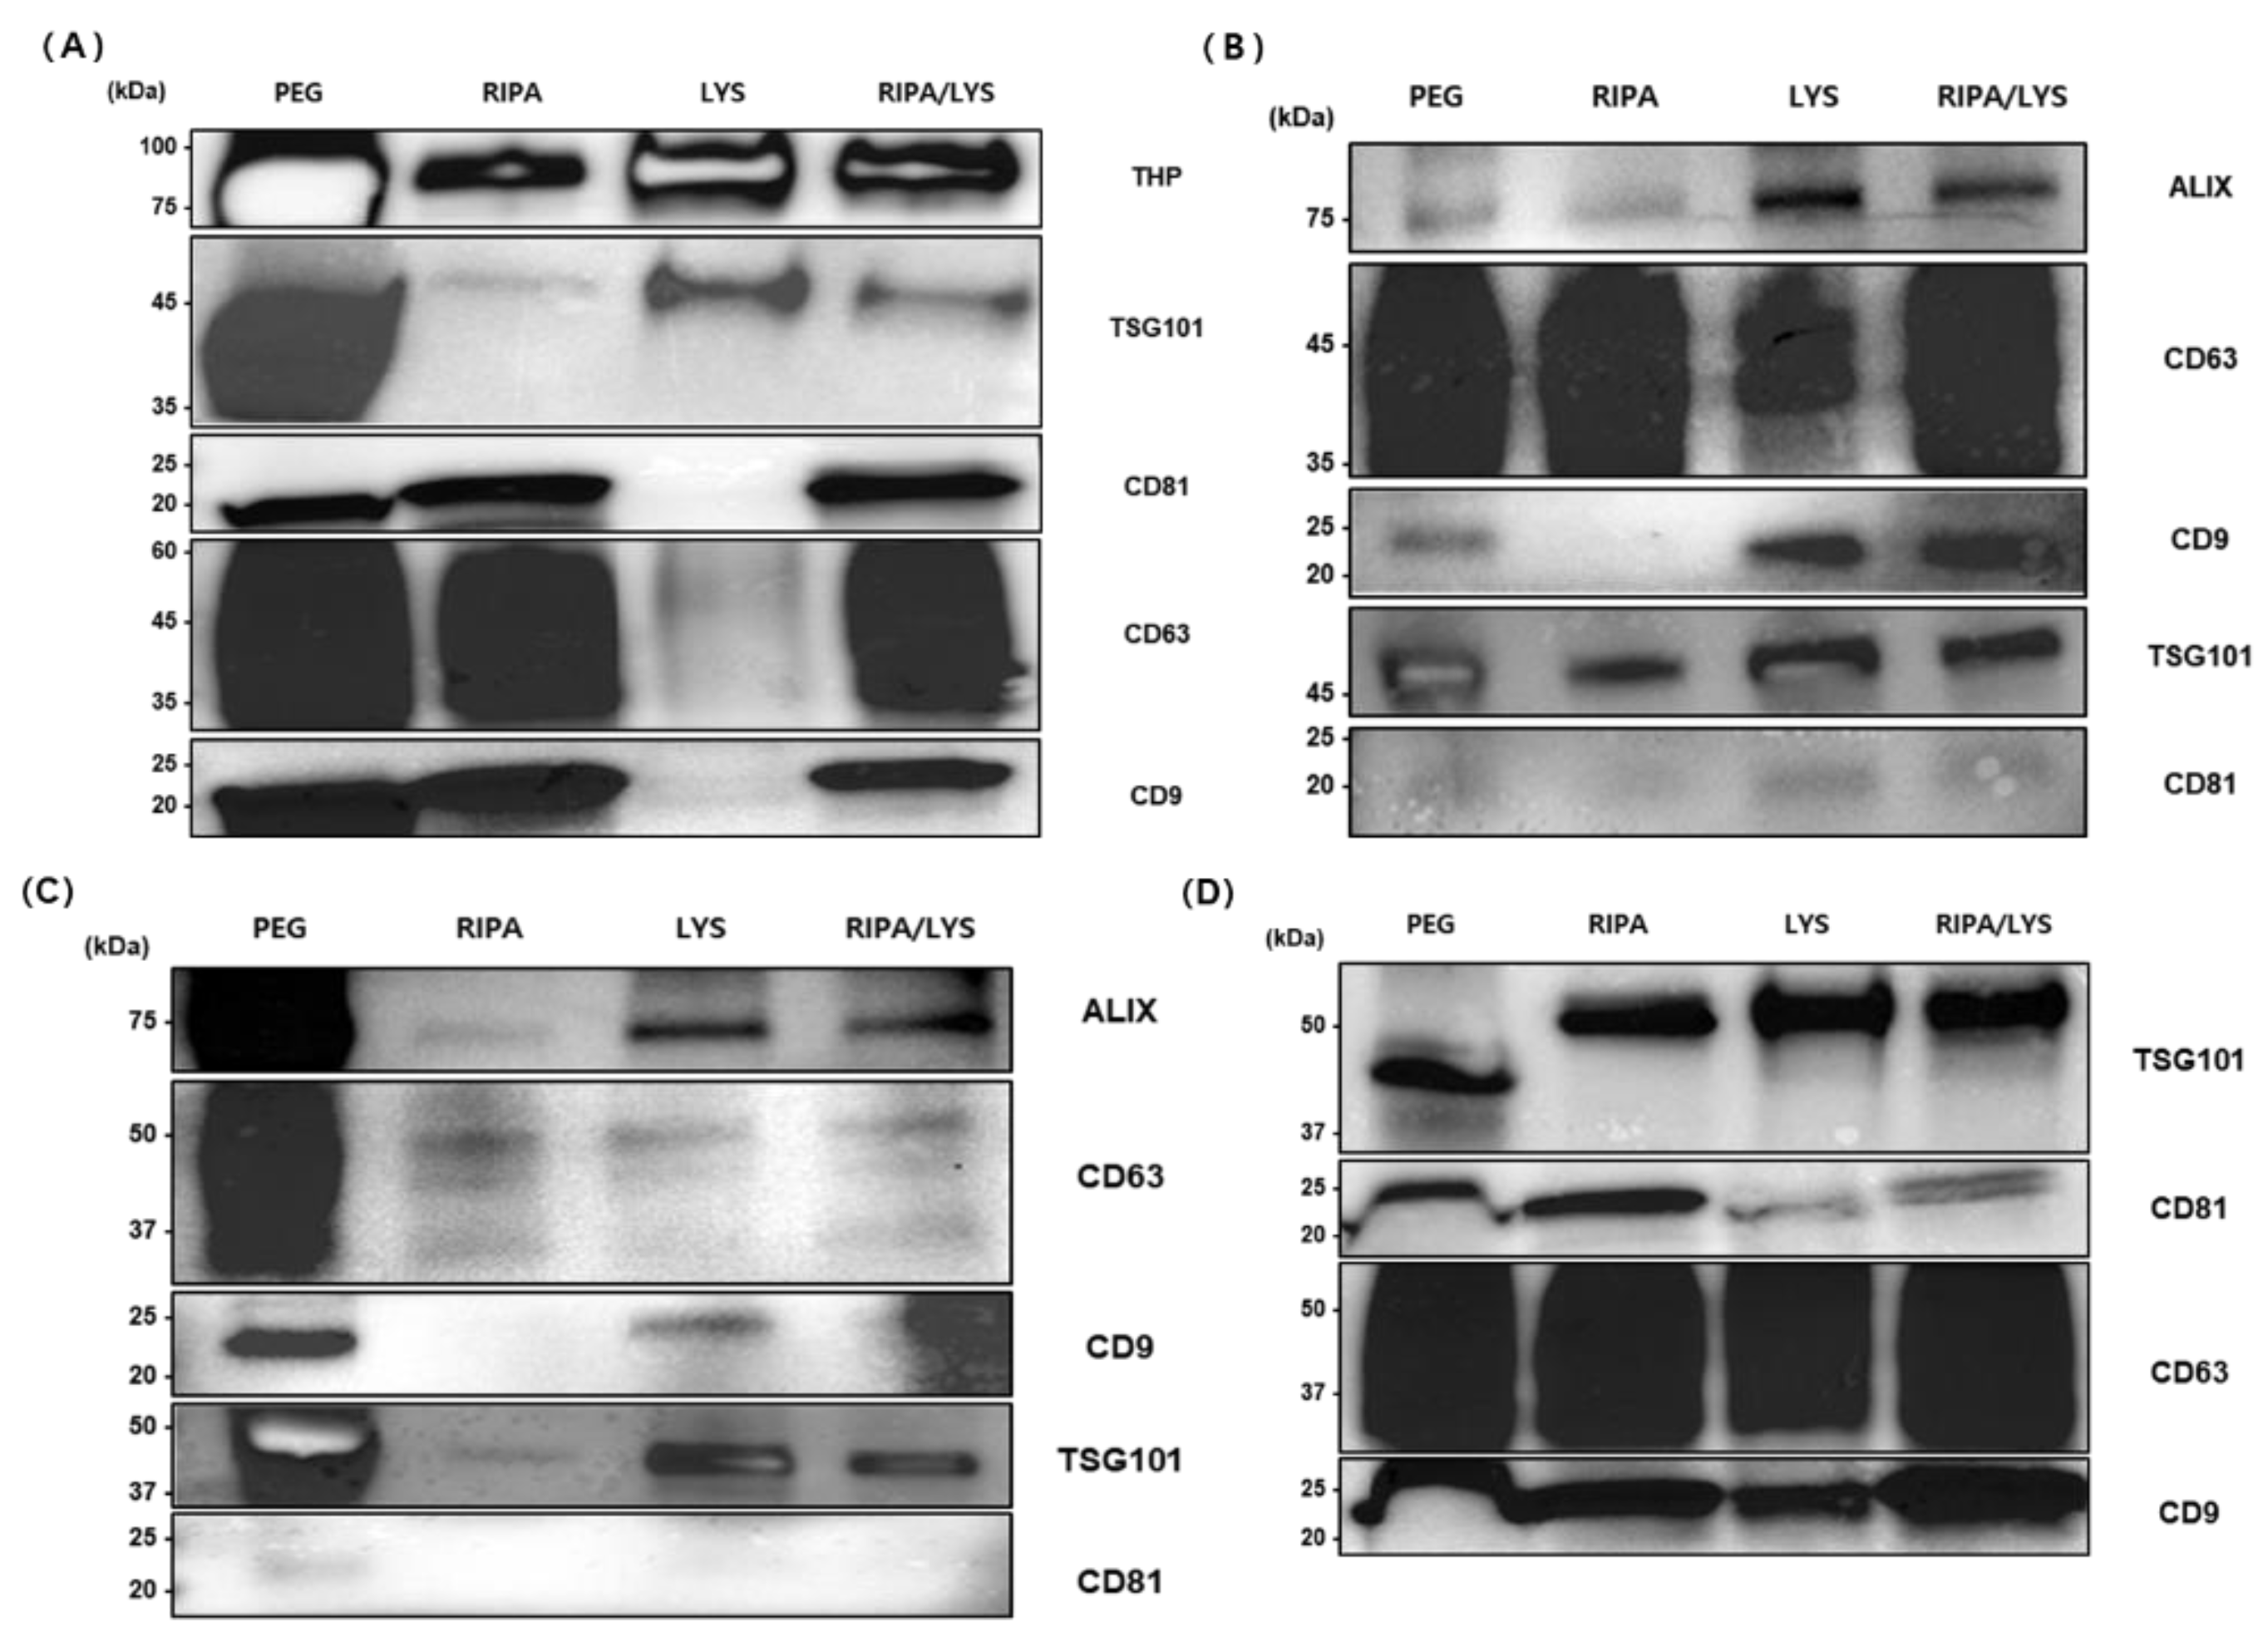
Figure 9.
Comparative analysis of CD63 expression in exosomes isolated from various biological samples using different methods.
Figure 9.
Comparative analysis of CD63 expression in exosomes isolated from various biological samples using different methods.
Disclaimer/Publisher’s Note: The statements, opinions and data contained in all publications are solely those of the individual author(s) and contributor(s) and not of MDPI and/or the editor(s). MDPI and/or the editor(s) disclaim responsibility for any injury to people or property resulting from any ideas, methods, instructions or products referred to in the content. |
© 2025 by the authors. Licensee MDPI, Basel, Switzerland. This article is an open access article distributed under the terms and conditions of the Creative Commons Attribution (CC BY) license (http://creativecommons.org/licenses/by/4.0/).
Copyright: This open access article is published under a Creative Commons CC BY 4.0 license, which permit the free download, distribution, and reuse, provided that the author and preprint are cited in any reuse.


