
Submitted:
15 April 2025
Posted:
15 April 2025
You are already at the latest version
Abstract
Thyroid carcinogenesis has multiple hallmarks, including evasion of tumor suppressors. Reactivation of wild-type p53 function is an ultimate goal in cancer therapy, which requires an understanding of the p53 suppression mechanism specific for the cancer type. MiR-7-5p and IPO7 are implicated in the pathogenesis of several human diseases. This work demonstrates the role of IPO7 supported by miR-7-5p in p53 regulation in papillary thyroid cancer cells. Primary cultured thyroid cells and FFPE thyroid tissues from PTC and benign cases were used. Functional experiments were performed by transfection with IPO7 siRNA or miR-7-5p mimic/inhibitor, followed by apoptosis and luciferase reporter assays, immunoblot assays and RT‒PCR. The expression and subcellular localization of IPO7, p53, MDM2, and ribosomal proteins (RPL11 and RPL5) were studied by immunofluorescence staining and confocal microscopy. The results show that IPO7 is overexpressed in PTC and regulated by miR-7-5p. Modulation of IPO7 expression in cultured thyroid cells altered the nucleocytoplasmic shuttling of p53, MDM2, RPL11 and RPL5 in addition to the p53 protein level and activity. The expression pattern of IPO7, p53 and MDM2 in cultured thyroid cells and clinical thyroid tissue specimens confirmed the association between IPO7 overexpression and reduced p53 stability in PTC. In conclusion, the data here show that p53 level and activity are differentially controlled in malignant and benign thyroid cells through miR-7-5P/IPO7-mediated regulation of RP-MDM2-p53 nucleocytoplasmic trafficking. In PTC, downregulation of miR-7-5p with consequent overexpression of IPO7 might be a protective mechanism used by cancer cells to evade p53 growth suppression during carcinogenesis.
Keywords:
PTC
; miR-7-5p
; Importin 7
; p53
; MDM2
1. Introduction
Thyroid cancer is the most common type of endocrine malignancy, and its incidence has increased worldwide over the last decade [1,2]. Papillary thyroid cancer (PTC) is the most common type of thyroid cancer, accounting for approximately 80% of all cases [3]. Although PTC is considered a nonlethal and treatable cancer, it can develop into aggressive variants and metastasize to neck lymph nodes [4,5]. During transformation and progression, thyroid cancer cells undergo multiple genetic and epigenetic changes, including suppression of p53 activity, which is a pivotal tumor suppressor [6,7]. p53 mutation is common in undifferentiated thyroid tumors (50–80%) but is less frequent in PTC (3–11%) [8,9]. Therefore, inactivation of wild type p53 by other mechanisms is presumed to contribute to PTC development [10]. In our previous work, we demonstrated that miR-7-5p is significantly downregulated in papillary thyroid cancer and regulates the expression of epidermal growth factor receptor (EGFR) in thyroid neoplasms [11,12]. In parallel with its downregulation, miR-7 appears to function as a tumor suppressor in thyroid and other cancers and to indirectly promote the p53 signaling pathway [13,14,15,16,17,18]. On the other hand, miR-7-5p was found to activate oncogenes and to suppress the p53-dependent apoptotic pathway [19,20,21].
Importins are molecules that mediate the nuclear translocation of many proteins and regulate many biological functions, including proliferation, differentiation and cell death [22,23,24]. IPO7 belongs to the importin-β family and is a transporter of many signaling proteins and transcription factors important in tumorigenesis, such as HIF1-α [25], c-Jun [26] and SMADs [27]. IPO7 is implicated in several human malignancies by facilitating the nuclear import of oncogenes to support tumor cell growth, migration, and metastasis [28,29,30,31,32,33]. Few studies have linked IPO7 to p53 regulation [34,35]. A recent study performed in pancreatic cancer tissues showed that the overexpression of IPO7 facilitated the malignant phenotypes of pancreatic cancer cells through an IPO7 and p53 positive feedback loop [35]. There are no previous reports on IPO7 expression, its regulation or its contribution to the pathogenesis of PTC. We report here that IPO7 is overexpressed in PTC, its expression is regulated by miR-7-5p, and it contributes to the suppression of p53 by modulating its nucleocytoplasmic shuttling and stability.
2. Materials and Methods
2.1. Tissue Samples
Fresh and formalin-fixed paraffin-embedded (FFPE) thyroid tissues were obtained from histopathology units at the Kuwait Cancer Control and Farwaniya hospitals. All cases were microscopically reviewed by two consultant histopathologists following the WHO classification of endocrine tumors and as described in our previous published work [12,36,37]. The groups were classified as follows: 1- Classic PTC (cPTC) includes conventional infiltrative PTC composed predominantly of papillae. 2- NIFTPs are noninvasive follicular neoplasms with PTC nuclear features. The FFPE samples used in this study included 30 cPTCs, 11 NIFTPs, and 10 cases of follicular nodular disease (FND) which were used as controls. Fresh thyroid tissues were portions of thyroid specimens from partial or total thyroidectomy that are left over after routine gross and histopathological procedures and included 8 PTCs and 3 FND samples used as controls.
2.2. Thyroid Cell Culture and Transfection Experiments
Primary thyroid cells were isolated, characterized and maintained in culture as described in our previously published work [37]. In all functional experiments, the primary cells were from early passages (Passages 1-3). Nthy-ori 3-1 normal human thyroid follicular epithelial cell line (catalogue # 90011609) was purchased from ECACC and cultured according to manufacturer's recommendations. Cells from passage 10 were used in the functional experiments. For transfection experiments, primary cells and cell lines were plated at a density of 1 × 10⁵ cells/well in antibiotic-free minimal essential media. Transfection was performed using 15 µl of HiPerFect Transfection Reagent (Qiagen) and 0.5 ng of miScript miR-7-5p mimic (Qiagen, Gene globe ID-MSY0000252), or inhibitor (Qiagen, Gene globe ID-YI04100814-DDA), 10 nM IPO7 siRNA (Qiagen, Gene globe ID-SI00088081), or negative control (Qiagen). The cells were incubated for 48 hours before RNA/protein extraction and subsequent experiments. The success of the transfection was confirmed by testing the expression of IPO7 and miR-7-5p in treated cells by real-time PCR.
2.3. Luciferase Reporter Assay
The cell death signaling pathways were tested using the Cignal Finder Cancer Pathway Reporter Array (Qiagen). Transfected cells and control cells were plated at a density of 8 × 10⁴ cells/well in 96-well plates containing transcription factor-responsive reporters, negative controls, and positive controls. After 48 hours of incubation, the firefly luciferase activity was stopped by adding 100 µl of Dual-Glo® Stop & Glo® Reagent (Promega). Then, 100 µl of Dual-Glo® Luciferase Reagent (Promega) containing buffer and substrate was added, and the luminescence was measured by a Thermo Scientific Appliskan Plate Reader. Firefly/Renilla activity ratios were generated for experimental and negative control transfections. The change in the activity of each signaling pathway was determined by comparing the normalized luciferase activities of the reporter in experimental versus control transfectants using the following formula: fold change = (firefly/Renilla ratio of experimental sample)/(firefly/Renilla ratio of control sample). All transfections were performed in quadruplicate for each of the reporter assays. Transfection efficiency was estimated by observing GFP expression (a constitutively expressing GFP construct containing Monster Green® Fluorescent Protein) in the positive control wells by fluorescence microscopy. A transfection efficiency higher than 80% was considered acceptable.
2.4. Reverse Transcription and Quantitative Real-Time PCR Amplification
Total RNA from cultured cells and paraffin-embedded thyroid tissues was isolated using TRIzol (Ambion) and miRNeasy FFPE Kit (Qiagen, Hilden, Germany), respectively, following the manufacturers’ instructions. Reverse transcription of cDNA and RT-PCR were performed using miScript II RT Kit (Qiagen), RT² SYBR Green Mastermix (Qiagen) and RT² qPCR Primer Assay-specific primers (Qiagen), following standard procedures. HPRT was used as the housekeeping gene, and PCRs were run on an ABI 7500 Fast Block real-time PCR machine. All samples were run in triplicate, and the mean CT value with standard deviation was calculated for each sample. The expression in the test groups was compared to that in the control group using the formula (ΔΔCT = ΔCT of test group − ΔCT of control group), and the results are presented as the fold change (2−ΔΔCT) [38].
2.5. Immunofluorescence and Confocal Microscopy
The expression and subcellular localization of different molecules in FFPE tissues and cultured cells were tested by indirect immunofluorescence staining and confocal microscopy following standard procedures. The FFPE tissues stained included 30 PTC, 10 NIFTP and 10 FND cases. The antibodies used were anti-p53 (Cell Signaling), anti-MDM2 (Novus Biologicals), anti-RPL5 (Protein Tech), anti-RPL11 (Novus Biologicals) and anti-IPO7 (Protein Tech). Secondary antibodies conjugated to Alexa Fluor 555, Alexa Fluor 488 (Invitrogen) or HRP (Dako) were used. Staining was assessed qualitatively and scored as positive or negative. A positive score was given only when more than 10% of the tumor follicular cells showed non-ambiguous staining. Positive staining in immune cells or other cells of the tumor microenvironment was not considered positive. The expression and cellular localization of miR-7-5p were studied by in situ hybridization using miRCURY LNA miRNA Detection Probes (QIAGEN). The protocol is described in our previous work [12]. LSM 700 and 800 laser scanning confocal microscopes (Zeiss, Germany) and Zen software (version 14.0.0.201, Zeiss) were used for acquisition and analysis of images. Mean fluorescence intensity is provided in treated cells and controls. Mean nuclear localization intensity is calculated from the colocalization data (the number of green/red pixels that colocalize with DAPI nuclear stain).
2.6. Immunoblotting
Protein extracted from treated cells or controls (20 μg) was mixed with loading buffer and rainbow marker (14,300–220,000 Da, Amersham Pharmacia Biotech Ltd., U.K.). Electrophoresis was performed using SDS-PAGE (SDS-PAGE; 5–14% polyacrylamide gradient gels). Protein was transferred to nitrocellulose membranes at a stable current of 75A for 75 minutes at room temperature. Membranes were stained with Ponceau and used to estimate total proteins. Blocking was performed for 1 h at room temperature with 1x TBS 1% casein blocker (Bio-Rad). The membranes were incubated with anti-p53 antibody (Cell Signaling) for one hour at room temperature followed by secondary antibody. Protein bands were detected by chemiluminescence (ECL) and the quantity of p53 was normalized to the total protein using Image Lab Software Version 6.1, 2017, Bio-Rad Laboratories, Inc.
2.7. Viability Assay
Cultured cells were harvested by trypsinization and then centrifuged and washed with cold PBS. Viable cells were counted by Trypan Blue Exclusion Test using Beckman Coulter VI-Cell XR. For apoptosis assay, the cells were resuspended in 400 µl of binding buffer (Invitrogen). Two microliters of both Annexin V and propidium iodide were added, and the cells were incubated on ice for 20 min. The stained cells were analyzed by flow cytometry following standard procedures.
2.8. Statistical Analysis
The gene expression levels in different groups were compared using Student’s t test. The difference in gene and protein expression levels between matched samples (transfected with IPO7 siRNA or miR-7-5p mimic/inhibitor versus control) was determined using paired-sample t tests. In all tests, p values <0.05 were considered to indicate statistical significance.
3. Results
3.1. Expression of IPO7 and p53 in PTC Clinical Samples
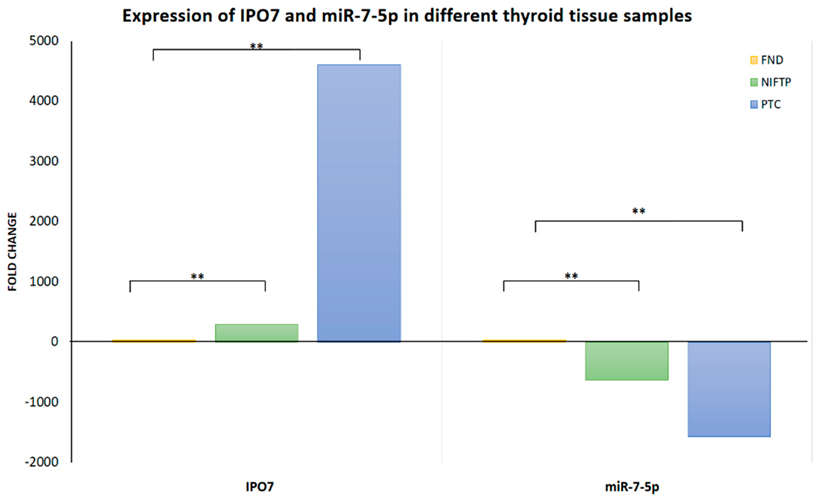
IPO7 mRNA expression is significantly upregulated in PTC and NIFTP compared to FND (Table 1). The high IPO7 expression is associated with a significant downregulation of miR-7-5p (Table 1). Immunofluorescence staining and in situ hybridization experiments confirmed the high expression of the IPO7 protein and the low expression of miR-7-5p in PTC tissue samples while in FND there was a low expression of IPO7 and high expression of miR-7-5p (Figure 1a). For p53 expression, there was no significant difference in p53 mRNA expression between PTC, NIFTP and FND (Table S1). However, immunofluorescence stain showed that p53 is not expressed in tumor cells in all PTC samples tested, while in FND, p53 was evident in the nuclei and cytoplasm of follicular cells (Figure 1b). MDM2 appeared in the nuclei and cytoplasm of follicular cells in PTC and FND tissues (Figure 1b). Additional immunohistochemical staining confirmed the lack of p53 expression and the high expression of IPO7 in PTC samples (Figure S1a).
 |
3.2. p53 Activity Is Suppressed in PTC and Is Rescued by miR-7-5p Gain of Function
Primary cultured thyroid cells from PTC and FND samples were prepared for functional studies. Luciferase assay showed that the endogenous activities of p53, RB, C-MYC, NFKB and JNK are significantly lower in PTC than in FND cells (Table 2). miR-7-5p gain-of-function resulted in a significant reduction in IPO7 expression in all the five PTC primary cell cultures with p < 0.002 (Table 3). Luciferase assay showed that miR-7-5p gain of function restored the activity of the p53 and Myc pathways in four out of the five PTC primary cell cultures with p = 0.04 and p = 0.01 respectively (Table 3). Effects on other cell death pathways were not statistically significant. Apoptosis and viability assays showed that miR-7-5p gain of function increased the number of dead/apoptotic cells and reduced the viability of PTC cultured cells (Figure S2).
3.3. IPO7 Partial Depletion Increased the Availability of p53 Protein and the Nuclear Colocalization of MDM2 with the Ribosomal Proteins RPL11 and RPL5 in Primary Cultured PTC Cells
To investigate the effect of IPO7 on p53, primary cultured PTC cells were transfected with IPO7 siRNA. Partial depletion of IPO7 expression was confirmed by RT-PCR and immunofluorescence staining (Table S2, Figure S1b). Partial depletion of IPO7 resulted in a significant increase of p53 protein (p = 0.0026) (Figure 2a) and in the accumulation of p53 and MDM2 in the nuclei of the transfected PTC cells (Figure 2b). Partial IPO7 depletion also significantly increased the expression of miR-7-5p (Table S2). Investigation of the involvement of ribosomal proteins by immunofluorescence revealed that RPL11 strongly accumulated in the nuclei of cultured PTC cells transfected with IPO7 siRNA, while it predominantly localized to the cytoplasm in the control cells (Figure 3a). RPL11 colocalized with MDM2 in the cell nuclei after IPO7 depletion (Figure 3a). RPL5 showed a similar pattern of nuclear accumulation and colocalization with MDM2 in the treated cells (Figure 3b).
3.4. p53 Regulation by miR-7-5p/IPO7 in the Normal Thyroid Cell Line Nthy-ori 3-1
Nthy-ori 3-1 is a normal thyroid cell line that we used to confirm the regulation of p53 by miR-7-5p/IPO7. Nthy-ori 3-1 cells express miR-7-5p and a low level of IPO7 (Figure 4a). To recapitulate the expression profile in PTC, loss-of-function experiments using miR-7-5p inhibitor were performed. Inhibition of miR-7-5p increased the expression of IPO7 (Figure 4a, Table S3). The level of p53 protein expression in Nthy-ori 3-1 cells is reduced after miR-7 inhibition and is rescued with IPO7 partial depletion (Figure S3). Nthy-ori 3-1 cells showed a shift of p53 and MDM2 from the nuclei to the cytoplasm after miR-7-5p inhibition (Figure 4b). RPL11 and RPL5 were found to be localized with MDM2 in the nuclei of untreated Nthy-ori 3-1 cells (Figure 4c,d). Upon inhibition of miR-7-5p, MDM2 and RPL11 appeared to be more focused in the cytoplasm, while RPL5 remained to be strongly detected in the nuclei and cytoplasm of the treated cells (Figure 4c,d).
4. Discussion
The new WHO classification divided thyroid tumors into benign, low-risk, and malignant neoplasms based on pathologic features, molecular characteristics, and biological behavior (36). Classic PTC is classified as a high-risk subtype of malignant follicular cell–derived neoplasm. Noninvasive follicular thyroid neoplasms with papillary-like nuclear features (NIFTPs) were classified as low-risk follicular cell–derived neoplasms. Multifocal hyperplastic lesions are now referred to as “thyroid follicular nodular disease (FND)” and are classified as benign conditions [36]. Many genes with diverse cellular functions have been shown to contribute to the PTC phenotype and functional characteristics [4,5,6,7,10]. This is the first report on IPO7 expression and its potential contribution to PTC pathogenesis. Here, we demonstrated that the IPO7 gene is overexpressed in PTC and NIFTP compared to FND (Table 1). In our samples, no correlation of IPO7 expression with any of the aggressive tumor characteristics were detected. The IPO7 protein appeared to be highly expressed in the cytoplasm and nuclei of tumor cells (Figure 1a). These results agree with the profile reported in the Protein Atlas database [Human Protein Atlas]. IPO7 expression inversely correlated with miR-7-5p expression and could be reversed with miR-7-5p gain of function (Table 1, Table 3). This profile of IPO7 and miR-7-5p regulation, which is consistent across high-risk (PTC) and low-risk (NIFTP) neoplasms, suggests that IPO7 and miR-7-5p are involved in neoplastic transformation rather than in the progression of thyroid tumors.
Altered function of wild-type p53 has been described in thyroid cancer and has been attributed to multiple mechanisms affecting p53 transcriptional activity, protein stability, or downstream signaling [39,40]. Our results showed reduced activity of p53 and other signaling pathways involved in cell death and apoptosis in PTC compared to FND (Table 2). MiR-7-5p gain of function restored the activity of the p53 pathway in PTC cells (Table 3). It is well established that MDM2 negatively regulates p53 by binding to its N-terminal domain and blocking its access to the transcription machinery or by targeting it for proteasomal degradation. During these regulatory activities, MDM2 and p53 adopt diverse intracellular localizations that have functional consequences. MDM2 export to the cytoplasm is required for the degradation of p53, while inhibition of this export modifies the ability of MDM2 to block p53 and leads to p53 stabilization and activation [41,42,43,44,45,46]. Our results show that in PTC, MDM2 is localized to the cytoplasm of tumor cells with no evidence of p53 protein presence. In FND, both p53 and MDM2 are observed in the cytoplasm and nuclei of follicular cells (Figure 1b). This p53/MDM2 expression pattern in our samples agreed with that published in the Human Protein Atlas. Reduced nuclear expression of p53 has been previously reported in cancers such as melanoma, breast and colorectal cancers [47,48]. In PTC, one study reported that nuclear accumulation of the p53 protein is only associated with the dedifferentiation of papillary carcinoma [49]. Our experiments demonstrated that partial depletion of IPO7 in PTC cells significantly increased the level of p53 protein and resulted in the accumulation of p53 and MDM2 in the cells nuclei (Figure 2a,b). These results indicate that IPO7 plays a role in P53 dynamics and stability in PTC.
Carcinogenesis is usually associated with an increase in ribosome biogenesis, which is believed to be one of the consequences of tumor suppressors' altered functions [50,51]. Loss of function of p53 results not only in loss of cell proliferation control but also in upregulation of ribosomal genes [52,53,54,55]. Disturbance of ribosomal biogenesis and nuclear transport triggers the accumulation of ribosomal proteins (RPs), such as RPL5 and RPL11, in the nucleoplasm. The binding of RPL5 and RPL11 to MDM2 and the inhibition of its ubiquitin ligase activity have been suggested to be critical steps in p53 activation in response to cellular stress. RPL5 and RPL11 bind and sequester MDM2 in the nucleoplasm, resulting in p53 stabilization and activation and consequent proliferation arrest [56,57,58,59]. Cancer cells use multiple methods to evade this mechanism and continue to grow [60,61]. IPO7 has been linked to the ribosomal biogenesis stress response in one study that showed that partial IPO7 depletion resulted in RPL5/RPL11-mediated inhibition of MDM2 and p53 nuclear localization and activation [34]. In agreement with these findings, our results showed that partial IPO7 depletion increased the nuclear accumulation of RPL5 and RPL11 along with MDM2, which increased p53 stability (Figure 3a,b). In all experiments, RPL11 and RPL5 appeared to be highly expressed in the cytoplasm of PTC cells and in the nuclei and cytoplasm of normal thyroid cells, Nthy-ori 3-1 cells (Figure 3a,b; Figure 4c,d). It is worth to mention here that RPL11 was found to downregulate the activity of E2F1, p53 and c-Myc [62,63], which support our results showing reduced activity of these pathways in PTC cells (Table 2). In summary, this work showed that high expression of IPO7 contributes to reduced p53 stability and activity through regulation of the RP-MDM2-p53 pathway. This IPO7-mediated mechanism can be considered an addition to the list of p53 posttranslational modifications that occur in tumorigenesis. Our proposed p53 regulatory mechanisms in PTC and FND cells are depicted in Figure 5.
Parallel experiments conducted in normal thyroid cell line (Nthy-ori 3-1) showed that miR-7-5p loss of function, with the consequent IPO7 upregulation, promoted a p53 nucleocytoplasmic translocation (Figure 4a,b). MiR-7-5p inhibition or mimic did have an effect on cell proliferation in PTC and normal cell line (Figure S2b). However, there was no significant change in the p53 protein level upon modulation of IPO7 or miR-7-5p expression in the normal cell line (Figure S3). These results indicate that the IPO7-mediated regulation of p53 stability is specific to PTC where additional cancer-related regulatory mechanisms come into play. This finding might have an important implication in designing therapeutics to target the p53 pathway. The available therapies, such as MDM2 inhibitors, are designed to stabilize p53 in tumor cell. However, clinical data showed that they have a potential problem of stabilizing p53 in normal cells, which constitutes a major challenge to the success of these treatments [64]. Moreover, preclinical and clinical data showed that targeting importins constitutes a new therapeutic avenue in treating malignancies [65]. Therefore, modulation of IPO7 expression might be a potential tool in the reactivation of p53 function in PTC and possibly other cancers.
In conclusion, IPO7 and miR-7-5p regulate the dynamics and stability of p53 in thyroid cells. In PTC, miR-7-5p downregulation with consequent upregulation of IPO7 facilitates the engagement of RPL11/RPL5 in the ribosomal biogenesis stress response, which promotes MDM2/p53 cytoplasmic repositioning and p53 degradation. Overexpression of IPO7 might be a protective mechanism hijacked by cancer cells to evade p53 growth arrest in situations of stress associated with carcinogenesis. These results are important for designing therapies to restore normal p53 function in cancer cells.
Supplementary Materials
The following supporting information can be downloaded at the website of this paper posted on Preprints.org. Supporting Figure 1. Immunohistochemistry images showing the protein expression of IPO7 and p53 in representative PTC and NIFTP tissues. A- p53 expression is negative in PTC and NIFTPs. IPO7 is expressed in the cytoplasm and nuclei of thyroid follicular cells. The scale bar is shown in the bottom right panel = 50 μm. B- Confirmation of the reduced expression of IPO7 after transfection with IPO7 siRNA. Nuclei were counterstained with DAPI (blue). The scale bar is shown in the bottom right panel = 20 μm. Supporting Figure 2. A- Flow cytometry analysis of PTC cells transfected with the miR-7-5p mimic (quadrants B2 and B4) showing an increase in the number of apoptotic/necrotic cells compared to that in the negative control. B- Viability assay showing increased number of viable cells in normal thyroid cell line treated with miR-7-5p inhibitor, and reduced number of viable cells in PTC cultured cells treated with miR-7-5p mimic. Supporting Figure 3. Immunoblot representative image showing the expression of p53 in Nthy-ori 3-1 cells transfected with miR-7-5p inhibitor, IPO7 siRNA or control. The bar graph shows the quantity of p53 protein measured relative to total protein. The results calculated from three experiments did not reach statistical significance. Supporting Table 1. Expression of p53 and related molecules measured by RT-PCR in thyroid samples. Original gel of the western blot experiment showing p53 protein change after IPO7 partial depletion is shown. Supporting Table 2. Expression of IPO7 and miR-7-5p in primary cultured PTC cells treated with IPO7 siRNA. Supporting Table 3. miR-7-5p loss of function effect on IPO7 expression in NTHY-ORI 3-1 cells.
Author Contributions
A.A. did the study design, data analysis and manuscript writing. I.J. and B.M. did the molecular and functional experiments and statistical analysis.
Funding
This work is funded by Kuwait University, Research Sector, research grant # MG 04/19.
Institutional Review Board Statement
Ethical approval to conduct this study was obtained from the Kuwait Ministry of Health. All methods were performed in accordance with the relevant guidelines and regulations approved by the ethics committee of the Kuwait Ministry of Health. The research protocol was reviewed and approved by the Kuwait University Health Sciences Center ethics committee. Informed consent: N/A. Registration No of the trial: N/A. Animal studies: N/A.
Data Availability Statement
The datasets generated during and/or analyzed during the current study are available from the corresponding author upon reasonable request.
Acknowledgments
We acknowledge the work of Dr Rola Ali and Dr Nabeel Al-Brahim in the histopathological diagnosis/classification of the tissue samples. We also acknowledge the research core facility of the health sciences center, Kuwait University, project # SRUL 02/13.
Conflicts of Interest
None of the authors have any conflicts of interest related to this manuscript.
References
- Lim, H.; Devesa, S.S.; Sosa, J.A.; Check, D.; Kitahara, C.M. Trends in Thyroid Cancer Incidence and Mortality in the United States, 1974-2013. JAMA 2017, 317, 1338–1348. [Google Scholar] [CrossRef]
- American Cancer Society. Key Statistics for Thyroid Cancer. Available online: https://www.cancer.org/cancer/types/thyroid-cancer/about/key-statistics.html (accessed on 31 January 2024).
- Limaiem, F.; Rehman, A.; Mazzoni, T. Papillary Thyroid Carcinoma. In StatPearls [Internet]; StatPearls Publishing: Treasure Island, FL, USA, 2024; Available online: https://www.ncbi.nlm.nih.gov/books/NBK536943/.
- Wang, Z.; Ji, X.; Zhang, H.; Sun, W. Clinical and molecular features of progressive papillary thyroid microcarcinoma. Int. J. Surg. 2024, 110, 2313–2322. [Google Scholar] [CrossRef] [PubMed]
- Vuong, H.G.; Altibi, A.M.; Abdelhamid, A.H.; Ngoc, P.U.; Quan, V.D.; Tantawi, M.Y.; Elfil, M.; Vu, T.L.; Elgebaly, A.; Oishi, N.; Nakazawa, T.; Hirayama, K.; Katoh, R.; Huy, N.T.; Kondo, T. The changing characteristics and molecular profiles of papillary thyroid carcinoma over time: a systematic review. Oncotarget 2017, 8, 10637–10649. [Google Scholar] [CrossRef]
- Lee, M.Y.; Ku, B.M.; Kim, H.S.; Lee, J.Y.; Lim, S.H.; Sun, J.M.; Lee, S.H.; Park, K.; Oh, Y.L.; Hong, M.; Jeong, H.S.; Son, Y.I.; Baek, C.H.; Ahn, M.J. Genetic Alterations and Their Clinical Implications in High-Recurrence Risk Papillary Thyroid Cancer. Cancer Res Treat 2017, 49, 906–914. [Google Scholar] [CrossRef]
- Rajabi, S.; Alix-Panabières, C.; Alaei, A.S.; Abooshahab, R.; Shakib, H.; Ashrafi, M.R. Looking at Thyroid Cancer from the Tumor-Suppressor Genes Point of View. Cancers 2022, 14, 2461. [Google Scholar] [CrossRef] [PubMed]
- Donghi, R.; Longoni, A.; Pilotti, S.; Michieli, P.; Della Porta, G.; Pierotti, M.A. Gene p53 mutations are restricted to poorly differentiated and undifferentiated carcinomas of the thyroid gland. J. Clin. Investig. 1993, 91, 1753–1760. [Google Scholar] [CrossRef] [PubMed]
- Wang, H.; Guo, M.; Wei, H.; et al. Targeting p53 pathways: mechanisms, structures, and advances in therapy. Sig Transduct Target Ther 2023, 8, 92. [Google Scholar] [CrossRef]
- Iacobas, D.A.; Iacobas, S. Papillary Thyroid Cancer Remodels the Genetic Information Processing Pathways. Genes 2024, 15, 621. [Google Scholar] [CrossRef]
- Jahanbani, I.; Al-Abdallah, A.; Ali, R.H.; Al-Brahim, N.; Mojiminiyi, O. Discriminatory miRNAs for the Management of Papillary Thyroid Carcinoma and Noninvasive Follicular Thyroid Neoplasms with Papillary-Like Nuclear Features. Thyroid 2018, 28, 319–327. [Google Scholar] [CrossRef]
- Al-Abdallah, A.; Jahanbani, I.; Ali, R.H.; Al-Brahim, N.; Prasanth, J.; Al-Shammary, B.; Al-Bader, M. A new paradigm for epidermal growth factor receptor expression exists in PTC and NIFTP regulated by microRNAs. Front Oncol 2023, 13, 1080008. [Google Scholar] [CrossRef]
- Morales-Martínez, M.; Vega, M.I. Role of MicroRNA-7 (MiR-7) in Cancer Physiopathology. Int J Mol Sci 2022, 23, 9091. [Google Scholar] [CrossRef] [PubMed]
- Hua, K.; Jin, J.; Zhang, H.; Zhao, B.; Wu, C.; Xu, H.; Fang, L. MicroRNA-7 inhibits proliferation, migration and invasion of thyroid papillary cancer cells by targeting CKS2. International Journal of Oncology 2016, 49, 1531–1540. [Google Scholar] [CrossRef] [PubMed]
- Yue, K.; Wang, X.; Wu, Y.; Zhou, X.; He, Q.; Duan, Y. microRNA-7 regulates cell growth, migration and invasion via direct targeting of PAK1 in thyroid cancer. Mol Med Rep 2016, 14, 2127–2134. [Google Scholar] [CrossRef]
- Kong, X.; et al. MicroRNA-7 inhibits epithelial-to-mesenchymal transition and metastasis of breast cancer cells by targeting FAK expression. PLoS One 2012, e41523. [Google Scholar] [CrossRef] [PubMed]
- Gajda, E.; Grzanka, M.; Godlewska, M.; Gawel, D. The Role of miRNA-7 in the Biology of Cancer and Modulation of Drug Resistance. Pharmaceuticals 2021, 14, 149. [Google Scholar] [CrossRef]
- Zhang, N.; Li, X.; Wu, C.W.; Dong, Y.; Cai, M.; Mok, M.T.S.; Wang, H.; Chen, J.; Ng, S.S.M.; Chen, M.; et al. microRNA-7 is a novel inhibitor of YY1 contributing to colorectal tumorigenesis. Oncogene 2012, 32, 5078–5088. [Google Scholar] [CrossRef]
- Yu, Z.; Ni, L.; Chen, D.; Zhang, Q.; Su, Z.; Wang, Y.; Yu, W.; Wu, X.; Ye, J.; Yang, S.; et al. Identification of miR-7 as an oncogene in renal cell carcinoma. J Mol Histol 2013, 44, 669–677. [Google Scholar] [CrossRef]
- Hong, C.-F.; Lin, S.-Y.; Chou, Y.-T.; Wu, C.-W. MicroRNA-7 Compromises p53 Protein-dependent Apoptosis by Controlling the Expression of the Chromatin Remodeling Factor SMARCD1. J. Biol. Chem. 2016, 291, 1877–1889. [Google Scholar] [CrossRef]
- Chou, Y.T.; Lin, H.H.; Lien, Y.C.; Wang, Y.H.; Hong, C.F.; et al. EGFR promotes lung tumorigenesis by activating miR-7 through a Ras/ERK/Myc pathway that targets the Ets2 transcriptional repressor ERF. Cancer Res 2010, 70, 8822–8831. [Google Scholar] [CrossRef]
- Görlich, D.; Kutay, U. Transport between the cell nucleus and the cytoplasm. Annu Rev Cell Dev Biol 1999, 15, 607–660. [Google Scholar] [CrossRef]
- Flores, K.; Seger, R. Stimulated nuclear import by β-like importins. F1000Prime Rep 2013, 5, 41. [Google Scholar] [CrossRef] [PubMed]
- Chen, J.; Liu, M.Y.; Parish, C.R.; Chong, B.H.; Khachigian, L. Nuclear import of early growth response-1 involves importin-7 and the novel nuclear localization signal serine-proline-serine. Int J Biochem Cell Biol 2011, 43, 905–912. [Google Scholar] [CrossRef] [PubMed]
- Chachami, G.; Paraskeva, E.; Mingot, J.; Braliou, G.G.; Görlich, D.; Simos, G. Transport of hypoxia-inducible factor HIF-1alpha into the nucleus involves importins 4 and 7. Biochem Biophys Res Commun 2009, 390, 235–240. [Google Scholar] [CrossRef] [PubMed]
- Waldmann, I.; Wälde, S.; Kehlenbach, R.H. Nuclear import of c-Jun is mediated by multiple transport receptors. J Biol Chem 2007, 282, 27685–27692. [Google Scholar] [CrossRef]
- Yao, X.; Chen, X.; Cottonham, C.; Xu, L. Preferential utilization of Imp7/8 in nuclear import of Smads. J Biol Chem 2008, 283, 22867–22874. [Google Scholar] [CrossRef]
- Çağatay, T.; Chook, Y.M. Karyopherins in cancer. Curr Opin Cell Biol 2018, 52, 30–42. [Google Scholar] [CrossRef]
- Li, S.R.; Gyselman, V.G.; Dorudi, S.; Bustin, S.A. Elevated levels of RanBP7 mRNA in colorectal carcinoma are associated with increased proliferation and are similar to the transcription pattern of the proto-oncogene c-myc. Biochem Biophys Res Commun 2000, 271, 537–543. [Google Scholar] [CrossRef]
- Xue, J.; Zhou, A.; Tan, C.; Wu, Y.; Lee, H.-T.; Li, W.; et al. Forkhead box M1 is essential for nuclear localization of glioma-associated oncogene homolog 1 in glioblastoma multiforme cells by promoting importin-7 expression. J Biol Chem 2015, 290, 18662–18670. [Google Scholar] [CrossRef]
- Lee, A.Y.; Kim, S.; Lee, S.; Jiang, H.-L.; Kim, S.-B.; Hong, S.-H.; Cho, M.-H. Knockdown of Importin 7 Inhibits Lung Tumorigenesis in K-rasLA1 Lung Cancer Mice. Anticancer Research 2017, 37, 2381–2386. [Google Scholar] [CrossRef]
- Chen, J.; Hu, Y.; Teng, Y.; Yang, B. Increased Nuclear Transporter Importin 7 Contributes to the Tumor Growth and Correlates With CD8 T-Cell Infiltration in Cervical Cancer. Front Cell Dev Biol 2021, 9, 732786. [Google Scholar] [CrossRef]
- Li, M.; Xu, D.; Zhan, Y.; Tan, S. IPO7 promotes pancreatic cancer progression by regulating ERBB pathway. Clinics 2022, 77, 100044. [Google Scholar] [CrossRef]
- Golomb, L.; Bublik, D.R.; Wilder, S.; Nevo, R.; Kiss, V.; Grabusic, K.; Volarevic, S.; Oren, M. Importin 7 and exportin 1 link c-Myc and p53 to regulation of ribosomal biogenesis. Mol Cell 2012, 45, 222–232. [Google Scholar] [CrossRef] [PubMed]
- Xu, J.; Xu, W.; Xuan, Y.; Liu, Z.; Sun, Q.; Lan, C. Pancreatic Cancer Progression Is Regulated by IPO7/p53/LncRNA MALAT1/MiR-129-5p Positive Feedback Loop. Front Cell Dev Biol 2021, 9, 630262. [Google Scholar] [CrossRef] [PubMed]
- Baloch, Z.W.; Asa, S.L.; Barletta, J.A.; Ghossein, R.A.; Juhlin, C.C.; Jung, C.K.; et al. Overview of the 2022 WHO classification of thyroid neoplasms. Endocrine Pathol 2022, 33, 27–63. [Google Scholar] [CrossRef] [PubMed]
- Al-Abdallah, A.; Jahanbani, I.; Mehdawi, H.; Ali, R.H.; Al-Brahim, N.; Mojiminiyi, O. The stress-activated protein kinase pathway and the expression of stanniocalcin-1 are regulated by miR-146b-5p in papillary thyroid carcinogenesis. Cancer Biol Ther 2020, 21, 412–423. [Google Scholar] [CrossRef]
- Livak, K.J.; Schmittgen, T.D. Analysis of relative gene expression data using realtime quantitative PCR and the 2−ΔΔCT method. Methods 2001, 25, 402–408. [Google Scholar] [CrossRef]
- Manzella, L.; Stella, S.; Pennisi, M.S.; Tirrò, E.; Massimino, M.; Romano, C.; Puma, A.; Tavarelli, M.; Vigneri, P. New Insights in Thyroid Cancer and p53 Family Proteins. Int J Mol Sci 2017, 18, 1325. [Google Scholar] [CrossRef]
- Malaguarnera, R.; Vella, V.; Vigneri, R.; Frasca, F. p53 family proteins in thyroid cancer. Endocrine-Related Cancer. Endocr Relat Cancer 2007, 14, 43–60. [Google Scholar] [CrossRef]
- Shakeri, R.; Kheirollahi, A.; Davoodi, J. Apaf-1: Regulation and function in cell death. Biochimie 2017, 135, 111–125. [Google Scholar] [CrossRef] [PubMed]
- Uxa, S.; Castillo-Binder, P.; Kohler, R.; Stangner, K.; Müller, G.A.; Engeland, K. Ki-67 gene expression. Cell Death Differ 2021, 28, 3357–3370. [Google Scholar] [CrossRef] [PubMed] [PubMed Central]
- Ma, W.; Zhao, P.; Zang, L.; Zhang, K.; Liao, H.; Hu, Z. Tumor suppressive function of HUWE1 in thyroid cancer. J. Biosci. 2016, 41, 395–405. [Google Scholar] [CrossRef] [PubMed]
- Malaguarnera, R.; Vella, V.; Pandini, G.; et al. TAp73 alpha increases p53 tumor suppressor activity in thyroid cancer cells via the inhibition of Mdm2-mediated degradation. Mol Cancer Res 2008, 6, 64–77. [Google Scholar] [CrossRef]
- Lu, W.; Pochampally, R.; Chen, L.; Traidej, M.; Wang, Y.; Chen, J. Nuclear exclusion of p53 in a subset of tumors requires MDM2 function. Oncogene 2000, 19, 232–240. [Google Scholar] [CrossRef]
- Liang, S.H.; Clarke, M.F. Regulation of p53 localization. Eur J Biochem 2001, 268, 2779–2783. [Google Scholar] [CrossRef] [PubMed]
- Conforti, F.; Wang, Y.; Rodriguez, J.A.; Alberobello, A.T.; Zhang, Y.W.; Giaccone, G. Molecular Pathways: Anticancer Activity by Inhibition of Nucleocytoplasmic Shuttling. Clin Cancer Res 2015, 21, 4508–4513. [Google Scholar] [CrossRef] [PubMed]
- Zerfaoui, M.; Dokunmu, T.M.; Toraih, E.A.; Rezk, B.M.; Abd Elmageed, Z.Y.; Kandil, E. New Insights into the Link between Melanoma and Thyroid Cancer: Role of Nucleocytoplasmic Trafficking. Cells 2021, 10, 367. [Google Scholar] [CrossRef] [PubMed]
- Gerasimov, G.; Bronstein, M.; Troshina, K.; Alexandrova, G.; Dedov, I.; Jennings, T.; Kallakury, B.V.; Izquierdo, R.; Boguniewicz, A.; Figge, H.; et al. Nuclear p53 immunoreactivity in papillary thyroid cancers is associated with two established indicators of poor prognosis. Exp. Mol. Pathol. 1995, 62, 52–62. [Google Scholar] [CrossRef]
- Penzo, M.; Montanaro, L.; Treré, D.; Derenzini, M. The Ribosome Biogenesis-Cancer Connection. Cells 2019, 8, 55. [Google Scholar] [CrossRef]
- de Las Heras-Rubio, A.; Perucho, L.; Paciucci, R.; et al. Ribosomal proteins as novel players in tumorigenesis. Cancer Metastasis Rev 2014, 33, 115–141. [Google Scholar] [CrossRef]
- Zhang, Y.; Lu, H. Signaling to p53: ribosomal proteins find their way. Cancer Cell 2009, 16, 369–377. [Google Scholar] [CrossRef]
- Wang, H.; Guo, M.; Wei, H.; et al. Targeting p53 pathways: mechanisms, structures, and advances in therapy. Sig Transduct Target Ther 2023, 8, 92. [Google Scholar] [CrossRef]
- Levine, A.J. p53: 800 million years of evolution and 40 years of discovery. Nat. Rev. Cancer 2020, 20, 471–480. [Google Scholar] [CrossRef] [PubMed]
- Kastenhuber, E.R.; Lowe, S.W. Putting p53 in context. Cell 2017, 170, 1062–1078. [Google Scholar] [CrossRef]
- Jäkel, S.; Görlich, D. Importin beta transportin, RanBP5 and RanBP7 mediate nuclear import of ribosomal proteins in mammalian cells. EMBO J. 1998, 17, 4491–502. [Google Scholar] [CrossRef] [PubMed]
- Bhat, K.P.; Itahana, K.; Jin, A.; Zhang, Y. Essential role of ribosomal protein L11 in mediating growth inhibition-induced p53 activation. EMBO J. 2004, 23, 2402–2412. [Google Scholar] [CrossRef] [PubMed]
- Lohrum, M.A.; Ludwig, R.L.; Kubbutat, M.H.; Hanlon, M.; Vousden, K.H. Regulation of HDM2 activity by the ribosomal protein L11. Cancer Cell 2003, 3, 577–587. [Google Scholar] [CrossRef]
- Bursac, S.; Brdovcak, M.C.; Pfannkuchen, M.; Orsolic, I.; Golomb, L.; Zhu, Y.; Katz, C.; Daftuar, L.; Grabusic, K.; Vukelic, I.; et al. Mutual protection of ribosomal proteins L5 and L11 from degradation is essential for p53 activation upon ribosomal biogenesis stress. Proc. Natl. Acad. Sci. USA 2012, 109, 20467–20472. [Google Scholar] [CrossRef]
- Chakraborty, A.; Uechi, T.; Kenmochi, N. Guarding the ‘translation apparatus’: defective ribosome biogenesis and the p53 signaling pathway. Wiley Interdiscip. Rev. RNA 2011, 2, 507–522. [Google Scholar] [CrossRef]
- Song, B.; Yang, P.; Zhang, S. Cell fate regulation governed by p53: Friends or reversible foes in cancer therapy. Cancer Commun 2024, 3, 297–360. [Google Scholar] [CrossRef]
- Donati, G.; Brighenti, E.; Vici, M.; Mazzini, G.; Treré, D.; Montanaro, L.; Derenzini, M. Selective inhibition of rRNAtranscription downregulates E2F-1: Anew p53-independent mechanism linking cell growth to cell proliferation. J. Cell Sci. 2011, 124, 3017–3028. [Google Scholar] [CrossRef]
- Dai, M.-S.; Arnold, H.; Sun, X.-X.; Sears, R.; Lu, H. Inhibition of c-Myc activity by ribosomal protein L11. EMBO J. 2007, 26, 3332–3345. [Google Scholar] [CrossRef] [PubMed]
- Duffy, M.J.; Synnott, N.C.; O’Grady, S.; Crown, J. Targeting p53 for the treatment of cancer. Seminars in Cancer Biology 2022, 79, 58–67. [Google Scholar] [CrossRef] [PubMed]
- Nachmias, B.; Schimmer, A.D. Targeting nuclear import and export in hematological malignancies. Leukemia 2020, 34, 2875–2886. [Google Scholar] [CrossRef] [PubMed] [PubMed Central]
Figure 1.
Immunofluorescence staining images showing the protein expression of IPO7 and p53 in representative PTC and FND tissues. A- IPO7 (red) is localized in the cytoplasm and nuclei of thyroid follicular cells in PTC samples, while it is expressed at low intensity in FND. MiR-7-5p (green) tested by in situ hybridization is negative in PTC tumor cells and strongly positive in FND. B- Tumor cells in PTC show negative expression of p53 (green) and low cytoplasmic/nuclear expression of MDM2 (red). P53 staining was detected only in infiltrating cells in PTC tissues. In FND tissue, p53 and MDM2 showed strong cytoplasmic and nuclear expression. Nuclei were counterstained with DAPI (blue). The scale bar is shown in the bottom right panel = 20 μm. The mean fluorescence intensity was analyzed by Zen software (version 14.0.0.201, Zeiss) and presented in the pictures as overall intensity (OI).
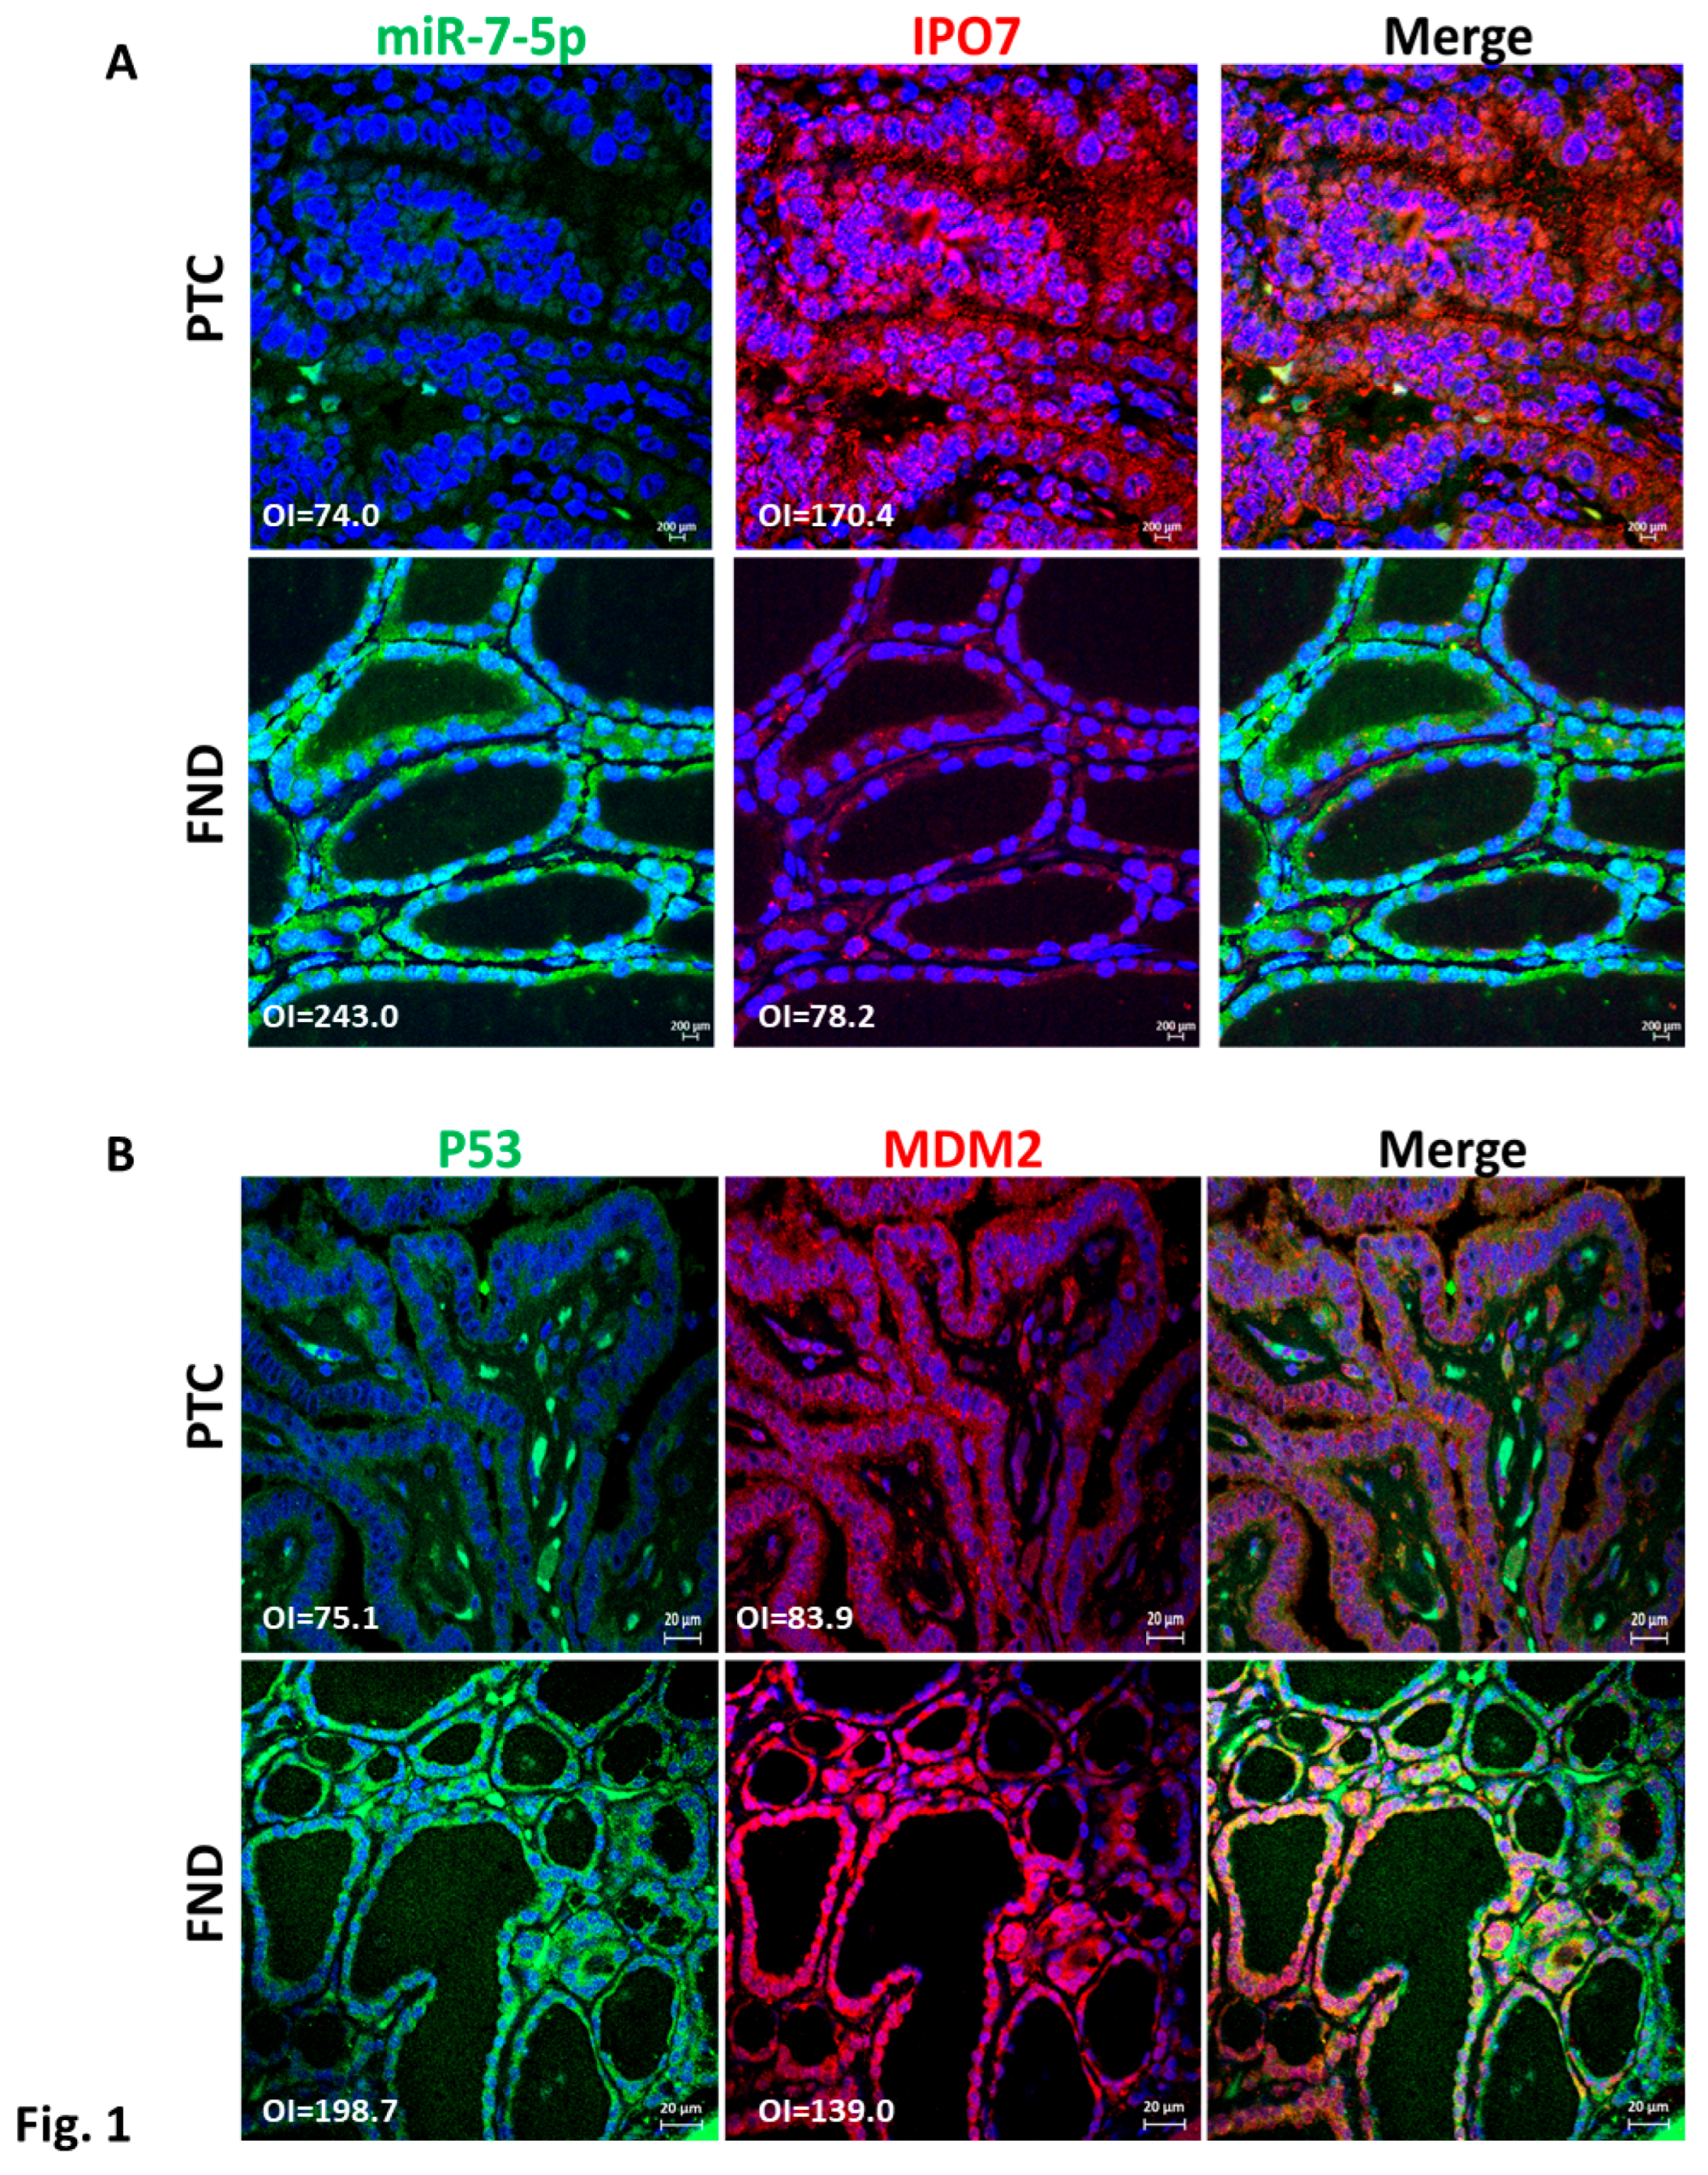
Figure 2.
Partial depletion of IPO7 stabilizes p53. A- Immunoblots showing the expression of p53 in PTC cells transfected with IPO7 siRNA or the control. The bar graph shows the quantity of p53 protein measured relative to total protein. The results of three samples are shown. A significant increase in p53 protein was detected in cells treated with IPO7 siRNA (p = 0.0026). B- Immunofluorescence images showing that p53 (green) and MDM2 (red) shift to the nuclei of PTC cells after partial IPO7 depletion. Three PTC samples were tested and images from a representative sample are shown. Nuclei were counterstained with DAPI (blue). Images were analyzed by LSM 800 and Zen software (Zeiss). The mean fluorescence intensity is presented in the pictures as overall intensity (OI). The mean nuclear localization intensity is calculated from the colocalization data. Nuclear intensity (NI) = the number of green/red pixels that colocalize with DAPI nuclear stain. The increased NI score in the treated cells indicates increased nuclear expression. The scale bar is shown in the bottom right panel = 20 μm.
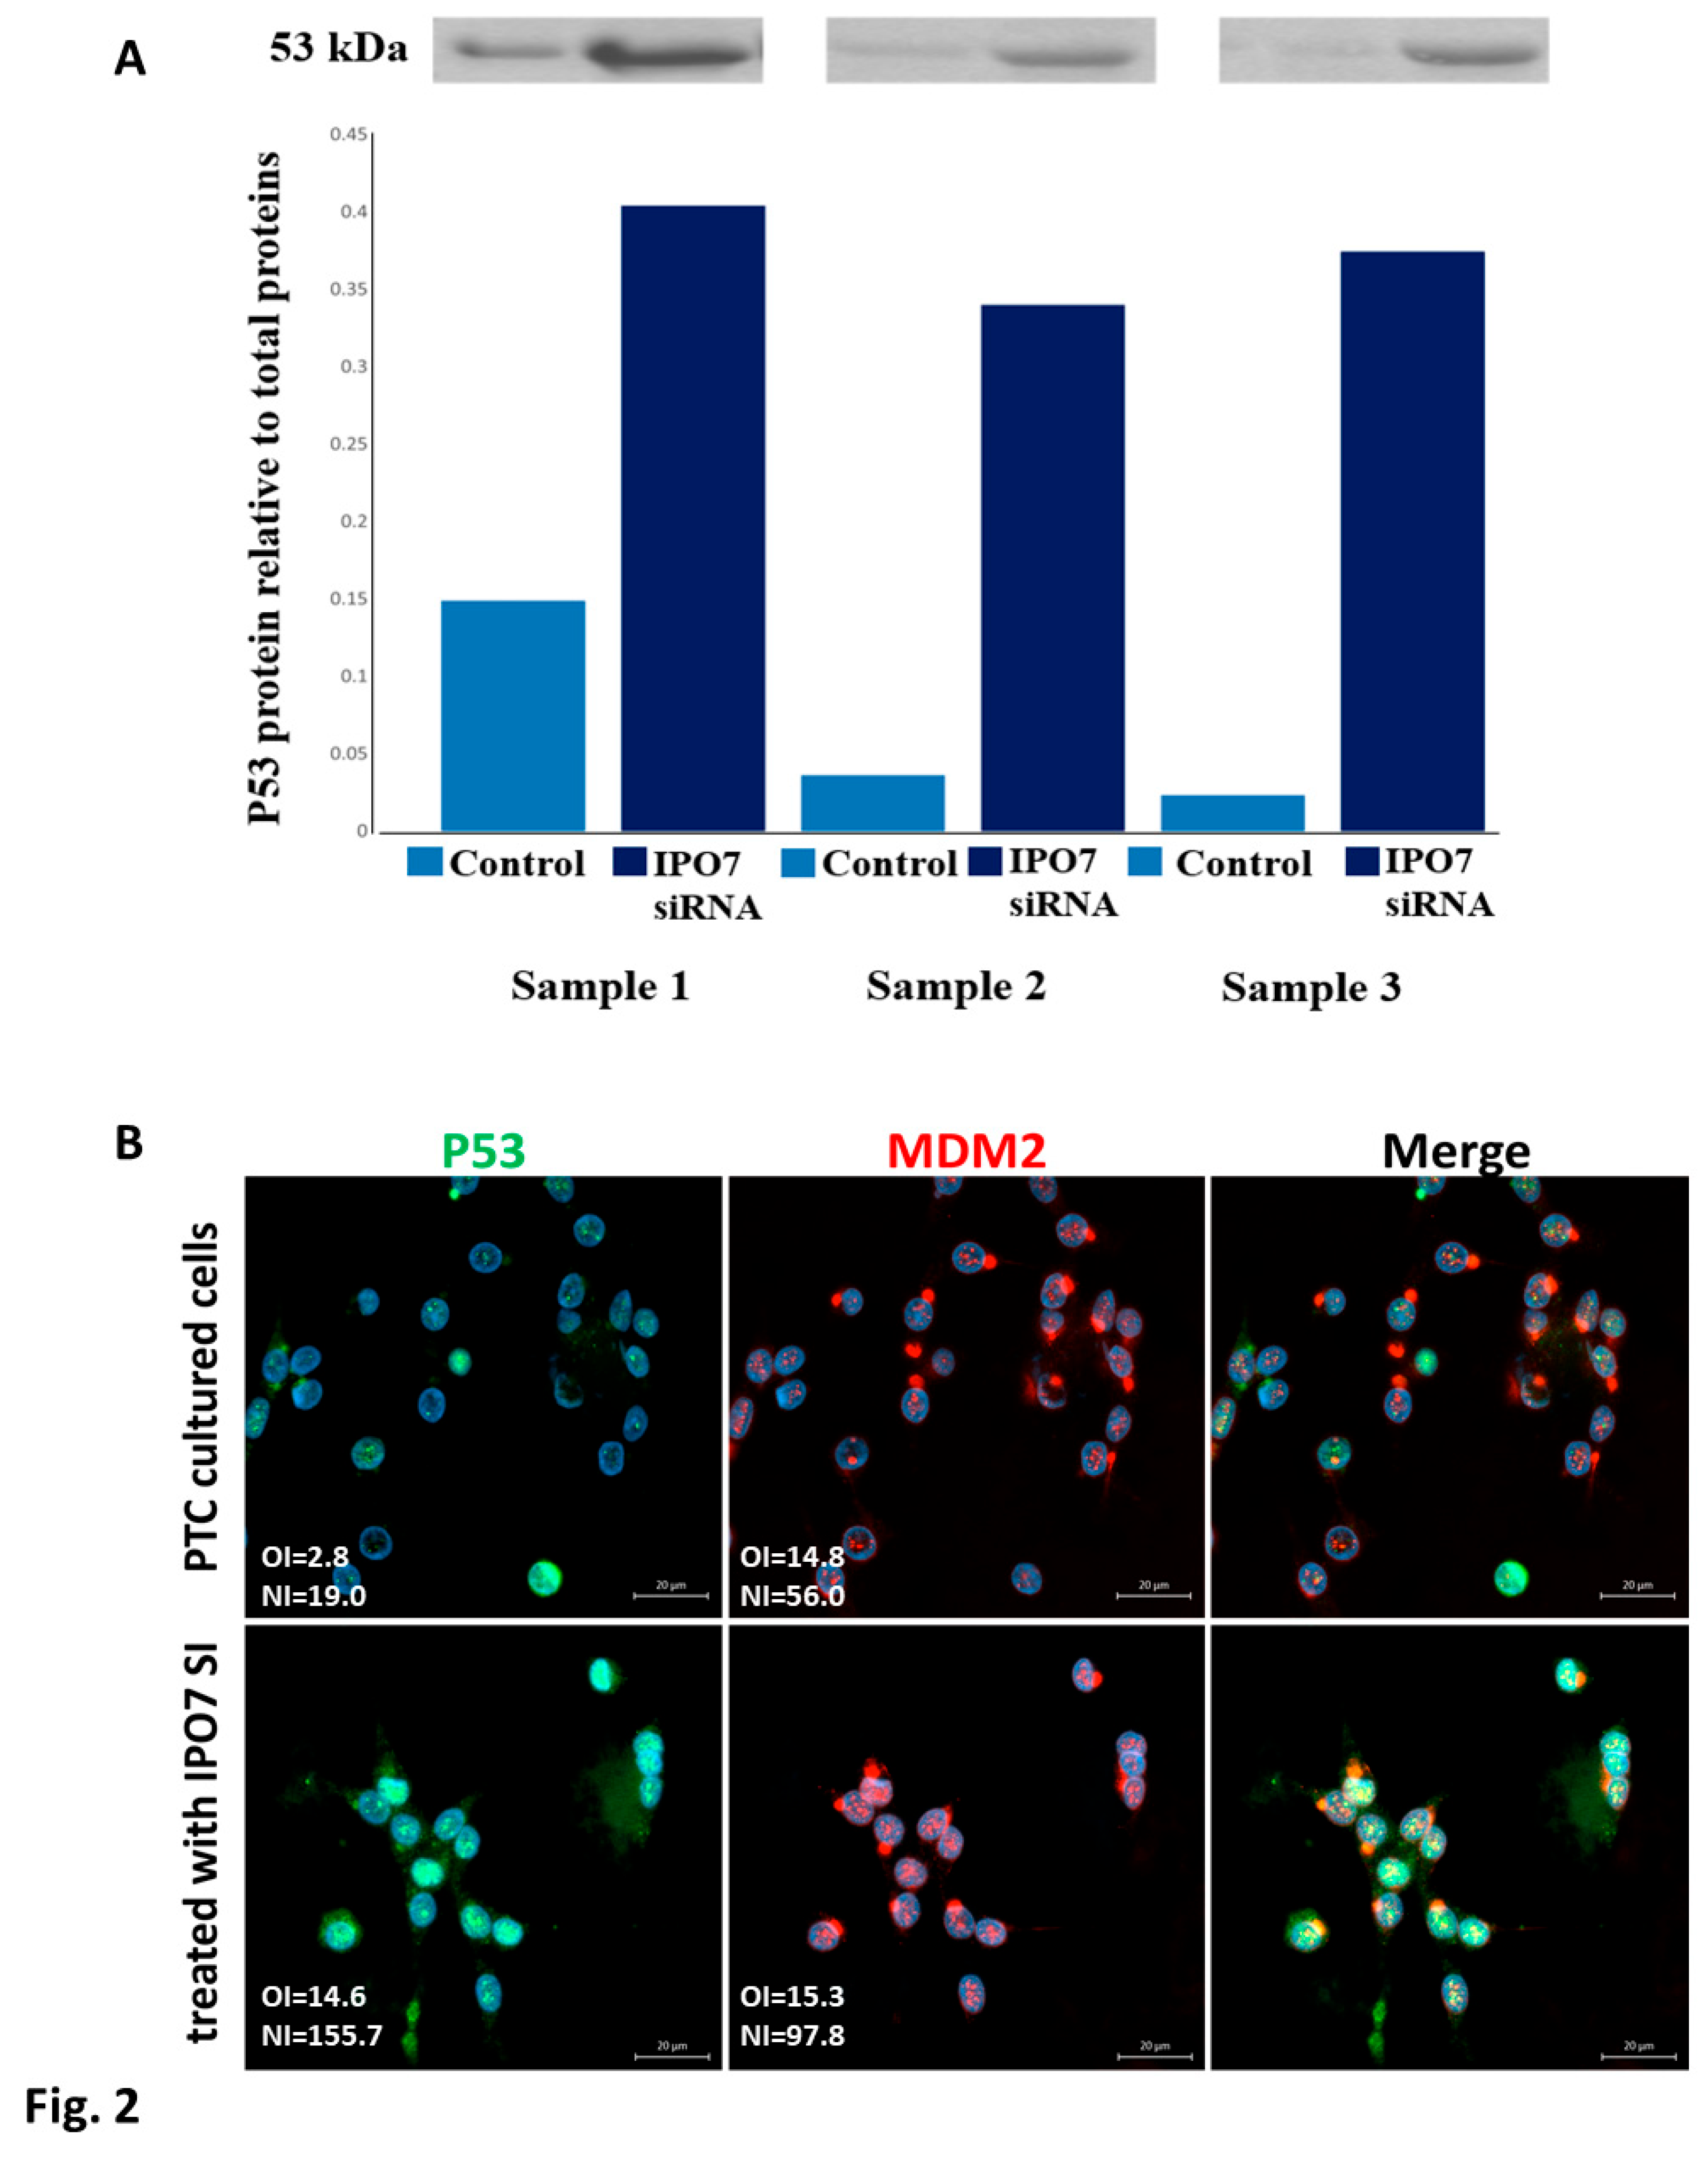
Figure 3.
Effect of partial IPO7 depletion on the cellular localization of ribosomal proteins in primary cultured PTC cells. A- RPL11 (green) shifts from the cytoplasm to the nuclei of PTC cells in colocalization with MDM2 (red) after partial IPO7 depletion. B- RPL5 (green) and MDM2 (red) colocalize in the nuclei of PTC cells after partial IPO7 depletion. Three PTC samples were tested and images from a representative sample are shown. Nuclei were counterstained with DAPI (blue). Images were analyzed by LSM 800 and Zen software (Zeiss). The mean fluorescence intensity is presented in the pictures as overall intensity (OI). The mean nuclear localization intensity is calculated from the colocalization data. Nuclear intensity (NI) = the number of green/red pixels that colocalize with DAPI nuclear stain. The increased NI score in the treated cells indicates increased nuclear expression. Yellow color in the merged pictures indicates the colocalization of the red and green fluorescence. The scale bar is shown in the bottom right panel = 20 μm.
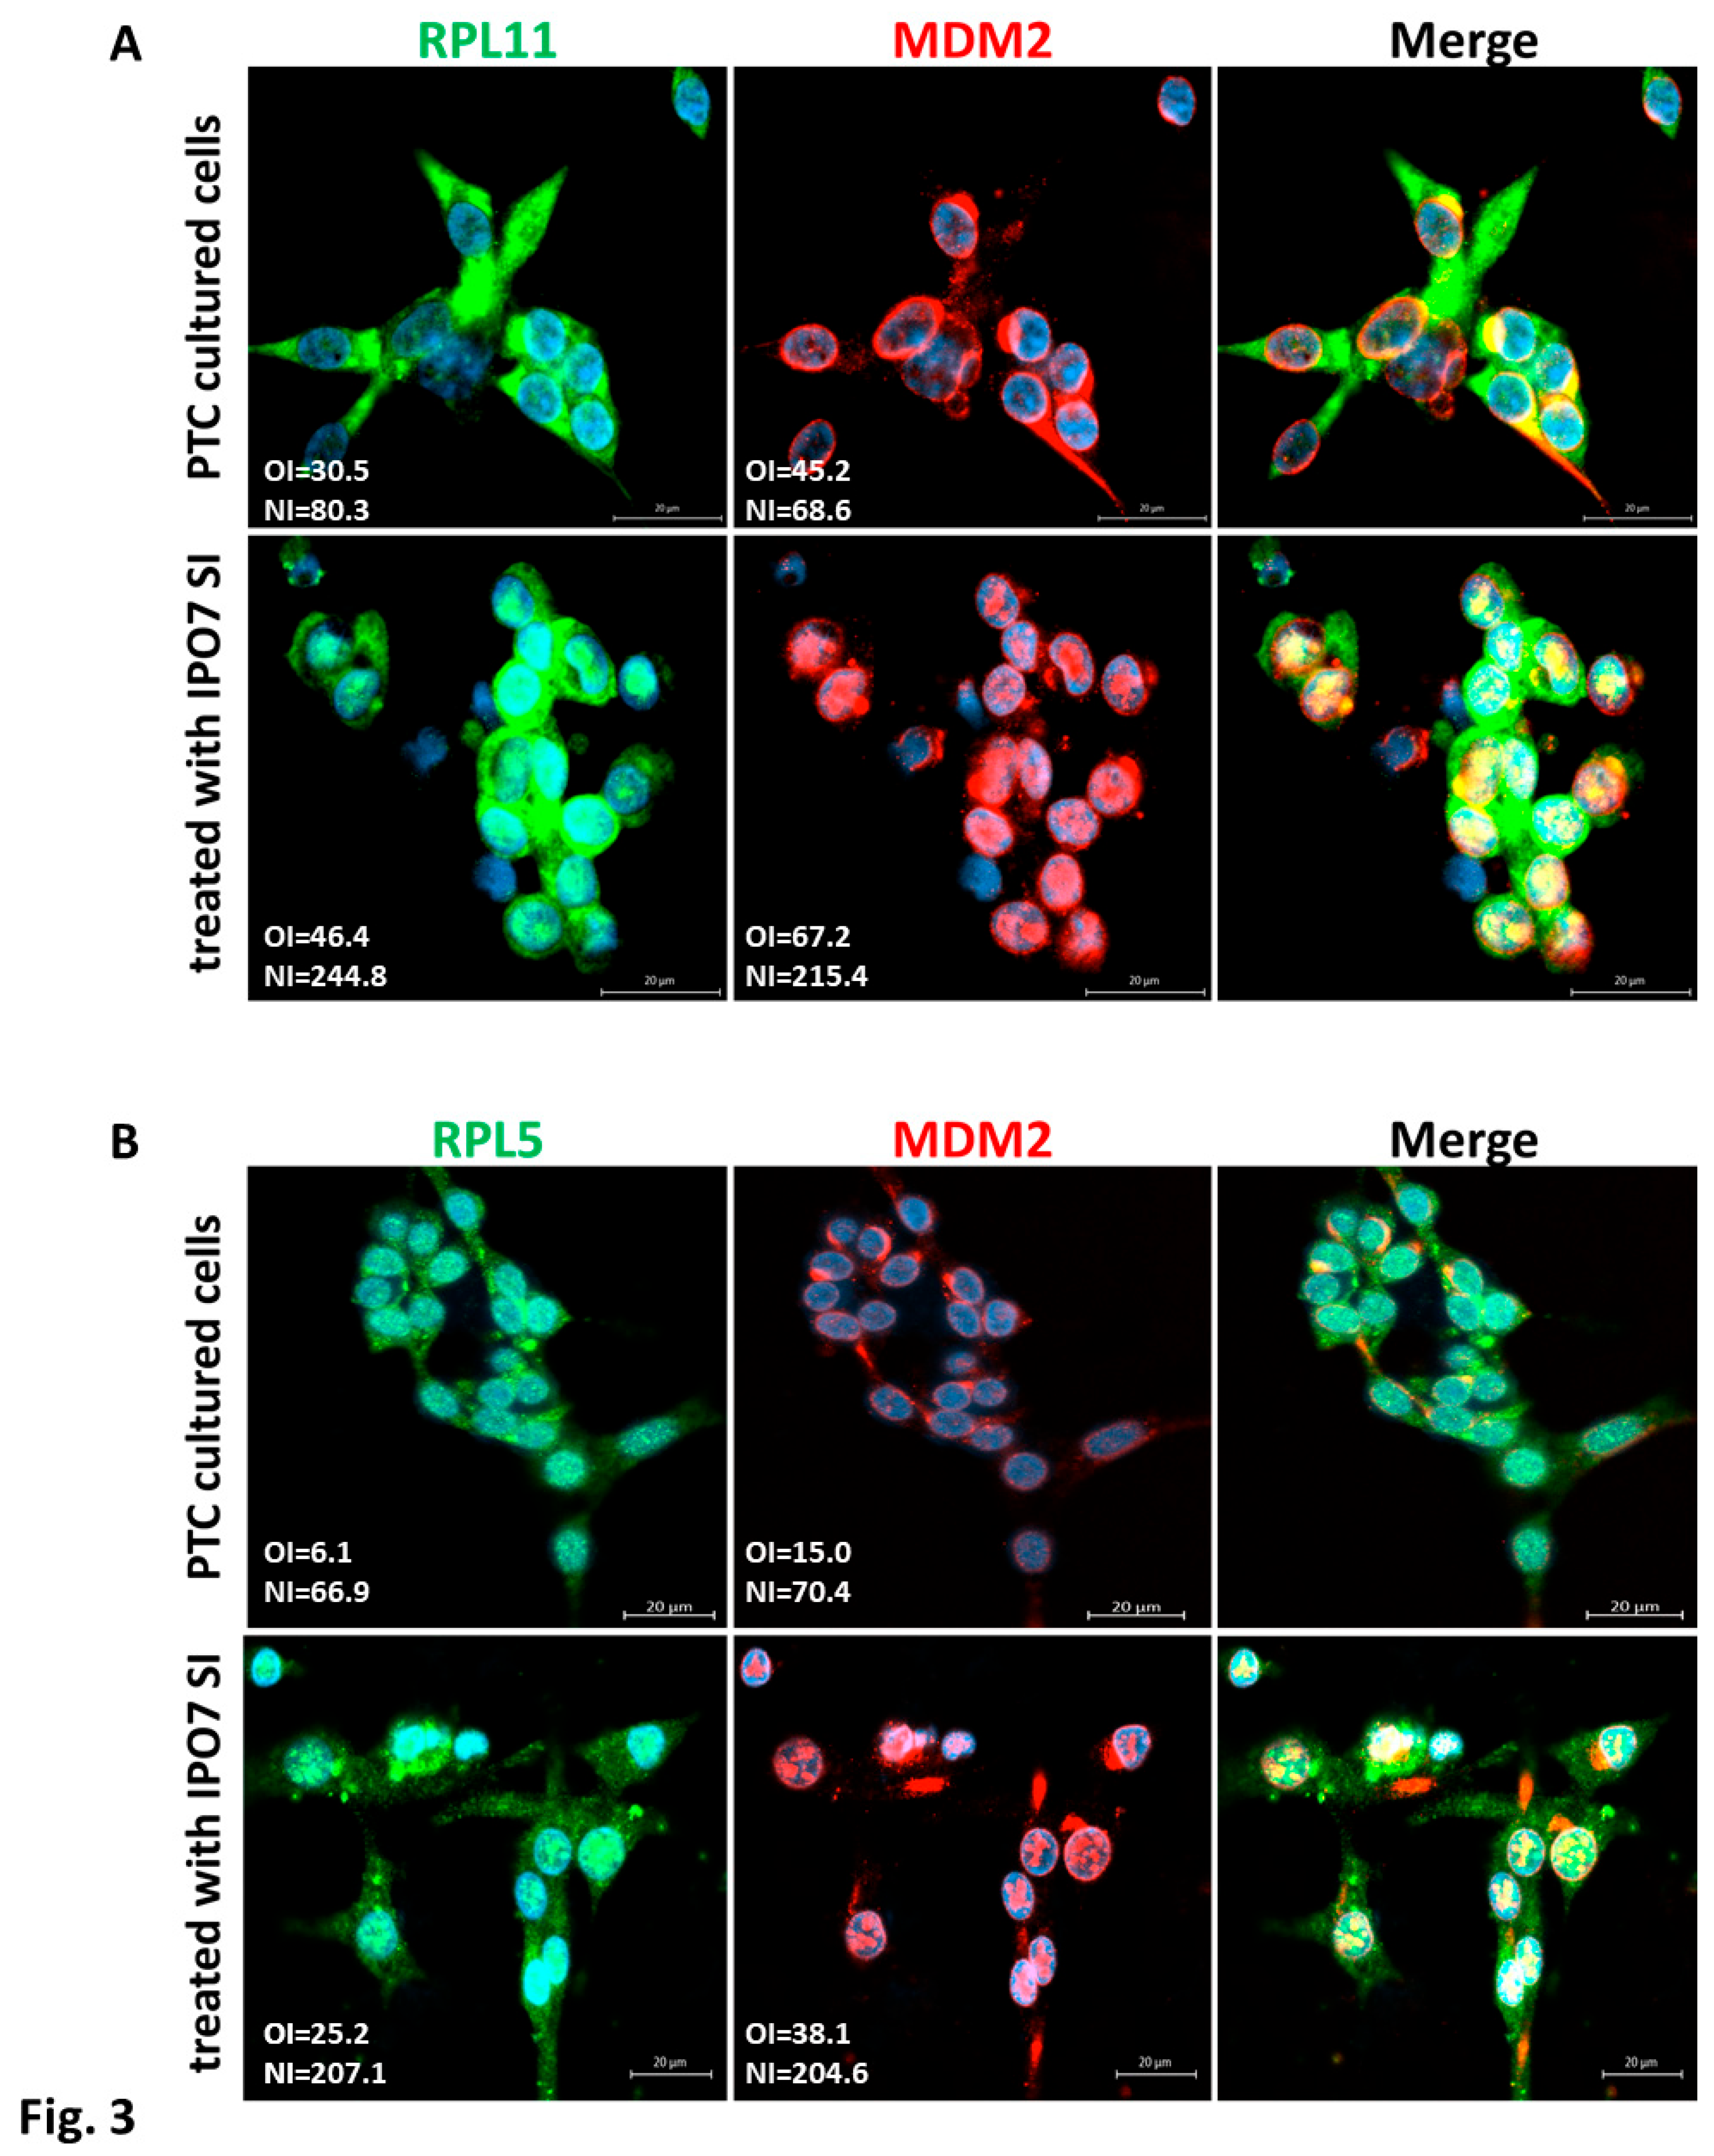
Figure 4.
Functional experiments in normal thyroid cell line (Nthy-ori 3-1). Each experiment was repeated three times and results from one representative experiment are shown. A- Nthy-ori 3-1 cells express low levels of IPO7 (green) and moderate levels of miR-7-5p (red). Transfection with miR-7-5p inhibitor increased the expression of IPO7 in the treated cells. B- Nthy-ori 3-1 cells show nuclear expression of p53 (green) and MDM2 (red). P53 and MDM2 shifted to the cytoplasm in cells transfected with the miR-7-5p inhibitor. C- RPL11 and MDM2 are located in the cells nuclei. MiR-7-5p loss of function promoted the nucleocytoplasmic translocation of MDM2 and RPL11 as indicated by the reduced NI (nuclear intensity) score of the treated cells. D- RPL5 and MDM2 are located in the nuclei of cells. MiR-7-5p loss of function promoted the nucleocytoplasmic translocation of MDM2 and RPL5. RPL5 retained an intense staining in the cytoplasm and nuclei of the treated cells. Nuclei were counterstained with DAPI (blue). Images were analyzed by LSM 800 and Zen software (Zeiss). The mean fluorescence intensity is presented in the pictures as overall intensity (OI). The mean nuclear localization intensity is calculated as nuclear intensity (NI) = the number of green/red pixels that colocalize with DAPI nuclear stain. Yellow color in the merged pictures indicates the colocalization of the red and green fluorescence. The scale bar is shown in the bottom right panel = 20 μm.
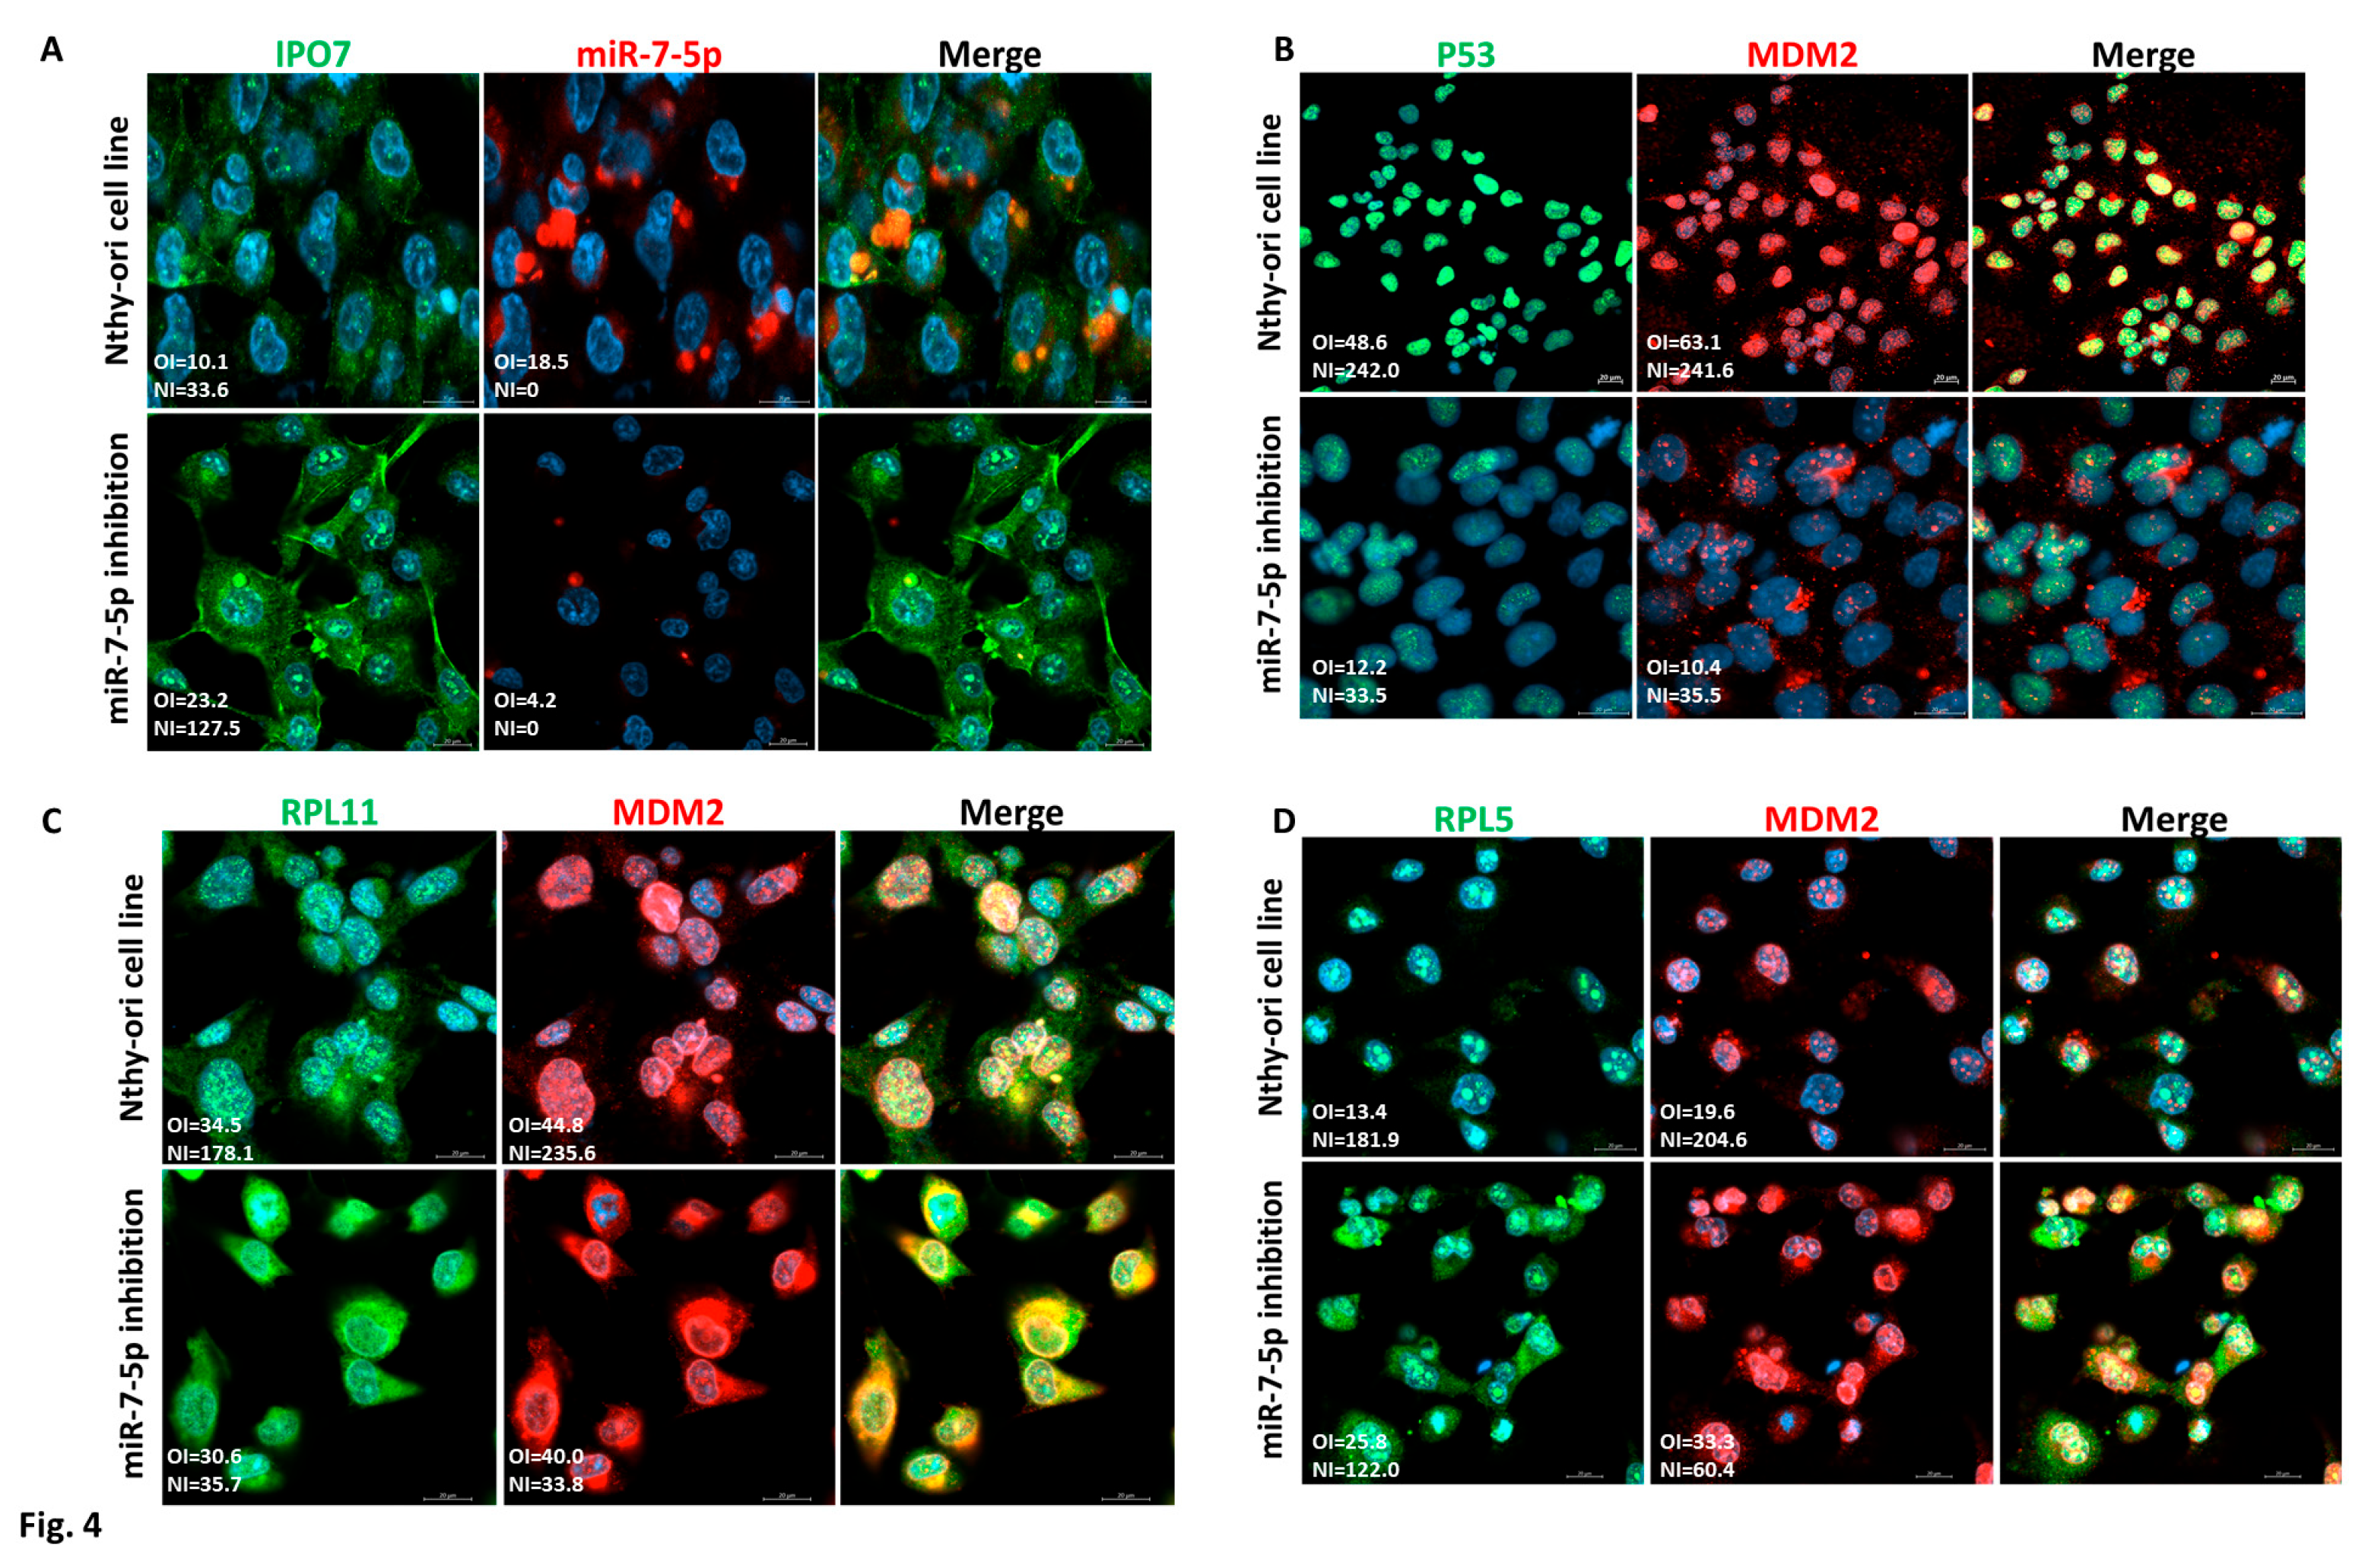
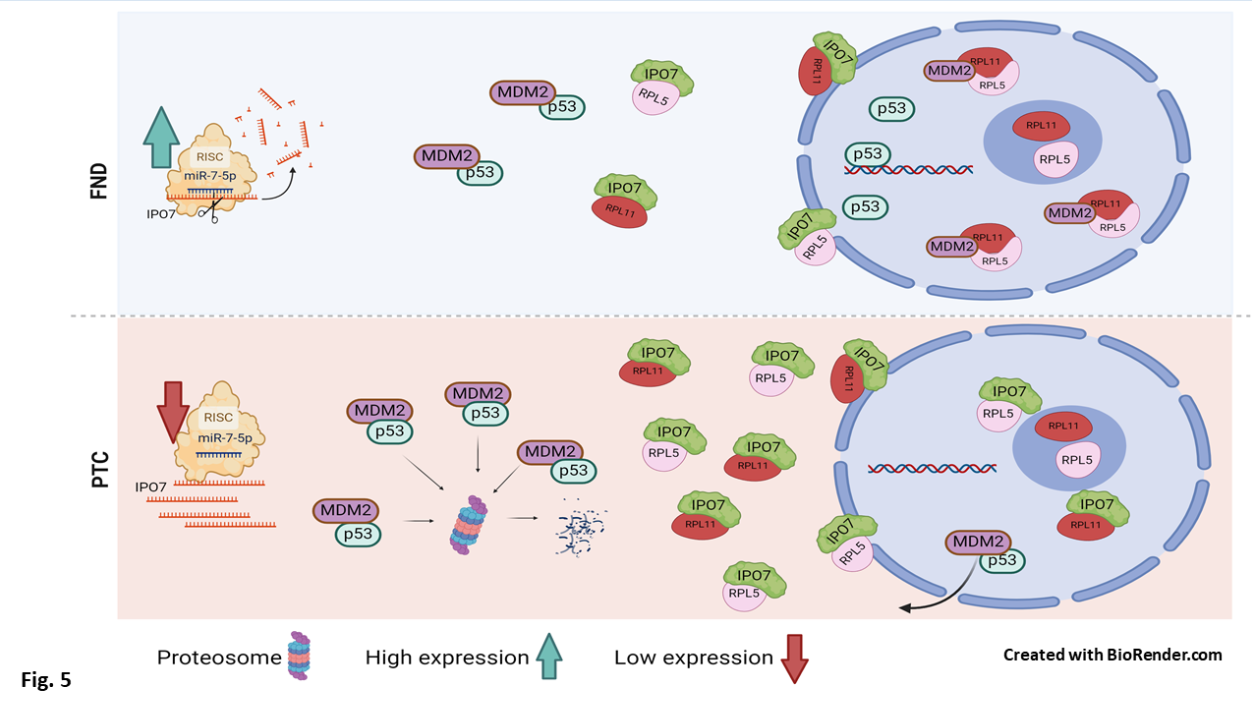
Figure 5.
p53 is differentially regulated in malignant and benign thyroid cells. In FND, a low level of IPO7 leads to less import of ribosomal proteins to the nucleolus. The cellular stress associated with proliferation disturbs the ribosomal biogenesis and increases the availability of RPL11 and RPL5 in the nucleus. In the nucleus, RPL11 and RPL5 bind to MDM2 and inhibit the MDM2/p53 complex formation and the MDM2-mediated p53 proteasomal degradation resulting in increased stability of p53. In PTC, miR-7-5p downregulation causes IPO7 upregulation. High levels of IPO7 facilitate the increased import of ribosomal proteins into the nucleolus for use in cancer-associated ribosome biogenesis. Therefore, RPL11 and RPL5 are no longer free in the nucleus for MDM2 inactivation. Free MDM2 binds to p53 and the complex translocates to the cytoplasm facilitating the p53 proteasomal degradation.
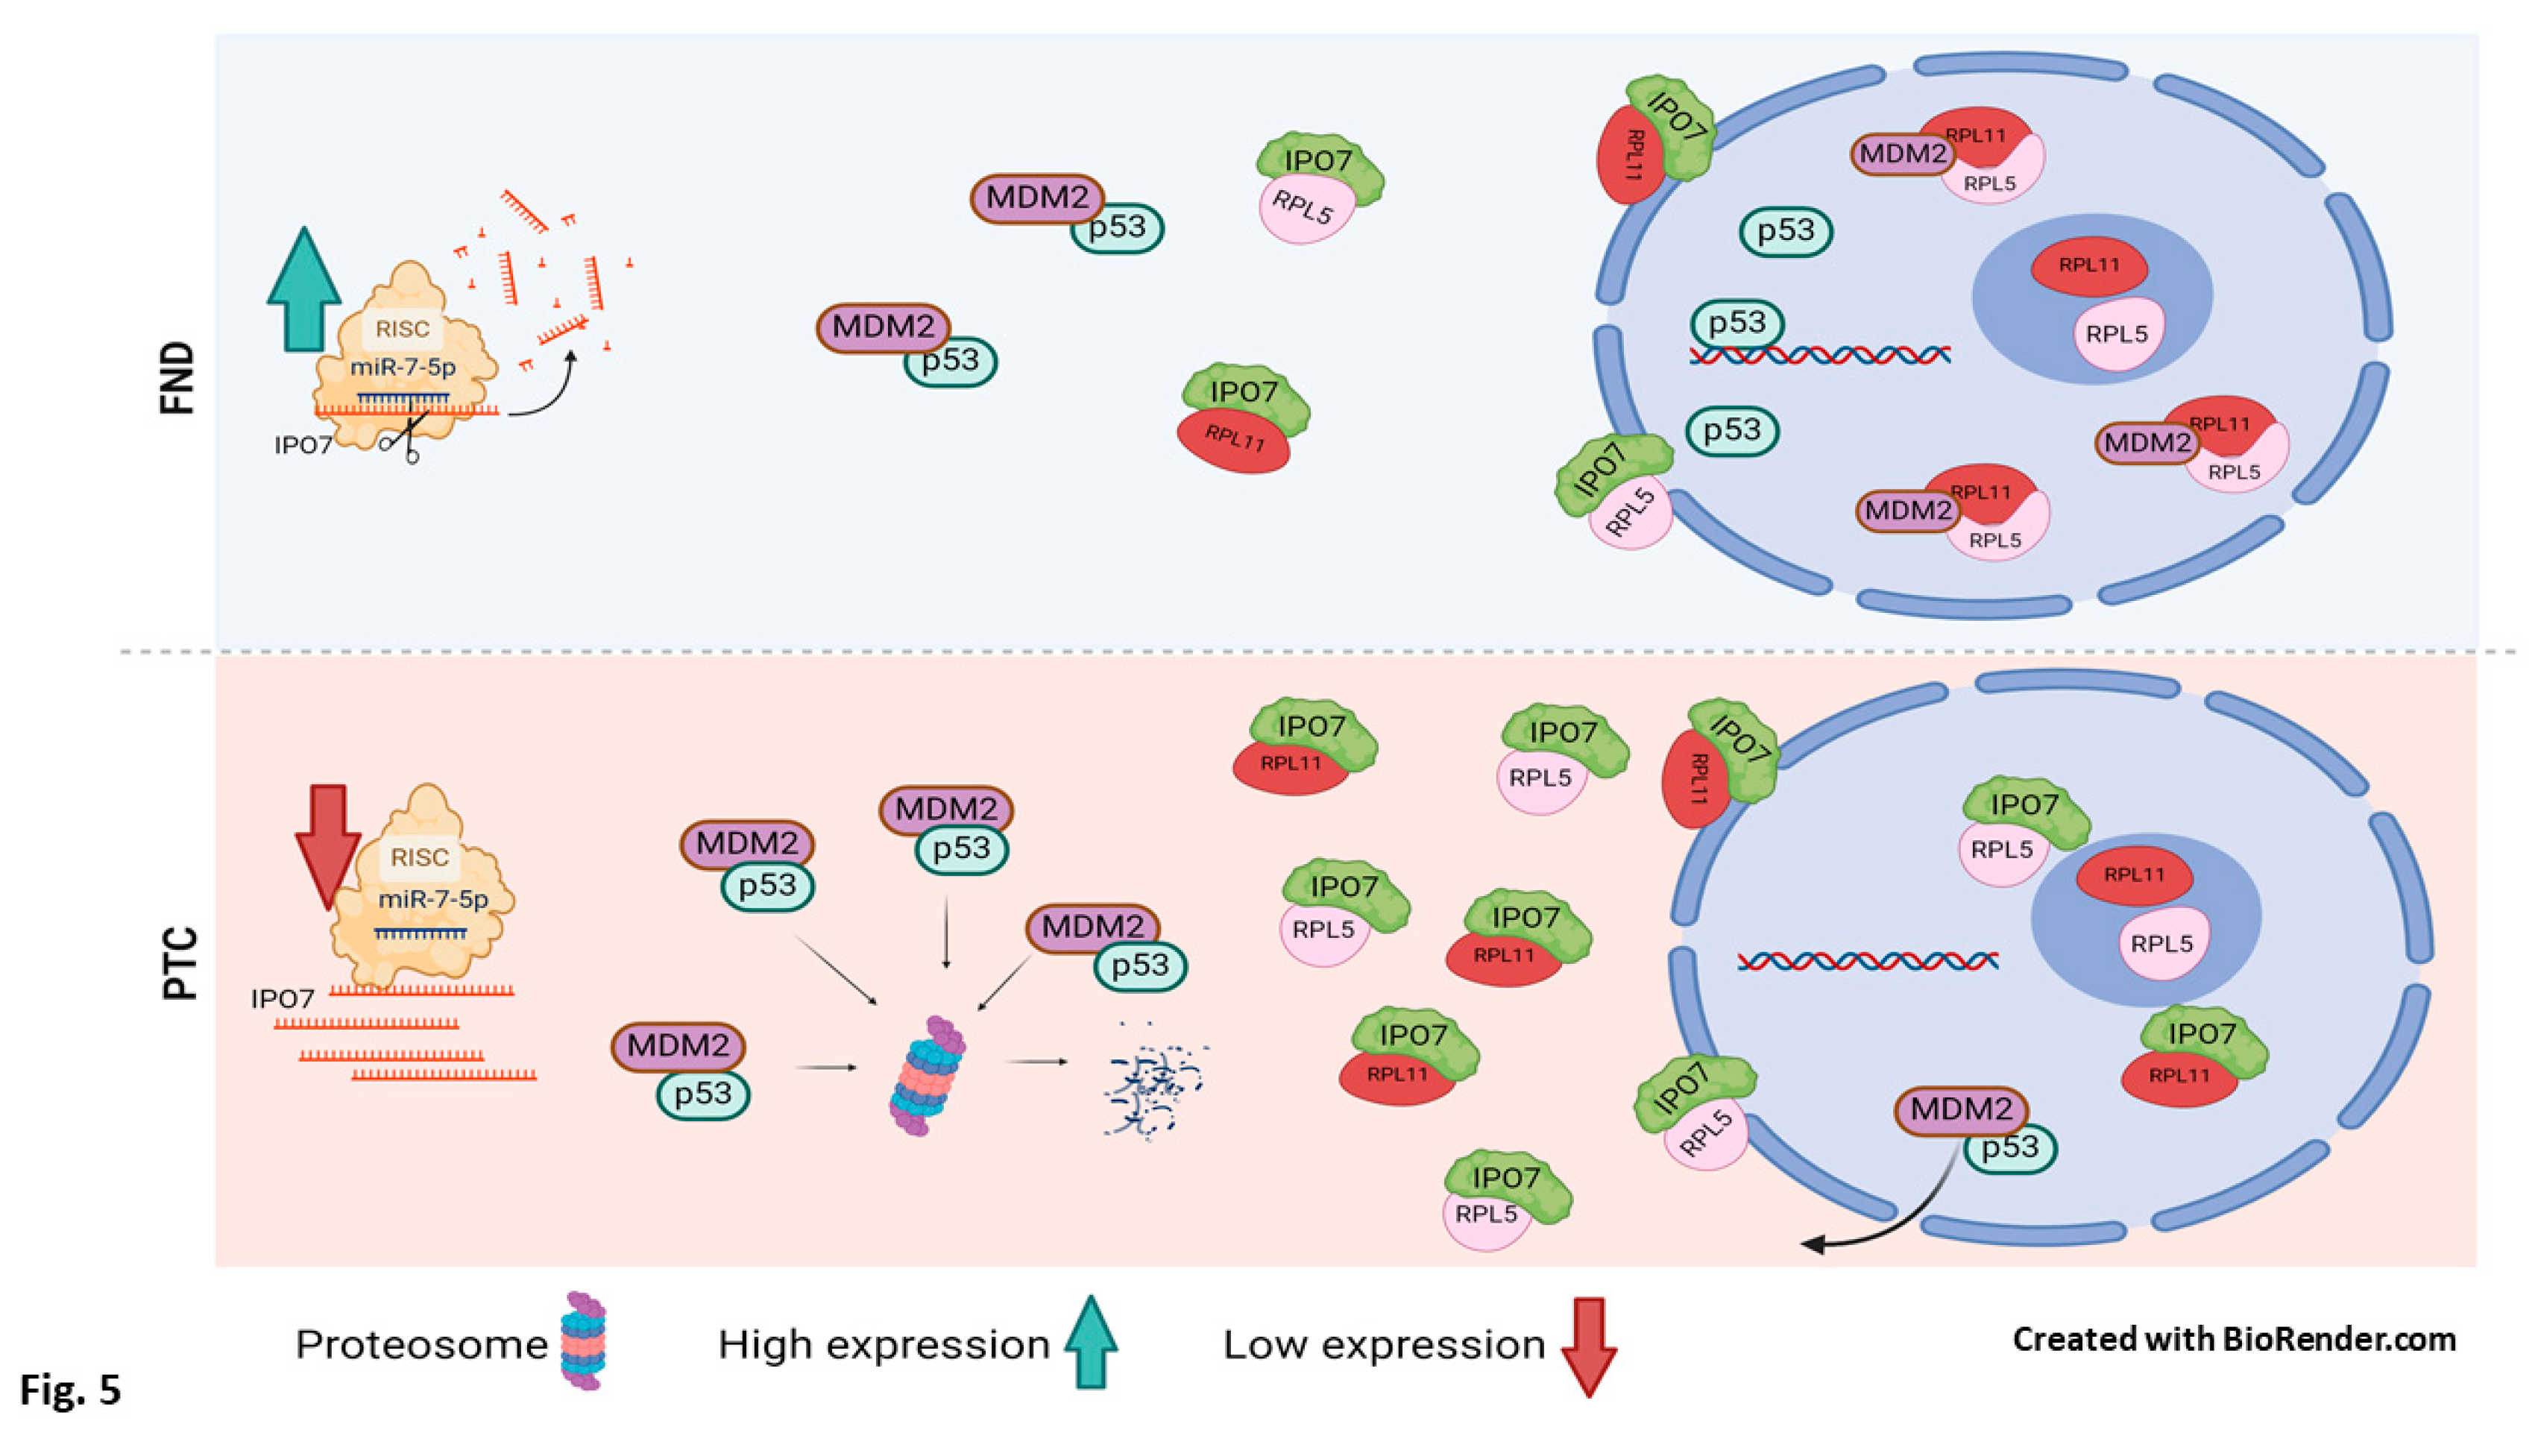

Table 1.
Expression of IPO7 and miR-7-5p in different thyroid tissue samples.
|
Mean expression value ΔCt (SD) |
NIFTP vs. FND | PTC vs. FND | |||||
| FND (n = 10) | NIFTP (n = 11) | PTC (n = 30) | Fold Change | p-value * | Fold Change | p-value * | |
| IPO7 | 2.35 (1.48) | -5.83 (3.25) | -9.82 (3.86) | 290.02 | <0.0001 | 4608.24 | <0.0001 |
| miR-7-5p | -1.05 (1.15) | 8.25 (5.07) | 9.57 (4.17) | -630.35 | 0.0003 | -1573.76 | <0.0001 |
Fold change is calculated using the 2-(ΔΔCt) formula. * Statistical analysis done using Student’s t-test.
Table 2.
Endogenous activity of cell death signaling pathways in PTC cultured cells measured by luciferase assay.
Table 2.
Endogenous activity of cell death signaling pathways in PTC cultured cells measured by luciferase assay.
| miR-7 level a | Signaling pathways b | |||||
| p53 | pRb/E2F | MYC/MAX | NFκB | MAPK/JNK | ||
| Sample 1 | -22.85 | -6.59 | -2.67 | -4.51 | -1.88 | -11.38 |
| Sample 2 | -15.37 | -3.70 | -3.64 | -3.76 | -1.46 | -58.01 |
| Sample 3 | -31.71 | 1.47 | -1.96 | -1.90 | -1.14 | -152.93 |
| Sample 4 | -2.38 | -4.63 | -5.87 | -7.41 | -2.45 | -15.54 |
| Sample 5 | -62.77 | -3.14 | -1.97 | -4.26 | -1.23 | -14.69 |
| Sample 6 | -13.97 | -2.26 | 1.99 | 1.35 | 4.09 | -1.28 |
| Sample 7 | -43.74 | -1.78 | -2.39 | -2.08 | 1.29 | -5.97 |
| Sample 8 | -17.72 | -2.45 | -1.93 | -1.71 | 1.63 | -3.29 |
| p-value | <0.001 | <0.001 | 0.007 | 0.016 | <0.001 | <0.001 |
a: miRNA level measured by RT-PCR and expressed in fold change in PTC compared to FND controls; b: Activity of cell death signaling pathways expressed as fold change of the luciferase activity in PTC (primary cultured cells from 8 different tumor samples) compared to FND (primary cultured cells from 3 different samples).
Table 3.
Effect of miR-7-5p gain of function on IPO7 expression and cell death signaling pathways activity in PTC.
Table 3.
Effect of miR-7-5p gain of function on IPO7 expression and cell death signaling pathways activity in PTC.
|
Sample (Diagnosis) |
Expression level a | Signaling pathway activity b | |||||
| p53 | pRb/E2F | Myc/Max | NFκB | MAPK/JNK | |||
| miR-7-5p | IPO7 | p53 | E2F/DP1 | Myc/Max | NFκB | AP-1 | |
| 1 (PTC) | 22.50 | -92.72 | 8.23 | 4.86 | 6.01 | 1.43 | 1.62 |
| 2 (PTC) | 43.47 | -19.41 | 5.29 | -1.22 | 1.71 | 1.87 | -1.42 |
| 3 (PTC) | 48.23 | -7.45 | 2.72 | 1.32 | 4.34 | 1.73 | 1.28 |
| 4 (PTC) | 201.11 | -16.87 | 1.07 | 1.24 | 1.14 | 1.64 | 1.70 |
| 5 (PTC) | 36.05 | -12.27 | 2.60 | 2.86 | 1.84 | -1.36 | -1.86 |
| P Value | <0.002 | 0.04 | 0.067 | 0.01 | 0.45 | 0.38 | |
IPO7 is a predicted target of miR-7-5p with a complementary sequence at position 1909-1916 of its 3’ untranslated region [TargetScan Database]. a: Expression level calculated as fold change of miR-7-5p and IPO7 in primary cultured PTC cells transfected with miR-7-5p mimic compared to cells transfected with negative control; Fold change is calculated using the 2-(ΔΔCt) formula. b: Pathway activity expressed as fold change of the luciferase activity of the same primary cultured PTC cells transfected with miR-7-5p mimic compared to cells transfected with negative control. Results from experiments performed on five different PTC cases are shown. Statistical analysis is done using paired Student’s t-test.
Disclaimer/Publisher’s Note: The statements, opinions and data contained in all publications are solely those of the individual author(s) and contributor(s) and not of MDPI and/or the editor(s). MDPI and/or the editor(s) disclaim responsibility for any injury to people or property resulting from any ideas, methods, instructions or products referred to in the content. |
© 2025 by the authors. Licensee MDPI, Basel, Switzerland. This article is an open access article distributed under the terms and conditions of the Creative Commons Attribution (CC BY) license (http://creativecommons.org/licenses/by/4.0/).
Copyright: This open access article is published under a Creative Commons CC BY 4.0 license, which permit the free download, distribution, and reuse, provided that the author and preprint are cited in any reuse.


