
Submitted:
14 April 2025
Posted:
15 April 2025
You are already at the latest version
Abstract
Nucleic acids are significant components of daily diet and have attracted attention regarding their metabolic and nutritional roles. Numerous studies have explored the biological functions of nucleotides, nucleosides, and functional nucleic acids like microRNAs. However, the nutritional value and metabolic mechanisms of RNA oligonucleotides derived from ribosomal RNA (rRNA)—a major form of nucleic acids in nature remain underexplored. Here, yeast was utilized as a model organism to investigate the absorption and metabolism of oligonucleotides obtained from rRNA. We cultured yeast directly using RNA oligonucleotides as one nutrient, demonstrating that yeast can efficiently utilize RNA oligonucleotides (length < 30 nt) as a nitrogen source. Through proteomic analysis to assess the expression levels of key proteins associated with transport and metabolic processes, we found that the key proteins involved in endocytosis, autophagy, and RNA degradation were upregulated. These results clearly demonstrate that yeast directly uptakes RNA oligonucleotides via endocytosis, which are subsequently degraded into nucleosides, ammonia and β-Alanine through autophagy and RNA degradation, thus providing substrates for synthesizing nucleic acid and other organic nitrogenous metabolites. Our findings and proposed mechanisms for RNA absorption and metabolism in eukaryotic cells can promote future research in both nutrition and nucleic acid metabolism.
Keywords:
RNA oligonucleotide
; nucleic acid metabolism
; yeast
; nitrogen source
; endocytosis
; autophagy
1. Introduction
Nucleic acids are essential for cell growth, development, proliferation and differentiation, and they play crucial roles in biological processes [1,2,3,4,5]. As we know, most foods are organisms (or parts of organisms) composed of cells, and all cells contain both DNA and RNA, mainly in the form of biomacromolecules. It is believed that nucleic acids in food can be utilized as nutrients for heterotrophic organisms. If dietary nucleotides and nucleosides derived from digested nucleic acids are insufficient, organisms can produce them through their endogenous de novo synthesis pathways. Consequently, nucleic acids are classified as semi-essential or conditionally essential nutrients [6]. The current basic understanding is that nucleic acids are absorbed by the intestine after being digested into nucleosides (NSs) or nucleotides (NTs). In the food industry, NTs have been added to infant formulas and foods for special medical purposes [7,8].
These external absorbed NSs and NTs have been shown to promote the differentiation of intestinal epithelial cells [9,10,11], provide energy (using uridine) for cellular growth and reproduction [12,13], benefit liver health [14], facilitate intestinal development [15], enhance gut microbiota composition [16,17], and improve immune function [18,19,20]. However, the underlying mechanisms are not well clarified, and the possibility of absorbing oligonucleotides remain unknown. It is necessary to study in detail for understanding the metabolism mechanisms and nutritional function of nucleic acids, especially those that are not digested into nucleotides.
In a metabolically active cell, RNA constitutes approximately 6% of the total weight (as high as 20% of the dry weight) in mammalian cells, primarily comprising (> 95%) RNA macromolecules such as ribosomal RNA (rRNA), transfer RNA (tRNA), messenger RNA (mRNA), microRNA (miRNA), and several other kinds of RNA [21]. Low molecular weight derivatives of NTs (including NTPs, dNTPs, and coenzymes involving NTs) account for less than 5%. Recent studies have shown that miRNAs in food can be absorbed to regulate gene expression in the eater (mouse or human cells), although RNA is believed to be absorbed by organisms after being digested into NTs or NSs [22,23]. For example, Chen et al. demonstrated that exogenous dietary miRNAs are absorbed by pit cells via the SIDT1 intrinsic carrier protein and subsequently transported to other tissues through exosomes [24]. These findings suggest that RNA oligonucleotides can be directly absorbed by organisms. However, most researches to date have focused on the gene regulatory functions of RNA oligonucleotides, with limited inquiry into their intrinsic nutritional value. Incidentally, total DNA in a cell is usually less than 10% of total RNA. Because rRNA makes up approximately 80% of total cellular RNA [21,25], and RNases can easily convert rRNA into RNA oligonucleotides of various lengths, we propose here that environmental RNA primarily exists as RNA oligonucleotides derived from rRNA. If it is true, these RNA oligonucleotides may be directly utilized as nutrients by cells.
In this study, we utilized the yeast (Komagataella phaffii X-33) as a model organism to investigate the nutritional potential of RNA oligonucleotides and elucidate the underlying molecular mechanisms of their absorption and catabolism. To minimize the interference from other nutrients, we cultured the yeast cells using RNA oligonucleotides as the sole nitrogen source. The results show that yeast can effectively uptake RNA oligonucleotides (length < 30 nt), and the proteomic analysis reveals that proteins related to endocytosis, autophagy, and RNA degradation may greatly contribute to their catabolism. This study offers a novel perspective on the utilization of RNA oligonucleotides as nutrients by eukaryotic cells, providing insights and a theoretical foundation for further exploring nucleic acid metabolism and its nutritional functions.
2. Materials and Methods
2.1. Strain Cultivation and Culture Medium
The strain of Komagataella phaffii X-33 (CGMCC, Beijing, China) was used as the yeast cells. All medium components were from China National Pharmaceutical Group Co., Ltd. (Shanghai, China). Initially, the yeast was inoculated onto YPD solid medium (composition: 20 g/L glucose, 20 g/L peptone, 10 g/L yeast extract, and 20 g/L agar) using the streak plate method and incubated at 28°C in an aerobic environment for 3 days. The culture seeds were obtained as follows. Single colonies of yeast were picked from YPD solid medium and inoculated into liquid basic medium (composition: 0.5 g/L K2HPO4, 0.5 g/L MgSO4, 0.5 g/L NaCl, 5 g/L or 20 g/L glucose and 1 g/L NaNO3), followed by incubation under aerobic conditions at 28°C with shaking at 150 r/min for 3 days. Afterward, the culture was centrifuged (4°C, 10,000 r/min, 5 min) to remove the medium, and collected the yeast cells. The yeast cells were washed with 0.2 mol/L PBS buffer (composed of 0.2 mol/L Na2HPO4·12H2O and 0.2 mol/L NaH2PO4·2H2O) to eliminate residual glucose and NaNO3. After washing, the samples were centrifuged again (4°C, 10,000 r/min, 5 min) to collect the yeast cells, and the washing steps were repeated three times. The yeast cells were then resuspended in the same buffer, which served as the yeast seed culture (OD600 ~ 0.5).
For the culture medium containing nucleic acids, RNA oligonucleotides, and/or nucleotides (or nucleosides) were added to the carbon-free and/or nitrogen-free basic medium to achieve final concentrations ranging from 1 g/L to 45 g/L. The nucleic acids were filtered through a membrane with a pore size of 0.22 μm before being added to the culture medium. The prepared yeast seed culture was inoculated at a 5% inoculum size into 60 mL of medium containing nucleic acids and incubated at 28°C under aerobic conditions with shaking at 150 r/min. Yeast growth was monitored by measuring the optical density at a wavelength of 600 nm (OD600) using a microplate reader (Varioskan Flash, Thermo Scientific) as well as employed the plate count method for accurate quantification. The growth rate of yeast during the logarithmic phase (the number of divisions per unit time) can be calculated using the following formula: [(lgX2-lgX1)/lg2]/(t2-t1), in which X1 and X2 represent the yeast cell counts at the respective cultivation times of t1 and t2, respectively.
2.2. RNA Oligonucleotide Used and Its Quantification
Two types of yeast RNA oligonucleotides were used. Mix-A, composed of 20%–35% RNA oligonucleotides (length < 30 nt) and 65%–80% nucleotides, was obtained from Nanjing Tongkai Zhaoye Biotechnology Co., Ltd. (Nanjing, China). Mix-B, which contains over 90% RNA oligonucleotides ranging from 10 to 100 nt, has nucleotide content below 1% and was sourced from Beijing Solabio Technology Co., Ltd. (Beijing, China). Nucleotides (NT) and nucleosides (NS) were obtained from QZU Co., Ltd. (Nantong, China). Yeast cells were cultured in a basic medium containing RNA. At various time intervals, the cultures were centrifuged (4°C, 10,000 r/min, 5 min) to collect the cell-free supernatant. The concentration of residual RNA in the supernatant was measured by absorbance at 260 nm (OD260) using a NanoDrop 2000 spectrophotometer (Thermo Scientific).
2.3. Analysis of RNA Oligonucleotide Length Distribution Using Capillary Electrophoresis
The sample (Mix-A or Mix-B) was diluted to a final concentration of 2 ng/μL using RNase-free water, and 20 μL was added to individual wells of a 96-well plate compatible with the Qsep100 system (BiOptic Inc.), from which 1.0 μL was drawn by the capillary. Other parameters included sample injection at 4 kV for 10 s and separation at 8 kV for 200 s. The standard cartridge S2 was used, and Tris-Boric acid-EDTA was utilized as the electrophoresis buffer.
2.4. Analysis of RNA Oligonucleotides Via High-Performance Liquid Chromatography (HPLC)
Mix-A and Mix-B were analyzed using a YMC-Pack ODS-AQ reversed-phase column (4.6 mm × 250 mm) on an HPLC machine (Hitachi Chromaster 5430 Diode Array Detector (Uvison, China)). Mobile phase A: Aqueous solution of 50 mM ammonium formate (pH 6.45). Mobile phase B: 50% acetonitrile aqueous solution containing 50 mM ammonium formate (pH 6.45). The gradient for separation was set as follows: Mobile phase B was maintained at 10% for 0–8 min, increased from 10% to 12% over 8–9 min, maintained at 12% over 9–19 min, increased from 12% to 20% over 19–24 min, increased from 20% to 100% over 24–29 min, and maintained at 100% over 29–39 min. It then decreased from 100% to 10% over 39–40 min and was maintained at 10% over 40–70 min. Other conditions included a flow rate of 0.5 mL/min at 25°C, with detection at 260 nm.
2.5. Digestion of RNA Oligonucleotide to Shorter Fragments by RNase A
Mix-B (10 g/L or 50 g/L) was incubated with RNase A (0.1 g/L or 0.5 g/L) at 28°C for 3 days in a total reaction volume of 20 mL. The enzymatic digestion products were subjected to electrophoresis on a 15% denaturing polyacrylamide gel, and the extent of digestion was analyzed by quantifying the intensity of the bands observed in the gel using image analysis software (Image Lab). RNA ladder (10–50 nt) (Cat # R0207) was obtained from Biyuntian Biotechnology Co., Ltd. (Shanghai, China) and served as a size ladder for comparison.
2.6. Electrophoretic Analysis of RNA Oligonucleotide Length
Denaturing (8 mol/L urea) polyacrylamide gel electrophoresis (15% dPAGE) was performed. Solutions of 33.3 g/L Mix-A or 0.6 g/L Mix-B were used, and 4.0 μL was loaded. Band intensity was analyzed using image analysis software (Image Lab). An RNA ladder (10–50 nt) (Cat# R0207, Biyuntian Biotechnology Co., Ltd., Shanghai, China) was used.
2.7. RNA Isolation from Yeast and RT-qPCR
Yeast was cultured as described above for 4 and 6 days, respectively. 1 mL aliquot of yeast suspension (OD600 ~ 1.0) was centrifuged at 10,000 r/min for 5 minutes at 4°C to remove the supernatant. Total RNA was subsequently extracted from the yeast cells using TRIzol reagent (Thermo Fisher Scientific) following the manufacturer’s protocol. The quality and concentration of the RNA were assessed using a NanoDrop 2000 spectrophotometer (Thermo Scientific). RNA concentration was measured based on absorbance at 260 nm (OD260), and RNA purity was confirmed by the OD260/OD280 ratio (1.9–2.0). For cDNA synthesis, 50 ng of total RNA was added to a 10 μL reaction mixture consisting of the FastKing RT Kit (TianGen, KR116) according to the manufacturer’s protocols. To quantify the expression levels of nucleases within the yeast, reverse transcription quantitative PCR (RT-qPCR) was performed utilizing the PikoReal 96 Real-time PCR System (Thermo Scientific). The PCR cycling conditions included an initial denaturation at 94°C for 3 minutes, followed by 40 cycles of three-step amplification comprising denaturation at 94°C for 30 s, annealing at 60°C for 30 s, and extension at 72°C for 45 s. Each 10 μL PCR reaction mixture contained 5 μL of BlasTaq 2× qPCR Master Mix (abm, Cat# G891), 1 μL of cDNA, and 0.5 μM of both forward and reverse primers. The primers used for the nuclease genes are listed in Table S3. Glyceraldehyde-3-phosphate dehydrogenase (GAPDH) served as the reference gene to standardize the expression levels of the target genes. The expression levels of the target genes were calculated using the 2−ΔCt method. ΔCt = Ct target gene – Ct GAPDH.
2.8. 4D-DIA Quantitative Proteomic Analysis and Data Processing
Yeast cells were cultured in a basic medium containing Mix-A (5 g/L) or glutamate (5 g/L) as the sole nitrogen source. The composition of the medium included: 0.5 g/L K2HPO4, 0.5 g/L MgSO4, 0.5 g/L NaCl, and 20 g/L glucose (as the sole carbon source), along with either 5 g/L Mix-A or glutamate (without NaNO3). After incubation for 3 days, the culture was subjected to centrifugation (4°C, 10,000 r/min, 5 min) to remove the supernatant. The pellet was subsequently washed with 0.2 mol/L PBS buffer to eliminate residual culture medium. The cleaned yeast cells were collected, rapidly frozen in liquid nitrogen, and stored at -80°C until used for protein extraction.
The extraction buffer (containing 1% SDS, 200 mM dithiothreitol (DTT), 50 mM Tris-HCl, and a protease inhibitor) was added to the yeast cells and thoroughly mixed using vortex mixing. The samples were subjected to high-throughput tissue homogenization three times for 40 s each. The samples were then placed on ice and allowed to react for 30 min, with vortex mixing for 10 s every 5 minutes. Subsequently, the samples were heated at 100°C for 10 min and then cooled on ice. The mixture was centrifuged (4°C, 12,000 g, 20 min), and the supernatant was collected. Pre-cooled acetone was added to the supernatant at a volume ratio of 1:4, and it was allowed to precipitate at -20°C for 12 h. The samples were then centrifuged again (4°C, 12,000 g, 20 min) to remove the supernatant. Subsequently, 90% pre-cooled acetone was added to the pellet, mixed, and centrifuged (4°C, 12,000 g, 20 min) to remove the supernatant. This step was repeated twice. Finally, the pellet was dissolved in a protein lysis buffer (containing 8 mol/L urea, 1% SDS, and protease inhibitors) and centrifuged (4°C, 12,000 g, 20 min) to collect the supernatant. The protein concentration was quantified using the Bicinchoninic Acid (BCA) assay, after which SDS-PAGE electrophoresis analysis was performed.
To a 100 μg protein sample, 60 μL of lysis buffer was added, followed by the sequential addition of 100 mM Triethylammonium bicarbonate (TEAB) and 10 mM Tris (2-carboxyethyl) phosphine (TCEP). The reaction was allowed to proceed at 37°C for 60 min before the addition of 40 mM Iodoacetamide (IAA), which was incubated in the dark at 25°C for 40 min. Pre-cooled acetone (with an acetone: protein sample volume ratio of 6:1) was then added to the reaction tube, and the mixture was allowed to stand at -20°C for 4 h before centrifugation (4°C, 10,000 g, 20 min) to collect the precipitate. The precipitate was dissolved in 100 mM TEAB, and trypsin was added at a mass ratio of 1:50 (enzyme activity ≥ 250 units/mg), followed by digestion at 37°C for 12 h.
The digested peptides were dried and then re-solubilized in 0.1% Trifluoroacetic acid (TFA). Desalting was accomplished using hydrophilic-lipophilic balance (HLB) cartridges. The samples were then concentrated using a vacuum concentrator and quantified using the Thermo Fisher Scientific Peptide Quantification Kit (item #23275).
The peptides were dissolved in a mass spectrometry loading buffer (comprising 2% acetonitrile (Fisher, USA) and 0.1% formic acid (Fisher, USA)) for DIA detection analysis. Peptide separation was performed using an EASY-nLC 1200 system (Fisher, USA) with a C18 column (75 μm × 25 cm, Ionopticks, USA). Mobile phase A consisted of 2% acetonitrile and 0.1% formic acid, while mobile phase B contained 80% acetonitrile and 0.1% formic acid. The gradient for separation was set as follows: from 3% to 28% mobile phase B over 0–33 min, from 28% to 44% mobile phase B over 33–37 min, from 44% to 90% mobile phase B over 37–40 min, and maintaining 90% mobile phase B from 40–44 min. The flow rate was set to 250 nL/min. Subsequently, Data-Independent Acquisition (DIA) was performed using the timsTOF Pro2 mass spectrometer (Bruker, Germany) in DIA-PASEF mode. The detection mode was set to positive ion, with an ion source voltage of 1.5 kV and a mass range of 100 to 1700 m/z. The accumulation and ramp times were both set to 100 ms, and the ion mobility coefficient (1/K0) varied from 0.6 to 1.6 Vs·cm-2, utilizing a total of 64 DIA-PASEF windows (25 isolation windows).
DIA raw data were analyzed using SpectronauTM software (version 14) (Biognosys, USA). For quantification, six specific peptides were selected for each protein, and three ions for each peptide were analyzed. The parameters were set to Protein FDR ≤ 0.01, Peptide FDR ≤ 0.01, Peptide Confidence ≥ 99%, and XIC width ≤ 75 ppm. Quantification was achieved by summing the peak areas for each protein.
Proteomic data were uploaded to the Majorbio Cloud platform (https://cloud.majorbio.com) for further analysis. The R language package was used to calculate the p-values and the fold change (FC) values of differences in protein expression between the two groups using the t. test function. Proteins with a significance level of p < 0.05 and FC > 2 or FC < 0.5 were classified as differentially expressed proteins (DEPs). Functional annotation was performed based on KEGG database (https://www.genome.jp/kegg/). Functional enrichment analysis of the identified proteins was conducted using Python (https://www.python.org/). The enrichment analysis was performed by mapping the identified proteins to KEGG pathways, and statistical significance was assessed by calculating the p-values to identify significantly enriched biological pathways.
2.9. Statistical Analysis
The experimental data for statistical analysis were visualized using Origin software. Electrophoresis image data were processed with Image Lab software. All graphical data are presented as mean ± standard deviation (SD). Comparisons between experimental groups were performed using one-way analysis of variance (ANOVA) followed by the least significant difference (LSD) post hoc test, utilizing SPSS version 25.0. p* < 0.05 and p** < 0.01 were considered significant. p > 0.05 was regarded as not significant (n.s.).
3. Results
3.1. Oligonucleotides Serve as Superior Nitrogen Sources for Yeast Growth and Reproduction
To investigate whether RNA oligonucleotides can be used by yeast as a nitrogen source, we used Mix-A, an RNA sample prepared by enzymatic hydrolysis (using nuclease P1) from a company (Nanjing Tongkai Biotechnology Co., Ltd.). The purity of Mix-A was higher than 95% after drying (checked by UV-Vis spectroscopy), and the impurities primarily consisted of bound water and salts (Figure S1 and Table S1). The product report for Mix-A shows that it contains about 65%–80% nucleotides with attached 5′-phosphate groups. The length of Mix-A was also assessed by dPAGE, showing that more than 90% of Mix-A consists of oligonucleotides shorter than 30 nt (Figure S2). To exclude the interference from other organic compounds (which contain carbon and nitrogen elements) and simplify the culture system, we used a basic medium containing only mineral salts (0.5 g/L K2HPO4, 0.5 g/L MgSO4, 0.5 g/L NaCl, and 1 g/L NaNO3) as the basic components, with NaNO3 providing nitrogen elements. If necessary, 5 g/L glucose was used as the primary carbon source (Figure 1).
As shown in Figure 1A, yeast cells grew well when glucose was used as the primary carbon source and Mix-A as the sole nitrogen source (NaNO3 was not present in this case), although yeast grew much more quickly using YPD medium. However, during the stationary phase of cultivation, the yeast exhibited similar cell density (lg values are about 9.5, or 3.2×10⁹ CFU/mL). The growth curve (Mix-A + Glucose) was quite similar to that using glutamate to replace Mix-A (Glutamate + Glucose), indicating that Mix-A and glutamate have similar efficiencies as nitrogen sources. The calculated growth rate for Mix-A + Glucose (1.8 d⁻¹) was significantly higher than that of Glutamate + Glucose (0.8 d⁻¹), indicating that oligonucleotides may serve as a high-quality nitrogen source comparable to glutamate (Figure 1B). Obviously, NaNO3 is a very poor nitrogen source for yeast. It is noteworthy that RNA also contains carbon, which may also be utilized by yeast.
In the case that glucose was removed from above medium, i.e. when only Mix-A supplied nitrogen and carbon element for growth, yeast also grew well (Figure 1C), although the growth rate was lower compared to glutamate or YPD (Figure 1D). Interestingly, when Mix-A was added to the YPD medium, a significant increase in the growth rate (from 4.1 to 5.3 d⁻¹) was also observed. The difference in growth rates between Mix-A and glutamate was not substantial, with values of 1.0 d-1 and 1.5 d-1, respectively (Figure 1D). These results demonstrate that RNA can provide both nitrogen and carbon sources for yeast growth. On the other hand, while RNA may serve as an excellent nitrogen source, but not so good as a carbon source.
3.2. Short Oligonucleotides Are Preferentially Assimilated by Yeast Compared to Nucleotides
Since Mix-A contains both short oligonucleotides and nucleotides, we must address the interesting question of which one is preferentially utilized by yeast. We used Mix-B, which comprises RNA oligonucleotides ranging from 10 to 100 nt, digested from yeast rRNA. We further digested Mix-B with RNase A to generate shorter RNA products (with 3′-phosphate groups) that are 5–30 nt long (Figure 2A). For comparison, a mixture of nucleotides (NTs), including AMP, UMP, CMP, and GMP, was also used. As shown in Figure 2B, amazingly, for all media containing short oligos (Mix-A, Mix-B, and digested products of Mix-B), yeast grew much better than that of nucleotides (NT). This difference in growth rate can also be clearly seen in Figure 2C. The medium containing the digested products of Mix-B (Digested Mix-B) showed highest growth rate (4.8 d⁻¹), which is about four times faster than that of NT group (1.4 d⁻¹). After 7 days of culture, the cell densities for Mix-A and Digested Mix-B were highest (lg value was 9.6, or 4.0×10⁹ CFU/mL), which was about 100 times higher than that for NT (lg value was 7.7, 5.0×10⁷ CFU/mL). When comparing the three groups containing short RNA oligonucleotides, more interestingly, the growth rate follows the order: Digested Mix-B (5–30 nt) > Mix-A (containing about 20%–35% length < 30 nt oligonucleotides and 65% NT) > Mix-B (10–100 nt) (Figure 2B,C). Accordingly, we conclude that shorter oligonucleotides (but not nucleotides) are much easily utilized by yeast than NT.
To determine whether RNA or NT was absorbed by yeast, the absorbance change at 260 nm (OD260) was measured after removing yeast cells by centrifugation (RNA and NT exhibit the maximum absorption at 260 nm) (Figure 2D). Interestingly, a significant decrease in OD260 was observed for Mix-A and Digested Mix-B, but not for Mix-B and NT. Only less than 20% OD260 was remained, indicating more than 80% of Mix-A was consumed. For Mix-B, the OD260 was even increased to some extent. These results suggest that yeast preferentially utilizes oligonucleotides (5–30 nt) compared to either longer RNA (> 30 nt) or nucleotides (NT).
3.3. Simultaneous Utilization of Oligonucleotides and Nucleosides by Yeast
Although several researches have demonstrated that nucleosides (NS) are the primary components absorbed by cells to utilize exogenous RNA [9,10,26], our above results indicate that short RNA oligonucleotides are utilized more quickly than nucleotides. To clarify these contradictory results, we studied this in more details by using several combinations of short RNA oligonucleotides, nucleotides, and nucleosides (Figure 3). It is noteworthy that OD600 values (but not their lg values) are shown in Figure 3A and 3B. Unexpectedly, yeast did not grow well when using NS, although it seems better than with NT (Figure 3A). Very interestingly, when both 1.0 g/L of Mix-A and 5.0 g/L of NS (comprising adenosine, guanosine, cytidine, uridine, and inosine) were present, the cell density was extremely high (OD600 = 1.8 on the 14th day) compared to other groups (OD600 < 1.0 on the 14th day), and even much higher than the mixture of 1.0 g/L of Mix-A and 5.0 g/L of NT (Figure 3A). Actually, the growth rates did not differ greatly, especially during the first few days, with the order being Mix-A + NS > Mix-A > NS (Figure 3B). The quick utilization of Mix-A and NS in the mixture was also confirmed by the change in OD260, with at least 60% of Mix-A and NS being consumed (Figure 3C). These results suggest that yeast can simultaneously utilize short oligonucleotides and nucleosides.
Considering that there are very few opportunities filled with nucleotides and nucleosides around the yeast in nature, it is hypothesized that the corresponding genes for utilization of NT and NS should be in the inhibited (closed) state. We propose that once yeast is cultured for enough time in the presence of short RNA oligonucleotides, those corresponding genes may be expressed for absorbing of both short RNA oligonucleotides and nucleosides. To prove this hypothesis, we first pre-cultured yeast in the medium containing either 1.0 g/L Mix-A or 5.0 g/L NS for 3 days (to OD600 ~ 0.5) as seeds. These seeds were transferred to a new medium containing either 5.0 g/L NS or 1.0 g/L Mix-A at a 5% inoculation rate. These two groups are designated as Mix-A-pre-NS and NS-pre-Mix-A, respectively. In comparison to the control groups of NS pre-cultured in basic medium (designated as NS group) or Mix-A pre-cultured in basic medium (designated as Mix-A group), the cell densities for Mix-A-pre-NS and NS-pre-Mix-A were significantly higher (Figure 3D). On the 7th day, for example, the differences in cell density were as high as 7–9 folds, and the corresponding differences in growth rate were about 5 and 2 times for Mix-A-pre-NS and NS-pre-Mix-A, respectively (Figure 3D and 3E). The consumption of NS and Mix-A was consistent with above results (Figure 3F). Obviously, after pre-cultured using either Mix-A or NS, yeast cells could utilize these substances of nucleic acids much more quicky, indicating that the corresponding genes are activated. This was further confirmed by the result that NS was consumed quickly when culturing yeast first in Mix-A medium, followed by adding NS (data not shown).
Similar experiments were conducted using NT (AMP, GMP, CMP, and UMP) to replace NS (Figure S3). Even after pre-cultured in the medium containing Mix-A, however, no quick growth (from 0.3 d⁻¹ to 0.4 d⁻¹) was observed when culturing in the medium containing NT (5 g/L), indicating that yeast has a limited capacity to directly utilize nucleotides compared to RNA oligonucleotides. Interestingly, when a much higher concentration of NT (15–25 g/L) was used, the growth rate increased moderately (0.7 d⁻¹), but decreased in the presence of 30–45 g/L of NT (0.6 d-1) (Figure S4). Accordingly, the utilization of NT seems to be strictly controlled compared to that of NS.
Collectively, our findings indicate that oligonucleotides of appropriate lengths (e.g., 5–30 nt) are preferentially utilized by yeast compared to nucleosides and nucleotides. In addition, yeast can simultaneously utilize both oligonucleotides and nucleosides through a shared metabolic pathway, but uptake NT cautiously.
3.4. Higher Expression of Yeast Nuclease in the Presence of Short Oligonucleotides
It is well known that nucleases to serve as key enzymes in nucleic acid metabolism, and there are many types of nucleases located in various subcellular compartments such as the nucleus, mitochondria, cytoplasm, exosomes, and vacuoles of yeast cells [27,28,29]. To investigate the utilization of oligonucleotides by yeast, we checked the gene expression of some of these nucleases (found in NCBI database; see Table S2) in response to culturing in the presence of oligonucleotides (Figure 4). As shown in Figure 4A and Figure S5, mRNA levels were measured on the 4th day of culturing using RNase A-treated oligonucleotides (Digested Mix-B) as the sole nitrogen source. The expression of some nucleases was observed at various levels in the nucleus, mitochondria, cytoplasm, exosomes, and vacuoles. Specifically, the nucleases of RNASEH2A in nucleus, RNZ in mitochondria, XRN1 in cytoplasm, and RRP41 in exosomes were expressed at relatively high levels.
To further examine the impact of RNA length on nuclease expression during culturing, we compared three groups of nucleic acids (Mix-B, Digested Mix-B, and NT) with the YPD group as a control. Interestingly, for most nucleases investigated, higher expression was observed for all the test groups (Figure 4B). Notably, in the RNase A-treated group (Digested Mix-B), the expression of nucleases (except for RNASEH2A) was significantly higher even compared to both Mix-B and NT (comparing purple bars with others). These results show that the presence of short RNA oligonucleotides (5–30 nt) in the culturing medium can stimulate the expression of nucleases in yeast. When too long RNA (length > 30 nt) or NT were used, the expression levels could also be upregulated, but at a moderate level. These results further suggest that the short RNA oligonucleotides (5–30 nt) are more easily utilized by yeast.
3.5. Yeast Primarily Absorbs and Metabolizes Oligonucleotides Through Endocytosis and Autophagy
To investigate the possible mechanisms by which yeast assimilates and metabolizes oligonucleotides, proteomic analysis was employed to examine the expression levels of key enzymes involved in transport and catabolic pathways. In this case, we used the control of glutamate that served as the sole nitrogen source instead of Mix-A. Using t-test statistical analysis, we identified 2,727 proteins that were significantly upregulated, and 847 proteins that were downregulated in the oligonucleotide group (Mix-A), compared to the glutamate group (Glu) (Figure 5A). This result indicates that more proteins are required to utilize RNA oligonucleotides as nutrients. Further KEGG pathway annotation analysis revealed that among the proteins associated with transport and catabolism, 233 proteins were found to be upregulated in the Mix-A group (Figure 5B). KEGG enrichment analysis indicated that these upregulated proteins were predominantly enriched in pathways related to endocytosis and autophagy (Figure 5C). This finding suggests that yeast may primarily absorb oligonucleotides through endocytosis and subsequently degrade them via autophagy.
3.6. Expression of Proteins Related to Endocytosis Process
Endocytosis serves as a vital mechanism for nutrient absorption in yeast, encompassing six key stages: budding, vesicle formation, uncoating, early endosomes formation, conversion of early endosomes into late endosomes, and fusion of late endosomes with vacuoles [30]. In this study, we discovered that when Mix-A was provided as the sole nitrogen source, proteins exhibiting significantly elevated expression levels were notably enriched in processes associated with endocytosis (Figure 6). Specifically, several endocytosis-related proteins displayed high levels of specific expression. For example, the Hsc70 protein, which is essential for the uncoating process, along with CAPZB and CAPZA proteins involved in the formation of early endosomes, showed significantly elevated expression in this group (Figure 6A). Furthermore, among the proteins co-expressed in both the Mix-A group and Glu group, Rab7, required for the fusion of late endosomes with vacuoles, was also significantly upregulated for Mix-A group (Figure 6B). This further underscores the critical role of endocytosis in the uptake of oligonucleotides by yeast.
The involvement of key enzymes in the endocytic process and their expression levels are summarized in the schematic diagram (Figure 6C), where proteins with high expression in the Mix-A group are indicated in red font, while those with low expression are shown in green. These findings indicate that when oligonucleotides serve as the sole nitrogen source, yeast primarily relies on the endocytic pathway for absorbing them.
3.7. Expression of Proteins Related to Autophagy, RNA Degradation, and Nucleotide Degradation Processes
Autophagy is a highly conserved catabolic process in eukaryotic cells that promotes cell survival by recycling cellular components and maintaining energy levels [31]. This process involves four critical steps: signal induction, formation of autophagosomes, fusion of autophagosomes with vacuoles, and degradation of the autophagic body within the vacuoles. We investigated the roles of autophagy, RNA degradation, and nucleotide hydrolysis in yeast cells cultured with Mix-A as the sole nitrogen source (Figure 7). It was found that several autophagy-related proteins in the Mix-A group exhibited higher expression levels, particularly those associated with autophagosome formation (e.g., ATG7, Vps34, ATG8, ATG2, ATG11, ATG13, and ATG18) and those involved in the fusion of autophagosomes with vacuoles (e.g., Vti1, Vps11, Vps18, Ykt6, Vps16, and Vps41), all specifically expressed in yeast (Figure 7A). Furthermore, among the proteins co-expressed in both Mix-A and Glu groups, those related to autophagosome formation (ATG27 and Vps15) and fusion with vacuoles (Sec18 and Vps33) also demonstrated significantly higher expression in the Mix-A group (Figure 7B). These findings further support the hypothesis that yeast utilizes autophagic mechanisms to degrade oligonucleotides. An overview of the involvement and expression of key enzymes in the autophagy process is provided through a schematic representation (Figure 7C).
Regarding RNA degradation, we revealed that the cytoplasmic 5′-exonuclease (XRN1) in yeast collaborates with 3′-exonucleases present in exosome to facilitate RNA degradation. We hypothesize that, in addition to autophagy, the oligonucleotides taken up by yeast can also be degraded by intracellular nucleases. Results indicated that coactivator complexes necessary for the function of 3′-exonucleases in the exosome (e.g., SKI2, SKI3, and SKI8) and core proteins forming exosome (e.g., Rrp46, Rrp44, Rrp42, Rrp45, Rrp6, Mitr3, Rrp43, and Csl4) were specifically expressed in Mix-A group. Moreover, the cytoplasmic 5′-nucleases (XRN1) and subunits of their RNA-binding complex (Lsm6) also exhibited specific expression (Figure 7D and 7E). These results indicate that, following the uptake of oligonucleotides, yeast can decompose them via autophagy and RNA degradation using nucleases within the exosomes and cytoplasm, allowing for further utilization. The involvement and expression levels of key enzymes in the RNA degradation pathway are summarized in a schematic representation (Figure 7F).
Subsequently, we found that the expression of key enzymes involved in the degradation of purine and pyrimidine nucleotides was also significantly enhanced in the Mix-A group (p < 0.05) (Figure 7G and 7I). This suggests that nucleotides and nucleosides generated from oligonucleotide degradation can be further broken down into ammonia (NH4+) and β-Alanine, which are then utilized by yeast. The participation and expression levels of key enzymes in nucleotide degradation processes are also illustrated in schematic form (Figure 7H and 7J).
These results elucidate clearly the metabolic mechanisms that yeast effectively decomposes oligonucleotides through a combination of autophagy and the RNA degradation processes, which are inherent pathways in yeast. The generated nucleosides and nucleotides are further decomposed into NH4+ and β-Alanine, which subsequently participate in the nitrogen source cycle within the yeast cell.
3.8. Expression Levels of Proteins Associated with Nucleotide Synthesis, Amino Acid Synthesis, and Glycerophospholipid Synthesis
To investigate whether the degradation products of oligonucleotides can be utilized in nucleotide synthesis in yeast, we analyzed the expression of key enzymes involved in nucleotide synthesis (Figure 8). Enzymes involved in the salvage pathway of purine nucleotide synthesis exhibited significantly higher expression in the Mix-A group, indicating that degradation products of oligonucleotides primarily contribute to purine nucleotide synthesis through the salvage pathway (Figure 8A and 8B). Conversely, enzymes for de novo synthesis of purine nucleotides were significantly lower in Mix-A group. In contrast, enzymes for both the de novo synthesis and the salvage synthesis of pyrimidine nucleotides showed significantly higher expression levels, suggesting that both pathways are utilized to supply materials for pyrimidine nucleotide synthesis when oligonucleotides are degraded to provide a nitrogen source (Figure 8C and 8D).
Considering that pyrimidine nucleotides serve not only as building blocks for nucleic acid synthesis but also as carriers for lipid components involved in glycerophospholipid synthesis, we hypothesized that yeast may need to accumulate a greater quantity of pyrimidine nucleotides compared to purine nucleotides. To support this perspective, we investigated the expression of enzymes involved in glycerophospholipid synthesis utilizing CTP. The results showed that enzymes required for synthesizing CDP-diacylglycerol, CDP-ethanolamine, and CDP-choline, including phosphatidate cytidylyltransferase (CDS1), ethanolamine phosphate cytidylyltransferase (PCYT2), and choline phosphate cytidylyltransferase (PCYT1), were all significantly upregulated in Mix-A group. Furthermore, enzymes necessary for converting these metabolites into phosphatidylinositol, phosphatidylethanolamine, and phosphatidylcholine, such as CDP-diacylglycerol-inositol 3-phosphatidyltransferase (CDIPT), ethanolamine phosphotransferase (EPT1), and diacylglycerol choline phosphotransferase (CPT1), also exhibited significantly higher expression levels (Figure S6A–S6C). These results provide evidences that yeast utilizes the degradation products of oligonucleotides to accumulate more pyrimidine nucleotides, which are essential not only for nucleic acid synthesis but also for the synthesis of glycerophospholipids and other critical metabolites.
Since oligonucleotides were used as the sole nitrogen source for the cultivation of yeast, they inevitably contributed to the synthesis of other organic nitrogen-containing metabolites required by the yeast. Amino acids, which are significant organic nitrogen compounds, were assessed to determine the potential pathways through which the NH4+ and β-Alanine derived from oligonucleotide degradation could be converted. The results demonstrated that the expression of 4-aminobutyrate aminotransferase (puuE), responsible for conversion of β-Alanine to glutamate, was significantly higher expression for Mix-A group, compared to that of glutamate dehydrogenase (gdhA), which facilitates glutamate synthesis from NH4+. Additionally, enzymes such as glutamine synthetase (glnA), which catalyzes the conversion of NH4+ and glutamate into glutamine, and glutamate synthase (GLT1), responsible for conversion of glutamine back into glutamate, also exhibited significantly elevated expression (Figure S6D and S6E). These findings suggest that NH4+ and β-Alanine derived from oligonucleotide would first be converted into glutamate and glutamine, subsequently allowing for the synthesis of other amino acids.
4. Discussion
Ribosomal RNA (rRNA) comprises approximately 80% of total cellular RNA [21,25] and is subjected to degradation by various nucleases in natural environments [32]. It is well-known that RNA is easily digested by some nucleases (e.g., RNase A is difficult to inactivate) when use in the lab. Thus, it can be inferred that short oligonucleotides derived from rRNA may represent a prevalent form of nucleic acids in the environment. This leads to an essential question: Can oligonucleotides be directly absorbed and utilized by cells? What are the underlying mechanisms? The findings of this research demonstrate that yeast can absorb RNA oligonucleotides (length < 30 nt) as a nitrogen source through endocytosis, and subsequently, a coordinated cellular process involving autophagy and RNA degradation leads to breakdown of these oligonucleotides into nucleosides and nucleotides. Nucleosides and nucleotides are metabolized through the intrinsic nucleotide degradation pathway of yeast into NH4+ and β-Alanine. This process not only provides essential building blocks for nucleic acid synthesis but also contributes to the nitrogen cycling used for synthesizing other metabolites.
The nitrogen content of nucleic acids is approximately 15–17%, which is close to that in proteins (14–18% nitrogen content), indicating that nucleic acids have the potential to provide nitrogen elements. Consistent with this assumption, we observed that when oligonucleotides served as the sole nitrogen source, yeast growth was comparable to that achieved using glutamic acid as the sole nitrogen source (Figure 1A). Interestingly, yeast exhibited a higher efficiency in utilizing oligonucleotides shorter than 30 nt (Mix-A or Digested Mix-B) compared to nucleotides (Figure 2 and Figure 4). This is reasonable because 5′-nucleotides play crucial roles in various significant cellular processes, such as energy production, DNA replication, RNA transcription, and signal transduction [33]. In addition, 5′-nucleotides are essential components in their synthesis. As a result, the concentration of each NT should be strictly regulated to a certain level [34]. Accordingly, its uptake should also be controlled to avoid metabolic disorders. When the concentration of nucleotides exceeded 30 g/L, the growth rate of yeast significantly declined (Figure S4B), consistent with the above discussion. In contrast, short oligonucleotides derived from rRNA cannot participate directly in metabolic pathways but are mainly digested into nucleosides and 3′-nucleotides. These products can be converted into 5′-nucleotides when necessary, thereby effectively avoiding metabolic disruptions. Within cells, many RNA molecules, such as mRNA and some degraded rRNA, are recycled. On the other hand, RNA is difficult to digest into nucleotides in natural environments. It is not cost-effective for an organism to secrete nucleases to digest RNA into nucleotides from the perspective of survival competition. Thus, capturing and “eating” short RNA oligonucleotides seems labor-saving. Previous findings indicated that pit cells can directly absorb microRNAs (about 21 nt long) via the SIDT1 (an intrinsic carrier protein in stomach), subsequently transporting them through exosomes to various tissues and organs [24], supporting our explanation for utilizing short RNA.
Interestingly, compared to the utilization of oligonucleotides or nucleosides as the sole nitrogen sources, yeast can efficiently utilize a mixture of oligonucleotides and nucleosides (Figure 3A–C). Additionally, yeast pre-cultured with oligonucleotides can enhances the utilization of nucleosides (Figure 3D–F). We speculate that this phenomenon may be attributed to the widespread presence of RNA oligonucleotides in the environment, which enables yeast cells to activate the expression of genes associated with the utilization of related compounds such as NT and NS. Contrary to the prevailing belief that cells can only absorb nucleosides [9,10,11,26], this study clearly demonstrates that yeast cells can simultaneously uptake and utilize oligonucleotides and nucleosides.
The addition of nucleotides to infant formula is primarily motivated by the significantly higher nucleotide content in human milk compared to that in cow’s milk. Specifically, non-protein nitrogen constitutes up to 20% of human breast milk, but only about 2% in cow’s milk [35,36]. Moreover, approximately 40% to 56% of “Total Potentially Available Nucleosides (TPAN)” are derived from RNA oligonucleotides in human milk [37,38], demonstrating that oligonucleotides may play significant roles. Recent researches have reported that RNA oligonucleotides, such as microRNAs, are present in human milk [39], and microRNAs may be transmitted to infants via exosomes—impacting lipid and glucose metabolism, gut maturation, neurodevelopment, and immune function [40,41]. Given that the concentration of microRNA in cells (comprising only 0.003% to 0.02% of total RNA) is significantly lower than that of ribosomal RNA [42], we hypothesize that RNA oligonucleotides in breast milk may primarily originate from ribosomal RNA. Building on previous findings, our study challenges traditional perspectives by proposing a novel viewpoint: eukaryotic cells directly absorb and utilize oligonucleotides derived from ribosomal RNA as nutritional sources. This discovery provides a new perspective for understanding the nutritional functions of RNA and their significance for infant health, underscoring the important research implications of our findings.
Our study reveals that when RNA oligonucleotides (length < 30 nt) serve as the sole nitrogen source, there is a significant upregulation of intracellular nucleases in yeast (Figure 4). This finding provides genetic evidence that yeast can effectively utilize RNA oligonucleotides. The observed upregulation may result from the activation of specific response pathways following the binding of RNA oligonucleotides to the surfaces of yeast cells. This binding can stimulate the metabolic pathways responsible for RNA degradation and modulate the expression of intracellular nucleases. Furthermore, proteomic analysis showed a significant increase in the expression of proteins related to RNA catabolic pathways (such as autophagy and RNA degradation) in the Mix-A group (length < 30 nt) (Figure 7A–E). Notably, since RNA oligonucleotides are commonly abundant in food sources [43], their presence may act as a nutritional signal, prompting yeast to rapidly express genes (such as nucleases) associated with RNA oligonucleotide utilization. The enhanced expression of nucleases facilitates the degradation of RNA oligonucleotides, thereby generating the requisite nucleotides for cellular metabolism. Based on these findings, we boldly propose that the expression levels of nucleases might serve as a potential indicator of cellular vitality. An increase in nuclease expression could reflect heightened metabolic activity within the cell. This viewpoint offers a novel perspective for investigating cellular vitality and metabolic status, potentially advancing research in related biomedical fields.
Endocytosis is a fundamental process for yeast to acquire external nutrients, enabling the uptake of larger molecules or particles, such as proteins and polysaccharides [30]. Currently, it is accepted that RNAs (microRNAs, mRNAs, and siRNAs) encapsulated in extracellular vesicles primarily enter cells via endocytic pathways [44]. Our study revealed that when RNA oligonucleotides served as the sole nitrogen source, key proteins involved in endocytosis were significantly upregulated in the oligonucleotide group (Mix-A) (Figure 6), thereby confirming the potential for yeast to absorb free oligonucleotides through endocytosis. The receptor for binding short RNA oligonucleotides remains unknown.
Autophagy is an essential process for the degradation and reutilization of cellular components in eukaryotic cells [31]. Our findings indicate that when oligonucleotides are utilized as nutrients, key proteins related to autophagy were significantly upregulated in the oligonucleotide group (Figure 7A–C). Concurrently, crucial proteins involved in RNA degradation, such as nucleases, were also significantly expressed (Figure 7D–F). It has been shown that nitrogen deficiency can induce yeast to degrade RNA through autophagy [45], and studies have suggested that autophagy also serves as a pathway for RNA recycling [46]. This suggests that yeast may decompose oligonucleotides into nucleotides and nucleosides through a cooperative mechanism involving autophagy in vacuole and RNA degradation in cytoplasm.
Significantly, our study indicated that under conditions where oligonucleotides served as the sole nitrogen source, key proteins in the de novo synthesis and salvage pathways of pyrimidine nucleotides were significantly upregulated (Figure 8C, D). In contrast, key proteins involved in the salvage synthesis of purine nucleotides were expressed at high levels, while those related to de novo synthesis were significantly downregulated (Figure 8A, B). This suggests that the nucleosides and bases generated from the degradation of oligonucleotides can effectively meet the demand for purine nucleotides in yeast through the salvage synthesis pathway. Current research indicates that excessive accumulation of purine nucleotides may lead to metabolic dysfunction in cells [47,48]. Thus, under these conditions, yeast exhibited reduced de novo purine nucleotide synthesis. The relatively higher demand for pyrimidine nucleotides could be attributed to their roles not only in nucleic acid synthesis but also as precursors for other metabolites (e.g., CTP serves as a key precursor for glycerophospholipid synthesis) [49]. In alignment with this theoretical perspective, our study found that enzymes associated with glycerophospholipid biosynthesis were also significantly upregulated in yeast when oligonucleotides served as the sole nitrogen source (Figure S6A–S6C).
This study provides a comprehensive understanding of how yeast cells utilize oligonucleotides as nutrients, not only supplying nucleotides but also contributing to the synthesis of other organic nitrogenous metabolites derived from the metabolite of NH4+ or β-Alanine from RNA. Specifically, 4-aminobutyric acid transaminase (puuE), which catalyzes the conversion of β-Alanine (derived from pyrimidine degradation) into glutamate, was significantly upregulated (Figure S6D and S6E). This finding may provide significant theoretical support for re-evaluating the role of nucleic acids.
In summary, yeast can directly absorb RNA oligonucleotides (length < 30 nt) as an excellent nitrogen source, and uptake these RNA oligonucleotides through an endocytic process. Subsequently, these RNA oligonucleotides are degraded into nucleotides and nucleosides via the autophagy pathway in the vacuole and the RNA degradation pathway in the cytoplasm. A portion of these nucleosides and nucleotides is utilized for nucleic acid synthesis, while the remainder is further degraded into NH4+ and β-Alanine via yeast’s inherent nucleotide degradation pathways. This process participates in the nitrogen source cycle and contributes to the synthesis of other organic nitrogen compounds, such as amino acids and lipid (Figure 9). This discovery offers new insights into the absorption and metabolism of RNA oligonucleotides in eukaryotic cells, suggesting that oligonucleotides derived from rRNA can be used as nutrients. We believe that further study of rRNA metabolism can provide a significant foundation in the field of nucleic acid metabolism and nutrition.
Supplementary Materials
The following supporting information can be downloaded at the website of this paper posted on Preprints.org. Figure S1: Analysis of the components of Mix-A and Mix-B; Figure S2: The size of Mix-A was analyzed using 15% dPAGE electrophoresis; Figure S3: Effects of oligonucleotide and mixed nucleotides as the sole nitrogen source for yeast cultivation; Figure S4: Effects of nucleotide or nucleoside concentrations as sole nitrogen sources on yeast growth; Figure S5: Effects of different lengths of RNA oligonucleotides on the expression of nuclease genes in yeast on the 4th day of cultivation; Figure S6: Expression levels of proteins involved in amino acid and glycerophospholipid biosynthesis; Table S1: Purity of Mix-A and Mix-B; Table S2: List of intracellular nuclease gene information of Komagataella phaffii X-33; Table S3: Primer sequences for RT-qPCR.
Author Contributions
Conceptualization, X. D. and X. L.; Methodology, X. D. and X. L.; Software, X. D. and X. L.; Validation, X. D., X. L., J. Z. and R. A.; Formal analysis, X. D., X. L., J. Z. and R. A.; Investigation, X. D. and X. L.; Resources, X. D. and J. Z.; Data Curation, X. D; Writing - Original Draft, X. D.; Writing-Review & Editing, X. D. and X. L.; Visualization, X. D.; Supervision, X. L. and R. A.; Project administration, X. L. and R. A. All authors have read and agreed to published version of manuscript.
Funding
This work was funded by the National Natural Science Foundation of China (grants number 32102064), Qingdao Natural Science Foundation (grants number 24-4-4-zrjj-147-jch), Open Foundation of State Key Laboratory of Marine Food Processing & Safety Control (grants number SKI202308), and Youth Innovation Team Program of Universities in Shandong Province (grants number 2023KJ040).
Institutional Review Board Statement
Not applicable.
Informed Consent Statement
Not applicable.
Data Availability Statement
The authors confirm that the data supporting the findings of this study are available within the article.
Acknowledgments
Thank QZU Co., Ltd. (Nantong, China) for supporting us on materials and donation. Thank Jun Rao for his assistance in the proteomic analysis experiment. Thank Major Bio-technology Co., Ltd. (Shanghai, China) for their help in the proteomic sequencing experiment. I would like to extend my heartfelt gratitude to all the faculty and students of the Nucleic Acid Chemistry and Biotechnology Laboratory at the College of Food Science and Engineering, Ocean University of China, for their valuable suggestions and guidance throughout the experimental process.
Conflicts of Interest
The authors declare that they have no conflicts of interests.
References
- Cramer, P. Organization and regulation of gene transcription. Nature 2019, 573, 45–54. [CrossRef]
- Carthew, R.W. Gene regulation and cellular metabolism: an essential partnership. Trends Genet. 2021, 37, 389–400. [CrossRef]
- Henninger, J.E.; Young, R.A. An RNA-centric view of transcription and genome organization. Mol. Cell 2024, 84, 3627–3643. [CrossRef]
- Ding, T.; Song, G.; Liu, X.; Xu, M.; Li, Y. Nucleotides as optimal candidates for essential nutrients in living organisms: A review. J. Funct. Food. 2021, 82, 104498. [CrossRef]
- Strefeler, A.; Blanco-Fernandez, J.; Jourdain, A.A. Nucleosides are overlooked fuels in central carbon metabolism. Trends Endocrinol. Metab. 2024, 35, 290–299. [CrossRef]
- Carver, J.D. Dietary nucleotides: effects on the immune and gastrointestinal systems. Acta Paediatr. 1999, 88, 83–88. [CrossRef]
- Schlimme, E.; Martin, D.; Meisel, H. Nucleosides and nucleotides: natural bioactive substances in milk and colostrum. Br. J. Nutr. 2000, 84, S59–S68. [CrossRef]
- Soininen, H.; Solomon, A.; Visser, P.J.; Hendrix, S.B.; Blennow, K.; Kivipelto, M.; Hartmann, T. 24-month intervention with a specific multinutrient in people with prodromal Alzheimer’s disease (LipiDiDiet): a randomised, double-blind, controlled trial. Lancet Neurol. 2017, 16, 965–975. [CrossRef]
- María Vieites, J.; Torre Rde, L.; Ramírez Mdel, C.; Torres, M.I.; Sánchez-Pozo, A.; Gil, A.; Suárez, A. Exogenous nucleosides accelerate differentiation of rat intestinal epithelial cells. Br. J. Nutr. 2008, 99, 732–738. [CrossRef]
- He, Y.; Sanderson, I.R.; Allan Walker, W. Uptake, Transport and metabolism of exogenous nucleosides in intestinal epithelial Cell Cultures. J. Nutr. 1994, 124, 1942–1949. [CrossRef]
- Pastor-Anglada, M.; Urtasun, N.; Pérez-Torras, S. Intestinal nucleoside transporters: function, expression, and regulation. Compr. Physiol. 2018, 8, 1003–1017. [CrossRef]
- Skinner, O.S.; Blanco-Fernández, J.; Goodman, R.P.; Kawakami, A.; Shen, H.; Kemény, L.V.; Joesch-Cohen, L.; Rees, M.G.; Roth, J.A.; Fisher, D.E., et al. Salvage of ribose from uridine or RNA supports glycolysis in nutrient-limited conditions. Nat. Metab. 2023, 5, 765–776. [CrossRef]
- Nwosu, Z.C.; Ward, M.H.; Sajjakulnukit, P.; Poudel, P.; Ragulan, C.; Kasperek, S.; Radyk, M.; Sutton, D.; Menjivar, R.E.; Andren, A., et al. Uridine-derived ribose fuels glucose-restricted pancreatic cancer. Nature 2023, 618, 151–158. [CrossRef]
- López-Navarro, A.; Gil, A.; Sánchez-Pozo, A. Age-related effect of dietary nucleotides on liver nucleic acid content in rats. Ann. Nutr. Metab. 1997, 41, 324–330. [CrossRef]
- Dancey, C.P.; Attree, E.A.; Brown, K.F. Nucleotide supplementation: a randomised double-blind placebo controlled trial of IntestAidIB in people with Irritable Bowel Syndrome [ISRCTN67764449]. Nutr. J. 2006, 5, 16. [CrossRef]
- Uauy, R. Nonimmune system responses to dietary nucleotides. J. Nutr. 1994, 124, S157–S159. [CrossRef]
- Singhal, A.; Macfarlane, G.; Macfarlane, S.; Lanigan, J.; Kennedy, K.; Elias-Jones, A.; Stephenson, T.; Dudek, P.; Lucas, A. Dietary nucleotides and fecal microbiota in formula-fed infants: a randomized controlled trial. Am. J. Clin. Nutr. 2008, 87, 1785–1792. [CrossRef]
- Jyonouchi, H.; Sun, S.; Sato, S. Nucleotide-free diet suppresses antigen-driven cytokine production by primed T cells: Effects of supplemental nucleotides and dietary fatty acids. Nutrition 1996, 12, 608–615. [CrossRef]
- Jyonouchi, H.; Sun, S.; Winship, T.; Kuchan, M.J. Dietary ribonucleotides modulate type 1 and type 2 T-helper cell responses against ovalbumin in young BALB/cJ mice. J. Nutr. 2001, 131, 1165–1170. [CrossRef]
- Maldonado, J.; Navarro, J.; Narbona, E.; Gil, A. The influence of dietary nucleotides on humoral and cell immunity in the neonate and lactating infant. Early Hum. Dev. 2001, 65, S69–S74. [CrossRef]
- Wu, J.; Xiao, J.; Zhang, Z.; Wang, X.; Hu, S.; Yu, J. Ribogenomics: the science and knowledge of RNA. Genom. Proteomics Bioinformatics 2014, 12, 57–63. [CrossRef]
- Yang, J.; Hirschi, K.D.; Farmer, L.M. Dietary RNAs: New stories regarding oral delivery. Nutrients 2015, 7, 3184–3199. [CrossRef]
- Hirschi, K.D. Navigating dietary small RNAs. Genes Nutr. 2017, 12, 16. [CrossRef]
- Chen, Q.; Zhang, F.; Dong, L.; Wu, H.; Xu, J.; Li, H.; Wang, J.; Zhou, Z.; Liu, C.; Wang, Y., et al. SIDT1-dependent absorption in the stomach mediates host uptake of dietary and orally administered microRNAs. Cell Res. 2021, 31, 247–258. [CrossRef]
- Boehlke, K.W.; Friesen, J.D. Cellular content of ribonucleic acid and protein in Saccharomyces cerevisiae as a function of exponential growth rate: calculation of the apparent peptide chain elongation rate. J. Bacteriol. 1975, 121, 429–433. [CrossRef]
- Rodríguez-Serrano, F.; Marchal, J.A.; Ríos, A.; Martínez-Amat, A.; Boulaiz, H.; Prados, J.; Perán, M.; Caba, O.; Carrillo, E.; Hita, F., et al. Exogenous nucleosides modulate proliferation of rat intestinal epithelial IEC-6 cells. J. Nutr. 2007, 137, 879–884. [CrossRef]
- Gutierrez-Beltran, E.; Bozhkov, P.V.; Moschou, P.N. Tudor Staphylococcal Nuclease plays two antagonistic roles in RNA metabolism under stress. Plant Signal. Behav. 2015, 10, e1071005. [CrossRef]
- Dominski, Z. Nucleases of the metallo-beta-lactamase family and their role in DNA and RNA metabolism. Crit. Rev. Biochem. Mol. Biol. 2007, 42, 67–93. [CrossRef]
- Jia, F.; Chi, C.; Han, M. Regulation of nucleotide metabolism and germline proliferation in response to nucleotide imbalance and genotoxic stresses by EndoU nuclease. Cell Rep. 2020, 30, 1848–1861. [CrossRef]
- Scita, G.; Di Fiore, P.P. The endocytic matrix. Nature 2010, 463, 464–473. [CrossRef]
- Huang, W.P.; Klionsky, D.J. Autophagy in yeast: a review of the molecular machinery. Cell Struct. Funct. 2002, 27, 409–420. [CrossRef]
- Sorrentino, S. The eight human “canonical” ribonucleases: molecular diversity, catalytic properties, and special biological actions of the enzyme proteins. FEBS Lett. 2010, 584, 2194–2200. [CrossRef]
- Chandel, N.S. Nucleotide metabolism. Cold Spring Harbor Perspect. Biol. 2021, 13, a040592. [CrossRef]
- Lane, A.N.; Fan, T.W. Regulation of mammalian nucleotide metabolism and biosynthesis. Nucleic Acids Res. 2015, 43, 2466–2485. [CrossRef]
- Gil, A.; Sanchez-Medina, F. Acid-soluble nucleotides of human milk at different stages of lactation. J. Dairy Res. 1982, 49, 301–307. [CrossRef]
- Janas, L.M.; Picciano, M.F. The nucleotide profile of human milk. Pediatr. Res. 1982, 16, 659–662. [CrossRef]
- Tressler, R.L.; Ramstack, M.B.; White, N.R.; Molitor, B.E.; Chen, N.R.; Alarcon, P.; Masor, M.L. Determination of total potentially available nucleosides in human milk from Asian women. Nutrition 2003, 19, 16–20. [CrossRef]
- Leach, J.L.; Baxter, J.H.; Molitor, B.E.; Ramstack, M.B.; Masor, M.L. Total potentially available nucleosides of human milk by stage of lactation. Am. J. Clin. Nutr. 1995, 61, 1224–1230. [CrossRef]
- Lukasik, A.; Brzozowska, I.; Zielenkiewicz, U.; Zielenkiewicz, P. detection of plant miRNAs abundance in human breast milk. Int. J. Mol. Sci. 2017, 19. 37. [CrossRef]
- Xu, Y.R.; Zhao, J.; Huang, H.Y.; Lin, Y.C.; Lee, T.Y.; Huang, H.D.; Yang, Y.; Wang, Y.F. Recent insights into breast milk microRNA: their role as functional regulators. Front. Nutr. 2024, 11, 1366435. [CrossRef]
- Leroux, C.; Chervet, M.L.; German, J.B. Perspective: milk microRNAs as important players in infant physiology and development. Adv. Nutr. 2021, 12, 1625–1635. [CrossRef]
- Palazzo, A.F.; Lee, E.S. Non-coding RNA: what is functional and what is junk? Front. Genet. 2015, 6, 2. [CrossRef]
- Chen, X.J.; Yang, F.Q.; Wang, Y.T.; Li, S.P. CE and CEC of nucleosides and nucleotides in food materials. Electrophoresis 2010, 31, 2092–2105. [CrossRef]
- O’Brien, K.; Breyne, K.; Ughetto, S.; Laurent, L.C.; Breakefield, X.O. RNA delivery by extracellular vesicles in mammalian cells and its applications. Nat. Rev. Mol. Cell Biol. 2020, 21, 585–606. [CrossRef]
- Huang, H.; Kawamata, T.; Horie, T.; Tsugawa, H.; Nakayama, Y.; Ohsumi, Y.; Fukusaki, E. Bulk RNA degradation by nitrogen starvation-induced autophagy in yeast. Embo J. 2015, 34, 154–168. [CrossRef]
- Łabno, A.; Tomecki, R.; Dziembowski, A. Cytoplasmic RNA decay pathways - enzymes and mechanisms. Biochim. Biophys. Acta. 2016, 1863, 3125–3147. [CrossRef]
- Diehl, F.F.; Miettinen, T.P.; Elbashir, R.; Nabel, C.S.; Darnell, A.M.; Do, B.T.; Manalis, S.R.; Lewis, C.A.; Vander Heiden, M.G. Nucleotide imbalance decouples cell growth from cell proliferation. Nat. Cell Biol. 2022, 24, 1252–1264. [CrossRef]
- Ali, E.S.; Ben-Sahra, I. Regulation of nucleotide metabolism in cancers and immune disorders. Trends Cell Biol. 2023, 33, 950–966. [CrossRef]
- Chang, Y.-F.; Carman, G.M. CTP synthetase and its role in phospholipid synthesis in the yeast Saccharomyces cerevisiae. Prog. Lipid Res. 2008, 47, 333–339. [CrossRef]
Figure 1.
Growth of yeast using short oligonucleotides (most of Mix-A consists of oligonucleotides shorter than 30 nt). (A) Oligonucleotides are used as the sole nitrogen source (glucose is present). (B) and (D) show corresponding growth rates. (C) Oligonucleotides are used as both carbon and nitrogen source (glucose is not present). The used media are: YPD (5 g/L yeast extract, peptone, and 5 g/L glucose); Mix-A + Glucose (5 g/L Mix-A and 5 g/L glucose); Glutamate + Glucose (5 g/L glutamate and 5 g/L glucose); NaNO3 + Glucose (5 g/L NaNO3 and 5 g/L glucose); C+N− (glucose only, no nitrogen sources); YPD + Mix-A (5 g/L yeast extract, peptone, 5 g/L Mix-A, and 5 g/L glucose); Glutamate (5 g/L glutamate); Mix-A (5 g/L Mix-A); and C−N− (lacking both carbon and nitrogen sources). All experiments were performed in triplicate, and data are presented as mean ± SD. Statistical significance analysis was assessed using one-way ANOVA; *p < 0.05, **p < 0.01.
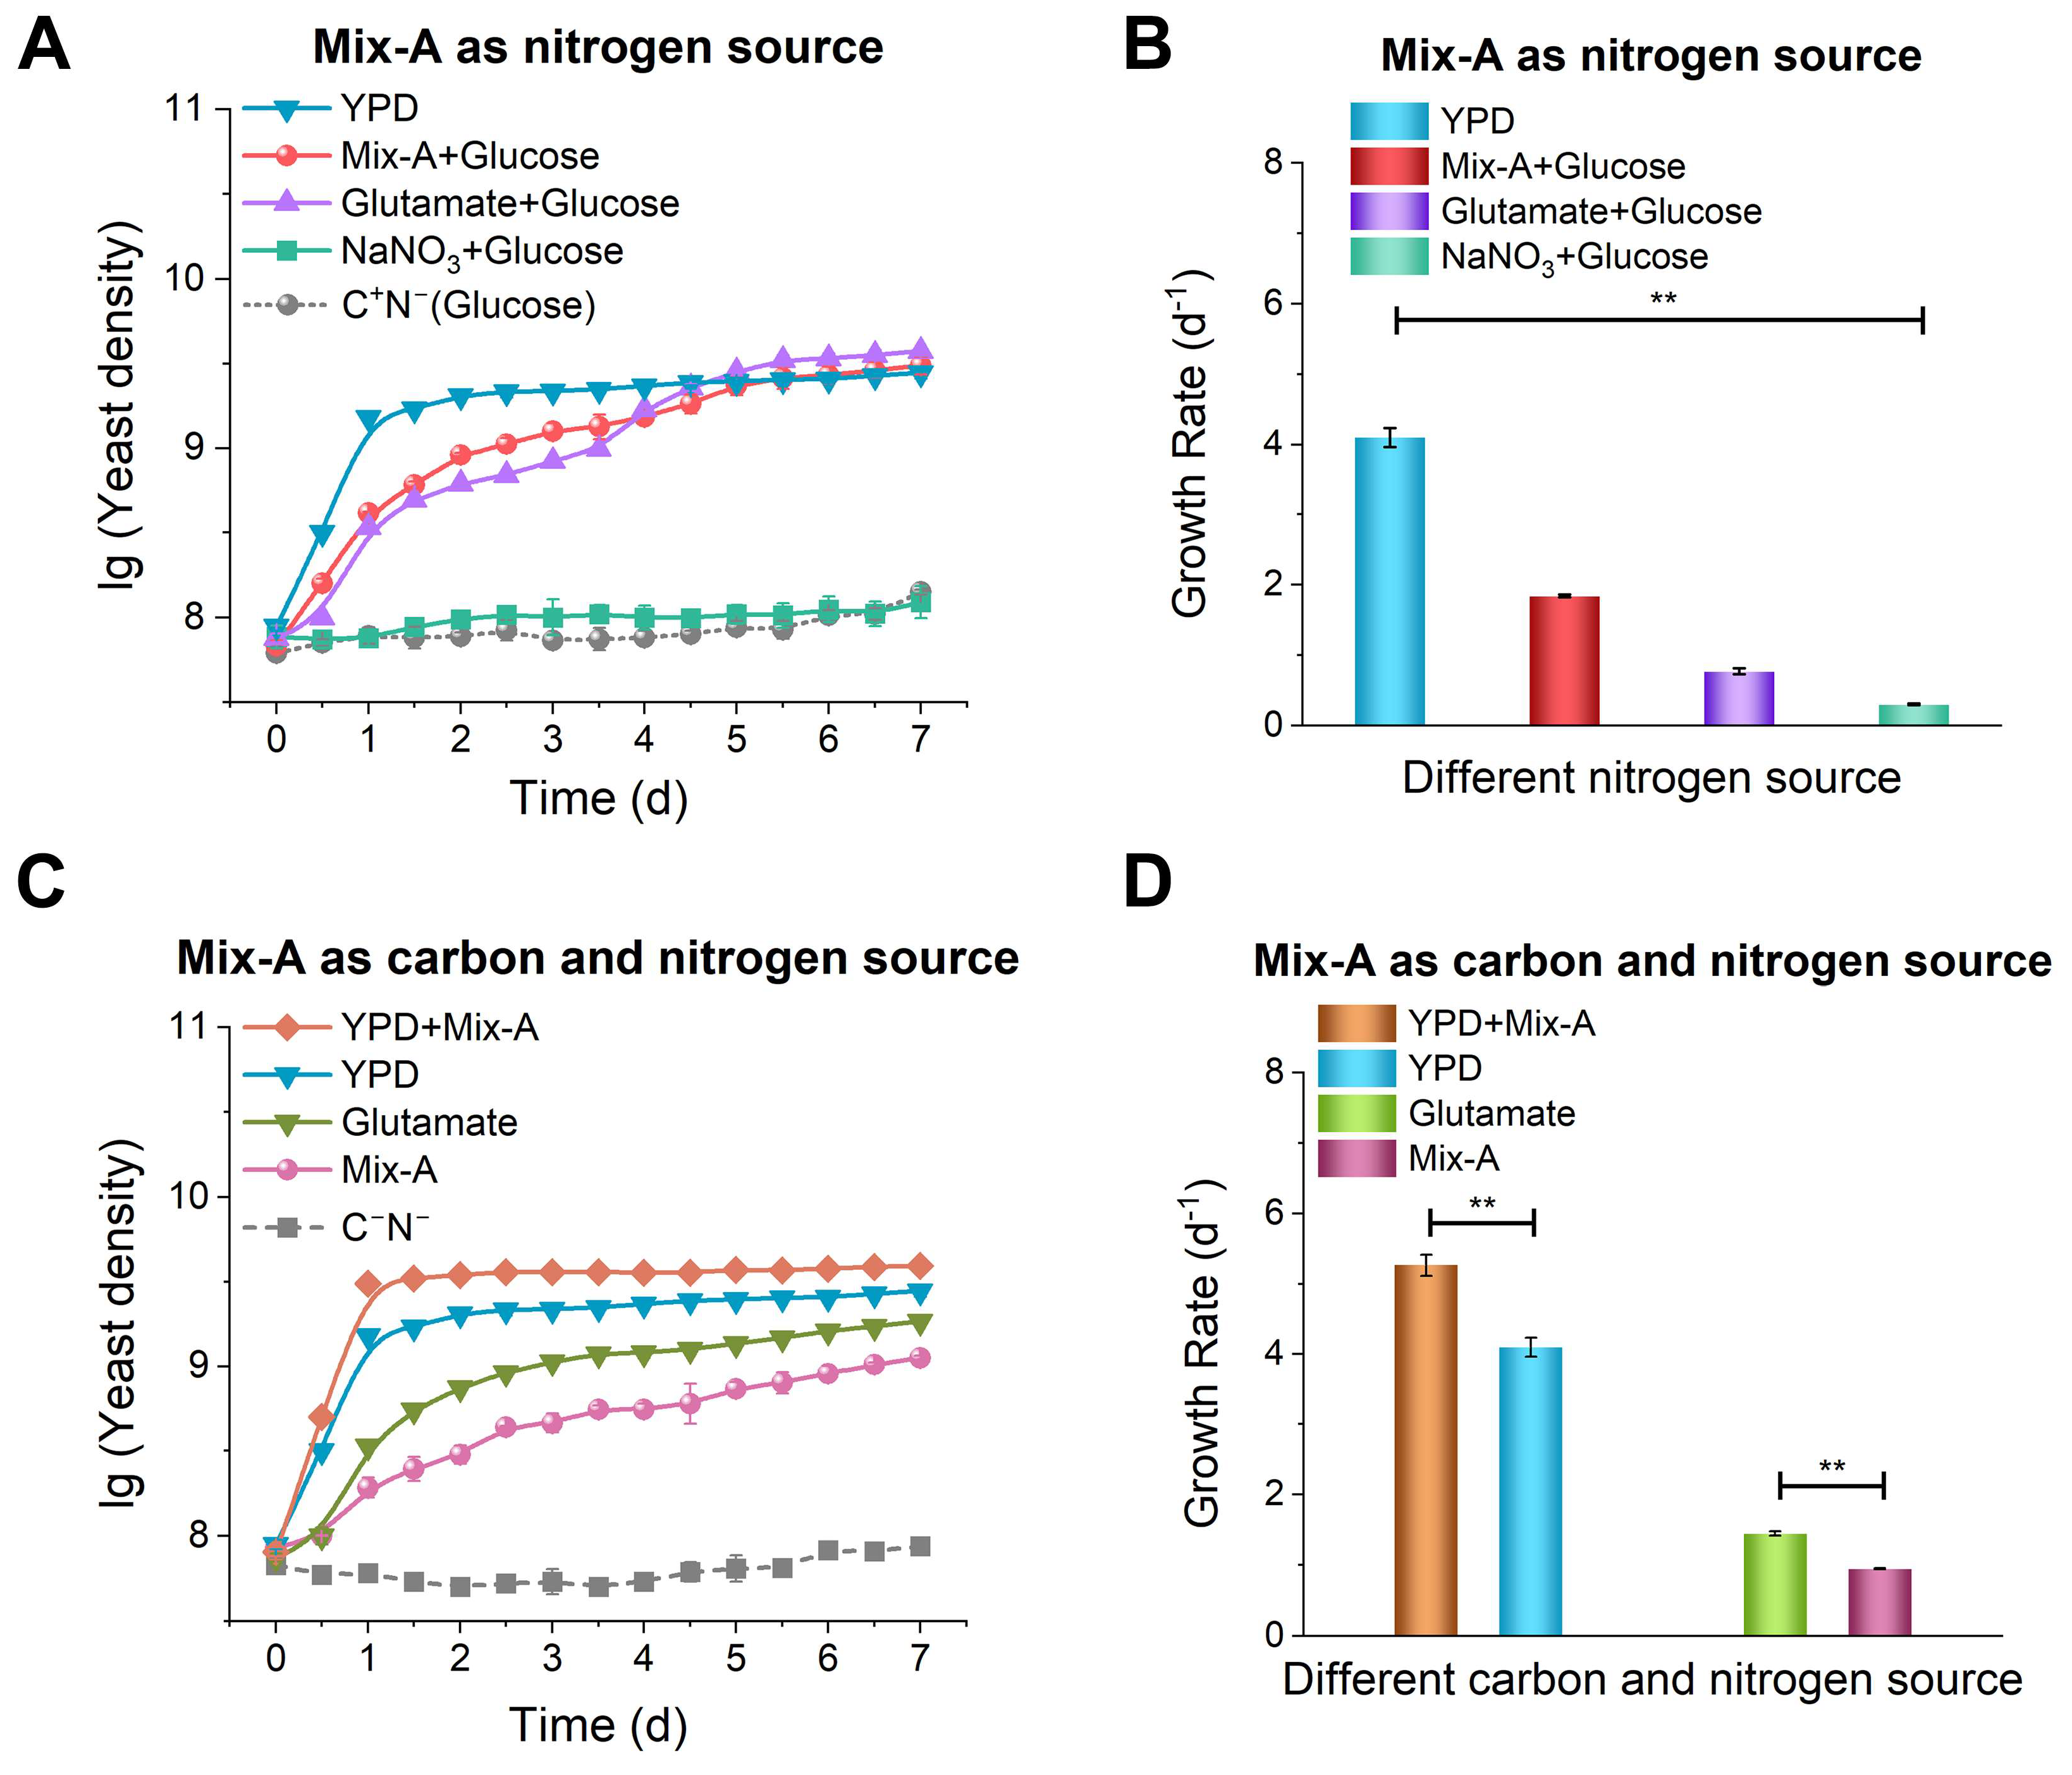
Figure 2.
RNA oligonucleotides of appropriate length are more efficiently utilized as a nitrogen source by yeast. (A) Analysis of RNase A digestion products by dPAGE (15%). “−” indicates the control group without RNase A; “+” indicates the RNase A-treated group. Digestion conditions: 1.0 g/L Mix-B, 0.01 g/L RNase A, incubated at 28°C for 3 days. (B) and (C) are growth curves and growth rates for various media. (D) OD260 changes in culture supernatants (after cells were removed). Mix-B (10–100 nt): 1 g/L of Mix-B; Digested Mix-B (5–30 nt): 1 g/L of digestion products of Mix-B by RNase A; Mix-A (length < 30 nt): 1.0 g/L of Mix-A; NT: 1.0 g/L of mixed nucleotides (AMP, GMP, CMP, and UMP); C+N− : the medium lack of any nitrogen source. In all media, 20 g/L of glucose was present. The experiments were conducted in triplicate, and results are expressed as means ± SD. Statistical significance was assessed using one-way ANOVA; *p < 0.05, **p < 0.01.
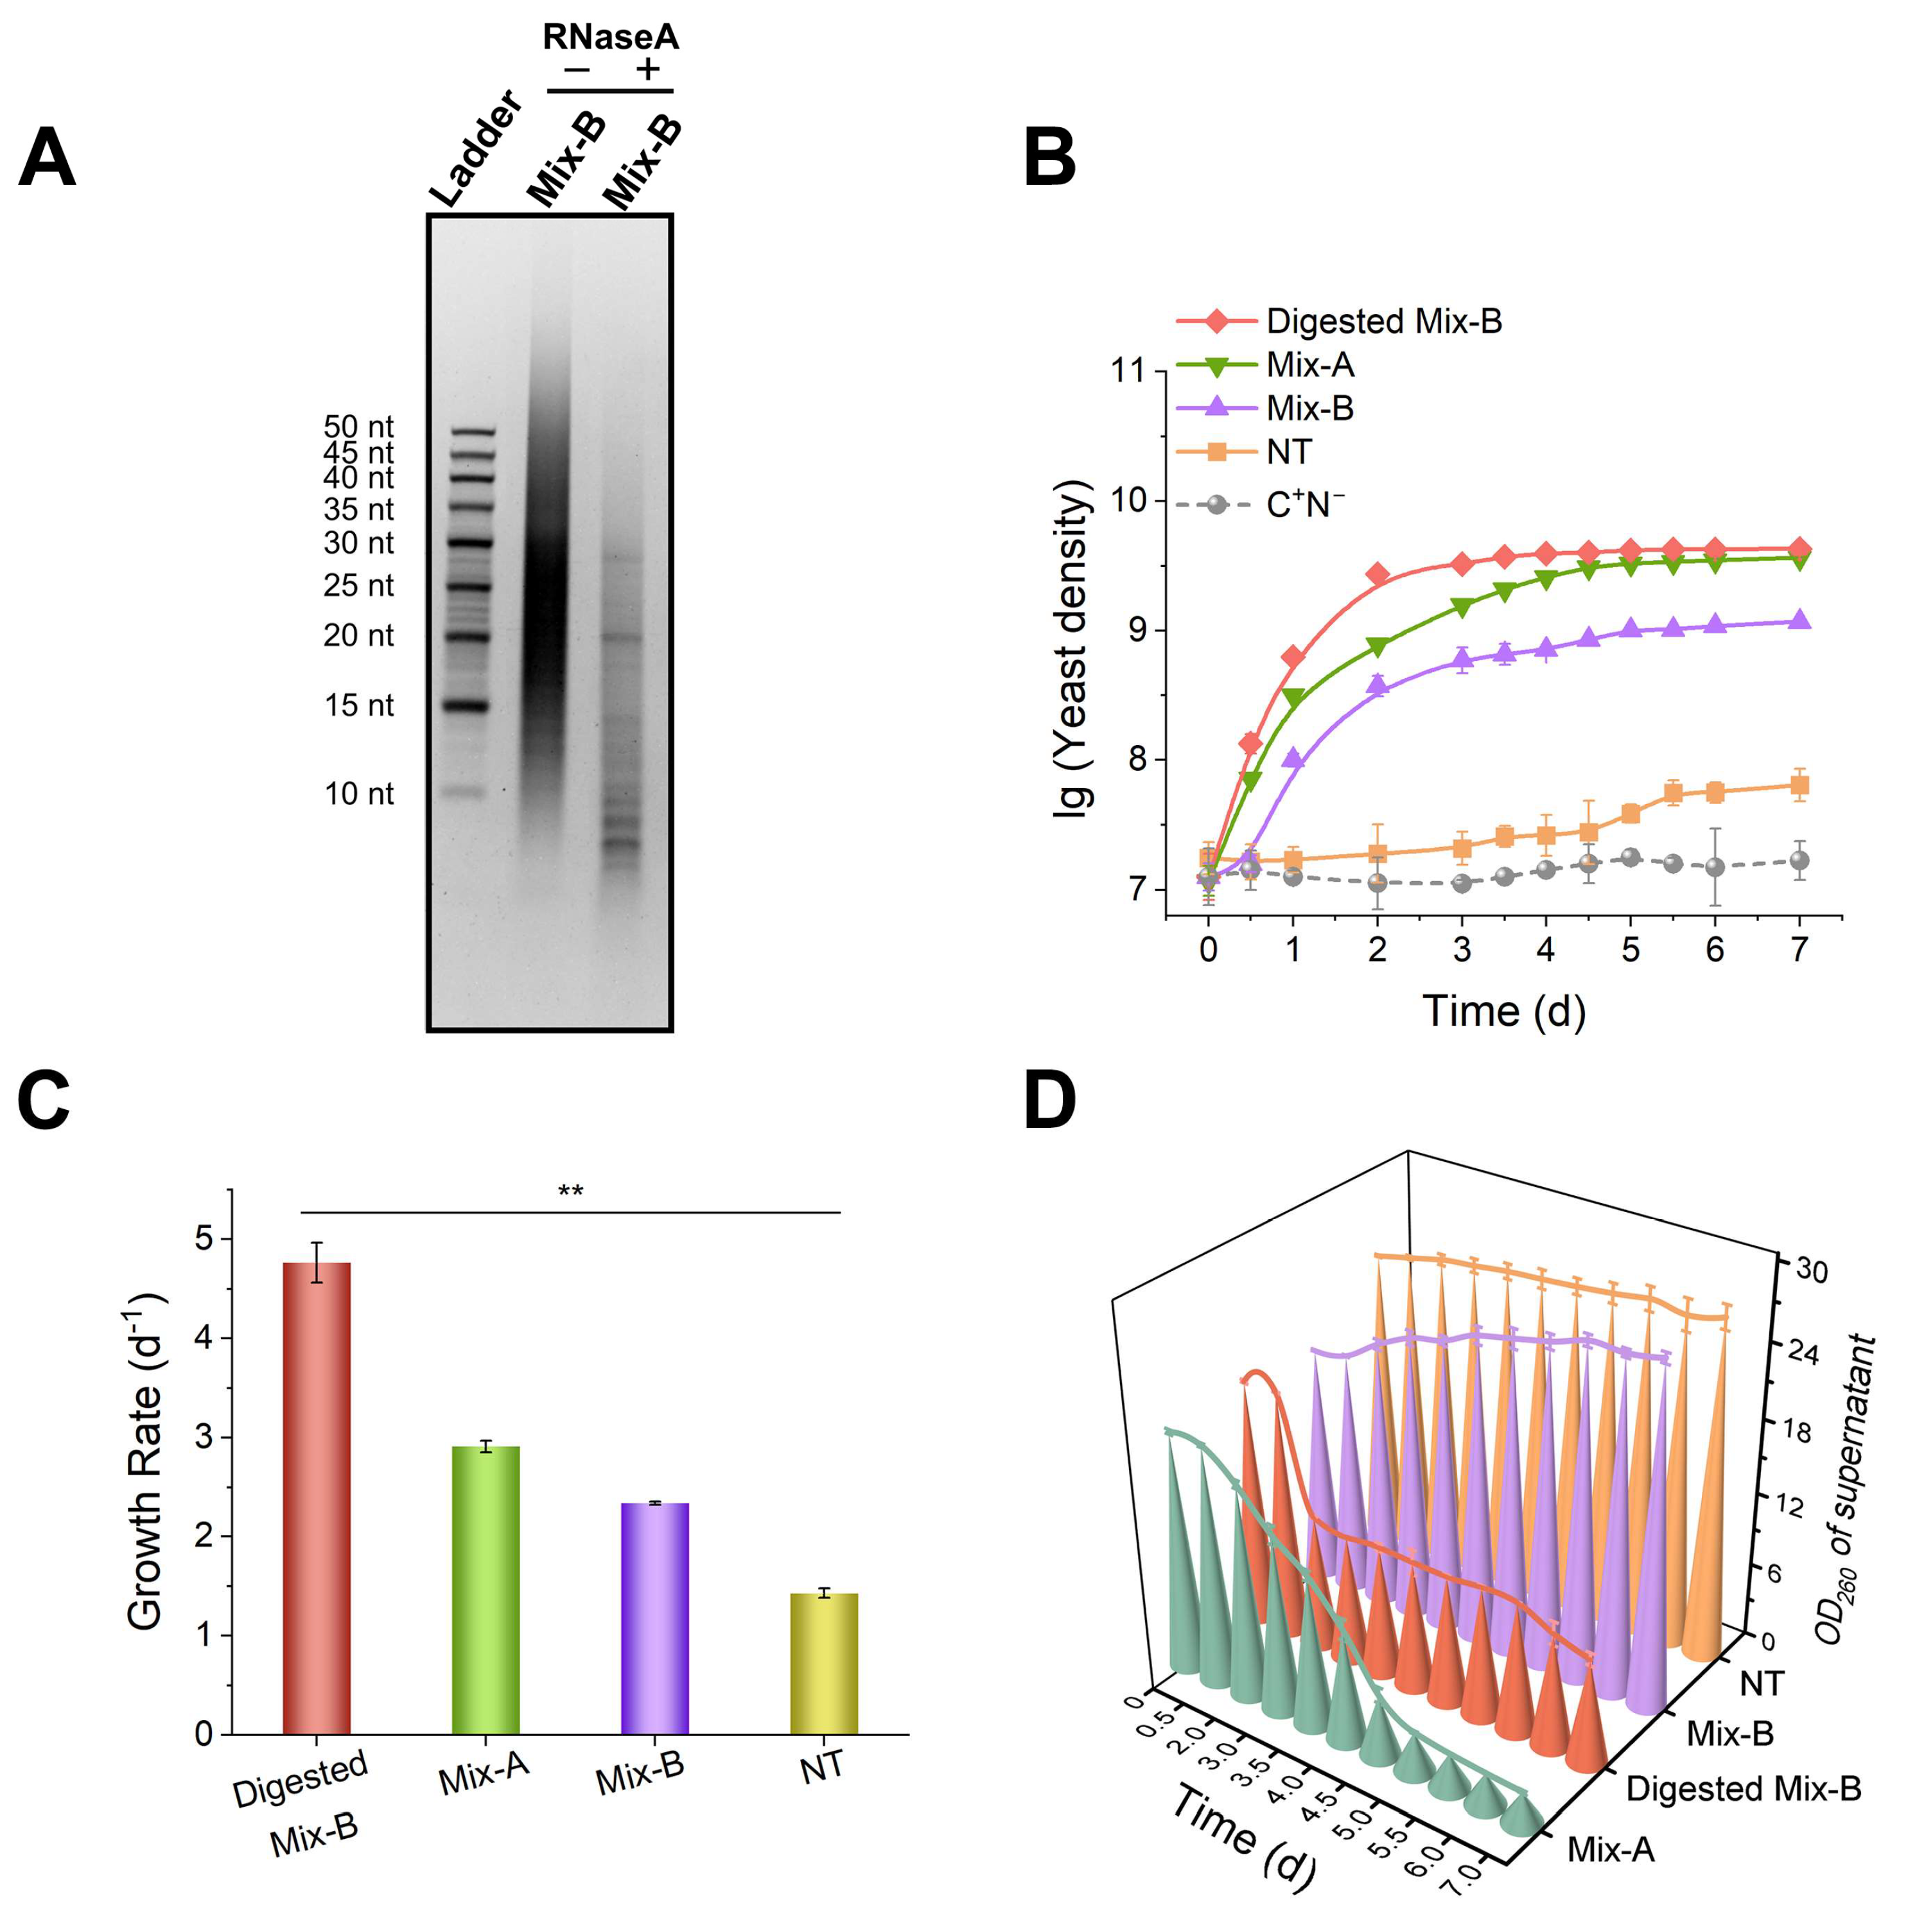
Figure 3.
Simultaneous utilization of RNA oligonucleotides and nucleosides by yeast. (A–C) Cultured with Mix-A and mixed nucleosides as the sole nitrogen source. (D–F) Yeasts pre-cultured in either 1 g/L Mix-A or 5 g/L NS for 3 days (OD600 ~ 0.5) were transferred into media containing 5 g/L NS or 1 g/L Mix-A at a 5% inoculation rate. (A, D) Growth curves. (B, E) Growth rates. (C, F) OD260 changes in culture supernatants (after cells were removed). 1 g/L Mix-A + 5 g/L NS: 1.0 g/L of Mix-A (length < 30 nt) and 5.0 g/L of mixed nucleosides (adenosine, guanosine, cytidine, uridine, and inosine); 1 g/L Mix-A + 5 g/L NT: 1.0 g/L Mix-A and 5.0 g/L mixed nucleotides (AMP, GMP, CMP, and UMP); 1 g/L Mix-A: 1.0 g/L Mix-A; 5 g/L NS: 5.0 g/L mixed nucleosides; 5 g/L NT: 5.0 g/L mixed nucleotides; Mix-A-pre-NS: in the medium containing 5.0 g/L mixed nucleosides, using seeds (OD600 ~ 0.5) pre-cultured in the medium containing 1.0 g/L Mix-A; NS-pre-Mix-A: in the medium containing 1.0 g/L Mix-A, using seeds (OD600 ~ 0.5) pre-cultured in the medium containing 5.0 g/L mixed nucleosides; C+N−: the medium lacking any nitrogen source. In all media, 20 g/L of glucose was present. The experiments were conducted in triplicate, and results are expressed as means ± SD. Statistical significance was assessed using one-way ANOVA; *p < 0.05, **p < 0.01.
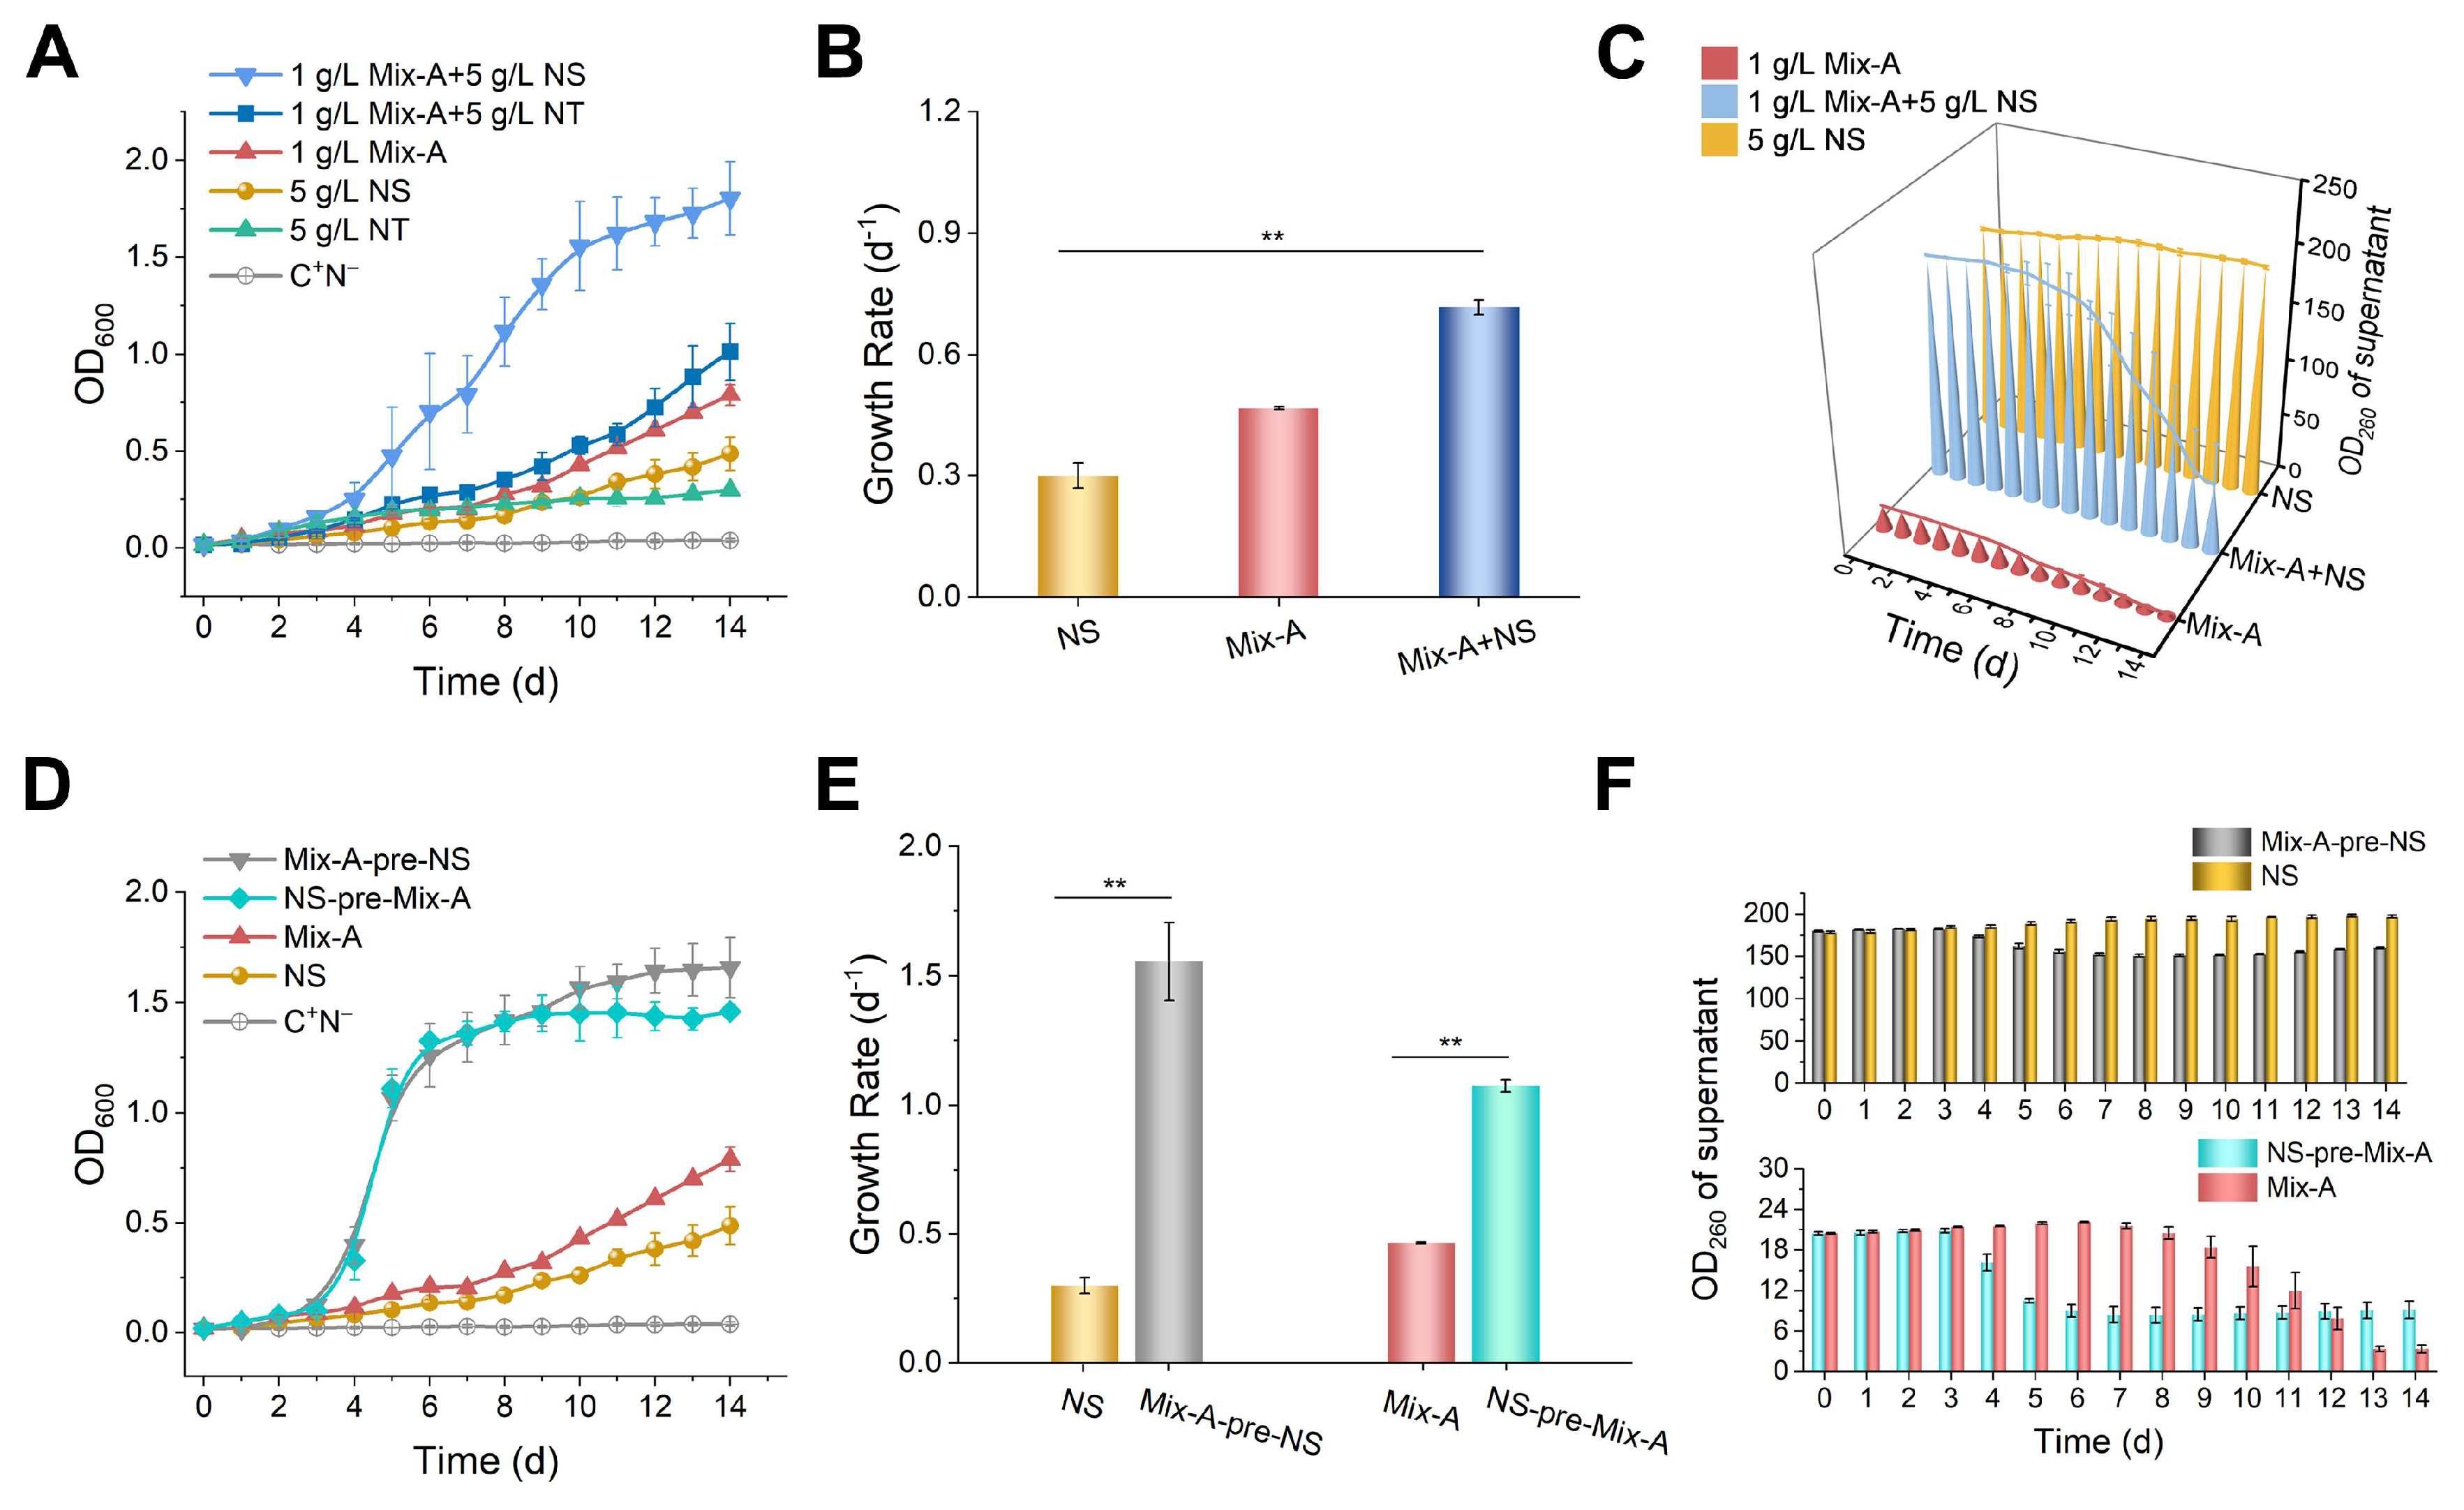
Figure 4.
RNA oligonucleotides in the culturing medium induce upregulation of gene expression for various yeast nucleases. (A) Expression levels on the 4th day of the group RNase A-treated oligonucleotides (Digested Mix-B). (B) Expression levels on the 6th day for Mix-B, Digested Mix-B, NT, and YPD groups. Several nucleases in the nucleus, cytoplasm, mitochondria, exosomes, and vacuoles are checked. Yeast cultured with yeast extract and peptone served as the control group (YPD). Nuclease names in black denote exonucleases, while those in blue denote endonucleases. YPD: 5 g/L yeast extract and peptone; Mix-B: 5 g/L oligonucleotides, 10–100 nt; Digested Mix-B: 5 g/L RNase A-treated oligonucleotides, 5–30 nt; NT: 5 g/L mixture of AMP, GMP, CMP, and UMP. For all these media, 20 g/L glucose was supplemented. Values represent mean ± SD (n=6). Different letters (a–d) indicate significant differences in yeast nuclease gene expression levels (p < 0.05).
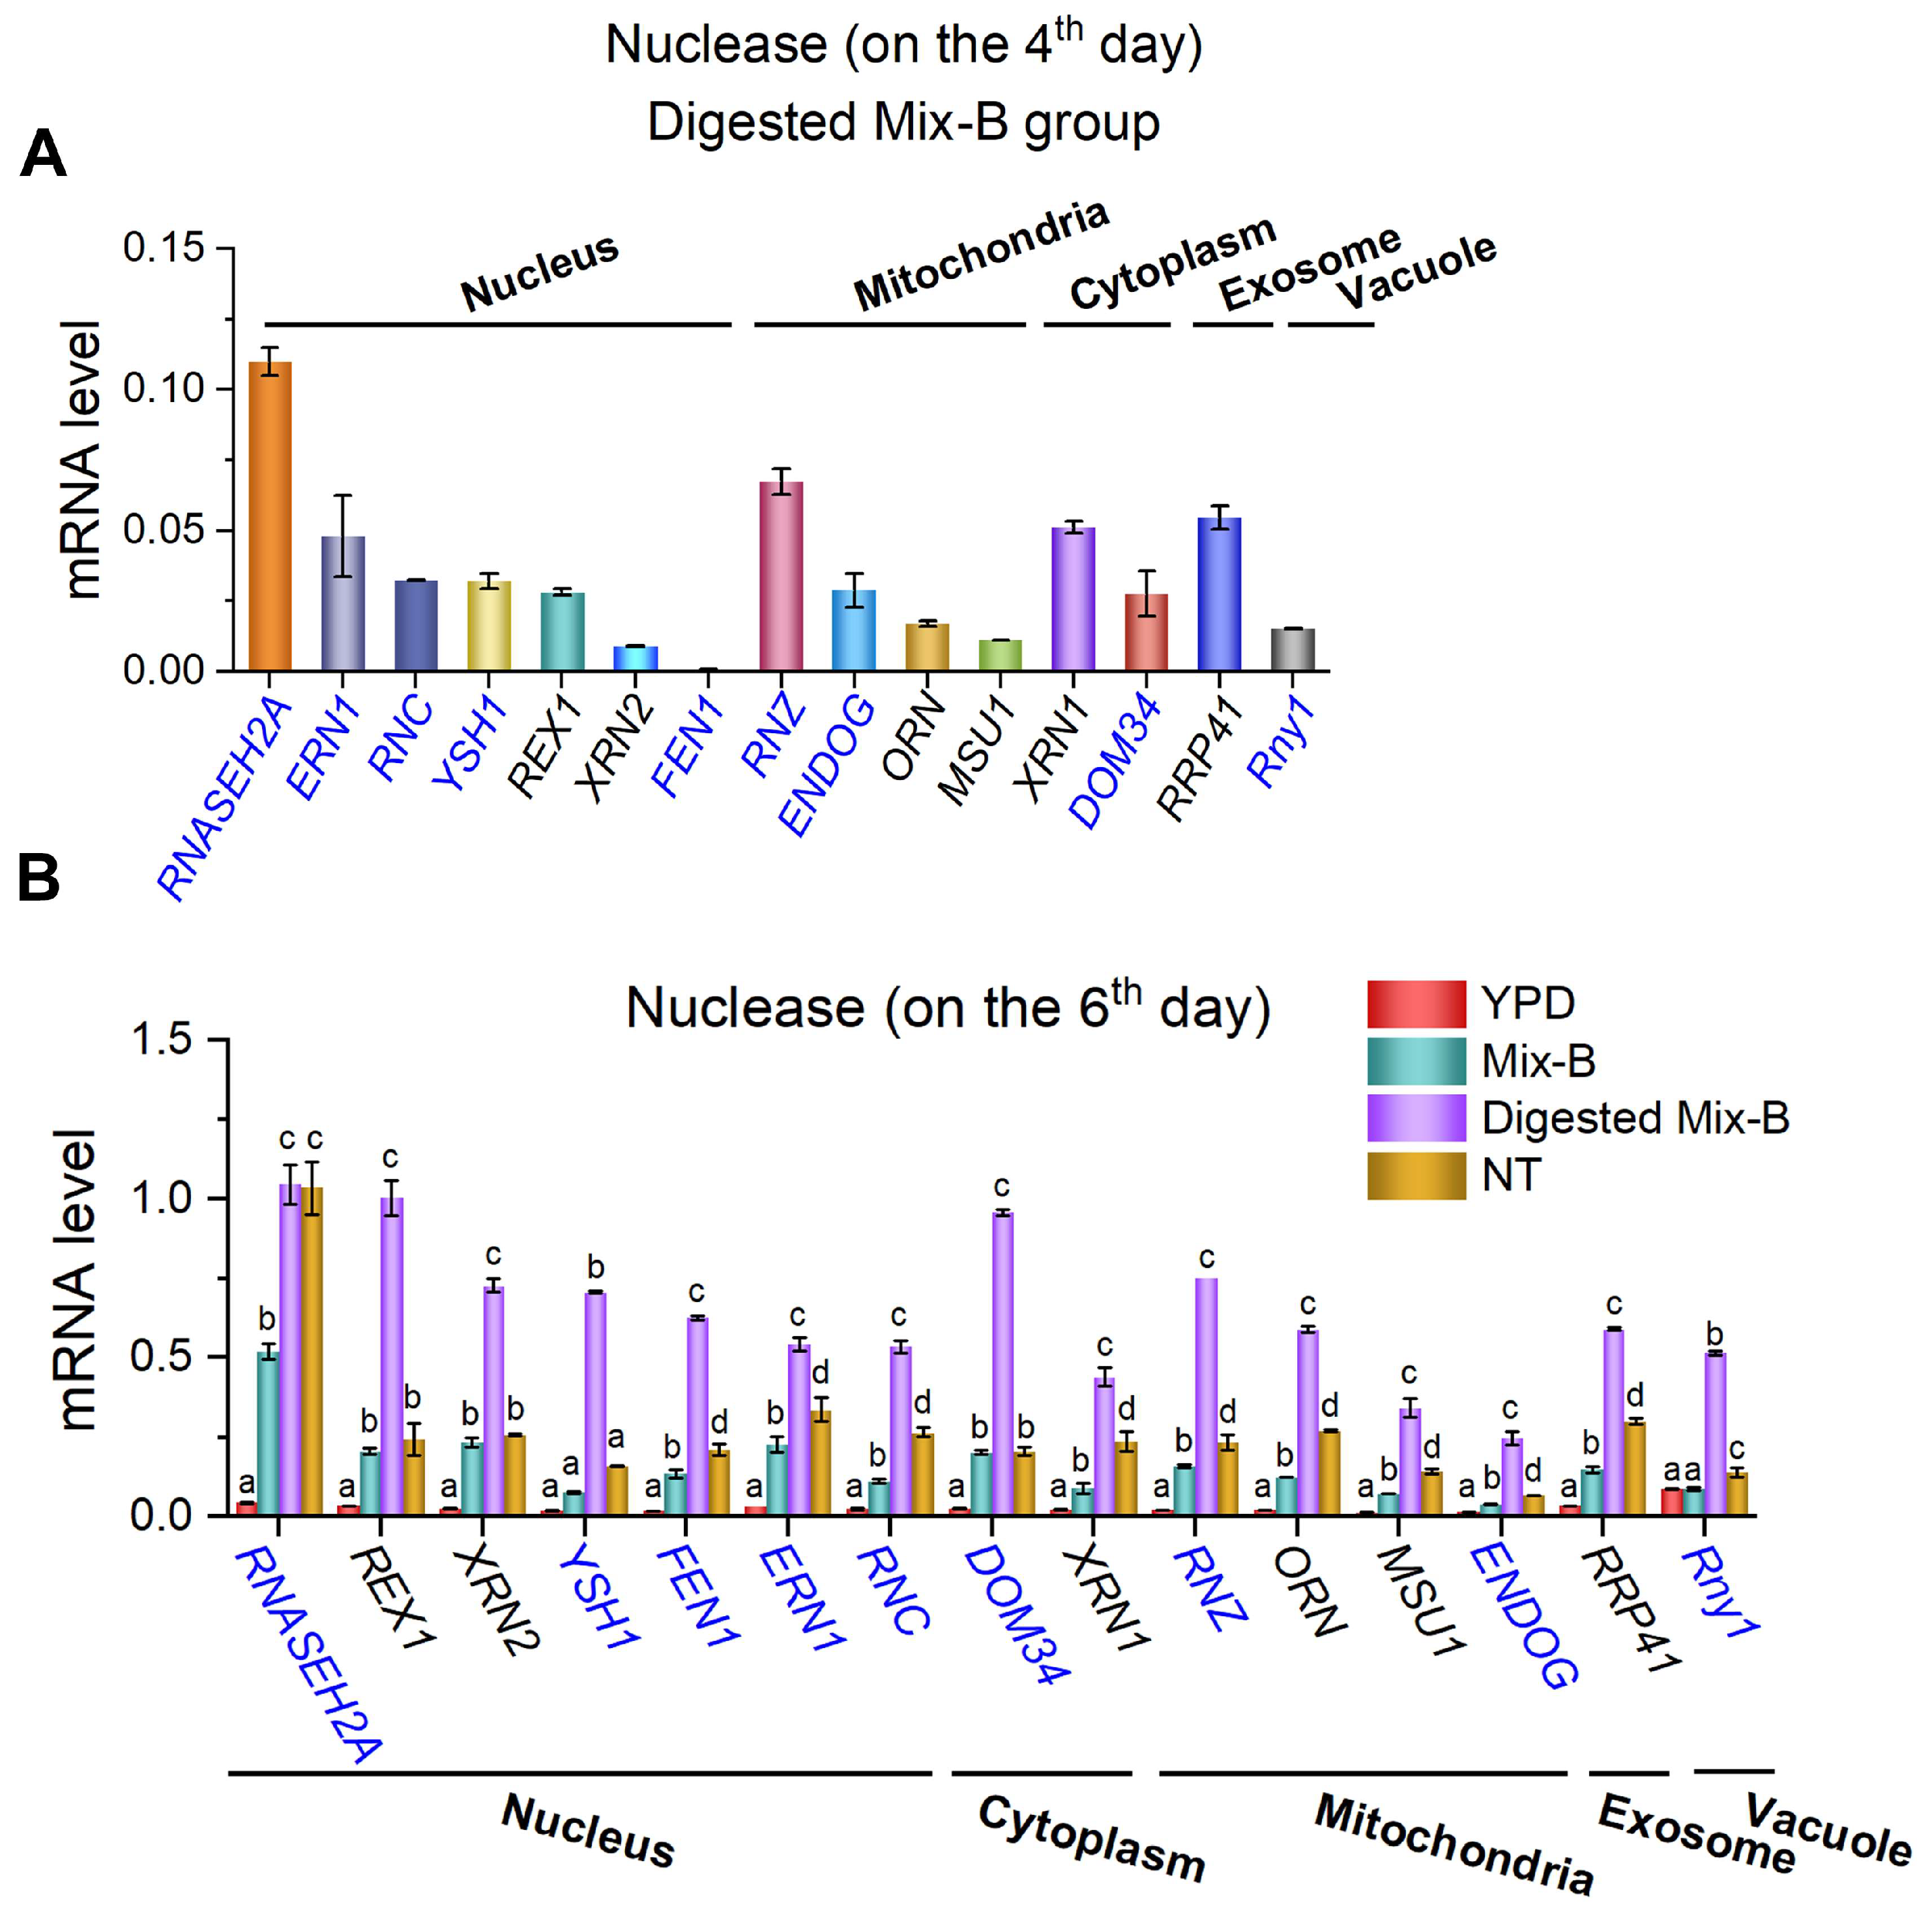
Figure 5.
Proteomic analysis of key processes involved in the absorption and metabolism of oligonucleotides in yeast. (A) Volcano plot illustrating differentially expressed proteins (DEPs) selected based on fold change values (FC) > 2 or < 0.5 and p < 0.05. The points highlighted by the green box and the purple one represent proteins that are significantly upregulated during the endocytic and the autophagic processes, respectively. (B) KEGG annotation of DEPs. (C) KEGG enrichment analysis of transport and catabolism pathways. Dot size represents the number of proteins involved. “Mix-A (up)” indicates proteins that are highly expressed in the Mix-A group; “Mix (down)” indicates proteins that are less expressed in Mix-A group. Mix-A: 5 g/L Mix-A (length < 30 nt) as sole nitrogen; Glu: 5 g/L glutamate as sole nitrogen. For all of these media, 20 g/L glucose was supplemented.
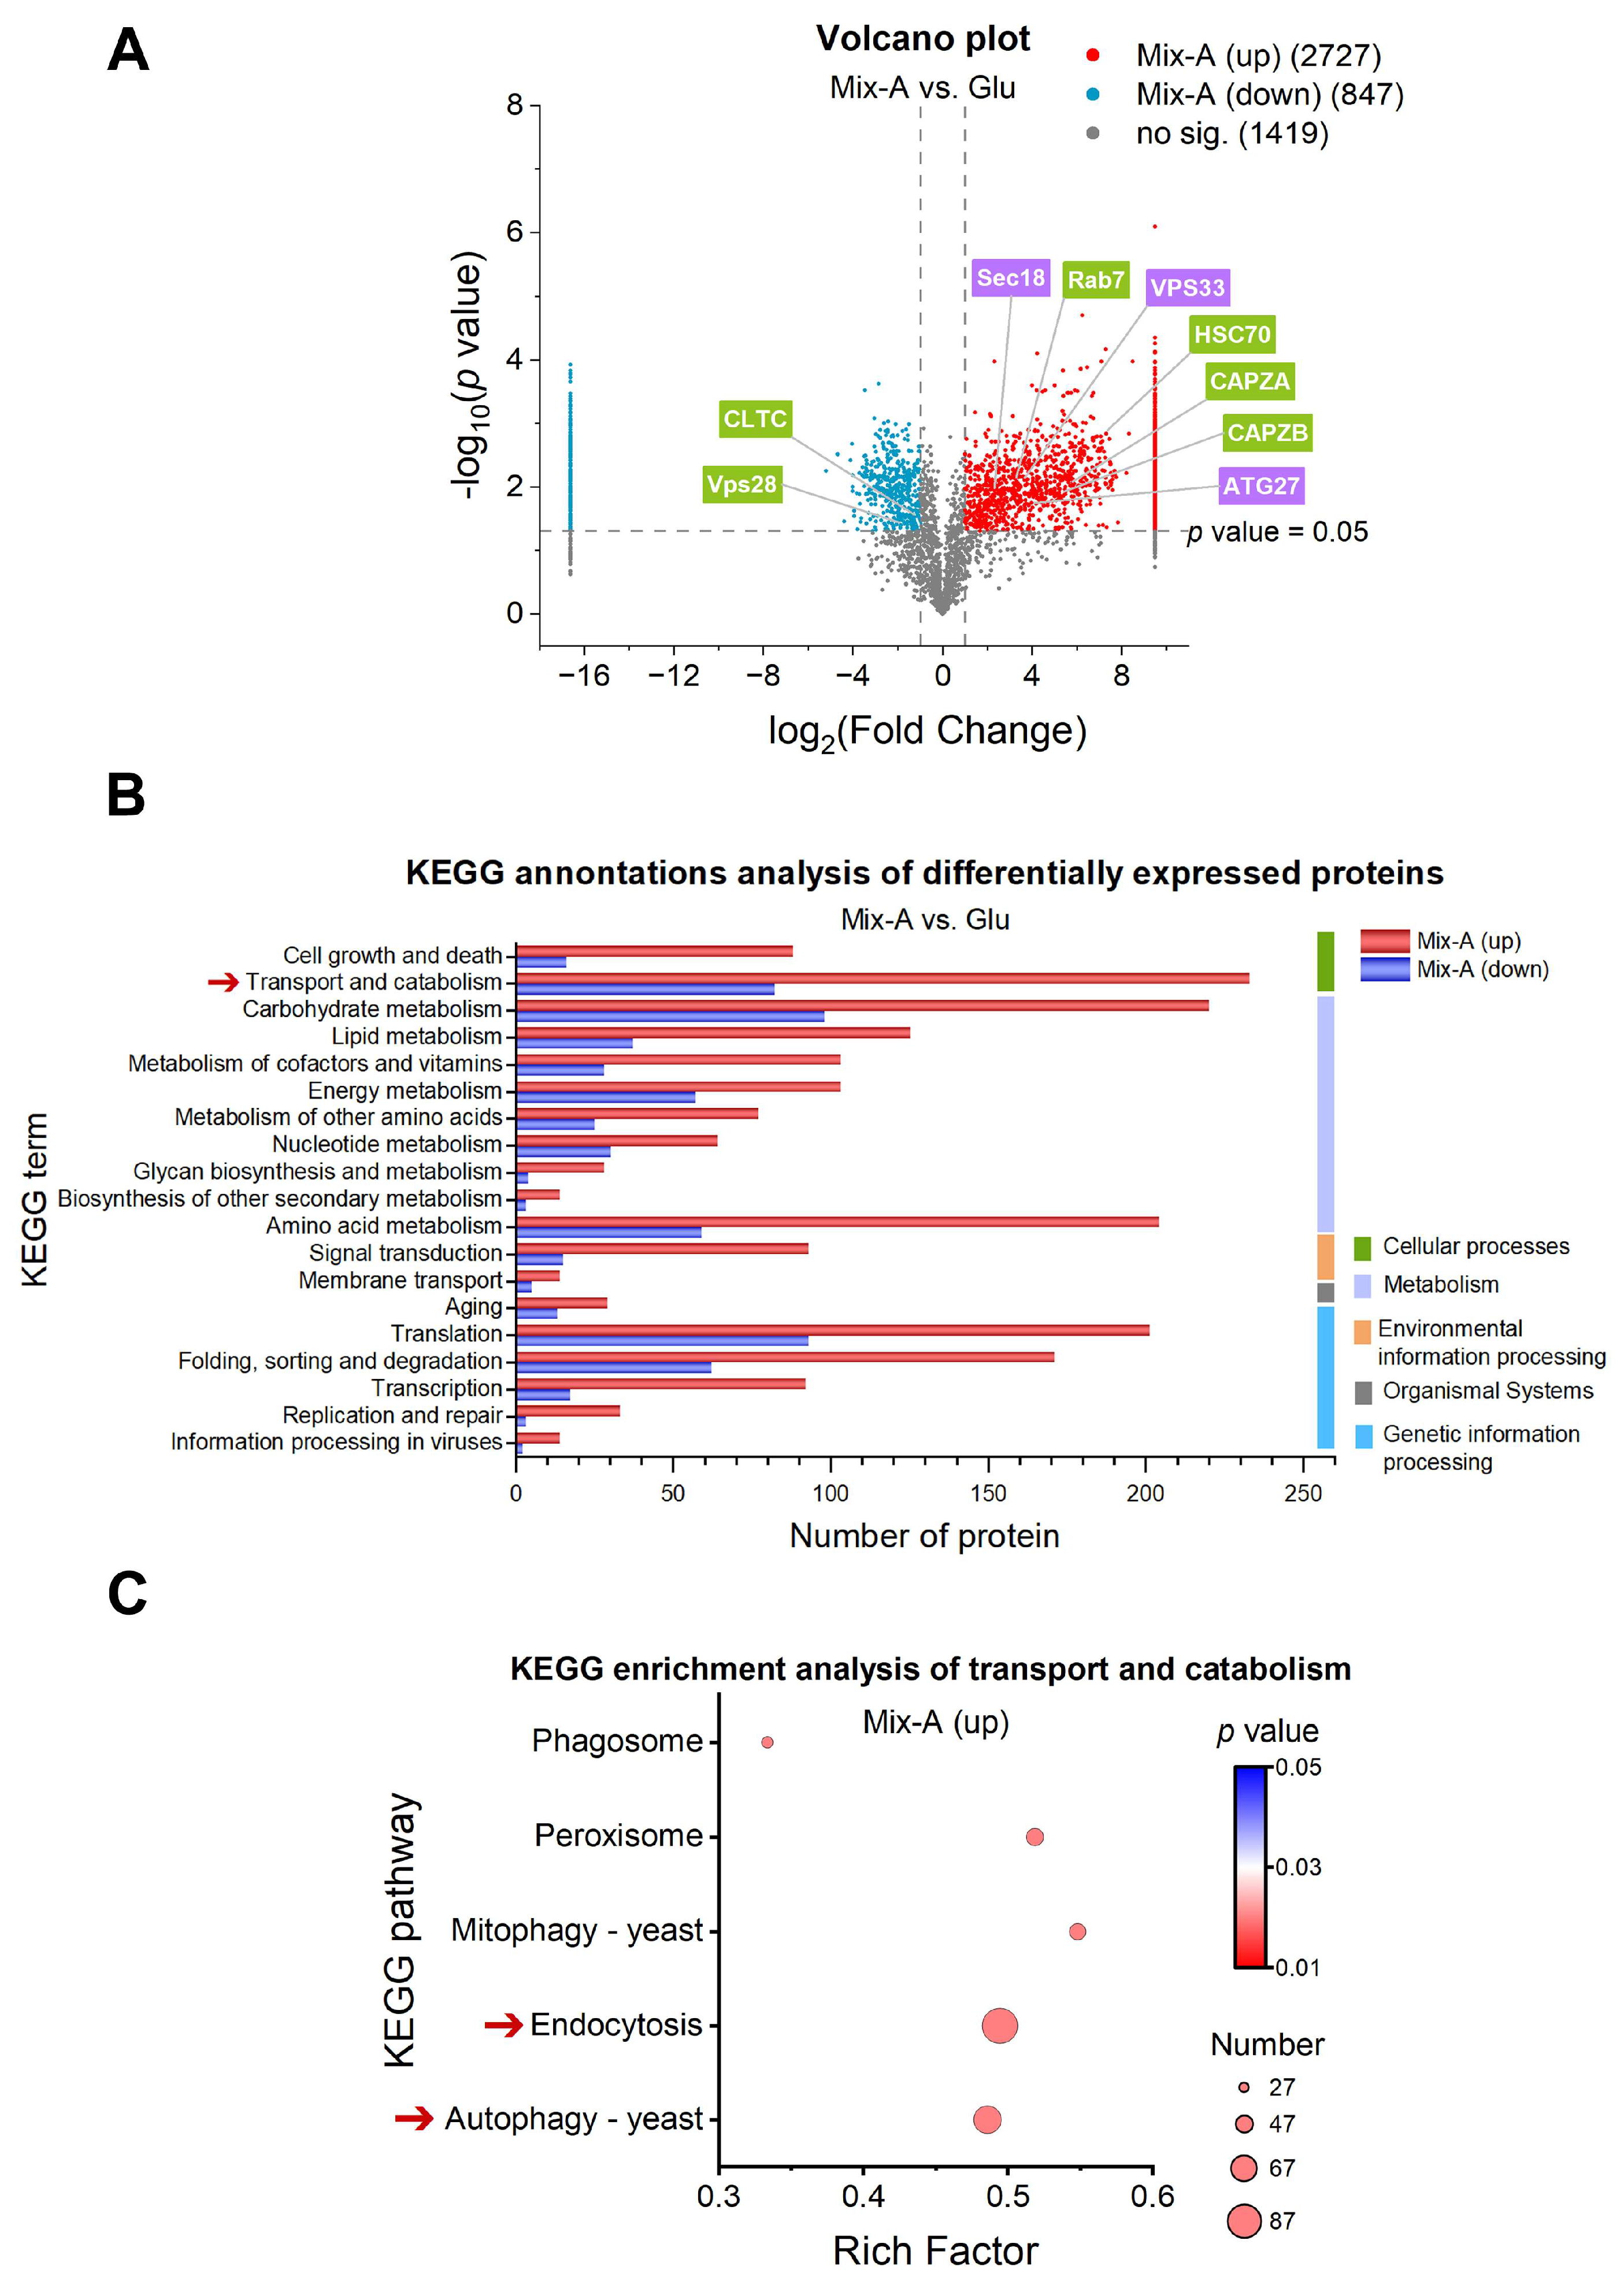
Figure 6.
Expression profiles of proteins associated with endocytosis. (A) Proteins exhibit specific expression levels in the oligonucleotide (Mix-A) group. (B) Proteins co-expressed in both the oligonucleotide (Mix-A) and glutamate (Glu) groups. (C) Schematic diagram illustrating key proteins involved in the endocytic process and their expression levels. Proteins with higher expression in Mix-A group are indicated in red font, while those with lower expression are in green font, and undetected proteins are indicated in black font. Mix-A: 5 g/L Mix-A (length < 30 nt) as sole nitrogen; Glu: 5 g/L glutamate as sole nitrogen. For all of these media, 20 g/L glucose was supplemented.
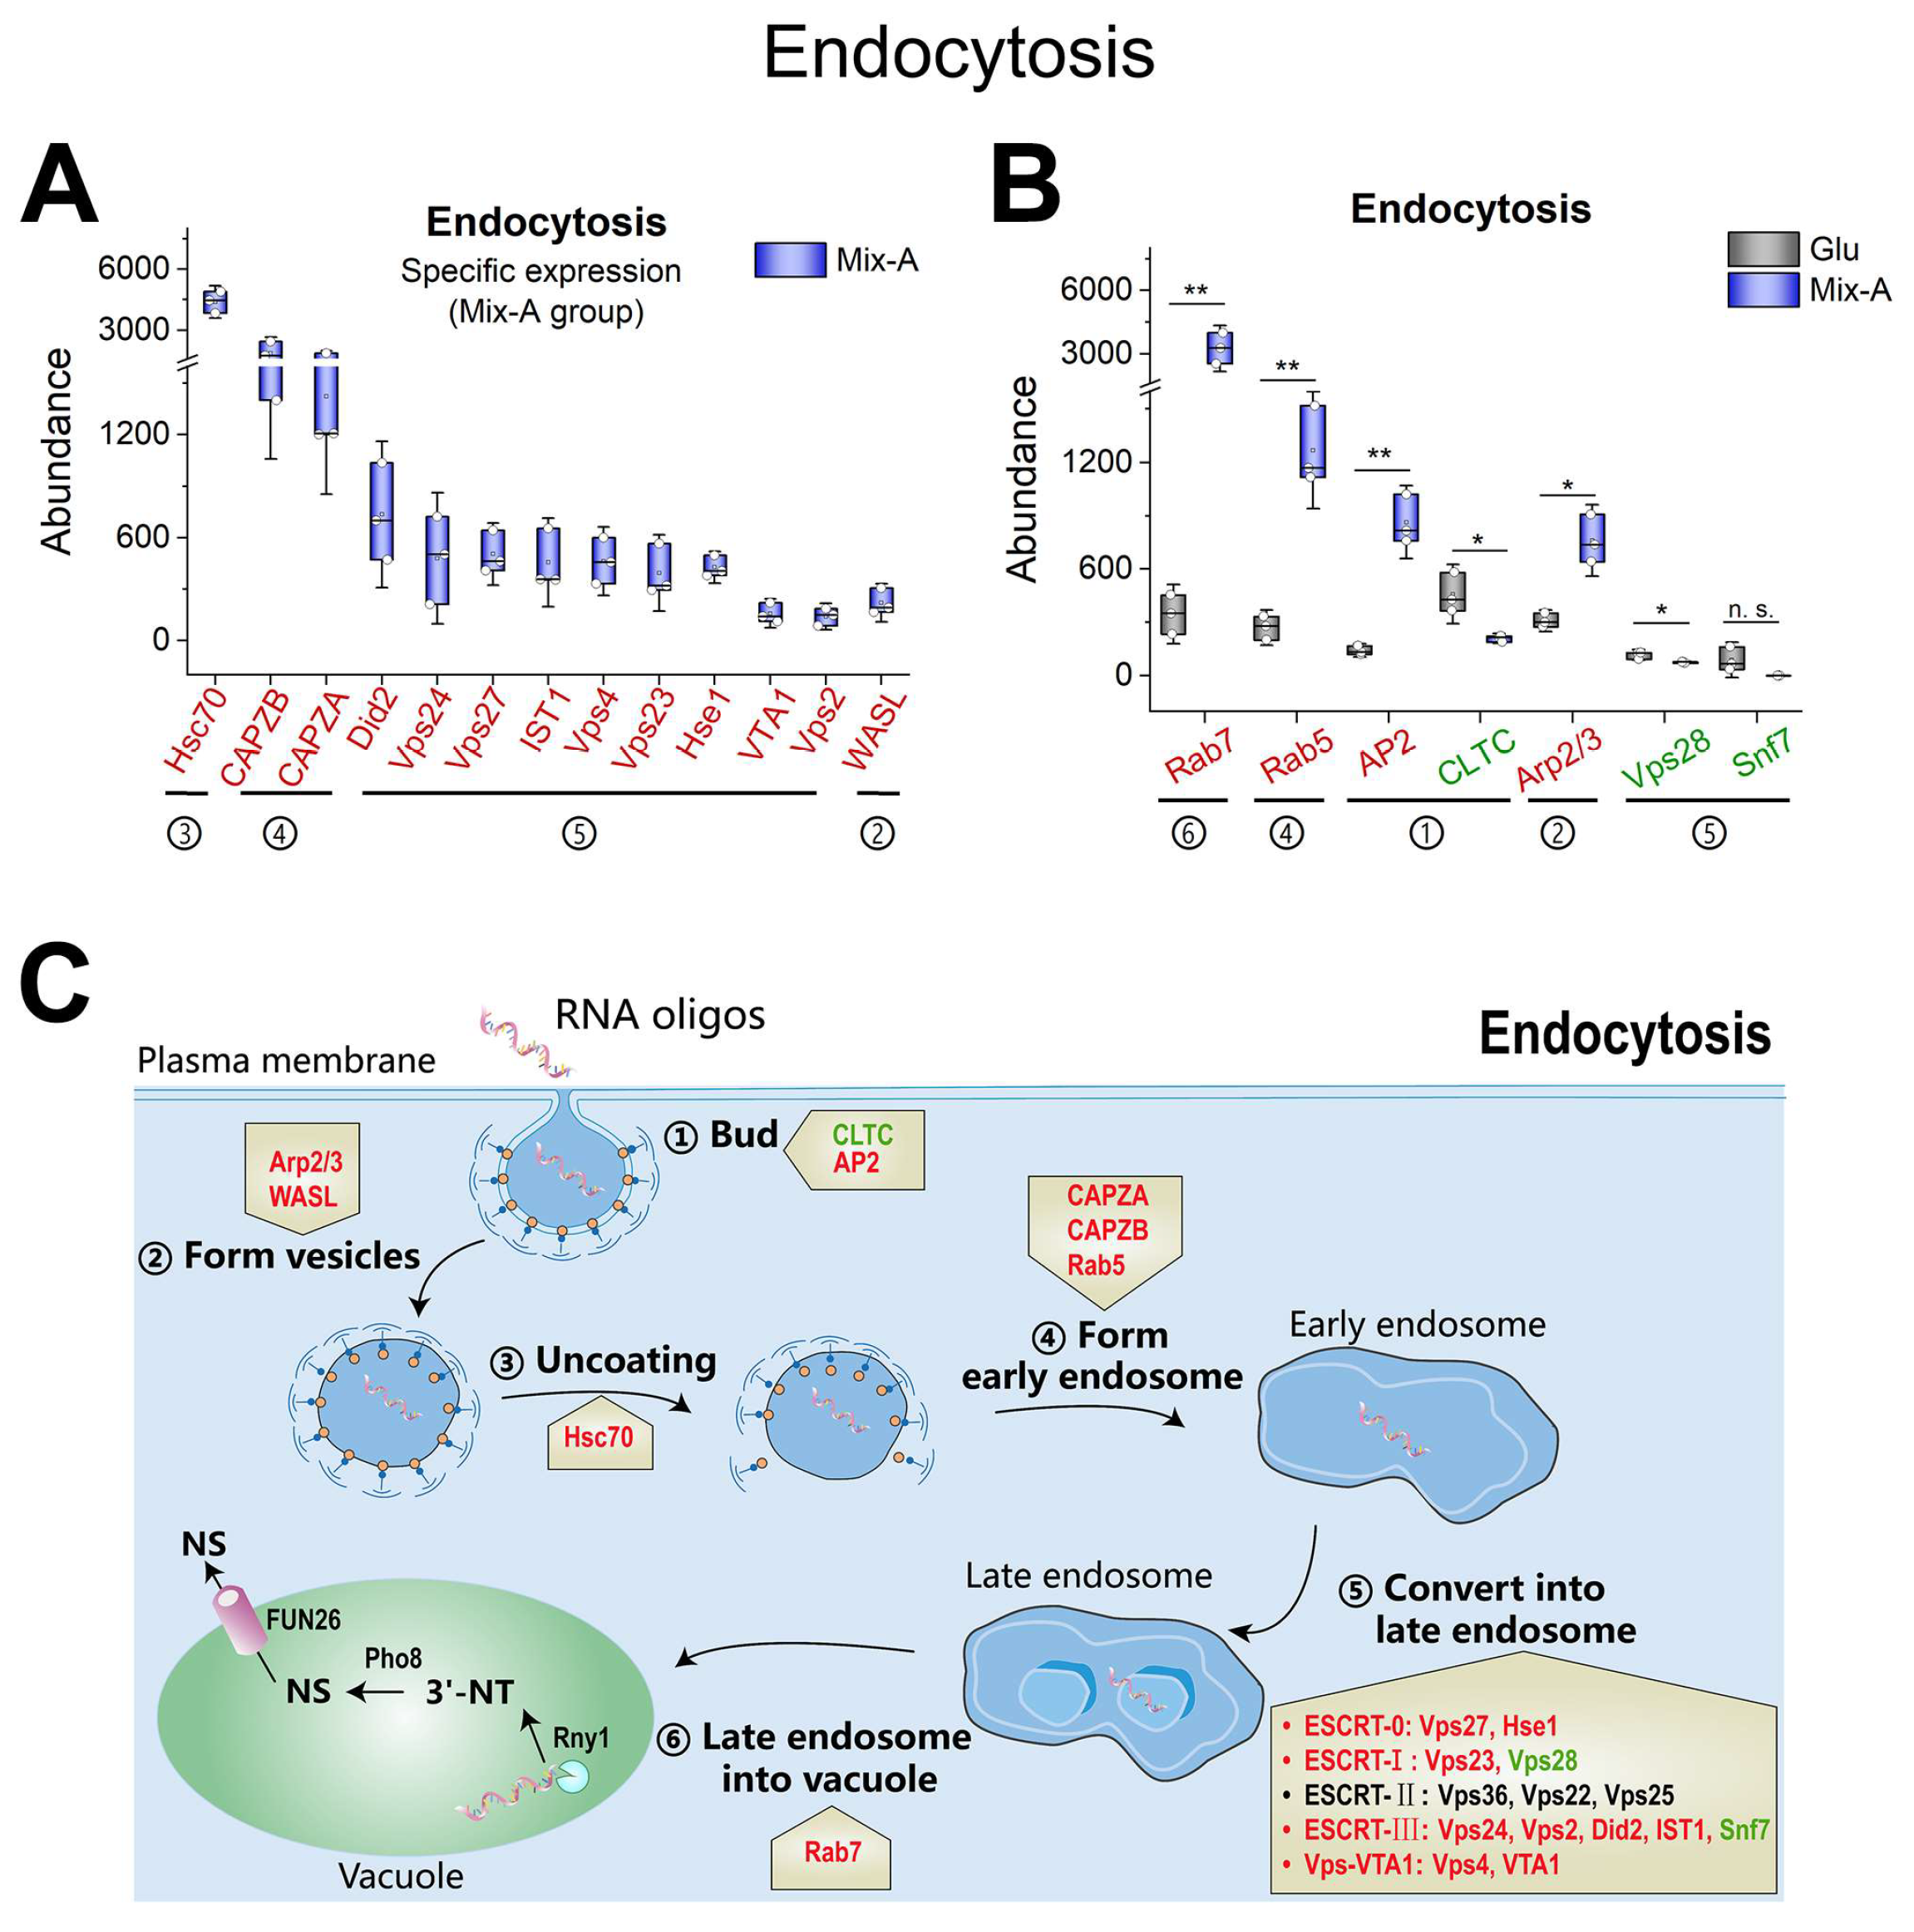
Figure 7.
Expression of proteins related to autophagy, RNA degradation, and nucleotide degradation. (A, B) Protein levels involved in the autophagy. (D, E) Protein levels involved in RNA degradation. (G, I) Protein levels involved in purine and pyrimidine nucleotide degradation processes, respectively. (C, F, H, and J) Schematic diagram illustrating key proteins involved in the autophagy, RNA degradation, purine nucleotide degradation, and pyrimidine nucleotide degradation, respectively. Proteins highly expressed in the Mix-A group are indicated in red font, while those with lower expression are indicated in green font, and undetected proteins are indicated in black font. Mix-A: 5 g/L Mix-A (length < 30 nt) as sole nitrogen; Glu: 5 g/L glutamate as sole nitrogen. For all of these media, 20 g/L glucose was supplemented.
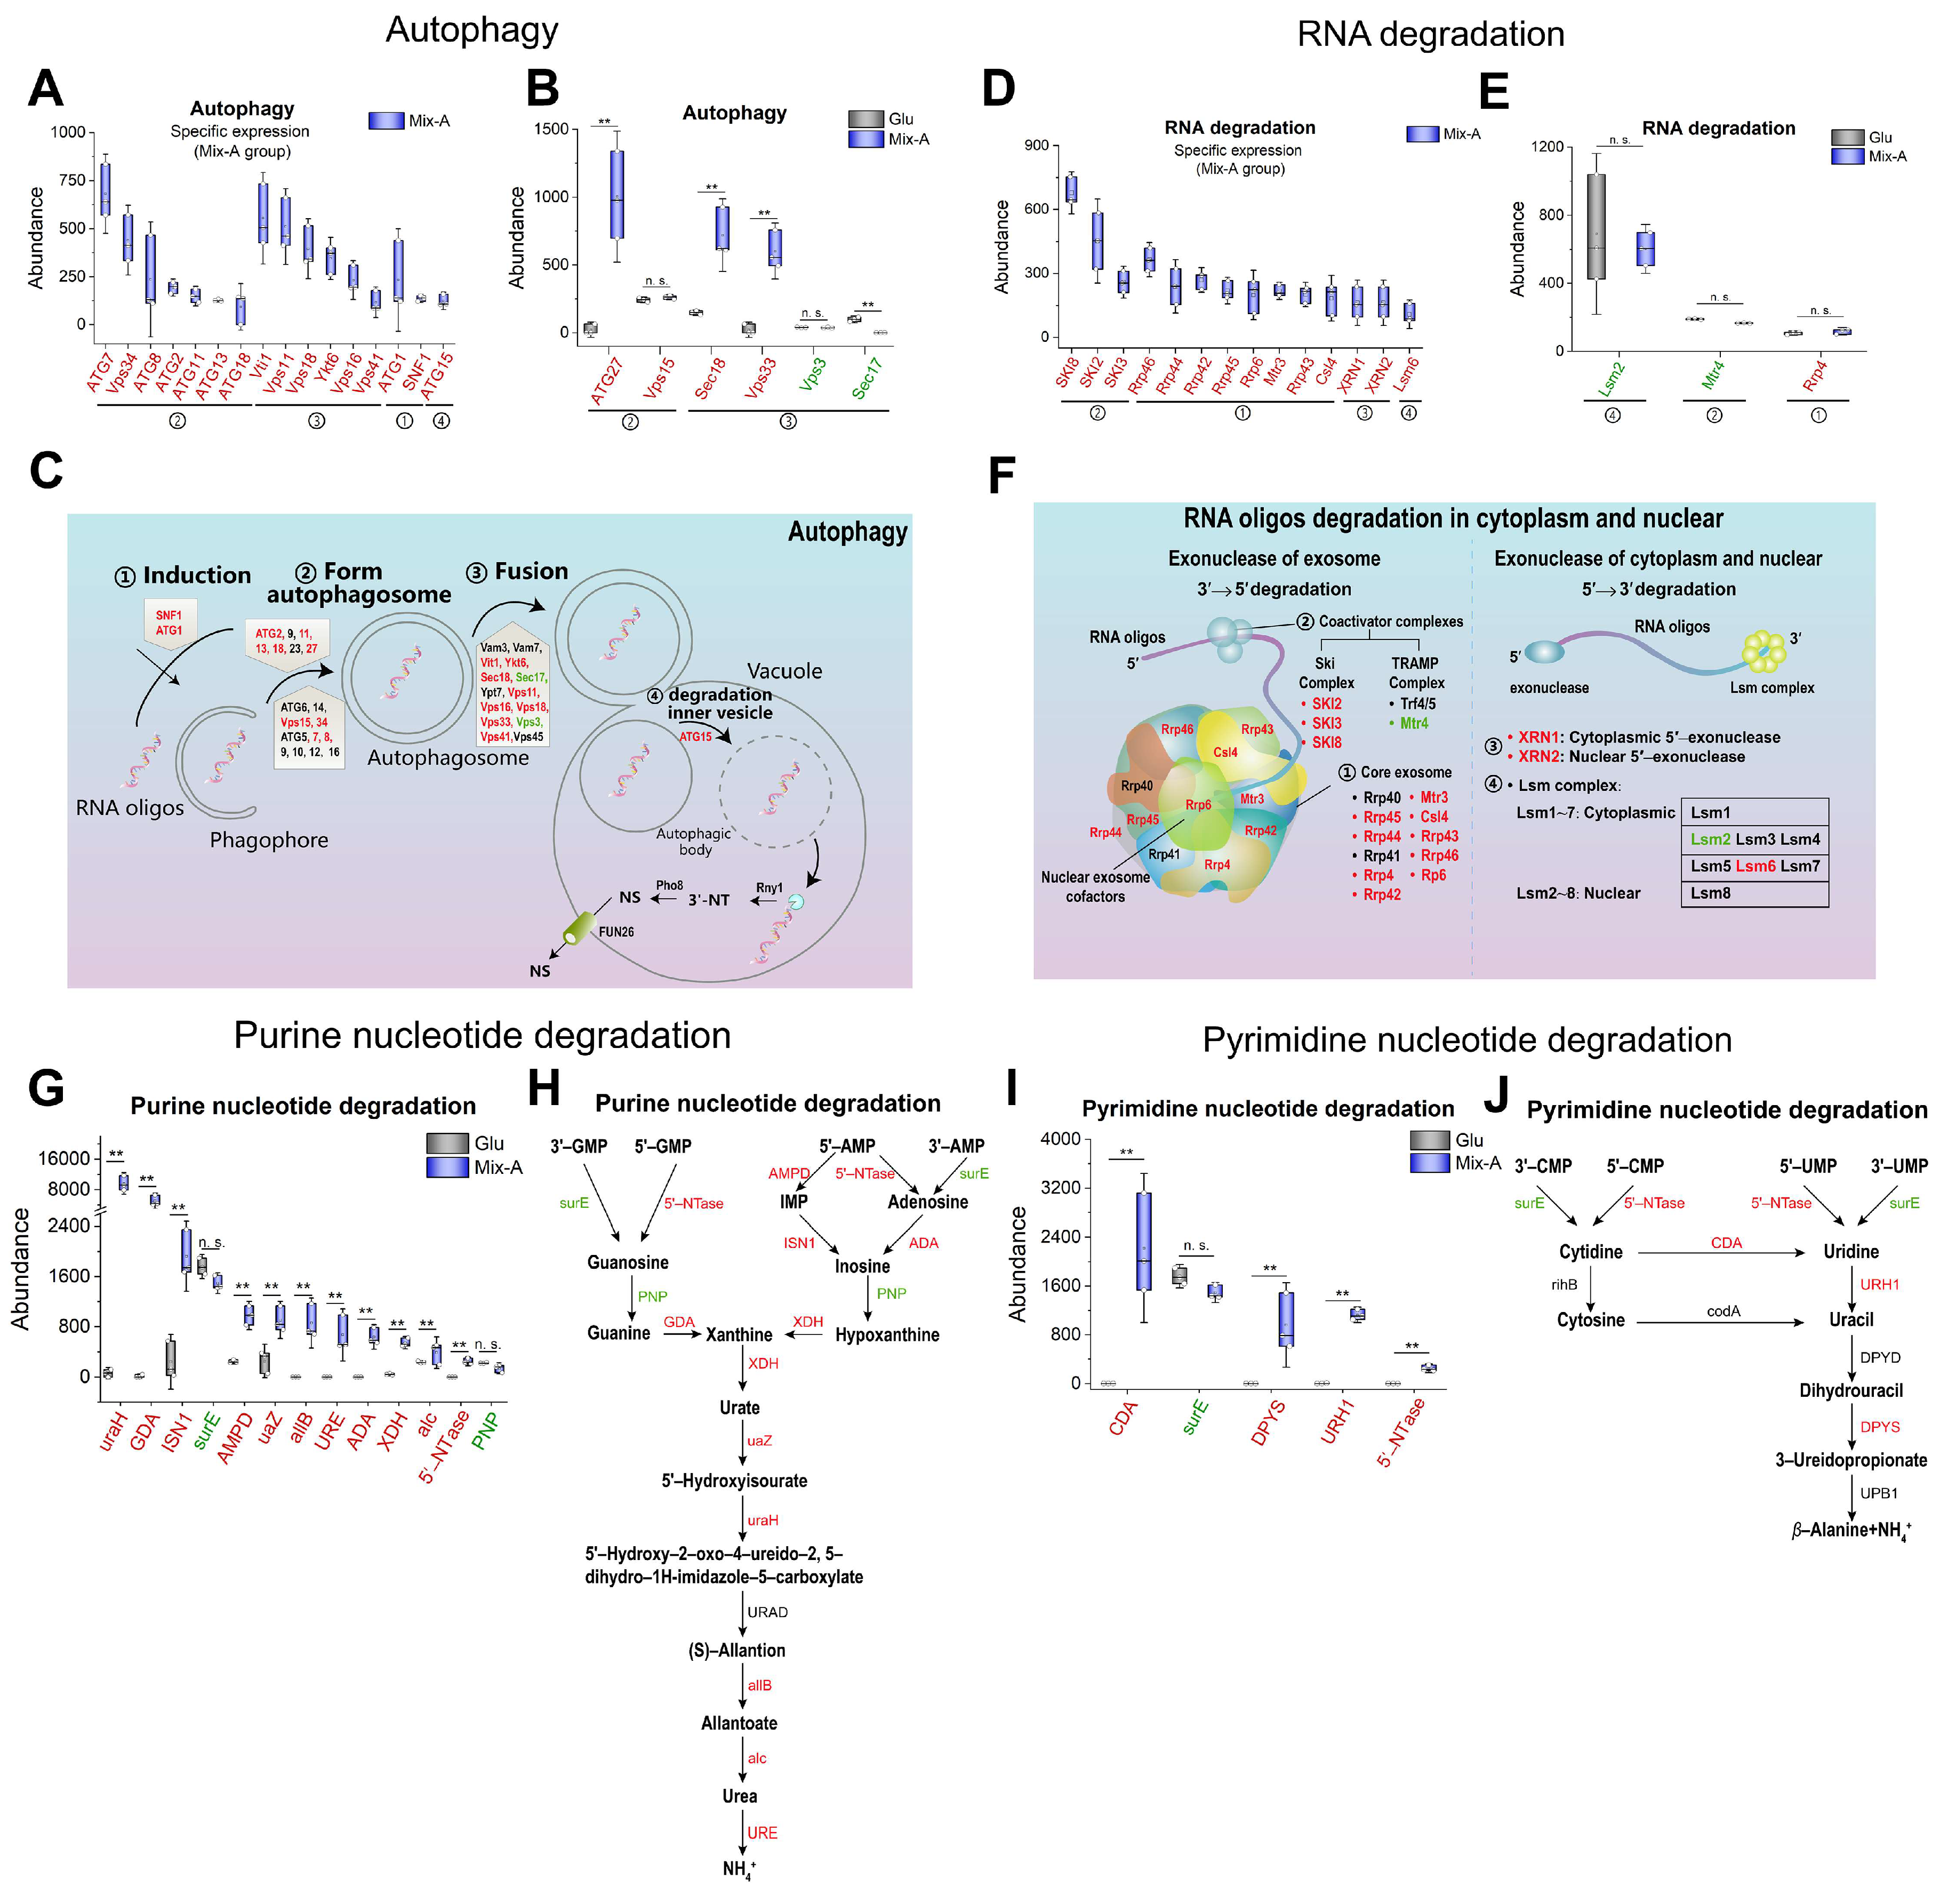
Figure 8.
Expression levels of proteins involved in nucleotide synthesis pathways. (A, C) Protein levels involved in purine and pyrimidine nucleotide synthesis. (B, D) Schematic diagram illustrating key proteins involved in purine and pyrimidine nucleotide synthesis. In the Mix-A group, proteins that are highly expressed are indicated in red font, while those that are lowly expressed are indicated in green font, and undetected proteins are indicated in black font. Mix-A: 5 g/L Mix-A (length < 30 nt) as sole nitrogen; Glu: 5 g/L glutamate as sole nitrogen. For all of these media, 20 g/L glucose was supplemented.
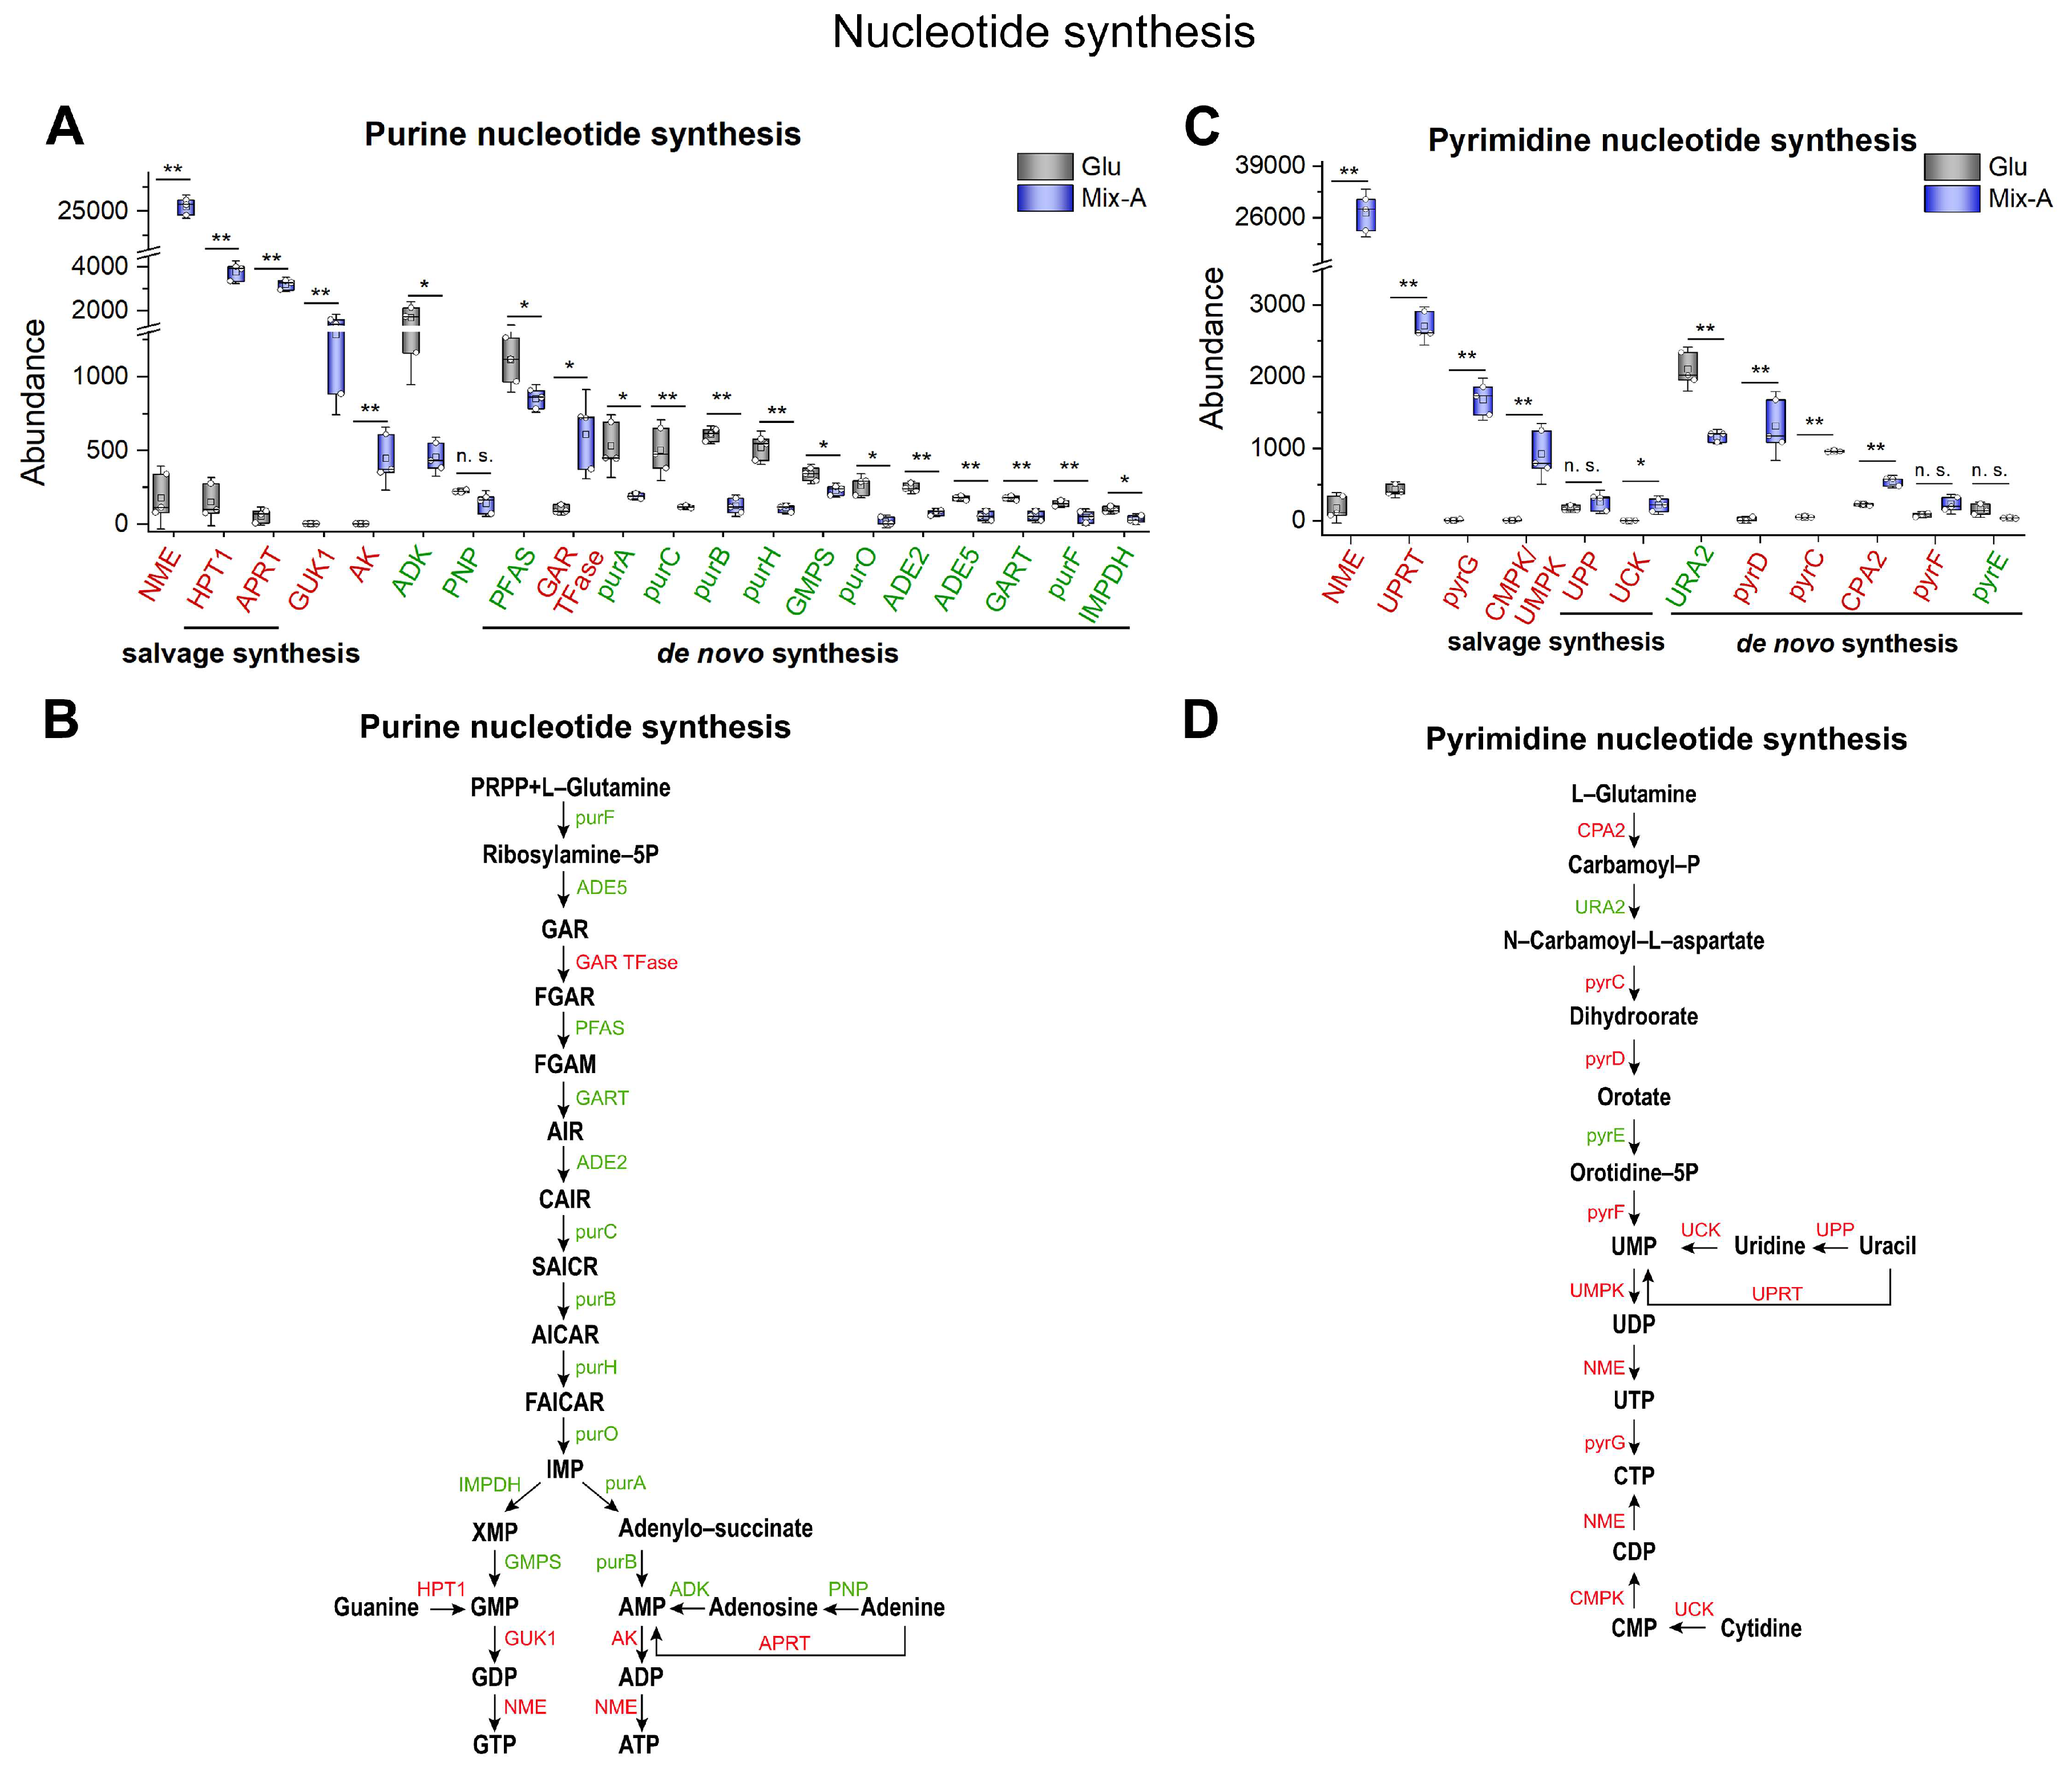
Figure 9.
A graphical model illustrating the absorption and metabolism of RNA oligonucleotides (RNA oligos) by yeast. Yeast cells directly absorb oligonucleotides (length < 30 nt) via endocytosis. A portion of these absorbed oligonucleotides is transported through endosomes to vacuoles, where they are further degraded into nucleosides. The remaining oligonucleotides are released into the cytoplasm. In the cytoplasm, some oligonucleotides are degradation into nucleosides through autophagy, while others are processed into nucleotides and nucleosides by cytoplasmic nucleases. Subsequently, a fraction of these nucleotides and nucleosides is utilized for RNA and DNA synthesis, while another fraction is further degraded into ammonia (NH4+) and β-Alanine for amino acids synthesis and the production of other biomolecules.
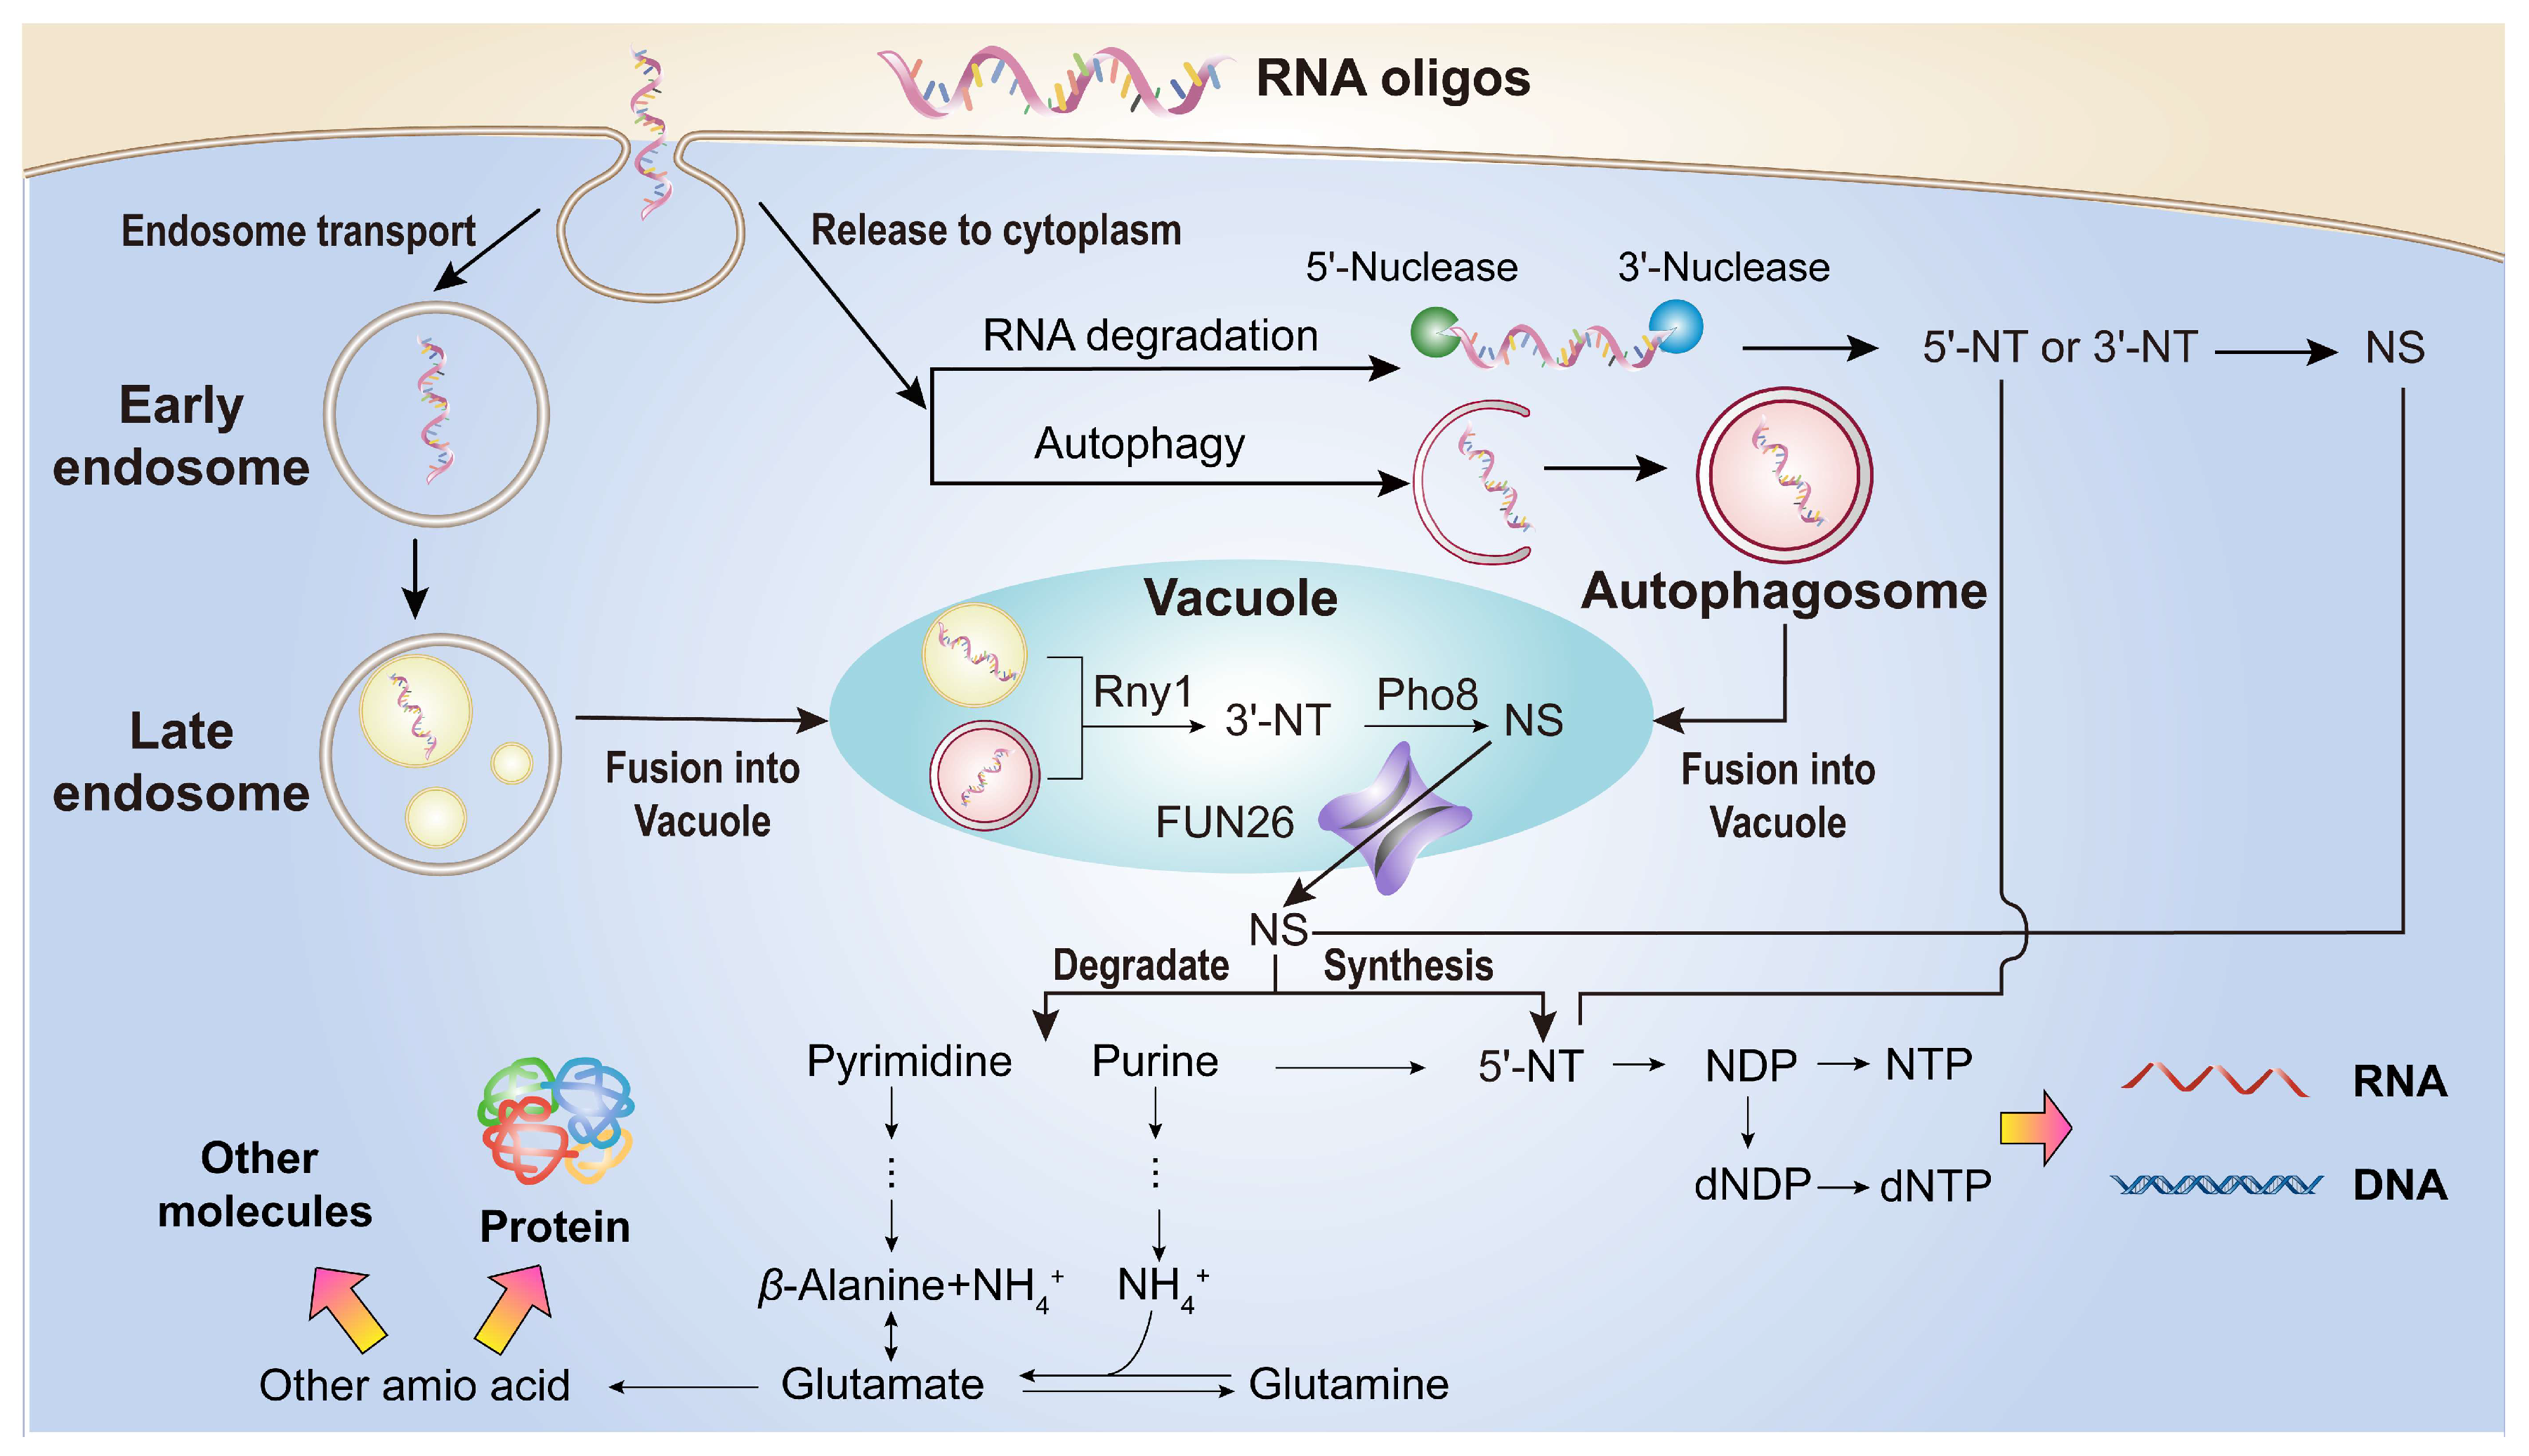
Disclaimer/Publisher’s Note: The statements, opinions and data contained in all publications are solely those of the individual author(s) and contributor(s) and not of MDPI and/or the editor(s). MDPI and/or the editor(s) disclaim responsibility for any injury to people or property resulting from any ideas, methods, instructions or products referred to in the content. |
© 2025 by the authors. Licensee MDPI, Basel, Switzerland. This article is an open access article distributed under the terms and conditions of the Creative Commons Attribution (CC BY) license (http://creativecommons.org/licenses/by/4.0/).
Copyright: This open access article is published under a Creative Commons CC BY 4.0 license, which permit the free download, distribution, and reuse, provided that the author and preprint are cited in any reuse.


