Submitted:
14 April 2025
Posted:
15 April 2025
You are already at the latest version
Abstract
Nylons 6,7, 8,7 and 10,7 have been synthesized by interfacial polycondensation and characterized. Thermal properties and thermally induced structural transitions have been evaluated to complement the reported data on nylon 4,7. Therefore, the complete even-odd series derived from pimelic acid is fully characterized to insist in their peculiar structural polymorphism. Real time WAXD synchrotron experiments were acquired during heating, cooling and reheating processes. Basically, three structures were involved: a modified α-form, a distorted pseudohexagonal form and a pseudohexagonal form. The modified α-form was stable up to relatively low temperatures (i.e., lower than 140 °C), was mainly produced by solution crystallization and was progressively disfavored when the number of methylene groups of the diamine moiety increased. A progressive transition from the modified α-form to the distorted pseudohexagonal structure was observed during heating. Also, a continuous reverse transition was detected on cooling, although the yield on the modified α-form was low. A Brill transition towards a pseudohexagonal structure was observed in all cases. This transition was reversible, although with some hysteresis degree. Oriented fiber patterns corresponding to the distorted pseudohexagonal structure were obtained by melt stretching. In all cases, the 00l reflections appeared with a meridional orientation and indicated a shortening close to 0.05 nm/amide group with respect to the expected values for fully extended conformations.
Keywords:
aliphatic polyamides
; nylons
; even-odd series
; pimelamide
; synchrotron radiation
; structural transitions
; hydrogen bonds
; thermal properties
1. Introduction
Aliphatic polyamides (nylons) constitute a family of polymers with outstanding mechanical performance (e.g., high toughness, modulus and resistance), good thermal properties, and recognized resistance to abrasion and chemicals [1,2]. Nylons are mainly employed as fibers and engineering plastics that include the automative industry and electronics taking advantage of weight reduction capabilities and insulation properties, respectively. Furthermore, nylons have applications in newer technologies in the field of energy harvesting and biomedicine [3]. It is estimated that nylons will reach a production of 10.4 million tons in 2027 and a growth rate of 6.2% from 2022 to 2030 due to the increasing demand on durable, lightweight and corrosion resistant materials [4].
Nylons are usually obtained from petrochemical products like α,ω-amino acids and lactams that give rise to nylons n, or alternatively from the reaction of diamines with dicarboxylic acid derivatives that leads to nylons n,m. Nowadays, efforts are focused to develop sustainable polymers from renewable sources [5,6,7]. Specifically, attention is addressed to get bio-based polyamides where one or both monomers derive from biomass [8,9]. Strategies for biological production of even diamines (e.g., 1,4-butanediamine, 1,6-diaminohexane, 1,8-diaminooctane and 1,10-diaminodecane) have been developed and involved fermentation, cell bioconversion or enzymatic processes [10,11,12,13]. Different engineering strategies have also been explored to improve production (e.g., gene expression [14] and protein engineering [15]). With respect to bio-based odd and short dicarboxylic acids, malonic acid offers great possibilities. Thus, different structural studies have been undertaken [16,17] despite processing is limited due to the high melting point of his derivatives. Glutaric acid has also been considered (e.g., nylons 5.5 [18], 6.5 [19] and 12.5 [20]), but polymerization is hindered as consequence of monomer cyclization at high temperatures [21]. The next member of this odd series is pimelic acid, a natural product found in Phycomyces blakesleeanus, Arabidopsis thaliana and other organisms [22,23,24]. Pimelic acid is synthesized in bacteria and yeast by a modified fatty acid synthetic pathway and also by the enzymatic cleavage of longer chain fatty acids (e.g., linolenic acid). In fact, pimelic acid has a biological function since it is involved in the biosynthesis of lysine and biotin (vitamin B7). In addition, pimelic acid is excreted in the urine of patients with mitochondrial beta-oxidation disorders [25]. From an industrial point of view, pimelic acid can be obtained by oxidation of unsaturated fats (e.g., castor oil) [26]. Up to now, nylon 4.7 is the only derivative of pimelic acid that has been structurally studied [27], being the purpose of the present work to progress on the bio-based series of even-odd polyamides derived from pimelic acid (i.e., nylons 6.7, 8.7 and 10.7).
Properties of nylons are dominated by their capacity to establish strong hydrogen bonding interactions [1]. Thus, these interactions in the melt state led to a low entropy that repercusses on a high melting temperature as well as on some memory effects [28,29,30]. The influence of H-bonds in the solid state is also significant since the final crystalline structure depends on the best way to arrange molecules to form H-bonds with optimal geometry (i.e., to minimize the packing energy). This feature leads to some characteristics that are still controversial: (a) A temperature dependent polymorphism with not well defined and understood transitions. Probably the clearest example is the Brill transition towards a pseudohexagonal packing that is observed in different nylons at temperatures close to their melting point [31,32,33,34,35]; (b) Complex spherulitic morphologies with varied optical properties that depend on the crystallization temperature [36,37,38,39,40]; (c) Uncertainties concerning the disposition of H-bonds in the solid state. For example, models with 3H-bonding and 1H-bonding directions have been postulated for the pseudohexagonal Brill structure. Despite structures with 1H-bonding direction have been stated for the typical structures of nylons (i.e., α/β forms of even and even-even nylons [41,42] and γ-form of odd and odd-odd nylons [43], models with 2-H bonding directions have also been postulated for even-odd [19,20,27,44,45,46,47,48] and odd-even [49,50,51] nylons. Furthermore, peculiar structures with 3H- and 2H- bonding directions have been proposed for nylons having glycine [52,53,54] and malonic acid [16,17] units, respectively. These peculiar arrangements have also been supported by the resolution of the crystalline structure of small model compounds by X-ray diffraction and applying direct methods for the phase estimation [49,55] as well on the well-defined hexagonal and rhombic crystals displayed in some cases by lamellar crystals obtained from diluted solutions [18,53].
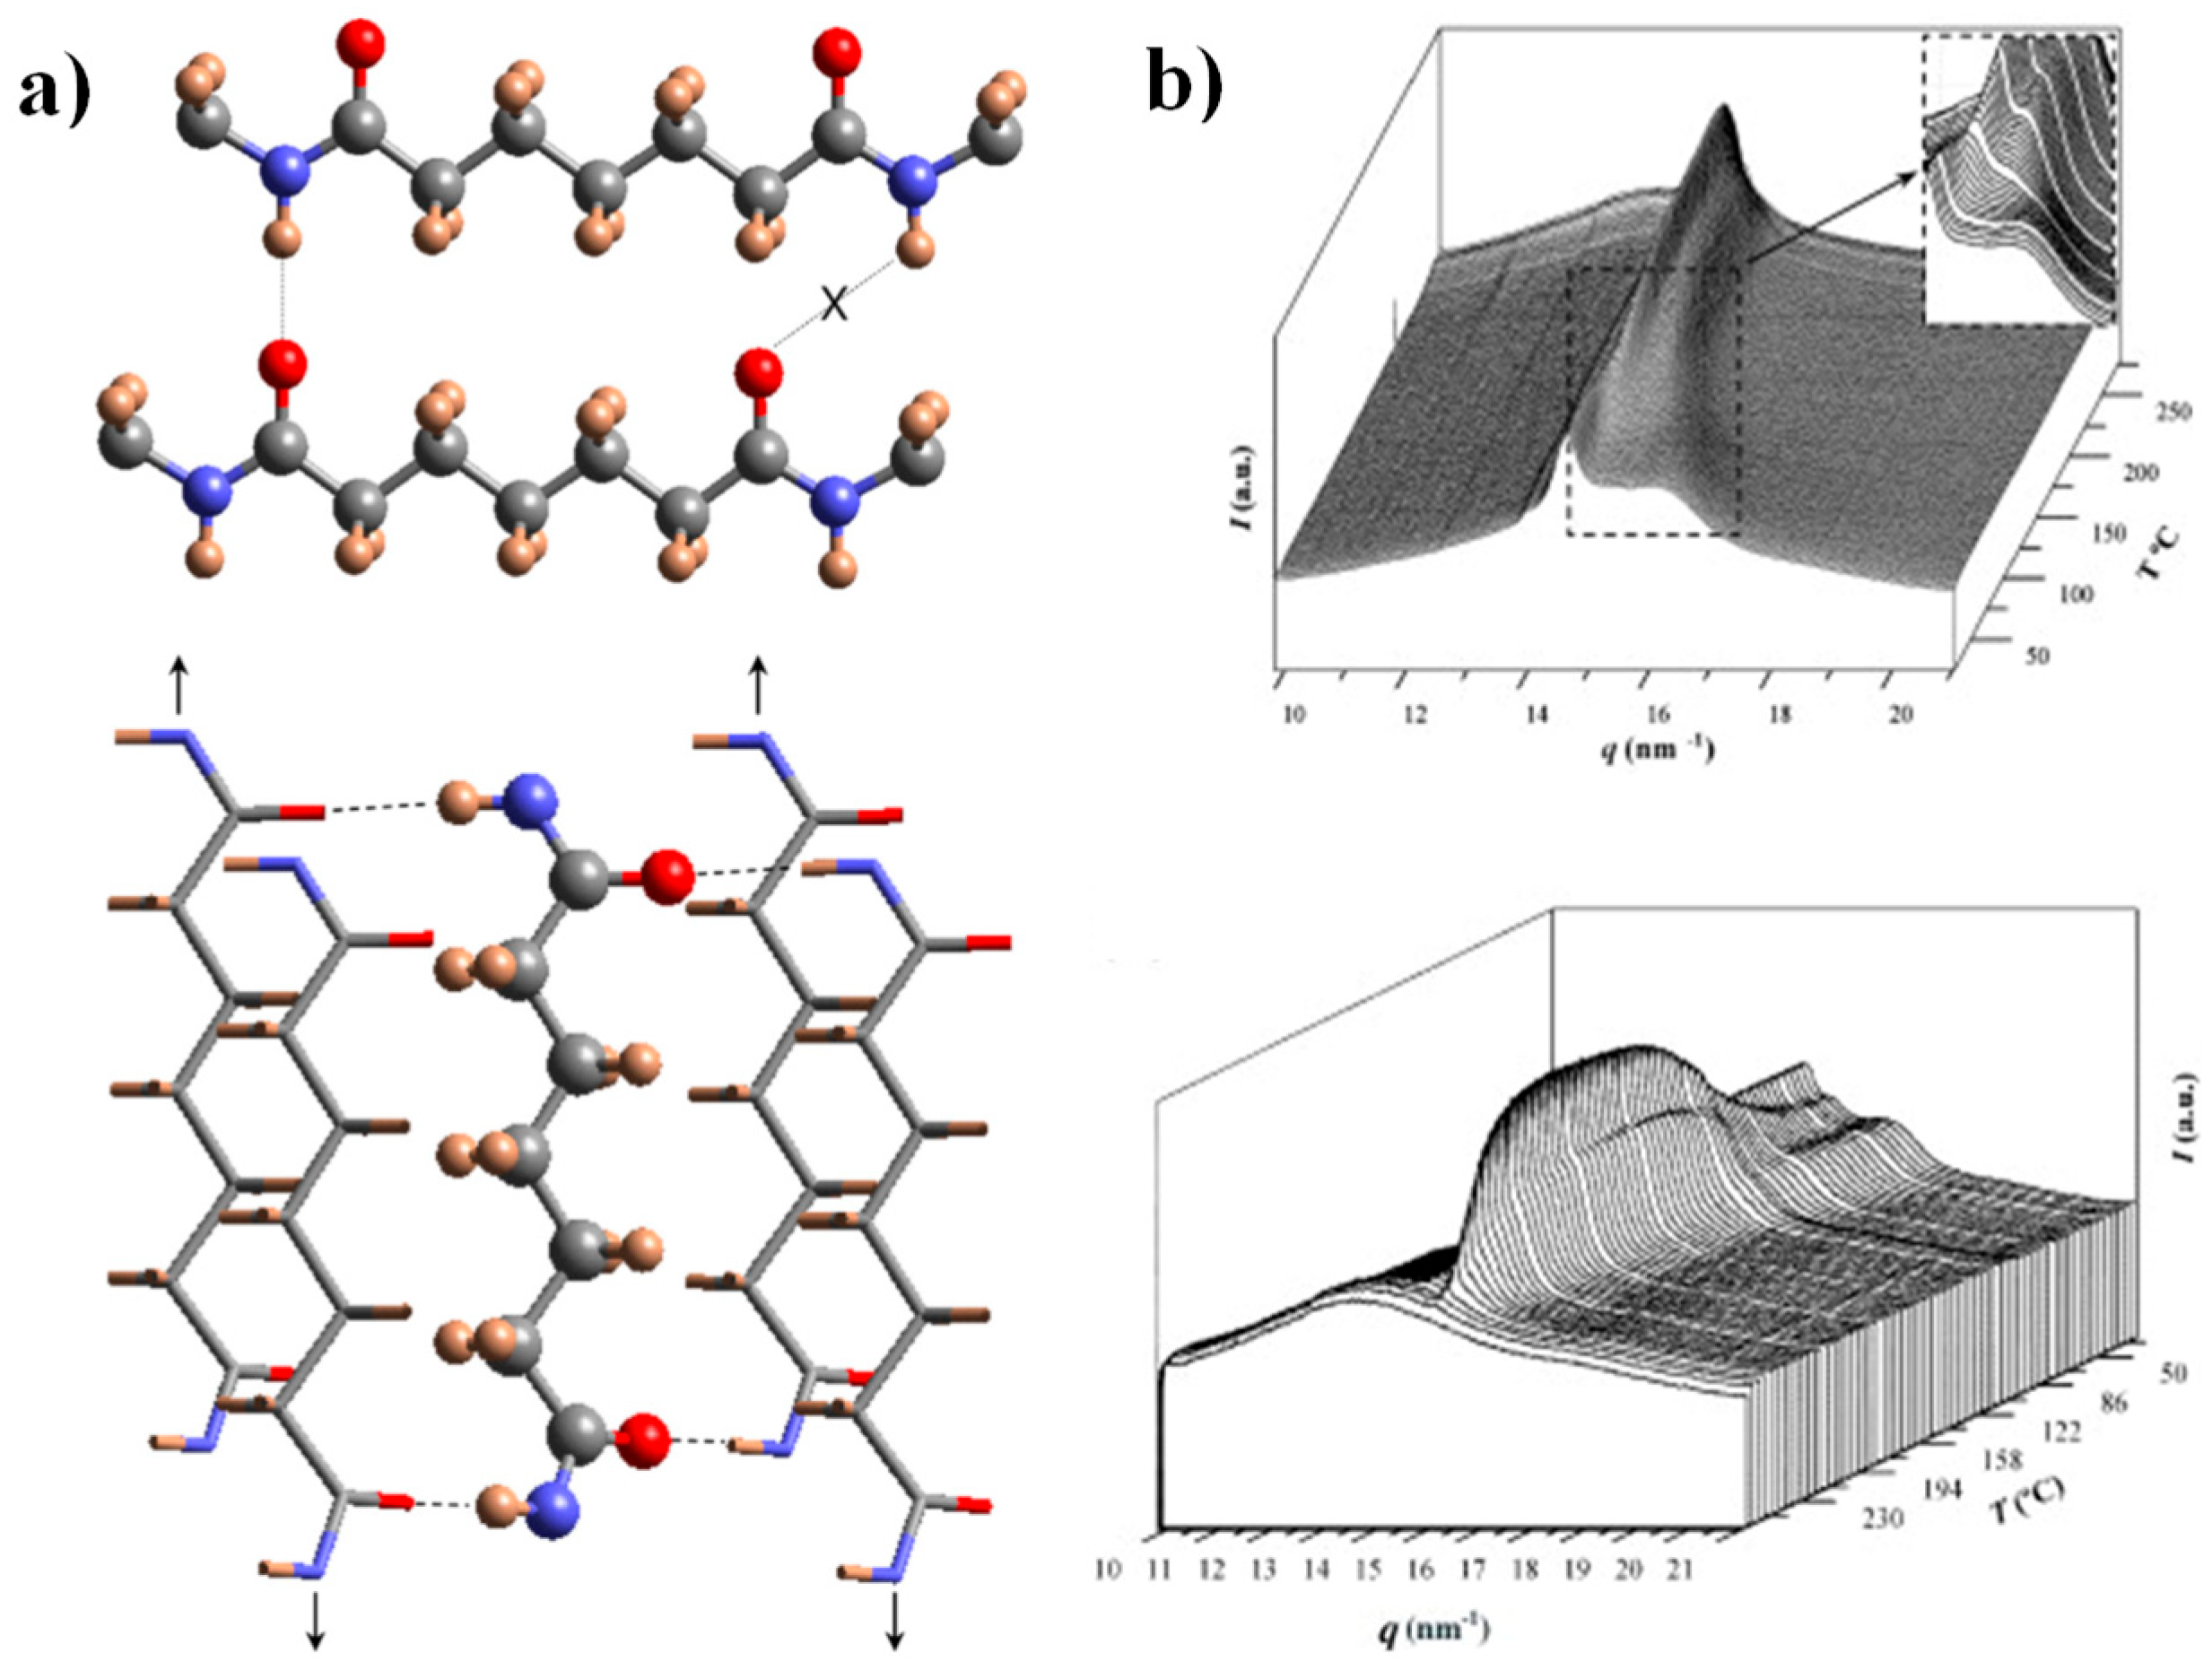
The crystalline structure of nylon 4.7 has recently been studied by our group [27], being interesting to remark some features for the comprehension of the present work: (a) X-ray diffraction patterns of solution crystallized samples showed two strong equatorial reflections at 0.430 nm and 0.389 nm and defined a monoclinic unit cell with a = 0.482 nm, b = 0.860 nm, c (fiber axis) = 3.192 nm and β = 115. Despite the indicated reflections seemed compatible with the typical sheet arrangement of the α/β forms of nylons (e.g., intersheet and intrasheet spacings of 0.440 nm and 0.380 nm), a model based on two H-bonding directions was postulated as previously done for other even-odd and odd-even nylons [44,51]. This model accounts for a good H-bonding geometry when odd diamide units are involved, a feature that cannot be accomplished when molecular chains have the characteristic all trans conformation postulated for the α/β forms (Figure 1a). (b) Real time WAXD profiles obtained by synchrotron radiation during heating showed a structural transition towards an intermediate pseudohexagonal structure that finally experiments the Brill transition towards the typical pseudohexagonal form (Figure 1b). A Brill transition involving an intermediate structure has recently been postulated for some even-even nylons [32]. The observation of this two-step process is difficult in most nylons, since the two events appear merged. (c) WAXD profiles taken during a subsequent cooling showed some reversibility and specifically the intermediate structure can be detected again as well as the partial recovery of the initial crystalline structure. The existence of two structures at high temperature is also significative to justify the complex morphologies of spherulites obtained during crystallization. In fact, the presence of two crystalline entities with competitive properties was recently postulated to justify the peculiar optical properties of even-even nylons [40]. In addition, the partially temperature reversible polymorphic transition of nylon 4.7 seems important to justify the observed reversible behavior of the optical properties of some nylon 4.7 spherulites.
In general, pseudohexagonal packings seem to be favoured when nylons have long polymethylene segments. In this case, the influence of hydrogen bonding interactions becomes progressively minimized as the number of CH2 groups increase, while van der Waals interactions become enhanced. In addition, at high temperatures, the librational movement of CH2 groups tends to stabilize a packing with an identical distance between a molecular chain and its six closer neighboring chains. By contrast, molecular arrangements with the characteristic disposition of layered structures (or even their modified form) seem to be favoured in low temperature crystallizations (e.g., solution precipitation). Note that at low temperature, minimum energy of torsional angles involving methylene groups should be associated to the trans conformation of the α/β-like forms. Furthermore, the accomplishment of a good hydrogen bonding geometry may be prevalent in diluted solutions and low temperatures since the motion of methylene groups is lower and the establishment of good H-bonding interactions may be prevalent. Therefore, the main goal of the present study is the evaluation of thermal induced structural transitions for the series of even-odd nylons having pimelate units and displaying different lengths of their polymethylene unit (diamine moiety).
2. Materials and Methods
2.1. Materials
Pimelic acid dichloride (PDC), 1,6-diaminohexane (DAH), 1,8-diaminooctane (DAO), 1,10-diaminodecane (DAD), sodium carbonate, dichloromethane and formic acid were purchased from Sigma Aldrich (Barcelona, Spain) and used as received. 1,1,1,3,3,3-hexafluoroisopropanol (HFIP) was supplied by Apollo Scientific (Cheshire, United Kingdom).
2.2. Synthesis
The selected nylons were obtained via interfacial polymerization (Scheme 1) using previously optimized conditions. In a typical procedure, 10 mmol of diamine and 2 eq of proton acceptor (sodium carbonate) were dissolved in 40 mL of water, in case of DAH and DAO or in 40 mL solution water-acetone 3:1 in case of DAD. The solution was then stirred at room temperature using an Ultraturrax® homogenizer. 10 mmol of PDC was separately dissolved in 40 mL of dichloromethane. This second solution was dropwise added during a period of 60 min to the stirred aqueous phase. After an additional period of 30 min, the reaction was stopped by precipitation with water. The solid was washed subsequently with water, ethanol, and diethyl ether. The obtained white polymer was then dried overnight at room temperature under reduced pressure.
2.3. Characterization
Molecular weights were determined by Gel Permeation Chromatography (GPC) using a liquid chromatographic pump (Shimadzu, model LC-8A, Tokyo, Japan) controlled by the LC Solution software (Shimadzu, Tokyo, Japan). The polymer was dissolved and eluted in 1,1,1,3,3,3-hexafluoroisopropanol (HFIP) containing CF3COONa (0.05 M). The flow rate was 1 mL/min, the injected volume 20 μL and the sample concentration 6 mg/mL. A PL-HFIP-gel column (Agilent Technologies Deutschland GmbH, Boblingen, Germany) and a refractive index detector (Shimadzu, model RID-20A, Tokyo, Japan) were employed. The number and weight average molecular weights were determined using polymethyl methacrylate standards.
Infrared absorption spectra were recorded, at a resolution of 4 cm−1, with a Fourier Transform FTIR 4700 Jasco spectrometer (Tokyo, Japan) equipped with a Specac MKII Golden Gate Single Reflection Diamond ATR system.
1H spectra were recorded on a Bruker NMR Ascend 400 spectrometer operating at 400.13 MHz. Samples were dissolved in deuterated trifluoroacetic acid (CF3COOD) (nylon 10.7) or a 7:3 mixture of deuterated trifluoroacetic acid and deuterated formic acid. Spectra were recorded at 25 °C and were internally referenced to TMS.
Calorimetric data were recorded by differential scanning calorimetry using a TA Instruments Q100 series equipped with a refrigerated cooling system operating from −90 to 550 °C. Experiments were performed under a flow of dry nitrogen with a sample of ca. 4 mg. The instrument was calibrated for temperature and heat of fusion using an indium standard. Thermal characterization was carried out following a four-run protocol consisting in a heating run (10 °C/min) of the as-synthesized sample, a cooling run (10 °C/min) after keeping the sample in the melt for 3 min to remove the thermal history, a second heating run (10 °C/min) of such non-isothermally crystallized sample. Finally, a third heating run (10 °C/min) was performed with a sample cooled from the melt state at the maximum rate allowed by the equipment.
Thermogravimetric analysis (TGA) data were acquired with a Q50 thermogravimetric analyzer of TA Instruments (New Castle, DE, USA) under a flow of dry nitrogen with approximately 5 mg samples and at a heating rate of 10 °C/min.
The wide-angle X-ray diffraction (WAXD) real-time variable temperature synchrotron studies were carried out on beamline BL11-NCD-SWEET at ALBA synchrotron (Cerdanyola del Vallès, Barcelona, Spain) by using a wavelength of 0.100 nm. A WAXD LX255-HS detector from Rayonix was employed. Polymer samples were confined between Kapton films and then held on a Linkam hot stage with temperature control within ±0.1 °C. WAXD profiles were acquired during heating and cooling runs in time frames of 10 s and rates of 10 °C/min. WAXD diffraction pattern was calibrated by means of a geometrical calibration process of a well-known sample (i.e., standard Cr2O3). Diffraction profiles were normalized to the beam intensity and corrected considering the empty sample background.
3. Results
3.1. Synthesis
The selected nylons were synthesized after optimization of typical parameters (i.e., organic solvent, proton acceptor, addition method and agitation system) as accurately described for the preparation of nylon 10.7 [56]. Polymerization yields were in the 67–75% range. Molecular weights were moderate, and the polydispersity indices relatively elevated as typical for a polycondensation polymer. For the subsequent characterization and structural analyses, a more homogeneous fraction (Table 1) was obtained by a controlled precipitation of a 10 wt-% solution of the corresponding nylon in formic acid by dropwise addition of water.
In all cases FTIR spectra (Figure 2) showed the typical bands associated to amide and methylene groups of nylons with small shift differences and logically the increase of the relative intensity of methylene bands as the diamine changed in the sequence DAH, DAO, DAD. Specifically, amide A, amide B, amide I, amide II and amide III bands were observed at 3310, 3289, 1630, 1543–1540 and 1240–1238 cm−1, respectively. Asymmetric and symmetric CH2 stretching vibrations were observed at 2920 and 2850 cm−1, respectively, while the twisting of the CH2-NH bond of CH2 groups was detected at 720 cm−1. An amide V band was also observed at 685 cm−1, increasing logically its relative intensity with respect to the 720 cm−1 band when the length of the diamine unit decreased (i.e., amide V appeared as a shoulder or a well differentiated peak in nylon, 10.7 and 6.7, respectively). The specific value of the amide V band is interesting since for even and even-even nylons it is associated with the α/β structures (i.e., those characterized by X-ray diffraction patterns with two intense reflections at 4.40 and 3.85 nm). The inset of Figure 2 shows as the clear amide V band of nylon 10.7 decreased on intensity and shifts to around 690 cm−1 when the sample was crystallized from the melt, which is evidence of a structural transition towards a pseudohexagonal arrangement. It should be pointed out that the amide VI band (640 cm−1), which is proof of a typical γ form was not detected. In addition, the amide A band shifted after crystallization towards a lower wavenumber (i.e., 3295 cm−1) suggesting a worse formation of hydrogen bonds (inset).
1H spectra (Figure 3) of the synthesized samples are fully consistent with the chemical structure (see Table 2). Only some additional small signals close to the CH2CO peak (triplet at 2.69 ppm) were detected in the spectrum of nylon 6.7, a feature that may be indicative of a carboxylic acid termination as consequence of its lower reactivity and a faster precipitation when the density of amide groups increase (i.e., shorter diamine unit). The chemical shift of the CH2NH proton slightly increased with the decreasing length of the diamine moiety. The clearest shift corresponds to the central protons of the diamine unit that move from 1.36 ppm to 1.44 ppm as the length of the unit decreases. The highest triplet resolution of the NHCH2 protons was detected for the most soluble nylon 10.7.
3.2. Calorimetric Analysis
Calorimetric properties of the synthesized nylons were evaluated by applying a typical four run protocol that allows to get data from the initial powder coming from solution, a melt crystallized sample, a quenched sample, and the crystallization from the melt. Figure 4 shows the behavior of nylon 6.7 (i.e., with the specific indication of representative peak temperatures and enthalpy data) in the indicated scans, while Table 3 summarizes the general data deduced for all the three studied nylons including those previously reported for nylon 4.7 [27]. The general behavior, as illustrated for nylon 6.7, consists of:
- A complex melting process where a major peak centered at 222 °C, a shoulder around 203 °C and a minor peak/shoulder at 180 °C can be distinguished according to the preparation method (e.g., samples coming from solution precipitation or by melt crystallization). The two high temperature signals may be due to the presence of lamellae with different thicknesses, being the thinner ones susceptible to a folding reorganization during heating. Endothermic processes associated to the fusion of minority phases should be discarded since structural transitions so close to the fusion were not detected in the subsequent synchrotron measurements as then will be explained. This argument is not so clear for the signal around 180 °C since it is a value close to the Brill transition temperature, by contrast the presence of highly defective crystals with low melting peak temperature has also been reported for similar nylons. DSC plots showed also a slow recovery of the base line on both heating and cooling processes, which may be indicative of a continuous structural transition as detected in synchrotron experiments.
- A crystallization process that is characterized by a narrow exothermic peak at an undercooling degree of 30–35 °C (for a cooling rate of 10 °C/min). This peak is followed by a broad exothermic event that extents practically up to the glass transition temperature and that may be associated to a continuous structural transition.
- Some minor events that can be detected in the 80–100 °C interval (see ellipsoids in Figure 4 that point out small exothermic peaks during 2nd and 3rd heating runs and an endothermic peak during cooling).
- A well-defined and reversible glass transition.
Figure 5 shows the changes of main thermal parameters with the number of methylene groups in the diamine repeat unit. These can be summarized as follows: (a) The temperature of the main melting peak has a linear decrease as the number of methylene groups increases (i.e., −8.8 °C/methylene group). This feature is compatible with a similar high temperature structure for the four considered nylons, which as then will be explained corresponds to the Brill pseudohexagonal packing. Thus, thermal transitions during heating led to the same molecular arrangement for the four nylons despite they may have different initial structures at room temperature. Note that the evolution of the melting point of nylons derived from α-amino acids was reflected by a serrated line, which was explained in terms of structural differences between odd and even nylons; (b) Melting enthalpy increased as the number of methylene groups decreased. Thus, the energy involved in the molecular packing increased with the amide group content of the repeat unit. Note that according to the group contribution theory of van Krevelen [57] a higher melting enthalpy is expected for 100% crystalline nylons when the methylene content increases (i.e., contribution of 2.0 kJ/mol and 4.0 kJ/mol are reported for the amide and methylene groups, respectively). These contradictory observations can be reconciled assuming a higher amorphous content when the ratio of methylene groups increased probably as consequence of the higher motion of these groups. Therefore, estimated degrees of crystallinities () clearly decreased with the increase of the diamine length (i.e., from 50% to 29%). Enthalpy data was dependent of the way as the sample was processed since melt crystallized samples had enthalpies around 75% of solution crystallized ones. Nevertheless, the observed trend was common for solution and melt crystallized samples and slopes of −5.6 J.g−1/methylene group and −3.3 J.g−1/methylene group were determined; (c) The peak crystallization temperature showed also a linear decrease when the number of methylene groups increased (i.e., −9.2 °C/methylene group) and corresponded to a supercooling of 30–32 °C for all the studied nylons. In all cases, a broad exotherm was detected after the occurrence of the narrow crystallization peak. (d) Crystallization enthalpy showed a linear decrease as the number of methylene groups increased (i.e., slope of −3.7 J.g−1/methylene group): (e) Glass transition temperature tended to increase when the number of methylene groups decrease as consequence of the increase of chain stiffness provoked by the strong H-bond interactions. Note that influences of molecular weight are minimal since the studied samples have highly similar molecular sizes.
3.3. Thermal Stability
All studied nylons showed a relatively high thermal stability that allows their processing in the melt state. Figure 6 shows the corresponding TGA and DTGA curves while main degradation data are summarized in Table 4. Note that in the worst case, the temperature associated to the beginning of degradation is more than 180 °C higher than the melting temperature (e.g., temperatures of 222 °C and 410 °C are characteristic of nylon 6.7). Degradation basically occurs according to a major step that at least corresponds to a decomposition higher than 86%. Decomposition started with a minority process, which cannot be correlated with the number of methylene groups in the repeat unit or with differences on molecular weight (i.e., a influence of terminal groups). In any case, this decomposition represents at maximum a 5% of weight loss (nylons 6.7 and 10.7). Differences also can be observed at the end of degradation where a third minority step can be observed for nylons with the higher number of methylene groups (i.e., 4.7% and 6.6% for nylons 8.7 and 10.7, respectively). At 600 °C no char yield was detected for all the three studied polyamides. Weight losses associated with water uptake were not detected as a consequence of the effective drying of the sample before performing analyses.
3.4. Structural Transitions of Nylon 6.7 During Heating/Cooling Processes
X-ray diffraction profiles of nylon 6.7 coming from synthesis (i.e., a solution precipitated sample) showed during the first heating run (Figure 7a) a similar evolution than that previously reported for nylon 4.7 (Figure 1b) [27]. Representative profiles are plotted in Figure 7b for a better understanding, while the continuous evolution of main spacings and peak intensities are shown in Figure 7c and Figure 7d, respectively. The most remarkable features are the followings:
- The initial sample is characterized by the two typical reflections of the α-modified form (i.e., the narrow peak at 0.430 nm and the broad peak at 0.380 nm, see black arrows). In addition, two very small signals at 0.421 nm and 0.404 nm (blue arrows) can be intuited. These indicate a highly distorted pseudohexagonal form due to the clear deviation of a single spacing around 0.415 nm. Observed structures correlate perfectly with forms I and II indicated for nylon 4.7, but for the shake of completeness will be described in the present paper as a modified α-form (2H-bonding directions) and an intermediate distorted pseudohexagonal form.
- A continuous decrease of the intensity of the two reflections associated to the modified α-form can be observed while those associated to the distorted pseudohexagonal form also increased in a continuous way. The process seems to end at a temperature close to 91 °C (see profile in Figure 7b and also the intensity evolution indicated in Figure 7d). It is therefore significant that the structural change does not take place at a specific temperature and corresponds to gradual transformation that involved the arrangement of hydrogen bonds towards the pseudohexagonal form. It was previously suggested that this transformation implied a slight change of conformational angles that lead to an angle close to 60° between consecutive amide bonds of the odd even unit. Note that in disagreement with structural changes described for conventional nylons the spacings of 4.30 nm and 0.380 nm reflections remained practically constant. Nevertheless, the increase of temperature is moderate (i.e., from 25 °C to 91 °C) and consequently changes caused by dilation effects should not be significant. The observed structural transition could not be demonstrated by DSC measurements since no evidence of exothermic or endothermic events were detected in the DSC trace of the first heating run in the temperature range between 25 °C and 91 °C (Figure 4). Similar observations were previously reported for nylon 4.7 [27].
- The two reflections at 0.421 nm and 0.404 nm progressively approach each one (Figure 7c) and join in a single spacing at 0.420 nm at a temperature of 231 °C (Figure 7b,c). Basically, the less intense reflection at the spacing of 0.404 nm has the higher shift and appear as shoulder of the main reflection at temperatures close to 130 °C (Figure 7b). Note that the intensity of the main reflection clearly increases as consequence of the indicated overlapping (Figure 7d).
- When the Brill structure is achieved the intensity of the single reflection at 0.420 is practically constant (Figure 7d).
- Melting process starts at a temperature of 210 °C as evidenced by the decrease of the Bragg reflection and the apparition of an amorphous halo centered at 0.468 nm (Figure 7b,c).
- Evidence of an increase of crystallinity as consequence of a lamellar reordering cannot be deduced from the synchrotron profile evolution (Figure 7a). Note that DSC data indicated a complex melting peak that was associated to an increase of the degree of perfection of constitutive lamellae.
- A long spacing (associated to the 004 reflection) is observed at a spacing of 0.860 nm. This spacing is practically constant during all heating process and consequently is not useful to detect structural transitions
Figure 8a shows the evolution of diffraction profiles during cooling from the melt state. At the first stage a single reflection indicative of the Brill pseudohexagonal packing is observed but a second reflection appears rapidly as a small shoulder that progressively becomes a well-defined reflection at 0.402 nm. In addition, the two characteristic reflections of the modified α-form appeared at temperatures lower than 110–120 °C with an intensity the progressively increased see dashed red circle). The relevant point is that the spacings of the indicated reflections remained practically constant except for the 0.402 nm peak (Figure 8b) during the cooling process. Therefore, contraction effects seem to be minimal and the shift of the indicated reflection may correspond to its definition as a well-separated peak. The plot of the intensity of the main reflection (Figure 8c) versus temperature allows to identify a first step with a high crystallization rate (up to 175 °C) followed by a second one with a slower rate that seems to finish at 125 °C. After that the intensity decreased as consequence of the conversion to the modified pseudohexagonal form (note that change of the appearance of the 0.405–0.402 nm peak from a shoulder to a well differentiated peak, see dashed white circle). Changes on intensity can also be influenced by the apparition of the α-modified form, but this should not be the main factor since at low temperature, the intensity of 0.420 nm reflection (and even of 0.402 nm) remains constant despite intensity of 0.430 nm and 0.380 nm peaks clearly increased.
Figure 9 shows as the described polymorphic transitions were reversible on the subsequent heating process. Namely the disappearance of peaks associated to the α-modified form at a temperature of 120 °C, the increase of the intensity of the main reflection associated to its progressive overlapping with the 0.402 nm reflection and the achievement of the Brill structure at a temperature of 75 °C. A final increase of the intensity of Bragg reflections was not detected and consequently it cannot be proved an increase of crystallinity as consequence of potential lamellar reordering.
The limited molecular weight of nylon 6.7 precludes the obtention of highly oriented fibers. Despite different conditions have been assayed (e.g., film or fiber drawing from concentrated HFIP or formic acid solutions), only melt drawing was successful. According to Figure 8 a predominant pseudohexagonal structure should be obtained at the first stages of crystallization from the melt, but reflections assigned to the modified α-form can also be clearly detected in the fiber patterns (Figure 10a). Note that strong equatorial reflections at 0.430 nm (modified α-form) and 0.417 nm (pseudohexagonal form) can be observed, and also that the meridional reflection at 0.860 nm (pseudohexagonal form) shows clues of off meridional reflections (see dashed ellipsoids in Figure 10a). These can be linked to the monoclinic unit cell expected for the modified α-form.
The ratio between the two polymorphs is slightly variable inside a given fiber. The high spatial resolution of synchrotron radiation allows to identify regions with a clearly predominant pseudohexagonal form (Figure 10b), which generally corresponds to the outer parts of the fibers (i.e., regions with a faster cooling). The given pattern shows only the strong equatorial reflection associated to the pseudohexagonal form (together with a weak reflection at 0.407 nm), while those associated to the α-form practically disappeared.
The meridional 004 reflection at a spacing of 0.850 nm indicates a chain repeat unit of 3.40 nm and a shortening of the repeat unit higher than 0.04 nm/amide group with respect to the expected value of the repeat unit for a fully extended molecular chain (i.e., 3.75–3.60 nm). Crystallographic data point out to a slight deviation from the ideal pseudohexagonal unit cell with parameters a = b = 0.479 nm, c (chain axis) = 3.40 nm and γ = 60°. This distortion may concern a deviation of a and b parameters from the typical distance of 0.479 nm between hydrogen bonded chains or also of the γ angle from 60°. Indexing of the modified alpha form was not possible since it was difficult to differentiate its low intense 004 reflections from the strong meridional reflection of the pseudohexagonal form. However, a precise inspection of Figure 10a allows us to intuit the presence of reflections outside the meridian (see red ellipsoids) that are practically superimposed with the main arcuate signal.
Diffraction patterns with an improved orientation could be obtained (Figure 11) by mixing nylon 6.7 with a minor proportion of nylon 10.7. Basically, it was taken profit of the higher capacity of nylon 10.7 to be stretched as then will be shown. Patterns showed a clear meridional orientation of the 004 reflection and a predominant pseudohexagonal form. Spacings were in full agreement with those observed for the single polymer and only very weak reflections associated to nylon 10.7 could be intuited.
3.5. Structural Transitions of Nylon 8.7 During Heating/Cooling Processes
The evolution of WAXD patterns during the heating scan of a solution crystallized sample of nylon 8.7 is shown in Figure 12a while some representative profiles (i.e., those corresponding to the initial samples) are given in Figure 12b. The more remarkable features can be summarized as follows:
- The initial profile corresponds to a mixture of the α-modified form with reflections at 0.441 nm and 0.371 nm and the distorted pseudohexagonal form with reflections at 0.424 nm and 0.395 nm. The specific ratio between the two polymorphs becomes the main difference between the profiles of nylons 6.7 and 8.7. Thus, the distorted pseudohexagonal form appeared in a minority ratio in nylon 6.7, while it was slightly predominant in nylon 8.7.
- The intensity of the α-modified form reflections gradually decreased and practically disappeared at 115 °C (see the selected profiles in Figure 12b). The spacings of these reflections remained practically constant up to their disappearance (Figure 12c), being probably not significant a cell dilatation due to the relatively low temperature that was assumed.
- The intensity of reflections associated with the distorted pseudohexagonal form showed and increased with temperature, being possible to distinguish two steps (Figure 12a). The first one is characterized by a gradual and moderate increase and coincides with the intensity decrease of the modified α-form. Therefore, a gradual transformation from the modified α-form to the distorted pseudohexagonal form seems to take place. The second step corresponds to a greater intensity increase and appears associated with the gradual overlapping of the two characteristic reflections. As shown in Figure 12c, the spacing of the reflection at 0.395 nm experiments a remarkable increase with temperature while the spacing of the 0.424 nm reflection remained practically constant.
- At a temperature of 170 °C the Brill transition took place and only a single crystalline reflection at 0.423 nm was observed.
- All crystalline reflections disappeared when temperature reached 220 °C, being the most distinctive feature the presence of the broad amorphous halo at 0.465 nm.
- Only a long spacing reflection with a significant intensity was detected. This reflection corresponded to a spacing of 0.972 nm that was also practically constant during all the heating process.
Figure 13a shows the temperature evolution of 3D-profiles during the cooling from the melt state and the subsequent reheating. Comparison of the intensity evolution of main peaks between both processed is shown in Figure 13c.
The specific plot of the cooling process indicated that the sample crystallized from the melt according to the Brill structure, which subsequently transformed into the distorted pseudohexagonal form. The dashed white circle (Figure 13a) highlights the apparition of the 0.414 nm reflection as a peak shoulder at a temperature close to 140 °C. Note that the Brill structure remains in a wider temperature interval (i.e., from 195 °C to 140 °C) than observed in the heating scans. The intensity of the main 0.427 nm reflection clearly decreased and reached a practically constant intensity when the two peaks of the distorted form were clearly distinguished (i.e., 120 °C). Note that only the shoulder/peak at 0.417–0.402 nm had a significant spacing decrease. The amorphous halo at 0.465 nm progressively decreased in intensity and became overlapped at low temperature with the 0.423 nm peak of the modified α-form that appeared around 100 °C. The two peaks of these form developed with a very low intensity (i.e., the ratio was clearly lower than observed for the solution-crystallized sample).
A practically reversible behavior was observed in the subsequent heating process. Specifically, the disappearance of the modified α-form around 70 °C, the definition of a clear amorphous halo at temperatures close to 150 °C (blue ellipsoid) and the development of the Brill structure around 140 °C, and the melting process that was initiated around 200 °C. This reversibility is more evident in Figure 13c, where also it is detected a shift of main transitions to lower temperatures in the cooling process (obviously crystallization took place at lower temperature than fusion). In this sense note the different temperature interval where the Brill structure can be observed (10 °C and 30 °C for cooling and reheating processes, respectively).
An oriented fiber pattern could only be obtained by melt stretching as previously explained for nylon 6.7. This pattern (Figure 13d) corresponded to the distorted pseudohexagonal form characterized by the two strong equatorial reflections at 0.419 nm and 0.406 nm and three meridional reflections at 1.843 nm, 0.971 nm and 0.647, nm associated to the 002, 004 and 006 planes (c, chain axis). Therefore, a chain repetition of 3.88 can be deduced, which means again a shortening around 0.05 nm/amide group since the expected value of the repeat unit for a fully extended molecular chain becomes 4.24–4.08 nm. As indicated for nylon 6.7, the fiber patterns obey to a distortion of the ideal pseudohexagonal unit cell defined by parameters: a = b = 0.479 nm, c (chain axis) = 3.40 nm and γ = 60°.
3.6. Structural Transitions of Nylon 10.7 During Heating/Cooling Processes
Figure 14 displays the variation of 3D WAXD profiles during the heating and cooling processes of an initial nylon 10.7 sample obtained from precipitation. In this case, it is remarkable that traces of the α-modified form cannot be observed in the initial sample. Note the contrast with the previously published data with nylon 4.7 and those obtained in the present work with nylons 6.7 and 8.7. It is clear that the content on the modified α-form in the initial precipitated sample decreases as the number of methylene groups in the diamine moiety increases. For nylon 10.7, reflections associated to this α-form could only be intuited at the end of the cooling scan (see black arrows).
The solution crystallized sample mainly corresponds to the pseudohexagonal form (blue arrows) and shows as a peculiarity the high broadness (and even intensity) of the peak around 0.415–0.407 nm. This peak probably corresponds to an overlapping of two reflections (see pink arrow for the additional one at a spacing of 0.415 nm) that may suggest some variability of the pseudohexagonal arrangement attained during solution crystallization. Specifically, it seems that the distorted (reflections at 0.423 nm and 0.407 nm) and non-distorted (single reflection at 0.415 nm) arrangements are obtained. On the contrary, the pattern of the melt crystallized sample shows only the two reflections (i.e., 0.423 nm and 0.406 nm) of the distorted pseudohexagonal form. Note also that profiles show the characteristic relative intensity between these two reflections. The spacing of the initial reflection at 0.407 nm gradually increased during heating and the Brill transition is completed at a temperature of 170 °C. The process is reversible on cooling with some degree of hysteresis and specifically the Brill transition occurred at 160 °C. Figure 14 shows also the amorphous halo centered at 0.444 that is visible at the final and initial stages of heating and cooling, respectively.
It was possible to get oriented fiber patterns of nylon 10.7 by stretching from the melt (Figure 15). Logically, in this case only the pattern of the distorted pseudohexagonal arrangement was obtained. Note the high intensity of 00l reflections (l = even) that points out to a chain repeat of 4.36 nm and a shortening close to 0.05 nm/amide group with respect to the fully extended conformation (4.75–4.56 nm). As indicated for previous nylons, the fiber patterns obey to a distortion of the ideal pseudohexagonal unit cell defined by parameters: a = b = 0.479 nm, c (chain axis) = 4.36 nm and γ = 60°. Fiber patterns of the isomeric nylon 7.10 have been previously reported (see inset of Figure 15) and corresponded to a similar distorted pseudohexagonal cell with a similar but slightly higher chain shortening (i.e., 0.07 nm/amide group). Remarkable differences are also observed in the intensity of 00l reflections that in a simple way can be justified taking into account the different distribution of the CO groups. These have the higher electronic density and consequently have the higher contribution to the diffraction pattern. Specifically, these groups are separated by 12 and 5 chain atoms in nylon 10.7, whereas 9 and 8 chain atoms correspond to nylon 7.10 (i.e., a more regular distribution along the chain axis).
4. Conclusions
Nylons 6.7, 8.7 and 10.7 can be synthesized by interfacial polymerization with high yields (67–75%) and moderate molecular weights. The highest Mw was 35,000 g/mol after fractionation, being observed a slight decrease when the length of the diamine decreased (i.e., 27,500 g/mol for nylon 6.7). Samples with polydispersity indices slightly lower than 2 were attained by water precipitation of formic acid solutions and used for subsequent studies. FTIR and NMR spectroscopic analyses were fully consistent with the expected chemical structures and showed only the presence of minor terminal group signals for nylon 6.7 coming directly from synthesis. Amide V band was observed in the samples prepared by precipitation and suggested a structure related with the typical α-form. A structural modification based on a 2H-bonding arrangement was postulated considering X-ray diffraction evidence and the model previously reported for nylon 4.7, the shortest component of the studied even-odd series based on pimelate units.
The three synthesized nylons were thermally stable up to an onset temperature of 410 °C and consequently could be processed without problems from the melt state. Melting peak was usually complex independently on both the way as the sample was crystallized and the length of the diamine unit. Linear trends were observed for the variation of the main melting peak temperature, the crystallization peak temperature and melt/crystallization enthalpies. These values decreased with the length of the chemical repeat unit and for example slopes around −9 °C/methylene group and −3.5 J.g−1/methylene group were estimated for melting temperatures and melting enthalpies, respectively. Estimated degrees of crystallinity clearly decreased with the length of the repeat unit (i.e., from 50% to 29%). Interestingly, it was not possible to detect clear exotherms or endotherms associated to polymorphic transitions in both DSC heating and cooling traces, a feature that can be linked to continuous transformations as evidenced by synchrotron diffraction data.
The modified α-form and a distorted pseudohexagonal form were obtained in different relative ratios when samples crystallized from solution. Thus, the modified α-form was the predominant one in nylons 4.7 and 6.7 while the distorted pseudohexagonal form was the only structure observed in nylon 10.7. In all cases, melt crystallized samples rendered the predominant distorted pseudohexagonal form although a low and variable ratio of the modified α-form was also obtained. A continuous transition between the modified α-form and the distorted pseudohexagonal was detected on heating in a broad temperature interval that extended up to a temperature of 120 °C. A similar transition was detected on cooling although the yield onto the modified α-form was lower. A second structural transition involving the distorted pseudohexagonal form and the Brill pseudohexagonal structure was always observed at high temperature during both heating and cooling runs.
Oriented fiber diffraction patterns of all studied nylons could be obtained by melt stretching. These patterns corresponded to the distorted pseudohexagonal form and showed a degree of orientation that increased with the length of the diamine unit. Relative intensities of 00l reflections (c, chain axis) were different according to the different separation between the two CO groups of the chemical repeat unit along the molecular chain. Chain axis periodicities indicate a small shortening around 0.04–0.07 nm/amide group with respect to the expected values for a fully extended conformation. Values were higher than reported for the classical α-structure of nylons [45], being the distortion more remarkable as the number of methylene groups increased.
Author Contributions
Conceptualization, L.F. and J.P.; formal analysis, M.A., L.F. and J.P.; writing—original draft preparation, M.A. and J.P.; writing—review and editing, M.A., L.F. and J.P.; supervision, L.F. and J.P.; funding acquisition, J.P. All authors have read and agreed to the published version of the manuscript.
Funding
The authors acknowledge the group eb-POLICOM: Polímers i Compòsits Ecològics i Biodegradables, a research group of the Generalitat de Catalunya (Grant 2021 SGR 01042). We acknowledge the project PID2022-140302OB-I00 funded by the Ministerio de Ciencia, Innovación y Universidades (MICIU), the Agencia Estatal de Investigación (AEI) and the FEDER funds. This work is part of María de Maeztu Units of Excellence Programme CEX2023-001300-M/funded by MICIU/AEI/10.13039/501100011033.
Data Availability Statement
Data are contained within the article and supplementary materials.
Acknowledgments
Synchrotron diffraction experiments were performed at BL11—NCD-SWEET beamline of the ALBA synchrotron with the collaboration of Juan Carlos Martínez through the 2023097826 granted Project. M.A. is grateful for the support received from the Spanish Ministry of Science and Innovation, with the scholarship “Ayudas para contratos predoctorales para la formación de doctors/as 2019”.
Conflicts of Interest
The authors declare no conflicts of interest.
References
- Xenopoulos, A.; Clark, E. Nylon Plastics Handbook; Kohan, M.I. (Eds.) ; Hanser: New York, 1995.
- Wang, L.; Dong, X.; Huang, M.; Müller, A.J.; Wang, D. Self-Associated Polyamide Alloys with Tailored Polymorphism Transition and Lamellar Thickening for Advanced Mechanical Application. ACS Appl Mater Interfaces 2017, 9, 19238–19247. [Google Scholar] [CrossRef] [PubMed]
- Arioli, M.; Puiggalí, J.; Franco, L. Nylons with Applications in Energy Generators, 3D Printing and Biomedicine. Molecules 2024, 29, 2443. [Google Scholar] [CrossRef] [PubMed]
- Global Nylon Industry Https://Www.Reportlinker.Com/P03993523/Global-Nylon-Industry.Html. (accessed on 5 August 2024).
- Radzik, P.; Leszczyńska, A.; Pielichowski, K. Modern Biopolyamide-Based Materials: Synthesis and Modification. Polymer Bulletin 2020, 77, 501–528. [Google Scholar] [CrossRef]
- Kawashima, N.; Yagi, T.; Kojima, K. How Do Bioplastics and Fossil-Based Plastics Play in a Circular Economy? Macromol Mater Eng 2019, 304. [Google Scholar] [CrossRef]
- Davis, S.J.; Caldeira, K.; Matthews, H.D. Future CO 2 Emissions and Climate Change from Existing Energy Infrastructure. Science (1979) 2010, 329, 1330–1333. [Google Scholar] [CrossRef]
- Iwata, T. Biodegradable and Bio-Based Polymers: Future Prospects of Eco-Friendly Plastics. Angewandte Chemie—International Edition 2015, 54, 3210–3215. [Google Scholar] [CrossRef]
- Anastas, P.; Eghbali, N. Green Chemistry: Principles and Practice. Chem Soc Rev 2010, 39, 301–312. [Google Scholar] [CrossRef]
- Wang, X.; Gao, S.; Wang, J.; Xu, S.; Li, H.; Chen, K.; Ouyang, P. The Production of Biobased Diamines from Renewable Carbon Sources: Current Advances and Perspectives. Chin J Chem Eng 2021, 30, 4–13. [Google Scholar] [CrossRef]
- Kind, S.; Wittmann, C. Bio-Based Production of the Platform Chemical 1,5-Diaminopentane. Appl Microbiol Biotechnol 2011, 91, 1287–1296. [Google Scholar] [CrossRef]
- Chung, H.; Yang, J.E.; Ha, J.Y.; Chae, T.U.; Shin, J.H.; Gustavsson, M.; Lee, S.Y. Bio-Based Production of Monomers and Polymers by Metabolically Engineered Microorganisms. Curr Opin Biotechnol 2015, 36, 73–84. [Google Scholar] [CrossRef]
- Wendisch, V.F.; Mindt, M.; Pérez-García, F. Biotechnological Production of Mono- and Diamines Using Bacteria: Recent Progress, Applications, and Perspectives. Appl Microbiol Biotechnol 2018, 102, 3583–3594. [Google Scholar] [CrossRef] [PubMed]
- Chae, T.U.; Kim, W.J.; Choi, S.; Park, S.J.; Lee, S.Y. Metabolic Engineering of Escherichia Coli for the Production of 1,3-Diaminopropane, a Three Carbon Diamine. Sci Rep 2015, 5, 13040. [Google Scholar] [CrossRef] [PubMed]
- Choi, H.; Kyeong, H.H.; Choi, J.M.; Kim, H.S. Rational Design of Ornithine Decarboxylase with High Catalytic Activity for the Production of Putrescine. Appl Microbiol Biotechnol 2014, 98, 7483–7490. [Google Scholar] [CrossRef] [PubMed]
- Aceituno, J.E.; Tereshko, V.; Lotz, B.; Subirana, J.A. Synthesis and Characterization of Polyamides n,3. Macromolecules 1996, 29, 1886–1893. [Google Scholar] [CrossRef]
- Puiggalí, J.; Aceituno, J.E.; Navarro, E.; Campos, J.L.; Subirana, J.A. Structure of n,3 Polyamides, a Group of Nylons with Two Spatial Hydrogen-Bond Orientations. Macromolecules 1996, 29, 8170–8179. [Google Scholar] [CrossRef]
- Navarro, E.; Alemán, C.; Subirana, J.; Puiggalí, J. On the Crystal Structure of Nylon 55. Macromolecules 1996, 29, 5406–5415. [Google Scholar] [CrossRef]
- Navarro, E.; Franco, L.; Subirana, J.A.; Puiggalí, J. Nylon 65 Has a Unique Structure with Two Directions of Hydrogen Bonds. Macromolecules 1995, 28, 8742–8750. [Google Scholar] [CrossRef]
- Navarro, E.; Subirana, J.A.; Puiggalí, J. The Structure of Nylon 12,5 Is Characterized by Two Hydrogen Bond Directions as Are Other Polyamides Derived from Glutaric Acid. Polymer (Guildf) 1997, 38, 3429–3432. [Google Scholar] [CrossRef]
- Zhou, L.; Cheng, K.; Liu, T.; Li, N.; Zhang, H.; He, Y. Fully Bio-Based Poly (Pentamethylene Glutaramide) with High Molecular Weight and Less Glutaric Acid Cyclization via Direct Solid-State Polymerization. Eur Polym J 2022, 180, 111618. [Google Scholar] [CrossRef]
- Manandhar, M.; Cronan, J.E. Pimelic Acid, the First Precursor of the Bacillus Subtilis Biotin Synthesis Pathway, Exists as the Free Acid and Is Assembled by Fatty Acid Synthesis. Mol Microbiol 2017, 104, 595–607. [Google Scholar] [CrossRef]
- Cronan, J.E.; Lin, S. Synthesis of the α,ω-Dicarboxylic Acid Precursor of Biotin by the Canonical Fatty Acid Biosynthetic Pathway. Curr Opin Chem Biol 2011, 15, 407–413. [Google Scholar] [CrossRef] [PubMed]
- Ohsugi, M.; Miyauchi, K.; Tachibana, K.; Nakao, S. Formation of a Biotin Precursor, Pimelic Acid, in Yeasts from C18 Fatty Acids. J Nutr Sci Vitaminol (Tokyo) 1988, 34, 343–352. [Google Scholar] [CrossRef] [PubMed]
- Bennett, M.J.; Ragni, M.C.; Hood, I.; Hale, D.E. Azelaic and Pimelic Acids: Metabolic Intermediates or Artefacts? J Inherit Metab Dis 1992, 15, 220–223. [Google Scholar] [CrossRef] [PubMed]
- “Pimelic Acid.” Merriam-Webster.Com Medical Dictionary. (accessed on 4 August 2024).
- Morales-Gámez, L.; Casas, M.T.; Franco, L.; Puiggalí, J. Structural Transitions of Nylon 47 and Clay Influence on Its Crystallization Behavior. Eur Polym J 2013, 49, 1354–1364. [Google Scholar] [CrossRef]
- Starkweather, H.W. Transitions and Relaxations. In Nylon Plastic Handbook; Kohan, M.I., Ed.; Hanser: New York, 1995; p. 139. [Google Scholar]
- Seguela, R. Overview and Critical Survey of Polyamide6 Structural Habits: Misconceptions and Controversies. Journal of Polymer Science 2020, 58, 2971–3003. [Google Scholar] [CrossRef]
- Murthy, N.S. Hydrogen Bonding, Mobility, and Structural Transitions in Aliphatic Polyamides. J Polym Sci B Polym Phys 2006, 44, 1763–1782. [Google Scholar] [CrossRef]
- Feldman, A.Y.; Wachtel, E.; Vaughan, G.B.M.; Weinberg, A.; Marom, G. The Brill Transition in Transcrystalline Nylon-66. Macromolecules 2006, 39, 4455–4459. [Google Scholar] [CrossRef]
- Lotz, B. Brill Transition in Nylons: The Structural Scenario. Macromolecules 2021, 54, 565–583. [Google Scholar] [CrossRef]
- Mileva, D.; Kolesov, I.; Androsch, R. Morphology of Cold-Crystallized Polyamide 6. Colloid Polym Sci 2012, 290, 971–978. [Google Scholar] [CrossRef]
- Tashiro, K.; Yoshioka, Y. Molecular Dynamics Simulation of the Structural and Mechanical Property Changes in the Brill Transition of Nylon 10/10 Crystal. Polymer (Guildf) 2004, 45, 4337–4348. [Google Scholar] [CrossRef]
- Olf, H.G.; Peterlin, A. NMR Observations of Drawn Polymers. VII. Nylon 66 Fibers. Journal of Polymer Science Part A-2: Polymer Physics 1971, 9, 1449–1469. [Google Scholar] [CrossRef]
- Lovinger, A.J. Crystallographic Factors Affecting the Structure of Polymeric Spherulites. I. Morphology of Directionally Solidified Polyamides. J Appl Phys 1978, 49, 5003–5013. [Google Scholar] [CrossRef]
- Lovinger, A.J. Crystallographic Factors Affecting the Structure of Polymeric Spherulites. II. X-ray Diffraction Analysis of Directionally Solidified Polyamides and General Conclusions. J Appl Phys 1978, 49, 5014–5028. [Google Scholar] [CrossRef]
- Magill, J.H. Formation of Spherulites in Polyamide Melts: Part III. Even-Even Polyamides. Journal of Polymer Science Part A-2: Polymer Physics 1966, 4, 243–265. [Google Scholar] [CrossRef]
- Hirami, M. SAXD Studies on Bulk Crystallization of Nylon 6.I. Changes in Crystal Structure, Heat of Fusion, and Surface Free Energy of Lamellar Crystals with Crystallization Temperature. Journal of Macromolecular Science, Part B 1984, 23, 397–414. [Google Scholar] [CrossRef]
- Lotz, B.; Cheng, S.Z.D.; Li, C.Y. Structure of Negative Spherulites of Even-Even Polyamides. Introducing a Complex Multicomponent Spherulite Architecture. Macromolecules 2018, 51, 5138–5156. [Google Scholar] [CrossRef]
- Bunn, C.W.; Garner, E. V.; Bragg, W.L. The Crystal Structures of Two Polyamides (‘Nylons’). Proc R Soc Lond A Math Phys Sci 1947, 189, 39–68. [Google Scholar] [CrossRef]
- Holmes, D.R.; Bunn, C.W.; Smith, D.J. The Crystal Structure of Polycaproamide: Nylon 6. Journal of Polymer Science 1955, 17, 159–177. [Google Scholar] [CrossRef]
- Kinoshita, Y. The Crystal Structure of Polyheptamethylene Pimelamide (Nylon 77). Die Makromolekulare Chemie 1959, 33, 21–31. [Google Scholar] [CrossRef]
- Morales-Gámez, L.; Ricart, A.; Franco, L.; Puiggalí, J. Study on the Brill Transition and Melt Crystallization of Nylon 65: A Polymer Able to Adopt a Structure with Two Hydrogen-Bonding Directions. Eur Polym J 2010, 46, 2063–2077. [Google Scholar] [CrossRef]
- Olmo, C.; Casas, M.T.; Martínez, J.C.; Franco, L.; Puiggalí, J. Thermally Induced Structural Transitions of Nylon 4 9 as a New Example of Even-Odd Polyamides. Polymers (Basel) 2018, 10, 198. [Google Scholar] [CrossRef]
- Franco, L.; Cooper, S.J.; Atkins, E.D.T.; Hill, M.J.; Jones, N.A. Nylon 6 9 Can Crystallize with Hydrogen Bonding in Two and in Three Interchain Directions. J Polym Sci B Polym Phys 1998, 36, 1153–1165. [Google Scholar] [CrossRef]
- Murase, S.K.; Casas, M.T.; Martínez, J.C.; Estrany, F.; Franco, L.; Puiggalí, J. Reversible Changes Induced by Temperature in the Spherulitic Birefringence of Nylon 6 9. Polymer (Guildf) 2015, 76, 34–45. [Google Scholar] [CrossRef]
- Olmo, C.; Rota, R.; Carlos Martínez, J.; Puiggalí, J.; Franco, L. Temperature-Induced Structural Changes in Even-Odd Nylons with Long Polymethylene Segments. J Polym Sci B Polym Phys 2016, 54, 2494–2506. [Google Scholar] [CrossRef]
- Puiggalí, J.; Franco, L.; Alemán, C.; Subirana, J.A. Crystal Structures of Nylon 5,6. A Model with Two Hydrogen Bond Directions for Nylons Derived from Odd Diamines. Macromolecules 1998, 31, 8540–8548. [Google Scholar] [CrossRef]
- Morales-Gámez, L.; Soto, D.; Franco, L.; Puiggalí, J. Brill Transition and Melt Crystallization of Nylon 56: An Odd-Even Polyamide with Two Hydrogen-Bonding Directions. Polymer (Guildf) 2010, 51, 5788–5798. [Google Scholar] [CrossRef]
- Villaseñor, P.; Franco, L.; Subirana, J.A.; Puiggalí, J. On the Crystal Structure of Odd-Even Nylons: Polymorphism of Nylon 5,10. J Polym Sci B Polym Phys 1999, 37, 2383–2395. [Google Scholar] [CrossRef]
- Puiggalí, J.; Muñoz-Guerra, S.; Lotz, B. Extended-Chain and Three-Fold Helical Forms of Poly(Glycyl-β-Alanine). Macromolecules 1986, 19, 1119–1124. [Google Scholar] [CrossRef]
- Puiggalí, J.; Muñoz-Guerra, S.; Subirana, J.A. Morphology and Crystalline Structure of Nylon-2/6. Polymer (Guildf) 1987, 28, 209–212. [Google Scholar] [CrossRef]
- Bella, J.; Puiggalí, J.; Subirana, J.A. Glycine Residues Induce a Helical Structure in Polyamides. Polymer (Guildf) 1994, 35, 1291–1297. [Google Scholar] [CrossRef]
- Tormo, J.; Puiggalí, J.; Vives, J.; Fita, I.; Lloveras, J.; Bella, J.; Aymamí, J.; Subirana, J.A. Crystal Structure of a Helical Oligopeptide Model of Polyglycine II and of Other Polyamides: Acetyl-(Glycyl-β-alanyl)2-NH Propyl. Biopolymers 1992, 32, 643–648. [Google Scholar] [CrossRef] [PubMed]
- Arioli, M.; Franco, L.; Puiggalí, J. Non-Isothermal Crystallization and Thermal Degradation Studies on Nylons 7.10 and 10.7 as Isomeric Odd-Even and Even-Odd Polyamides. Thermochim Acta 2024, 735, 179721. [Google Scholar] [CrossRef]
- van Krevelen, D.W. Properties of Polymers; 3rd, *!!! REPLACE !!!* (Eds.) ; Elsevier Science: Amsterdam, 1990; ISBN 9780080915104.
Figure 1.
(a) Scheme of the unfavorable hydrogen-bonding geometry between pimelamide units having an all-trans conformation (up) and scheme showing the 2H-bonding structure based on the rotation of the two amide planes of the pimelamide unit in opposite directions from the plane defined by its methylene carbons (down). The monoclinic unit cell is generated when the external chains (stick representation) are shifted along the chain axis direction (see arrows) with respect to the central chain (ball and stick representation). Color code: nitrogen, blue; oxygen, red; carbon, grey; hydrogen, brown. (b) Three-dimensional representation of WAXD profiles of nylon 47 during heating (3 °C/min) (up) and cooling (3 °C/min) (down). The inset shows the transformation of the initial structure to an intermediate one (up). Reproduced with permission from Elsevier [27].
Scheme 1.
Synthesis of nylons 6.7, 8.7 and 10.7 by interfacial polycondensation, x is equal to 6,8 and 10 for nylons 6.7, 8.7 and 10.7, respectively.
Scheme 1.
Synthesis of nylons 6.7, 8.7 and 10.7 by interfacial polycondensation, x is equal to 6,8 and 10 for nylons 6.7, 8.7 and 10.7, respectively.
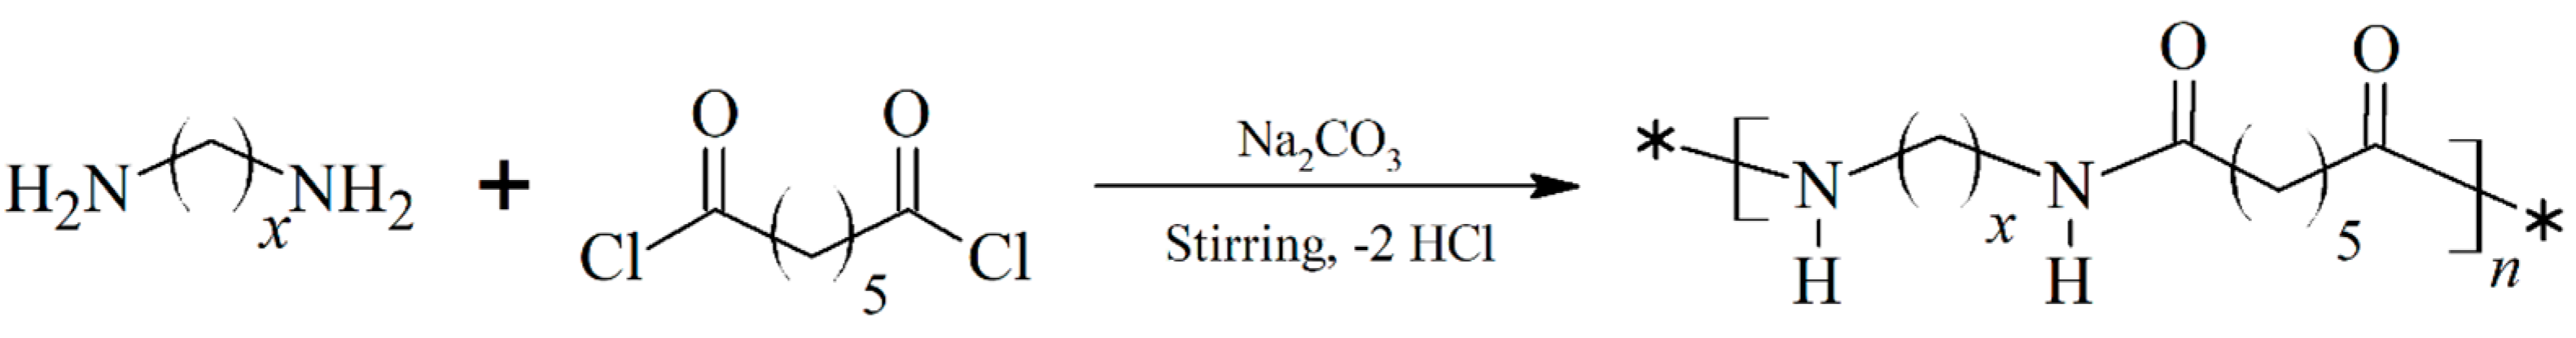
Figure 2.
FTIR spectra of the three synthesized polymers with labelling of main bands. Spectra are normalized keeping constant the intensity of the amide I band. On the left, the amide A and amide I bands are shown in insets, for the original (red) and after crystallization (black) samples of nylon 10.7.
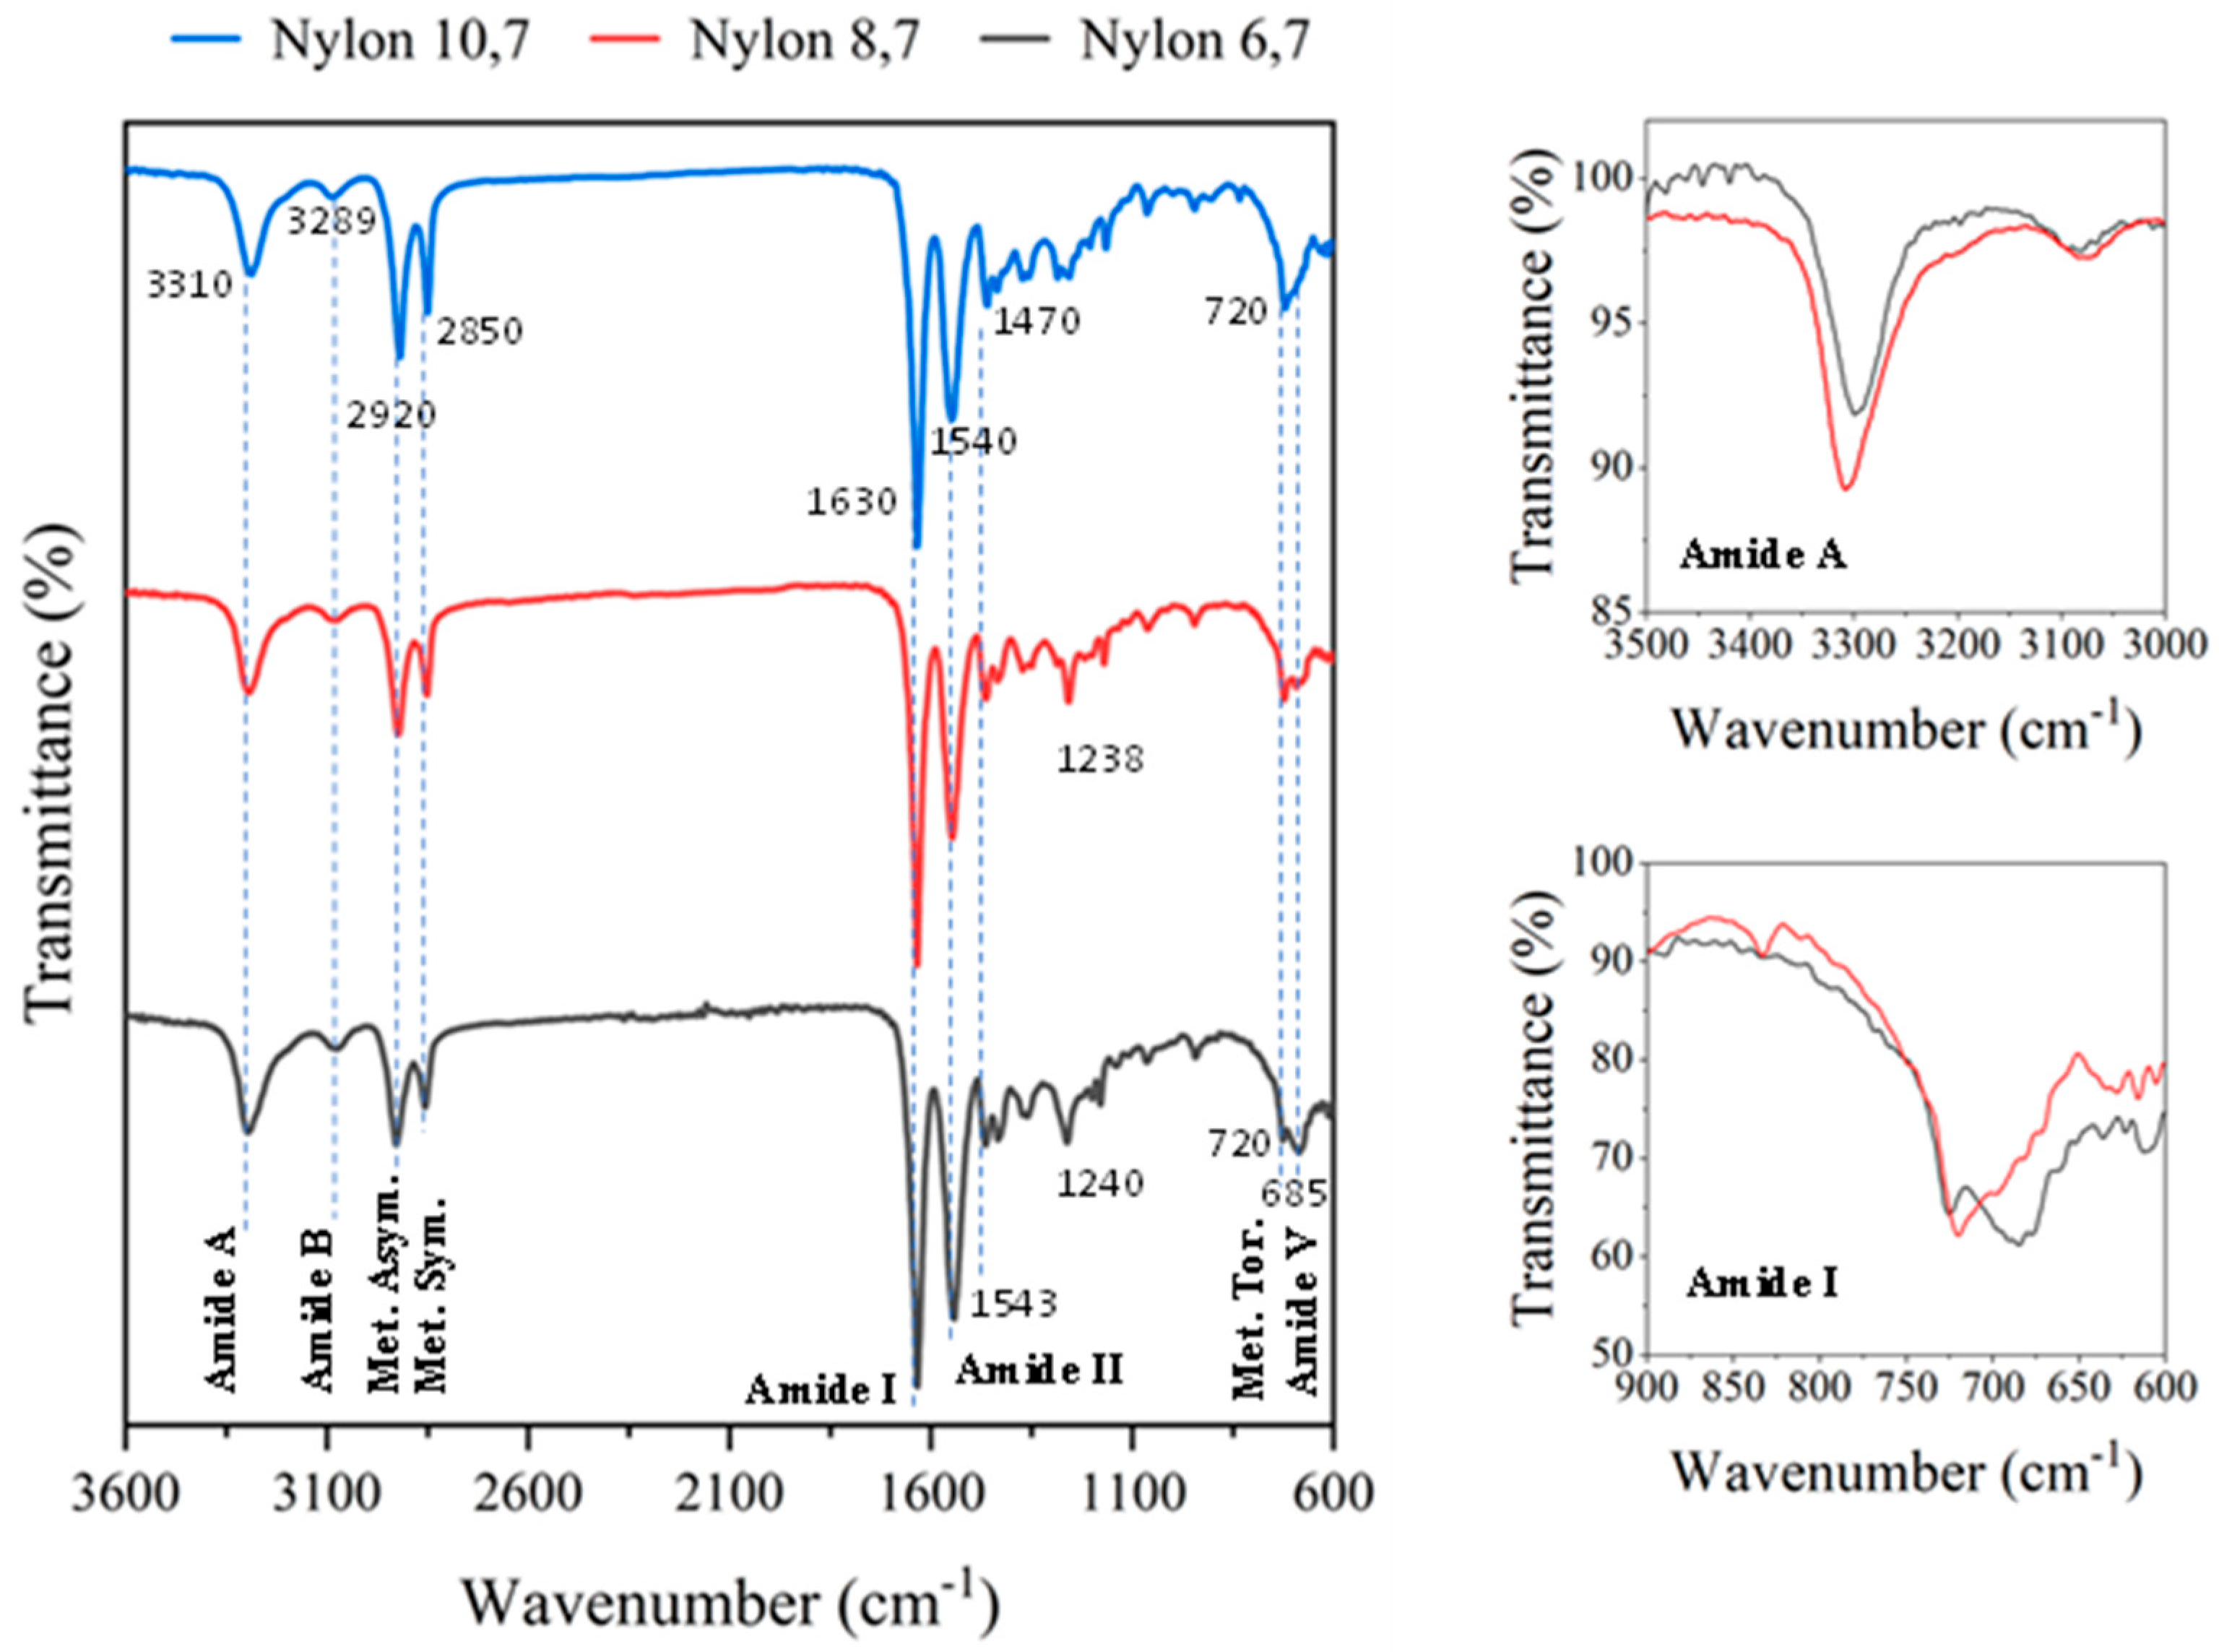
Figure 3.
1H-NMR spectra of the three synthesized polymers with labelling of main peaks.
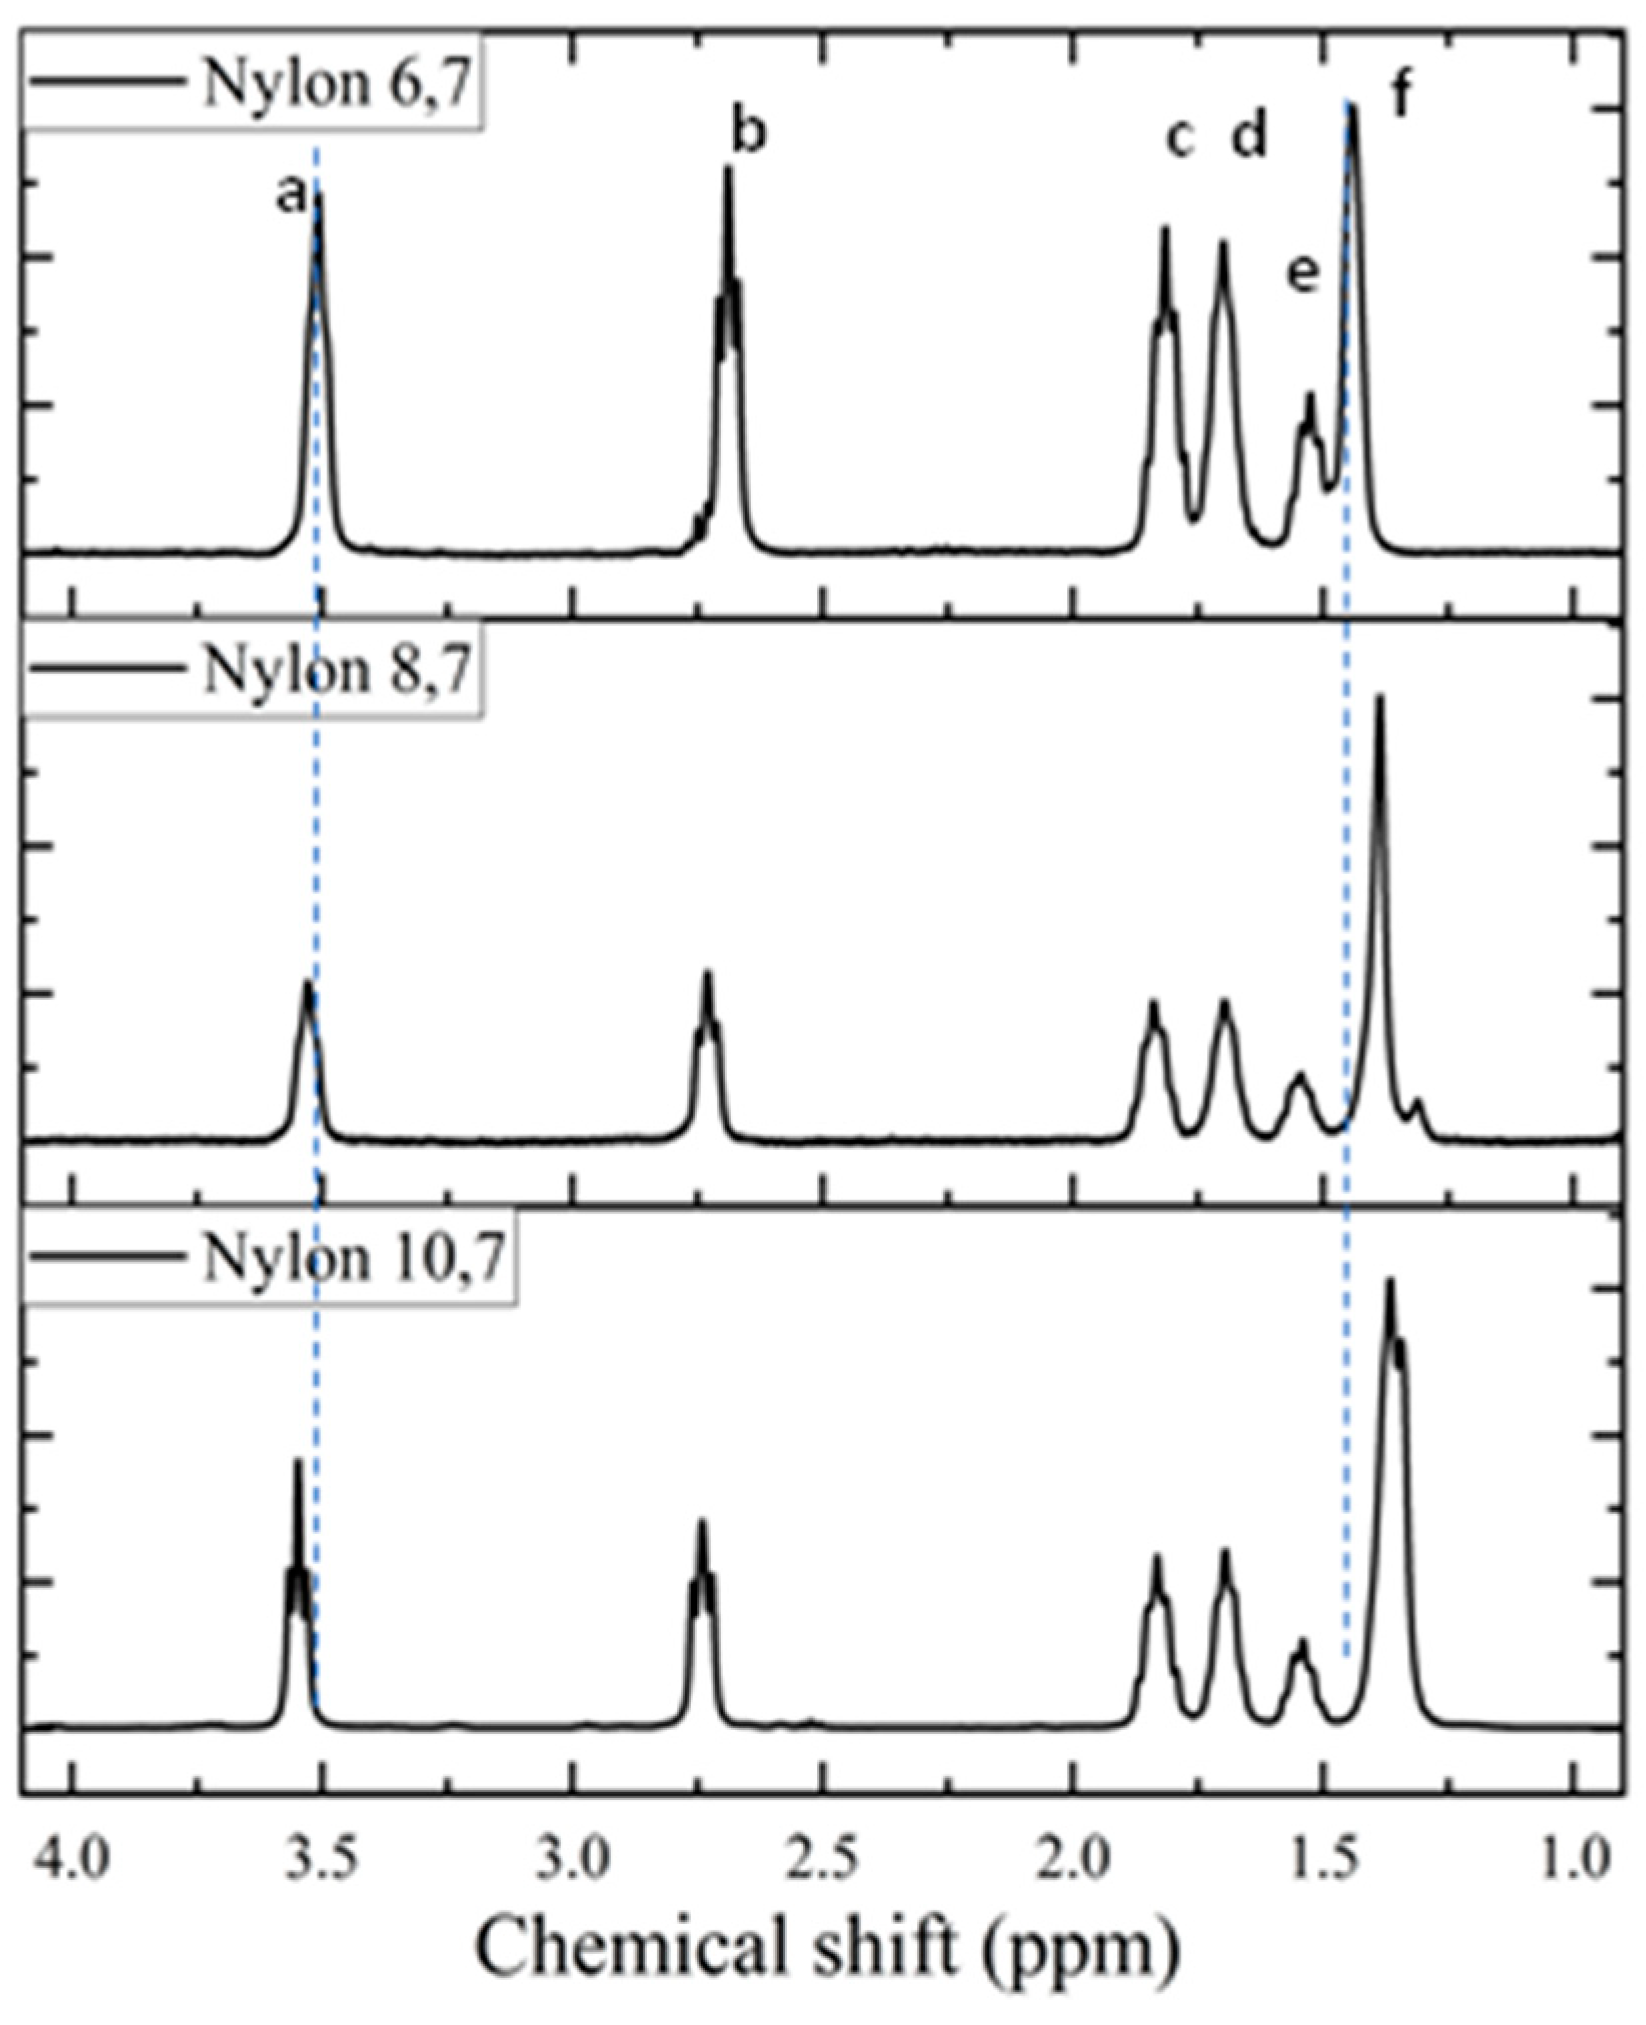
Figure 4.
Sequence of DSC traces performed with the high molecular weight fraction of nylon 6.7: (a) First heating run, (b) Cooling run, (c) Second heating run, (d) Third heating run performed with a melt quenched sample.
Figure 4.
Sequence of DSC traces performed with the high molecular weight fraction of nylon 6.7: (a) First heating run, (b) Cooling run, (c) Second heating run, (d) Third heating run performed with a melt quenched sample.
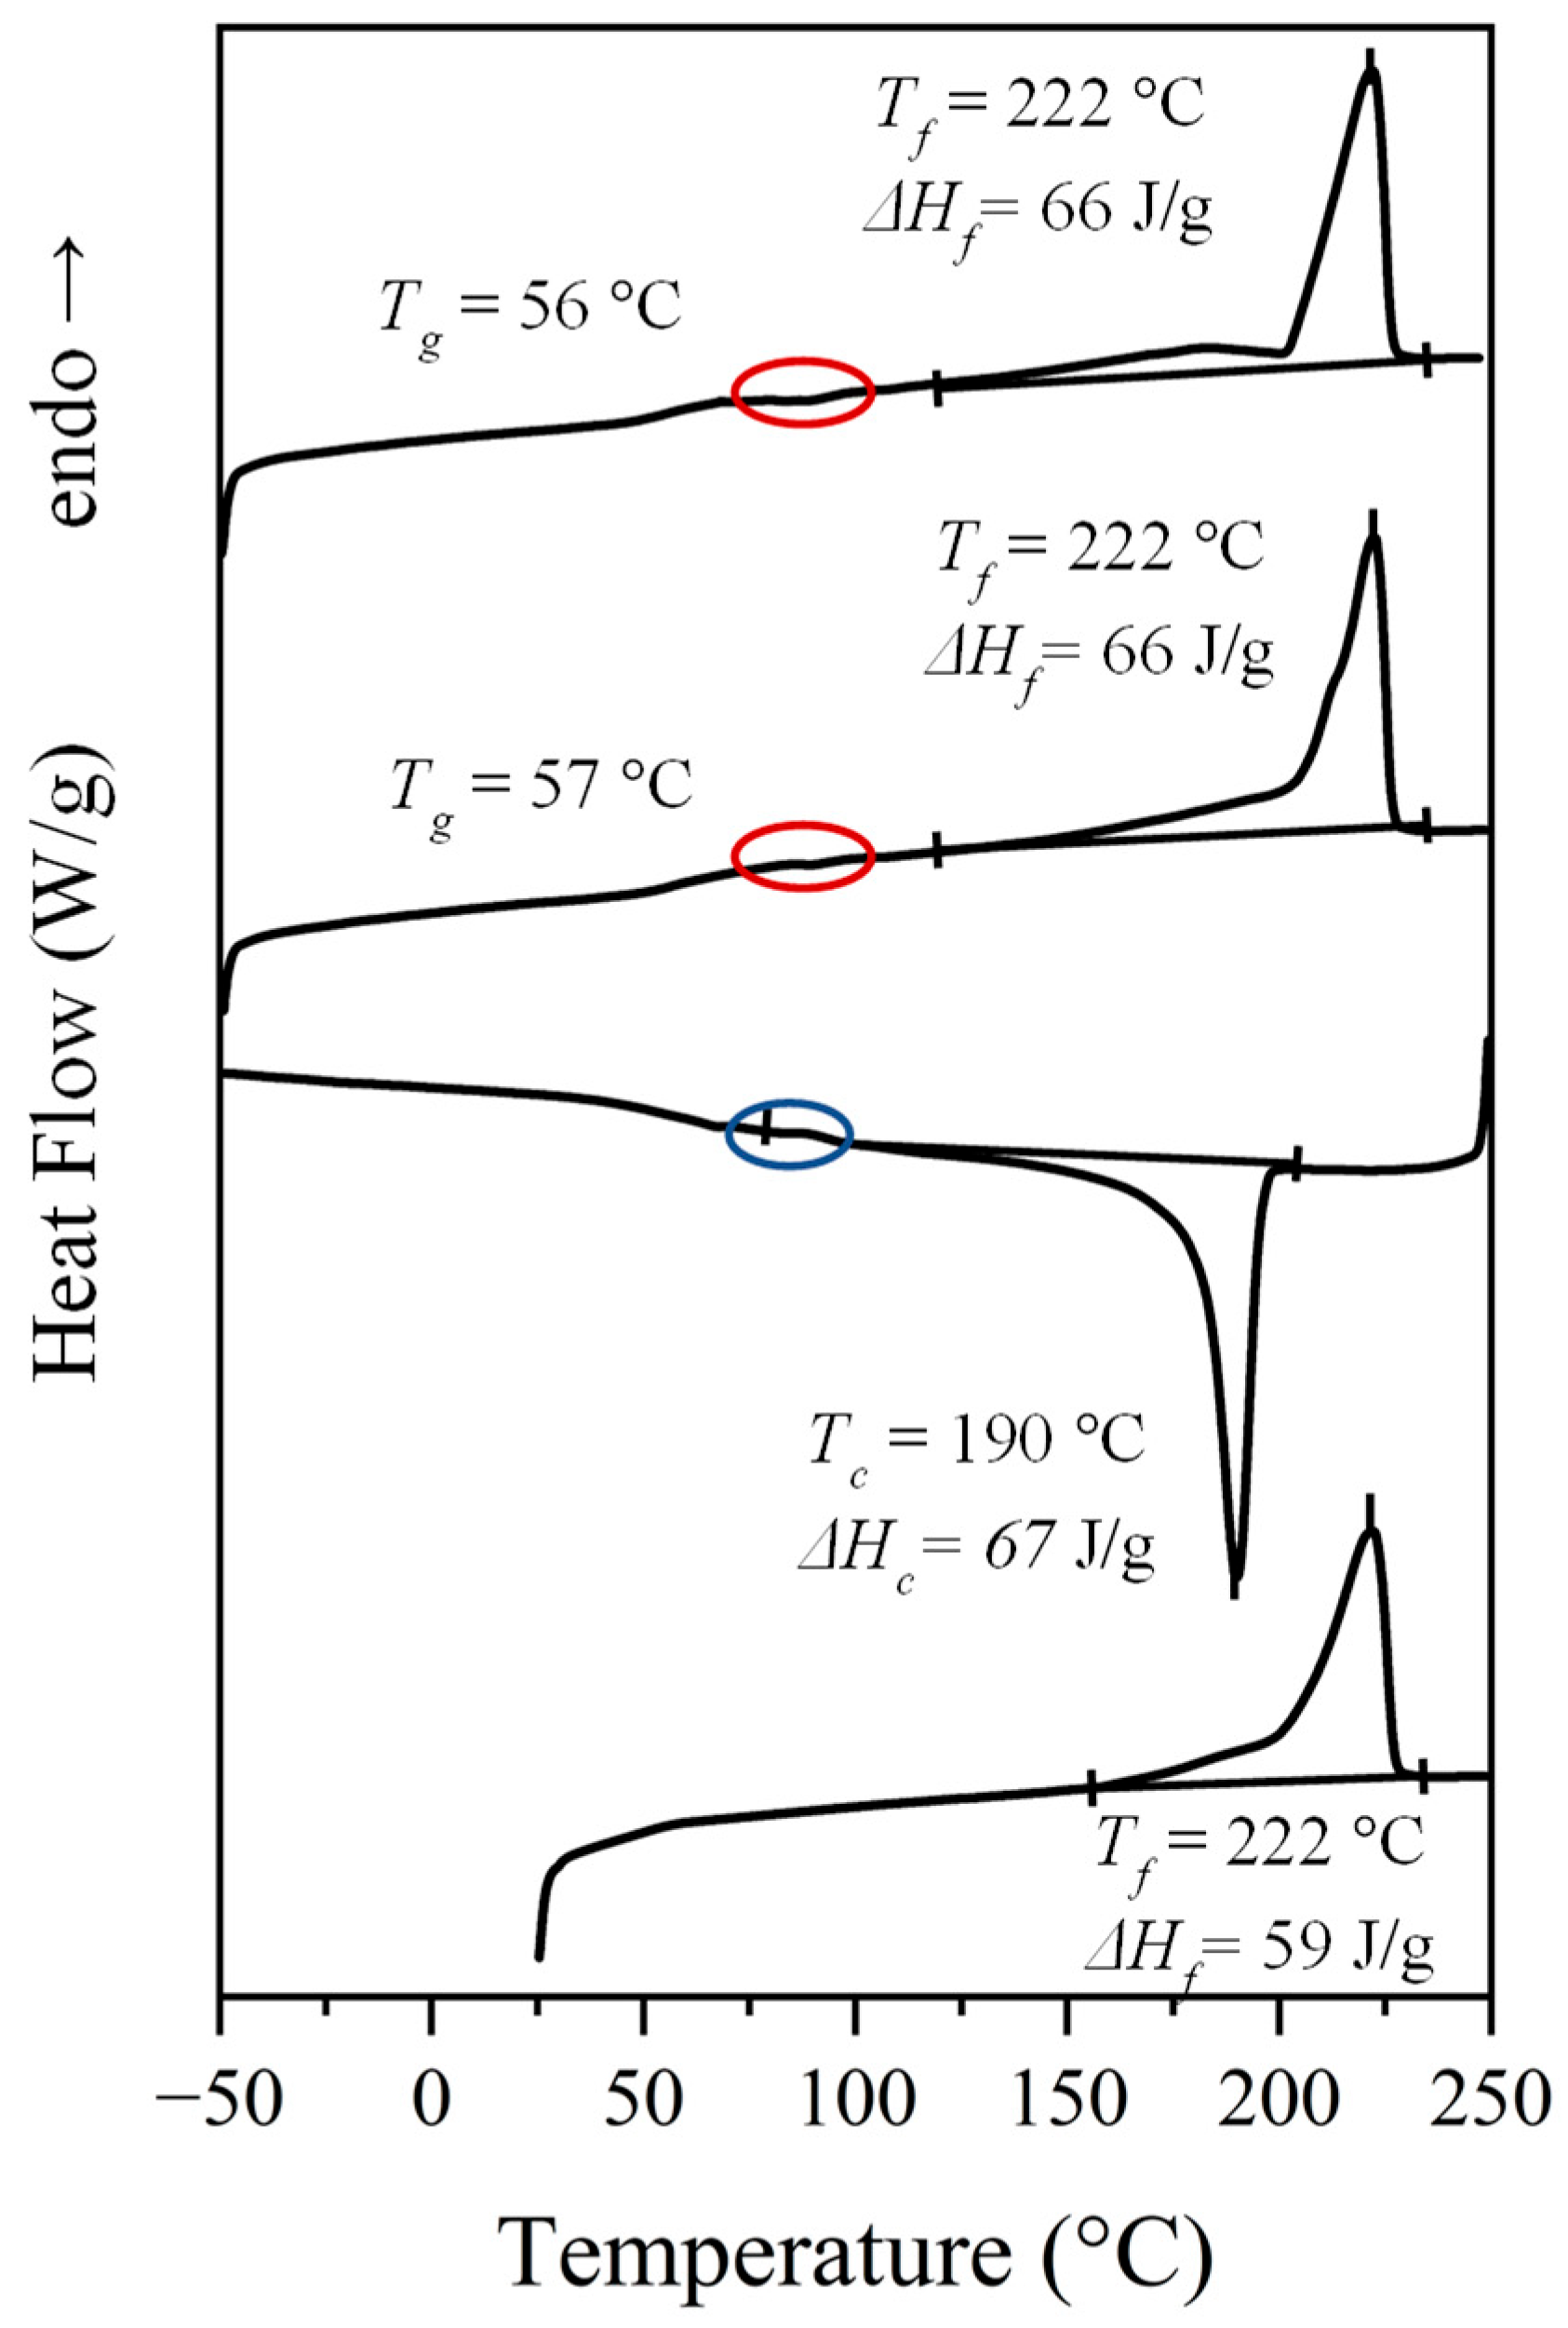
Figure 5.
Plot of the variation of Tf (▪), ΔHf (first heating, ◄), Tc (●), ΔHc (♦), and Tg (▲) with the number of methylene groups in the diamine moiety. Empty symbols correspond to those previously reported for nylon 4.7 [27].
Figure 5.
Plot of the variation of Tf (▪), ΔHf (first heating, ◄), Tc (●), ΔHc (♦), and Tg (▲) with the number of methylene groups in the diamine moiety. Empty symbols correspond to those previously reported for nylon 4.7 [27].
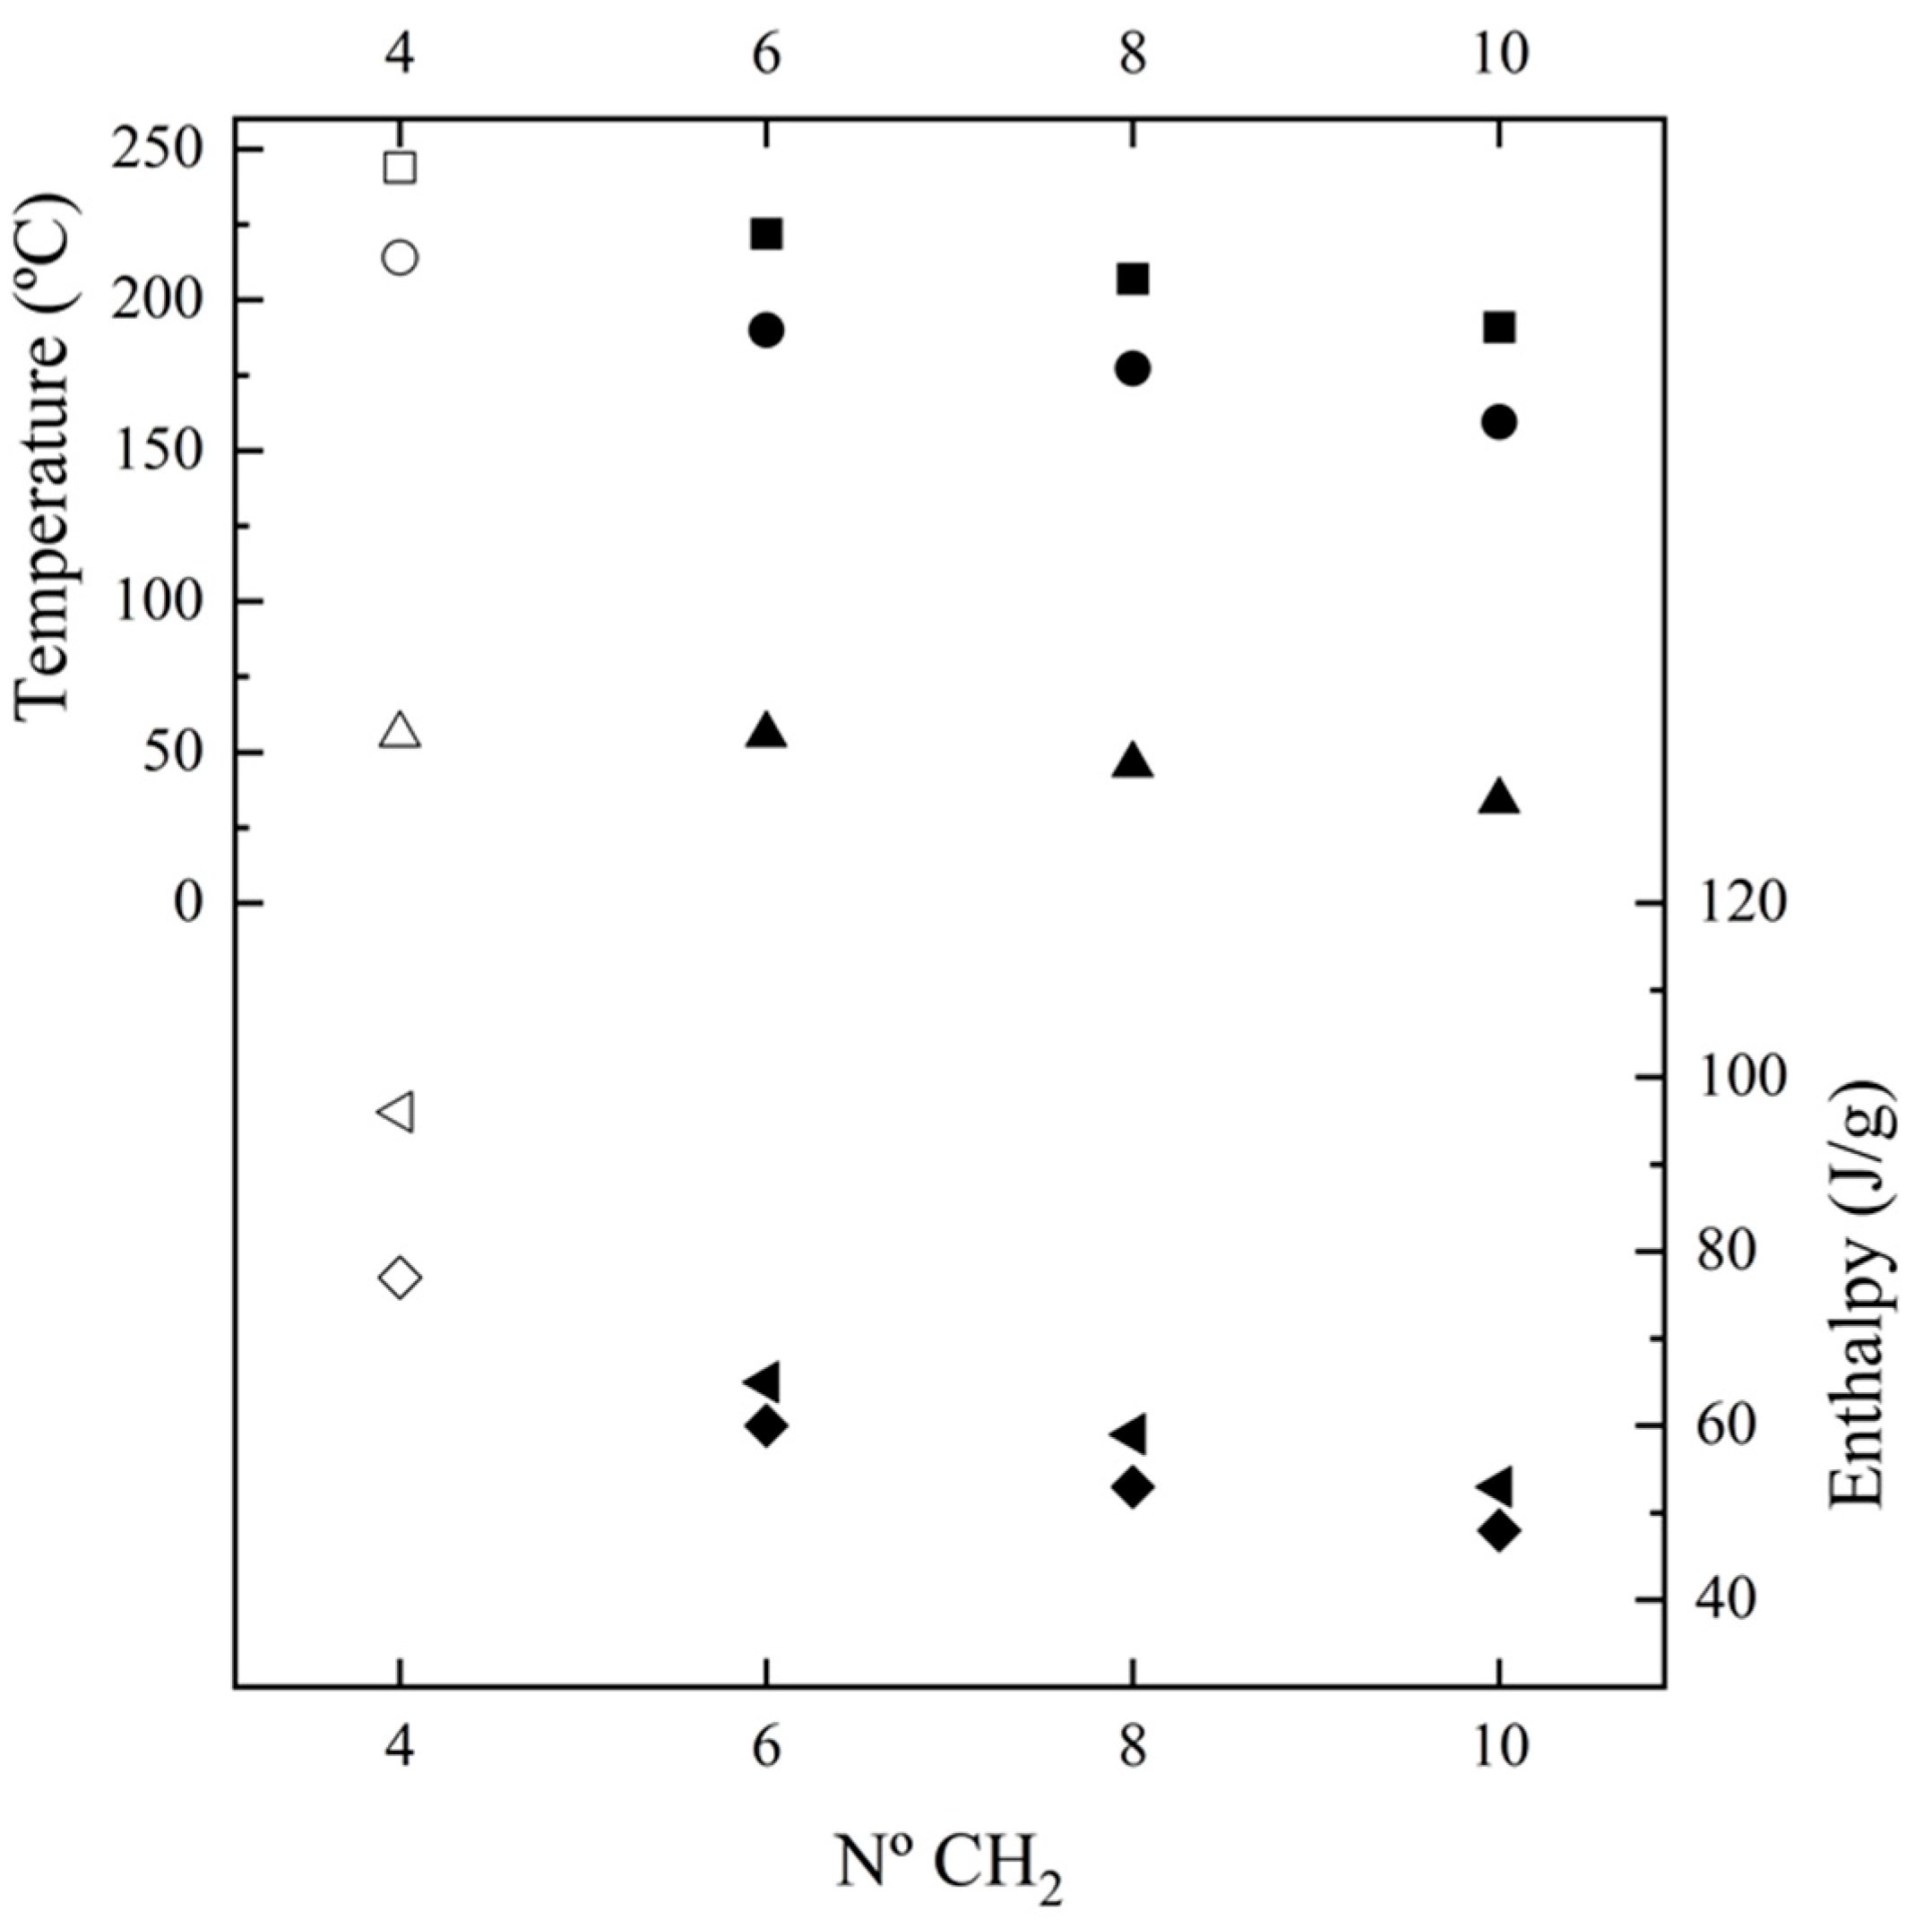
Figure 6.
TGA and DTGA curves of the three synthesized nylons.
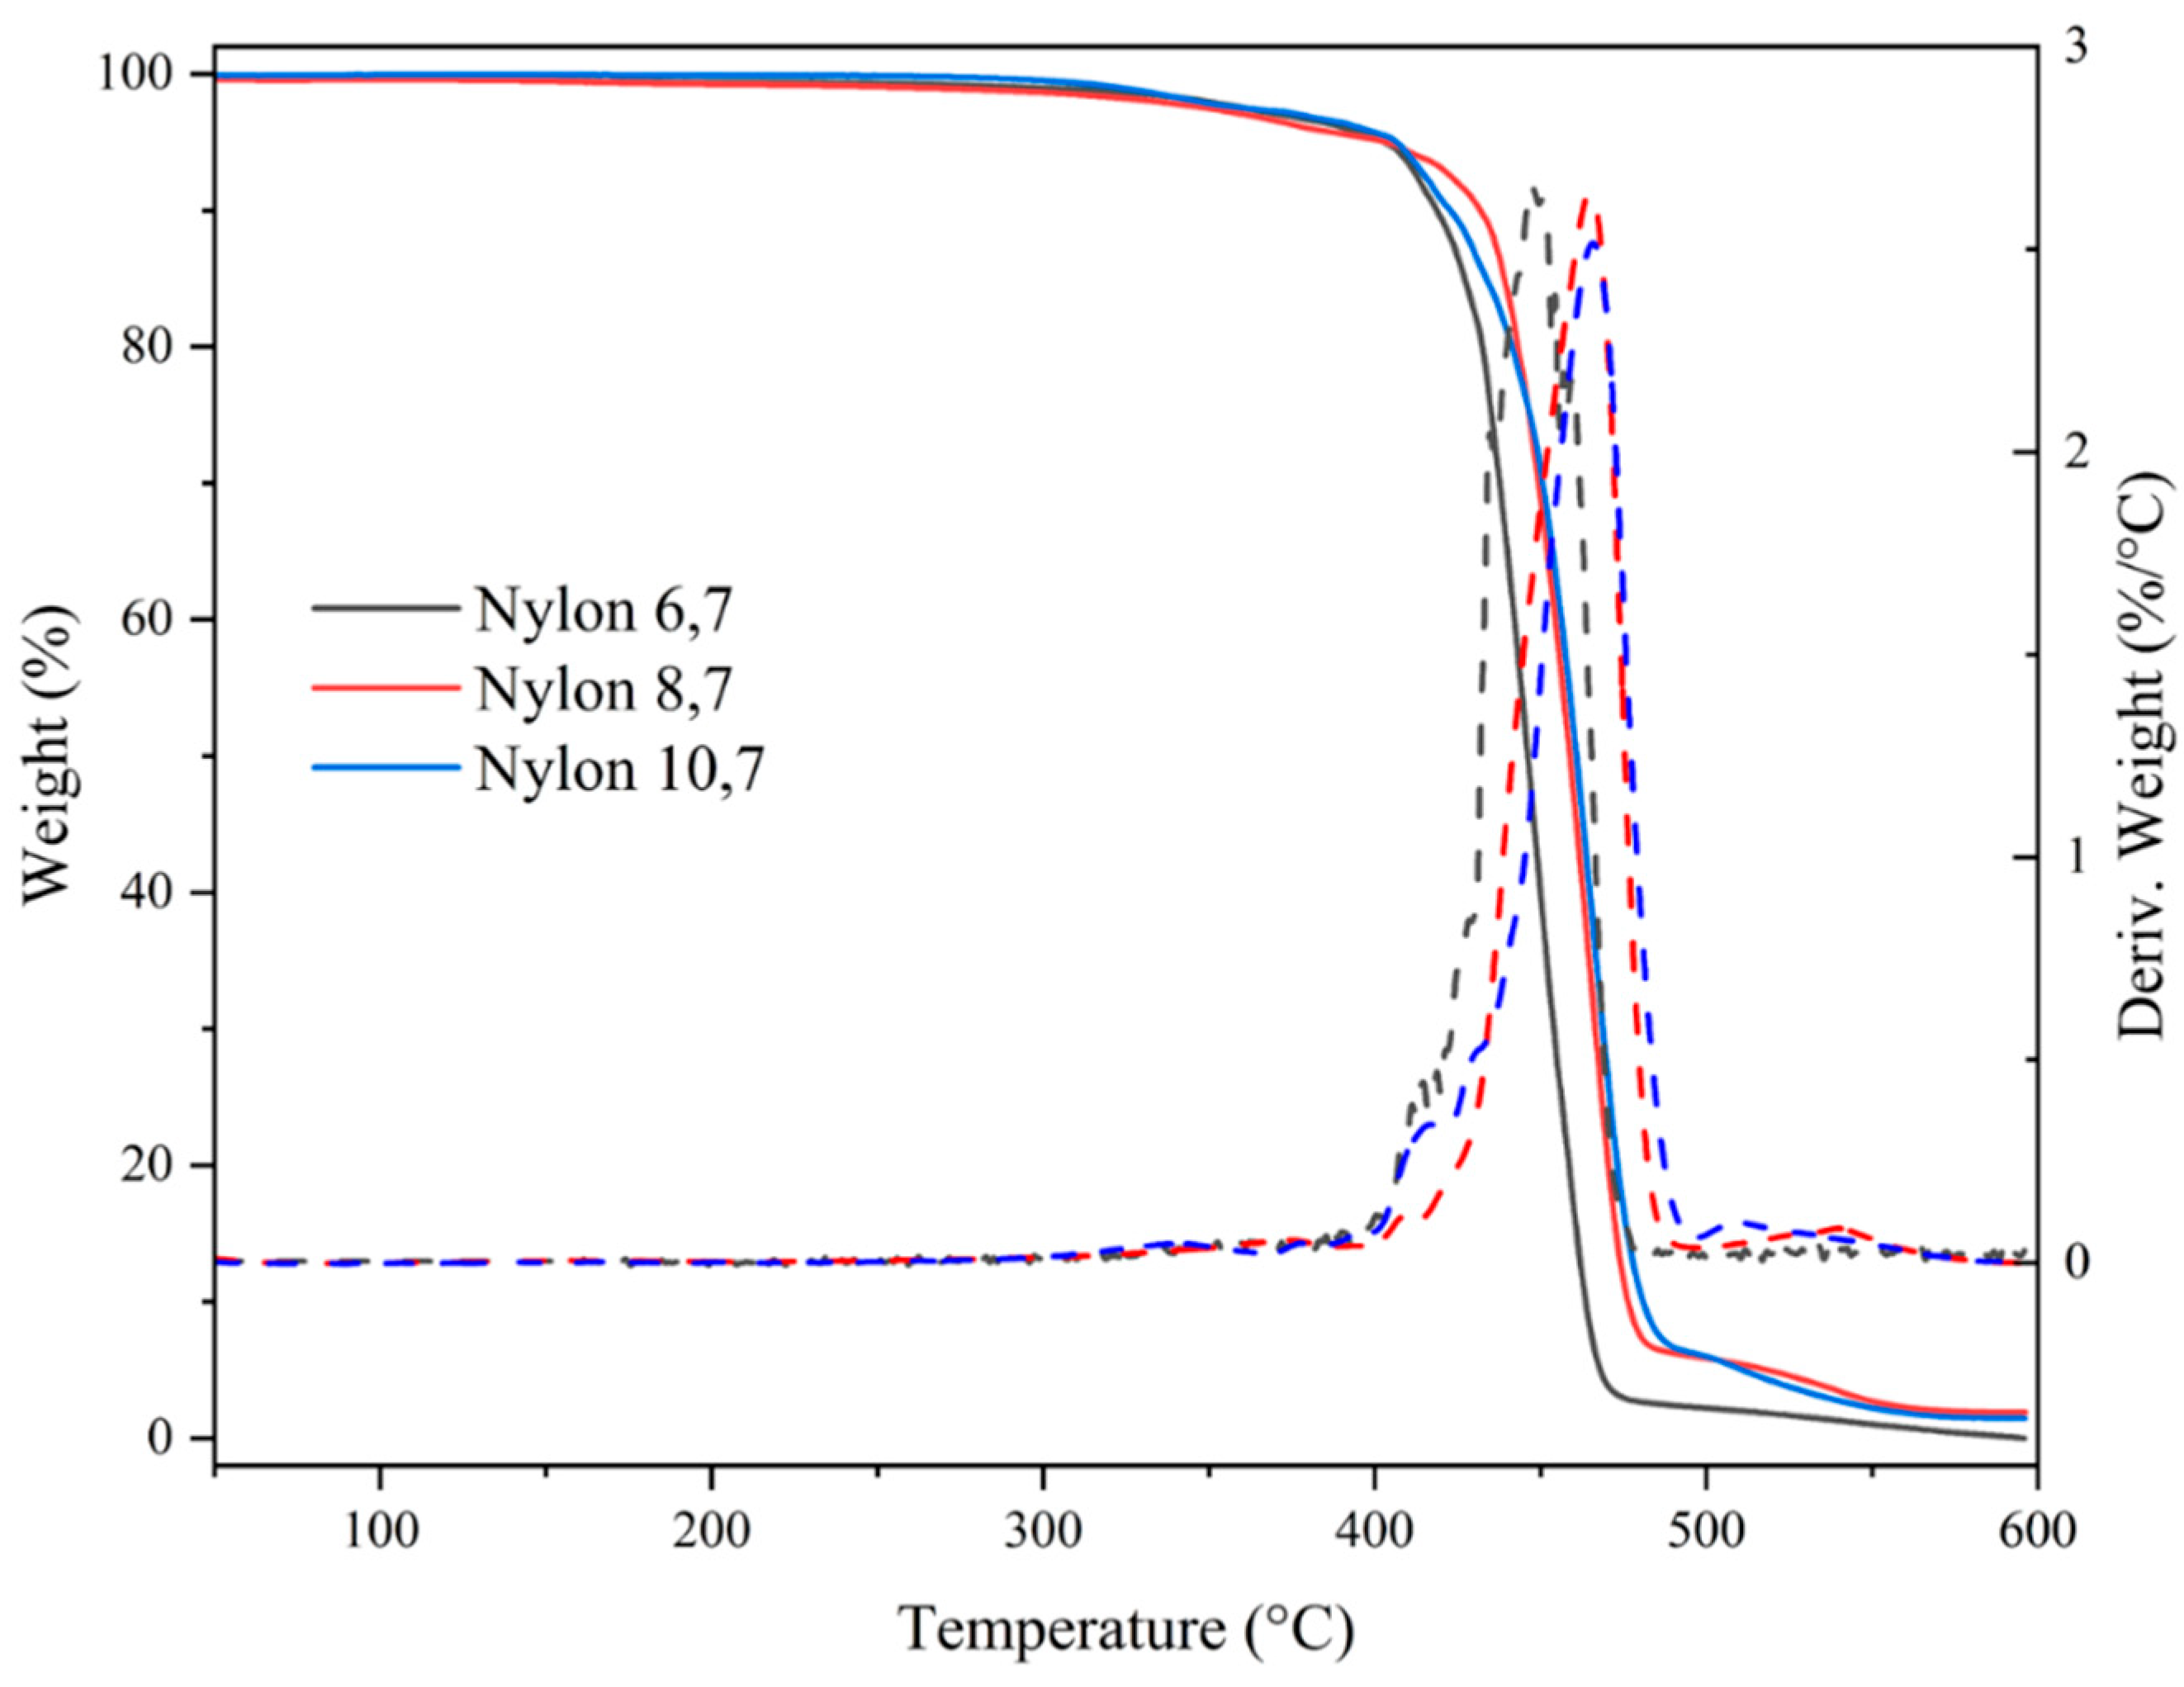
Figure 7.
(a) 3D dimensional plots showing the continuous evolution of X-ray diffraction profiles of nylon 6.7 taken during the heating run (10 °C/min) of a sample precipitated from formic acid. The inset shows a view of the profile evolution from the left side of the most intense peak. Black arrows indicate the strong reflections associated to the modified α-form while blue arrows point out small signals/shoulder associated to the pseudohexagonal form. (b) One-dimensional WAXD profiles of nylon 6.7 that correspond to the singular profiles indicated by empty rounds in the 3D plot, together with the initial and final profiles. (c) Changes in the spacings of main observed reflections. Empty symbols correspond to low intense signals. Gray symbols correspond to the amorphous halo. Dashed red lines indicate the temperatures associated with the observed structural transitions. (d) Change on the intensity of the more intense peaks.
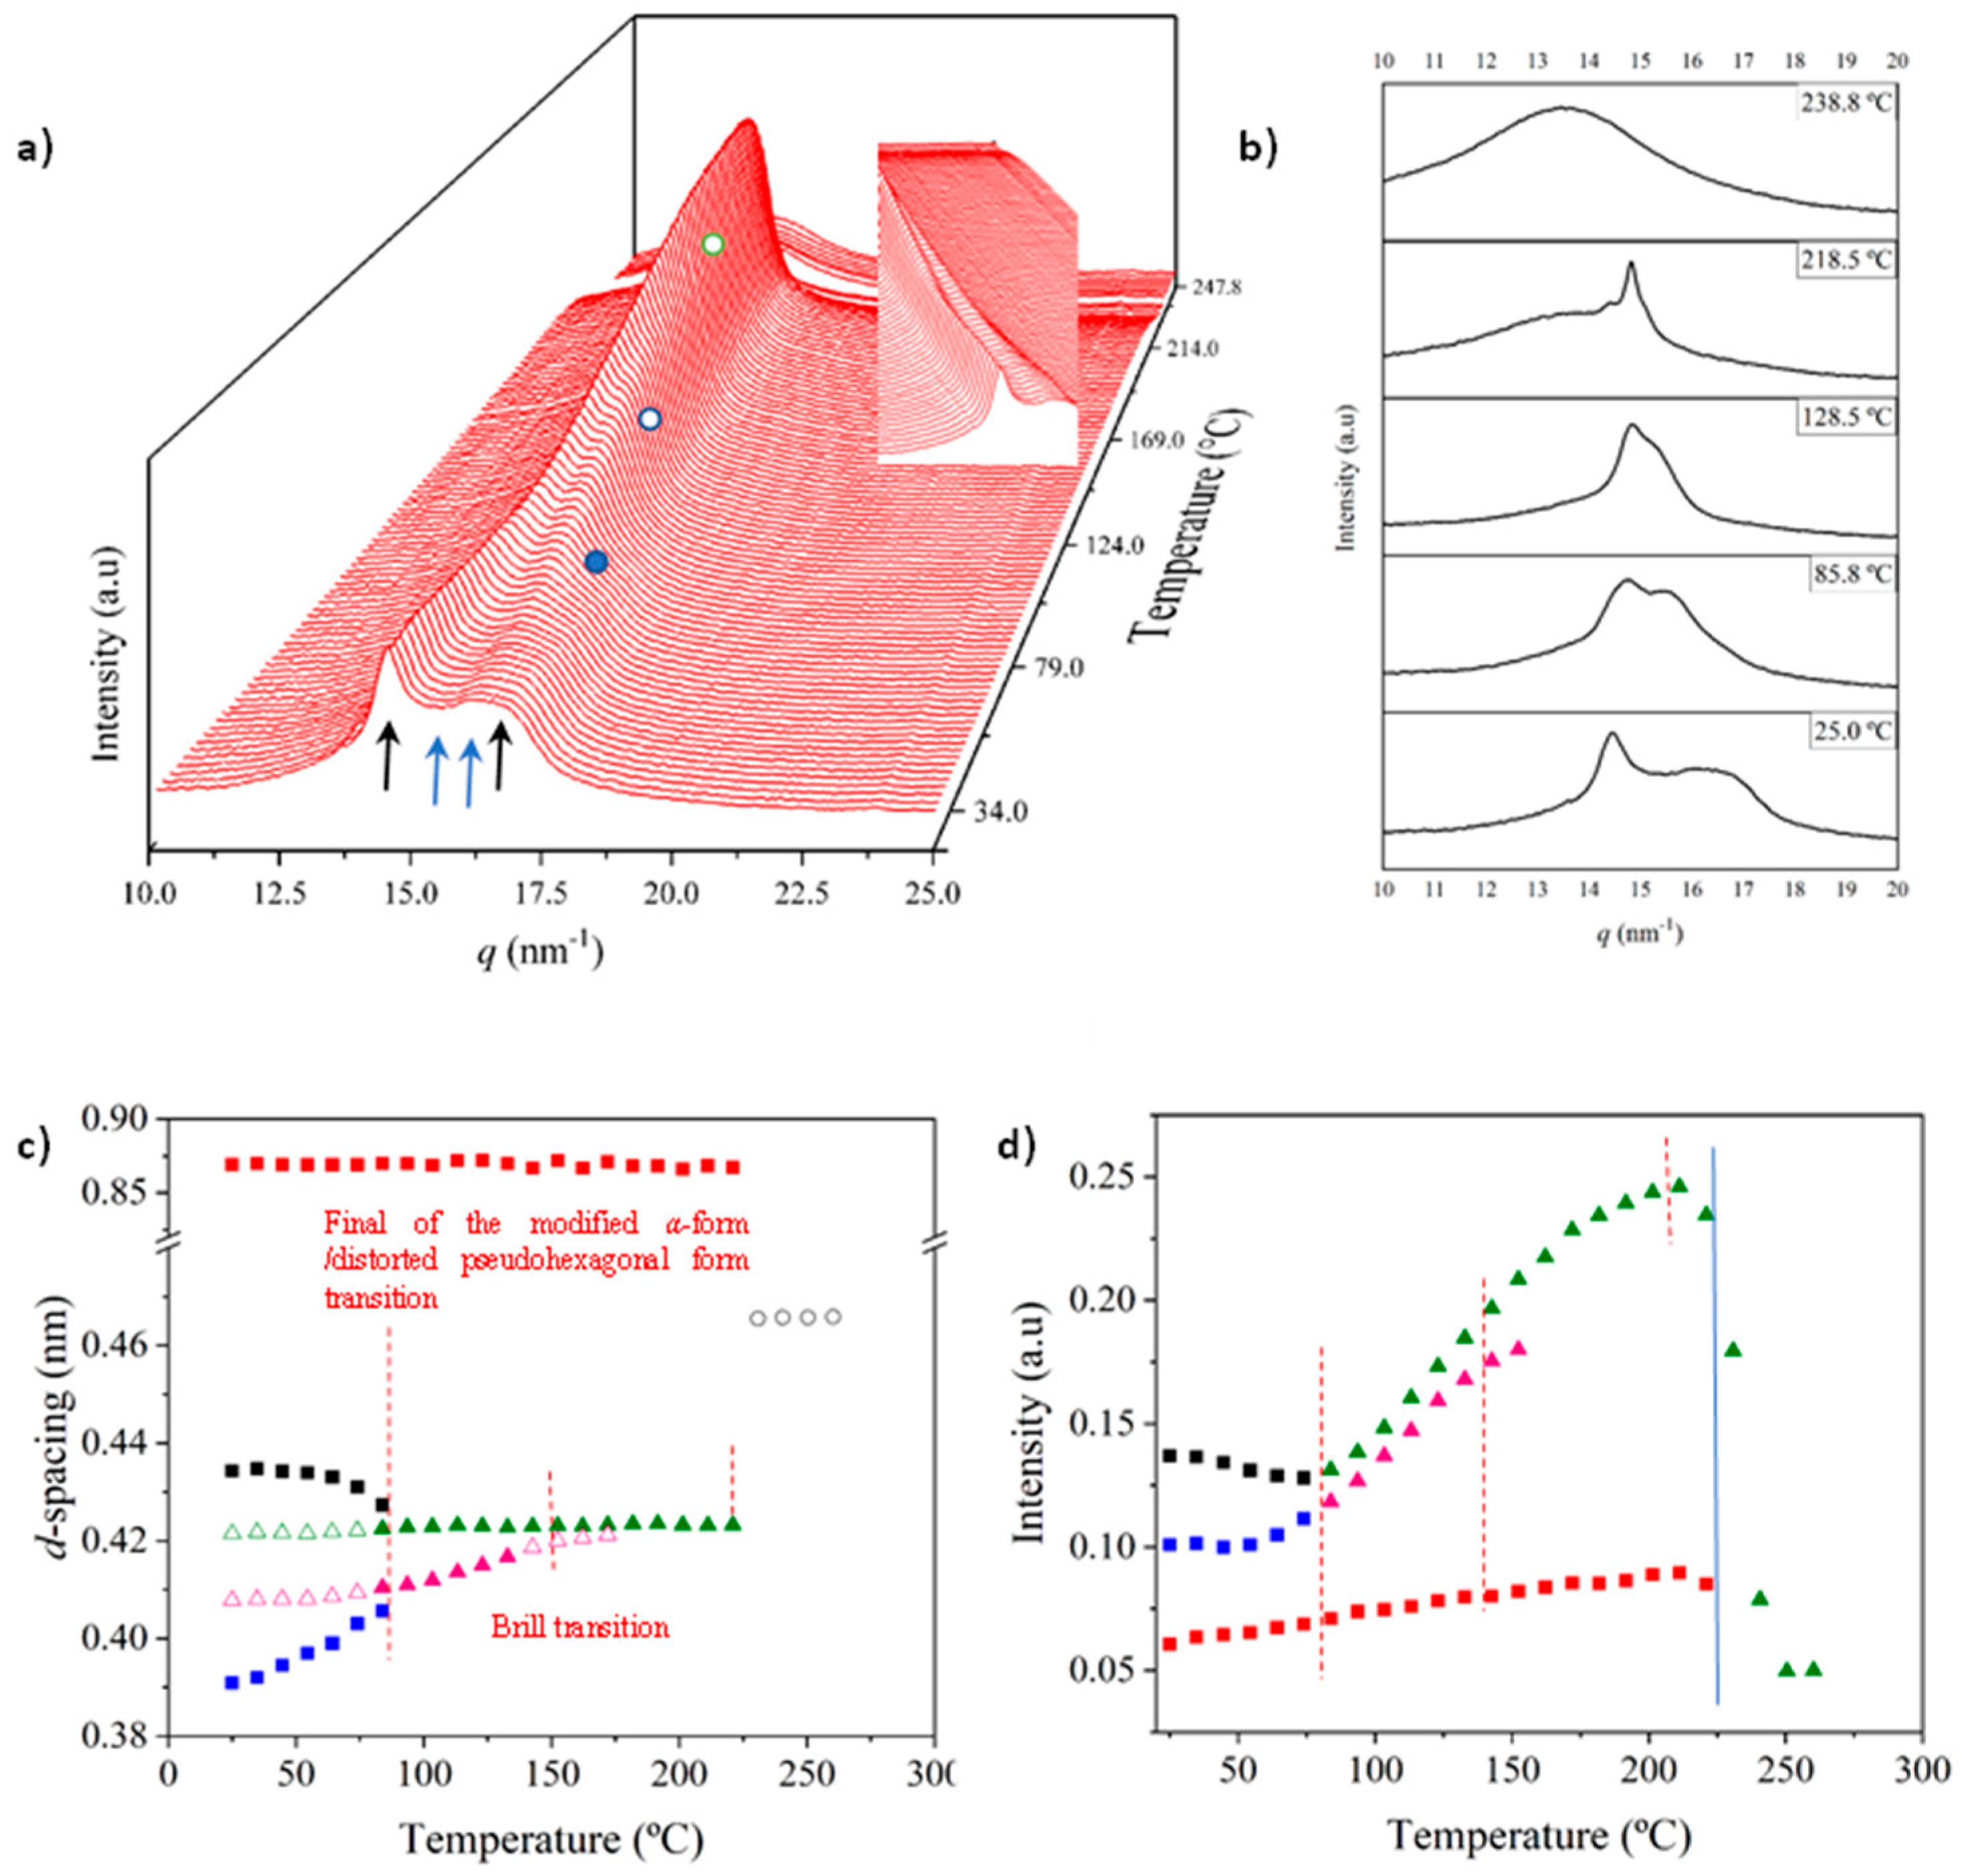
Figure 8.
(a) 3D dimensional plots showing the continuous evolution of X-ray diffraction profiles of nylon 6.7 taken during the cooling run (10 °C/min) of a molten sample. In order to show the evolution of peaks two views (i.e., from high to low temperatures and from low to high temperatures) are given. (b) Changes on the spacings of main observed reflections. Empty symbols correspond to low intense signals. Gray symbols correspond to the amorphous halo. (c) Change on the intensity of the observed peaks.
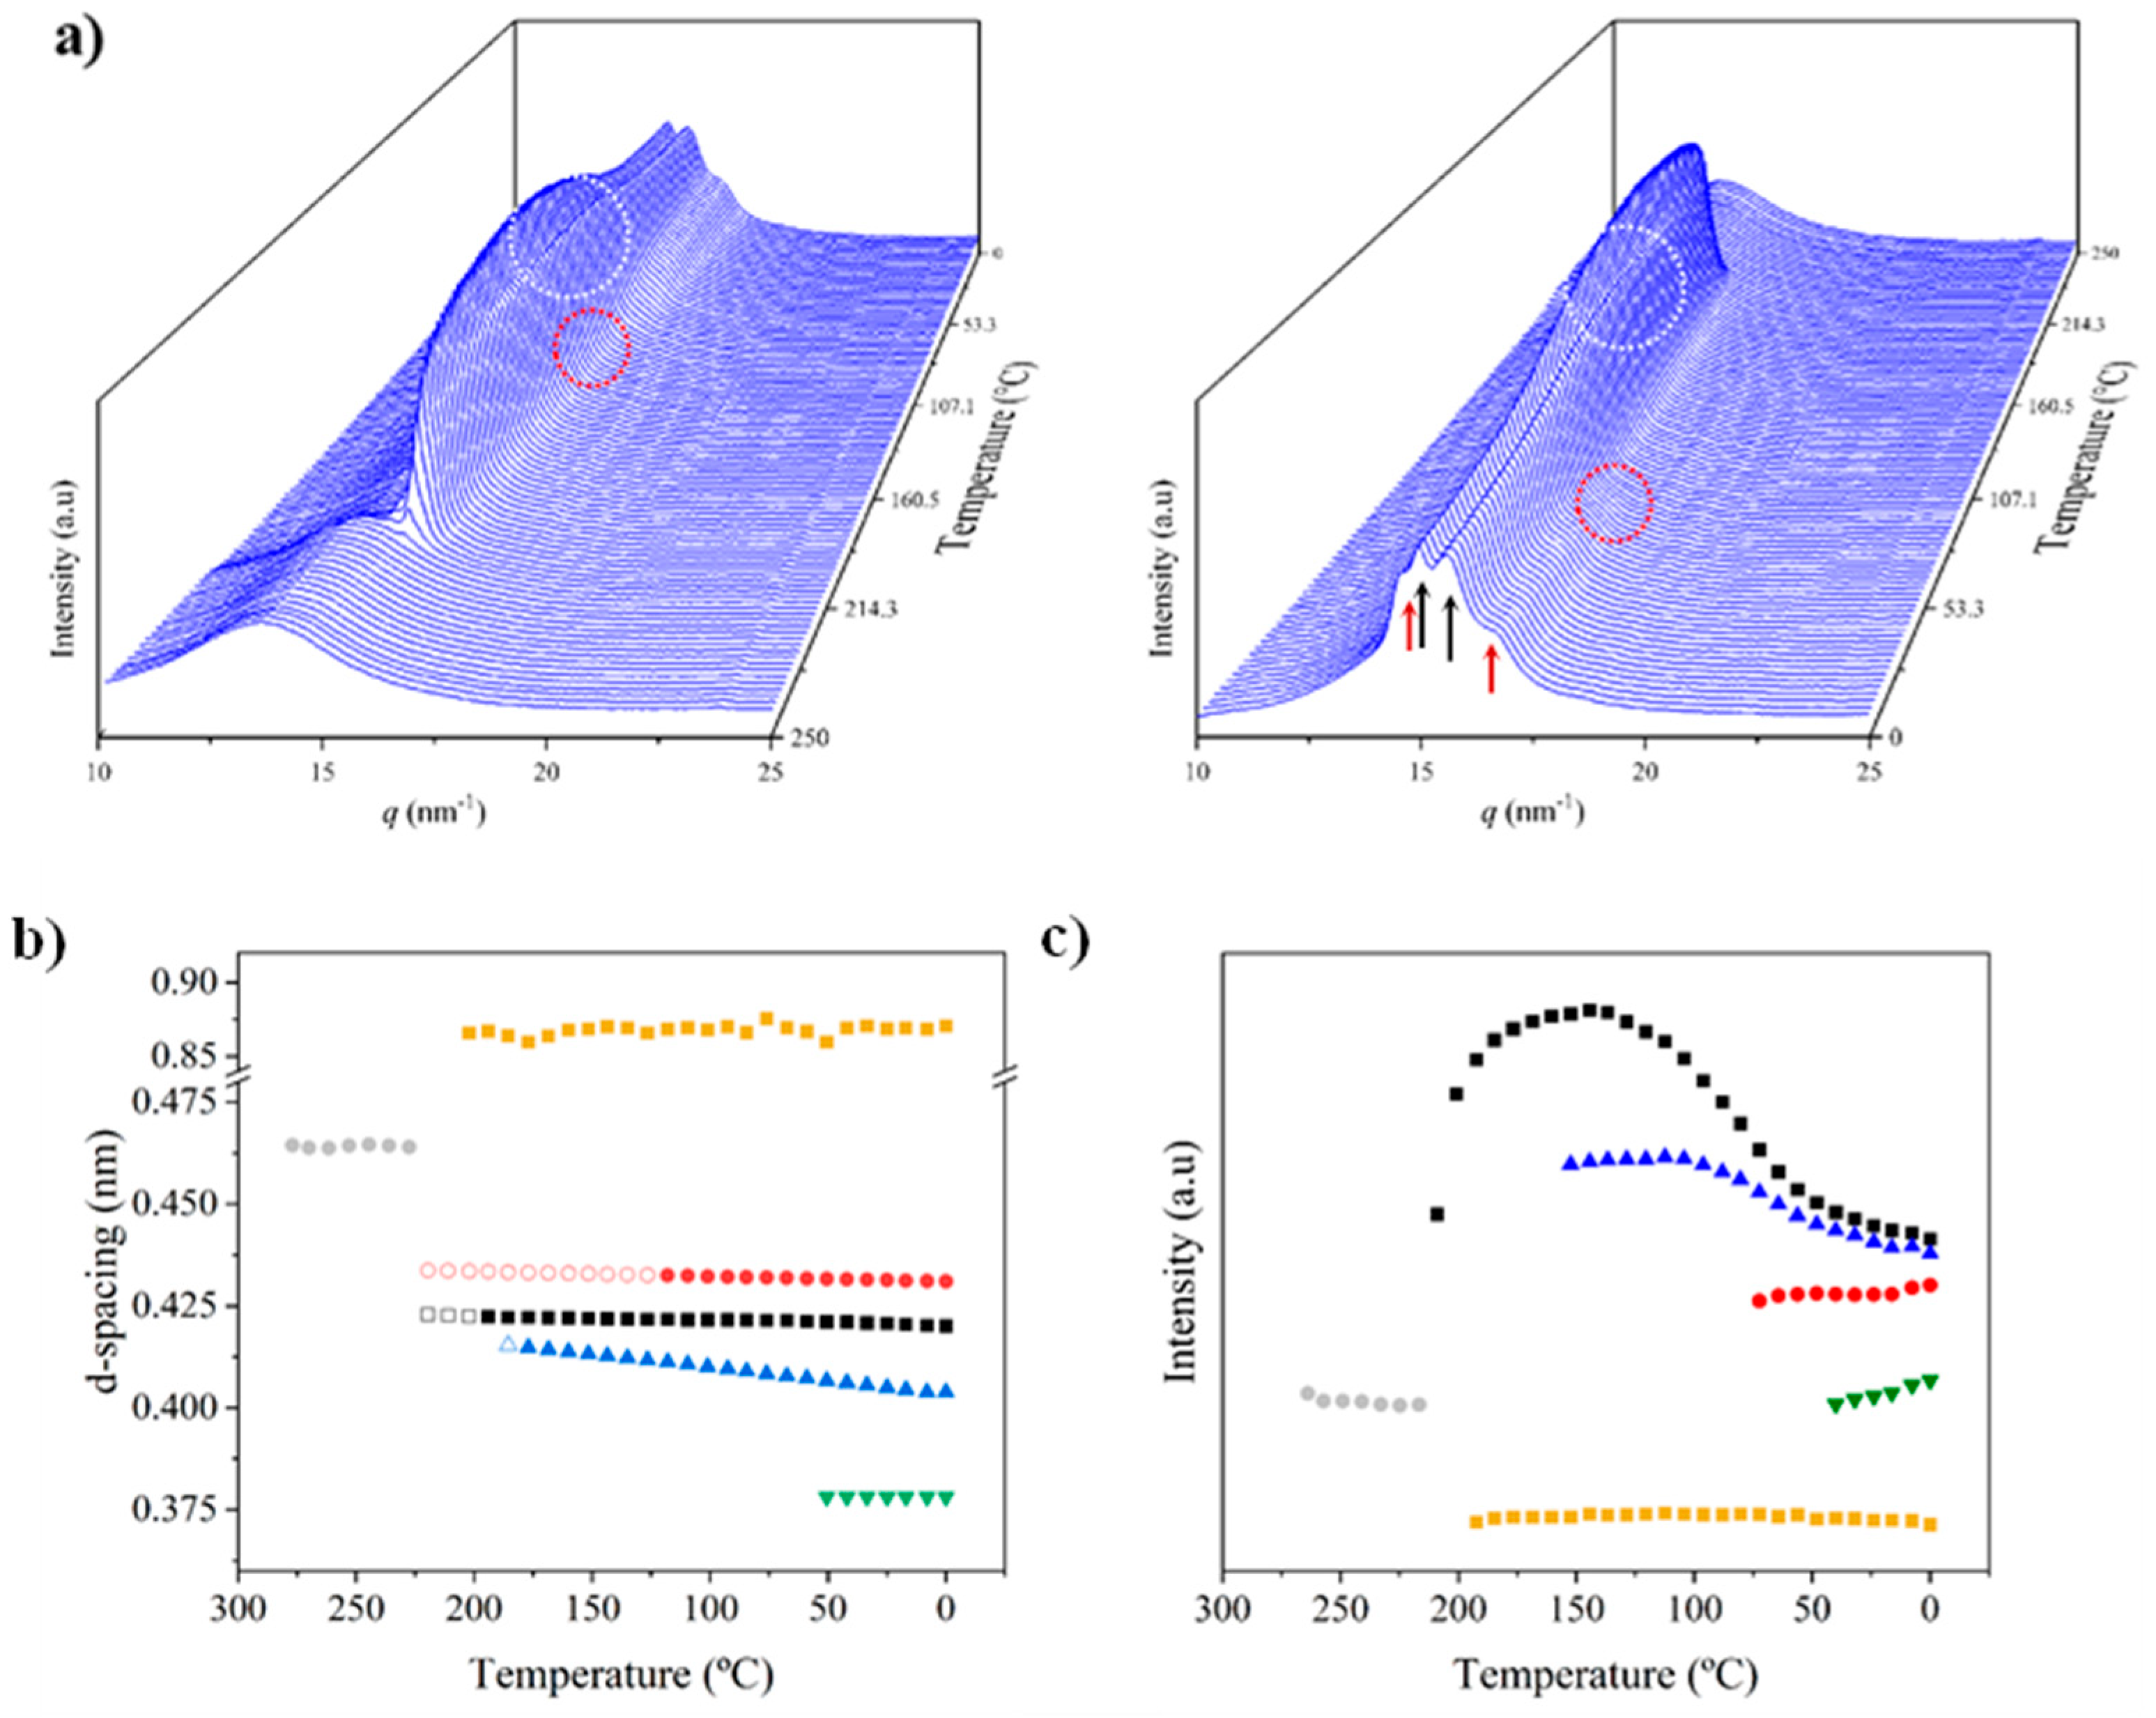
Figure 9.
(a) 3D dimensional plots showing the continuous evolution of X-ray diffraction profiles of nylon 6.7 taken during the heating run (10 °C/min) of a melt crystallized sample. (b) Changes in the spacings of main observed reflections. Empty symbols correspond to low intense signals. Gray symbols correspond to the amorphous halo.
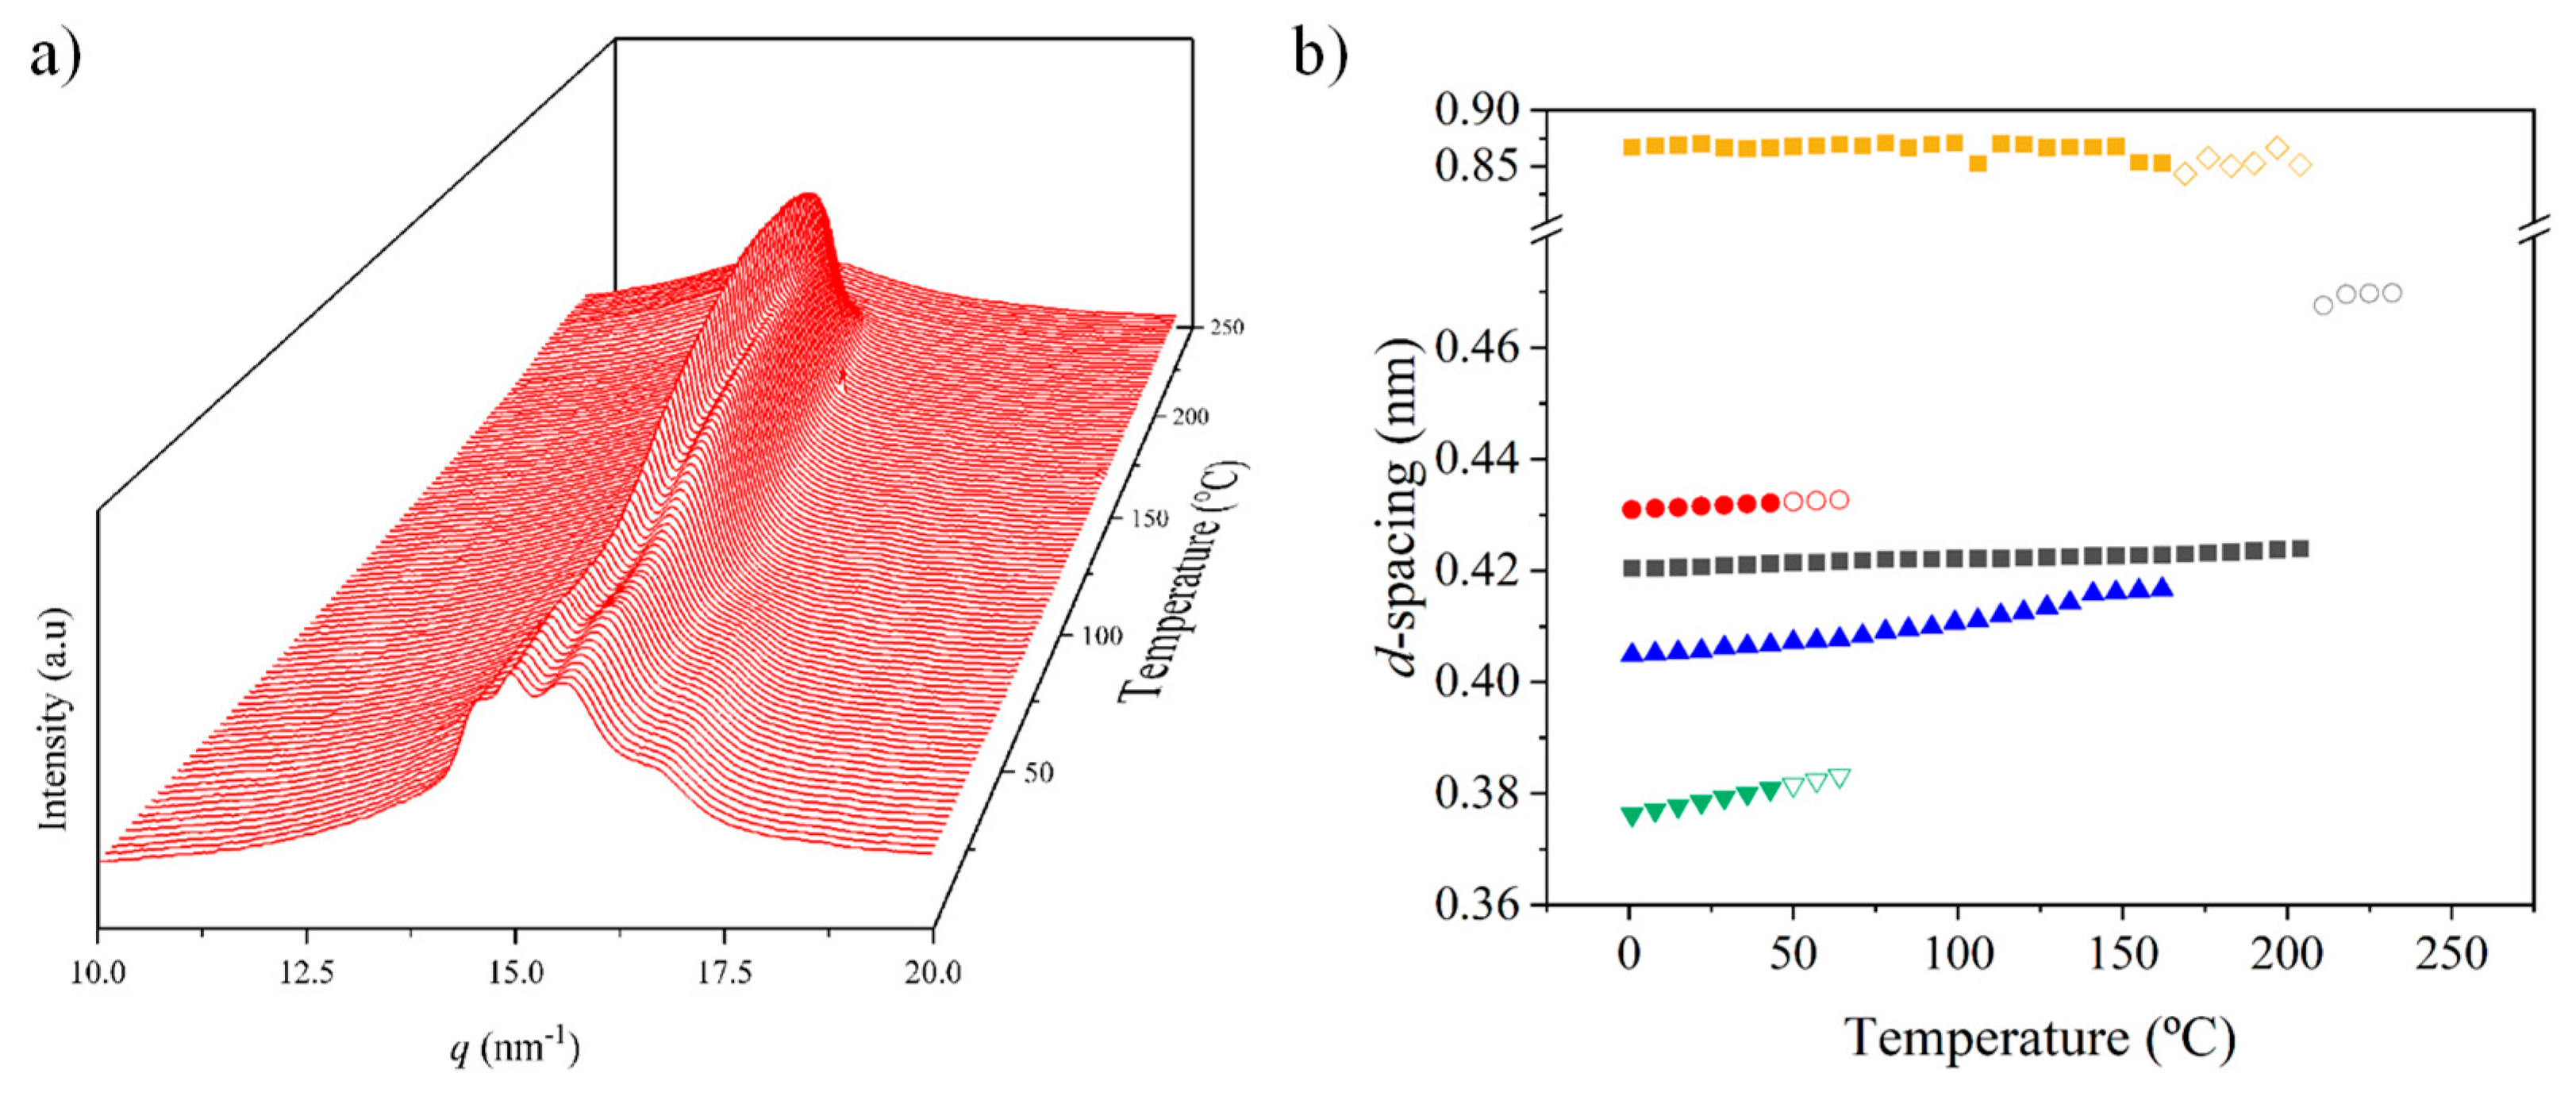
Figure 10.
Fiber diffraction patterns of nylon 6.7: Inner (left) and outer (right) regions. Colored insets show the equatorial reflections. Two and one strong arches (white color) can be observed depending on the ratio between the modified alpha (a) and pseudohexagonal (b) structures. Ellipsoids point out the presence of off meridional reflections.
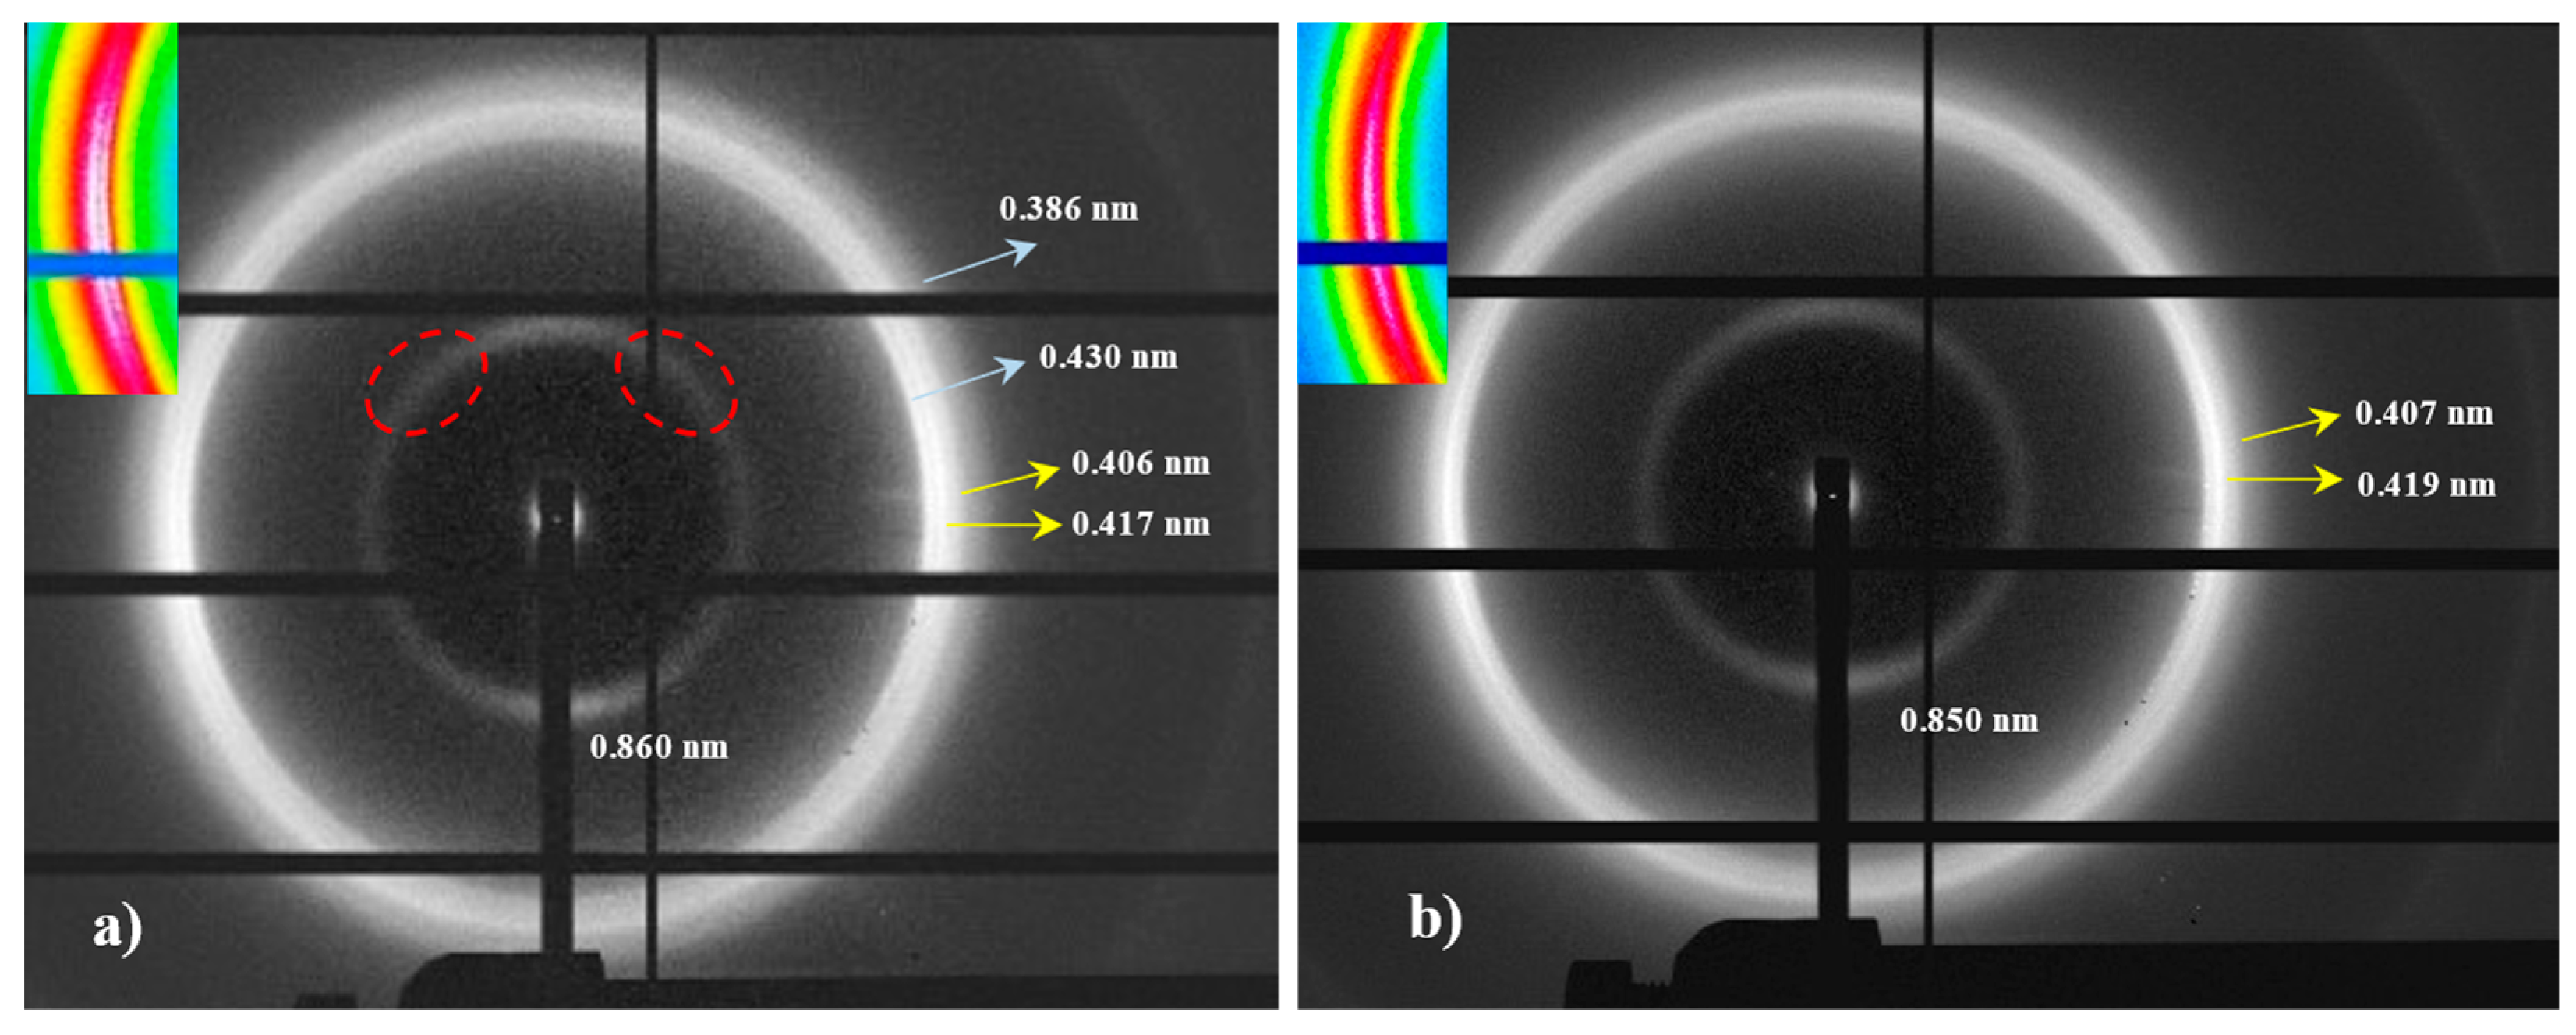
Figure 11.
Fiber diffraction pattern of a fiber obtained from a mixture of nylons 6.7 and 10.7 (7:3 ratio).
Figure 11.
Fiber diffraction pattern of a fiber obtained from a mixture of nylons 6.7 and 10.7 (7:3 ratio).
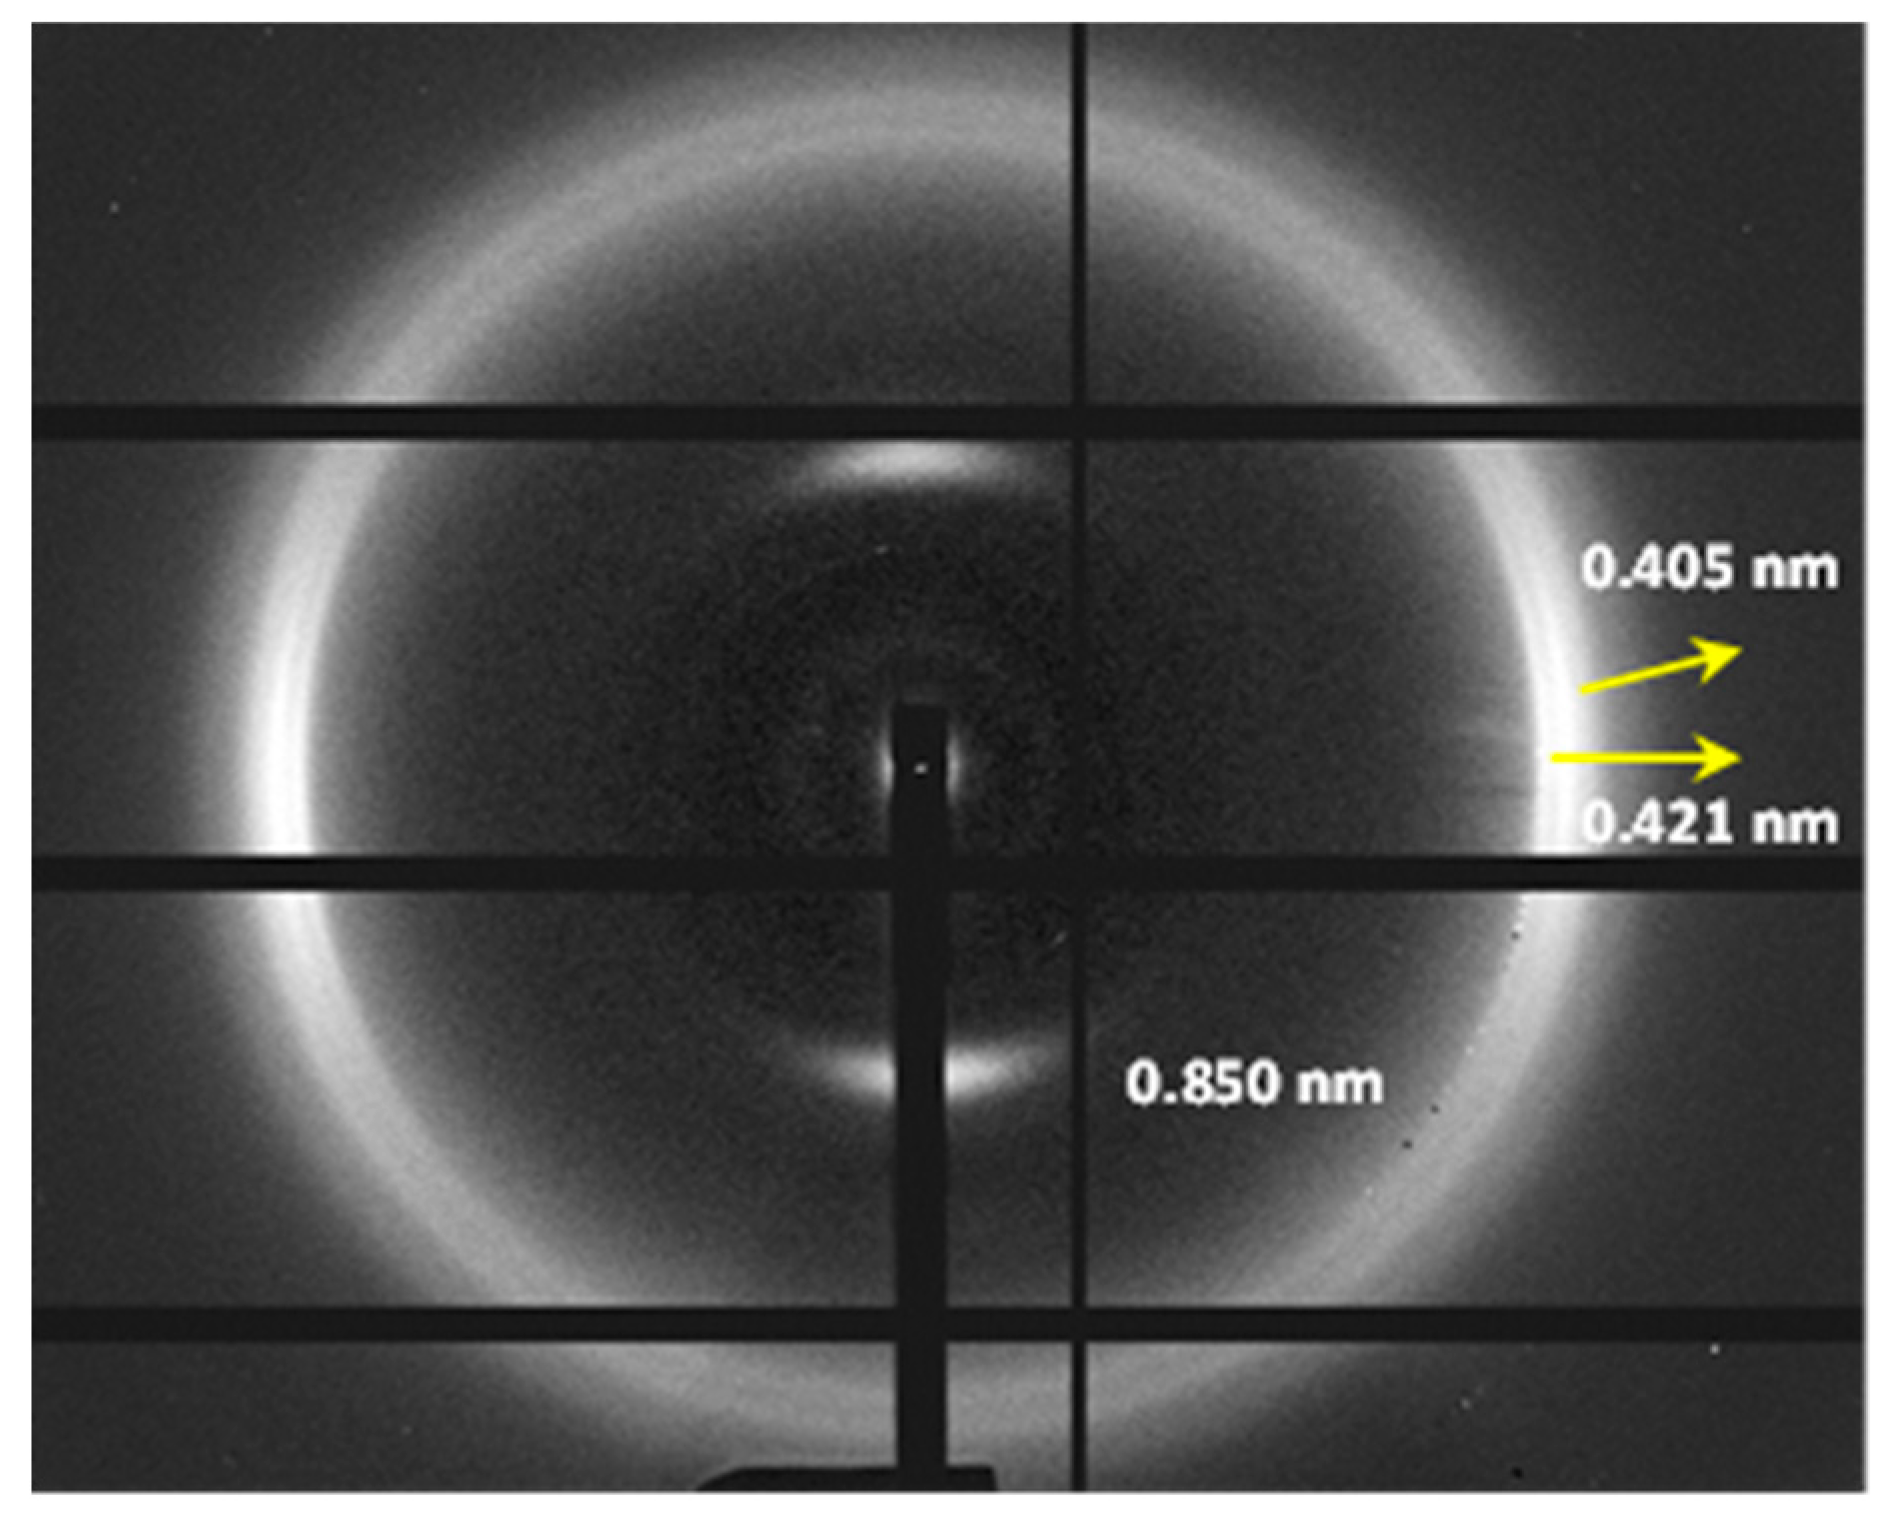
Figure 12.
(a) 3D dimensional plots showing the continuous evolution of X-ray diffraction profiles of nylon 8.7 taken during the heating run (10 °C/min) of a sample precipitated from formic acid. In order to show the evolution of peaks two views (i.e., from the left and the right side of the most intense peak) are given. Black arrows indicate the characteristic reflections associated to the modified α-form, while blue arrows point out the characteristic signals associated to the distorted pseudohexagonal form. (b) One-dimensional WAXD profiles of nylon 8.7 that correspond to the singular profiles labeled in the 3D plot (full blue point for the first profile without the modified α-form, empty blue point for the highest temperature profile without a significant overlapping and empty green point for the highest temperature profile for the Brill structure) and the initial and final profiles. (c) Changes on the spacings of main observed reflections. Empty symbols correspond to low intense signals. Gray symbols correspond to the amorphous halo.
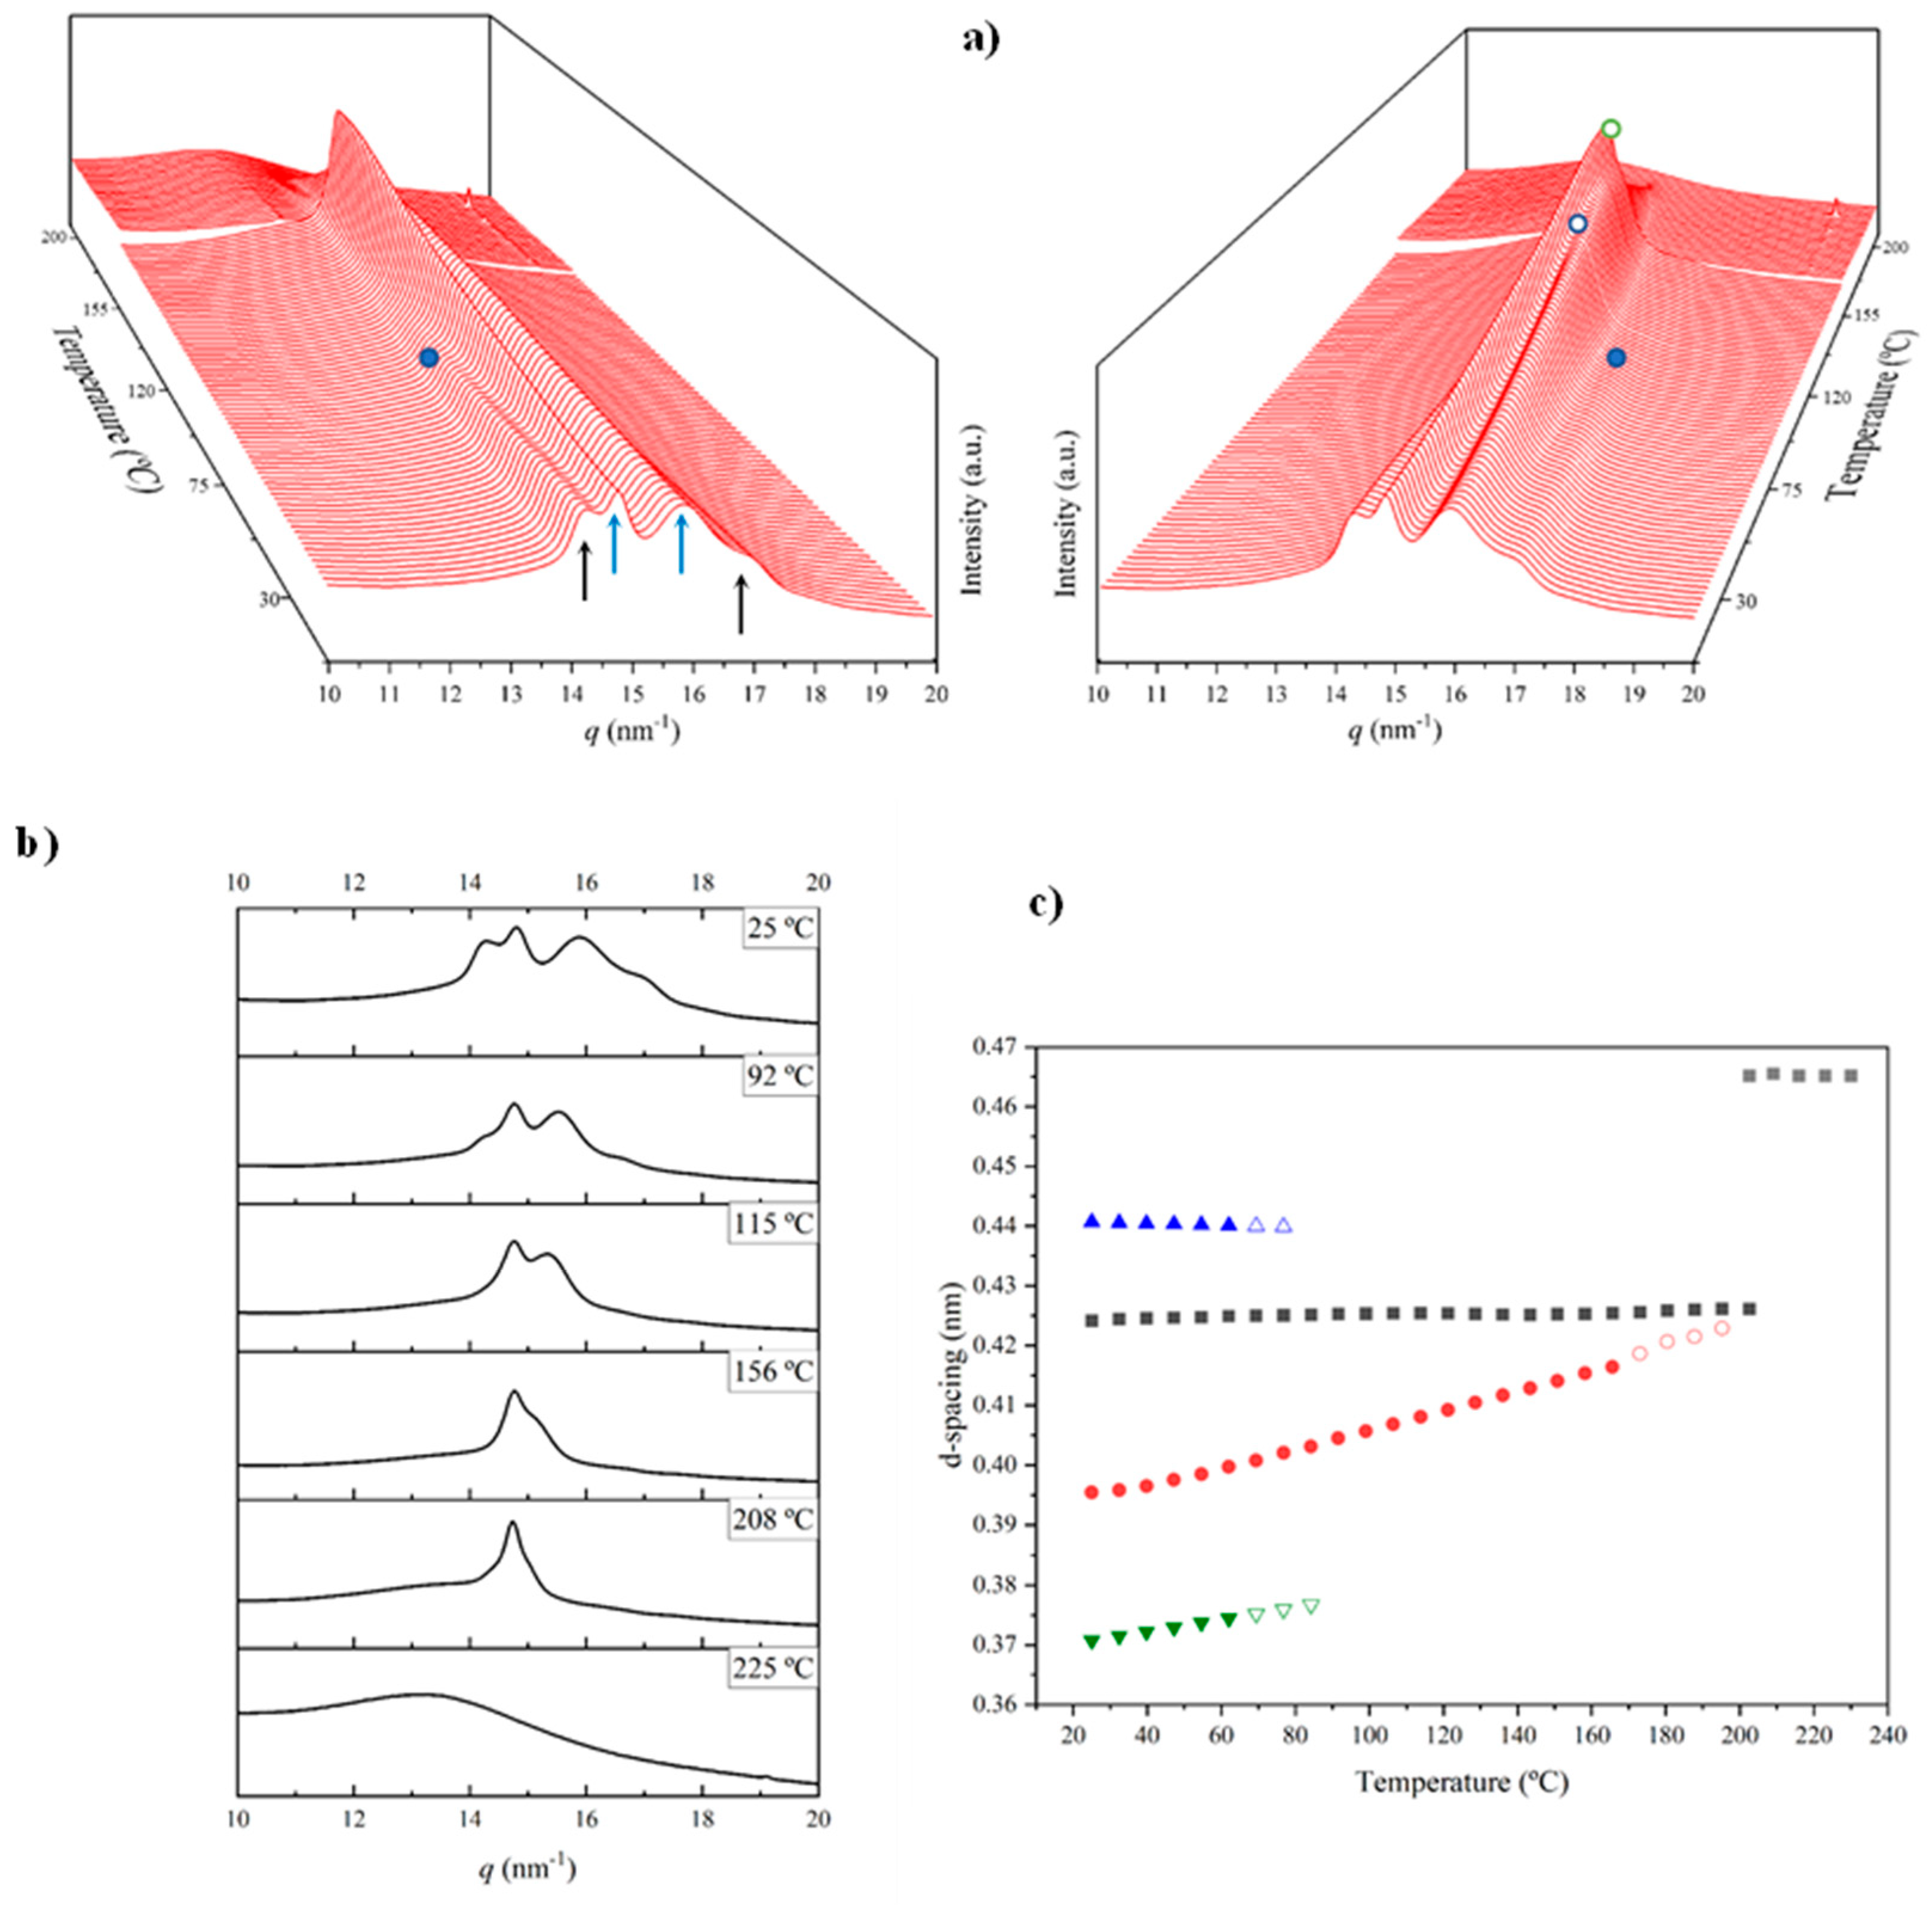
Figure 13.
3D dimensional plots showing the continuous evolution of X-ray diffraction profiles of nylon 8.7 taken during cooling (a) and reheating runs (10 °C/min) (b). Black arrows indicate the characteristic reflections associated to the modified α-form while blue arrows point out the characteristic signals associated to the distorted pseudohexagonal form. (c) Comparison between the intensity evolution of the four main peaks during cooling and reheating processes. Empty symbols correspond to low intense signals. Gray symbols correspond to the amorphous halo. Dashed red lines indicate the temperatures associated with the observed structural transitions (i.e., Brill and appearance/disappearance of the α-modified form. (d) X-ray diffraction pattern of a nylon 7.7 fiber obtained from the melt.
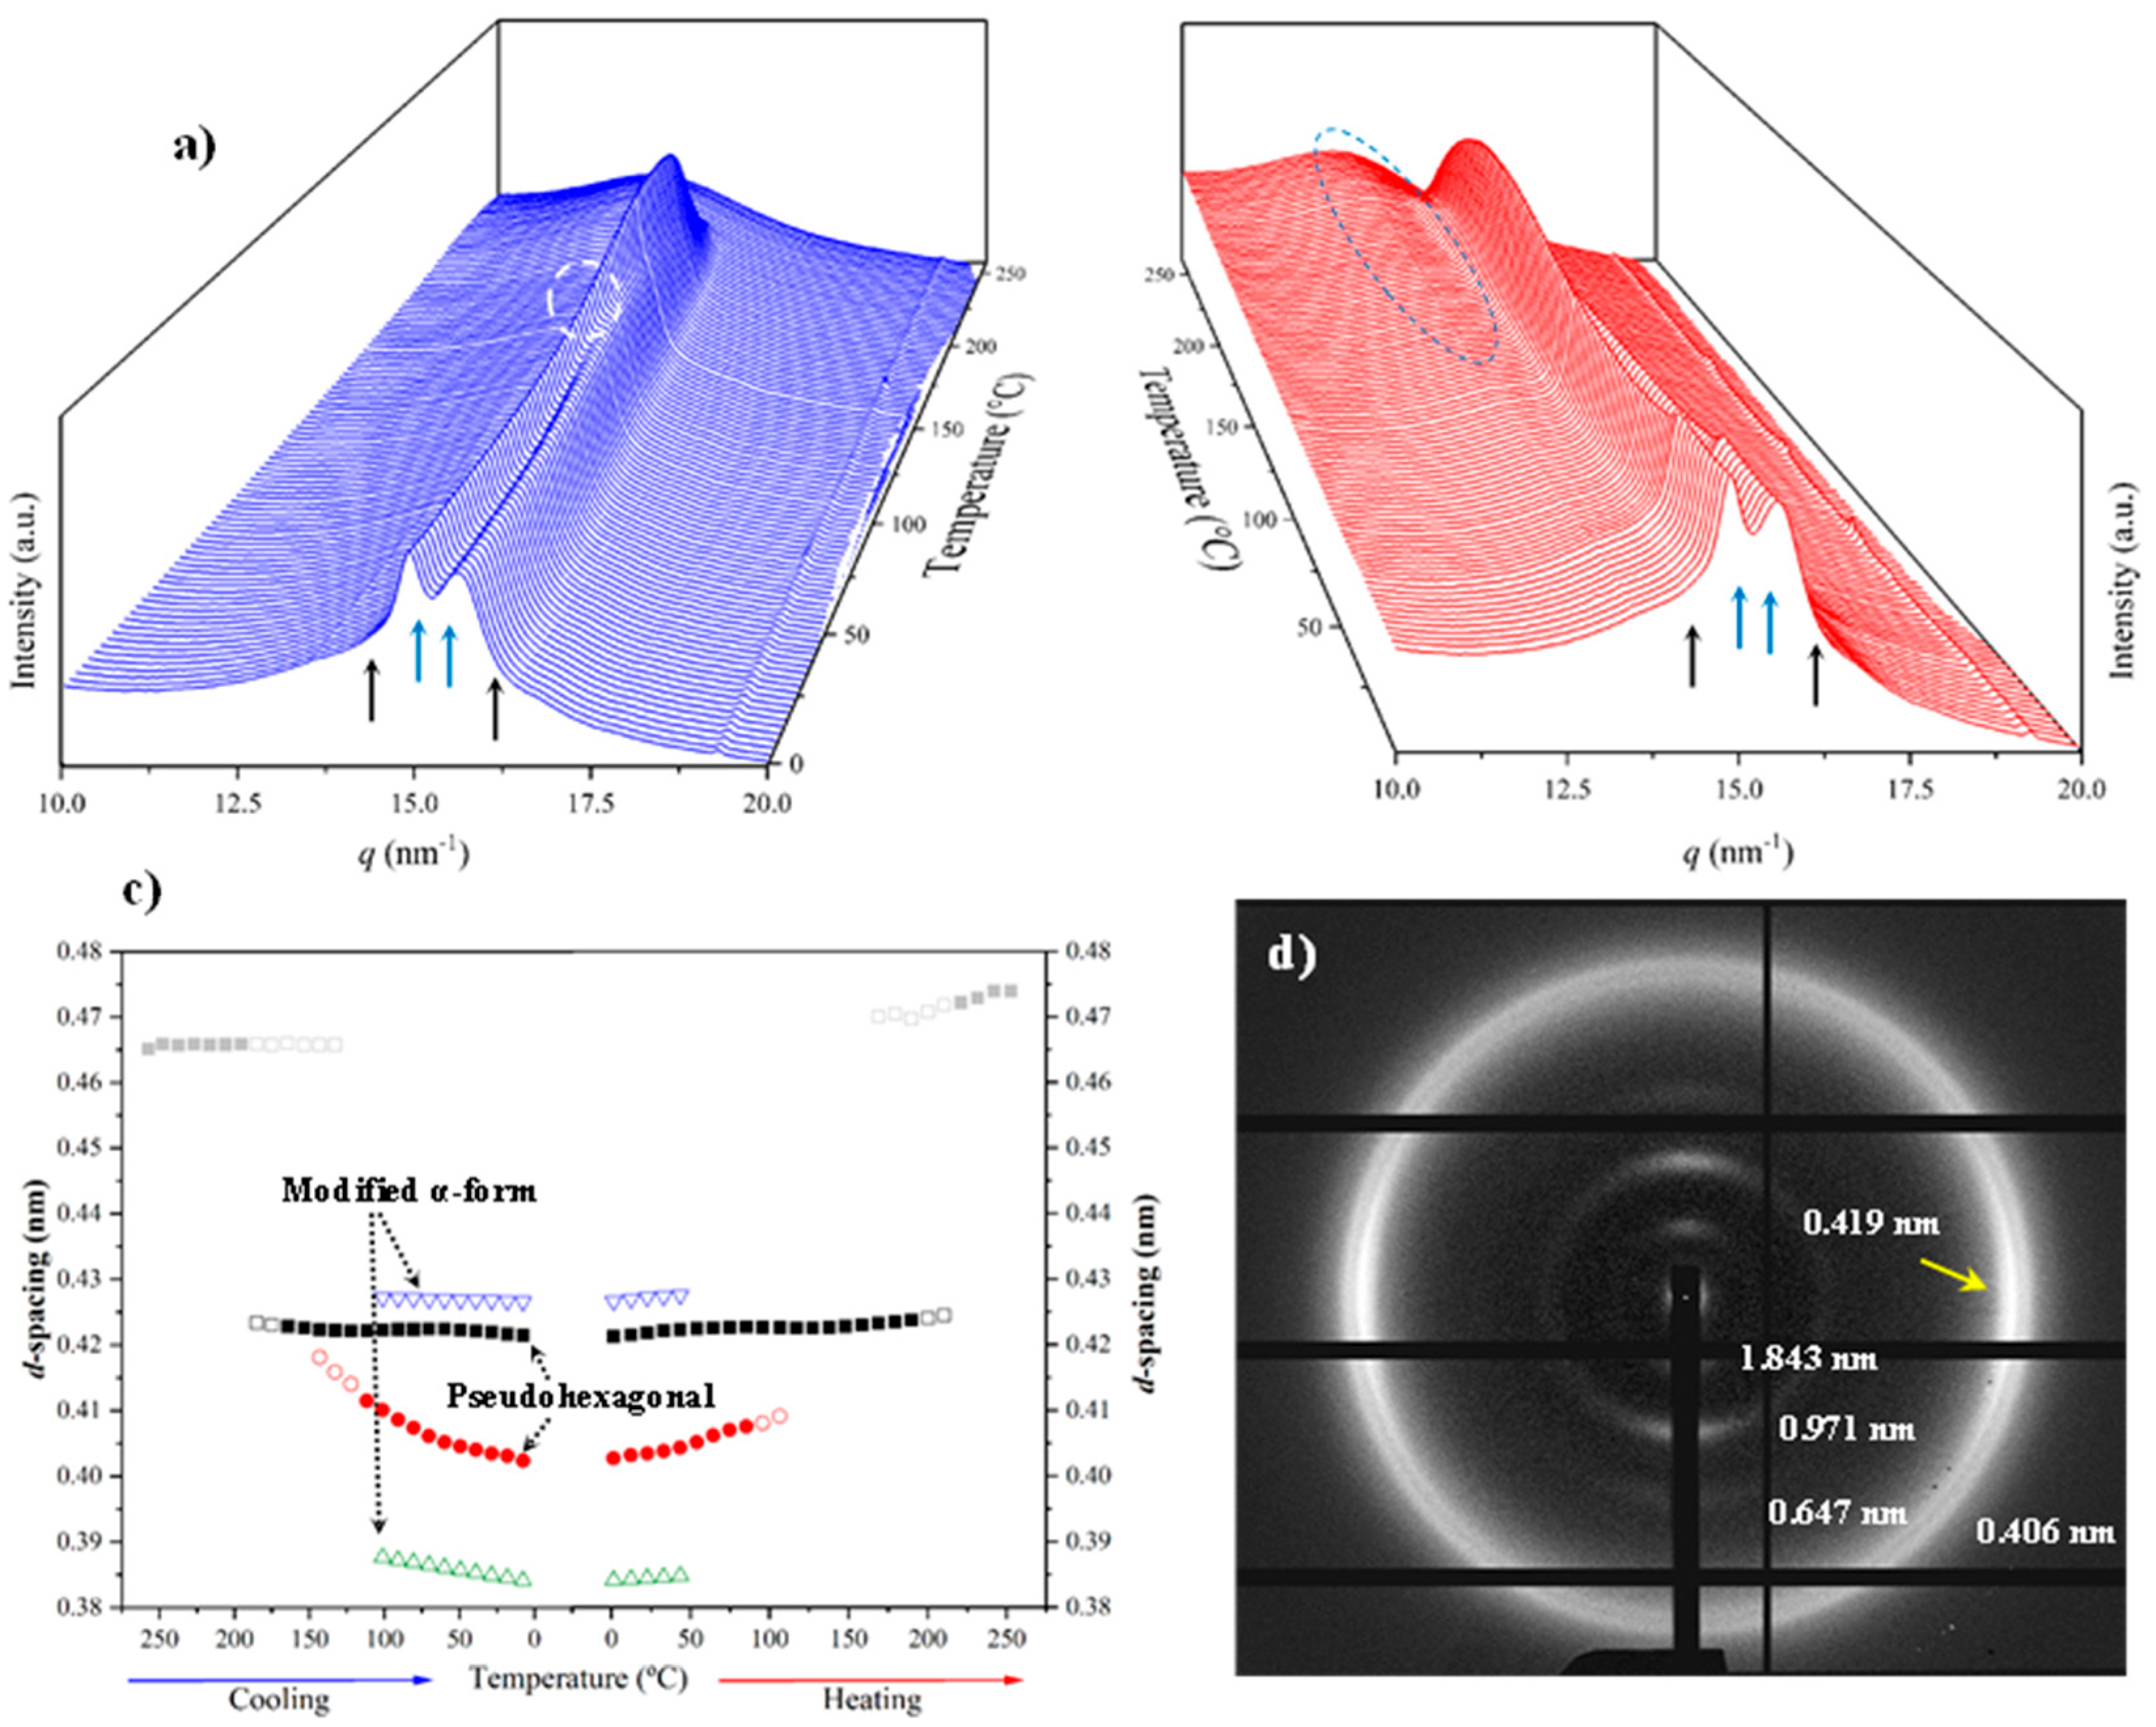
Figure 14.
3D dimensional plots showing the continuous evolution of X-ray diffraction profiles of nylon 10.7 taken during first heating (a) and cooling (b) runs (10 °C/min), respectively. See text for the labelling of reflections and profiles.
Figure 14.
3D dimensional plots showing the continuous evolution of X-ray diffraction profiles of nylon 10.7 taken during first heating (a) and cooling (b) runs (10 °C/min), respectively. See text for the labelling of reflections and profiles.
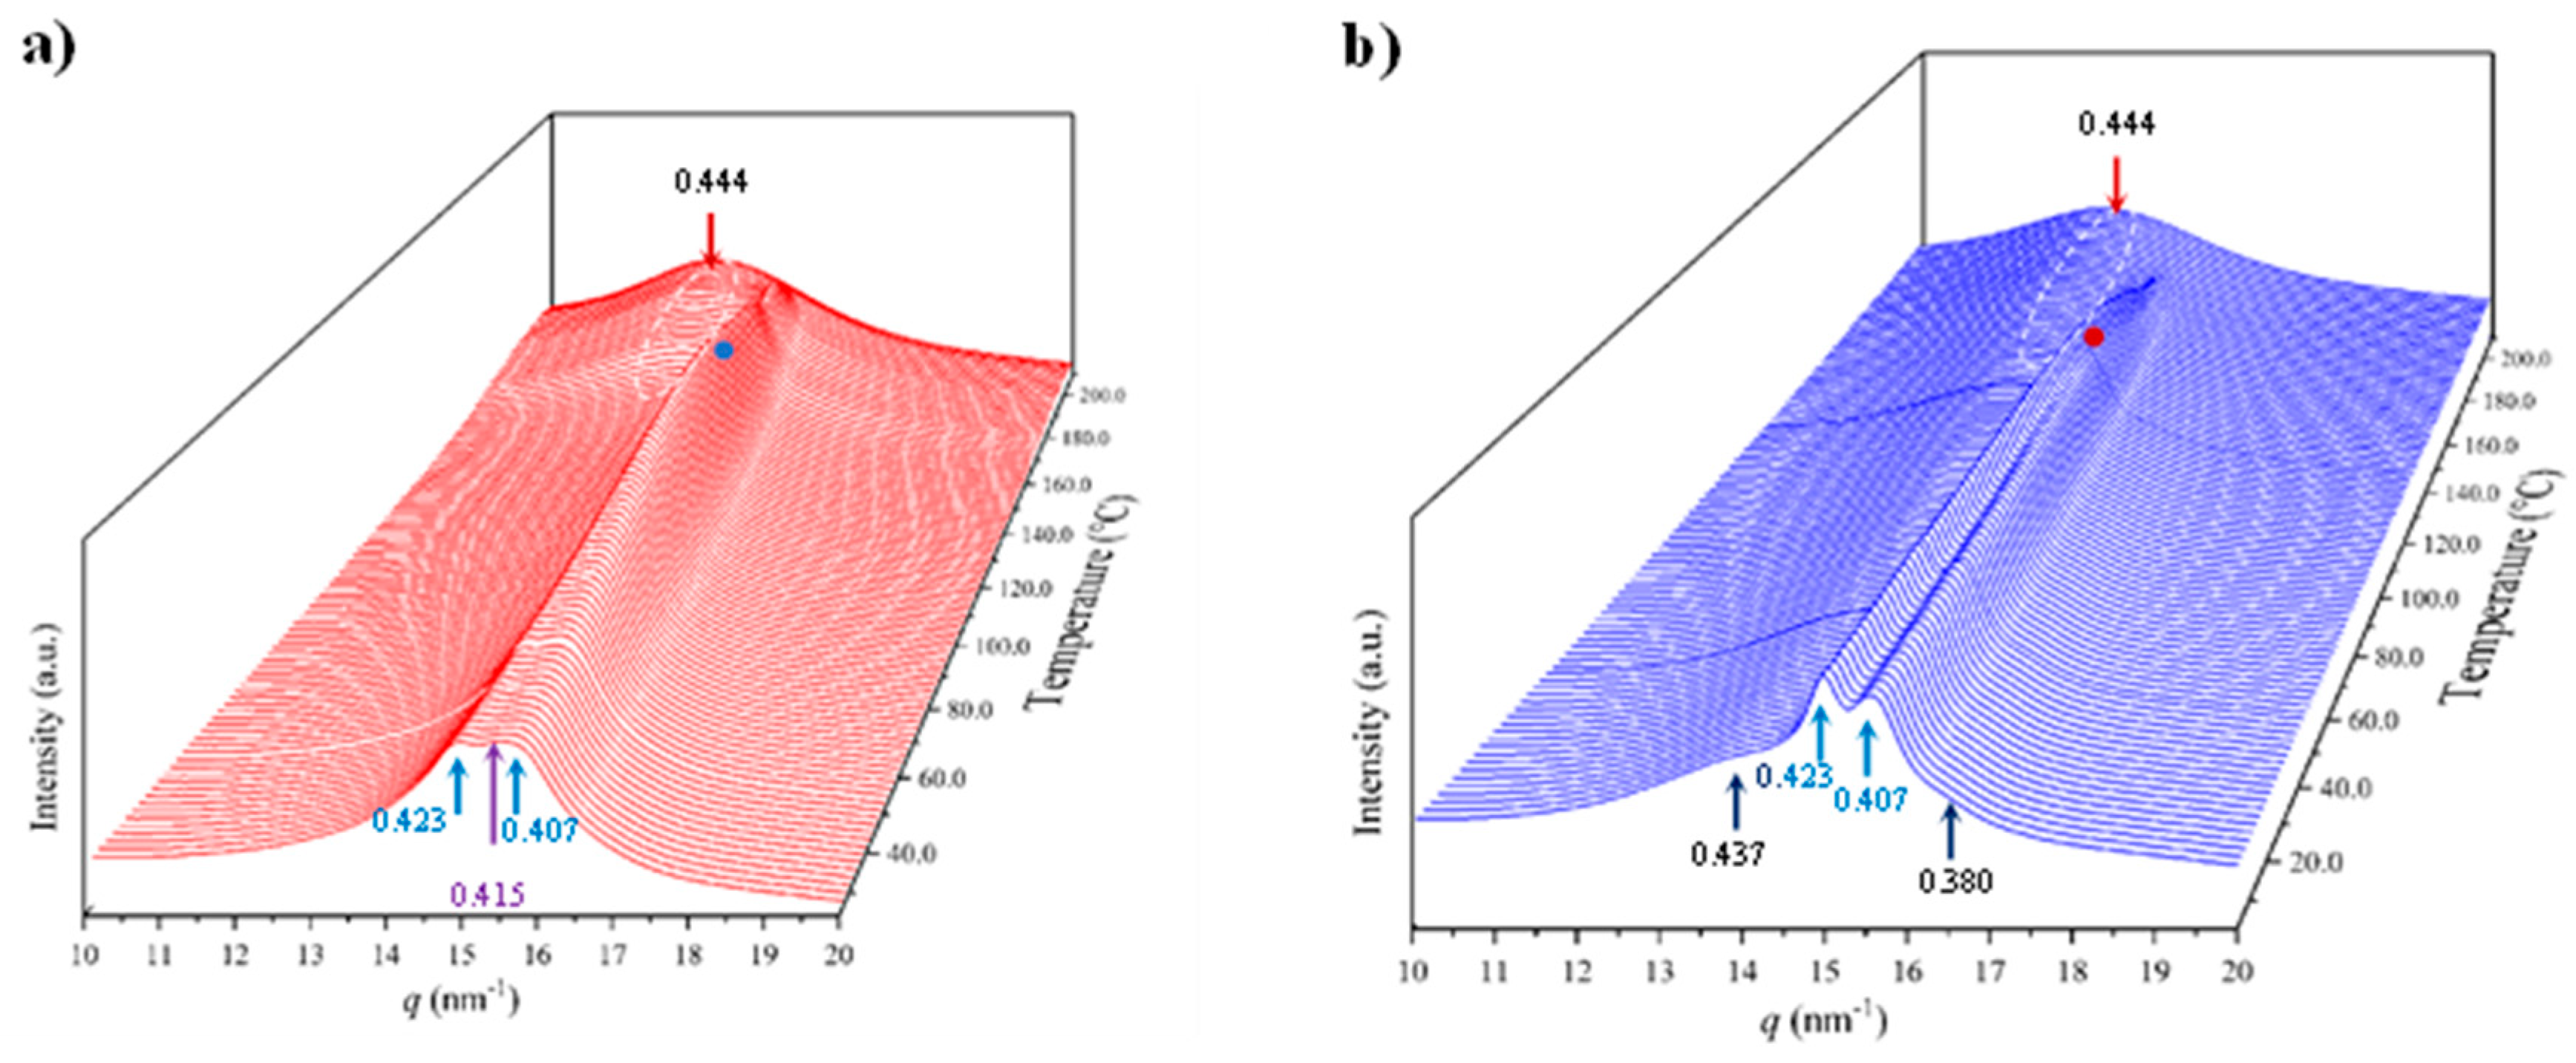
Figure 15.
X-ray diffraction pattern of a nylon 10.7 fiber obtained from the melt with labelling of the main reflections. Inset shows the diffraction patters obtained from the isomeric nylon 7.10.
Figure 15.
X-ray diffraction pattern of a nylon 10.7 fiber obtained from the melt with labelling of the main reflections. Inset shows the diffraction patters obtained from the isomeric nylon 7.10.
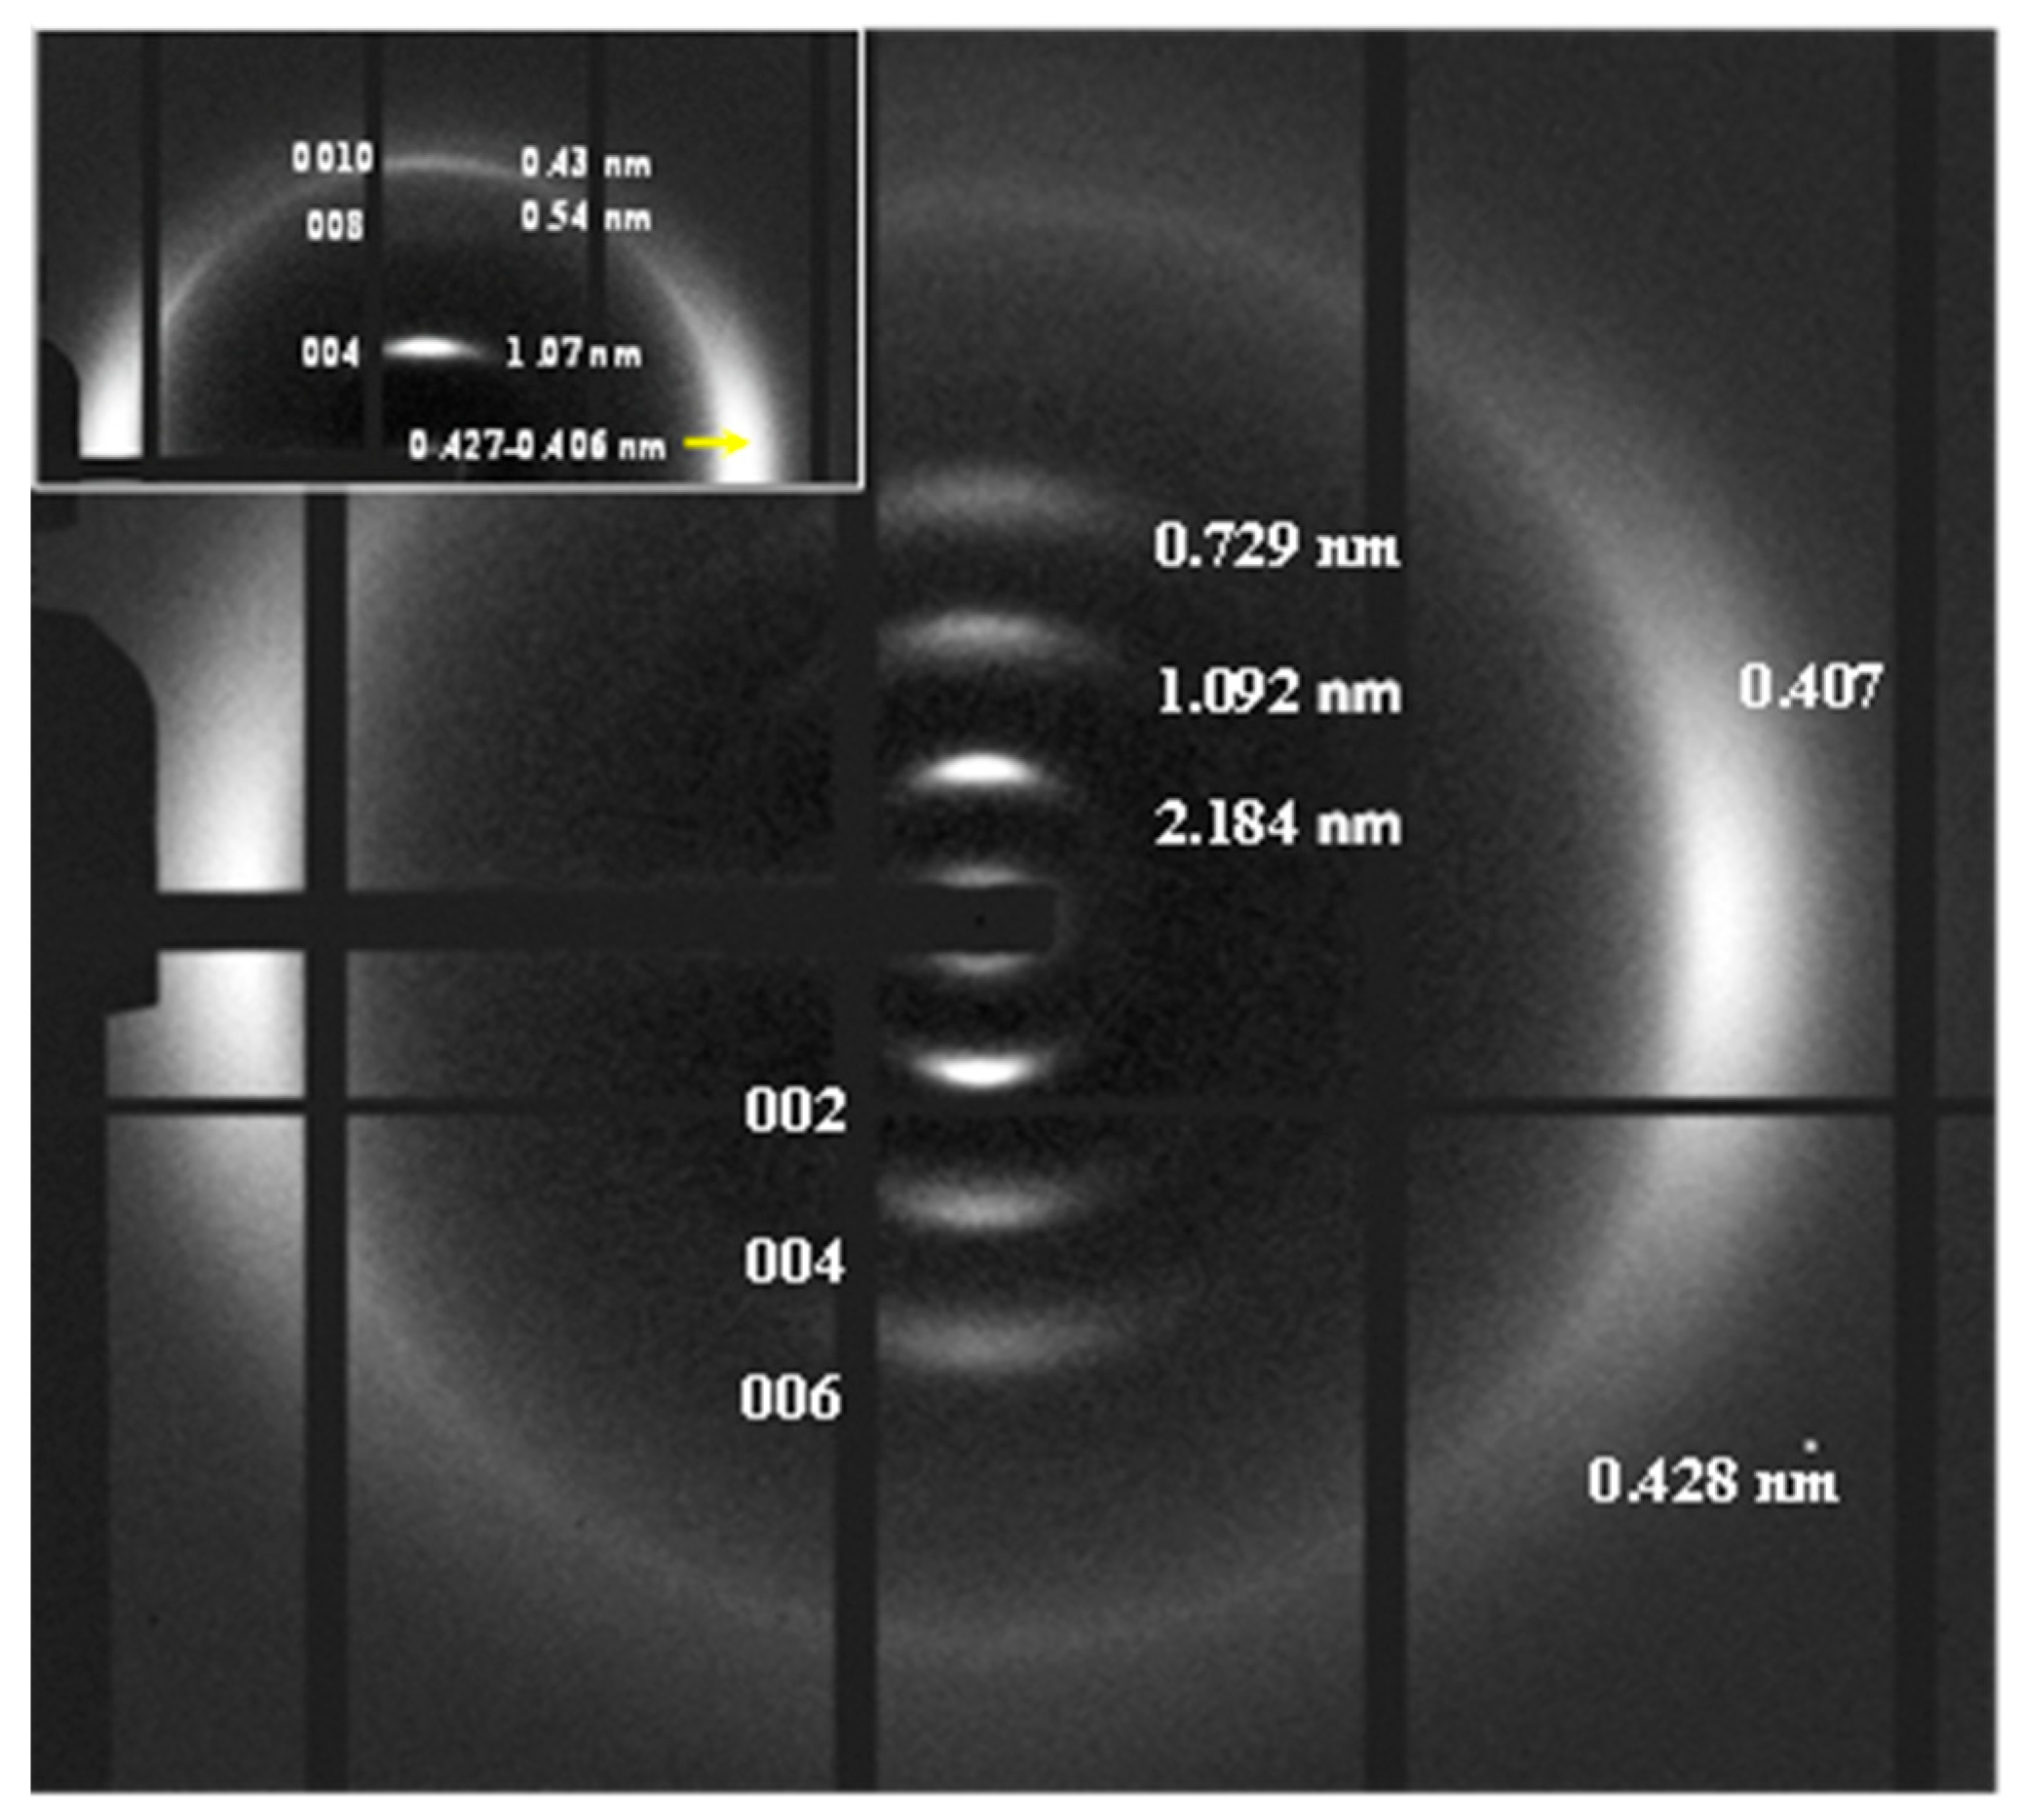

Table 1.
Table 1. Synthesis data of studied nylons.
| Sample | Yield (%) a | Mw (g/mol) a | PDI a | Mw (g/mol) b | PDI b |
|---|---|---|---|---|---|
| Nylon 6.7 | 70 | 22,500 | 4.20 | 27,500 | 2.15 |
| Nylon 8.7 | 67 | 26,100 | 3.70 | 28,100 | 1.65 |
| Nylon 10.7 | 75 | 29,000 | 3.90 | 35,000 | 1.84 |
a Data from the polymer directly recovered from synthesis. b Data for the first polymer fraction.
Table 2.
Chemical shifts, multiplicity and relative intensities of proton signals in the recorded spectra of nylons 6.7, 8.7, and 10.7.
Table 2.
Chemical shifts, multiplicity and relative intensities of proton signals in the recorded spectra of nylons 6.7, 8.7, and 10.7.
| Peak | δ (ppm) a | Integral | Assignation | Multiplicity |
|---|---|---|---|---|
| a | 3.51, 3.53, 3.55 | 4H, 4H, 4H | CH2-NH- | t |
| b | 2.69, 2.73, 2.74 | 4H, 4H, 4H | CH2-CO- | t |
| c | 1.82, 1.84, 1.83 | 4H, 4H, 4H | CH2CH2-NH- | m |
| d | 1.70, 1.70, 1.70 | 4H, 4H, 4H | CH2CH2-CO- | m |
| e | 1.51, 1.54, 1.54 | 2H, 2H, 2H | CH2(CH2)2-CO- | m |
| f | 1.44, 1.39, 1.36 | 4H, 8H, 12H | Rest of methylene protons in diamine unit | m |
a From left to right: nylon 6.7, 8.7 and 10.7.
Table 3.
Main calorimetric properties determined from the different DSC scans performed with the synthesized nylons. a.
Table 3.
Main calorimetric properties determined from the different DSC scans performed with the synthesized nylons. a.
| Sample | 1st Heating | Cooling | 2nd Heating | 3rd Heating | ||||||
|---|---|---|---|---|---|---|---|---|---|---|
| Tf (°C) | ΔHf (J/g) | Tc (°C) | ΔHc(J/g) | Tg (°C) | Tf (°C) | ΔHf (J/g) | Tg (°C) | Tf (°C) | ΔHf (J/g) | |
| N. 4.7 b | 214, 227, 244 | 96 | 214 | 77 | -e | 227, 244 | 77 | 56 | 228, 243 | 71 |
| N. 6.7 | 190, 222 | 71 | 190 c | 66 | 57 | 213, 222 | 66 | 56 | 183 c, 222 | 66 |
| N. 8.7 | 154, 207 | 66 | 177 c | 60 | 46 | 208d | 60 | 46 | 182, 207 | 61 |
| N. 10.7 | 170, 191 d | 62 | 159 c | 55 | 30 | 177, 193 | 57 | 34 | 174, 193 | 54 |
a Main melting peaks are indicated in bold. b Data for nylon 4.7 are provided in [27]. c,d Presence of a broad exotherm or endotherm peak, respectively. e Data not provided.
Table 4.
TGA degradation data for nylons 6.7, 8.7 and 10.7.
| Sample | T Onset (°C) | T Max (°C) | 1st Step (%) | Last Step (% and °C) |
|---|---|---|---|---|
| Nylon 6.7 | 410 | 447 | 5 | n.p. |
| Nylon 8.7 | 427 | 465 | 1 | 4.7, 539 |
| Nylon 10.7 | 421 | 467 | 5 | 6.6, 510 |
Disclaimer/Publisher’s Note: The statements, opinions and data contained in all publications are solely those of the individual author(s) and contributor(s) and not of MDPI and/or the editor(s). MDPI and/or the editor(s) disclaim responsibility for any injury to people or property resulting from any ideas, methods, instructions or products referred to in the content. |
© 2025 by the authors. Licensee MDPI, Basel, Switzerland. This article is an open access article distributed under the terms and conditions of the Creative Commons Attribution (CC BY) license (http://creativecommons.org/licenses/by/4.0/).
Copyright: This open access article is published under a Creative Commons CC BY 4.0 license, which permit the free download, distribution, and reuse, provided that the author and preprint are cited in any reuse.


