
Submitted:
13 April 2025
Posted:
15 April 2025
You are already at the latest version
Abstract
Expanding the WBE footprint to include low-resource settings where small, informal, and ad-hoc wastewater systems and high burdens of disease are co-located requires resource-efficient and adaptable methods. To that end, we deployed passive samplers made of granular activated carbon (GAC) into raw influent at a small wastewater treatment plant continuously over 90 days. Detections of SARS-CoV-2 RNA, respiratory syncytial virus RNA, and human adenovirus DNA on GAC passive samplers were coincident with regional clinical trends during a low-incidence period. GAC also recovered bacterial DNA, including mapA, a gene associated with Campylobacter jejuni. A set of antibiotic resistance genes – tetW, blaTEM, blaCTX – were also quantified from GAC passive samplers and did not show increased relative abundance over exposure durations up to 168 hours. Sequencing of 16S rRNA amplicons indicated the GAC samplers recovered bacterial families abundant in both wastewater and feces. Over 38 deployments up to 168 hours long, the average uptake rate decayed exponentially with exposure duration for 16S rRNA (R2 = 0.972), pepper mild mottle virus (R2 = 0.882), and human adenovirus (R2 = 0.585). GAC passive samplers may afford a resource-efficient approach to producing quantitative data for a wide variety of infectious agents relevant to WBE.
Keywords:
passive sampling
; granular activated carbon
; wastewater-based epidemiology
; viruses
; bacteria
; 16S rRNA
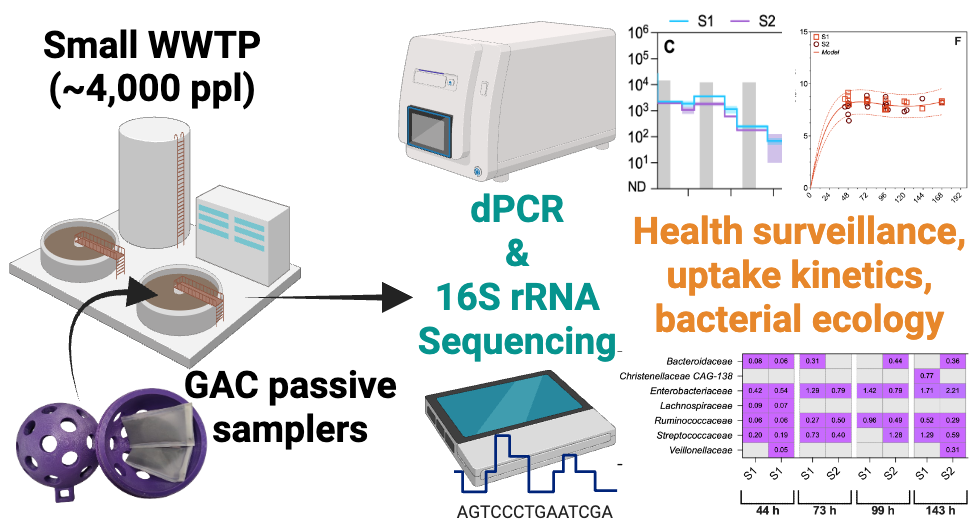
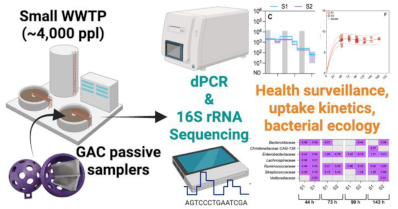
Synopsis: Wastewater surveillance remains dependent on resource-intensive sampling methods. This study finds that in situ GAC passive samplers recovered a variety of public-health-relevant viruses and bacteria with predictive uptake performance.
TOC Graphic:
1. Introduction
In response to the COVID-19 pandemic, wastewater-based epidemiology (WBE) was widely and successfully implemented to assess population-level trends of SARS-CoV-2 infection across a variety of settings[1,2]. The widespread uptake, development, and validation of WBE methods, particularly for a non-enteric pathogen, has now spurred applications of WBE for other infectious agents, such as respiratory syncytial virus (RSV)[3], avian influenza[4], Mpox[5], Candida auris[6], arboviruses[7], and other pathogens with pandemic potential[8]. A myriad of recent experiences have firmly established the technical feasibility and relevance of wastewater as a surveillance matrix for a variety of infectious agents[9,10,11]. However, the resource demands of WBE have, so far, produced programs that are more likely to be located in high-income countries[12] and in urban settings[9].
To maximize value for global health, WBE must be suitable for use in resource-limited settings where access to healthcare is limited and burdens of infectious diseases are high. Such health disparities are often co-located with sewer infrastructure that is smaller scale, decentralized, informal, or non-existent, and more likely to be in poor condition[13,14]. The challenges of working in these settings have precluded sustained WBE efforts. For example, in the United States (U.S.), the National Wastewater Surveillance System (NWSS), has primarily focused on larger wastewater treatment plants (WWTPs)[15]. As of December 2024, NWSS includes only 5.4% of the U.S. population (1.8 of 33.3 million) served by “small” WWTPs (flow < 1 million gallons per day, MGD) compared to 55.3% of the population (165.2 of 298.8 million) served by “medium” and “large” WWTPs (flow > 1 MGD). Thus, in the U.S., persons served by a small WWTP are roughly 10 times less likely to be included in NWSS. This under-representation also extends to communities with higher vulnerability per the social vulnerability index (SVI)[15,16]. Notably, WBE programs among more vulnerable communities have found the approach manifested sub-population trends relevant to vulnerability status[17,18]. Although research in resource-limited settings has lagged, equity and sound public health strategy require further development to achieve resource-efficient WBE in less-sewered communities[11,19,20].
Sustained WBE in less-sewered settings requires sampling methods simultaneously adaptable to diverse infrastructure configurations and resource limitations. In applications for SARS-CoV-2, passive sampling has demonstrated strong potential as a versatile and resource-efficient sampling method for wastewater surveillance of microbial analytes, especially compared to grab sampling[21]. In certain settings, passive samplers have proven to be more sensitive than grab and composite sampling[22] and have captured shifts in SARS-CoV-2 variants among the population[23]. For non-targeted analysis via metagenomic sequencing, passive samplers have also produced bacterial abundance patterns comparable to composite sampling[24].
Among the materials tested for passive sampling, granular activated carbon (GAC) has shown strong potential for recovery of microorganisms from wastewater and surface water. Hayes and colleagues found sorption of SARS-CoV-2, pepper mild mottle virus (PMMoV), and CrAssphage onto GAC followed pseudo-second-order (PSO) kinetics during bench-scale batch experiments and suggested wastewater deployments up to 4 days in length would be feasible[25]. During deployments to sewers serving smaller populations, GAC passive samplers sorbed influenza A (infA), RSV-A, and SARS-CoV-2, suggesting applicability to a variety of viruses[26]. This has been further substantiated by the recovery of adenovirus (HAdV), RSV, norovirus, enterovirus, infA, SARS-CoV-2, and rotavirus during sampling of a freshwater lake with GAC passive samplers[27]. GAC passive samplers also enabled the early detection of the SARS-CoV-2 Omicron variant in wastewater from university dormitories before clinical observation in Halifax, Canada[28].
While passive sampling techniques and paradigms for monitoring chemical pollutants in water are well established[29], the application of such techniques to microorganisms remains more limited. For example, in NWSS, only 50 samples have been collected by passive sampling compared to 1,308 grab samples and 9,607 composite samples[15]. The limited use of passive samplers likely reflects the limited understanding of their sorption kinetics and the resulting uncertainties for producing reliable data, especially during in situ deployments where the performance must also be resilient to inherent variability in the microbiological workflow[30]. In view of this gap, we deployed GAC passive samplers into raw influent at a small WWTP in the state of Louisiana, U.S.A. We aim to inform the development of passive samplers as a potential method to improve the representation of small WWTPs in WBE efforts[10]. We hypothesized that GAC passive samplers would recover a diverse set of microbial analytes relevant to NWSS (adenovirus, RSV, influenza, SARS-CoV-2, Campylobacter jejuni, and antibiotic resistance genes)[15], produce signals pertinent to clinical surveillance (when and where available), and achieve bacterial sample compositions reflective of domestic wastewater with predictable kinetic performance.
2. Materials and Methods
2.1. Study Site & Passive Sampling Method
The current study was performed at a small WWTP in Louisiana, U.S.A. The WWTP serves approximately 4,500 residents with a design flow of 0.8 MGD and an average influent flow of 0.48 MGD in 2023. Passive samplers were deployed into the raw influent just upstream of two inclined static screens (S1 and S2) in parallel from 17 May 2023 to 15 August 2023 such that two samplers were continuously exposed to the raw influent in 19 discrete sampling events ranging from 44 to 503 hours in duration.
Each passive sampler consisted of a 3D printed acrylonitrile butadiene styrene (ABS) housing containing two granular activated carbon (GAC) “packets” (Filtrasorb 200, Calgon Carbon Corp., Moon Township, PA, USA)[25,31]. For each GAC packet, 3 g of washed GAC was aseptically transferred into a 25 µm 2.5-inch by 4.5-inch nylon filter bag (The Press Club, USA) and heat sealed (PFS-200 Impulse Sealer, Walfront, Wuhan City, Hubei Province, CN) such that the GAC mass was loosely confined within a volume roughly 1/3 of the total filter bag volume. After fabrication, 4 GAC packets were placed into a sterile Whirl-Pak bag (Nasco, Pleasant Prairie, WI, USA) for transport to the sampling site. Upon arrival at the WWTP, two GAC packets and a sterile lead fishing weight were loaded into each ABS housing, and the passive sampler was tethered to a handrail so that it was fully submerged in the raw influent. Following the exposure period, each passive sampler was retrieved from the raw influent and aseptically transferred into a sterile Whirl-Pak bag, and fresh ones were deployed in their place. The retrieved GAC packets were transported to the lab on ice in a cooler (~1.5 h) and then immediately frozen at -80°C.
2.2. Passive Sampler Elution & Total Nucleic Acid Extraction
The 19 GAC packets from a single screen over the sampling period were thawed at 4°C, eluted, and extracted as a single batch with the addition of 1 GAC blank per batch (negative extraction control, NEC). In total, two 20-sample extraction batches were completed – one for S1 and one for S2. For elution, each 3 g GAC packet was cut open, and the GAC was dumped into a clean 50 mL centrifuge tube with the filter bag placed on top. Sorbed materials were eluted from the GAC and filter bag by adding 40 mL of 0.075% Tween20, 0.25 mM Tris-HCl solution[25], gently hand mixing for 2 minutes, followed by 2 minutes of gravitational settling. Immediately prior to hand mixing and settling, bovine coronavirus (BCoV) in the form of 40 µL of resuspended Calf-Guard Vaccine (Zoetis, Parsippany, NJ, USA) was seeded into each 50 mL centrifuge tube as a process control. After settling, the supernatant (~35 mL) was transferred into a new 50 mL centrifuge tube, taking care to avoid transferring any GAC. Total nucleic acids were extracted from each 35 mL eluate using a Wizard Enviro Total Nucleic Acid Kit (A2991, Promega Corp., Madison, WI, USA) per the manufacturer’s standard protocol for capture, concentration, and clean-up. Total nucleic acids were eluted in 100 µL of pre-heated nuclease-free water and stored at -80°C.
2.3. Digital PCR
Molecular targets associated with viruses and bacteria were measured in purified total nucleic acids via dPCR performed on a QIAcuity One 5plex dPCR System (Qiagen, Hilden, Germany). Gene targets, primer and probe sequences, reaction concentrations, and thermal cycling conditions for each dPCR/RT-dPCR assay used are summarized in Table S1. The dPCR experiments are reported to the digital MIQE standards, including the dMIQE checklist (Table S2)[32]. All dPCR experiments included a no-template control (NTC), NEC, and positive controls with all sample reactions run in duplicate. For each target, dPCR quantitative results (gene copies (GC) per passive sampler) were calculated per Table S3. RNA associated with RSV, PMMoV, SARS-CoV-2, InfA, InfB, and BCoV was measured via reverse transcription (RT) dPCR using the QIAcuity One-Step (OS) Advanced Probe Kit (Qiagen) with the Influenza and SARS-CoV-2 Multiplexed Assay (Cat No. 100305, GT Molecular, Fort Collins, CO, USA) and the RSV Assay Kit v2.0 (Cat No. 100360, GT Molecular). RT-dPCR reactions were prepared per GT Molecular’s protocols as detailed in the Supporting Information. After preparation, the reaction mixture (40 µL) was transferred into a QIAcuity 26k 24-well Nanoplate (Qiagen), loaded into the QIAcuity One, thermal cycled, imaged, and the results interpreted per GT Molecular’s protocols.
Antibiotic resistance genes (ARGs) associated with tetracycline resistance (tetW), beta-lactam resistance (blaCTX, blaTEM), and a mobile genetic element (class 1 integrase, intl1) were measured in two duplex reactions (intl1/tetW; blaCTX/blaTEM) using a QIAcuity Probe PCR Kit (Qiagen) with a blaCTX;blaTEM Assay Kit (Cat No. 100569, GT Molecular) and a intl1;tetW Assay Kit (Cat No. 100549, GT Molecular) following GT Molecular’s protocols as detailed in the Supporting Information. The reaction mixture was transferred into a Nanoplate and the experiment performed on the QIAcuity One as previously described.
DNA targets associated with HAdV (hexon[33]), Campylobacter jejuni (mapA[34]), and bacterial 16S rRNA[35] were measured using previously published qPCR assays adapted to dPCR. Reaction compositions were as detailed in the Supporting Information. During all dPCR experiments, thresholds were manually set based on the separation between the positive and negative partitions in positive and negative control reactions using the onboard software. Quantitative results were then exported in .csv file format for further analysis.
2.4. 16S rRNA Sequencing and Bioinformatics
The bacterial community recovered from 10 GAC packets exposed for durations from 44 to 503 h was characterized by 16S rRNA amplicon sequencing on a MinION Mk1C (Oxford Nanopore Technologies, Oxford, UK) by multiplexing on a single Flow Cell (R10.4.1, Oxford Nanopore Technologies) using the Rapid sequencing DNA-PCR Barcoding Kit 24 V14 (SQK-RPB114.24, Oxford Nanopore Technologies). Eight unique barcodes were assigned to purified DNA extracts from GAC packet pairs (Table S6). The remaining two barcodes were assigned to two technical replicates of a DNA extract derived from a single GAC packet. Prior to library preparation, DNA quality (A260/A280) and quantity were measured by spectrophotometry and fluorometry on a DS-11 FX (DeNovix Inc., Wilmington, DE, USA) per the manufacturer’s DS-11 User Guide for “Microvolume Measurements,” and using the standard protocol for the dsDNA Broad Range Assay (DeNovix Inc.). Library preparation and sequencing were performed per the Oxford Nanopore protocol (version: 16S_9199_v114_revA_06Dec2023). For full-length 16S rRNA amplification (27F and 1492R, ~1.5 kb amplicon), 10 ng of input DNA from each sample was combined with the appropriate barcode and LongAmp Hot Start Taq 2X Master Mix (M0533S, New England Biolabs, Ipswich, MA, USA) and then thermal cycled on a mini16 thermal cycler (miniPCR Bio, Cambridge, MA, USA). Following amplification, each barcoded sample was again quantified by fluorometry on the DS-11 FX, pooled in equimolar ratios, and then purified using AMPure XP Beads. Immediately following purification, rapid sequencing adapters were ligated, the flow cell was primed, and the library was loaded for a 72 h sequencing run. After the initial sequencing run, base calling was performed using the high-accuracy model with demultiplexing, adapter, and primer trimming performed onboard the MinION Mk1C using Guppy v 7.1.4 and MinKnow v 23.07.12. Raw reads assigned to each barcode were filtered based on length (1,200 - 2,000 bp) and Q score of 13 (95% accuracy) using chopper v 0.8.0[36]. The filtered reads were imported into QIIME2 v 2024.5[37], sequences were dereplicated, and operational taxonomic units (OTUs) were clustered at 97% sequence identity using QIIME2’s built-in vsearch commands. OTUs were then classified using the Greengeens2 v 2022.10 full-length sequences classifier, and the top 20 bacterial families by relative abundance for each barcode were generated. The Shannon entropy, H , was calculated for each sample using family-level OTU assignments with singletons removed and rarefaction to achieve an even sampling depth[38]. Evenness (E) was calculated by dividing the Shannon entropy by the natural log of the sample richness. The pair-wise beta diversity was calculated using the Bray-Curtis dissimilarity index[39].
2.5. Clinical Surveillance Data
Weekly COVID-19 test positivity data for the study period were obtained for the pertinent region from the Louisiana Department of Health (LDH). For RSV positivity, the 3-week rolling average for the state of Louisiana over the relevant period was downloaded from the U.S. CDC National Respiratory and Enteric Virus Surveillance System (NREVSS) via the RSV State Trends site, which is now archived (https://archive.cdc.gov/www_cdc_gov/surveillance/nrevss/rsv/state.html). Weekly respiratory sample positivity for adenovirus in HHS Region 6, which includes Louisiana, was obtained from the current version of the NREVSS Dashboard (https://www.cdc.gov/nrevss/php/dashboard/index.html).
2.6. Data Analyses & Availability
Except where noted otherwise, all figures and statistical analyses were created in GraphPad Prism 10 for macOS Version 10.3.1, August 21, 2024 (GraphPad Software Inc., San Diego, CA, USA). Correlations between quantitative data were assessed by means of the Spearman rank correlation coefficient (ρ) except in the case of dPCR technical replicates, which were assessed via the Pearson correlation (r). Quantitative comparisons between two data sets at various replication levels were made using Mann-Whitney U tests. Non-linear least squares regression was used to assess the average uptake rate over each passive sampler deployment as a function of exposure duration (t). Raw DNA sequence data have been made available through the Sequence Read Archive (SRA) of the National Center for Biotechnology Information (NCBI) (https://submit.ncbi.nlm.nih.gov/subs/sra/). A database of sample metadata, dPCR quantitative data, and nucleic acid quantity and quality information is available via the Open Science Framework at https://osf.io/kn3b5/.
3. Results & Discussion
3.1. dPCR QA/QC
During the dPCR experiments, all NTCs and NECs were negative, and all positive controls were positive for their respective analytes by dPCR (example dPCR reactions are provided in Table S4). The effective sample volume achieved by the workflow ranged from 0.8 to 3.2 mL of GAC eluate, which is equivalent to 60 to 240 mg of GAC. As shown in Table S5, the mean number of partitions for each assay across all experiments was greater than 25,000 with standard deviations less than 1,300. Technical replicates of high abundance targets exhibited strong linear correlation for quantification of both DNA and RNA templates: BCoV (r = 0.998, p < 0.0001); HAdV (r = 0.998 p < 0.0001); 16S rRNA (r = 0.997, p < 0.001). The BCoV process control was successfully recovered from all samples with only two samples demonstrating relative recoveries less than their associated extraction blank. BCoV concentrations recovered from GAC samplers deployed upstream of S1 were significantly higher than from S2 (p < 0.0001, Mann-Whitney, Figure S2D); however, there was no correlation between BCoV relative recovery and PMMoV, HAdV, or 16S rRNA quantities at individual screens or overall (Figure S6D). Our experience reiterates the challenge associated with process controls for WBE and the need to further consider appropriate process controls and procedures for passive sampling in particular[40].
3.2. Endogenous Wastewater Viruses
PMMoV RNA was detected and quantified in all GAC-derived samples at a mean concentration of 5.26 log10 GC/sampler (95% CI: 5.06 - 5.46) and a range of 4.29 - 6.61 log10 GC/sampler (Figure S1). The maximum PMMoV concentration recovered during sampling was 1.36 x 10⁶ GC/g, which is roughly an order of magnitude greater than the equilibrium capacity observed by Hayes et al. during batch experiments[25]. Although similar concentrations were recovered from S1 and S2 overall (p = 0.1073, Mann-Whitney), they were not correlated (Figure S2A). Overall, the PMMoV results demonstrate the consistent recovery of a virus associated with human feces from wastewater at higher concentrations than previously reported for GAC passive sampling of dormitory effluent[25].
Based on RT-dPCR results, SARS-CoV-2 RNA was recovered intermittently from the GAC samplers (10 of 38) and at low abundance. Among the samplers yielding detections, the average concentration was 1.71 log10 GC/sampler (95% CI: 1.55 - 1.86). As shown in Figure 1A, SARS-CoV-2 RNA detection in wastewater was sporadic from May to mid-July when COVID-19 positivity was low (<10%). In general, COVID-19 incidence in Louisiana in early summer 2023 was at the lowest rate observed since spring 2022, followed by a late summer surge and peak in late August 2023[41]. But, when clinical positivity increased in late July and August, RNA incidence on the GAC passive samplers also increased. The low number of detections across replicates and samples precludes a more robust statistical analysis.
RSV RNA was also sporadically detected (4 of 38) in GAC passive samples over the 90-day sampling period. The RSV RNA concentration from these 4 samples ranged from 1.41 - 1.74 log10 GC/sampler. As shown in Figure 1B, the recovery of RSV RNA from the GAC passive samplers was coincident with periods of increased RSV positivity among clinical tests in Louisiana, although the clinical incidence remained low throughout the study period.
Conversely, DNA from HAdV was detected from 38 of 38 GAC passive samplers over the 90-day sampling period with an average concentration of 3.10 log10 GC/sampler (95% CI: 2.91 - 3.29). HAdV DNA concentrations recovered from GAC passive samplers upstream of S1 and S2 were strongly correlated (⍴ = 0.698, p = 0.0009, Figure S2B). The greater abundance of HAdV DNA in GAC eluate roughly agrees with the clinical trends, which show persistent HAdV positivity among clinical tests over the surveillance period (Figure 1C). Overall, for each of the viral pathogens included in the study, the trends in wastewater at a small WWTP, as observed via GAC passive sampling, corroborate the clinical situation with sporadic detections at low concentrations for viruses circulating at low levels among the population. These results suggest GAC passive samplers deployed at small WWTPs could provide insights into viral pathogen transmission at local or even regional scales.
3.3. Endogenous Wastewater Bacteria & ARGs
In addition to viruses, GAC eluates were also tested for molecular analytes associated with bacteria, including pathogenic bacteria. Bacterial 16S rRNA was detected and quantified in all 38 GAC eluates over the 90-day sampling period. The mean 16S rRNA concentration on GAC samplers was 8.48 log10 GC/sampler (95% CI: 8.34 - 8.61) and ranged from 6.93 to 9.67 log10 GC/sampler. The 16S rRNA concentrations upstream of S2 were lower than those recovered from upstream of S1 (p = 0.0076, Mann-Whitney, Figure S2C). As shown in Figure 1D, mapA, a gene associated with Campylobacter jejuni, was detected consistently in GAC eluate early in the study. During this period, the mean concentration recovered from GAC eluate was 1.57 log10 GC/sampler (95% CI: 1.47 - 1.68) with a range of 1.42 - 1.91 log10 GC/sampler. Although there is interest in Campylobacter jejuni surveillance via wastewater, there is no clinical dataset with which to compare. Together, these results indicate GAC passive samplers can recover large numbers of bacteria from wastewater streams, and that among them are pathogenic bacteria relevant to public health surveillance.
Given the recovery of large amounts of bacterial DNA, ARGs and a mobile genetic element were also measured by dPCR in GAC eluates. The class one integron intl1 was detected in all 38 samples, ranging from 5.45 to 8.70 log10 GC/sampler (Figure S3). Overall, the intl1 concentration was moderately correlated with 16S rRNA (⍴ = 0.3789, p = 0.0190, Figure S5A). As shown in Figure S4, the relative abundance of intl1 ranged from 3.09 x 10⁻³ to 2.31 x 10⁻¹. A gene conferring resistance to tetracycline, tetW, was also detected and quantified in all samples with a range of 4.85 - 8.14 log10 GC/sampler (Figure S3). The relative abundance of tetW ranged from 2.24 x 10⁻⁴ to 7.55 x 10⁻¹ (Figure S4), although the tetW concentration was not correlated with 16S rRNA (Figure S5B). As shown in Figure S3, the beta-lactamase encoding gene blaTEM was also detected in all samples at concentrations ranging from 5.67 - 7.64 log10 GC/sampler. The blaTEM relative abundance ranged from 2.64 x 10⁻³ to 1.03 x 10⁻¹ (Figure S4), and blaTEM concentrations were moderately correlated with 16S rRNA (Figure S5D). A second beta-lactamase gene, blaCTX, was detected in 34 of 38 samples at lower abundance than blaTEM (Figure S3). The concentration of blaCTX was not correlated with 16S rRNA (p = 0.6693, Figure S5C) with an average relative abundance of 4.29 x 10⁻⁵ (95% CI: 2.15 x 10⁻⁵ - 6.43 x 10⁻⁵) (Figure S4). As shown in Figure S7, we observed no temporal trend in the relative abundance of intl1, tetW, blaCTX, or blaTEM versus exposure duration.
Recent work with GAC for passive sampling has focused entirely on the recovery of viruses from wastewater[25,26] and surface water[27]. Consistent with these studies, we also recovered SARS-CoV-2 RNA, PMMoV RNA, RSV RNA, and HAdV DNA from wastewater via GAC. In this case, nucleic acid presence on GAC samplers was coincident with clinical trends even during a period of relatively low transmission. Beyond viruses, we also recovered DNA from bacteria, including Campylobacter jejuni via GAC passive sampling of wastewater. In the case of ARGs, in particular, there is growing interest in wastewater as a surveillance matrix for antimicrobial resistance[42,43]. We successfully recovered several ARGs and an MGE from wastewater at high titers using GAC. Importantly, we observed no enrichment of ARG concentrations relative to 16S rRNA over exposure durations from 44 to 163 h. Our experience suggests GAC is an adaptable material capable of recovering both DNA and RNA from a variety of microorganisms found in wastewater. Many of the targets we recovered are among the potential priority targets for NWSS, including RSV, adenovirus, Campylobacter jejuni, and tetracycline resistance genes[15].
3.4. GAC-Derived Bacterial Community Inferred by 16S rRNA
The DNA extraction, sequencing, and bioinformatics pipeline resulted in highly variable DNA yields, raw sequencing reads, and assigned reads derived from the 10 samplers (Table S6). Given the heterogeneous number of assigned reads, when assessing the alpha and beta diversities, we eliminated singleton families (i.e., only a single OTU assigned) and rarefied to 4,500 OTUs based on the sample with the lowest number of assigned OTUs (5,211). Samples S2-2A and S1-13A were removed from the diversity analysis owing to a low number of assigned reads. The Shannon index increased slightly from 1.2 to 2.5 with increasing exposure duration from 44 to 503 h (Table S7). Overall, the bacterial community derived from GAC samplers was largely comprised of several high-abundance families. Evenness also increased beyond 44 h from an average of 0.306 to an average of 0.540 for exposure durations of 99 h or longer. As shown in Table S8, Bray-Curtis dissimilarity between the bacterial families ranged from 0.139 to 0.449, suggesting a semi-consistent composition among the high-abundance families with some unique families also derived from each sampler. Bray-Curtis dissimilarity values were lowest for replicate pairs deployed upstream of screen S1 and S2 simultaneously. There were no clear temporal trends between the GAC exposure duration and the resulting similarity of the inferred bacterial community.
Given the importance of high-abundance families for the bacterial community structure, we compared the top 20 families by relative abundance between deployment locations (S1 vs S2) as a function of exposure duration (Figure 2). In the case of the 44 h exposure, purified DNA from S2 was exhausted during the dPCR analysis, so we compared technical replicates of the same DNA extract. Despite the large variation in assigned OTUs between individual samples, relative abundances at fixed exposure lengths were similar. The most abundant GAC-derived bacterial families included many previously found to be enriched in liquid wastewater compared to biofilms, such as Aeromonadaceae, Arcobacteraceae, Burkholderiaceae, Campylobacteraceae, Pseudomonadaceae, and Rhodocyclaceae[44,45]. Fecal-associated bacterial families were also well represented among the top 20 families derived from the GAC samplers, including Bacteroidaceae, Christenellaceae, Enterobacteriaceae, Lachnospiraceae, Ruminococcaceae, Streptococcaceae, and Veillonellaceae, although at low relative abundances[44]. Two bacterial families enriched in wastewater biofilms were also recovered from the GAC samplers at low abundance (Desulfovibrionaceae) and more rarely (Desulfobulbaceae)[44]. Interestingly, the relative abundance of Desulfovibrionaceae did exhibit an increasing trend with exposure duration (Figure S8).
Among the unique families recovered from the GAC samplers, more abundant and/or prevalent taxa were Anaeromusaceae, which has been previously observed in a mesophilic digester[46], and Aquaspirillaceae, which has been isolated from various freshwaters and sewage[47] . Geobacteraceae were especially abundant in the bacterial communities beyond 73 h exposure, demonstrating a strong increasing trend from the 44 h exposure (Figure S8). This family of bacteria is abundant in reductive soils where Fe(III) reduction is dominant, including wetlands, rice paddies, and freshwater sediments[48]. Other unique bacterial families with increasing abundance with exposure duration were Pseudopelobacteraceae and Saprospiraceae, which have found in wastewater systems, including activated sludge treatment trains and mesophilic anaerobic digesters[46,49].
We hypothesized that the bacterial community structure recovered from GAC samplers would change as a function of exposure duration owing to the formation of biofilm. Previous applications of GAC for both drinking water and wastewater treatment have established the presence of bacterial biofilms on GAC particles[50,51,52]. Biofilms can affect the uptake of organic compounds by passive samplers[53,54]. Although our data suggest large changes (i.e., <10-fold) in the relative abundances of Rhodocyclaceae and Geobacteraceae, both of which contain members associated with biofilm formation[55,56], we do not see evidence of temporal shifts in the relative abundances of fecal-associated or wastewater-enriched bacterial families. Admittedly, our study suffers from the large variations in the number of assigned OTUs, not to mention the many sources of potential bias in 16S rRNA-based community assessments such as DNA extraction, primer efficiency, and library preparation[57,58,59]. Nonetheless, we assert the GAC-derived bacterial community is internally consistent among samplers and highly plausible based on comparison with previous studies of bacterial communities in wastewater[44,45]. Additionally, several of the more abundant families observed, including Aeromonadaceae, Arcobacteraceae, Burkholderiaceae, Pseudomonadaceae, and Oxalobacteraceae, have also been recovered at high relative abundances during passive sampling of college dorm wastewater with Moore Swabs[24]. Our results suggest that GAC passive samplers could be a reliable method of assessing bacterial communities in wastewater and potentially other aqueous systems.
3.5. Analyte Adsorption Rate
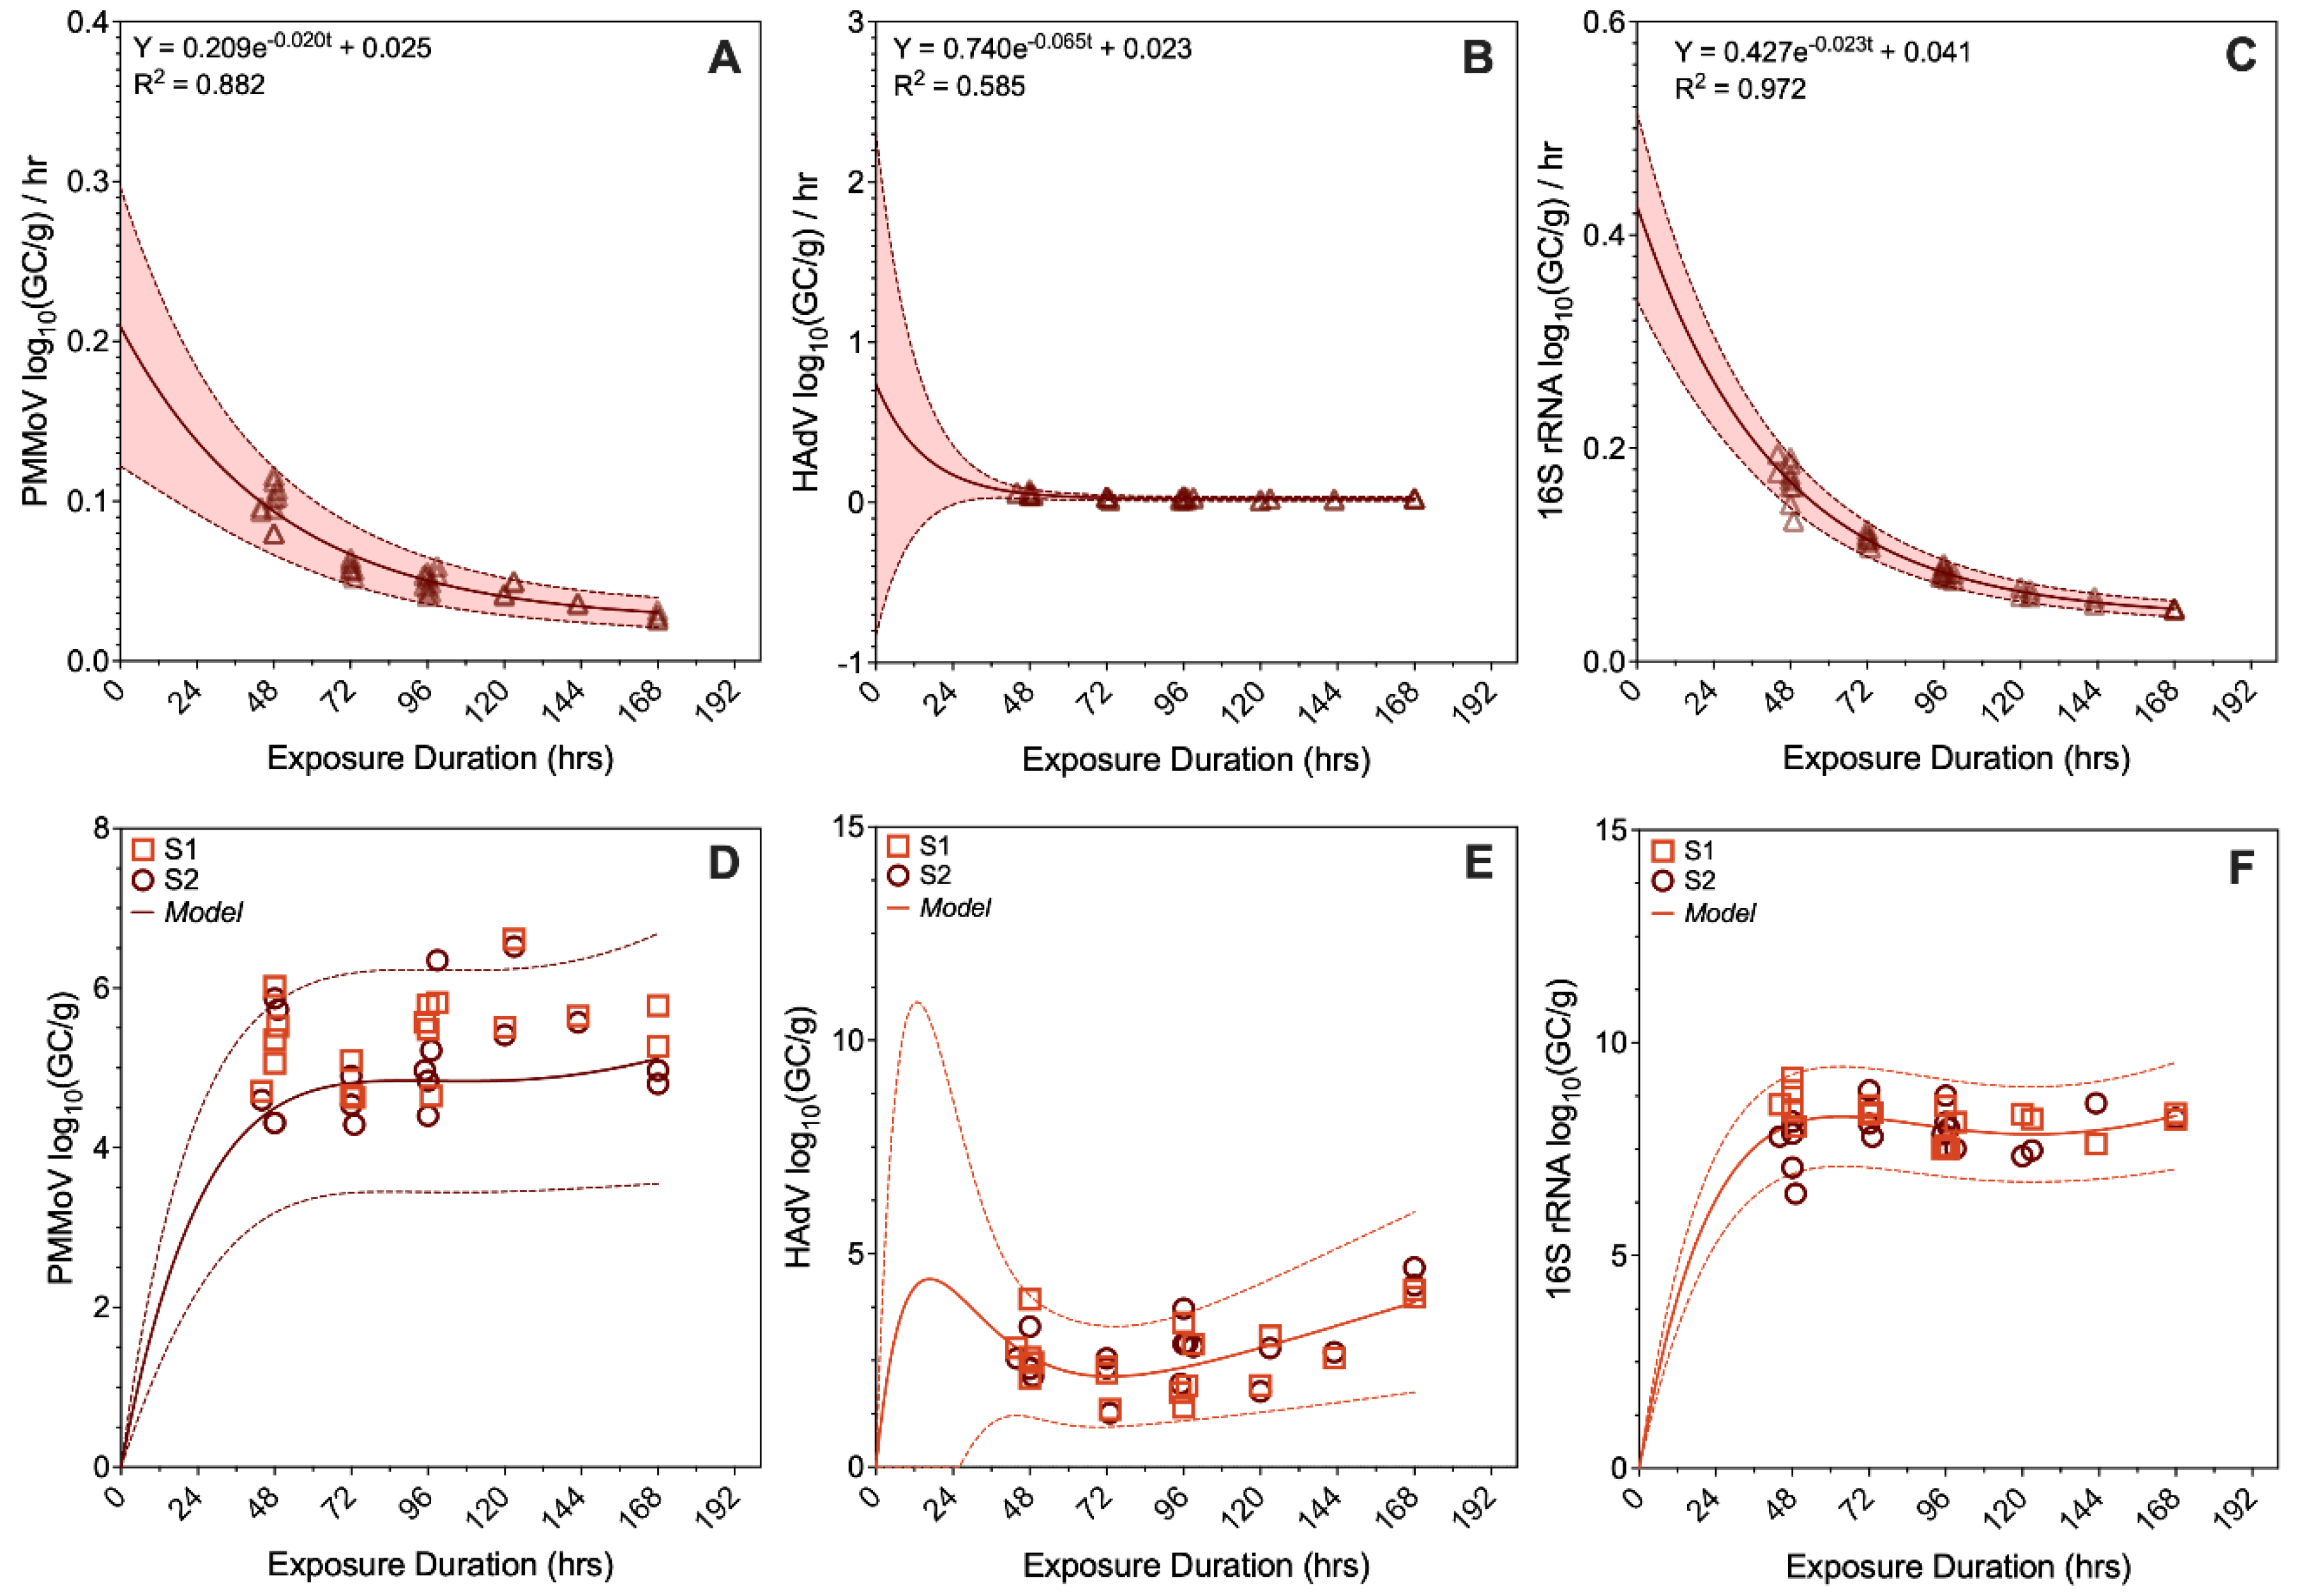
During the study, all exposure durations except one were 168 hours (7 days) or less. In one case, a breakdown of the sampling vehicle led to deployments lasting 503 hours. These samples were excluded from the adsorption rate analysis. As shown in Figure 3, the average analyte adsorption rate (log10(GC/g) h-1, Y) versus the exposure duration (hours, X) for PMMoV, HAdV, and 16S rRNA exhibited exponential decay to a plateau (Equation 1) based on non-linear least squares regression with residuals weighted to reflect heteroscedasticity in the variance as a function of time (e.g., 1/Y2 ):
where a is in the initial average adsorption rate, k is the first-order rate constant (h-1) and b is the plateau average adsorption rate as time approaches infinity. The model fit was best for 16S rRNA (R2 = 0.972, Figure 3C), which exhibited an initial average adsorption rate of 0.427 log10(GC/g) h-1 (95% CI: 0.374 - 0.511) and a plateau value of 0.041 log10(GC/g) h-1 (95% CI: 0.035 - 0.047). For PMMoV (R2 = 0.882, Figure 3A) the initial average uptake rate was 0.209 log10(GC/g) h-1 (95% CI: 0.157 - 0.316) with a plateau of 0.025 log10(GC/g) h-1 (95% CI: 0.010 - 0.034). The model fit was poorest for HAdV (R2 = 0.585, Figure 3B) due to the exposure durations all falling in the plateau region of the model creating large uncertainty in the first-order decay region (Figure 3B).
Y = a * exp (-k * t) + b
This is consistent with a greater initial average adsorption rate for HAdV (0.740 log10(GC/g) h-1) and a more rapid decay (0.065 h-1) compared to PMMoV and 16S rRNA. For each model, most of the empirical observations derived from the GAC samplers consistently fall within the 95% prediction intervals during deployments to two different inclined screens and for exposure durations ranging from 2 to 7 days (Figure 3D, E, F). Our results suggest that although the adsorption rate decreases with increasing exposure duration, the rate does not decay to zero but instead plateaus at a steady-state value that is an order of magnitude lower than the initial adsorption rate. We hypothesize this is attributable to the continued net uptake of the analyte (i.e., kadsorption > kdesorption) in additional layers as the GAC surface becomes saturated. The ordinal values of the adsorption rates we observed are consistent with in situ calibration results previously reported for membrane filters, where HAdV exhibited the highest uptake rate and PMMoV a much lower one[60].
Adsorption rate determinations based on the recovery of microbial analytes from sorbents remain exceptionally rare. Such observations have only been published for in situ deployments of mixed cellulose ester (MCE) membrane filters[60] and lab-scale batch experiments with MCE membranes and male-specific coliphage[61]. Consistent with the historical approach for adsorption, previous work with GAC for microbial passive sampling measured analytes in the bulk solution and deduced kinetic and isotherm models assuming the material removed from the bulk solution was transferred to the adsorbent[25]. While the resulting models are useful, it is critical to note that in the case of passive sampling, in situ performance to produce data must be reliable even when the variability and inefficiency of the analyte recovery and measurement workflow are included. The coefficients of determination for our adsorption rate models indicate that across 38 discrete deployments into wastewater the analyte quantities recovered from the GAC samplers were predictable in the context studied. This is a critical distinction since wastewater surveillance data streams would by necessity be derived from the recovered analyte quantities.
Based on the exponential decay of the average adsorption rate observed in our study, we hypothesize that in situ GAC sampling kinetics might be reliably characterized by the Elovich kinetic model (Equation (2)):
where qt is the quantity of analyte adsorbed at time, t, ɑ is the initial adsorption rate, and β is the desorption rate during a single experiment[62]. The Elovich model was originally developed for the chemisorption of gases to solid-phase adsorbents where the adsorption energy increases linearly with surface coverage[63,64]. The Elovich model is thought to be particularly relevant for heterogeneous surfaces and has been used to describe the adsorption of various pollutants from aqueous solutions including activated carbon adsorption of dyes from wastewater[65] and heavy metals, dyes, and phenols from aqueous solutions[66,67].
dqt/dt = ɑ * exp ( -𝛽 * qt)
In the current study, we deployed the GAC samplers into plug flow in a WWTP rather than lab-scale batch reactors, so deducing a precise Elovich model is precluded by the variation within and between deployment conditions. However, it seems reasonable to hypothesize that the quantity of analyte absorbed, the independent variable in the Elovich model, (Equation 2), is proportional to exposure duration (t), the independent variable in Equation (1). To further examine our hypothesis we used data produced during batch experiments for SARS-CoV-2 (seeded into deionized water and wastewater), PMMoV (endogenous wastewater), and CrAssphage (wastewater endogenous) onto GAC[25]. Hayes et al. previously estimated a pseudo-second order (PSO) model as the best fit for the adsorption rate of SARS-CoV-2, PMMoV, and CrAssphage to GAC using linearized forms of the equations[25]. However, there are important limitations and potential biases associated with linear transformations to fit non-linear kinetic isotherms[68,69]. In our re-analysis, we found that for non-linear fit, the Elovich model outperformed both PSO and pseudo-first order (PFO) models for adsorption of endogenous PMMoV (r2 = 0.92, Figure S9C) and CrAssphage (r2 = 0.97, Figure S9D) while the PSO model remained superior for SARS-CoV-2 control material seeded into deionized water (r2 = 0.92, Figure S9A) and wastewater (r2 = 0.92, Figure S9B). Based on these results, we suggest the Elovich model as a strong candidate for further batch and in situ experiments to characterize the adsorption of endogenous microbial analytes from wastewater to produce quantitative data for WBE.
Adsorption involves the mass transfer of an adsorbate onto an adsorbent through physical or chemical bonding[66]. Traditionally, the mechanisms relevant to the Elovich model have been considered to involve chemical bonding (i.e., chemisorption), which is assumed to be irreversible. However, in the case of microbial adsorption from aqueous solutions and recovered via elution, we hypothesize that reversible physical bonding via electrostatic interactions, hydrophobic bonding, and van der Waals bonds is likely more relevant. Previous studies have found a variety of enteric and respiratory viruses partition favorably (i.e., adsorb) to the solids fraction in wastewater[70,71,72]. Experiments suggest such virus-sorbent partitioning is a function of both the virus type and structure and the wastewater solids content and characteristics[71] primarily driven by electrostatic interactions and hydrophobic bonding[73]. In the case of the current study, virgin Filtrasorb GAC, has been previously observed to have a slightly positive surface charge at neutral pH with a point of zero charge at pH = 7.3, although the surface charge can decrease with the sorption of organic carbon[74]. Conversely, viruses, including HAdV and PMMoV, typically have a negative surface charge at neutral pH[75,76]. Bacteria also typically exhibit negative surface charge at neutral pH although the charge density can be dependent on physiological differences including gram-type[77,78]. These observations lend credibility to the idea of direct electrostatic interactions between GAC and microorganisms in wastewater. However, it is also possible that the primary interaction is between GAC and suspended solids with the solids acting as an intermediary for the mass transfer of microbial analytes. Previous studies with sorption on MCE membranes have found increases in recovery and sorption rate with increasing total suspended solids content, although the relationship has been non-linear in some cases[25,61]. Despite the many complexities and uncertainties of the adsorbent-adsorbate system for GAC sampling of microorganisms in wastewater, our coefficients of determination for three analytes across 38 deployments into raw influent suggest strong potential for the reliable production of quantitative data for public health surveillance.
3.6. Implications for Wastewater and Environmental Surveillance
The widespread application of WBE in response to the COVID-19 pandemic and, more recently, its expansion to include other infectious agents has firmly established its relevance for the protection of global health[9,79]. Socioeconomic vulnerability is a key driver for infectious disease outcomes[18,80] and informs the need for concerted efforts to better include vulnerable populations in WBE footprints[16,17,81]. Unfortunately, the resource requirements of composite sampling, frequently done by autosampler, inhibits the application of WBE in settings where small-scale wastewater systems, informal sewers, or unsewered communities and high infectious disease burdens are coincident[12,14]. Robust, adaptable, and resource-efficient sampling methods are a key component of successfully implementing WBE in such settings[82,83]. Passive sampling has demonstrated strong potential to be just such a method during early applications for COVID-19[21]. Here we elaborate that potential. We have found that GAC passive samplers deployed into raw influent at a small WWTP recovered a variety of molecular analytes relevant to public health surveillance, including DNA and RNA from both respiratory and enteric viruses and that the signal derived from wastewater reflected the regional clinical situation at the time. We were also able to recover DNA from bacteria, including 16S rRNA and ARGs, suggesting that GAC passive sampling could also be useful for the surveillance of antibiotic resistance. Sequencing of GAC-derived DNA also indicated that GAC provides a reasonable sample of the bacterial community observed in wastewater. Most importantly, we found that dPCR measurements of microbial nucleic acids recovered from GAC passive samplers deployed in situ were consistent with a single adsorption kinetic model over 38 deployments. Further development of GAC passive sampling is a potential path toward quantitative sampling of wastewater for infectious disease surveillance especially in resource-limited settings.
Supplementary Materials
The following supporting information can be downloaded at the website of this paper posted on Preprints.org and includes dPCR reaction mix composition; dPCR assay details; dMIQE checklist; mass balance calculations; examples of dPCR results; dPCR partitioning summary statistics; DNA QA/QC data; PMMoV GC/sampler versus time; correlations between dPCR target quantities from S1 and S2; MGE, ARG, and 16s rRNA quantities from S1 and S2; MGE and ARG relative abundance from S1 and S2; 16S rRNA versus MGE/ARG quantities from S1 and S2; process control quantities and recoveries versus high abundance dPCR targets; MGE/ARG relative abundance versus GAC exposure duration; top 20 bacterial families relative abundance versus exposure duration; alpha diversity of the bacterial community; beta diversity of the bacterial community; and non-linear PFO, PSO, and Elovich model fits.
Acknowledgments
We extend our sincere thanks to Dr. Graham Gagnon and Dr. Emalie Hayes from the Centre for Water Resource Studies at Dalhousie University, who graciously shared their expertise and GAC passive sampler design with us for use in this work. This research was not supported by any specific grant from funding agencies in the public, commercial, or not-for-profit sectors.
References
- Daughton, C.G. Wastewater Surveillance for Population-Wide Covid-19: The Present and Future. Sci. Total Environ. 2020, 736, 139631. [Google Scholar] [CrossRef] [PubMed]
- Kirby, A.E. Using Wastewater Surveillance Data to Support the COVID-19 Response — United States, 2020–2021. MMWR Morb. Mortal. Wkly. Rep. 2021, 70. [Google Scholar] [CrossRef] [PubMed]
- Hughes, B.; Duong, D.; White, B.J.; Wigginton, K.R.; Chan, E.M.G.; Wolfe, M.K.; Boehm, A.B. Respiratory Syncytial Virus (RSV) RNA in Wastewater Settled Solids Reflects RSV Clinical Positivity Rates. Environ. Sci. Technol. Lett. 2022, 9, 173–178. [Google Scholar] [CrossRef]
- Branda, F.; Ciccozzi, M.; Scarpa, F. Tracking the Spread of Avian Influenza A(H5N1) with Alternative Surveillance Methods: The Example of Wastewater Data. Lancet Infect. Dis. 2024, 24, e604–e605. [Google Scholar] [CrossRef]
- Wolfe, M.K.; Yu, A.T.; Duong, D.; Rane, M.S.; Hughes, B.; Chan-Herur, V.; Donnelly, M.; Chai, S.; White, B.J.; Vugia, D.J.; Boehm, A.B. Use of Wastewater for Mpox Outbreak Surveillance in California. N. Engl. J. Med. 2023, 388, 570–572. [Google Scholar] [CrossRef]
- Barber, C.; Crank, K.; Papp, K.; Innes, G.K.; Schmitz, B.W.; Chavez, J.; Rossi, A.; Gerrity, D. Community-Scale Wastewater Surveillance of Candida Auris during an Ongoing Outbreak in Southern Nevada. Environ. Sci. Technol. 2023, 57, 1755–1763. [Google Scholar] [CrossRef]
- Lee, W.L.; Gu, X.; Armas, F.; Leifels, M.; Wu, F.; Chandra, F.; Chua, F.J.D.; Syenina, A.; Chen, H.; Cheng, D.; Ooi, E.E.; Wuertz, S.; Alm, E.J.; Thompson, J. Monitoring Human Arboviral Diseases through Wastewater Surveillance: Challenges, Progress and Future Opportunities. Water Res. 2022, 223, 118904. [Google Scholar] [CrossRef]
- Grassly, N.C.; Shaw, A.G.; Owusu, M. Global Wastewater Surveillance for Pathogens with Pandemic Potential: Opportunities and Challenges. Lancet Microbe 2025, 6. [Google Scholar] [CrossRef]
- Keshaviah, A.; Diamond, M.B.; Wade, M.J.; Scarpino, S.V.; Ahmed, W.; Amman, F.; Aruna, O.; Badilla-Aguilar, A.; Bar-Or, I.; Bergthaler, A.; Bines, J.E.; Bivins, A.W.; Boehm, A.B.; Brault, J.-M.; Burnet, J.-B.; Chapman, J.R.; Chaudhuri, A.; de, R. Husman, A.M.; Delatolla, R.; Dennehy, J.J.; Diamond, M.B.; Donato, C.; Duizer, E.; Egwuenu, A.; Erster, O.; Fatta-Kassinos, D.; Gaggero, A.; Gilpin, D.F.; Gilpin, B.J.; Graber, T.E.; Green, C.A.; Handley, A.; Hewitt, J.; Holm, R.H.; Insam, H.; Johnson, M.C.; Johnson, R.; Jones, D.L.; Julian, T.R.; Jyothi, A.; Keshaviah, A.; Kohn, T.; Kuhn, K.G.; Rosa, G.L.; Lesenfants, M.; Manuel, D.G.; D’Aoust, P.M.; Markt, R.; McGrath, J.W.; Medema, G.; Moe, C.L.; Murni, I.K.; Naser, H.; Naughton, C.C.; Ogorzaly, L.; Oktaria, V.; Ort, C.; Karaolia, P.; Patel, E.H.; Paterson, S.; Rahman, M.; Rivera-Navarro, P.; Robinson, A.; Santa-Maria, M.C.; Scarpino, S.V.; Schmitt, H.; Smith, T.; Stadler, L.B.; Stassijns, J.; Stenico, A.; Street, R.A.; Suffredini, E.; Susswein, Z.; Trujillo, M.; Wade, M.J.; Wolfe, M.K.; Yakubu, H.; Sato, M.I.Z. Wastewater Monitoring Can Anchor Global Disease Surveillance Systems. Lancet Glob. Health 2023, 11, e976–e981. [Google Scholar] [CrossRef]
- National Academies of Sciences, E. Increasing the Utility of Wastewater-Based Disease Surveillance for Public Health Action: A Phase 2 Report; 2024. [CrossRef]
- Wastewater-Based Disease Surveillance for Public Health Action; National Academies Press: Washington, D.C., 2023. [CrossRef]
- Naughton, C.C.; Roman, F.A., Jr.; Alvarado, A.G.F.; Tariqi, A.Q.; Deeming, M.A.; Kadonsky, K.F.; Bibby, K.; Bivins, A.; Medema, G.; Ahmed, W.; Katsivelis, P.; Allan, V.; Sinclair, R.; Rose, J.B. Show Us the Data: Global COVID-19 Wastewater Monitoring Efforts, Equity, and Gaps. FEMS Microbes 2023, 4, xtad003. [Google Scholar] [CrossRef]
- Street, R.; Malema, S.; Mahlangeni, N.; Mathee, A. Wastewater Surveillance for Covid-19: An African Perspective. Sci. Total Environ. 2020, 743, 140719. [Google Scholar] [CrossRef] [PubMed]
- Cohen, A.; Vikesland, P.; Pruden, A.; Krometis, L.-A.; Lee, L.M.; Darling, A.; Yancey, M.; Helmick, M.; Singh, R.; Gonzalez, R.; Meit, M.; Degen, M.; Taniuchi, M. Making Waves: The Benefits and Challenges of Responsibly Implementing Wastewater-Based Surveillance for Rural Communities. Water Res. 2024, 250, 121095. [Google Scholar] [CrossRef]
- Adams, C.; Bias, M.; Welsh, R.M.; Webb, J.; Reese, H.; Delgado, S.; Person, J.; West, R.; Shin, S.; Kirby, A. The National Wastewater Surveillance System (NWSS): From Inception to Widespread Coverage, 2020–2022, United States. Sci. Total Environ. 2024, 924, 171566. [Google Scholar] [CrossRef] [PubMed]
- Mosher, J.R.; Banta, J.E.; Spencer-Hwang, R.; Naughton, C.C.; Kadonsky, K.F.; Hile, T.; Sinclair, R.G. An Environmental Equity Assessment Using a Social Vulnerability Index during the SARS-CoV-2 Pandemic for Siting of Wastewater-Based Epidemiology Locations in the United States. Geographies 2024, 4, 141–151. [Google Scholar] [CrossRef]
- Kadonsky, K.F.; Naughton, C.C.; Susa, M.; Olson, R.; Singh, G.L.; Daza-Torres, M.L.; Montesinos-López, J.C.; Garcia, Y.E.; Gafurova, M.; Gushgari, A.; Cosgrove, J.; White, B.J.; Boehm, A.B.; Wolfe, M.K.; Nuño, M.; Bischel, H.N. Expansion of Wastewater-Based Disease Surveillance to Improve Health Equity in California’s Central Valley: Sequential Shifts in Case-to-Wastewater and Hospitalization-to-Wastewater Ratios. Front. Public Health 2023, 11. [Google Scholar] [CrossRef]
- Baldwin, W.M.; Dayton, R.D.; Bivins, A.W.; Scott, R.S.; Yurochko, A.D.; Vanchiere, J.A.; Davis, T.; Arnold, C.L.; Asuncion, J.E.T.; Bhuiyan, M.A.N.; Snead, B.; Daniel, W.; Smith, D.G.; Goeders, N.E.; Kevil, C.G.; Carroll, J.; Murnane, K.S. Highly Socially Vulnerable Communities Exhibit Disproportionately Increased Viral Loads as Measured in Community Wastewater. Environ. Res. 2023, 222, 115351. [Google Scholar] [CrossRef]
- Shaw, A.G.; Troman, C.; Akello, J.O.; O’Reilly, K.M.; Gauld, J.; Grow, S.; Grassly, N.; Steele, D.; Blazes, D.; Kumar, S. Defining a Research Agenda for Environmental Wastewater Surveillance of Pathogens. Nat. Med. 2023, 29, 2155–2157. [Google Scholar] [CrossRef]
- Wannigama, D.L.; Amarasiri, M.; Hongsing, P.; Hurst, C.; Modchang, C.; Chadsuthi, S.; Anupong, S.; Phattharapornjaroen, P.; M, A.H.R.S.; Fernandez, S.; Huang, A.T.; Vatanaprasan, P.; Jay, D.J.; Saethang, T.; Luk-in, S.; Storer, R.J.; Ounjai, P.; Ragupathi, N.K.D.; Kanthawee, P.; Sano, D.; Furukawa, T.; Sei, K.; Leelahavanichkul, A.; Kanjanabuch, T.; Hirankarn, N.; Higgins, P.G.; Kicic, A.; Singer, A.C.; Chatsuwan, T.; Trowsdale, S.; Abe, S.; McLellan, A.D.; Ishikawa, H. COVID-19 Monitoring with Sparse Sampling of Sewered and Non-Sewered Wastewater in Urban and Rural Communities. iScience 2023, 26. [Google Scholar] [CrossRef]
- Bivins, A.; Kaya, D.; Ahmed, W.; Brown, J.; Butler, C.; Greaves, J.; Leal, R.; Maas, K.; Rao, G.; Sherchan, S.; Sills, D.; Sinclair, R.; Wheeler, R.T.; Mansfeldt, C. Passive Sampling to Scale Wastewater Surveillance of Infectious Disease: Lessons Learned from COVID-19. Sci. Total Environ. 2022, 835, 155347. [Google Scholar] [CrossRef]
- Schang, C.; Crosbie, N.D.; Nolan, M.; Poon, R.; Wang, M.; Jex, A.; John, N.; Baker, L.; Scales, P.; Schmidt, J.; Thorley, B.R.; Hill, K.; Zamyadi, A.; Tseng, C.-W.; Henry, R.; Kolotelo, P.; Langeveld, J.; Schilperoort, R.; Shi, B.; Einsiedel, S.; Thomas, M.; Black, J.; Wilson, S.; McCarthy, D.T. Passive Sampling of SARS-CoV-2 for Wastewater Surveillance. Environ. Sci. Technol. 2021, 55, 10432–10441. [Google Scholar] [CrossRef]
- Cha, G.; Graham, K.E.; Zhu, K.J.; Rao, G.; Lindner, B.G.; Kocaman, K.; Woo, S.; D’amico, I.; Bingham, L.R.; Fischer, J.M.; Flores, C.I.; Spencer, J.W.; Yathiraj, P.; Chung, H.; Biliya, S.; Djeddar, N.; Burton, L.J.; Mascuch, S.J.; Brown, J.; Bryksin, A.; Pinto, A.; Hatt, J.K.; Konstantinidis, K.T. Parallel Deployment of Passive and Composite Samplers for Surveillance and Variant Profiling of SARS-CoV-2 in Sewage. Sci. Total Environ. 2023, 866, 161101. [Google Scholar] [CrossRef] [PubMed]
- Cha, G.; Zhu, K.J.; Fischer, J.M.; Flores, C.I.; Brown, J.; Pinto, A.; Hatt, J.K.; Konstantinidis, K.T.; Graham, K.E. Metagenomic Evaluation of the Performance of Passive Moore Swabs for Sewage Monitoring Relative to Composite Sampling over Time Resolved Deployments. Water Res. 2024, 253, 121269. [Google Scholar] [CrossRef] [PubMed]
- Hayes, E.K.; Stoddart, A.K.; Gagnon, G.A. Adsorption of SARS-CoV-2 onto Granular Activated Carbon (GAC) in Wastewater: Implications for Improvements in Passive Sampling. Sci. Total Environ. 2022, 847, 157548. [Google Scholar] [CrossRef] [PubMed]
- Hayes, E.K.; Gouthro, M.T.; LeBlanc, J.J.; Gagnon, G.A. Simultaneous Detection of SARS-CoV-2, Influenza A, Respiratory Syncytial Virus, and Measles in Wastewater by Multiplex RT-qPCR. Sci. Total Environ. 2023, 889, 164261. [Google Scholar] [CrossRef]
- Hayes, E.K.; Gouthro, M.T.; Fuller, M.; Redden, D.J.; Gagnon, G.A. Enhanced Detection of Viruses for Improved Water Safety. Sci. Rep. 2023, 13, 17336. [Google Scholar] [CrossRef]
- Hayes, E.K.; Sweeney, C.; Stoddart, A.K.; Gagnon, G.A. Detection of Omicron Variant in November 2021: A Retrospective Analysis through Wastewater in Halifax, Canada. Environ. Sci. Water Res. Technol. 2024, 11, 100–113. [Google Scholar] [CrossRef]
- Vrana, B.; Allan, I.J.; Greenwood, R.; Mills, G.A.; Dominiak, E.; Svensson, K.; Knutsson, J.; Morrison, G. Passive Sampling Techniques for Monitoring Pollutants in Water. TrAC Trends Anal. Chem. 2005, 24, 845–868. [Google Scholar] [CrossRef]
- Karamati N․, E.; Law, I.; Weese, J.S.; McCarthy, D.T.; Murphy, H.M. Passive Sampling of Microbes in Various Water Sources: A Systematic Review. Water Res. 2024, 266, 122284. [Google Scholar] [CrossRef]
- Hayes, E.K.; Sweeney, C.L.; Anderson, L.E.; Li, B.; Erjavec, G.B.; Gouthro, M.T.; Krkosek, W.H.; Stoddart, A.K.; Gagnon, G.A. A Novel Passive Sampling Approach for SARS-CoV-2 in Wastewater in a Canadian Province with Low Prevalence of COVID-19. Environ. Sci. Water Res. Technol. 2021, 7, 1576–1586. [Google Scholar] [CrossRef]
- Huggett, J.F.; Foy, C.A.; Benes, V.; Emslie, K.; Garson, J.A.; Haynes, R.; Hellemans, J.; Kubista, M.; Mueller, R.D.; Nolan, T.; Pfaffl, M.W.; Shipley, G.L.; Vandesompele, J.; Wittwer, C.T.; Bustin, S.A. The Digital MIQE Guidelines: Minimum Information for Publication of Quantitative Digital PCR Experiments. Clin. Chem. 2013, 59, 892–902. [Google Scholar] [CrossRef]
- Heim, A.; Ebnet, C.; Harste, G.; Pring-Åkerblom, P. Rapid and Quantitative Detection of Human Adenovirus DNA by Real-Time PCR. J. Med. Virol. 2003, 70, 228–239. [Google Scholar] [CrossRef] [PubMed]
- Best, E.L.; Powell, E.J.; Swift, C.; Grant, K.A.; Frost, J.A. Applicability of a Rapid Duplex Real-Time PCR Assay for Speciation of Campylobacter Jejuni and Campylobacter Coli Directly from Culture Plates. FEMS Microbiol. Lett. 2003, 229, 237–241. [Google Scholar] [CrossRef] [PubMed]
- Ritalahti, K.M.; Amos, B.K.; Sung, Y.; Wu, Q.; Koenigsberg, S.S.; Löffler, F.E. Quantitative PCR Targeting 16S rRNA and Reductive Dehalogenase Genes Simultaneously Monitors Multiple Dehalococcoides Strains. Appl. Environ. Microbiol. 2006, 72, 2765–2774. [Google Scholar] [CrossRef]
- De Coster, W.; Rademakers, R. NanoPack2: Population-Scale Evaluation of Long-Read Sequencing Data. Bioinformatics 2023, 39, btad311. [Google Scholar] [CrossRef]
- Bolyen, E.; Rideout, J.R.; Dillon, M.R.; Bokulich, N.A.; Abnet, C.C.; Al-Ghalith, G.A.; Alexander, H.; Alm, E.J.; Arumugam, M.; Asnicar, F.; Bai, Y.; Bisanz, J.E.; Bittinger, K.; Brejnrod, A.; Brislawn, C.J.; Brown, C.T.; Callahan, B.J.; Caraballo-Rodríguez, A.M.; Chase, J.; Cope, E.K.; Da Silva, R.; Diener, C.; Dorrestein, P.C.; Douglas, G.M.; Durall, D.M.; Duvallet, C.; Edwardson, C.F.; Ernst, M.; Estaki, M.; Fouquier, J.; Gauglitz, J.M.; Gibbons, S.M.; Gibson, D.L.; Gonzalez, A.; Gorlick, K.; Guo, J.; Hillmann, B.; Holmes, S.; Holste, H.; Huttenhower, C.; Huttley, G.A.; Janssen, S.; Jarmusch, A.K.; Jiang, L.; Kaehler, B.D.; Kang, K.B.; Keefe, C.R.; Keim, P.; Kelley, S.T.; Knights, D.; Koester, I.; Kosciolek, T.; Kreps, J.; Langille, M.G.I.; Lee, J.; Ley, R.; Liu, Y.-X.; Loftfield, E.; Lozupone, C.; Maher, M.; Marotz, C.; Martin, B.D.; McDonald, D.; McIver, L.J.; Melnik, A.V.; Metcalf, J.L.; Morgan, S.C.; Morton, J.T.; Naimey, A.T.; Navas-Molina, J.A.; Nothias, L.F.; Orchanian, S.B.; Pearson, T.; Peoples, S.L.; Petras, D.; Preuss, M.L.; Pruesse, E.; Rasmussen, L.B.; Rivers, A.; Robeson, M.S.; Rosenthal, P.; Segata, N.; Shaffer, M.; Shiffer, A.; Sinha, R.; Song, S.J.; Spear, J.R.; Swafford, A.D.; Thompson, L.R.; Torres, P.J.; Trinh, P.; Tripathi, A.; Turnbaugh, P.J.; Ul-Hasan, S.; van der Hooft, J.J.J.; Vargas, F.; Vázquez-Baeza, Y.; Vogtmann, E.; von Hippel, M.; Walters, W.; Wan, Y.; Wang, M.; Warren, J.; Weber, K.C.; Williamson, C.H.D.; Willis, A.D.; Xu, Z.Z.; Zaneveld, J.R.; Zhang, Y.; Zhu, Q.; Knight, R.; Caporaso, J.G. Reproducible, Interactive, Scalable and Extensible Microbiome Data Science Using QIIME 2. Nat. Biotechnol. 2019, 37, 852–857. [Google Scholar] [CrossRef]
- Shannon, C.E. A Mathematical Theory of Communication. Bell Syst. Tech. J. 1948, 27, 379–423. [Google Scholar] [CrossRef]
- Bray, J.R.; Curtis, J.T. An Ordination of the Upland Forest Communities of Southern Wisconsin. Ecol. Monogr. 1957, 27, 325–349. [Google Scholar] [CrossRef]
- Kantor, R.S.; Nelson, K.L.; Greenwald, H.D.; Kennedy, L.C. Challenges in Measuring the Recovery of SARS-CoV-2 from Wastewater. Environ. Sci. Technol. 2021, 55, 3514–3519. [Google Scholar] [CrossRef]
- CDC. COVID Data Tracker. Centers for Disease Control and Prevention. Available online: https://covid.cdc.gov/covid-data-tracker (accessed on 10 April 2025).
- Pruden, A.; Vikesland, P.J.; Davis, B.C.; de Roda Husman, A.M. Seizing the Moment: Now Is the Time for Integrated Global Surveillance of Antimicrobial Resistance in Wastewater Environments. Curr. Opin. Microbiol. 2021, 64, 91–99. [Google Scholar] [CrossRef]
- Prieto Riquelme, M.V.; Garner, E.; Gupta, S.; Metch, J.; Zhu, N.; Blair, M.F.; Arango-Argoty, G.; Maile-Moskowitz, A.; Li, A.; Flach, C.-F.; Aga, D.S.; Nambi, I.M.; Larsson, D.G.J.; Bürgmann, H.; Zhang, T.; Pruden, A.; Vikesland, P.J. Demonstrating a Comprehensive Wastewater-Based Surveillance Approach That Differentiates Globally Sourced Resistomes. Environ. Sci. Technol. 2022, 56, 14982–14993. [Google Scholar] [CrossRef]
- McLellan, S.L.; Roguet, A. The Unexpected Habitat in Sewer Pipes for the Propagation of Microbial Communities and Their Imprint on Urban Waters. Curr. Opin. Biotechnol. 2019, 57, 34–41. [Google Scholar] [CrossRef] [PubMed]
- Roguet, A.; Newton, R.J.; Eren, A.M.; McLellan, S.L. Guts of the Urban Ecosystem: Microbial Ecology of Sewer Infrastructure. mSystems 2022, 7, e00118–22. [Google Scholar] [CrossRef] [PubMed]
- Dueholm, M.K.D.; Nierychlo, M.; Andersen, K.S.; Rudkjøbing, V.; Knutsson, S.; Albertsen, M.; Nielsen, P.H. MiDAS 4: A Global Catalogue of Full-Length 16S rRNA Gene Sequences and Taxonomy for Studies of Bacterial Communities in Wastewater Treatment Plants. Nat. Commun. 2022, 13, 1908. [Google Scholar] [CrossRef]
- Pot, B.; Gillis, M.; De LEY, J. The Genus Aquaspirillum. In The Prokaryotes: Volume 5: Proteobacteria: Alpha and Beta Subclasses; Dworkin, M., Falkow, S., Rosenberg, E., Schleifer, K.-H., Stackebrandt, E., Eds.; Springer: New York, NY, 2006. [Google Scholar] [CrossRef]
- Röling, W.F.M. The Family Geobacteraceae. In The Prokaryotes: Deltaproteobacteria and Epsilonproteobacteria; Rosenberg, E., DeLong, E.F., Lory, S., Stackebrandt, E., Thompson, F., Eds.; Springer: Berlin, Heidelberg, 2014. [Google Scholar] [CrossRef]
- Nielsen, P.H.; Mielczarek, A.T.; Kragelund, C.; Nielsen, J.L.; Saunders, A.M.; Kong, Y.; Hansen, A.A.; Vollertsen, J. A Conceptual Ecosystem Model of Microbial Communities in Enhanced Biological Phosphorus Removal Plants. Water Res. 2010, 44, 5070–5088. [Google Scholar] [CrossRef]
- Weber, W.; Pirbazari, M.; Melson, G. Biological Growth on Activated Carbon: An Investigation by Scanning Electron Microscopy. 1978. [CrossRef]
- Gibert, O.; Lefèvre, B.; Fernández, M.; Bernat, X.; Paraira, M.; Calderer, M.; Martínez-Lladó, X. Characterising Biofilm Development on Granular Activated Carbon Used for Drinking Water Production. Water Res. 2013, 47, 1101–1110. [Google Scholar] [CrossRef]
- Camper, A.K.; LeChevallier, M.W.; Broadaway, S.C.; McFeters, G.A. Bacteria Associated with Granular Activated Carbon Particles in Drinking Water. Appl. Environ. Microbiol. 1986, 52, 434–438. [Google Scholar] [CrossRef]
- Feng, Z.; Zhu, P.; Fan, H.; Piao, S.; Xu, L.; Sun, T. Effect of Biofilm on Passive Sampling of Dissolved Orthophosphate Using the Diffusive Gradients in Thin Films Technique. Anal. Chem. 2016, 88, 6836–6843. [Google Scholar] [CrossRef]
- Wang, L.; Cheng, D.; Liu, X.; Ye, Y. Utilizing Microorganisms Immobilized on Carbon-Based Materials for Environmental Remediation: A Mini Review. Water Emerg. Contam. Amp Nanoplastics 2024. [Google Scholar] [CrossRef]
- Hu, Y.; Wang, Y.; Han, X.; Shan, Y.; Li, F.; Shi, L. Biofilm Biology and Engineering of Geobacter and Shewanella Spp. for Energy Applications. Front. Bioeng. Biotechnol. 2021, 9. [Google Scholar] [CrossRef]
- Weissbrodt, D.; Lochmatter, S.; Neu, T.R.; Holliger, C. Significance of Rhodocyclaceae for the Formation of Aerobic Granular Sludge Biofilms and Nutrient Removal from Wastewater. In IWA Biofilm Conference 2011 - Processes in Biofilms; Tongji University, 2011; pp 106–107.
- Pollock, J.; Glendinning, L.; Wisedchanwet, T.; Watson, M. The Madness of Microbiome: Attempting To Find Consensus “Best Practice” for 16S Microbiome Studies. Appl. Environ. Microbiol. 2018, 84, e02627–17. [Google Scholar] [CrossRef]
- Fouhy, F.; Clooney, A.G.; Stanton, C.; Claesson, M.J.; Cotter, P.D. 16S rRNA Gene Sequencing of Mock Microbial Populations- Impact of DNA Extraction Method, Primer Choice and Sequencing Platform. BMC Microbiol. 2016, 16, 123. [Google Scholar] [CrossRef] [PubMed]
- Brooks, J.P.; Edwards, D.J.; Harwich, M.D.; Rivera, M.C.; Fettweis, J.M.; Serrano, M.G.; Reris, R.A.; Sheth, N.U.; Huang, B.; Girerd, P.; Strauss, J.F.; Jefferson, K.K.; Buck, G.A.; Vaginal Microbiome Consortium (additional members). The Truth about Metagenomics: Quantifying and Counteracting Bias in 16S rRNA Studies. BMC Microbiol. 2015, 15, 66. [Google Scholar] [CrossRef] [PubMed]
- Li, J.; Verhagen, R.; Ahmed, W.; Metcalfe, S.; Thai, P.K.; Kaserzon, S.L.; Smith, W.J.M.; Schang, C.; Simpson, S.L.; Thomas, K.V.; Mueller, J.F.; Mccarthy, D. In Situ Calibration of Passive Samplers for Viruses in Wastewater. ACS EST Water 2022. [Google Scholar] [CrossRef]
- Shakallis, A.G.; Fallowfield, H.; Ross, K.E.; Whiley, H. Laboratory Analysis of Passive Samplers Used for Wastewater-Based Epidemiology Using F-RNA Bacteriophage MS2 as a Model Organism. ACS EST Water 2024, 4, 500–508. [Google Scholar] [CrossRef]
- Ho, Y.S.; McKay, G. A Comparison of Chemisorption Kinetic Models Applied to Pollutant Removal on Various Sorbents. Process Saf. Environ. Prot. 1998, 76, 332–340. [Google Scholar] [CrossRef]
- Zeldowitsch, J. Über Den Mechanismus Der Katalytischen Oxidation Von CO a MnO2. URSS Acta Physiochim 1934, 1, 364–449. [Google Scholar]
- Low, M.J.D. Kinetics of Chemisorption of Gases on Solids. Chem. Rev. 1960, 60, 267–312. [Google Scholar] [CrossRef]
- Wu, F.-C.; Tseng, R.-L.; Juang, R.-S. Characteristics of Elovich Equation Used for the Analysis of Adsorption Kinetics in Dye-Chitosan Systems. Chem. Eng. J. 2009, 150, 366–373. [Google Scholar] [CrossRef]
- Largitte, L.; Pasquier, R. A Review of the Kinetics Adsorption Models and Their Application to the Adsorption of Lead by an Activated Carbon. Chem. Eng. Res. Des. 2016, 109, 495–504. [Google Scholar] [CrossRef]
- Tseng, R.-L.; Wu, F.-C.; Juang, R.-S. Liquid-Phase Adsorption of Dyes and Phenols Using Pinewood-Based Activated Carbons. Carbon 2003, 41, 487–495. [Google Scholar] [CrossRef]
- Kajjumba, G.W.; Emik, S.; Öngen, A.; Aydın, H.K. Ö. and S.; Kajjumba, G.W.; Emik, S.; Öngen, A.; Aydın, H.K. Ö. and S. Modelling of Adsorption Kinetic Processes—Errors, Theory and Application. In Advanced Sorption Process Applications; IntechOpen, 2018. [CrossRef]
- Canzano, S.; Iovino, P.; Leone, V.; Salvestrini, S.; Capasso, S. Use and Misuse of Sorption Kinetic Data: A Common Mistake That Should Be Avoided. Adsorpt. Sci. Technol. 2012, 30, 217–225. [Google Scholar] [CrossRef]
- Roldan-Hernandez, L.; Boehm, A. Adsorption of Respiratory Syncytial Virus, Rhinovirus, SARS-CoV-2, and F+ Bacteriophage MS2 RNA onto Wastewater Solids from Raw Wastewater. Environ. Sci. Technol. 2023. [Google Scholar] [CrossRef] [PubMed]
- Ye, Y.; Ellenberg, R.M.; Graham, K.E.; Wigginton, K.R. Survivability, Partitioning, and Recovery of Enveloped Viruses in Untreated Municipal Wastewater. Environ. Sci. Technol. 2016, 50, 5077. [Google Scholar] [CrossRef]
- Yin, Z.; Voice, T.C.; Tarabara, V.V.; Xagoraraki, I. Sorption of Human Adenovirus to Wastewater Solids. J. Environ. Eng. 2018, 144, 06018008. [Google Scholar] [CrossRef]
- Armanious, A.; Aeppli, M.; Jacak, R.; Refardt, D.; Sigstam, T.; Kohn, T.; Sander, M. Viruses at Solid-Water Interfaces: A Systematic Assessment of Interactions Driving Adsorption. Environ. Sci. Technol. 2016. [Google Scholar] [CrossRef]
- Morris, G.; Newcombe, G. Granular Activated Carbon: The Variation of Surface Properties with the Adsorption of Humic Substances. J. Colloid Interface Sci. 1993, 159, 413–420. [Google Scholar] [CrossRef]
- Wong, K.; Mukherjee, B.; Kahler, A.M.; Zepp, R.; Molina, M. Influence of Inorganic Ions on Aggregation and Adsorption Behaviors of Human Adenovirus. Environ. Sci. Technol. 2012, 46, 11145–11153. [Google Scholar] [CrossRef]
- Canh, V.D.; Furumai, H.; Katayama, H. Removal of Pepper Mild Mottle Virus by Full-Scale Microfiltration and Slow Sand Filtration Plants. Npj Clean Water 2019, 2, 1–7. [Google Scholar] [CrossRef]
- Beveridge, T.J.; Graham, L.L. Surface Layers of Bacteria. Microbiol. Rev. 1991, 55, 684–705. [Google Scholar] [CrossRef]
- Wilhelm, M.J.; Sharifian, G., M.; Wu, T.; Li, Y.; Chang, C.-M.; Ma, J.; Dai, H.-L. Determination of Bacterial Surface Charge Density via Saturation of Adsorbed Ions. Biophys. J. 2021, 120, 2461–2470. [Google Scholar] [CrossRef]
- Bowes, D.A. Towards a Precision Model for Environmental Public Health: Wastewater-Based Epidemiology to Assess Population-Level Exposures and Related Diseases. Curr. Epidemiol. Rep. 2024, 11, 131–139. [Google Scholar] [CrossRef]
- Saingam, P.; Jain, T.; Woicik, A.; Li, B.; Candry, P.; Redcorn, R.; Wang, S.; Himmelfarb, J.; Bryan, A.; Gattuso, M.; Winkler, M.K.H. Integrating Socio-Economic Vulnerability Factors Improves Neighborhood-Scale Wastewater-Based Epidemiology for Public Health Applications. Water Res. 2024, 254, 121415. [Google Scholar] [CrossRef] [PubMed]
- Muralidharan, A.; Olson, R.; Bess, C.W.; Bischel, H.N. Equity-Centered Adaptive Sampling in Sub-Sewershed Wastewater Surveillance Using Census Data. Environ. Sci. Water Res. Technol. 2024, 11, 136–151. [Google Scholar] [CrossRef]
- Hamilton, K.A.; Wade, M.J.; Barnes, K.G.; Street, R.A.; Paterson, S. Wastewater-Based Epidemiology as a Public Health Resource in Low- and Middle-Income Settings. Environ. Pollut. 2024, 351, 124045. [Google Scholar] [CrossRef]
- Goddard, F.G.B.; Ban, R.; Barr, D.B.; Brown, J.; Cannon, J.; Colford, J.M., Jr.; Eisenberg, J.N.S.; Ercumen, A.; Petach, H.; Freeman, M.C.; Levy, K.; Luby, S.P.; Moe, C.; Pickering, A.J.; Sarnat, J.A.; Stewart, J.; Thomas, E.; Taniuchi, M.; Clasen, T. Measuring Environmental Exposure to Enteric Pathogens in Low-Income Settings: Review and Recommendations of an Interdisciplinary Working Group. Environ. Sci. Technol. 2020, 54, 11673–11691. [Google Scholar] [CrossRef]
Figure 1.
GAC passive sampler-derived analyte quantities (GC/sampler) versus regional (COVID-19) or state-wide (RSV, HAdV) clinical positivity, where available, for SARS-CoV-2 (A), RSV (B), HAdV (C), and Campylobacter jejuni (D). In the case of Campylobacter, there are no clinical data available for comparison.
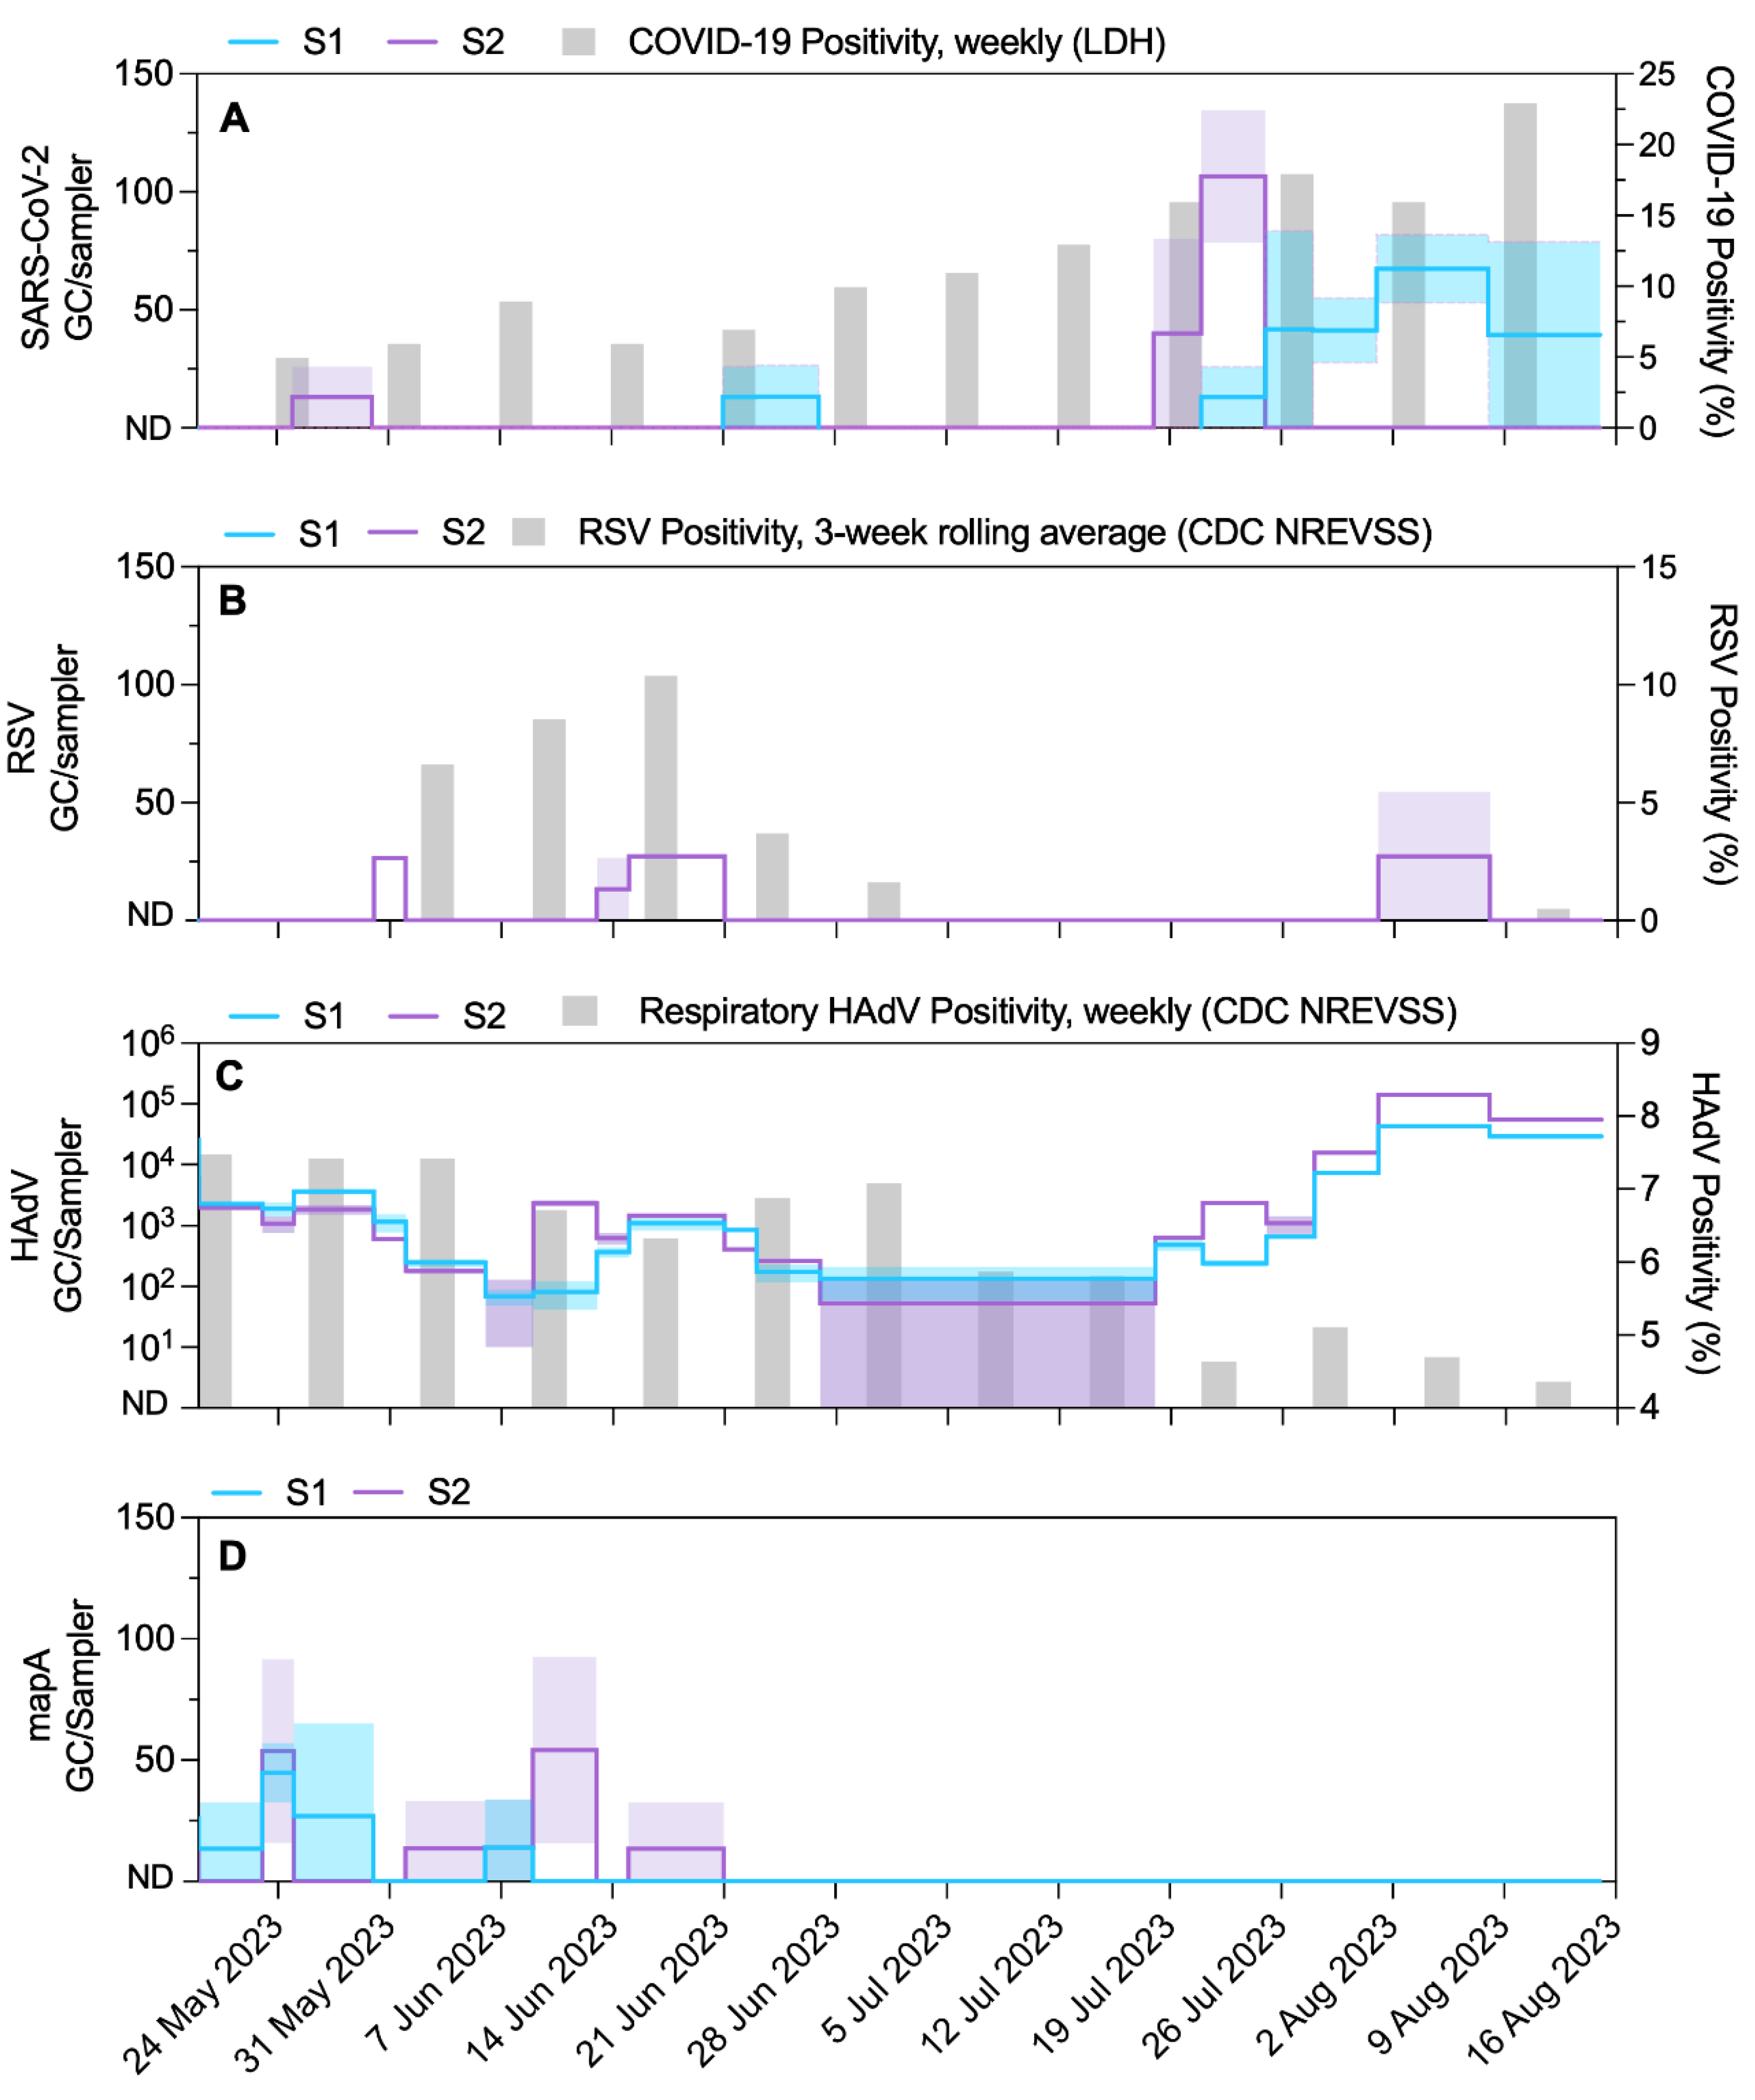
Figure 2.
The 20 most abundant bacterial families (relative abundance, %) derived from GAC passive samplers deployed into untreated wastewater upstream of two inclined static screens (S1 and S2) at exposure durations ranging from 44 to 503 h.
Figure 2.
The 20 most abundant bacterial families (relative abundance, %) derived from GAC passive samplers deployed into untreated wastewater upstream of two inclined static screens (S1 and S2) at exposure durations ranging from 44 to 503 h.
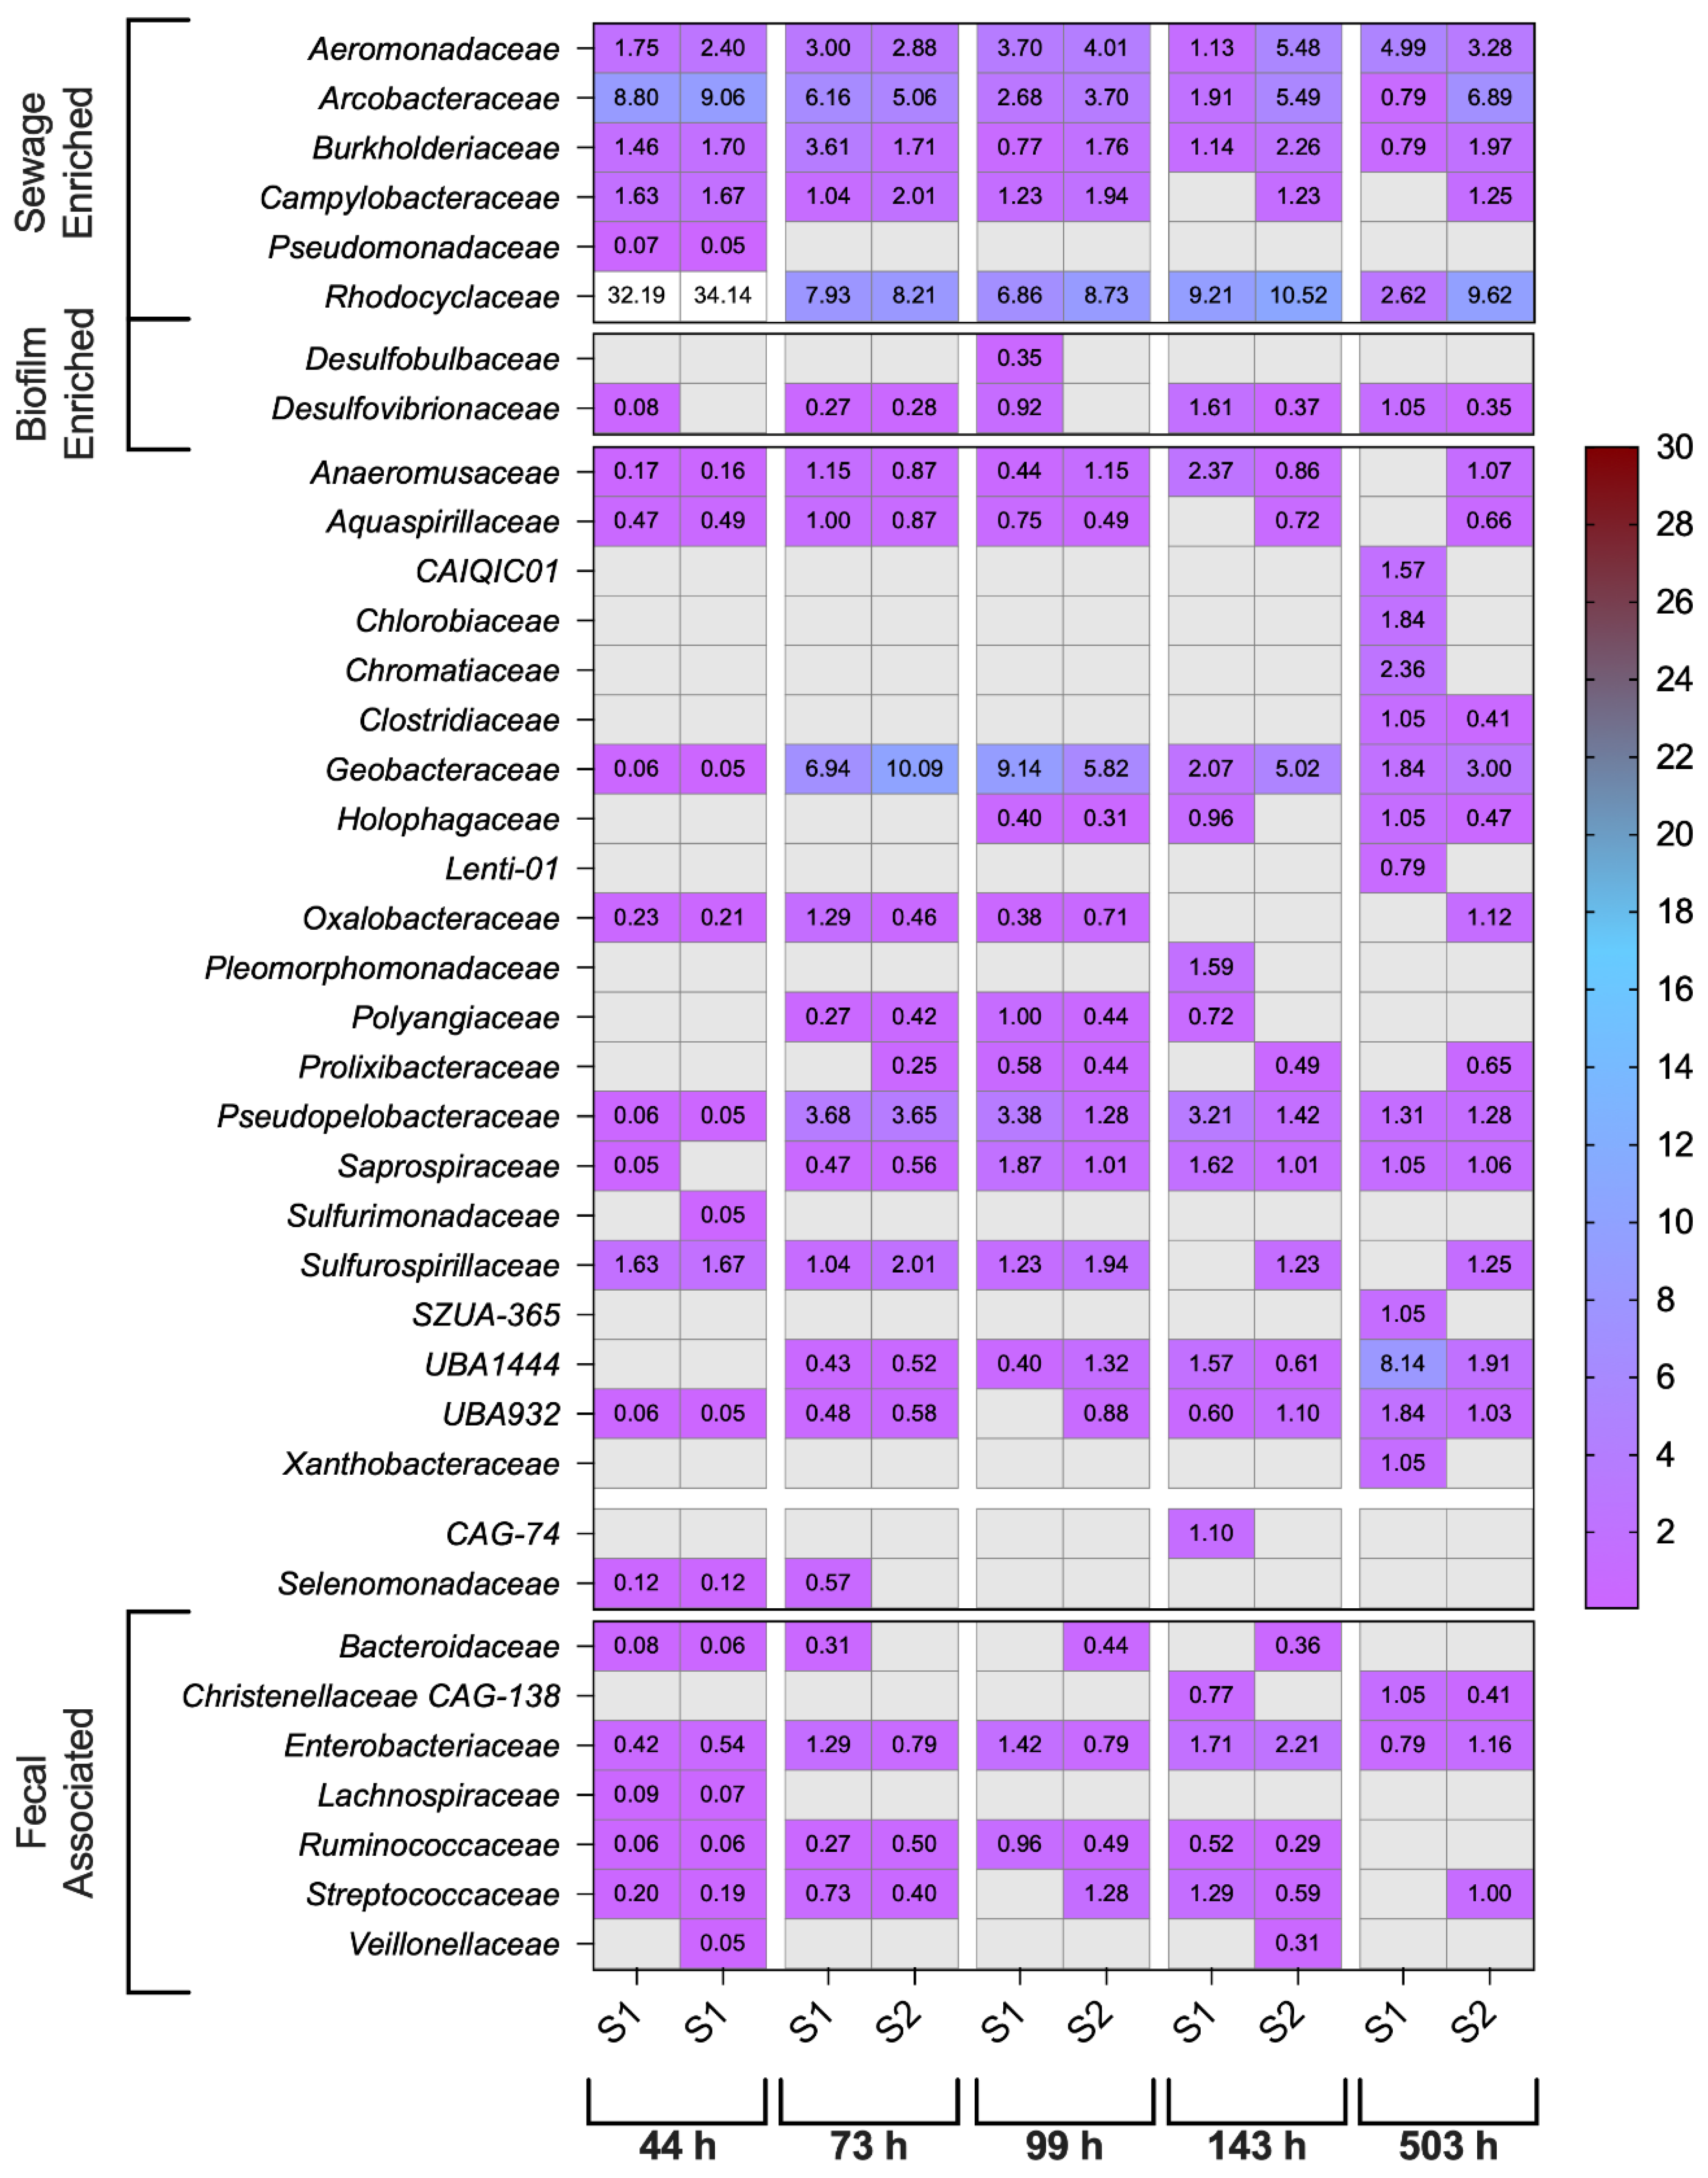
Figure 3.
Non-linear regression first-order decay models fit to the average analyte uptake rate (log10(GC/g) h-1) as a function of exposure duration (hours) and the subsequent model predicted analyte concentration (mean and 95% prediction interval) versus empirical observations during GAC passive sampler deployments for PMMoV (A, D), HAdV (B, E), and 16S rRNA (C, F).
Disclaimer/Publisher’s Note: The statements, opinions and data contained in all publications are solely those of the individual author(s) and contributor(s) and not of MDPI and/or the editor(s). MDPI and/or the editor(s) disclaim responsibility for any injury to people or property resulting from any ideas, methods, instructions or products referred to in the content. |
© 2025 by the authors. Licensee MDPI, Basel, Switzerland. This article is an open access article distributed under the terms and conditions of the Creative Commons Attribution (CC BY) license (http://creativecommons.org/licenses/by/4.0/).
Copyright: This open access article is published under a Creative Commons CC BY 4.0 license, which permit the free download, distribution, and reuse, provided that the author and preprint are cited in any reuse.


