
Submitted:
19 February 2025
Posted:
20 February 2025
You are already at the latest version
Preprints on COVID-19 and SARS-CoV-2
Abstract
Wastewater surveillance has emerged as a cost-effective and equitable approach for tracking the spread of SARS-CoV-2. In this study, we monitored the prevalence of SARS-CoV-2 on a university campus over three years (2021–2023) using wastewater-based epidemiology (WBE). Wastewater samples were collected from 11 manholes on campus, each draining wastewater from a corresponding dormitory building, and viral RNA concentrations were measured using reverse transcription quantitative PCR (RT-qPCR). Weekly clinical case data were also obtained from the university health center. A strong positive and significant correlation was observed between Grab and Composite sampling methods, supporting their robustness as equally effective approaches for sample collection. Specifically, a strong correlation was observed between Aggie Village 4 Grab and Aggie Village 4 Composite samples (R² = 0.84, p = 0.00) and between Barbee Grab and Barbee Composite samples (R² = 0.80, p = 0.00). Additionally, higher viral RNA copies of SARS-CoV-2 (N1 gene) were detected during the Spring semester compared to the Fall and Summer semesters. Notably, elevations in raw N1 concentrations were observed shortly after the return of college students to campus, suggesting that these increases were predomi-nantly associated with students returning at the beginning of the Fall and Spring semesters (January and August). To account for variations in fecal loading, SARS-CoV-2 RNA concentrations were normalized using Pepper Mild Mottle Virus (PMMoV), a widely used viral fecal biomarker. However, normalization using PMMoV did not improve correlations between SARS-CoV-2 RNA levels and clinical case data. Despite these findings, our study did not establish WBE as a consistently reliable complement to clinical testing in a university campus setting, contrary to many retrospective studies. One key limitation was that numerous off-campus students did not contribute to the campus wastewater system corresponding to the monitored dormitories. However, some off-campus students were still subjected to clinical testing at the university health center under mandated pro-tocols. Moreover, the university health center discontinued reporting cases per dormitory after 2021, making direct comparisons more challenging. Nevertheless, this study highlights the continued value of WBE as a surveillance tool for monitoring infectious diseases and provides critical insights into its application in campus environments.
Keywords:
Wastewater-Based Epidemiology (WBE)
; SARS-CoV-2
; Grab and Composite wastewater sampling
; PMMoV
1. Introduction
SARS-CoV-2, a zoonotic virus that was initially identified in China in December 2019 and spread at an alarming rate globally, is now considered the deadliest virus of the 21st century [1,2]. COVID-19 is spread via direct exposure through respiratory droplets with individuals in proximity and indirect exposure through surface contact with fomites [3]. Although, most COVID-19 exposures have been reported to occur via the respiratory system; recent research has revealed that SARS-CoV-2 RNA is found in the gastrointestinal tract [4,5]. Recent studies worldwide have indicated the detection and quantification of SARS-CoV-2 through sewage and wastewater [6,7,8,9,10]. Viable SARS-CoV-2 is released through human feces, saliva and sputum and makes its way through wastewater [4,11].
Wastewater is a Composite biological mixture of an entire community with biological specimens of each person in the community accumulated each day [12]. Wastewater-based epidemiology (WBE) is traditionally used for testing illicit drugs and STIs within communities [13,14] and has more recently, gained traction in detecting SARS-CoV-2 RNA in wastewater, and has been utilized for detecting enteric viruses such as poliovirus, Norovirus, hepatitis A virus [15,16]. Detection of SARS-CoV-2 in wastewater has become a novel approach to monitor viral shedding dynamics and make informed public health decisions [17]. SARS-CoV-2 has been shown to shed into feces in 27–89% of infected individuals, with estimated genomic copy levels ranging from 102-107 gc/mL in feces and 102-105 gc/mL in urine [18,19]. The average duration of SARS-CoV-2 RNA shed in feces is approximately 17 days; however, this duration may vary as new viral variants emerge [20].
Wastewater-based epidemiology (WBE) studies have reported evidence of local community transmission of SARS-CoV-2 prior to the first clinically documented cases [8,9,21,22]. Several studies in the United States found that WBE data predicted new clinical case reports by 2–8 days [17,23] and another study reported that viral titer trends in wastewater preceded clinical data by 4–10 days [24]. These findings suggest that monitoring SARS-CoV-2 RNA in wastewater can serve as an early indicator of the virus's presence in a community. Furthermore, a real-time study conducted in California found a correlation between SARS-CoV-2 RNA levels in settled solids and reported COVID-19 clinical cases [12,25,26]. Therefore, WBE has proven to be a valuable epidemiological tool and suitable complement to clinical testing, particularly in identifying delays in clinical testing within a particular community and underreported cases (along with increases in false positive and false negative results), facilitating early detection and outbreak prevention [27,28,29,30]
Real-time early warning, however, requires frequent wastewater sampling, rapid analytical methods, and timely communication of results to public health authorities. The correlation between SARS-CoV-2 RNA in wastewater and COVID-19 cases indicates that wastewater-based epidemiology (WBE) can offer valuable insights into community-level transmission dynamics. Moreover, WBE is not restricted to sampling at wastewater treatment plants (WWTPs). Consequently, larger communities, such as universities and hospitals have implemented WBE to address gaps in clinical testing and enhance understanding of infection dynamics. University settings, particularly, offer a valuable opportunity to implement wastewater surveillance due to the significant presence of asymptomatic populations and concentrated areas of potential transmission. Numerous higher education institutions and municipalities in the United States have recognized the utility of WBE as a surveillance tool for monitoring SARS-CoV-2 infection trends and swiftly identifying potential cases, thereby aiding health administrators in making informed decisions regarding infection control and contact tracing [19,31,32,33,34,35].However, while most studies have focused on collecting wastewater from large wastewater treatment plants (WWTPs) or local sewer sheds, building-specific collection, particularly in campus settings, can also provide valuable insights for inferring clinical incidences in university populations.
Here, we report the North Carolina A&T State University campus-wide wastewater surveillance analysis to monitor and assess SARS-CoV-2 transmission on campus. This study involved comparing SARS-CoV-2 concentrations in Grab samples collected biweekly from 11 different dormitories over a period of three consecutive years (Spring 2021-2023), alongside two composite samples. To assess the efficacy of wastewater-based epidemiology (WBE) as a predictive tool for COVID-19 outbreak dynamics, we examined the correlation between the concentration of the SARS-CoV-2 N1 gene in wastewater and the clinical COVID-19 cases reported in the corresponding dormitories and campus. Furthermore, we implemented a mixed linear-effects model to evaluate the association between levels of SARS-CoV-2 in wastewater and clinical cases reported per dormitory on campus in 2021. Additionally, from Spring 2022 to 2023, we quantified wastewater fecal strength using Pepper mild mottle virus (PMMoV) as a normalization biomarker in every sample.
2. Materials and Methods
2.1. Wastewater Sample Collection
The study was conducted in 11 designated dormitories on NCAT campus (Aggie Village 1, Aggie Village 3, Aggie Village 4, Aggie Village 6, Aggie Village E, Barbee Hall, Cooper Hall, Haley Hall, Holland Hall, Morrison Hall, Morrow Hall, and Pride Hall) shown in Figure 1. The inclusion criterion for these dormitories was determined by their high population size, resulting in a significantly higher inflow rate of wastewater into the manholes, rendering them particularly suitable for wastewater collection. Manholes placed outside the dormitories were chosen as the grab sampling sites with untreated wastewater. Samples of wastewater were collected between January to December 2021, January to December 2022 and January-June 2023 utilizing wastewater streaming from campus buildings. Sampling frequency was twice a week in the morning while once a week during the summer months.
2.2. Clinical Testing
NCA&T State University Health Center followed two clinical tests for COVID-19 diagnosis as recommended by CDC: antigen test via anterior nasal swab and Rt-PCR via nasopharyngeal swab samples. During 2020-2021, to decrease transmission, the institution required students who tested positive for SARS-CoV-2 to self-isolate in a quarantine dormitory (Haley Hall ~average 10 students per month) and employed the wastewater-based surveillance (WBS) as a secondary screening tool for SARS-CoV-2 spread on campus since 2021. Positive COVID-19 case numbers for the State of North Carolina were retrieved from NCDHHS dashboard [36]. The number of persons tested for SARS-CoV-2 on campus was compared to SARS-CoV-2 levels in the wastewater to estimate the number of RNA copies per person in total sewage water.
2.3. Wastewater Pre-Treatment
About 200mL of wastewater was collected and transferred into three 50 mL conical tubes (in 2021) or two 50mL conical tubes (2022 onwards). Two tubes were stored at -80°C, whereas the third tube was treated (one tube in case of 2022-2023 samples).Before processing the samples, 40mL of wastewater was treated with 0.5mL of alkaline protease [37] , to break down any unwanted proteins, and nucleases that degrade RNA.
2.4. Viral RNA Extraction
RNA was extracted according to the manufacturer's procedure using Promega Total Nucleic Acid Wastewater Extraction kit [37]. Briefly, silica based PureYield columns were used to absorb and concentrate total nucleic acids (TNA) from large quantities of wastewater. 40 mL of protease-treated wastewater was used to extract total nucleic acid (TNA) using a 20 mL PureYield column. At the completion of the extraction, a total of 40μl of TNA was eluted from each site (dormitory) in preheated (60°C) nuclease-free water.
2.5. Real Time-Quantitative Polymerase Chain Reaction
To detect and measure viral RNA, a SARS-CoV-2 RT-qPCR Kit for Wastewater was used (Promega; Madison, MI, USA). The primers for this kit were based on the published SARS-CoV-2 detection (Supplementary Table A.1) and quantification from the US Centers for Disease Control [38]. For this study, the N1 gene (highly abundant) was targeted. The SARS-CoV-2 RT-qPCR reaction plate was set up with 6 μl of the RT-qPCR amplification mix and 4 μl of extracted nucleic acid, reference RNA, or NTC (No Template Control). CFX Connect Real-Time PCR System (2021 samples) (Bio-Rad) and CFX 96 Touch Real-Time PCR System (Bio-Rad) (2022-2023) was used for RT-qPCR analysis following the thermal condition as: 25 °C for 2 min for initiation, reverse transcription at 45 °C for 15 min, and polymerase activation at 95°C for 2 min followed by running 40 cycles at 95 °C for 3s and 62 °C for 30s (CDC qRT-PCR panel 2020). Data was collected using the FAM/HEX/Cy5 channels of the CFX Maestro™ software. The concentration and purity of the extracted RNA were determined by using a Nanodrop™ (Thermo Fisher Scientific, Waltham, MA, USA). The absorbance readings at 260 nm and 280 nm (260/A280 ratios) are commonly used to determine the purity of nucleic acid with a general acceptable range between 1.9–2.1. Slopes and y-intercepts from RT-qPCR were used to quantify copies of SARS-CoV-2 in each reaction using the instrument’s recorded Cq value. Subsequently, the SARS-CoV-2 copy number value was then transformed into a gene copies/L of extracted wastewater value.
2.6. Quality Control
For quality control purposes, quantification of SARS-CoV-2 RNA was done using a standard curve with a dilution scheme (1:10) that was the same for the positive control and an NTC (No Template Control). The standard curve was generated by diluting the quantification standard RNA N+E (4 × 10⁶ copies/μl) 100-fold by mixing 2 μl in 198μl nuclease-free water to obtain a concentration of 1.6 x 10⁵ copies/μl. The Limit of Detection (LoD) was set at 8 copies per nucleic acid reaction and the Limit of Quantification (LoQ) was less than 25% coefficient of variance.
For 2022-2023 samples, the standard curve was generated by diluting the quantification standard RNA N+E (4 × 10⁶ copies/μl) 100-fold by mixing 2 μl along with 2μl of PMMoV virus, (used as an internal control) in 196μl nuclease-free water to obtain a total concentration of 1.6 x 10⁵ copies/μl.
2.7. Statistical Analysis
All Statistical analyses were computed using Prism GraphPad v.9, SPSS v.25 or R v4.4.0. For the wastewater analysis, correlations were examined using wastewater N1 gene concentration using SPSS v.25 and R studio. To determine if wastewater was a predictor of clinical cases, a cross-correlation between wastewater N1 gene concentrations per building and average of all buildings with COVID-19 clinical cases on campus per semester was computed. Spearman’s (Rs2) coefficient was determined for these analyses using base 10-logarithm-transformed values. These correlation coefficients were used to determine the strength of correlation relationship between the averaged wastewater N1 gene concentrations for a given date of specimen collection and the associated COVID-19 case rate, with a p-value of 0.05 or lower signifying significance. Correlations greater than 0.5 for R2 were considered strong. A one-way ANOVA was computed to quantify the differences between each dormitory and to test for statistical differences between sampling methods by comparing the detection of SARS-CoV-2 (Ct values) between samples collected using either the grab or composite method. All concentration of RNA copies/L determined for wastewater data between Spring 2021-2023 graphs were generated using Prism GraphPad v.9 and R v4.4.0.
3. Results and Discussion
3.1. Clinical COVID-19 Positive Cases on NCAT campus (2021-2023) and Correlation with State of NC
To determine the number of COVID-19 positive individuals in the dormitories, data was collected from the Student Health Center at North Carolina A&T State University (NCA&T) for the period spanning 2021-2023 (Spring, Summer, Fall), as shown in Figure 2a.
In the Spring 2021 semester, the health center recorded 175, 45, 166, and 314 COVID-19 positive cases in January, February, March, and April, respectively. During the Summer months of May through July 2021, only 23 positive cases were documented. However, a notable increase occurred in August, coinciding with the start of the Fall semester, with 312 positive cases was reported. The Fall semester saw a gradual decrease in positive cases from September to December 2021. In 2022, a notable peak in cases was observed at the beginning of the year, with 290 cases reported in January, followed by 198 cases in April and 118 cases in August, contrasting with the low case numbers (49 cases) reported during the Summer months. Significant COVID-19 case numbers were recorded in January, April, and August, while summer months saw very low case numbers. The increase in cases in January and August can be partially attributed to the return of students from winter and summer breaks, respectively, diminished vigilance regarding COVID-19 transmission risks, and the emergence of a more virulent Omicron subtype. These trends align with other studies observing increased SARS-CoV-2 prevalence in wastewater following holidays and gatherings, suggesting that post-travel and event-related surges in cases are common [39,40]. For Spring 2023, the highest number of cases occurred in February (246 cases), followed by January (126 cases), March (39 cases), and April (25 cases). According to the North Carolina Department of Health and Human Services (NCDHHS) wastewater dashboard, new case rates in Greensboro (North Buffalo WWTP) ranged from 3.75 to 1.62 per 10,000 persons between January and February, with a reported decline in March and April [41]. Overall, a decline in positive clinical cases was observed on campus from 2021 to 2023, likely due to prevalence of at-home testing and unwillingness of people to be tested often [42]. The data reflects clinical cases, home testing kit results were not included in these figures.
3.2. Quantification of SARS-CoV-2 Viral RNA in Wastewater in Spring 2021-2023
To determine the presence of SARS-CoV-2 RNA in effluent wastewater from dormitories across the NCA&T campus during 2021-2023, we employed qRT-PCR for the quantification.
The results shown in Figure 3a reveal distinct variations in viral RNA levels during these periods. Higher viral RNA copies of SARS-CoV-2 for the N1 gene were observed during the Spring semester compared to both Fall and Summer semesters of 2021. The average number of viral RNA copies detected in the Spring semester 2021 was 107 log RNA copies/L, indicating a notable presence of the virus during this period. On average, the RNA copies in wastewater were higher during the Spring months (January - April) (1.81×10⁵) compared to the summer months (May - July) (1.00×10⁵). This detailed seasonal comparison highlights the specific trends in RNA copies during spring, summer, and fall. In 2022, higher viral RNA copies of SARS-CoV-2 for the N1 gene were detected during the Spring 2022 semester as compared to the Fall and Summer semesters in 2022. The average number of viral RNA copies detected in the Spring was 1012 log RNA copies/L with an average Ct value of 32.98 for three replicates (Figure 3a). The lowest average levels of 105 log RNA copies/L were detected on campus during Summer semester with an average Ct value of 34.64. The average Ct value for the Fall semester was 34.43 and average RNA copies detected were 1011; suggesting that the number of RNA copies detected was lower in the Fall than in the Spring semester of 2022. Differences in RNA concentration across dormitories are shown in Supplementary Figure A.1. Higher viral RNA load was detected in Spring 2021 as compared to Spring 2022 and may be attributed to a higher number of vaccinated individuals as of 2022. Since the initiation of vaccination campaigns and the implementation of enhanced precautionary measures at the onset of the pandemic on campus, there has been a notable reduction in the number of clinical cases and RNA copies reported on campus since 2022, compared to the data from 2021.
Elevations in raw N1 concentration of SARS-CoV-2 were observed shortly following the return of college students to campus. We surmised that these increases are predominantly associated with the students' return at the commencement of the fall and spring semesters (specifically in January and August). Comparable surges in SARS-CoV-2 RNA levels were noted at other university campuses throughout the United States, with data indicating that, upon students' return, SARS-CoV-2 RNA concentrations significantly increased in wastewater samples from the majority of student residence hall monitoring locations [32,33,34,43,44]. Additionally, the potential influence of seasonal variability on wastewater-based epidemiology (WBE) analyses remains a subject of investigation [45,46,47]. Seasonal temperature fluctuations primarily affect the in-sewer transit time of the target virus. A study by Hart and Halden [46] in Detroit indicated that the virus’s persistence was approximately 100 hours in winter and 20 hours in summer. Furthermore, the duration required for a 90% reduction in virus titer is prolonged at lower temperatures [45,47]. Consequently, the observed higher RNA copy levels during the spring semesters of 2021 and 2022, compared to those in the summer and fall semesters, may be attributed to seasonal variability, warranting further investigation.
Additionally, we compared the mean SARS-CoV-2 RNA concentrations from each dormitory for the spring semesters of 2021-2023. The analysis performed using the Kruskal-Wallis test, revealed no statistically significant differences (F=0.86, P=0.569) (Supplementary table A.2). This indicates that the contributions of RNA concentrations observed in each dormitory were similar, as also illustrated in Figure 3b.
3.3. Correlation Between SARS-CoV-2 RNA Concentration and COVID-19 Clinical Data
A Spearman’s correlation analysis was carried out between positive dormitory infection case count and SARS-CoV-2 RNA concentrations corresponding to that dormitory in 2021 as shown in Figure 4a,b and separately for each dormitory is shown in Supplementary Figure A.2. Our dataset indicates a small but significant correlation between infection rates reported per dormitory and RNA copies in 2021 (Rs2=0.03 p=0.006).
Moreover, the mixed linear model applied to the wastewater system for predicting the number of clinical cases reported per building on campus in 2021 was unsuccessful in providing an epidemiological interpretation (p=0.704). In Spring 2022-2023, a Spearman’s correlation between clinical cases (reported by each month) and RNA concentrations was carried out. A weak and non-significant relationship was observed (Rs2=0.007, p=0.65). This outcome is not surprising given that numerous off-campus students did not contribute to the campus wastewater system corresponding to particular dormitories under study, yet some of them were still subjected to clinical testing in accordance with mandated testing policies and protocols. Moreover, the clinical health center at NCA&T did not report the cases per dormitory as done previously in 2021. The relationship between viral concentration in wastewater and the number of positive clinical cases appears to be strongly influenced by population size and the temporal resolution of the data, suggesting that broader temporal scales may obscure finer patterns [48,49]. Other wastewater surveillance studies have observed that sampling wastewater from neighborhood sites within a campus or individual buildings compared to cluster of buildings [19], county, or state wastewater treatment plants [12,25], which may offer more accurate representations of the viral signal. Therefore, to improve monitoring and avoid potential misinterpretation due to transitions from campus to city, tracking individuals who test positive through wastewater analysis could help maintain accurate city-wide epidemiological trends. Alternatively, clinical testing may lag wastewater monitoring during periods of high incidence (overwhelming contact tracing and clinical testing capacities, or during pandemic peaks) [33,50].
3.4. Normalizing SARS-CoV-2 RNA Concentrations by PMMoV Does not Substantially Impact Results
For spring 2022-2023, we generated PMMoV data at the NCA&T campus to determine if SARS-CoV-2 RNA concentrations normalized using these data improved correlations to clinical data. Our study for the period of Spring 2022- 2023 showed that normalizing SARS-CoV-2 concentrations by PMMoV yielded low, insignificant correlation (Rs2=0.002, P=0.29). In addition, trends for normalized RNA concentrations with clinical cases in Spring 2022-2023 had a weak and insignificant correlation (Rs2= 0.02, p=0.85). This suggests that PMMoV normalization did not significantly enhance the correlation with clinical data compared to non-normalized SARS-CoV-2 concentrations (Figure 5b).
While some studies advocate for PMMoV normalization [51,52], others have found no improvement in using a normalization fecal marker to positively affect correlations between wastewater concentrations and positive clinical cases [39,53,54,55,56]. Zhan et al [40] demonstrated that β2M (β-2 microglobulin), which copurifies with SARS-CoV-2 RNA and is present in various body fluids, provided more promising results compared to PMMoV [57,58,59]. Additionally, Hsu et al. [60] identified the CAF metabolite PARA as a more reliable biomarker than PMMoV due to its higher accuracy and temporal consistency in reflecting population dynamics and dilution in wastewater. Maal Bared et al.,[55] also showed that using unnormalized concentrations or normalizing by other parameters such as total Kjeldahl nitrogen (TKN), total phosphorus (TP), and ammonia (NH3) provided comparable results to PMMoV. Consequently, the use of alternative fecal biomarkers should be considered to enhance the accuracy of SARS-CoV-2 quantification in wastewater and improve estimates of human case counts.
3.5. Comparison of Composite and Grab Sampling Methods on NCA&T Campus
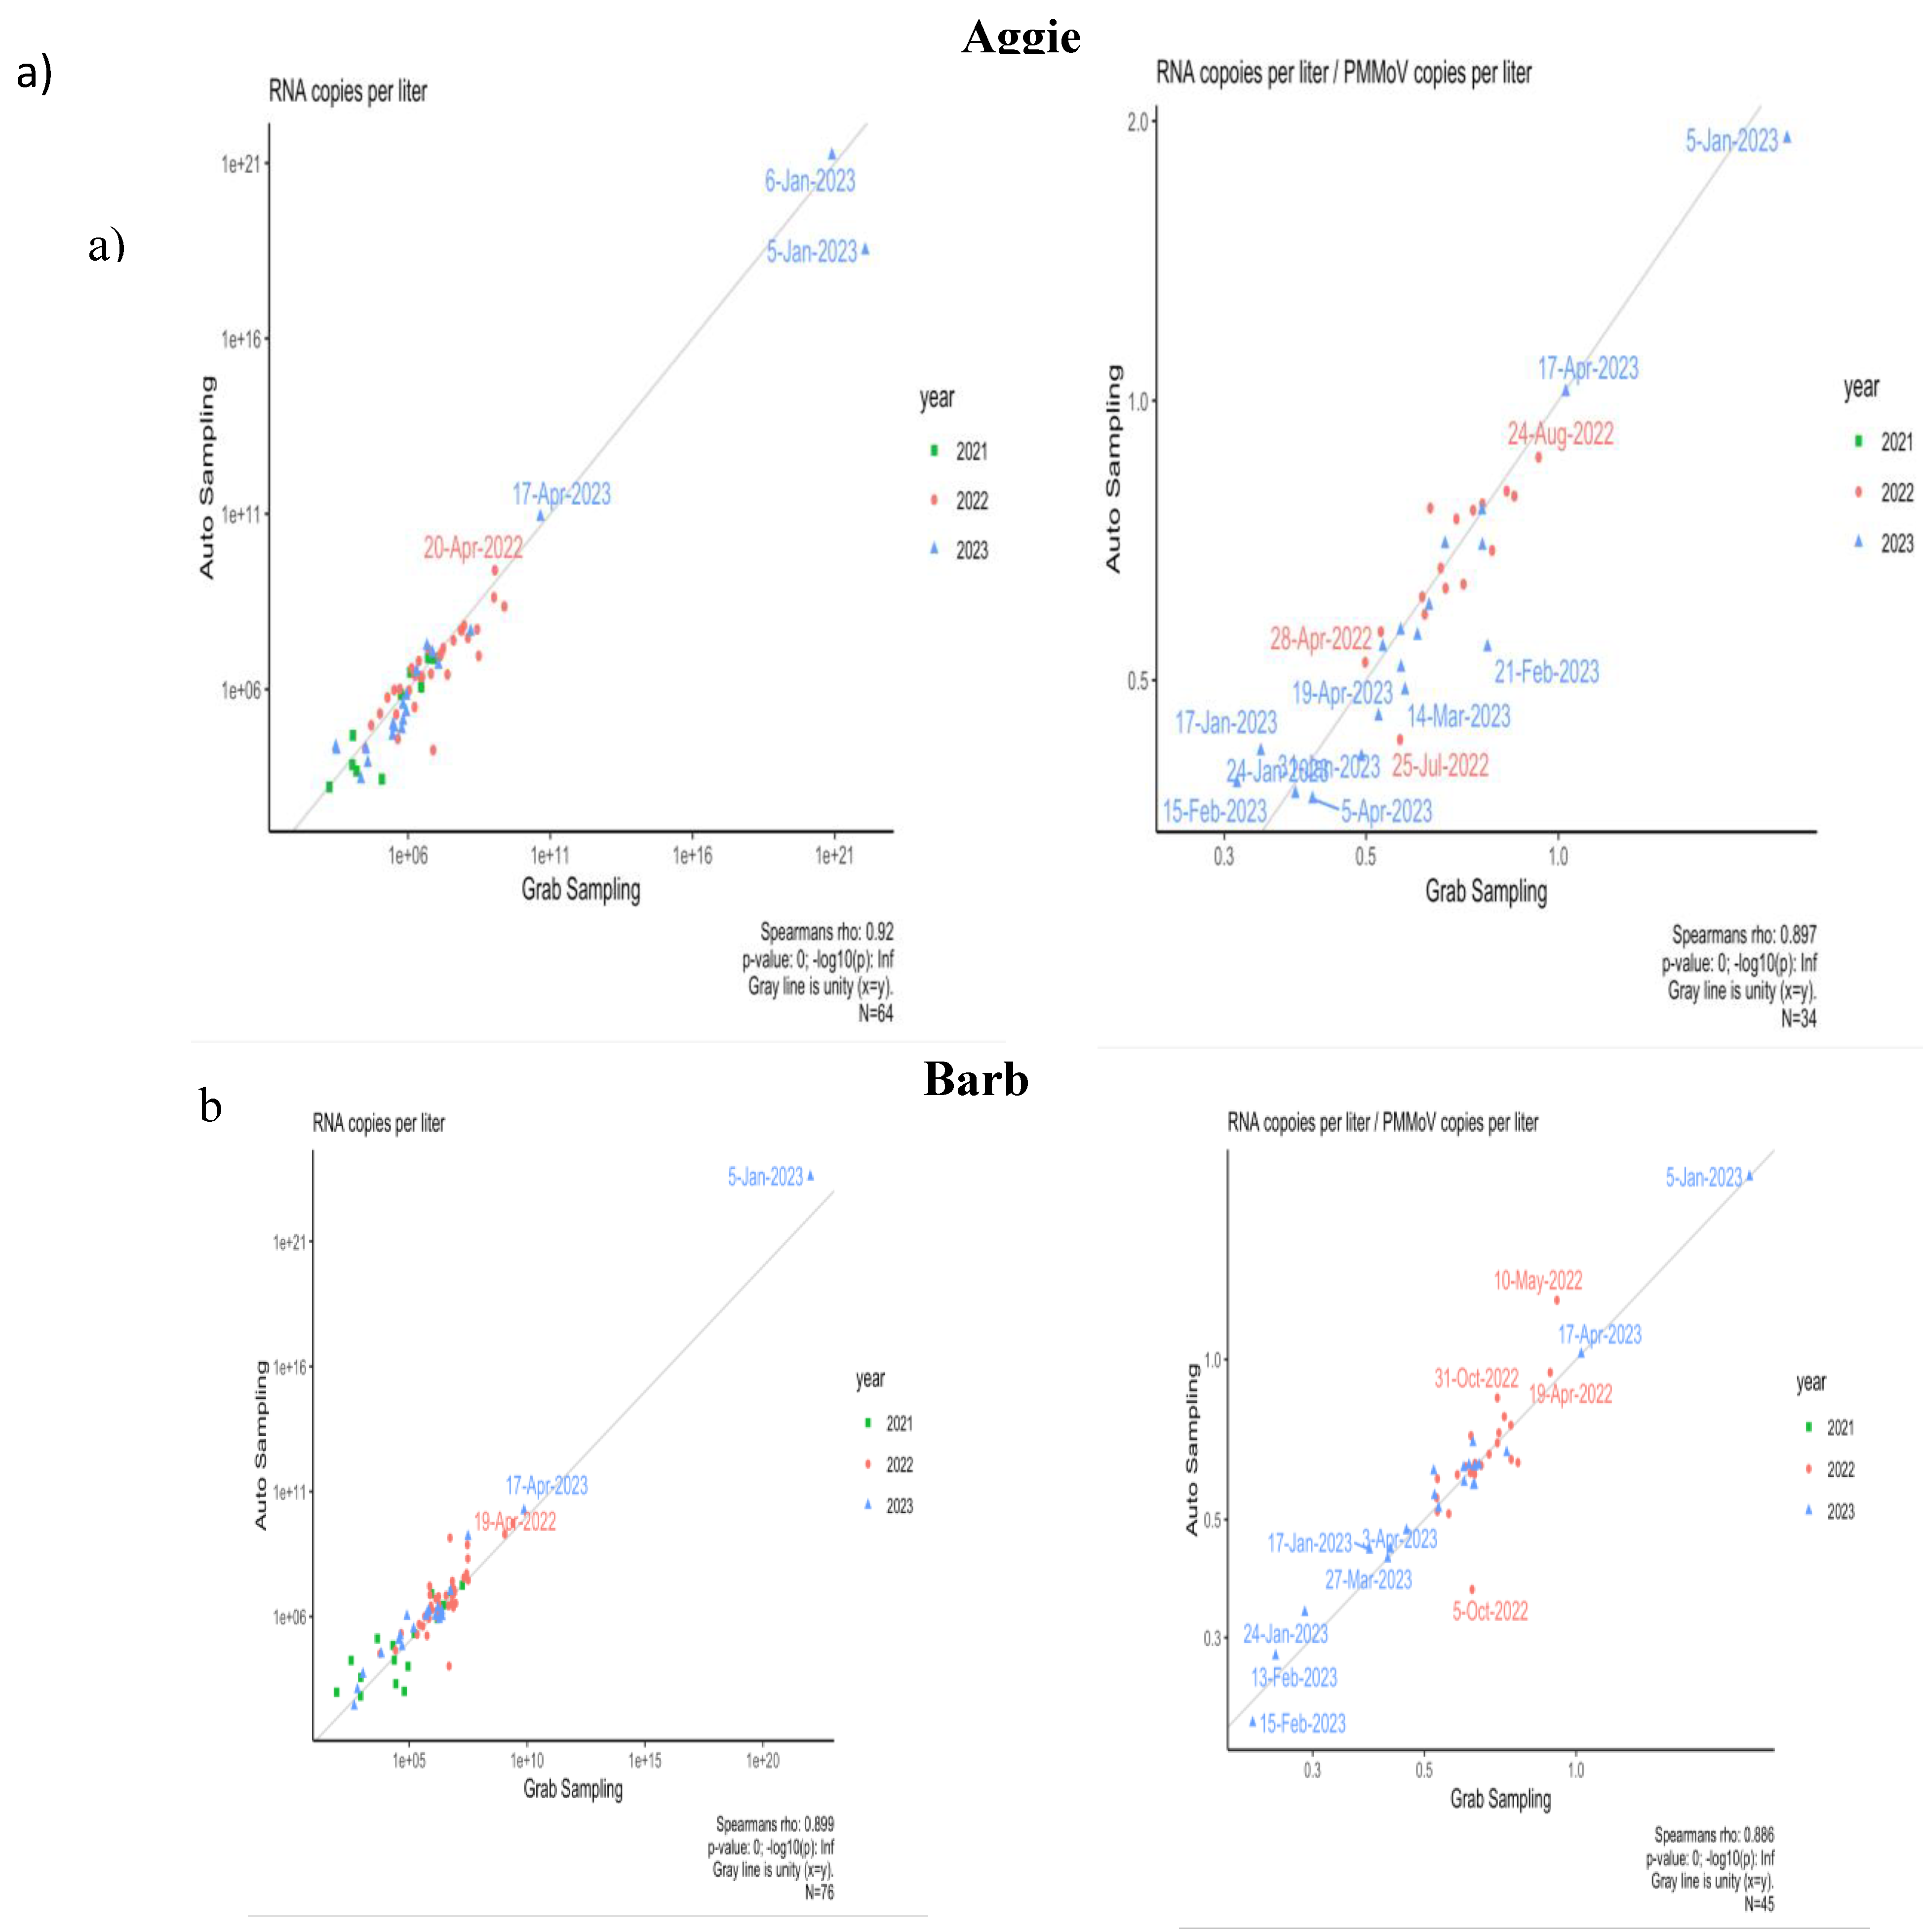
To identify the optimal sampling method correlating with community transmission of SARS-CoV-2, samples were collected using two methods: Grab and Composite sampling since Fall 2021. The comparison of Grab and Composite samples was conducted for two dormitories, Aggie Village 4 and Barbee Hall. A strong positive and significant correlation was observed between Grab and composite sampling methods for both halls: Aggie Village 4 (Grab) and Aggie Village 4-Auto (Composite) samples (Rs2 = 0.84, p=0.00) and between Barbee (Grab) and Barbee-Auto (Composite) samples (Rs2 = 0.80, p=0.00) between Fall 2021- Spring 2023, as shown in Figure 6a. Our findings align with previous studies that have reported a strong significant correlation between both methods [61,62]. A study conducted in Virginia found a strong correlation between grab and composite samples during a period of low transmission, based on samples collected from a municipal wastewater treatment facility [63]. In contrast, a study by Rafiee et al.[64], reported that grab samples exhibited lower levels of SARS-CoV-2 RNA in wastewater compared to composite samples. This disparity in performance is likely attributable to the substantial daily fluctuations in human fecal matter at the sub-sewer shed level. Moreover, Composite sampling, which aggregates multiple aliquots over a week, may capture a more representative average of viral presence compared to Grab sampling, which can introduce temporal variability. Increased frequency of Composite sampling might enhance accuracy in SARS-CoV-2 concentration estimates. To mitigate variability, it is suggested that Grab samples be collected multiple times per day, potentially up to six times, to improve correlation between viral shedding and wastewater data.
Furthermore, a correlation analysis was conducted to compare the two sampling methods using normalized data adjusted by PMMoV as shown in Figure 6b. For the Aggie V4 (Grab) and Aggie V4-AS (Composite) methods, a strong and significant correlation was observed (Rs2 = 0.79, p=0.00). Similarly, for the Barbee (Grab) and Barbee-Auto (Composite) hall, a strong and significant correlation was observed (Rs2= 0.78, p=0.00). The incorporation of PMMoV did not result in a significant enhancement in the correlations between the two sampling methods. Variations in seasonal patterns of viral biomarkers attributable to differences in sewer shed characteristics (e.g., flow rates, input sources) may influence the efficacy of normalization techniques in enhancing correlations [65]. Normalization of SARS-CoV-2 concentrations using PMMoV as a reference may provide benefits at certain sites or times by accounting for variations in flow, fecal matter, or sampling methodologies. However, caution is warranted in interpreting normalized data. The behavior of PMMoV in the sewer system may differ from that of SARS-CoV-2, with the latter being more uniformly distributed between solids and supernatant [65,66]. Consequently, increases in wastewater volume due to environmental factors such as precipitation or snowmelt are likely to result in a dilution of viral concentrations of the biomarker.
4. Conclusions
This study represented a first and one of the most comprehensive wastewater surveillance efforts on the campus of North Carolina A&T State University, across 11 dormitories over a period of 3 years. In this study, we have demonstrated that WBE is a novel method as it provides a standardized detection of viruses and pathogen load in wastewater sampling on campus. This technology is innovative, and helped to detect and monitor, the spread of SARS-CoV-2 on the campus of North Carolina A&T State University between Spring 2021-2023 while allowing the school administration to engage in critical conversations regarding topics such as dormitory occupancy, clinical testing, and switching to in-person classes versus online mode. Through this study, informed decisions about the health of NCAT students and staff while also continually monitoring the risk of COVID-19 spread was accomplished (particularly at the peak of the pandemic in 2021).
Wastewater-based epidemiology (WBE) has significant potential as an effective early warning system for community-wide monitoring of viruses in public health surveillance as shown in other studies [5,12,19,26,67]. However, several challenges identified in this study present opportunities for further research and improvement, especially in campus settings. A major limitation of the study was the confounding influence of variations in clinical data. In 2021, we observed a small but significant correlation (Rs2=0.03, p=0.006) between RNA concentrations and weekly reported clinical cases per dormitory while a weak and non-significant relationship was observed in Spring 2022-2023 Rs2=0.007, p-value=0.65). However, the mixed linear model applied to the wastewater system for predicting the number of clinical cases reported per building on campus in 2021 also failed in providing an epidemiological interpretation (p=0.704), suggesting inclusion of additional dormitories and accurate reporting of positive clinical cases corresponding to those dormitories, that could improve our understanding of the major factors that impact the correlation strength and lag between SARS-CoV-2 concentration in wastewater and clinical case counts. As the distribution of home-kits evolved in the subsequent years, it became increasingly challenging to monitor more effectively on a per-dormitory basis. To improve clarity, administering questionnaires in these dormitories could provide a more accurate assessment of infection rates. This approach would help establish a comprehensive database to track re-emerging infections, evaluate vaccination coverage, and identify unreported cases from at-home testing kits. Ultimately, this data could enhance contact tracing efforts through digital technology [68]. Correlating these data with the daily RNA copy numbers detected could yield more robust and informative results in future studies. Thus, by computing and plotting the total concentration detected daily, it is possible to examine the spread of the virus in a given area for every new infection arising by each case reported in the corresponding dormitory. Another useful parameter would be to conduct a geospatial analysis to evaluate the influence of dormitory age on the transmission dynamics of the virus. This investigation could reveal whether recently constructed dormitories, which are likely to have advanced ventilation systems, exhibit differences in infection rates compared to older facilities. Comprehensive analysis and ongoing monitoring are essential to better understand the seasonal dynamics of viral prevalence in wastewater.
In addition, PMMoV was incorporated as a normalization fecal strength biomarker to account for variations in dilution. The use of surrogate viruses as controls for fecal strength has been demonstrated to ensure consistent method performance across sample types and over time, addressing changes in target concentration efficiencies and RNA extraction (Feng et al., 2021; Graham et al., 2021; Wolfe et al., 2021). However, we found no significant differences (p > 0.005) between the trends of normalized and non-normalized SARS-CoV-2 concentrations. Additionally, the correlation between normalized RNA concentrations and clinical cases during Spring 2022–2023 was weak and insignificant (Rs2=0.002, p-value=0.29). Incorporating PMMoV did not enhance the correlation strength with clinical cases, consistent with findings from other studies, suggesting that recovery and extraction efficiency may vary depending on the input concentration of the surrogate virus and the chemical properties of the wastewater samples. Additionally, a strong positive correlation between Grab and Composite sampling methods for two sites under consideration: Aggie Village 4 and Aggie Village 4-Auto samples (Rs2 = 0.84, p=0.00) and between Barbee and Barbee-Auto samples (Rs2 = 0.80, p=0.00) for Fall 2021-2023. Therefore, to enable quantitative trend analysis, it is essential to maintain consistent analytical performance despite numerous variables that can impact the process. Addressing these challenges is critical to advancing the utility of WBE as a reliable tool for public health surveillance and early intervention strategies. Lastly, quantifying infectious virions in wastewater samples, which was not included in our study, could also provide valuable insights into the infection rate of SARS-CoV-2 and natural decay of the virus in sewers.
Therefore, with robust quality assurance and quality control protocols, WBE can serve as a valuable complement to, but not a replacement for, clinical testing. While retrospective studies have highlighted its promise for early detection, real-time early warning. The effectiveness of WBE is closely tied to the reliability and efficiency of analytical processes. Wastewater and sludge are characterized by complex sample matrices, and the concentrations of viruses or viral components are often extremely low, particularly during the initial phases of a community outbreak. Additional critical factors influencing WBE performance include frequent (e.g., daily) sampling, rapid sample transport, streamlined analytical workflows, and timely result reporting. In this study, sampling at the building or dormitory level introduced higher stochastic variability compared to retrospective studies that primarily focused on wastewater treatment plants (WWTPs) and local sewer sheds, which demonstrated stronger correlations with clinical case data.
Author Contributions
Formal Analysis, Methodology: SB, TVNM, ML, DW, OJ, Data curation: TVNM (2021), SB (2021-2023), Writing - original draft: SB; writing-review and editing: SB, DD, LJF, AF, Statistical Analysis: SB, IB, AF, Conceptualization, visualization, Project administration, validation, Funding acquisition, Supervision: LJF, DD. All authors have read and agreed to the published version of the manuscript.
Funding
This work was supported in part by the Engineering Research Centers Program of the National Science Foundation under NSF Cooperative Agreement No. EEC-2133504 and wastewater surveillance funding of North Carolina A&T State University, North Carolina Office of State Budget and Management (OSBM), North Carolina Collaboratory and the Triangle Center for Evolutionary Medicine (TriCEM).
Institutional Review Board Statement
Not applicable.
Informed Consent Statement
Not applicable.
Data Availability Statement
The original data presented in the study are openly available in the project git repository at https://github.com/FodorLab/SARS-CoV-2_wastewater_NCAT or by request from the corresponding author.
Acknowledgments
We would like to acknowledge Dr. Raymond Samuel, Professor, Department of Biology for his support and the health center staff; Robert Doolittle MD., Padonda Webb MD., for providing us with the clinical data. Facilities for helping with the weekly sampling: Shawn Hughes, Martis Robinson and members of LJF and Deng lab for their help with sampling and molecular analysis and Fodor lab with the data analysis.
Conflicts of Interest
The authors declare no conflicts of interest.
Abbreviations
The following abbreviations are used in this manuscript:
WBE: Wastewater-Based Epidemiology
SARS-CoV-2: Severe Acute Respiratory Syndrome Coronavirus 2
CDC: Center for disease control and prevention
ACE2: angiotensin-converting enzyme 2
LoD: Limit of Detection
LoQ: Limit of Quantification
PMMoV: Pepper mild mottle virus
PCR: Polymerase Chain reaction
Appendix A
Figure A1.
Amount of N1 gene copy numbers in Wastewater in all buildings between 2021-2023.
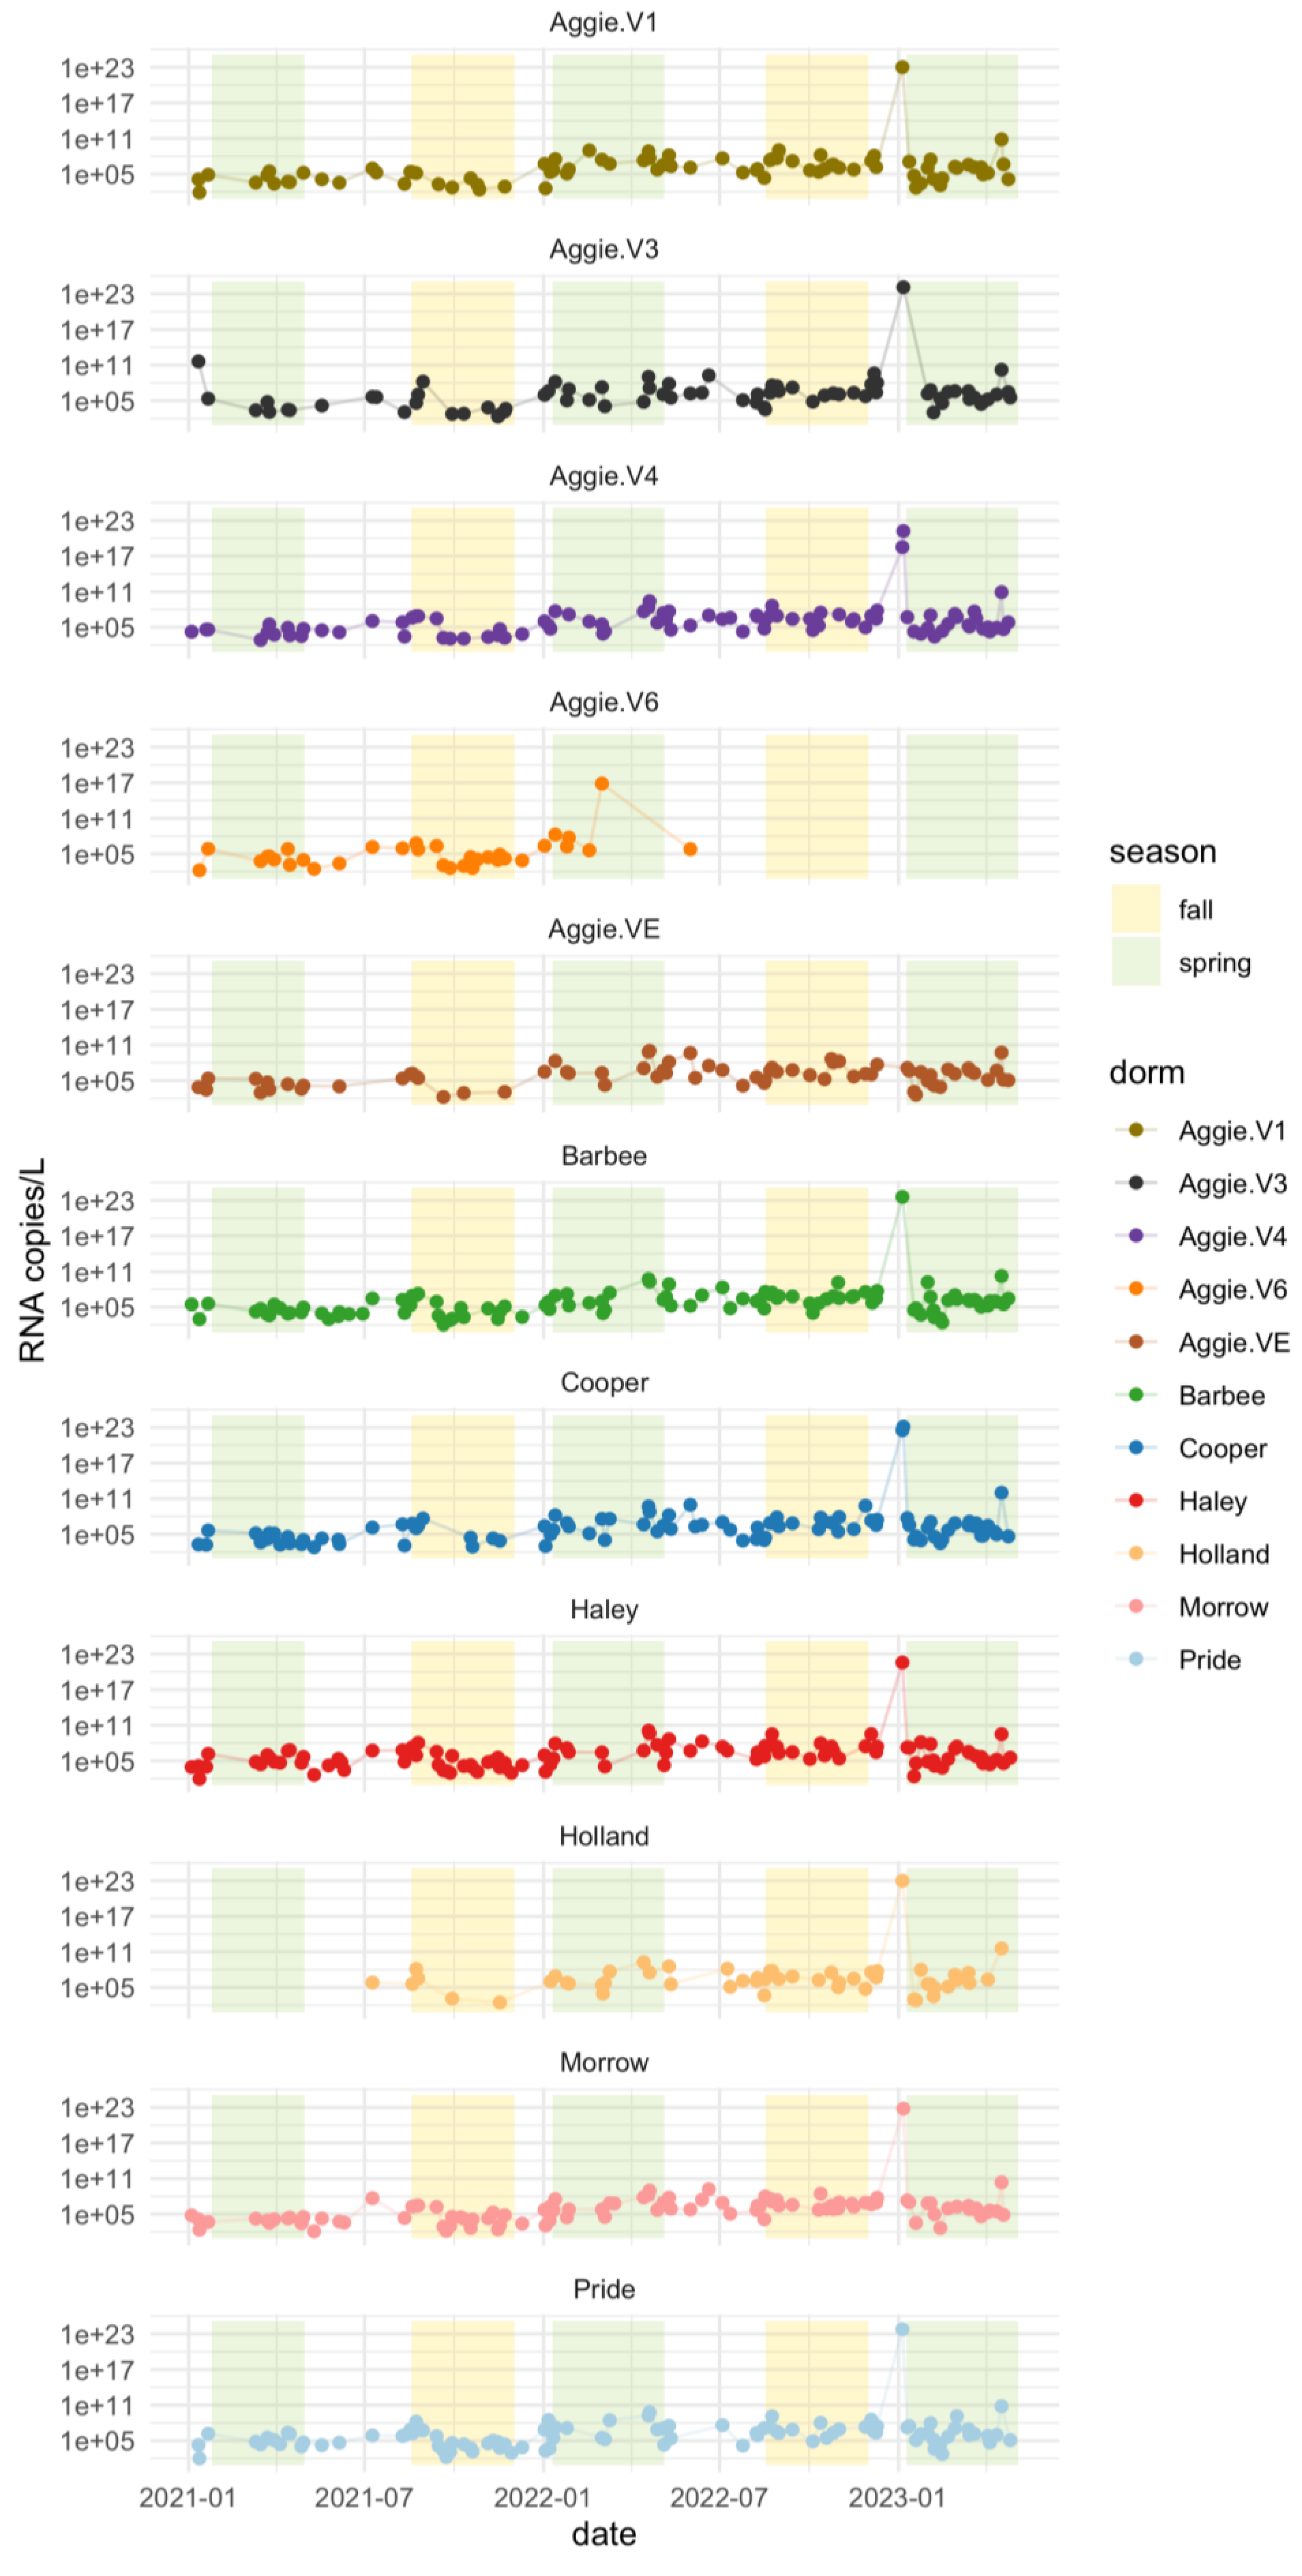
Figure A2.
Predictions of the incidence rates based on observed amount of N1 gene copy numbers in wastewater in all buildings in 2021.
Figure A2.
Predictions of the incidence rates based on observed amount of N1 gene copy numbers in wastewater in all buildings in 2021.
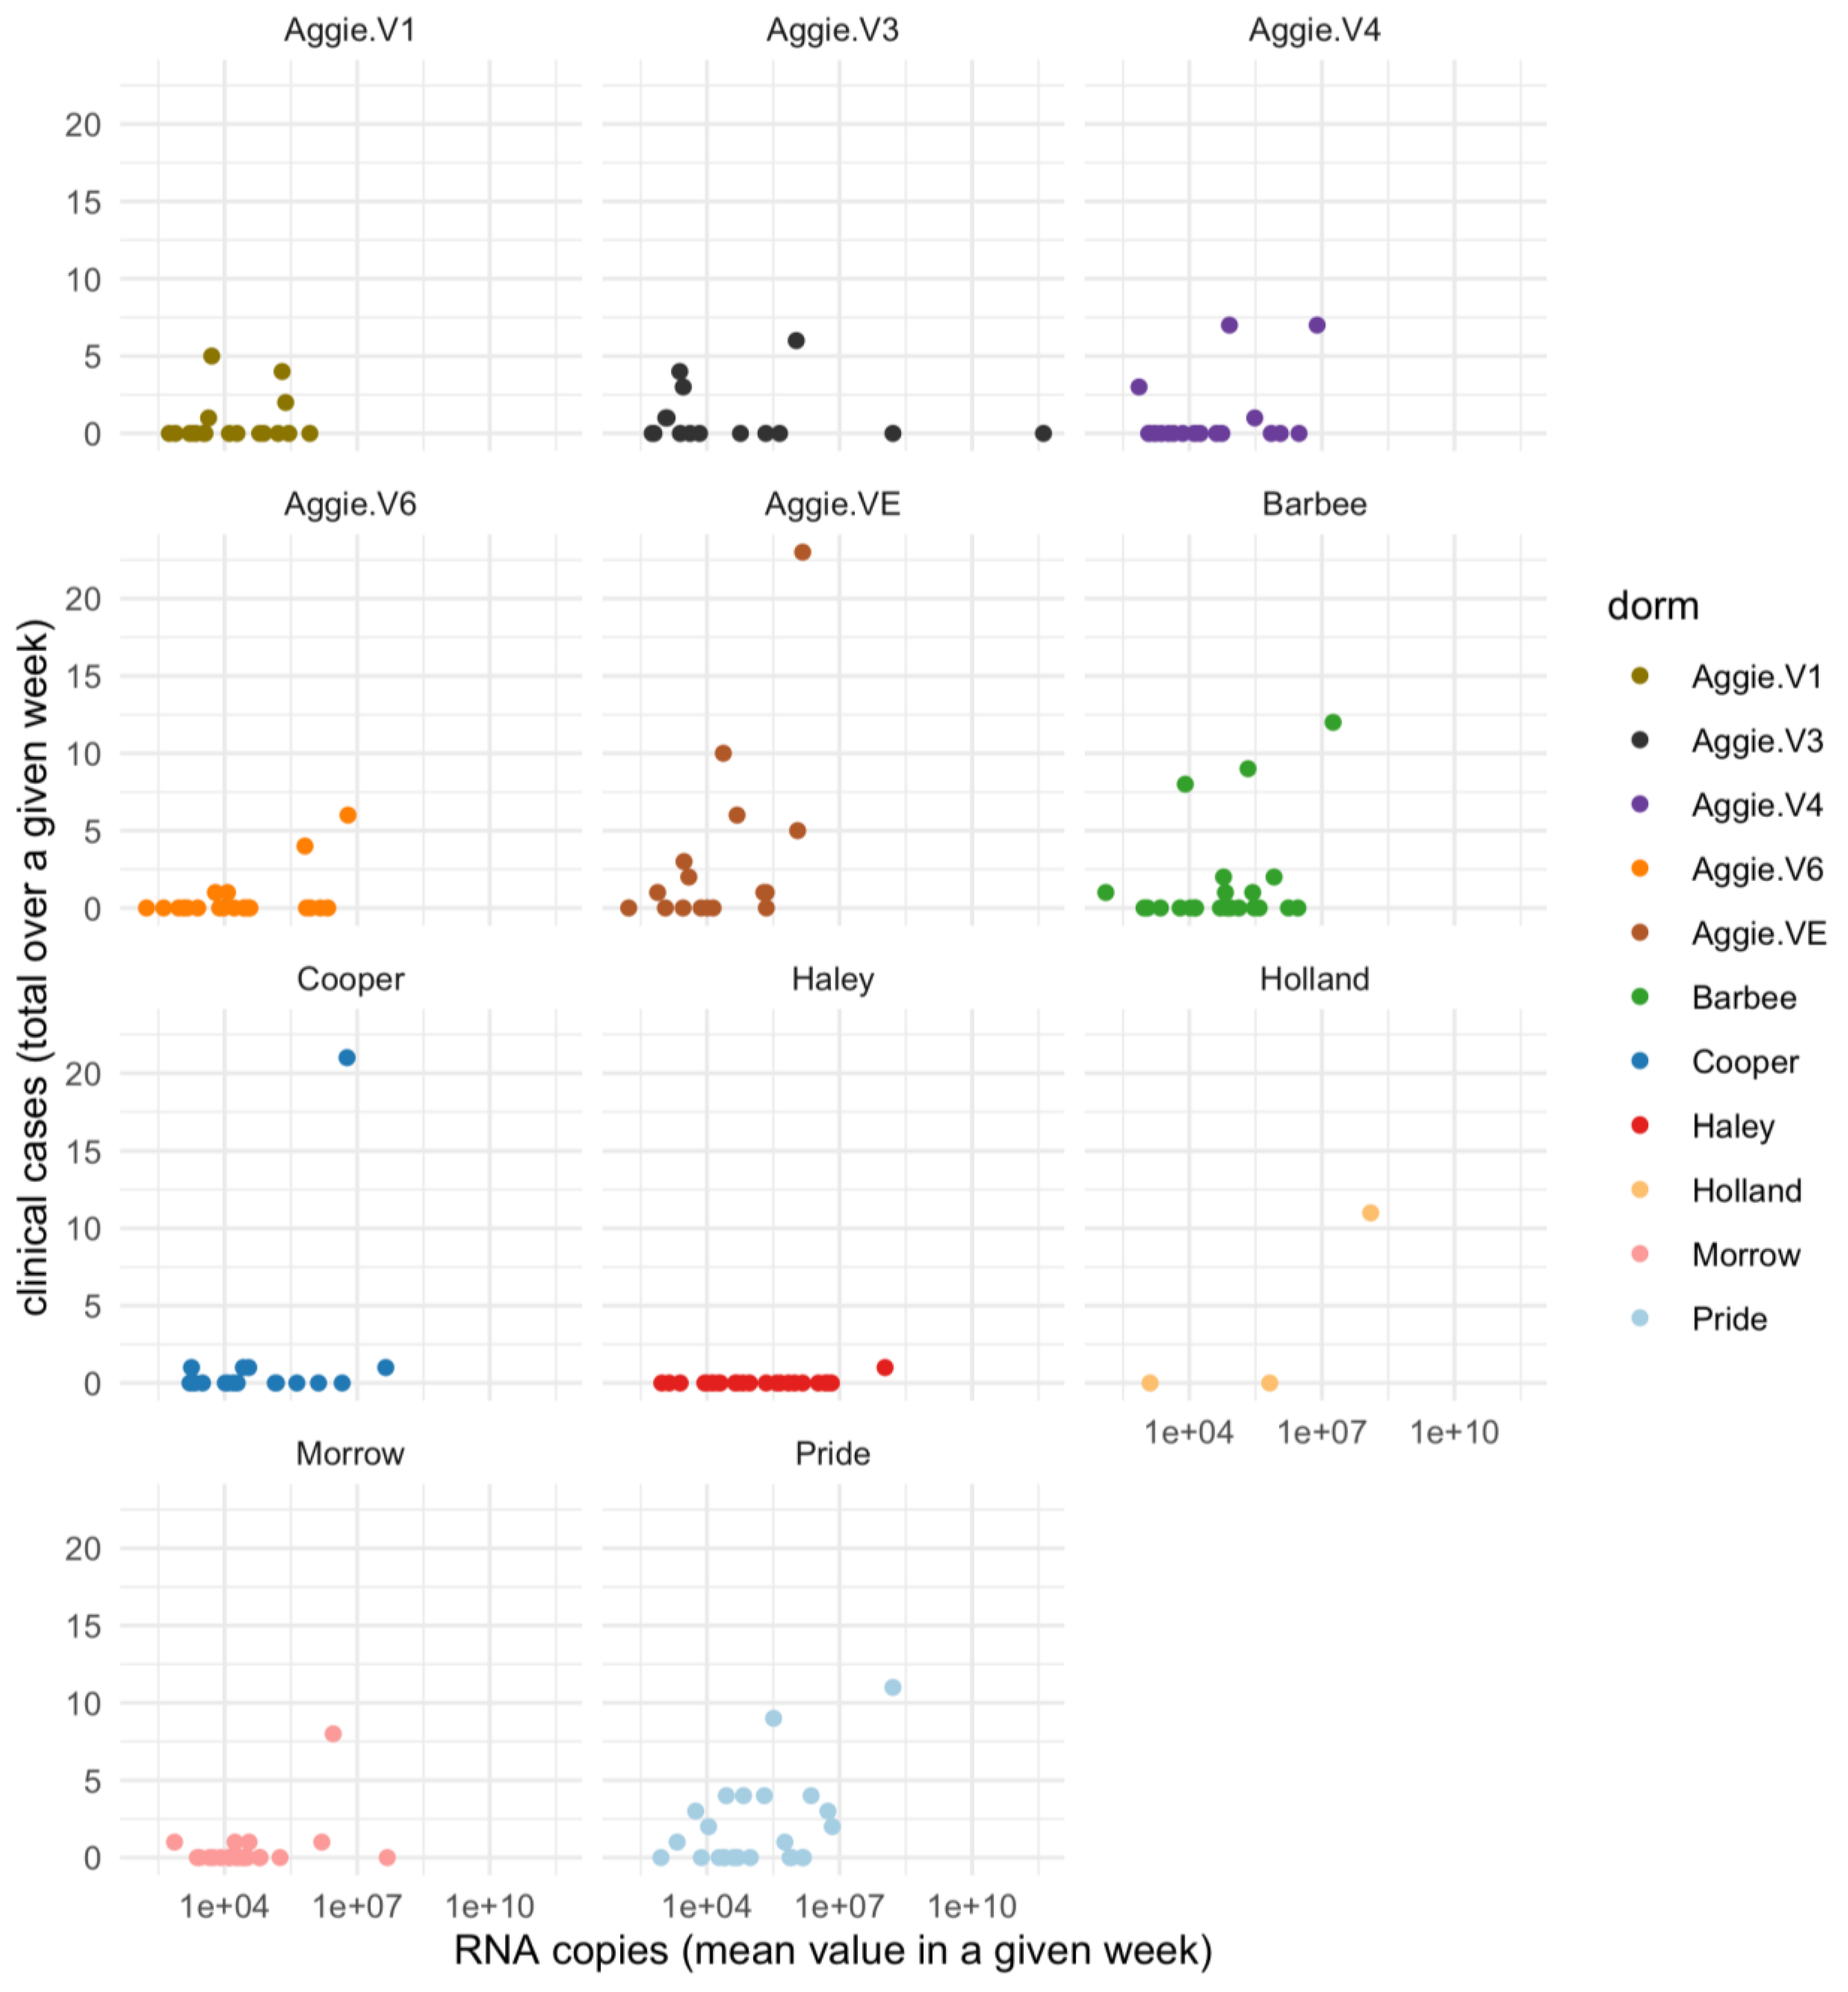

Table A1.
Prime/Probe sequences for N1 gene (Promega; (CDC, Centers for Disease Control and Prevention, 2021) used for quantifying SARS-CoV-2 in wastewater 2021-2023.
Table A1.
Prime/Probe sequences for N1 gene (Promega; (CDC, Centers for Disease Control and Prevention, 2021) used for quantifying SARS-CoV-2 in wastewater 2021-2023.
| Name | Sequence | Probe/Quencher |
| 2019-nCoV_N1-F | 5’-GACCCCAAAATCAGCGAAAT-3’ | |
| 2019-nCoV_N1-R | 5’-TCTGGTTACTGCCAGTTGAATCTG-3’ | |
| 2019-nCoV_N1-P | 5’-ACCCCGCATTACGTTTGGTGGACC-3’ | FAM/ ZEN/IBFQ |
Table A2.
Kruskal Wallis Analysis for comparisons in means of wastewater influent from all buildings (55 comparisons) on NCA&T State University.
Table A2.
Kruskal Wallis Analysis for comparisons in means of wastewater influent from all buildings (55 comparisons) on NCA&T State University.
| Level | - Level | Score Mean Difference | Std Err Dif | Z | p-Value | Hodges-Lehmann | Lower CL | Upper CL |
|---|---|---|---|---|---|---|---|---|
| Haley | Aggie V6 | 22.9564 | 8.232900 | 2.78837 | 0.0053* | 2.13656 | 0.67685 | 3.79031 |
| Cooper | Aggie V6 | 21.8878 | 7.613014 | 2.87504 | 0.0040* | 2.26015 | 0.68478 | 4.03072 |
| Pride | Aggie V6 | 21.8085 | 7.613014 | 2.86464 | 0.0042* | 2.39968 | 0.78832 | 3.98360 |
| Barbee | Aggie V6 | 19.5053 | 8.137181 | 2.39705 | 0.0165* | 1.83228 | 0.34738 | 3.39687 |
| Morrow | Aggie V6 | 18.7431 | 7.993824 | 2.34469 | 0.0190* | 1.84367 | 0.22610 | 3.50926 |
| Holland | Aggie V6 | 18.7084 | 5.549995 | 3.37088 | 0.0007* | 3.55921 | 1.54755 | 5.09805 |
| Holland | Barbee | 17.0216 | 7.855377 | 2.16688 | 0.0302* | 1.48582 | 0.13591 | 2.80863 |
| Aggie VE | Aggie V6 | 16.9639 | 6.443238 | 2.63283 | 0.0085* | 2.19304 | 0.62432 | 4.07702 |
| Holland | Aggie V4 | 14.4970 | 7.243058 | 2.00151 | 0.0453* | 1.48457 | 0.02790 | 2.78236 |
| Holland | Haley | 13.4924 | 7.928587 | 1.70175 | 0.0888 | 1.19719 | -0.21118 | 2.51796 |
| Holland | Aggie V1 | 13.0466 | 6.928378 | 1.88307 | 0.0597 | 1.24316 | -0.05696 | 2.80203 |
| Holland | Aggie V3 | 11.3852 | 6.689999 | 1.70182 | 0.0888 | 1.15060 | -0.18957 | 2.69423 |
| Holland | Cooper | 9.3176 | 7.456880 | 1.24953 | 0.2115 | 1.00426 | -0.48465 | 2.47990 |
| Holland | Aggie VE | 9.2815 | 6.589955 | 1.40843 | 0.1590 | 1.03178 | -0.40502 | 2.49874 |
| Cooper | Barbee | 7.4897 | 8.338446 | 0.89822 | 0.3691 | 0.46202 | -0.58276 | 1.52714 |
| Pride | Morrow | 7.4134 | 8.272762 | 0.89612 | 0.3702 | 0.48360 | -0.61921 | 1.56708 |
| Pride | Barbee | 7.3735 | 8.338446 | 0.88427 | 0.3765 | 0.51342 | -0.55939 | 1.58334 |
| Haley | Barbee | 5.8914 | 8.583283 | 0.68638 | 0.4925 | 0.38685 | -0.70313 | 1.42052 |
| Pride | Aggie V1 | 5.3294 | 7.815766 | 0.68188 | 0.4953 | 0.40307 | -0.84494 | 1.67871 |
| Cooper | Aggie V1 | 4.9956 | 7.815766 | 0.63917 | 0.5227 | 0.46081 | -0.86416 | 1.64649 |
| Pride | Aggie V4 | 4.9839 | 7.983121 | 0.62431 | 0.5324 | 0.38248 | -0.71471 | 1.54344 |
| Cooper | Aggie V4 | 4.0988 | 7.983121 | 0.51344 | 0.6076 | 0.29361 | -0.78093 | 1.46005 |
| Cooper | Aggie V3 | 3.8197 | 7.699417 | 0.49610 | 0.6198 | 0.32714 | -0.98463 | 1.53169 |
| Haley | Aggie V4 | 3.7471 | 8.282570 | 0.45241 | 0.6510 | 0.23286 | -0.81702 | 1.33025 |
| Aggie VE | Aggie V1 | 3.5788 | 7.249087 | 0.49369 | 0.6215 | 0.30862 | -1.02709 | 1.62380 |
| Haley | Aggie V1 | 3.2007 | 8.147566 | 0.39284 | 0.6944 | 0.25417 | -1.00324 | 1.50186 |
| Pride | Aggie V3 | 3.0254 | 7.699417 | 0.39294 | 0.6944 | 0.29335 | -0.98389 | 1.57729 |
| Aggie VE | Aggie V4 | 3.0096 | 7.488452 | 0.40190 | 0.6878 | 0.25393 | -0.95633 | 1.55410 |
| Aggie VE | Aggie V3 | 2.4574 | 7.072502 | 0.34745 | 0.7282 | 0.19152 | -1.13620 | 1.44823 |
| Pride | Haley | 1.9501 | 8.382832 | 0.23263 | 0.8160 | 0.13229 | -0.96052 | 1.25973 |
| Pride | Aggie VE | 1.9003 | 7.654120 | 0.24827 | 0.8039 | 0.14785 | -1.16108 | 1.32746 |
| Haley | Aggie V3 | 1.7844 | 8.058638 | 0.22143 | 0.8248 | 0.14705 | -1.15556 | 1.43785 |
| Cooper | Aggie VE | 1.7568 | 7.654120 | 0.22953 | 0.8185 | 0.12360 | -1.13386 | 1.32175 |
| Aggie V3 | Aggie V1 | 1.3233 | 7.310055 | 0.18103 | 0.8563 | 0.12271 | -1.20002 | 1.43147 |
| Pride | Cooper | 0.8265 | 8.103497 | 0.10200 | 0.9188 | 0.04909 | -1.14950 | 1.17855 |
| Morrow | Barbee | 0.3629 | 8.486108 | 0.04276 | 0.9659 | 0.02088 | -1.03813 | 1.06013 |
| Aggie V4 | Aggie V1 | 0.2865 | 7.669566 | 0.03735 | 0.9702 | 0.01429 | -1.27179 | 1.30055 |
| Haley | Aggie VE | -0.2952 | 8.025833 | -0.03678 | 0.9707 | -0.02714 | -1.30187 | 1.18195 |
| Morrow | Aggie V1 | -0.3545 | 8.017814 | -0.04421 | 0.9647 | -0.02727 | -1.31468 | 1.14226 |
| Aggie V4 | Aggie V3 | -0.8049 | 7.539826 | -0.10676 | 0.9150 | -0.07449 | -1.39833 | 1.18004 |
| Haley | Cooper | -1.1432 | 8.382832 | -0.13637 | 0.8915 | -0.09410 | -1.19203 | 1.02958 |
| Barbee | Aggie V1 | -1.3370 | 8.095375 | -0.16516 | 0.8688 | -0.09270 | -1.26328 | 1.10596 |
| Barbee | Aggie V4 | -2.2249 | 8.235193 | -0.27017 | 0.7870 | -0.13667 | -1.18708 | 0.97092 |
| Morrow | Aggie V3 | -2.2253 | 7.918567 | -0.28102 | 0.7787 | -0.19695 | -1.40998 | 1.03661 |
| Barbee | Aggie V3 | -2.4007 | 8.002350 | -0.30000 | 0.7642 | -0.14466 | -1.39156 | 0.98458 |
| Morrow | Aggie V4 | -2.4872 | 8.164964 | -0.30462 | 0.7607 | -0.14717 | -1.22786 | 0.99928 |
| Morrow | Aggie VE | -4.2911 | 7.881054 | -0.54448 | 0.5861 | -0.36435 | -1.58536 | 0.81397 |
| Barbee | Aggie VE | -5.0778 | 7.967675 | -0.63730 | 0.5239 | -0.37470 | -1.52178 | 0.77014 |
| Morrow | Haley | -5.4868 | 8.526738 | -0.64348 | 0.5199 | -0.36425 | -1.44335 | 0.70572 |
| Morrow | Cooper | -6.9224 | 8.272762 | -0.83677 | 0.4027 | -0.42659 | -1.54284 | 0.60190 |
| Pride | Holland | -10.8584 | 7.456880 | -1.45616 | 0.1453 | -1.02272 | -2.36280 | 0.42079 |
| Aggie V6 | Aggie V1 | -14.8219 | 6.906496 | -2.14609 | 0.0319* | -2.03269 | -3.70189 | -0.24053 |
| Aggie V6 | Aggie V3 | -15.7721 | 6.581385 | -2.39647 | 0.0166* | -1.98747 | -3.90295 | -0.40234 |
| Morrow | Holland | -15.8066 | 7.745967 | -2.04062 | 0.0413* | -1.45810 | -2.84156 | -0.03704 |
| Aggie V6 | Aggie V4 | -19.3955 | 7.329062 | -2.64638 | 0.0081* | -1.91501 | -3.50322 | -0.49975 |
References
- Fung TS, Liu DX. Similarities and Dissimilarities of COVID-19 and Other Coronavirus Diseases. Annu Rev Microbiol. 2021, 75, 19–47. [Google Scholar] [CrossRef]
- Wu F, Zhao S, Yu B, et al. A new coronavirus associated with human respiratory disease in China. Nature. 2020, 579, 265–269. [Google Scholar] [CrossRef] [PubMed]
- Azkur AK, Akdis M, Azkur D, et al. Immune response to SARS-CoV-2 and mechanisms of immunopathological changes in COVID-19. Allergy. 2020, 75, 1564–1581. [Google Scholar] [CrossRef] [PubMed]
- Bar-Or I, Weil M, Indenbaum V, et al. Detection of SARS-CoV-2 variants by genomic analysis of wastewater samples in Israel. Sci Total Environ. 2021, 789, 148002. [Google Scholar] [CrossRef]
- Bivins A, Greaves J, Fischer R, et al. Persistence of SARS-CoV-2 in Water and Wastewater. Environ Sci Technol Lett. 2020, 7, 937–942. [Google Scholar] [CrossRef] [PubMed]
- Ahmed W, Angel N, Edson J, et al. First confirmed detection of SARS-CoV-2 in untreated wastewater in Australia: A proof of concept for the wastewater surveillance of COVID-19 in the community. Sci Total Environ. 2020, 728, 138764. [Google Scholar] [CrossRef]
- Kumar M, Patel AK, Shah AV, et al. First proof of the capability of wastewater surveillance for COVID-19 in India through detection of genetic material of SARS-CoV-2. Sci Total Environ. 2020, 746, 141326. [Google Scholar] [CrossRef]
- Medema G, Heijnen L, Elsinga G, Italiaander R, Brouwer A. Presence of SARS-Coronavirus-2 RNA in Sewage and Correlation with Reported COVID-19 Prevalence in the Early Stage of the Epidemic in The Netherlands. Environ Sci Technol Lett. 2020, 7, 511–516. [Google Scholar] [CrossRef]
- Randazzo W, Truchado P, Cuevas-Ferrando E, Simón P, Allende A, Sánchez G. SARS-CoV-2 RNA in wastewater anticipated COVID-19 occurrence in a low prevalence area. Water Res. 2020, 181, 115942. [Google Scholar] [CrossRef]
- Sherchan SP, Shahin S, Ward LM, et al. First detection of SARS-CoV-2 RNA in wastewater in North America: A study in Louisiana, USA. Sci Total Environ. 2020, 743, 140621. [Google Scholar] [CrossRef]
- Han P, Ivanovski S. Saliva—Friend and Foe in the COVID-19 Outbreak. Diagnostics. 2020, 10, 290. [Google Scholar] [CrossRef]
- Graham KE, Loeb SK, Wolfe MK, et al. SARS-CoV-2 RNA in Wastewater Settled Solids Is Associated with COVID-19 Cases in a Large Urban Sewershed. Environ Sci Technol. 2021, 55, 488–498. [Google Scholar] [CrossRef] [PubMed]
- Choi PM, Tscharke BJ, Donner E, et al. Wastewater-based epidemiology biomarkers: Past, present and future. TrAC Trends Anal Chem. 2018, 105, 453–469. [Google Scholar] [CrossRef]
- Gonzalez R, Curtis K, Bivins A, et al. COVID-19 surveillance in Southeastern Virginia using wastewater-based epidemiology. Water Res. 2020, 186, 116296. [Google Scholar] [CrossRef] [PubMed]
- Asghar H, Diop OM, Weldegebriel G, et al. Environmental Surveillance for Polioviruses in the Global Polio Eradication Initiative. Environmental Surveillance for Polioviruses in the Global Polio Eradication Initiative. J Infect Dis. 2014, 210 (suppl. 1), S294–S303. [Google Scholar] [CrossRef]
- Hellmér M, Paxéus N, Magnius L, et al. Detection of pathogenic viruses in sewage provided early warnings of hepatitis A virus and norovirus outbreaks. Appl Environ Microbiol. 2014, 80, 6771–6781. [Google Scholar] [CrossRef]
- Peccia J, Zulli A, Brackney DE, et al. SARS-CoV-2 RNA Concentrations in Primary Municipal Sewage Sludge as a Leading Indicator of COVID-19 Outbreak Dynamics. Epidemiology 2020. [CrossRef]
- Jones DL, Baluja MQ, Graham DW, et al. Shedding of SARS-CoV-2 in feces and urine and its potential role in person-to-person transmission and the environment-based spread of COVID-19. Sci Total Environ. 2020, 749, 141364. [Google Scholar] [CrossRef]
- Sharkey ME, Kumar N, Mantero AMA, et al. Lessons learned from SARS-CoV-2 measurements in wastewater. Sci Total Environ. 2021, 798, 149177. [Google Scholar] [CrossRef]
- Cevik M, Tate M, Lloyd O, Maraolo AE, Schafers J, Ho A. SARS-CoV-2, SARS-CoV, and MERS-CoV viral load dynamics, duration of viral shedding, and infectiousness: a systematic review and meta-analysis. Lancet Microbe. 2021, 2, e13–e22. [Google Scholar] [CrossRef]
- Fongaro G, Stoco PH, Souza DSM, et al. The presence of SARS-CoV-2 RNA in human sewage in Santa Catarina, Brazil, November 2019. Sci Total Environ. 2021, 778, 146198. [Google Scholar] [CrossRef]
- La Rosa G, Iaconelli M, Mancini P, et al. First detection of SARS-CoV-2 in untreated wastewaters in Italy. Sci Total Environ. 2020, 736, 139652. [Google Scholar] [CrossRef] [PubMed]
- Nemudryi A, Nemudraia A, Wiegand T, et al. Temporal Detection and Phylogenetic Assessment of SARS-CoV-2 in Municipal Wastewater. Cell Rep Med. 2020, 1, 100098. [Google Scholar] [CrossRef]
- Wu F, Xiao A, Zhang J, et al. SARS-CoV-2 titers in wastewater foreshadow dynamics and clinical presentation of new COVID-19 cases. Published online June 23, 2020. [CrossRef]
- Wolfe MK, Archana A, Catoe D, et al. Scaling of SARS-CoV-2 RNA in Settled Solids from Multiple Wastewater Treatment Plants to Compare Incidence Rates of Laboratory-Confirmed COVID-19 in Their Sewersheds. Environ Sci Technol Lett. 2021, 8, 398–404. [Google Scholar] [CrossRef] [PubMed]
- Wolfe MK, Topol A, Knudson A, et al. High-Frequency, High-Throughput Quantification of SARS-CoV-2 RNA in Wastewater Settled Solids at Eight Publicly Owned Treatment Works in Northern California Shows Strong Association with COVID-19 Incidence. Langelier CR, ed. mSystems. 2021, 6, 10.1128–msystems.00829. [Google Scholar] [CrossRef]
- Adhikari S, Halden RU. Opportunities and limits of wastewater-based epidemiology for tracking global health and attainment of UN sustainable development goals. Environ Int. 2022, 163, 107217. [Google Scholar] [CrossRef] [PubMed]
- Ahmed W, Tscharke B, Bertsch PM, et al. SARS-CoV-2 RNA monitoring in wastewater as a potential early warning system for COVID-19 transmission in the community: A temporal case study. Sci Total Environ. 2021, 761, 144216. [Google Scholar] [CrossRef]
- Gushgari AJ, Venkatesan AK, Chen J, Steele JC, Halden RU. Long-term tracking of opioid consumption in two United States cities using wastewater-based epidemiology approach. Water Res. 2019, 161, 171–180. [Google Scholar] [CrossRef]
- Vo V, Tillett RL, Chang CL, Gerrity D, Betancourt WQ, Oh EC. SARS-CoV-2 variant detection at a university dormitory using wastewater genomic tools. Sci Total Environ. 2022, 805, 149930. [Google Scholar] [CrossRef]
- Betancourt WQ, Schmitz BW, Innes GK, et al. COVID-19 containment on a college campus via wastewater-based epidemiology, targeted clinical testing and an intervention. Sci Total Environ. 2021, 779, 146408. [Google Scholar] [CrossRef]
- Gibas C, Lambirth K, Mittal N, et al. Implementing building-level SARS-CoV-2 wastewater surveillance on a university campus. Sci Total Environ. 2021, 782, 146749. [Google Scholar] [CrossRef] [PubMed]
- Harris-Lovett S, Nelson KL, Beamer P, et al. Wastewater Surveillance for SARS-CoV-2 on College Campuses: Initial Efforts, Lessons Learned, and Research Needs. Int J Environ Res Public Health. 2021, 18, 4455. [Google Scholar] [CrossRef]
- Karthikeyan S, Nguyen A, McDonald D, et al. Rapid, Large-Scale Wastewater Surveillance and Automated Reporting System Enable Early Detection of Nearly 85% of COVID-19 Cases on a University Campus. McGrath J, ed. mSystems. 2021, 6, e00793–21. [Google Scholar] [CrossRef]
- Scott LC, Aubee A, Babahaji L, Vigil K, Tims S, Aw TG. Targeted wastewater surveillance of SARS-CoV-2 on a university campus for COVID-19 outbreak detection and mitigation. Environ Res. 2021, 200, 111374. [Google Scholar] [CrossRef]
- North Carolina Respiratory Virus Summary Dashboard. https://covid19.ncdhhs.gov/dashboard.
- Wizard® Enviro Total Nucleic Acid Kit, Promega 2020.; 2020. https://www.promega.com/products/nucleic-acid-extraction/viral-rna-extraction-viral-dna-extraction/wastewater-viral-rna-dna-extraction/?catNum=A2991.
- U.S. Centers for Disease Control and Prevention. CDC 2019-Novel Coronavirus (2019-nCoV) Real-Time RT–PCR Diagnostic Panel.; 2021. https://www.fda.gov/media/134922/download?fbclid=IwAR1DdEweazD3ixmrpZMc07VXM0_n1qx455rGV7E0fAEcA1QZf3Peh0Qxypo.
- Ai Y, Davis A, Jones D, et al. Wastewater SARS-CoV-2 monitoring as a community-level COVID-19 trend tracker and variants in Ohio, United States. Sci Total Environ. 2021, 801, 149757. [Google Scholar] [CrossRef] [PubMed]
- Zhan Q, Babler KM, Sharkey ME, et al. Relationships between SARS-CoV-2 in Wastewater and COVID-19 Clinical Cases and Hospitalizations, with and without Normalization against Indicators of Human Waste. ACS EST Water. 2022, 2, 1992–2003. [Google Scholar] [CrossRef]
- Wastewater Monitoring Dashboard. https://covid19.ncdhhs.gov/dashboard/wastewater-monitoring.
- Alvarez E, Bielska IA, Hopkins S, et al. Limitations of COVID-19 testing and case data for evidence-informed health policy and practice. Health Res Policy Syst. 2023, 21, 11. [Google Scholar] [CrossRef]
- Wang Y, Liu P, Zhang H, et al. Early warning of a COVID-19 surge on a university campus based on wastewater surveillance for SARS-CoV-2 at residence halls. Sci Total Environ. 2022, 821, 153291. [Google Scholar] [CrossRef]
- Williams BB, Newborn A, Karamat A, et al. Detection of SARS-CoV-2 RNA in wastewater from dormitory buildings in a university campus: comparison with individual testing results. Water Sci Technol. 2023, 88, 2364–2377. [Google Scholar] [CrossRef]
- Foladori P, Cutrupi F, Segata N, et al. SARS-CoV-2 from faeces to wastewater treatment: What do we know? A review. Sci Total Environ. 2020, 743, 140444. [Google Scholar] [CrossRef]
- Hart OE, Halden RU. Computational analysis of SARS-CoV-2/COVID-19 surveillance by wastewater-based epidemiology locally and globally: Feasibility, economy, opportunities and challenges. Sci Total Environ. 2020, 730, 138875. [Google Scholar] [CrossRef] [PubMed]
- Hart OE, Halden RU. Modeling wastewater temperature and attenuation of sewage-borne biomarkers globally. Water Res. 2020, 172, 115473. [Google Scholar] [CrossRef] [PubMed]
- Swift CL, Isanovic M, Correa Velez KE, Norman RS. SARS-CoV-2 concentration in wastewater consistently predicts trends in COVID-19 case counts by at least two days across multiple WWTP scales. Environ Adv. 2023, 11, 100347. [Google Scholar] [CrossRef] [PubMed]
- Wu F, Xiao A, Zhang J, et al. SARS-CoV-2 titers in wastewater foreshadow dynamics and clinical presentation of new COVID-19 cases. Published online June 23, 2020. [CrossRef]
- Kumblathan T, Liu Y, Uppal GK, Hrudey SE, Li XF. Wastewater-Based Epidemiology for Community Monitoring of SARS-CoV-2: Progress and Challenges. ACS Environ Au. 2021, 1, 18–31. [Google Scholar] [CrossRef]
- D’Aoust PM, Towhid ST, Mercier É, et al. COVID-19 wastewater surveillance in rural communities: Comparison of lagoon and pumping station samples. Sci Total Environ. 2021, 801, 149618. [Google Scholar] [CrossRef]
- Wu F, Xiao A, Zhang J, et al. SARS-CoV-2 RNA concentrations in wastewater foreshadow dynamics and clinical presentation of new COVID-19 cases. Sci Total Environ. 2022, 805, 150121. [Google Scholar] [CrossRef]
- Duvallet C, Wu F, McElroy KA, et al. Nationwide Trends in COVID-19 Cases and SARS-CoV-2 RNA Wastewater Concentrations in the United States. ACS EST Water. 2022, 2, 1899–1909. [Google Scholar] [CrossRef] [PubMed]
- Greenwald HD, Kennedy LC, Hinkle A, et al. Tools for interpretation of wastewater SARS-CoV-2 temporal and spatial trends demonstrated with data collected in the San Francisco Bay Area. Water Res X. 2021, 12, 100111. [Google Scholar] [CrossRef]
- Maal-Bared R, Qiu Y, Li Q, et al. Does normalization of SARS-CoV-2 concentrations by Pepper Mild Mottle Virus improve correlations and lead time between wastewater surveillance and clinical data in Alberta (Canada): comparing twelve SARS-CoV-2 normalization approaches. Sci Total Environ. 2023, 856, 158964. [Google Scholar] [CrossRef]
- Sakarovitch C, Schlosser O, Courtois S, et al. Monitoring of SARS-CoV-2 in wastewater: what normalisation for improved understanding of epidemic trends? J Water Health. 2022, 20, 712–726. [Google Scholar] [CrossRef]
- Bethea M, Forman DT. Beta 2-microglobulin: its significance and clinical usefulness. Ann Clin Lab Sci. 1990, 20, 163–168. [Google Scholar]
- Palumbo A, Avet-Loiseau H, Oliva S, et al. Revised International Staging System for Multiple Myeloma: A Report from International Myeloma Working Group. J Clin Oncol. 2015, 33, 2863–2869. [Google Scholar] [CrossRef]
- Ugan Y, Korkmaz H, Dogru A, et al. The significance of urinary beta-2 microglobulin level for differential diagnosis of familial Mediterranean fever and acute appendicitis. Clin Rheumatol. 2016, 35, 1669–1672. [Google Scholar] [CrossRef] [PubMed]
- Hsu SY, Bayati M, Li C, et al. Biomarkers selection for population normalization in SARS-CoV-2 wastewater-based epidemiology. Water Res. 2022, 223, 118985. [Google Scholar] [CrossRef]
- Augusto MR, Claro ICM, Siqueira AK, et al. Sampling strategies for wastewater surveillance: Evaluating the variability of SARS-COV-2 RNA concentration in composite and grab samples. J Environ Chem Eng. 2022, 10, 107478. [Google Scholar] [CrossRef] [PubMed]
- Kmush BL, Monk D, Green H, Sachs† DA, Zeng T, Larsen DA. Comparability of 24-hour composite and grab samples for detection of SARS-2-CoV RNA in wastewater. FEMS Microbes. 2022, 3, xtac017. [Google Scholar] [CrossRef] [PubMed]
- Curtis K, Keeling D, Yetka K, Larson A, Gonzalez R. Wastewater SARS-CoV-2 RNA Concentration and Loading Variability from Grab and 24-Hour Composite Samples. Published online July 11, 2020. [CrossRef]
- Rafiee M, Isazadeh S, Mohseni-Bandpei A, et al. Moore swab performs equal to composite and outperforms grab sampling for SARS-CoV-2 monitoring in wastewater. Sci Total Environ. 2021, 790, 148205. [Google Scholar] [CrossRef]
- Dhiyebi HA, Abu Farah J, Ikert H, et al. Assessment of seasonality and normalization techniques for wastewater-based surveillance in Ontario, Canada. Front Public Health. 2023, 11, 1186525. [Google Scholar] [CrossRef]
- Breadner PR, Dhiyebi HA, Fattahi A, et al. A comparative analysis of the partitioning behaviour of SARS-CoV-2 RNA in liquid and solid fractions of wastewater. Sci Total Environ. 2023, 895, 165095. [Google Scholar] [CrossRef]
- D’Aoust PM, Mercier E, Montpetit D, et al. Quantitative analysis of SARS-CoV-2 RNA from wastewater solids in communities with low COVID-19 incidence and prevalence. Water Res. 2021, 188, 116560. [Google Scholar] [CrossRef]
- Anglemyer A, Moore TH, Parker L, et al. Digital contact tracing technologies in epidemics: a rapid review. Cochrane Public Health Group, ed. Cochrane Database Syst Rev. 2020, 2020. [Google Scholar] [CrossRef]
Figure 1.
Campus map of North Carolina A&T State University with marked dormitories for sample collection (retrieved and modified from Campus website).
Figure 1.
Campus map of North Carolina A&T State University with marked dormitories for sample collection (retrieved and modified from Campus website).
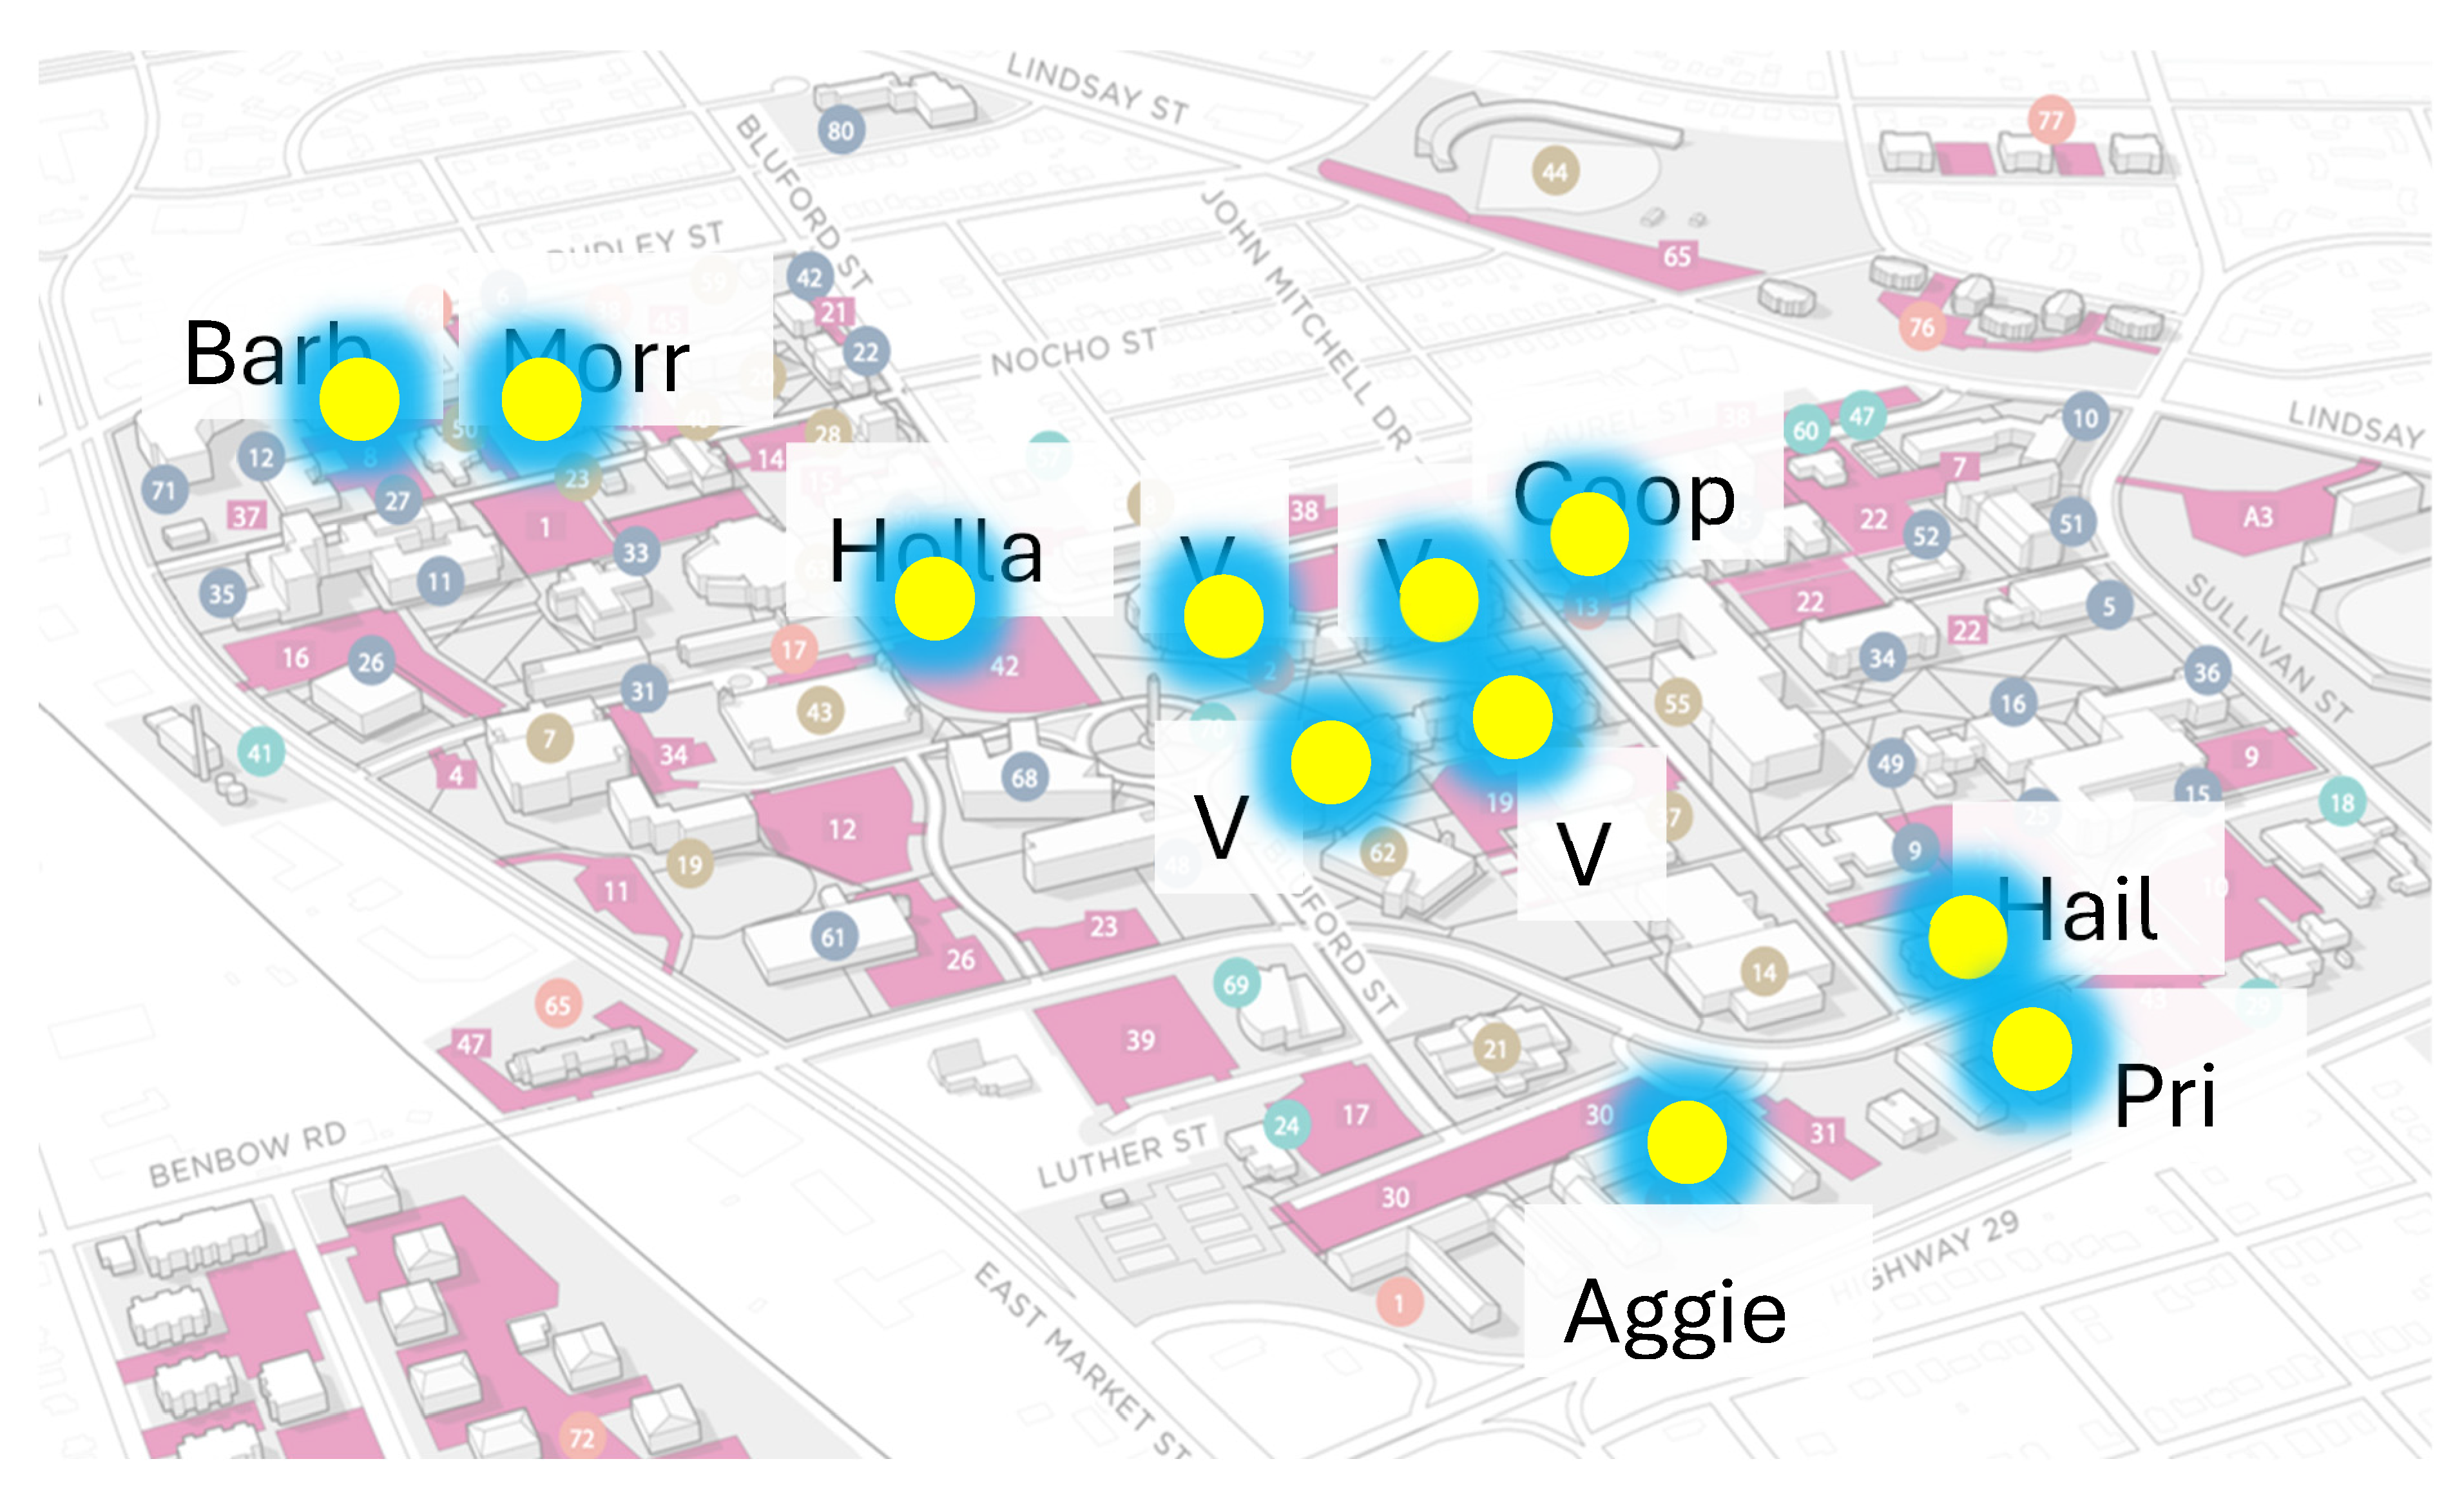
Figure 2.
a) Clinical cases on NCA&T campus between Spring 2021-2023, green bars represent Spring semesters and yellow bars represent the Fall semesters. b) Scatter plot showing the correlation (Rs2 = 0.04, p=0.29) between total number of clinical cases in NC state and NCA&T campus between Spring 2021-2023.
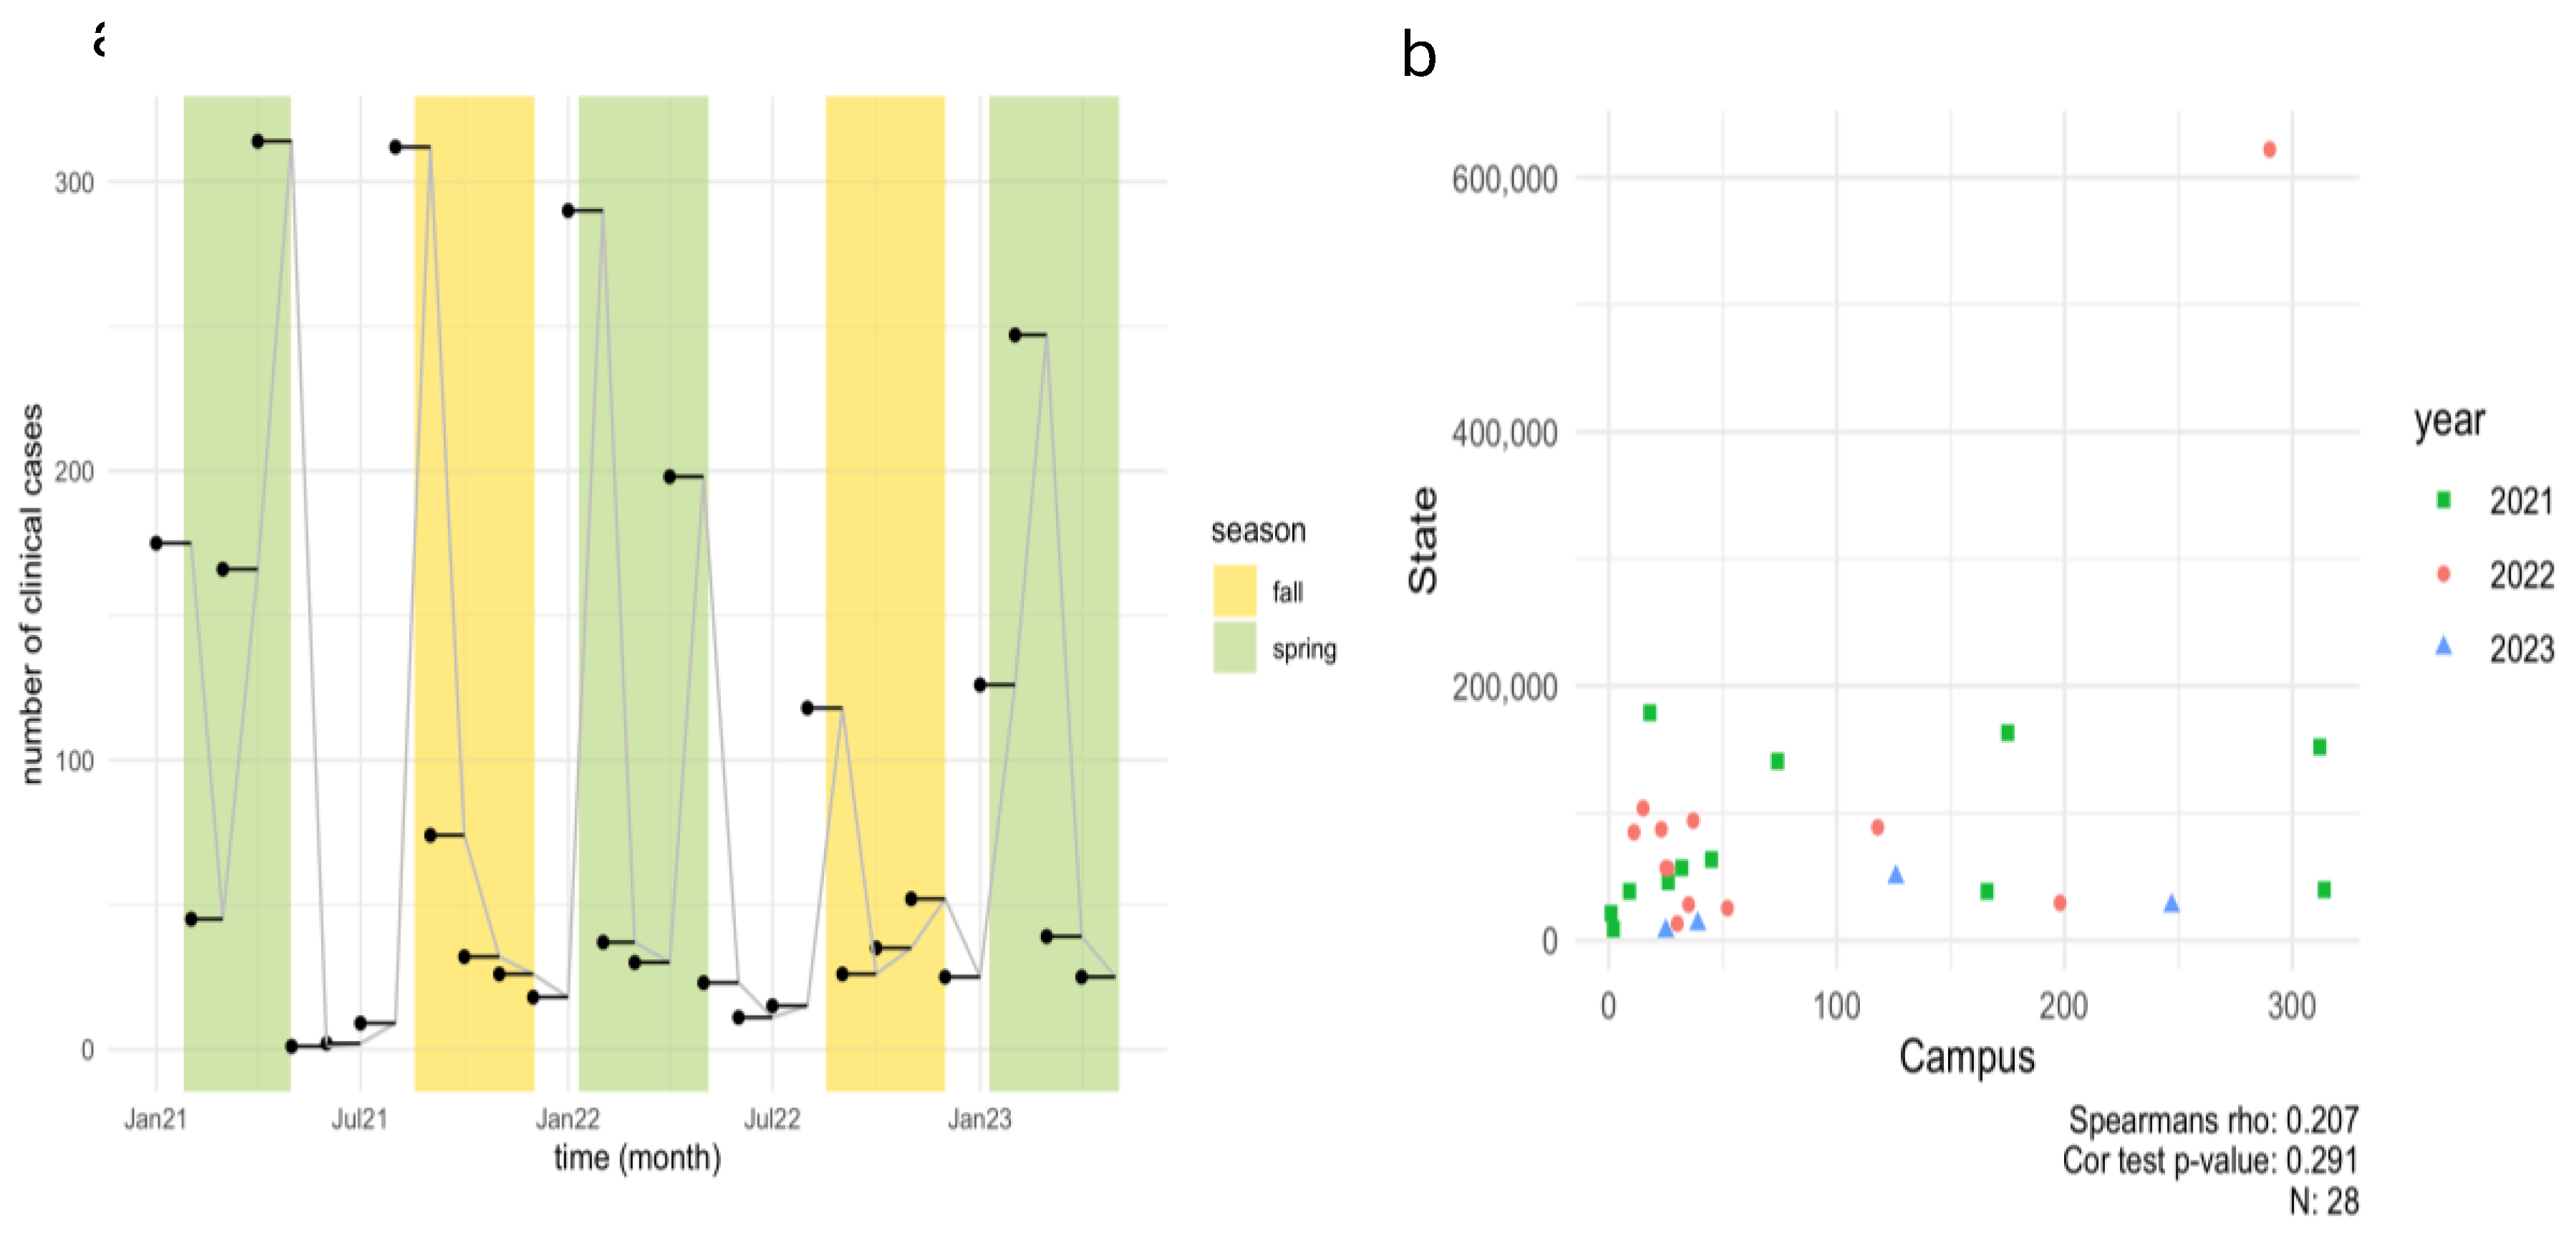
Figure 3.
a) SARS-CoV-2 RNA copies between Spring 2021-2023. Yellow area represents the spring semesters, white area represents the summer months and green area represents the fall semesters b) the mean SARS-CoV-2 RNA concentrations for each dormitory for the spring semesters of 2021-2023.
Figure 3.
a) SARS-CoV-2 RNA copies between Spring 2021-2023. Yellow area represents the spring semesters, white area represents the summer months and green area represents the fall semesters b) the mean SARS-CoV-2 RNA concentrations for each dormitory for the spring semesters of 2021-2023.
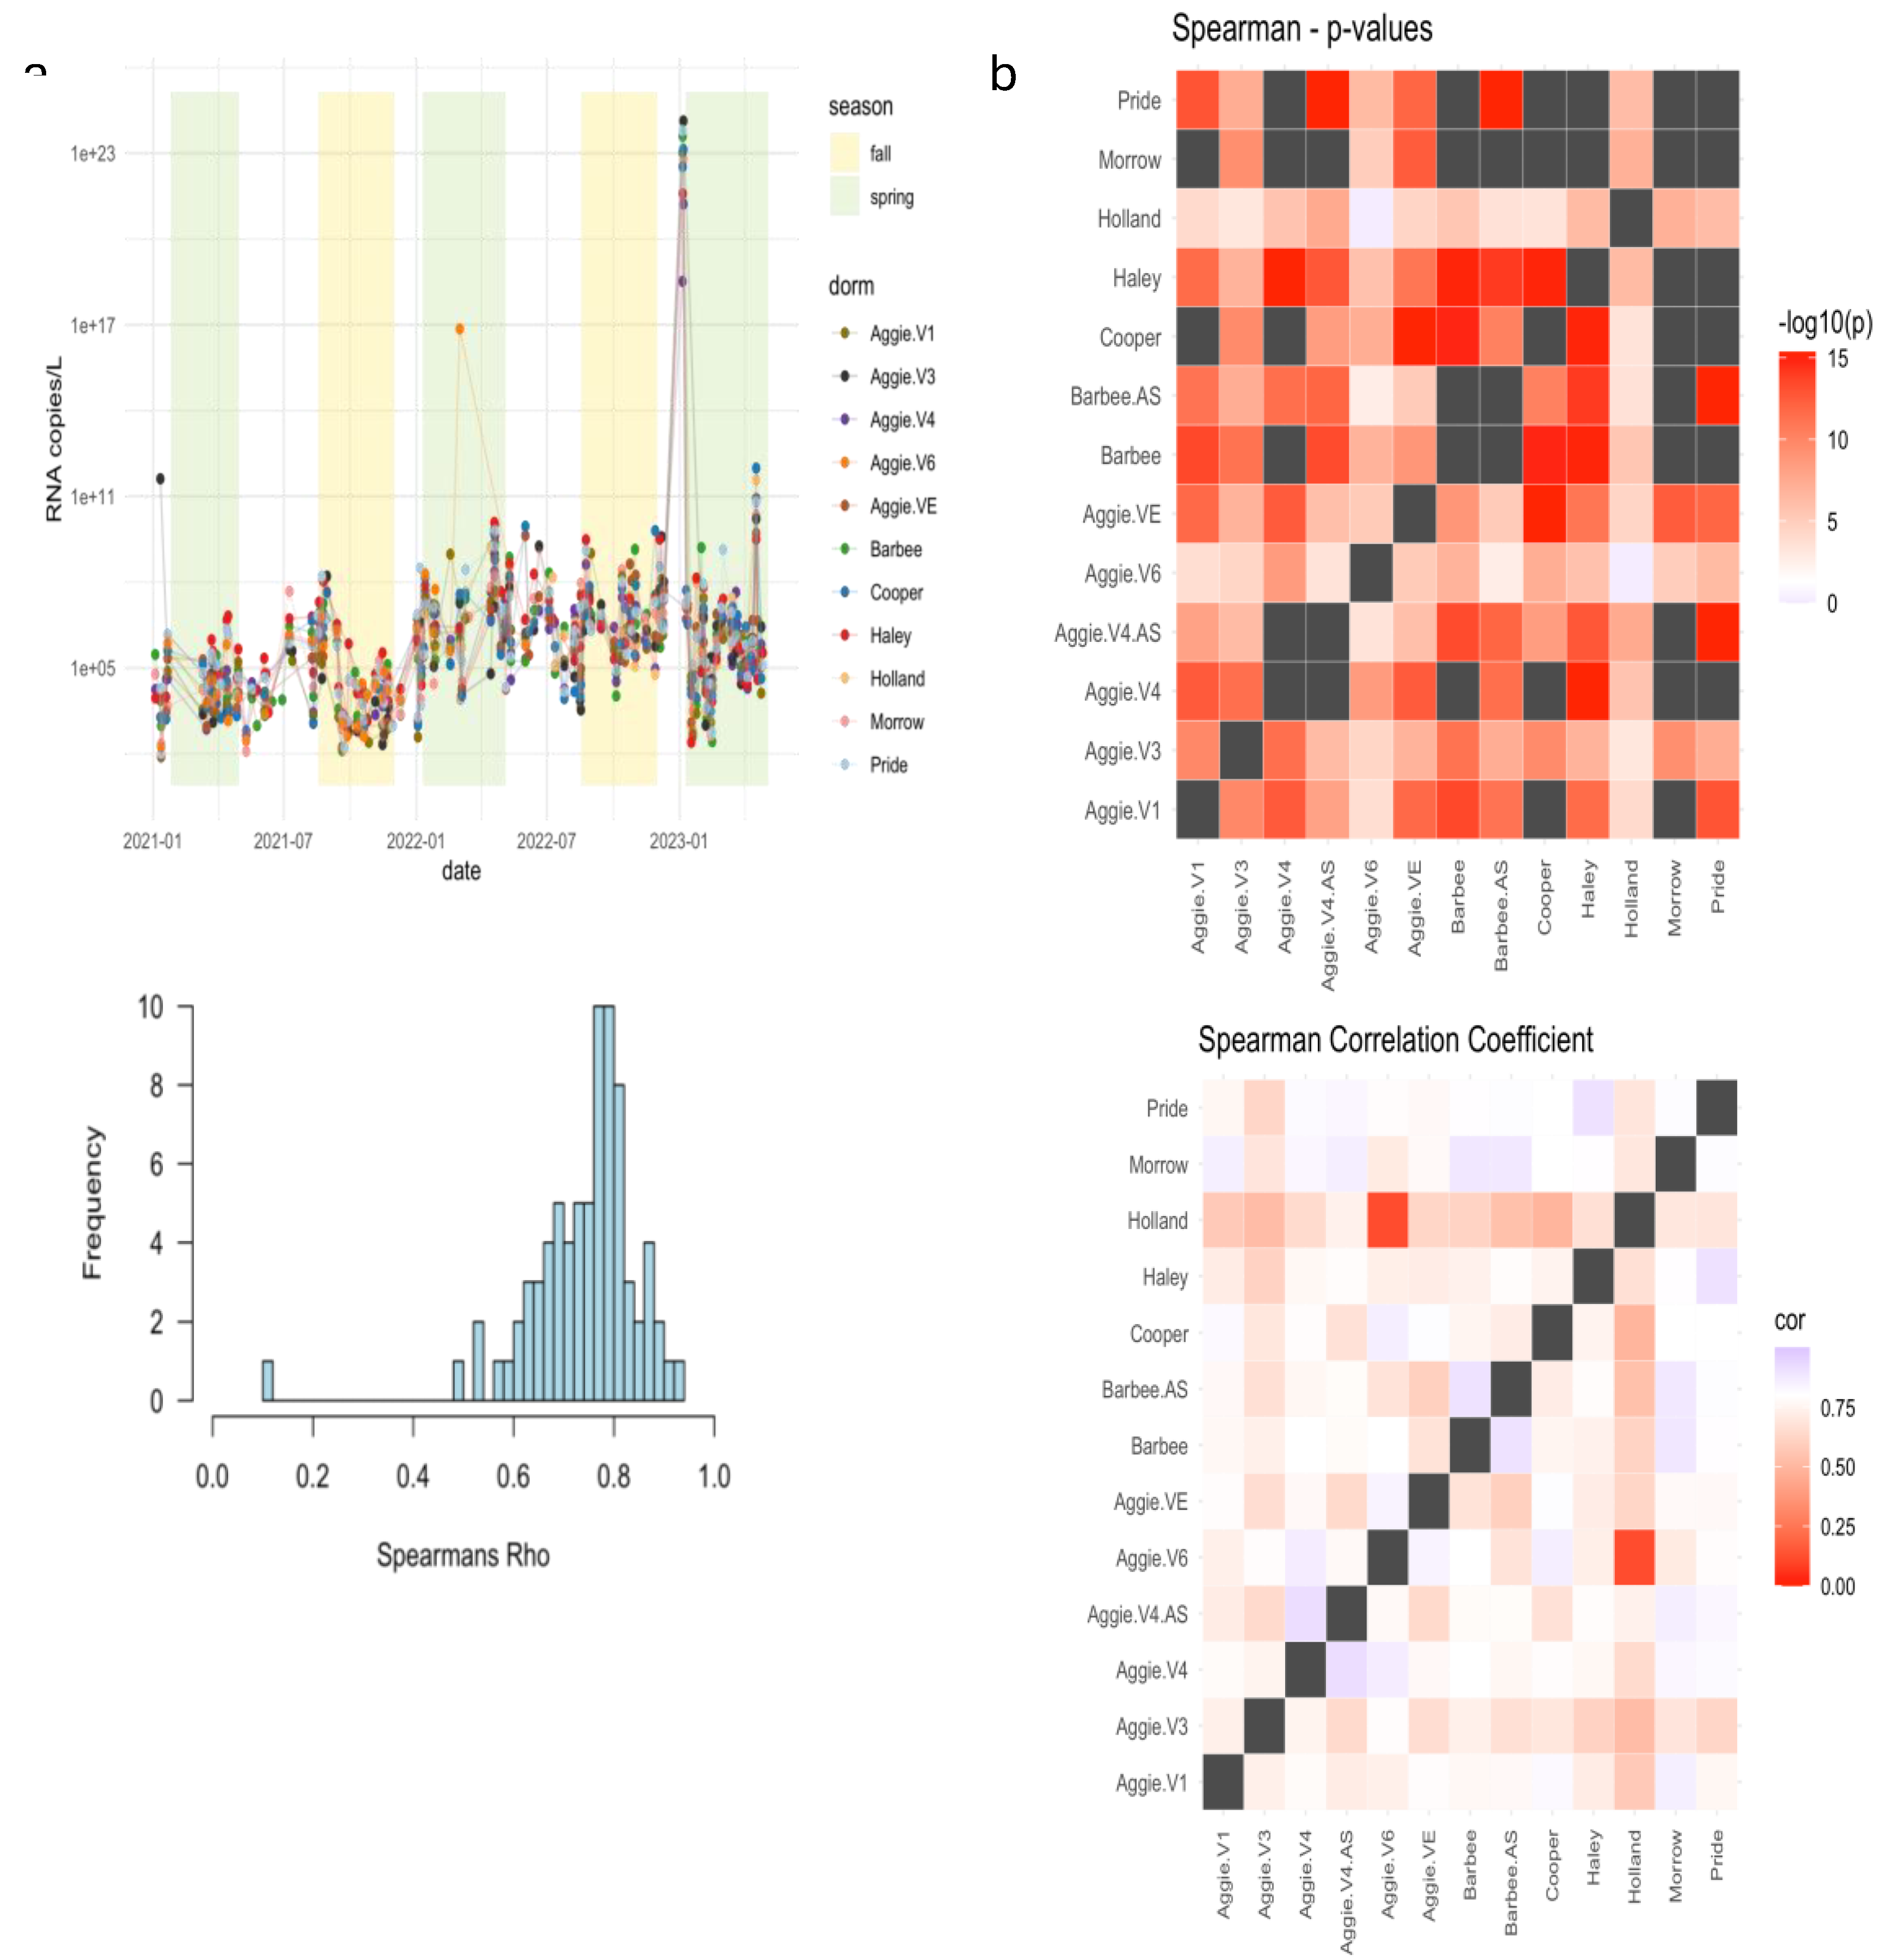
Figure 4.
a) Predictions of the incidence rates based on observed amount of N1 gene copy numbers in WW in selected buildings for 2021 (Rs2=0.03, p-value=0.006) b) Scatter plot between NCA&T campus wide clinical cases with mean of SARS-CoV-2 RNA concentrations in Spring 2022-2023 on a log scale (Rs2=0.007, p-value=0.65).
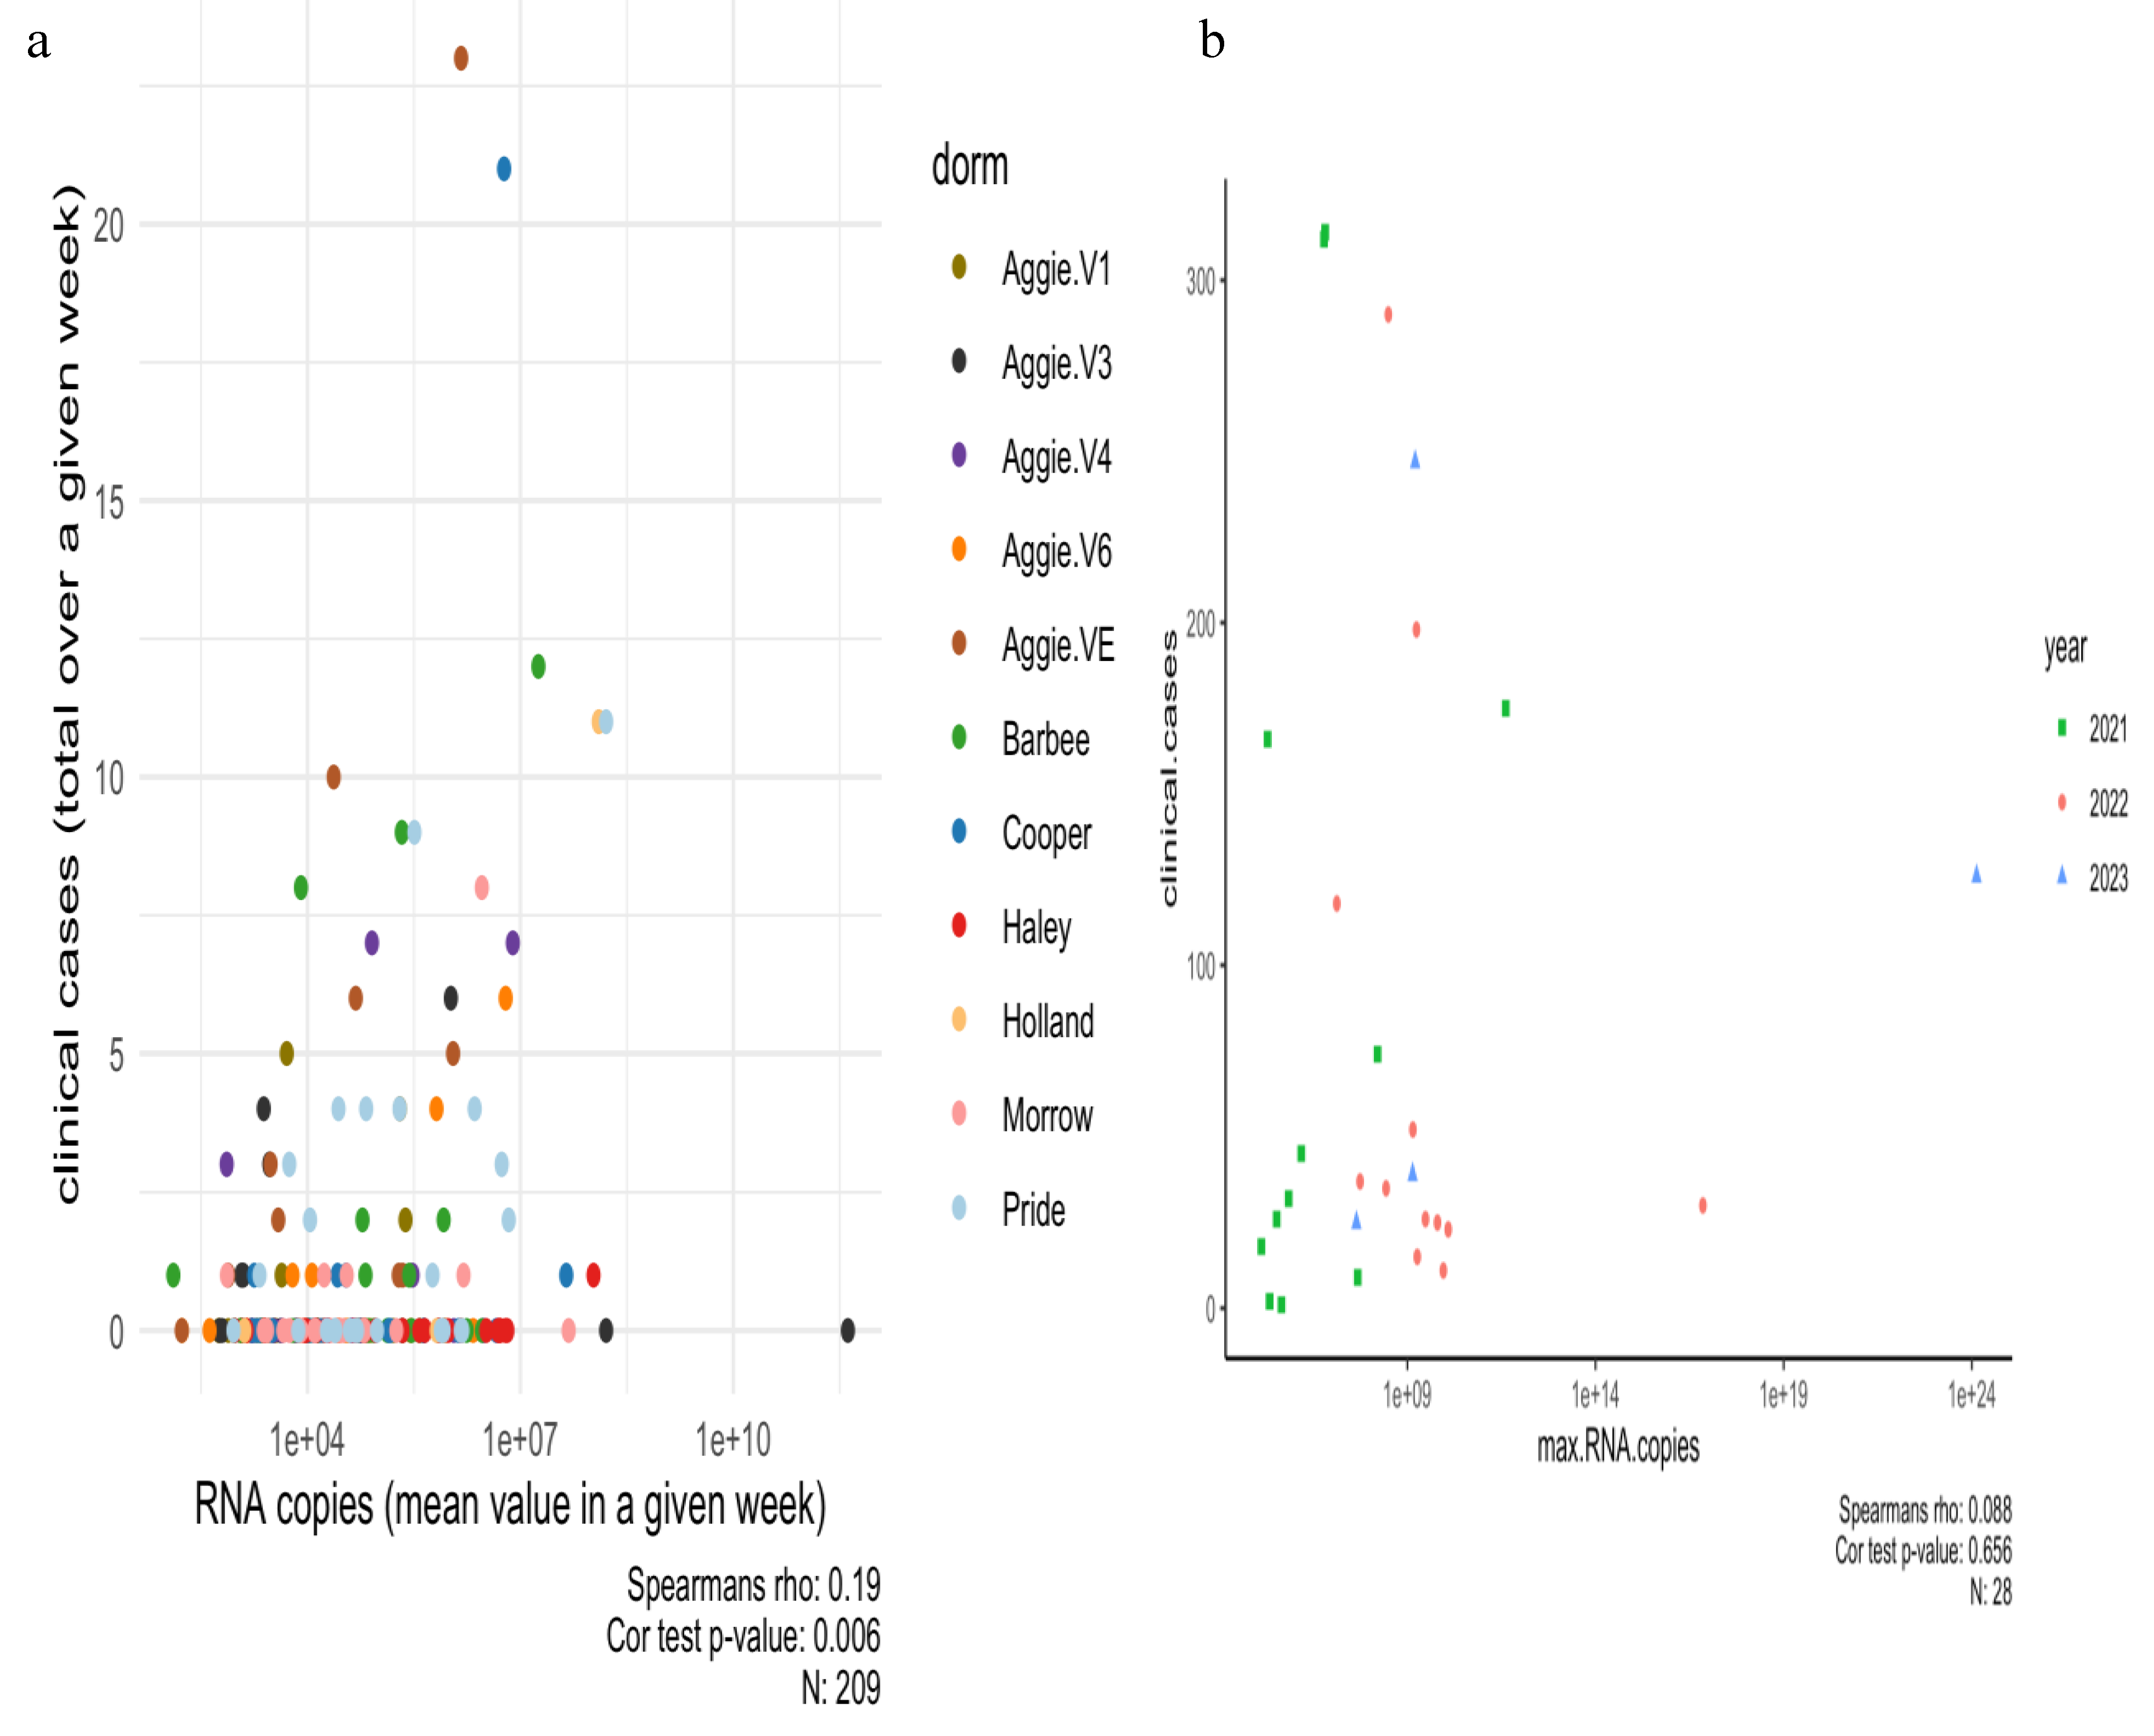
Figure 5.
a) Scatter plot between PMMoV and SARS-CoV-2 RNA concentrations for Spring 2022-2023 (Rs2=0.002, p-value=0.29) b) Scatter plot showing correlation between clinical cases and normalized RNA concentrations by PMMoV in 2022-2023, mean log. Ratio represents mean of “log10(SARS RNA copies)/log10(PMMoV RNA copies).
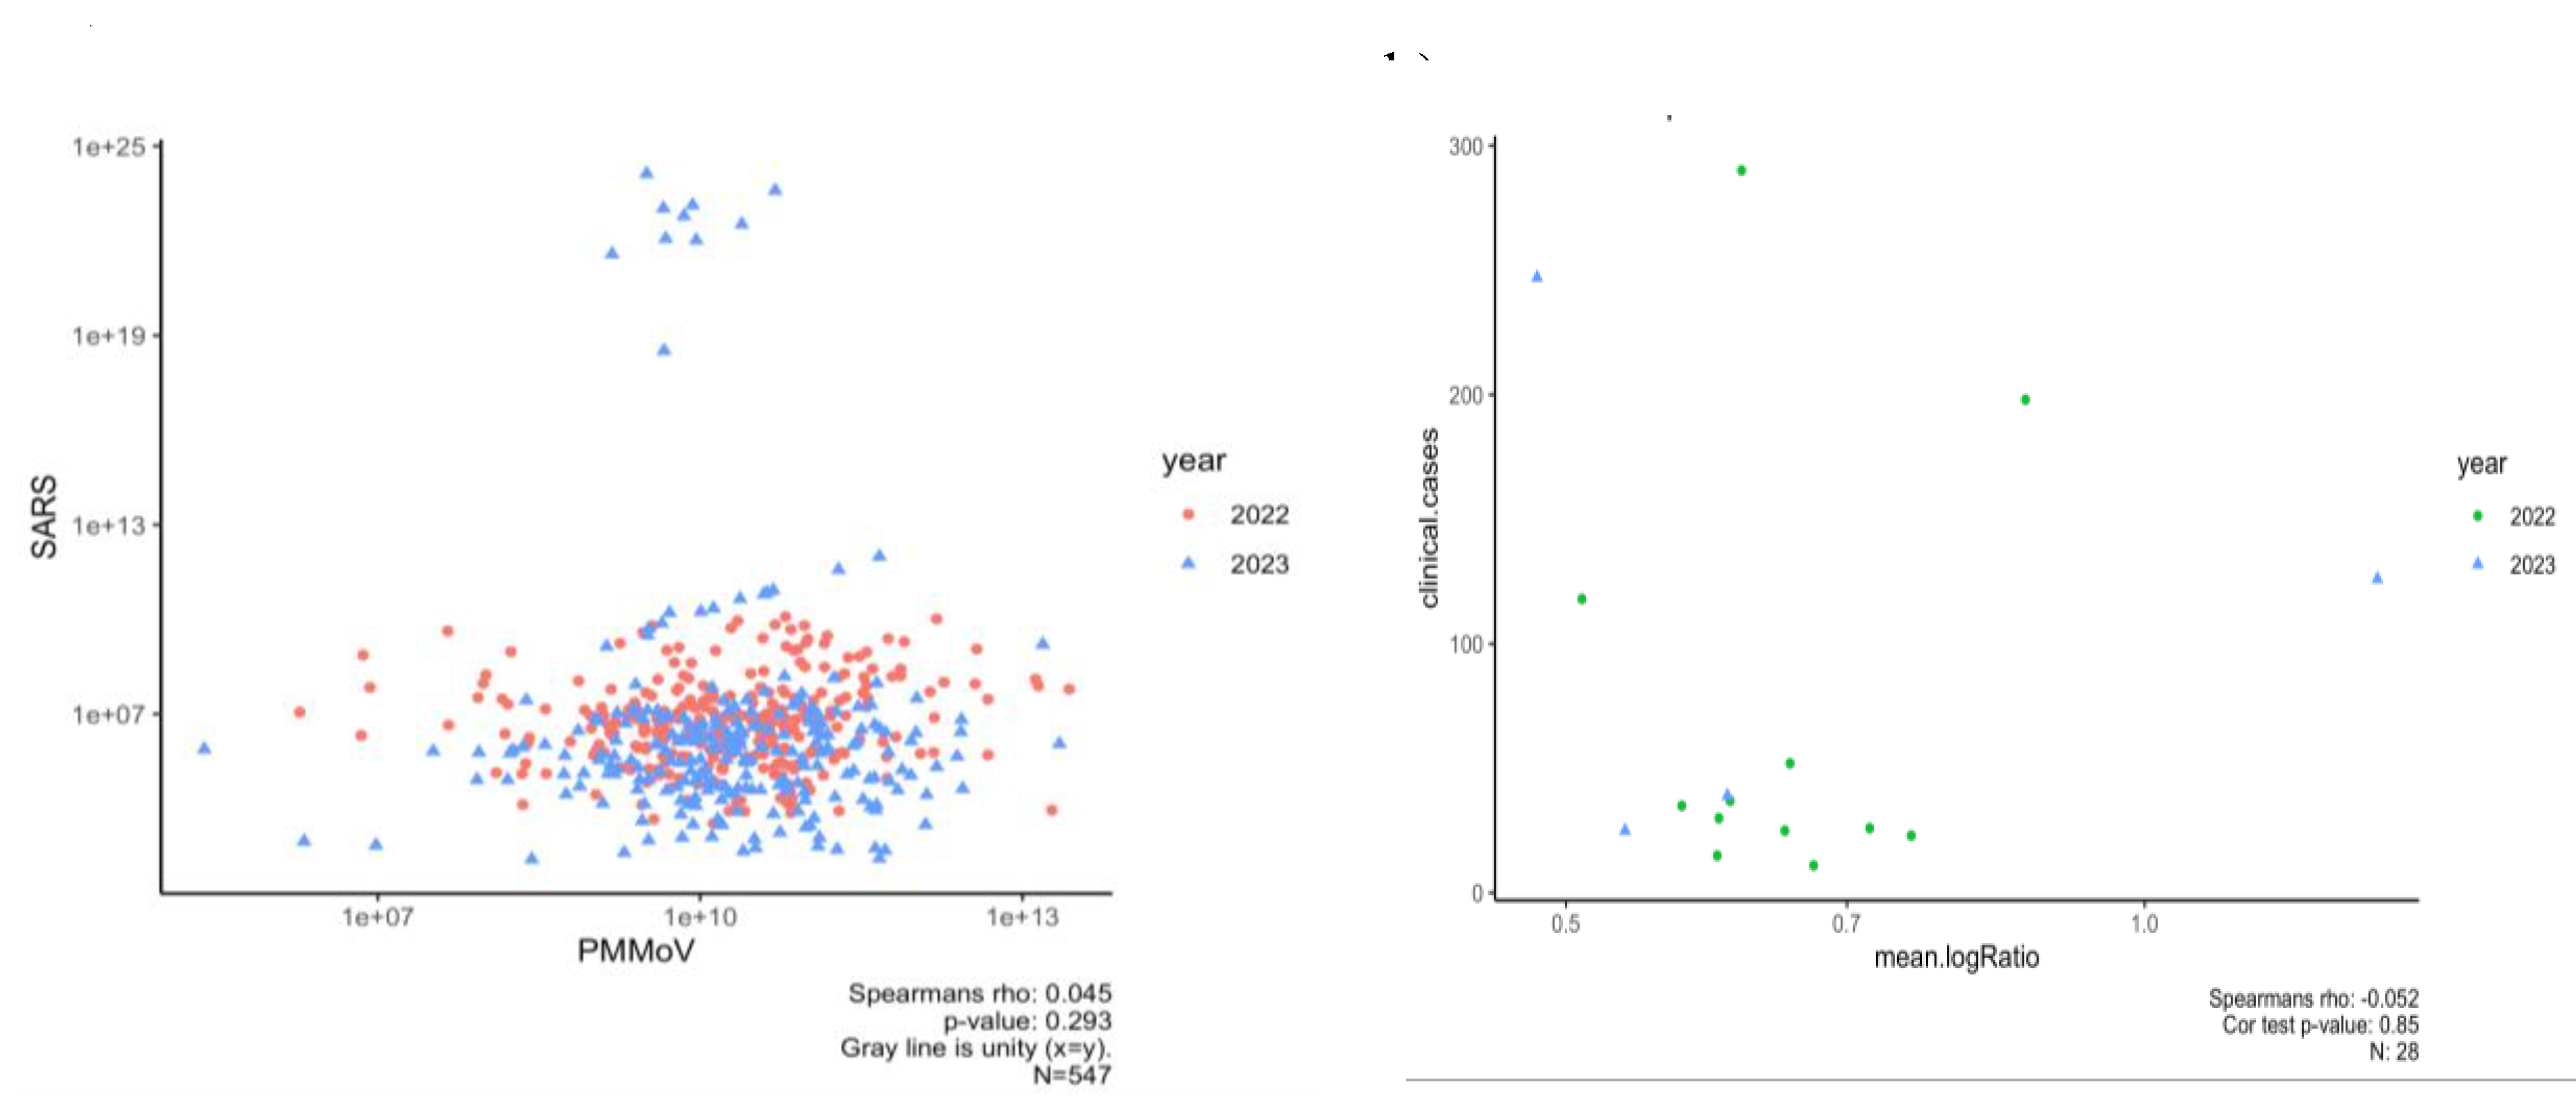
Figure 6.
a) Spearman’s correlation analysis between SARS-CoV-2 RNA concentrations two sampling methods (Grab and Composite) for Aggie V4 hall and normalized by PMMoV b) Spearman’s correlation analysis between SARS-CoV-2 RNA concentrations of two sampling methods (Grab and Composite) for Barbee hall and normalized by PMMoV.
Disclaimer/Publisher’s Note: The statements, opinions and data contained in all publications are solely those of the individual author(s) and contributor(s) and not of MDPI and/or the editor(s). MDPI and/or the editor(s) disclaim responsibility for any injury to people or property resulting from any ideas, methods, instructions or products referred to in the content. |
© 2025 by the authors. Licensee MDPI, Basel, Switzerland. This article is an open access article distributed under the terms and conditions of the Creative Commons Attribution (CC BY) license (http://creativecommons.org/licenses/by/4.0/).
Copyright: This open access article is published under a Creative Commons CC BY 4.0 license, which permit the free download, distribution, and reuse, provided that the author and preprint are cited in any reuse.


