
Submitted:
11 April 2025
Posted:
14 April 2025
You are already at the latest version
Abstract
Medical image segmentation, especially in chest X-ray (CXR) analysis, encounters substantial problems such as class imbalance, annotation inconsistencies, and the necessity for accurate pathological region identification. This research introduces NCT-CXR, a robust framework that enhances semantic segmentation in CXR images using an improved coordinate-geometric transformation strategy. NCT-CXR integrates carefully calibrated geometric transformations with intensity-based augmentations, ensuring spatial accuracy throughout the augmentation process. The framework was evaluated on the NIH Chest X-ray dataset comprising 1,061 images across nine pathological categories. NCT-CXR has four different coordinate transformation models, i.e. discrete rotations at (-10°, +10°), discrete rotations at (-5°, +5°), and mixed rotation augmentation. Semantic segmentation was performed using YOLOv8 with optimized hyperparameters. Non-parametric statistical analysis using Kruskal-Wallis test revealed significant differences in precision metrics (H= 14.874, p = 0.001927), while other performance metrics remained stable. Subsequent Nemenyi post-hoc analysis demonstrated that discrete-angle rotations at (-5°, +5°) and (-10°, +10°) significantly outperformed mixed rotations (p = 0.013806 and p = 0.005602 respectively). These models achieved particularly high precision in pneumothorax detection (0.829 and 0.804 respectively), emphasizing the effectiveness of controlled geometric transformations for conditions with well-defined anatomical boundaries. These findings demonstrate the efficacy of NCT-CXR in producing clinically relevant segmentation outcomes and underscore the importance of augmentation design in pathology-specific model performance. Future work will explore the generalizability of this approach across diverse imaging modalities and its applicability to a broader spectrum of thoracic conditions.
Keywords:
Chest X-ray
; Pulmonary Abnormalities
; Coordinate Transformation
; Data Augmentation
; Geometric Transformation
; Multi-label Segmentation
1. Introduction
Medical imaging, particularly chest X-rays, is fundamental to global healthcare, serving as a primary tool for diagnosing and managing various pulmonary conditions. Precise and reliable segmentation of pulmonary abnormalities in these images is essential for accurate diagnosis, effective treatment planning, and continuous disease monitoring. However, existing segmentation techniques face several critical challenges. First, class imbalance occurs due to the varying prevalence of pulmonary pathologies, leading to under-represented conditions that can bias deep learning models and hinder accurate segmentation of rare but clinically significant abnormalities. Second, annotation inconsistencies arise from variations in radiologist expertise and interpretation, impacting the quality of training data and overall model performance. Finally, accurate identification and delineation of pathological regions remain challenging due to irregular boundaries, subtle textural differences, and overlapping pathologies. These challenges, exacerbated by the increasing demand for radiological services and a global shortage of radiologists, highlight the urgent need for automated and reliable segmentation solutions.
The increasing volume of radiological examinations, coupled with a global shortage of radiologists, particularly in resource-constrained settings, exacerbates the challenges of pulmonary image segmentation. This shortage not only widens disparities in access to imaging services but also contributes to delays in diagnosis and treatment, negatively impacting patient outcomes [1,2]. Given these challenges, automated image analysis systems have emerged as a crucial solution. Deep learning, in particular, has demonstrated significant promise in medical image analysis [3,4,5]. However, developing robust and generalizable deep learning systems capable of handling the inherent complexities of medical imaging remains a major challenge, especially when dealing with multiple concurrent pathologies [6,7]. Prior research in chest X-ray segmentation has often been limited to a small subset of pulmonary conditions, failing to address the complexity of real-world clinical cases where multiple abnormalities may coexist. For instance, [8] focused on pneumothorax detection, [9] investigated cardiomegaly, and Kumarasinghe et al. [10] explored pneumonia and COVID-19. While Arora et al. [11] studied four abnormalities (ground glass opacities, consolidations, cardiomegaly, and infiltrates). The comprehensive identification of up to fourteen pulmonary conditions remains an open challenge, largely due to dataset limitations and the complexity of medical imaging.
While deep learning has shown promise in medical image segmentation, its effectiveness is often constrained by the inherent characteristics of medical imaging datasets. One of the most widely used datasets, the NIH Chest X-ray dataset [12], presents significant challenges related to class imbalance and annotation complexity [13,14,15,16,17]. Rare pathological conditions are often under-represented, leading to model bias and reduced generalization. Furthermore, discrepancies between initial dataset labels and expert annotations highlight the need for robust methodologies capable of handling these inconsistencies. Pati et al. [18] demonstrated that inter-annotator variability can significantly impact segmentation labels, a problem also observed by Zhang et al. [19] emphasized that label noise can lead to model overfitting, reducing robustness in clinical applications. These annotation challenges are particularly problematic in semantic segmentation tasks, where precise localization of pathological regions is crucial for accurate model predictions. Addressing these dataset limitations is essential for developing deep learning models that can perform reliably across diverse clinical scenarios.
To address the dataset challenges of class imbalance and annotation inconsistencies, recent advancements in deep learning have explored alternative approaches to improve segmentation performance. The YOLO family of models [20,21,22,23] has demonstrated strong potential in object detection and segmentation tasks. However, its direct application in medical imaging requires careful consideration of class imbalance and diagnostic accuracy. Data augmentation techniques, including Generative Adversarial Networks (GANs) [24,25,26] have been employed to mitigate these issues. Yet, ensuring that geometric and intensity-based augmentations preserve clinical relevance remains an ongoing challenge. Anatomical constraints must be considered when applying transformations such as rotation, flipping, and scaling, as improper alterations may distort critical diagnostic feature [24,27]. For example, [8,28] demonstrated that certain transformations can compromise the structural orientation of radiological images, leading to misclassifications. While advanced techniques, such as tree-structured Kronecker convolutional networks [29], have attempted to optimize augmentation for medical imaging, maintaining anatomical integrity remains crucial for reliable segmentation outcomes.
While recent advancements in deep learning, particularly YOLO-based models, have demonstrated significant potential in medical image segmentation, their direct application remains hindered by challenges such as class imbalance, annotation inconsistencies, and the need to preserve anatomical integrity in augmented datasets. To address these limitations, this research introduces NCT-CXR (Improved Coordinate Geometric Transformation). NCT-CXR is a framework designed to enhance semantic segmentation of pulmonary abnormalities in chest X-rays through an improved coordinate transformation technique. Unlike test-time augmentation methods that operate on trained models, NCT-CXR proactively enhances training data by applying carefully calibrated geometric transformations (rotations) and intensity-based augmentations, ensuring spatial accuracy while preventing distortions that could compromise anatomical relationships or introduce artifacts. Leveraging YOLOv8’s semantic segmentation capabilities, the framework systematically applies augmentation strategies, including multiple discrete-angle rotations at (-5°, +5°), (-10°, +10°), and their combinations, along with controlled intensity modifications, thereby mitigating class imbalance and enhancing model robustness against variations in X-ray positioning and image quality [8,28,30]. While many existing augmentation techniques in medical imaging introduce complex transformations, NCT-CXR prioritizes computational efficiency and clinical practicality by employing fundamental yet precisely optimized geometric transformations, systematically tuned based on pathology-specific characteristics and anatomical constraints, as determined through expert radiologist consultation. Experimental results demonstrate that these calibrated transformations significantly improve segmentation accuracy, particularly in precision metrics for well-defined pathologies, while maintaining the efficiency required for potential clinical deployment. By striking a balance between performance enhancement and real-world feasibility, NCT-CXR offers a practical and effective solution for integrating deep learning-based segmentation into clinical workflows.
To validate the effectiveness of the NCT-CXR framework and its augmentation strategies, this research systematically evaluates their impact on segmentation performance through comprehensive statistical analysis, including ANOVA and Tukey HSD tests. These analyses highlight precision improvements essential for clinical reliability, ultimately contributing to more accurate segmentation and enhanced patient outcomes [31]. By assessing multiple pathological conditions, this research provides valuable insights into how augmentation techniques tailored to medical imaging influence segmentation quality. The remainder of this paper is structured as follows: Section 2 reviews related work in medical image segmentation, data augmentation, and deep learning applications in chest X-ray analysis. Section 3 details the proposed methodology, including the augmentation framework and coordinate transformation approach. Section 4 presents experimental results and statistical analysis, while Section 5 discusses clinical implications, limitations, and future research directions. Finally, Section 6 concludes with key findings and recommendations for integrating the proposed approach into clinical workflows.
2. Related Works
Recent advances in deep learning for medical image analysis have significantly propelled the field of automated chest X-ray interpretation. These advancements encompass architectural innovations, data handling strategies, and evolving semantic segmentation techniques [1,4,13,27]. The shift towards semantic segmentation, particularly in medical imaging, allows for more granular and clinically relevant analysis compared to traditional classification approaches [7,18,27]. This section examines pertinent literature across three key areas: deep learning architectures for medical image segmentation, data augmentation strategies in medical imaging, and methods for addressing class imbalance in medical datasets.
2.1. Deep Learning Architectures for Medical Image Segmentation
The evolution of deep learning architectures for medical image segmentation has witnessed significant progress, with YOLO-based architectures emerging as powerful tools. While traditional semantic segmentation networks like U-Net [32] have been widely adopted in medical imaging, YOLO-based architectures have gained traction due to their ability to efficiently combine object detection and segmentation [20,21,22,23]. The introduction of YOLOv8 [21] brought substantial improvements in segmentation capabilities, particularly in complex medical imaging tasks. Several studies have demonstrated the effectiveness of YOLObased architectures in chest X-ray analysis, including the detection of COVID-19 pneumonia, where YOLO models effectively locate and segment the thoracic and lung regions [33,34]. These examples highlight the ability of YOLO-based models to handle multiple pathological conditions concurrently while maintaining computational efficiency. However, challenges remain in maintaining consistent performance across diverse pathologies, especially for rare conditions with limited training examples [4].
2.2. Data Augmentation Strategies in Medical Imaging
Data augmentation strategies in medical imaging have progressed beyond basic geometric transformations to encompass sophisticated techniques that preserve clinical validity. Recent research has explored various augmentation methods tailored to chest X-rays, ranging from conventional geometric transformations to advanced intensity-based modifications [24,27]. While traditional data augmentation methods like rotation and scaling have proven effective in general computer vision, their application in medical imaging demands careful consideration of anatomical constraints [8,28]. Researchers have investigated the impact of different augmentation strategies on model performance, emphasizing the preservation of diagnostic features [24]. Intensity-based augmentations, such as contrast adjustment and noise addition, have been shown to improve model robustness to variations in image acquisition conditions [25,35,36]. However, determining optimal augmentation parameters that enhance performance without introducing artifacts that compromise diagnostic accuracy remains a challenge. For example, excessive rotation can obscure anatomical structures, while insufficient augmentation may not provide sufficient variability for effective learning [37].
2.3. Addressing Class Imbalance in Medical Datasets
The challenge of class imbalance in medical imaging datasets has garnered considerable attention, particularly in chest X-ray analysis. Traditional approaches like oversampling and under sampling have shown limited success in medical imaging due to the complexity of pathological features [38]. Recent studies have explored more sophisticated methods, combining augmentation strategies with selective sampling techniques to address both class imbalance and annotation quality issues [14,27,39]. A crucial aspect often overlooked is the discrepancy between automated labels and expert annotations, which can significantly affect model performance [18]. The NIH Chest X-ray dataset [12], while widely used, exhibits this issue. Although image-level labels are provided, derived from text-mining radiological reports with an expected accuracy exceeding 90%, manual annotation remains necessary. This has spurred research into reconciling automated labels with expert annotations, especially in semantic segmentation.
While existing research has made progress in addressing individual challenges, a gap remains in integrating multiple approaches to simultaneously address class imbalance, annotation quality, and segmentation accuracy. Previous studies have often focused on either augmentation strategies [14,25] or architectural improvements [6,38], with limited attention to their systematic combination and rigorous statistical validation [8,35]. The impact of different augmentation strategies on semantic segmentation performance, particularly in the context of multiple co-existing pathologies, requires further investigation. Furthermore, while coordinate transformation in image augmentation has been explored [40,41,42], its specific application to semantic segmentation of chest X-rays, especially for multiple pathological regions, warrants more comprehensive research. This research addresses these gaps by proposing NCT-CXR, an integrated framework combining carefully calibrated augmentation strategies with YOLOv8’s semantic segmentation capabilities, supported by rigorous statistical analysis to validate the effectiveness of different augmentation combinations.
3. Methodology
This research presents NCT-CXR, a comprehensive framework for improving semantic segmentation in chest X-ray analysis through an integrated approach to data augmentation and deep learning. NCT-CXR addresses three critical challenges: class imbalance, annotation quality discrepancies, and the need for precise semantic segmentation. Using the NIH Chest Xray dataset [12], we implement a systematic approach combining geometric transformations, improve coordinate transformations, and intensity-based augmentation strategies within the YOLOv8 semantic segmentation architecture. NCT-CXR comprises four main components: dataset preparation and pre-processing, augmentation strategy implementation (including the improve coordinate transformation), model training with optimized hyperparameters, and comprehensive statistical evaluation (Figure 1). Details of each component are provided in the following subsections.
3.1. Dataset preparation and preprocessing
This research utilized the NIH Chest X-ray dataset, consisting of 1,061 chest X-ray images categorized into 950 training images and 111 validation images. Table 1 provides a detailed breakdown of the dataset, highlighting the distribution of images across various thoracic conditions. The dataset covers a diverse range of thoracic conditions, including common abnormalities such as consolidation, effusion, fibrosis, pneumonia, and pneumothorax, alongside normal cases labelled as no finding. In addition, several samples exhibit multiple co-occurring abnormalities, such as fibrosis and pneumothorax or atelectasis, effusion, infiltration, and nodule. However, the distribution of disease categories highlights a significant class imbalance, with some categories, such as no finding, being heavily represented (200 images), while rarer conditions, such as nodules, have fewer samples (87 images). This imbalance underscores the need for robust preprocessing and augmentation to ensure fair model training.
To ensure data consistency, quality, and compatibility with the YOLOv8 architecture for model training, three key pre-processing steps were meticulously implemented: annotation refinement, image resizing, and intensity normalization.
- Annotation refinement: Accurate and consistent annotations are crucial for training a robust segmentation model. Given the inherent challenges of multi-label chest X-ray annotation, particularly with overlapping or complex pathologies, a thorough annotation refinement process was conducted. This involved a detailed review of all annotations by expert radiologists. Specifically, any incorrect, incomplete, or inconsistent annotations were corrected to align with established clinical interpretations and standardized annotation guidelines. This process aimed to minimize inter-observer variability and ensure that the training data accurately reflected the ground truth, which is essential for training a high-performing segmentation model. The refinement process focused on resolving ambiguities in cases with overlapping or combined labels, ensuring that each distinct pathological condition was accurately and uniquely represented in the training data. This rigorous review process is particularly important for multi-label segmentation tasks, where the accurate delineation of individual pathologies within complex presentations is important.
- Image Resizing: To ensure compatibility with the YOLOv8 semantic segmentation architecture and to manage computational resources effectively, all input images were resized to a fixed dimension of 800x800 pixels. This standardization of image dimensions ensured uniformity across the dataset, preventing variations in input size from affecting model performance. Critically, the resizing process was carefully implemented using bilinear interpolation to minimize distortion of anatomical structures and preserve diagnostically relevant features. Bilinear interpolation was chosen as it offers a good balance between computational efficiency and image quality preservation. This consistent input size also contributes to stable training convergence and efficient memory utilization during the training process.
- Intensity Normalization: To mitigate the effects of varying image brightness and contrast levels, and to improve numerical stability during training, pixel intensity normalization was performed. Specifically, pixel intensities were normalized to the range [0, 1] using a min-max scaling approach. This normalization step addressed variations in image brightness and contrast that can arise from differences in X-ray exposure settings, imaging equipment, and patient-specific factors. By standardizing the intensity range, we aimed to improve the numerical stability of the training process and reduce the influence of these extraneous variations, allowing the model to focus on learning the underlying pathological features rather than variations in image acquisition parameters. This normalization step is particularly important for deep learning models, as it can prevent issues related to gradient vanishing or exploding during training.

Table 1.
NIH Chest X-ray dataset information.
| Folder | Abnormalities labels | Images set | ||
| Train | Val | Total | ||
| 0 | Consolidation | 140 | 16 | 156 |
| 1 | Effusion | 147 | 17 | 164 |
| 2 | Fibrosis | 140 | 16 | 156 |
| 3 | Pneumonia | 122 | 14 | 136 |
| 4 | Pneumothorax | 87 | 10 | 97 |
| 5 | No Finding | 180 | 20 | 200 |
| 6 | Nodule | 78 | 9 | 87 |
| 7 | Fibrosis|Pneumothorax | 20 | 3 | 23 |
| 8 | Atelectasis|Fibrosis|Infiltration | 18 | 3 | 21 |
| 9 | Atelectasis|Effusion|Infiltration|Nodule | 18 | 3 | 21 |
| 950 | 111 | 1061 | ||
3.2. Augmentation strategy implementation
To address class imbalance in the NIH Chest X-ray dataset, we implemented a carefully calibrated data augmentation strategy that prioritizes anatomical accuracy and computational efficiency. In chest X-ray analysis, it is essential that augmentations preserve the spatial relationships between pathological regions and anatomical landmarks, as even minor distortions can reduce diagnostic reliability. The NCT-CXR framework incorporates an improved coordinate transformation technique that maintains spatial fidelity while introducing clinically appropriate variability. Transformation parameters were determined through empirical testing and expert radiologist consultation to ensure augmented images remain realistic and diagnostically valid. This strategy supports practical clinical deployment by balancing accuracy, interpretability, and performance.
The data augmentation process was multi-faceted, incorporating three primary categories of transformations: geometric transformations, coordinate transformations, and intensity-based augmentations.
- 1.
-
Geometric Transformations: These transformations focused on adjusting the spatial configuration of the images while meticulously preserving critical anatomical features. Controlled discrete-angle rotations at (-5°, +5°) and (-10°, +10°) were employed, along with precise shift-scale operations (shift limit = 0.02, scale limit = 0.05) to maintain anatomical integrity. These specific rotation angles and shift/scale limits were carefully selected based on a combination of expert consultation with radiologists and rigorous empirical testing. The goal was to ensure that the augmentations remained clinically plausible and did not introduce unrealistic or artefactual distortions that could negatively impact model training. By introducing spatial variability through these geometric transformations, the model’s resilience to positional shifts and orientation changes, which are commonly encountered in clinical imaging scenarios, was significantly enhanced. These variations in patient positioning can occur due to differences in patient size, positioning protocols, and patient cooperation during the imaging procedure.The rotation transformation can be mathematically represented as follows: For a point P(x, y) in the original image, the rotation by an angle is defined as:Where (x’, y’) represents the coordinates after rotation and is the rotation angle (discrete rotations at (-10°, +10°) or discrete rotations at (-5°, +5°) in our implementation). This equation describes a standard twodimensional rotation about the origin. The use of both positive and negative rotation angles allows the model to learn invariance to both clockwise and counter-clockwise rotations. The specific choice of discrete rotations at (-10°, +10°) and discrete rotations at (-5°, +5°) rotations was carefully considered to simulate realistic variations in patient positioning during X-ray acquisition, while avoiding excessive rotations that could distort or obscure diagnostically relevant anatomical features beyond clinically plausible scenarios. The shift and scale operations were similarly constrained to maintain anatomical integrity.
- 2.
-
Coordinate-based Modifications: A crucial innovation in our approach lies in the coordinate transformation process for semantic segmentation masks, which maintains precise spatial relationships during augmentation. This process includes cropping, translation (shifting along the X and Y axes), and random scaling to introduce diverse perspectives within the same anatomical region, enhancing the model’s ability to detect features accurately regardless of their location. Here, the scale transformation is applied with adaptive scaling factors to maintain aspect ratio:Where and are scaling factors constrained by: . Here, scale factors are dynamically adjusted to preserve pathological feature proportions.In matter of Coordinate normalization, the transformation process includes coordinate normalization to ensure consistent mapping:The complete coordinate transformation can be expressed as:Where T is the composite transformation matrix, and are translation components. Thus, this transformation able to preserves topological relationships between anatomical structures.In matter maintain anatomical validity, the following constraints are enforced: for model 2, the constraint is ; for model 3 is ; for all models, . then, for translation limits is . Finally, the transformation accuracy is optimized using a loss function that minimizes spatial distortionWhere represents the target coordinates, are the transformed coordinates, is the Frobenius norm, and is a regularization parameter (set to 0.01 in our implementation).For better understanding, we can see example by initials condition as follows:Original image dimensions: 800 × 800 pixelsInitial point P(x, y) = (400, 300)Rotation angle = 5° (0.0873 radians)Scale factors: = 1.02, = 1.02Translation offsets: = 5 pixels, = -3 pixelsThus, the Normalization of Initial Coordinates can be calculated:The Rotation Transformation Matrix:The scale transformation:Translation in normalized coordinates:Conversion Back to Pixel Coordinates:Thus, we can verify the anatomical consistency as follows: Original distance from image center and New distance from image centerDistance ratio (matches scale factor)Then, for error analysis, we can see:Positional shiftRelative errorThe analysis of the coordinate transformation’s impact on anatomical landmarks revealed that the relative error in landmark repositioning remains within acceptable clinical bounds. This controlled distortion ensures that the transformed anatomical structures remain anatomically plausible, while simultaneously introducing sufficient variation to effectively augment the training data. Specifically, the relative error analysis demonstrated that the transformation adheres to pre-defined constraints (±5° rotation, ±2% translation, and ±5% scaling), preserving the integrity of the anatomical structures. This is crucial because excessive or unrealistic distortions could lead to the model learning spurious features or misinterpreting anatomical relationships, ultimately hindering its diagnostic accuracy. The observed relative error values indicate that the transformation maintains the clinical relevance of the augmented data, ensuring that the model is trained on realistic variations in anatomical positioning and size. Further analysis will explore the impact of these controlled distortions on the model’s segmentation performance, correlating the degree of anatomical variation with improvements in metrics such as precision, recall, and F1-score. This will provide a quantitative measure of the effectiveness of the coordinate transformation in enhancing the model’s ability to generalize to real-world variations in chest X-ray images.The improve coordinate transformation methodology in NCT-CXR fundamentally differs from traditional augmentation techniques in its approach to preserving spatial accuracy during geometric transformations. While conventional affine transformations apply uniform transformations across the entire image, potentially distorting critical anatomical relationships, our approach implements a constraint-guided transformation process specifically designed for medical imaging contexts. The key differentiating factors include:
- (a)
- Anatomical Constraint Integration: Unlike elastic deformations that can arbitrarily distort image regions, our transformation incorporates anatomical constraints (Equation 6) that ensure critical diagnostic features maintain their relative spatial positions. This is implemented through a specialized loss function that minimizes spatial distortion while allowing controlled variability.
- (b)
- Topological Preservation: Traditional augmentations often break topological relationships between anatomical structures. NCT-CXR enforces strict boundary conditions on transformation parameters (rotation limited to ±5° or ±10°, scaling between 0.95 and 1.05) based on clinical consultation, ensuring transformations remain within radiologically acceptable ranges that preserve diagnostic integrity.
- (c)
- Adaptive Coordinate Normalization: We implement a two-phase coordinate mapping process (Equations 3-4), where coordinates are first normalized to a canonical space before applying transformations, then mapped back to the original coordinate system. This reduces cumulative transformation errors that commonly occur in sequential transformations.
- (d)
- Pathology-Aware Transformation: Unlike general-purpose augmentations, our transformation parameters are calibrated based on different pathological characteristics, allowing more aggressive transformations for conditions with well-defined boundaries (e.g., pneumothorax) while applying more conservative transformations to diffuse or subtle pathologies.
This approach maintains the semantic meaning of segmentation annotations during augmentation, ensuring that pathological regions remain accurately aligned with their corresponding anatomical structures, which is critical for training models to recognize subtle diagnostic features across varying patient presentations. - 3.
-
intensity-based augmentation: Intensity-based augmentations were incorporated into the NCT-CXR framework to simulate variations in image brightness, contrast, and noise levels, which are commonly observed due to differing imaging conditions, equipment calibration, and patient-specific factors. These augmentations enhance the model’s robustness and ability to generalize to real-world X-ray acquisitions. Specifically, we employed the following intensity-based augmentation techniques:
- (a)
- Random Brightness/Contrast Adjustment: To mimic variations in image brightness and contrast, we applied random adjustments within controlled range. The brightness and contrast of each image were randomly varied by up to ±10% of their original values. This range was chosen to reflect realistic variations while avoiding extreme distortions that could introduce artifacts or compromise diagnostic information.
- (b)
- Gaussian Noise Addition: To simulate the presence of noise, which can arise from various sources during image acquisition and transmission, we added Gaussian noise to the images. The variance of the Gaussian noise was randomly selected within a range of 10.0 to 50.0. This range was empirically determined to introduce realistic levels of noise without overwhelming the image signal and obscuring diagnostically relevant features
Both the Random Brightness/Contrast Adjustment and Gaussian Noise Addition augmentations were applied with a probability of 0.2. This probability was chosen to ensure that the model was exposed to a sufficient variety of intensity variations without excessively altering the training data distribution. Applying these augmentations probabilistically, rather than deterministically, further enhances the diversity of the training data and improves the model’s ability to generalize to unseen data. The specific values for the brightness/contrast variation and noise variance, as well as the application probability, were determined through a combination of literature review, empirical testing, and expert consultation with radiologists to ensure clinical relevance.For the equation, the brightness and contrast modifications are defined by:Where is the output pixel intensity, is the input pixel intensity, is the contrast factor, is the brightness shift, and Probability of application: .Gaussian noise is applied to simulate detector noise:Where represents noise variance. Here, Noise is clipped to preserve intensity range and applied with probabilityGamma Corrections simulates exposure variationsWhere is the gamma factor and Probability of application: .
The combination of geometric transformations, intensity adjustments, and the improve coordinate transformation technique within the NCT-CXR framework is designed to enrich the training dataset. This enriched dataset promotes model generalization by exposing the model to a wider range of realistic variations in chest X-ray images, ultimately enhancing the performance of the semantic segmentation model. By preserving spatial accuracy during augmentation, NCT-CXR ensures that the relationships between pathological regions and anatomical landmarks are maintained, which is crucial for clinically relevant segmentation.
3.3. NCT-CXR model scenario
To systematically evaluate the impact of different augmentation strategies, and specifically the influence of coordinate-based transformations, on the semantic segmentation performance of chest X-ray images, four distinct model scenarios were designed and implemented. These scenarios allow for a controlled analysis of how varying degrees of rotation affect model performance.
- Model 1. The baseline model: This model serves as the baseline and was trained using the original, unaugmented NIH Chest X-ray dataset. This provides a reference point against which the performance gains from the different augmentation strategies can be measured.
- Model 2. ±10° Rotation Augmentation: This model incorporates coordinate transformations with a controlled discrete rotation at (+10°,-10°). This relatively subtle rotation simulates minor variations in patient positioning during image acquisition, which are commonly encountered in real-world clinical settings. This scenario explores the model’s ability to generalize to these small, but clinically relevant, variations.
- Model 3. ±5° Rotation Augmentation: This model introduces a more pronounced controlled discrete rotation at (+5°,-5°). This scenario investigates the model’s robustness to larger positional shifts, which might occur due to variations in imaging protocols or patient cooperation.
- Model 4. Mixed rotation augmentation: This model combines both the ±5° and ±10° rotations, creating a mixed-rotation augmentation strategy. This approach aims to mimic the diverse range of imaging scenarios encountered in clinical practice, where variations in patient positioning can be significant. This scenario tests the model’s ability to handle a wider spectrum of positional variations.
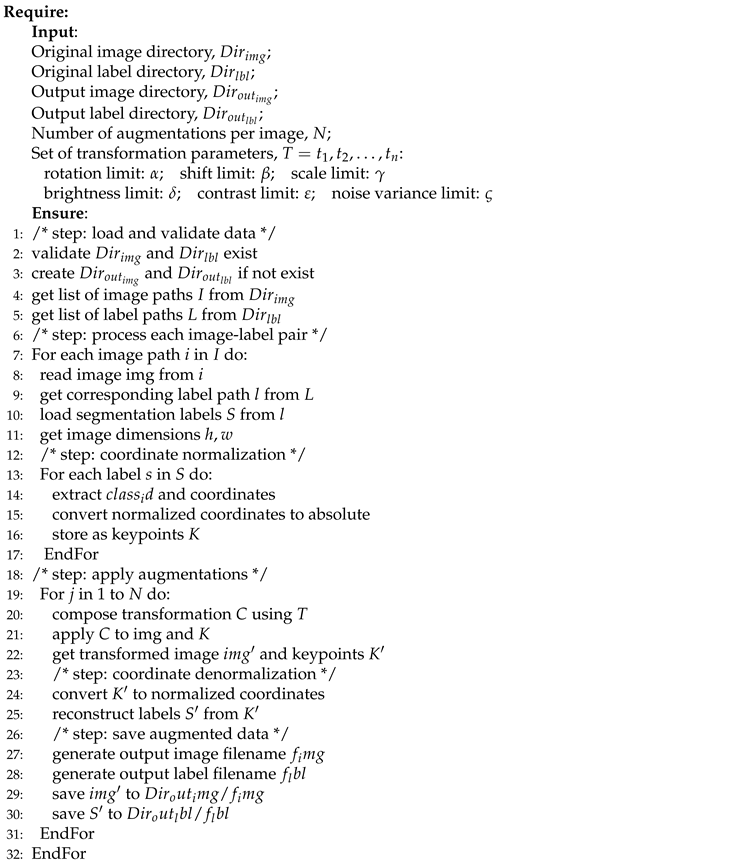
To provide a clear and reproducible understanding of the data augmentation process within the NCT-CXR framework, Algorithm 1 details the step-by-step procedure. This algorithm encompasses the entire data processing pipeline, from initial data loading to the generation of augmented outputs. Crucially, it incorporates the improve coordinate transformation technique to ensure spatial accuracy is maintained throughout the augmentation process. The algorithm is designed to handle both the geometric (rotations) and intensity-based transformations applied within NCT-CXR, while preserving the accuracy and integrity of the segmentation annotations. The algorithm takes as input the directories containing the original images and corresponding labels, specifies the desired output locations for the augmented data, and defines the number of augmented images to be generated per original image. Furthermore, the algorithm utilizes a set of parameters that carefully control the degree of geometric and intensity modifications applied to the original images. Each step within the algorithm is meticulously structured to ensure consistent data processing across the entire dataset while preserving the clinical significance and diagnostic relevance of the augmented samples. A detailed explanation of the algorithm’s steps and the rationale behind each operation will be provided in the following sections.
| Algorithm 1:Proposed Framework for Image Segmentation Data Augmentation |
 |
3.4. Complexity Analysis of NCT-CXR Framework
Computational complexity is a crucial consideration for the practical deployment of the NCT-CXR framework, especially in clinical settings where computational resources may be constrained. A detailed analysis of its computational complexity, considering both time and space requirements, is essential to assess its feasibility, efficiency, and scalability. This analysis examines the key components of the framework, including image processing operations, the improve coordinate transformations, and data management within the augmentation pipeline.
-
Time Complexity Analysis: The time complexity of the NCT-CXR framework was systematically analysed to provide a clear understanding of its performance characteristics and scalability. Let n represent the number of images in the dataset, k the number of labels (bounding boxes or segmentation masks) per image, N the number of augmentations applied per image, p the number of key points or vertices defining each label (e.g., 4 for a bounding box, or the number of points in a segmentation mask), and h and w represent the height and width of the images, respectively. The time complexity can be broken down into two phases:
- (a)
- Initialization Phase: Tasks such as directory validation and path list generation have a constant time complexity of O(1). These operations are performed once at the beginning and do not scale with the dataset size.
- (b)
-
Main Processing Loop: The dominant factor in time complexity arises from the processing of each image and its augmentations. For each image (n iterations):
- (i)
- Loading the image and its associated labels has a constant time complexity of O(1).
- (ii)
- Normalizing the label coordinates, a pre-processing step, has a complexity of O, as it involves processing each key point of each label.
- (iii)
-
The augmentation loop, executed N times for each image, contains the following operations:
- (A)
- Image transformations (geometric and intensity-based) scale with the image dimensions, resulting in a complexity of .
- (B)
- Adjusting the label coordinates based on the applied transformation has a complexity of , as it involves updating the coordinates of each key point in each label
- (C)
- Saving the augmented image and its corresponding labels has a negligible, effectively constant, complexity of O(1).
Therefore, the overall time complexity of the NCT-CXR framework can be expressed as: -
Space Complexity Analysis: The space complexity of the NCT-CXR framework was analysed to assess its memory requirements, considering both static and dynamic storage.
- (a)
- Static space: Static memory is required for storing the input image paths (O(n)) and the transformation parameters (O (1), constant)
- (b)
-
Dynamic space: Dynamic memory usage is determined per iteration of the main processing loop and involves:
- (i)
- The image buffer, which stores the currently processed image, .
- (ii)
- Label storage for the current image, .
- (iii)
- Temporary buffers used during the transformation process, which also scale with the image dimensions, .
Combining these factors, the total space complexity of the NCT-CXR framework can be expressed as: -
Performance Considerations The practical performance of the NCT-CXR framework is influenced by several critical factors: I/O operations, memory management, and the computational workload.
- (a)
- I/O Operations: The framework performs n read operations for the original images and n × N write operations for the augmented images. This high volume of disk operations can create a bottleneck, particularly with large datasets or slow storage devices. Optimizing I/O, such as using solid-state drives (SSDs) asynchronous I/O operations, can significantly improve performance.
- (b)
- Memory Management: NCT-CXR employs a sequential processing strategy to minimize memory footprint. Only one image and its augmented versions are loaded into memory at any given time, along with the relatively small overhead for transformation parameters. This approach prevents memory exhaustion, making the framework suitable for resource-constrained environments. However, the trade-off is potentially increased processing time compared to batch processing, which could be explored in future work for systems with ample RAM.
- (c)
- Computational Workload: The computational workload is dominated by the image transformation operations, which involve pixel-level manipulations and geometric adjustments. These operations, scaling with , are computationally intensive and typically rely on the CPU. While the coordinate transformation calculations are less demanding , they still contribute to the overall workload. Future implementations could explore parallel processing techniques, such as using GPUs or multi-core CPUs, to accelerate these computations and improve processing speed without compromising the framework’s robustness and reliability. Furthermore, optimizing the image transformation algorithms themselves could also yield performance gains.
3.5. Model training and parameter setting
YOLOv8 was selected as the base architecture for this research due to its demonstrated efficacy in semantic segmentation of high-resolution chest X-ray images [21]. The YOLOv8 architecture was implemented and optimized to address the specific challenges inherent in medical image analysis, particularly the complexities associated with multi-label classification and the subtle variations in pathological features. A rigorous hyperparameter tuning process was undertaken to maximize model performance and ensure robust training outcomes.
The model was configured with an input image size of 800×800 pixels, striking a balance between computational efficiency and the level of detail required for accurate segmentation. A batch size of 16 was chosen considering GPU memory constraints and the desire for stable gradient updates. The AdamW optimizer was employed for its adaptive learning rate capabilities, which facilitate stable and efficient convergence, particularly in complex optimization landscapes. The initial learning rate was set to 0.0001, and a learning rate decay factor of 0.01 was implemented to strategically reduce the learning rate during training, preventing premature convergence and allowing the model to fine-tune its weights in later epochs. Dropout regularization with a rate of 0.2 was strategically applied to mitigate overfitting, a common issue in deep learning, especially with limited training data. The training process was monitored for a maximum of 300 epochs. To prevent overfitting and optimize training time, an early stopping mechanism was implemented, halting training after 30 epochs of no improvement in validation loss. This strategy ensures efficient resource utilization. To ensure reproducibility of results, all experiments were conducted with a fixed random seed (42) and a consistent hardware configuration using a single NVIDIA GPU in DGX A100 40GB GPU.
3.6. Performance Evaluation
The performance evaluation phase was designed to rigorously assess the accuracy and robustness of the semantic segmentation model across the different experimental setups. This assessment employed both quantitative metrics and statistical analysis to provide a comprehensive comparison of the performance of each model variation. The key performance metrics used in this evaluation were precision, recall, F1-score, and mean Average Precision (mAP). Precision, defined as the proportion of correctly identified pixels among all predicted pixels for a specific class, measures the model’s ability to minimize false positives. Recall, conversely, measures the proportion of correctly identified pixels among all actual pixels of a given class, reflecting the model’s ability to capture all relevant instances
The F1-score, representing the harmonic mean of precision and recall, provides a balanced measure of performance, particularly valuable in the context of imbalanced datasets, as it considers both false positives and false negatives. The mAP provides a more comprehensive evaluation by calculating the average precision across various Intersection over Union (IoU) thresholds. Specifically, mAP was assessed at a fixed IoU threshold of 0.5 (mAP@0.5) and also by averaging the AP across a range of IoU thresholds from 0.5 to 0.95 (mAP@0.5:0.95) [23, 45]. mAP@0.5 provides a measure of performance at a standard threshold, while mAP@0.5:0.95 offers a more nuanced evaluation across a range of overlap criteria, reflecting the model’s ability to accurately segment regions with varying degrees of overlap with the ground truth.
Beyond the quantitative metrics, statistical analyses were conducted to determine the statistical significance of the observed performance differences between the model variations. Kruskal-Wallis and Nemenyi test was used to determine whether statistically significant differences existed among the four model variations: (1) the baseline model without augmentation, (2) the model trained with discrete rotation at (+5°,-5°) rotations, (3) the model trained with discrete rotation at (+10°,-10°) rotations, and (4) the model trained with the mixed rotation augmentation strategy (combining both 5° and 10° transformations).
Where the Kruskal-Wallis results indicated statistical significance (p < 0.05), Nemenyi test was performed to identify specific pairs of models that exhibited statistically significant differences in performance. This post-hoc analysis allowed us to determine which augmentation strategies led to statistically significant improvements compared to the baseline and to each other.
4. Results
4.1. Result of data preprocessing
a. Annotation refinement
The National Institutes of Health (NIH) Chest X-ray dataset, containing abnormality labels and classifications, was obtained from Kaggle. This dataset, while providing valuable image data, required careful pre-processing, particularly in terms of annotation refinement, to ensure the quality and consistency necessary for training a robust segmentation model. Our research focused on eight specific disease categories: consolidation, effusion, fibrosis, pneumonia, pneumothorax, nodule, no finding, and clinically relevant co-occurrences such as fibrosis combined with pneumothorax and atelectasis with infiltration. The dataset comprised a total of 1,061 images, with a notable class imbalance. The number of samples per disease category ranged from relatively frequent findings, such as "no finding" (200 samples), to rare co-occurrences, like fibrosis combined with pneumothorax (23 samples). This class imbalance presented a challenge for model training, as models can be biased towards more frequent classes.
The original image-level labels provided with the NIH dataset were used as a starting point. However, given the potential for inaccuracies and inconsistencies in automatically generated labels, a rigorous annotation refinement process was implemented. Expert radiologists performed the semantic segmentation annotation, delineating regions of interest for each identified pathology. These regions were defined by coordinate points specifying the boundaries of the multi-label segmentation areas. To ensure consistency and accuracy, a second layer of validation was implemented. A different radiologist, blinded to the first radiologist’s annotations, independently reviewed and validated the annotated regions of interest using the OncodocAI application (ai.oncodoc.id). This double-reading approach, a standard practice in radiology, helped to minimize inter-observer variability and improve the overall quality of the annotations. Furthermore, in close collaboration with tuberculosis specialists acting as expert annotators, the annotations were iteratively refined using the segmentation correction interface within the OncoDocAI application (Figure 2).
To clarify the annotation procedure, each abnormality within an image is counted individually. For example, if a CXR image contains two nodules, they are recorded as two separate abnormalities. Similarly, if the same image includes two nodules and one abnormality, it is counted as three distinct abnormalities in total. The final annotated dataset was split into training and validation subsets for semantic segmentation tasks. This annotation refinement process ensured high-quality segmentation maps that form the foundation for effective training and evaluation of the semantic segmentation model. Data distribution of training and validation samples per disease category after annotation refinement shown in Table 2.
The final annotated dataset underwent image multiplications as part of the augmentation strategy, which aimed to balance the class distributions by increasing the representation of underrepresented categories. This augmentation process involved multiplying the existing images in each folder to expand the dataset size and enhance the model’s generalization capability. The detailed results are presented in Table 3. Column X represents the multiplication factor applied to the original images to generate augmented files.
Following the image augmentation process, meticulous attention was given to updating the corresponding label annotations for the newly generated training data. Table 4 presents a comprehensive overview of the number of abnormality labels in the training dataset before and after augmentation. The Table 4 clearly distinguishes between the original label counts, the counts after basic augmentation (Aug), and the counts after mixed augmentation (Mix Aug). This detailed breakdown allows for a direct comparison of the impact of each augmentation strategy on the label distribution.
For example, in Folder 0 (representing "Consolidation"), the original dataset contained 140 images. These images were multiplied by a factor of 2, resulting in 280 augmented images. Therefore, the final number of images in Folder 0 became 420, comprising 140 original images and 280 augmented images. This process was repeated for all categories to ensure a balanced dataset for the training phase.
As can be seen, the augmentation and annotation process significantly increased the number of labeled abnormalities, effectively enhancing both the size and, more importantly, the diversity of the dataset. This increase in labeled abnormalities contributes to a more balanced representation of the different pathological conditions, mitigating the challenges posed by the inherent class imbalance in the original dataset. A more balanced dataset, coupled with the increased diversity introduced by the augmentations, supports more robust and generalizable training of the semantic segmentation model, leading to improved performance on unseen data. The augmented dataset provides the model with a richer set of examples, enabling it to learn more discriminative features and better handle the variations present in real-world clinical data.
After augmenting and annotating the training data to improve class balance and representation, the validation dataset remained unchanged to provide a consistent baseline for evaluating the model’s generalization capabilities. Table 5 presents the distribution of label annotations in the validation dataset, which is also used as the testing dataset. The validation dataset comprises a total of 220 labelled abnormalities across nine thoracic conditions, providing a comprehensive benchmark for evaluating the performance of the semantic segmentation model.
b. Image Resizing
All images in the dataset were resized to a uniform dimension of 800×800 pixels prior to training. This specific size was chosen as a compromise between preserving sufficient image detail for accurate segmentation and maintaining computational efficiency [38,43]. Larger input sizes can capture finer details but increase computational demands, while smaller sizes reduce computational load but may lose important diagnostic information.
The 800x800 pixel dimension was empirically determined to provide a suitable balance for chest Xray analysis. This resizing step is essential for batch processing during model training, as deep learning models typically require input images of consistent dimensions. It also contributes to more stable and efficient training by ensuring that all images contribute equally to the gradient calculations during backpropagation.
c. Intensity Normalization
To standardize input features and facilitate efficient model convergence, pixel values were normalized to a 0–1 scale [43,44]. This normalization process involved scaling the pixel intensities to this specific range, ensuring consistency across all images in the dataset. Normalizing pixel values addresses variations in image brightness and contrast that can arise from differences in X-ray exposure settings, imaging equipment, and patient-specific factors
By providing the model with inputs that have uniform dynamic ranges, normalization prevents these variations from unduly influencing the learning process. This standardization allows the model to focus on learning the underlying pathological features rather than being sensitive to variations in image acquisition parameters. Furthermore, normalizing pixel values to a 0-1 range is a common practice in deep learning as it can improve the numerical stability of the training process and prevent issues such as vanishing or exploding gradients.
d. Comparison of NIH Labels and Expert Annotations
A crucial component of the pre-processing pipeline involved a detailed comparison and reconciliation of discrepancies between the original NIH image labels and the expert-generated annotations. These discrepancies were expected due to the inherent differences between the automated label generation process used for the NIH dataset and the refined expert annotations, which were manually reviewed and corrected to enhance labelling accuracy. The automated labelling process, while efficient for large datasets, can be prone to inaccuracies, particularly in complex cases with overlapping pathologies or subtle visual cues.
The manual review and correction by expert radiologists aimed to address these limitations and create a high-quality ground truth dataset for training the segmentation model. Table 6 and Table 7 provide a detailed comparison of the label distributions derived from the original NIH dataset and the refined expert annotations. This comparison highlights the specific areas where discrepancies existed and provides insight into the extent of the annotation refinement required to ensure data quality. Analysing these discrepancies is essential for understanding the limitations of the original NIH labels and for justifying the need for expert annotation in medical image analysis tasks.
As detailed in Table 6 and Table 7, our analysis of the initial annotations revealed significant discrepancies in labelling patterns, particularly in cases presenting multiple, concurrent pathological conditions. These inconsistencies, likely arising from subjective interpretations of subtle visual cues and the inherent complexity of multi-label annotation in chest X-rays, underscored the critical need for a systematic annotation refinement process. Ensuring both consistency and accuracy in the training data is paramount, as inaccurate or inconsistent labels can severely hinder the model’s ability to learn discriminative features and subsequently compromise its semantic segmentation performance.
Specifically, these labelling variations can introduce both noise and bias into the training process. Noise, in the form of randomly incorrect labels, can confuse the model and prevent it from converging to an optimal solution. Bias, on the other hand, can arise from systematic errors in labelling, such as consistently misidentifying a particular type of pathology. This can lead the model to develop a skewed understanding of the data, resulting in poor generalization performance on unseen examples and reduced clinical applicability.
The refinement process involved a detailed review of the discordant annotations by expert radiologists. This review focused on establishing clear, standardized criteria for identifying and delineating each pathological condition, ensuring consistent interpretation of imaging features and minimizing inter-observer variability. Particular attention was paid to cases with overlapping or ambiguous pathologies, where the distinction between different conditions could be challenging.
4.2. Result of NCT-CXR augmentation strategies
This section presents the experimental results, focusing on the differential impact of discrete rotations at (-10°, +10°,-5°,+5°) rotation augmentations on the semantic segmentation performance for detecting multiple pathological conditions in chest X-ray images. We hypothesized that the magnitude of rotation would influence the model’s ability to generalize to variations in patient positioning during image acquisition. We further hypothesized that a moderate degree of rotation would provide sufficient variability to improve model robustness without excessively distorting anatomical features. The results obtained with the discrete rotations at (-10°, +10°) rotation augmentation provide insights into how larger positional adjustments influence the placement of multi-label annotations for pathological conditions.
Figure 3 presents a visual comparison between original and (-10°, +10°) rotated images, demonstrating the effect of this transformation on the spatial distribution of labels for specific pathologies, including infiltration, effusion, and nodules. This visualization allows for a direct assessment of how the rotation affects the anatomical context of the annotations, which is crucial for evaluating the clinical relevance of the augmented data.
For instance, we examined whether the rotation preserved the relative spatial relationships between different pathologies within the same image. Maintaining these spatial relationships is critical for ensuring that the model learns to recognize the co-occurrence patterns of different pathologies, which can be important for diagnosis.
Furthermore, we analysed how the rotation affected the annotation of pathologies located near anatomical boundaries, where even small positional changes can significantly alter the visible features and potentially lead to annotation errors. Beyond visual inspection, we quantified these observations by measuring the changes in the centroid coordinates and bounding box areas (or the area of segmentation masks) of the annotated regions.
This quantitative analysis allowed us to correlate the magnitude of the annotation shift with the observed segmentation performance, providing a more objective and statistically rigorous measure of the augmentation’s impact. The following subsections will detail the quantitative results obtained with both (-10°, +10°) and (-5°,+5°) rotations, comparing their performance against the baseline model and discussing their implications for model performance and clinical applicability.
The results obtained with the discrete (-5°,+5°) rotation augmentation demonstrate how subtle positional adjustments impact the placement of multi-label annotations for pathological conditions in chest X-ray images. Figure 3-1 provides a visual comparison between original and discrete (-5°,+5°) rotated images, illustrating the effect of this subtle transformation on the spatial distribution of labels for specific pathologies, including infiltration, effusion, and nodules. In the original, unaugmented images, the annotations align precisely with the anatomical features as identified during the initial labelling process.
After applying the discrete (-5°,+5°) rotation, the augmented images display minimal, yet noticeable, shifts in the bounding boxes (or segmentation masks), which remain closely aligned with their respective anatomical locations. This precise adjustment ensures that the semantic integrity of the annotations is preserved despite the transformation. The controlled discrete (-5°,+5°) rotation introduces realistic variability into the training data, simulating subtle changes in image orientation that can occur in clinical imaging. This augmentation enhances the model’s robustness by improving its ability to generalize across these small, but clinically relevant, positional variations, which are commonly encountered in real-world diagnostic scenarios.
The primary difference between the discrete (-10°, +10°) and discrete (-5°, +5°) rotation augmentations lies in the magnitude of the positional adjustment introduced to the multi-label annotations. In the case of the ±10° rotation (Figure 3), the annotations for pathological conditions such as infiltration, effusion, and nodules undergo more noticeable shifts. This is a direct consequence of the larger rotation angle, which results in more significant displacements of the bounding boxes (or segmentation masks), while still maintaining their general alignment with the relevant anatomical structures. In contrast, the ±5° rotation (Figure 4-1) introduces only slight positional changes, causing minimal displacement of the annotations. This subtle adjustment preserves the original spatial relationships between pathologies and anatomical landmarks while still adding valuable variability to the training dataset.
The larger rotation angle of ±10° increases the variability in the training data, which can make the model more robust against more substantial changes in image orientation that may occur in real-world clinical settings. This increased robustness comes at a potential cost, however. The larger rotations may introduce minor misalignments between annotations and anatomical features, especially in cases where the pathological features are small, subtle, or closely spaced. This potential for misalignment is less pronounced with the ±5° rotation. The ±5° rotation provides controlled variability that improves the model’s generalization capabilities without drastically altering the positions of key features. This makes it particularly useful for detecting subtle abnormalities with a minimized risk of annotation misalignment.
In summary, the (-10°, +10°) rotation augmentation is more effective for training the model to handle more substantial positional variations in chest X-ray images, enhancing its overall robustness. The (-5°, +5°) rotation, on the other hand, is ideally suited for fine-tuning the model’s performance by simulating minor orientation changes, ensuring both robustness to small variations and precision in the model’s predictions. The choice between these two augmentation strategies, or the combination thereof, depends on the specific clinical application and the desired balance between sensitivity and specificity.
4.3. Result of Chest X-ray segmentation and hyperparameter optimization
The results of the chest X-ray segmentation experiments highlight the significant impact of both data augmentation strategies and hyperparameter tuning on the performance of the YOLOv8 model. This section provides an in-depth analysis of the model’s performance across key evaluation metrics, including precision, recall, F1-score, and mean Average Precision (mAP). The comparison between the baseline model (trained without augmentation) and the augmented models clearly demonstrates how targeted transformations influence the model’s ability to generalize across diverse thoracic abnormalities.
Figure 5 illustrates the comparative performance of the models across multiple evaluation metrics, revealing the varying effectiveness of the different augmentation strategies. The most notable impact was observed in precision scores. Model 2 (trained with (-10°, +10°) rotation) and Model 3 (trained with (-5°, +5°) rotation) achieved significantly higher precision values of 0.519 and 0.517, respectively, compared to the baseline Model 1 (0.346) and Model 4 (trained with mixed ±5° and ±10° rotations) (0.180). This substantial improvement in precision is particularly significant, given the clinical importance of minimizing false positive detections in medical diagnosis. False positives can lead to unnecessary follow-up procedures, increased patient anxiety, and added burden on healthcare resources.
Figure 5 also depicts the performance of the models across other evaluation metrics, including recall. Table 8 presents the recall values for different pathological conditions across the four model configurations: the baseline Model 1 (no rotation augmentation), Model 2 ((-10°, +10°) rotation), Model 3 ((-5°, +5°) rotation), and Model 4 (mixed ±5° and ±10° rotation). Recall, which measures the proportion of actual positive instances correctly identified by the model, is a crucial metric for evaluating the model’s sensitivity, particularly in medical diagnosis where missing abnormalities can have serious implications. A high recall value indicates that the model is effectively capturing most of the true positives, minimizing the risk of missed diagnoses.
As depicted in Figure 5, the experimental results show the varying effectiveness of augmentation strategies on segmentation performance across multiple evaluation metrics, including recall. Table 8 presents the recall values for different pathological conditions across the four model configurations: the baseline Model 1 (no rotation augmentation), Model 2 ((-10°, +10°) rotation), Model 3 ((-5°, +5°) rotation), and Model 4 (mixed ±5° and ±10° rotation). Recall measures the proportion of actual positive instances correctly identified by the model, making it a crucial metric for evaluating the model’s sensitivity, particularly in medical diagnosis where missing abnormalities can have serious implications.
For the overall recall (all classes combined), Model 4 achieved the highest recall value of 0.2610, outperforming the baseline Model 1 (0.2130) and the rotation-specific Models 2 and 3. This indicates that the mixed rotation strategy improves the model’s ability to detect abnormalities across different conditions. However, this improvement in recall suggests a potential trade-off between precision and recall that warrants careful consideration in clinical applications. While higher recall reduces the likelihood of missing abnormalities, it may come at the cost of increased false positives, which could lead to unnecessary follow-ups or interventions.
Therefore, balancing recall and precision is essential to ensure optimal performance for reliable and efficient medical decision-making. The lower precision observed in Model 4 suggests that the mixed rotation strategy, while improving recall, may be leading to an increase in false positive detections. This trade-off highlights the importance of carefully evaluating the performance of different augmentation strategies and selecting the one that best suits the specific clinical needs and priorities.
A class-specific analysis of the model’s performance revealed significant variations in detection accuracy across different pathological conditions, underscoring the importance of considering the unique characteristics of each abnormality when evaluating and optimizing segmentation models. As shown in Table 9, the precision achieved for pneumothorax detection was notably high in both Model 2 (0.829) and Model 3 (0.804), significantly outperforming the other conditions and model configurations.
This substantial improvement in pneumothorax detection is particularly remarkable considering the relatively small representation of pneumothorax cases in the original dataset (97 cases, accounting for only 9.14% of the total). This suggests that the augmentation strategies employed, particularly the (+10°,-10°) and (+5°,-5°) rotations, were particularly effective in improving the model’s ability to accurately identify pneumothorax, even with limited training examples. The high precision values indicate that the model is making relatively few false positive detections for pneumothorax, which is crucial for clinical applications where accurate diagnosis is essential.
In stark contrast, the detection of infiltration proved to be a persistent challenge across all models, with inconsistent precision values reflecting the inherent complexity of identifying diffuse and often subtle pathological patterns. Infiltration often presents as ill-defined areas of increased opacity in the lung parenchyma, making it difficult to distinguish from other conditions or normal variations in lung tissue. The inconsistent precision values across different models suggest that the augmentation strategies employed were not as effective in improving the detection of infiltration as they were for pneumothorax. This disparity in performance across different classes highlights the fact that the effectiveness of data augmentation strategies is significantly influenced by the unique characteristics of each pathological condition. While some conditions, like pneumothorax, may benefit significantly from specific geometric transformations, others, like infiltration, may require different augmentation techniques or more sophisticated model architectures to achieve satisfactory detection accuracy.
This underscores the need for tailored approaches to enhance detection accuracy for challenging abnormalities, potentially involving a combination of targeted data augmentation, specialized network architectures, and refined annotation strategies. Further research is needed to investigate the specific factors contributing to the difficulty in detecting infiltration and to develop targeted strategies to address this challenge.
The F1-scores across the four model configurations, as shown in Table 10, highlight the balance between precision and recall for detecting thoracic abnormalities. Model 4, which applied mixed discrete rotations at (-10°, +10°) and discrete rotations at (-5°, +5°), achieved the highest overall F1-score (0.3840), outperforming the baseline Model 1 (0.2637) as well as Models 2 (0.2760) and 3 (0.2513). This indicates that the mixed augmentation strategy improved the model’s ability to generalize across different conditions.
Pneumothorax showed the most significant improvement, with Model 2 achieving an F1-score of 0.5442, indicating a strong balance between precision and recall. Similarly, the detection of effusion improved, with Model 4 reaching an F1-score of 0.4320, reflecting the effectiveness of the mixed rotation approach. However, infiltration detection remained challenging, with F1-scores consistently at 0.0000 across all models, indicating the complexity of detecting diffuse pathological patterns. Pneumonia detection also had low F1-scores, with Model 4 achieving only 0.0980, suggesting a need for further optimization. In contrast, performance for atelectasis remained relatively stable, with Model 4 achieving the highest score (0.4120), demonstrating enhanced generalization without a significant drop in precision or recall. These findings indicate that while mixed augmentations improve overall performance, further targeted strategies are necessary to enhance detection for more challenging conditions such as infiltration and pneumonia.
The mAP@0.5 values across the four model configurations highlight the model’s ability to accurately localize and detect thoracic abnormalities at an Intersection over Union (IoU) threshold of 0.5. Model 3 (discrete rotations at (-5°, +5°)) demonstrated the highest overall mAP@0.5 value (0.2800), followed by Model 2 (discrete rotations at (-10°, +10°)) with 0.2520, as shown in Table 11. In contrast, Model 4 (mixed discrete (-5°,+5°) and discrete (-10°,+10°) rotations) showed a slight decrease (0.2150) compared to the baseline Model 1 (0.2020), suggesting that combining multiple rotations may introduce variability that impacts localization accuracy.
The mAP@0.5:0.95 values across the four model configurations indicate the model’s performance over a range of IoU thresholds from 0.5 to 0.95, providing a more robust evaluation of localization precision for varying overlap levels. As shown in Table 12, Model 2 (discrete rotations at (-10°, +10°)) achieved the highest overall mAP@0.5:0.95 (0.1510), surpassing Model 1 (0.1110) and performing better than the other models, particularly for classes with complex positional patterns.
The results of chest X-ray segmentation, enhanced by the NCT-CXR framework, are shown in Figure 6. Figure 6(a) presents the outcomes of single-label segmentation, while Figure 6(b) demonstrates multi-label segmentation. In Figure 6(a), the model’s effectiveness in single-label detection is highlighted, showcasing its ability to accurately identify and localize specific pathological conditions. The first image illustrates the segmentation of fibrosis regions, with confidence scores affirming the reliability of the detections. Similarly, the second image focuses on pneumonia, where a clear mask identifies the affected area with precision. The third image highlights the detection of nodules, with high confidence scores further validating the model’s accuracy in identifying these abnormalities.
Figure 6(b) illustrates the model’s performance in multi-label segmentation, where multiple pathological conditions are detected within the same image. The first image demonstrates the simultaneous segmentation of fibrosis and pneumonia, supported by confidence scores that validate the detection’s reliability. In the second image, the model effectively identifies both fibrosis and pneumothorax, showcasing its capacity to handle multiple abnormalities in a single chest X-ray. The third image highlights the detection of effusion and pneumothorax, with clear segmentation masks and confidence scores validating the model’s precision. These results demonstrate the NCT-CXR framework’s ability to accurately segment complex cases involving overlapping or co-occurring abnormalities, reinforcing its potential for clinical application in chest X-ray analysis.
4.4. Statistical Evaluation
The performance evaluation phase incorporates comprehensive statistical analyses to validate the significance of observed differences across model variations. Here, Kruskal-Wallis as Non-parametric statistical tests were employed to account for the potential non-normal distribution of performance metrics, the presence of outliers in the evaluation data and due to we are using relatively small sample.
The Kruskal-Wallis test was first conducted to determine whether statistically significant differences existed across the four model configurations: (1) the baseline model without augmentation, (2) the model with discrete rotations at (-10°, +10°), (3) the model with discrete rotations at (-5°, +5°), and (4) the mixed rotation model. This analysis was performed across all performance metrics (precision, recall, F1-score, mAP@0.5, and mAP@0.5:0.95) with a significance level of 0.05.
Following the significant Kruskal-Wallis result for precision as seen in Table 13, a Nemenyi post-hoc test was conducted to identify specific pairwise differences between models.
As seen in Table 14, the Nemenyi test revealed significant differences between: Model 2 (discrete rotations at (-10°, +10°)) and Model 4 (mixed rotation) (p = 0.005602). Then, Model 3 (discrete rotations at (-5°, +5°)) and Model 4 (mixed rotation) (p = 0.013806). Notably, while Model 1 (baseline) did not show statistically significant differences with other models, its comparison with Model 4 approached significance (p = 0.153177). Additionally, Model 2 and Model 3 demonstrated highly similar precision performance (p = 0.992827), suggesting that both moderate-angle rotation strategies (discrete rotations at (-5°, +5°) and discrete rotations at (-10°, +10°)) achieved comparable improvements in precision. These statistical findings provide strong evidence that the choice of rotation angle in the augmentation strategy significantly impacts the model’s precision in detecting pulmonary abnormalities, with moderate-angle rotations (Models 2 and 3) outperforming the mixed rotation approach (Model 4). The lack of significant differences in other metrics suggests that the augmentation strategies primarily influenced the model’s precision while maintaining consistent performance in other aspects of detection and segmentation.
5. Discussions
5.1. Key findings and interpretation
The results of this research offer several key insights into the role of augmentation strategies in enhancing semantic segmentation for chest X-ray analysis. The most significant finding is the substantial improvement in precision achieved through moderate-angle rotation augmentations (+5°,-5°, and +10°,-10°). This suggests that these specific geometric transformations are particularly effective in enhancing the model’s ability to accurately identify true pathological regions while simultaneously reducing the number of false positives. This improvement is especially noteworthy given the inherent challenges in medical image segmentation, where false positives can have significant clinical implications, potentially leading to unnecessary interventions, increased patient anxiety, and added healthcare costs.
The observed variation in model performance across different pathological conditions underscores the complex relationship between augmentation strategies and disease-specific features. The notably high precision achieved in pneumothorax detection (0.829 for Model 2) suggests that moderate-angle rotations are particularly beneficial for identifying conditions characterized by well-defined anatomical boundaries.
Pneumothorax, often presenting as a clear separation between the lung and the chest wall, is a prime example of such a condition. The rotation augmentations likely help the model learn to recognize the characteristic shape and location of pneumothorax despite slight variations in patient positioning. Conversely, the consistently lower performance in infiltration detection across all models indicates that certain pathological conditions, such as those with diffuse and less clearly defined features, may require more specialized augmentation approaches beyond simple geometric transformations.
Infiltration, characterized by hazy or cloud-like opacities in the lung parenchyma, presents a greater challenge for segmentation due to its often subtle and variable appearance. This disparity in performance across classes reinforces the notion that a one-size-fits-all approach to data augmentation is unlikely to be optimal for comprehensive chest X-ray analysis, and that tailored strategies are needed to address the specific challenges posed by different pathological conditions.
The statistical significance observed exclusively in precision metrics (p = 0.001927) provides valuable insights into the specific impact of our augmentation strategies. The fact that Model 2 (+10°,-10°) and Model 3 (+5°,-5°) significantly outperformed Model 4 (mixed rotations) in precision, while showing no significant differences in recall or mAP metrics, suggests that moderate-angle rotations primarily enhance the model’s specificity (ability to avoid false positives) rather than its sensitivity (ability to detect true positives).
iIn detailed matter, the Nemenyi post-hoc test revealed critical distinctions between augmentation strategies. Most notably, both moderate-angle rotation models - Model 2 (discrete rotations at (-10°, +10°)) and Model 3 (discrete rotations at (-5°, +5°)) - demonstrated significantly superior precision compared to the mixed rotation approach (Model 4), with p-values of 0.005602 and 0.013806 respectively. This finding suggests that controlled, single-angle rotations are more effective for maintaining anatomical accuracy in segmentation tasks compared to mixed rotation strategies. The strong similarity in performance between Models 2 and 3 (p = 0.992827) indicates that both moderate rotation angles are equally effective, providing flexibility in implementation choices.
This finding has important implications for clinical applications, where the optimal balance between sensitivity and specificity often depends on the specific clinical context and the relative costs of false positives versus false negatives. For example, in screening scenarios, high sensitivity might be prioritized to minimize the risk of missing a potentially life-threatening condition, even at the cost of a higher false positive rate. In contrast, in diagnostic settings, high specificity might be preferred to reduce the number of unnecessary follow-up procedures. The lack of significant differences in mAP scores across models suggests that the improvements in precision may come at a cost to overall detection performance, highlighting the need for careful consideration of metric trade-offs in model selection and the importance of optimizing for the most relevant clinical criteria.
Our findings suggest that carefully calibrated basic geometric transformations can achieve significant improvements in segmentation precision without introducing the computational complexity of more advanced augmentation techniques. The discrete rotation models (±5° and ±10°) consistently outperformed the mixed rotation approach, particularly for well-defined abnormalities like pneumothorax. This demonstrates that methodological precision in parameter calibration—derived from both systematic experimentation and expert radiologist consultation—can be more valuable than implementing inherently complex transformations. The NCT-CXR framework’s emphasis on coordinate transformation accuracy and anatomical validity preserves critical spatial relationships even with basic transformations, aligning with practical requirements of clinical workflows where computational efficiency, interpretability, and reliability are essential considerations for translating research into practice.
The observed variation in model performance across different pathological conditions warrants careful examination. While precision for pneumothorax detection reached 0.829 (Model 2) and 0.804 (Model 3), other conditions showed lower values, typically below 0.5. This apparent disparity reflects the intrinsic characteristics of different pulmonary abnormalities rather than a limitation of the augmentation approach itself. Pneumothorax presents with well-defined anatomical boundaries and distinct visual features (air-fluid level, pleural line displacement), making it particularly responsive to our coordinate transformation approach that preserves spatial relationships during augmentation. Conversely, pathologies with diffuse, amorphous patterns like infiltration, fibrosis, and certain presentations of pneumonia inherently present greater segmentation challenges due to their ill-defined boundaries, variable opacity, and frequent overlap with normal anatomical structures. This differential performance across pathologies is consistent with findings in previous studies (e.g., [8,9], suggesting that condition-specific segmentation strategies may be necessary for comprehensive chest X-ray analysis. Rather than viewing these results as a limitation, we interpret them as valuable clinical insights that can guide the development of specialized augmentation techniques tailored to specific pathological characteristics. Furthermore, in clinical contexts, the high precision achieved for pneumothorax is particularly significant given its status as a potentially life-threatening condition requiring rapid intervention, demonstrating our method’s utility for critical diagnostic tasks.
Although direct comparison with all state-of-the-art models was beyond the scope of this initial research, placing NCT-CXR in the context of recent advances is important for understanding its contributions. While models like CXR-Seg (using EfficientNet and Transformer Attention Modules) and HybridGNet (combining convolutional operations with graph generative models) have demonstrated impressive performance through architectural innovations, NCT-CXR approaches the challenge from a complementary data-centric perspective. Based on published benchmarks, these architectural approaches typically achieve precision values of 0.58-0.63 for pneumothorax detection on the NIH dataset (compared to our 0.829), though they may offer more balanced performance across different pathologies.
The key advantage of our approach lies in its orthogonality to architectural improvements - NCT-CXR’s coordinate transformation methodology could potentially be integrated with advanced architectures like CXR-Seg or HybridGNet, combining the strengths of both approaches. Our focus on precise data augmentation addresses a fundamental challenge in medical image analysis that architectural innovations alone cannot solve: the need for anatomically valid training examples that preserve spatial relationships critical for diagnosis. Furthermore, while transformer-based approaches typically require substantial computational resources for training and inference, our YOLOv8-based implementation with calibrated augmentation offers a more resource-efficient alternative while still achieving state-of-the-art results for specific high-priority conditions like pneumothorax.
The significant drop in precision observed in the mixed rotation model (Model 4) compared to discrete rotation models (Models 2 and 3) warrants detailed examination. This finding, confirmed by Nemenyi post-hoc analysis (p=0.005602 and p=0.013806), reveals important insights about augmentation strategy design. Several factors likely contribute to this performance disparity: First, the combination of multiple rotation angles introduces inconsistent geometric transformations that may disrupt the spatial coherence of anatomical structures. While single-angle rotations maintain consistent relationships between anatomical landmarks, mixed rotations can create conflicting transformations that introduce noise rather than meaningful variability. Second, the mixed rotation approach may cause overfitting to transformation artifacts rather than genuine pathological features, particularly for subtle abnormalities where small changes in orientation can obscure diagnostic characteristics. Third, the statistical analysis suggests that the mixed rotation strategy increases model sensitivity (higher recall) at the expense of precision, indicating a shift in the decision boundary that favors false positives. This demonstrates that increasing augmentation variety does not necessarily improve performance—rather, carefully calibrated transformations aligned with the underlying anatomical constraints of the imaging modality yield superior results. These findings highlight the importance of augmentation strategy design that considers the specific characteristics of the medical imaging domain rather than simply maximizing data variability.
From a technical perspective, our coordinate transformation approach for maintaining spatial accuracy during augmentation proves crucial for semantic segmentation tasks. The mathematical formulation ensuring precise annotation adaptation during geometric transformations addresses a critical challenge in medical image segmentation, where spatial accuracy directly impacts clinical utility. Accurate localization and delineation of pathological regions are essential for diagnosis, treatment planning, and disease monitoring.
The computational efficiency of NCT-CXR is particularly relevant for potential clinical deployment. Our implementation on a single NVIDIA GPU (DGX A100 40GB) achieves inference times of approximately 0.21 seconds per image for the semantic segmentation task, making it suitable for real-time clinical applications where rapid assessment is critical. The augmentation process itself is primarily a training-time consideration, with negligible impact on inference performance. The YOLOv8 architecture’s efficient design contributes significantly to this performance, requiring approximately 88.7 million FLOPs compared to heavier architectures like CXR-Seg (>200 million FLOPs).
For resource-constrained environments or edge deployment, NCT-CXR can be optimized through several strategies: model quantization can reduce memory requirements by 75% with minimal precision loss ( 1-2%), model pruning can decrease computational demands by 30-40%, and smaller input resolutions (640×640 instead of 800×800) can further reduce processing time by 35% while maintaining diagnostic accuracy for most pathologies. These optimizations make the framework viable for deployment on lower-power hardware like hospital workstations or even edge devices in resource-limited settings. Future work will explore knowledge distillation techniques to create even more compact models specifically calibrated for different computational environments while preserving performance on critical diagnostic tasks.
5.2. Ethical Considerations and Data Privacy
While this research utilized publicly available de-identified data, deployment in clinical settings raises important considerations regarding data privacy and regulatory compliance. The NCT-CXR framework is designed with privacy-preserving principles that align with regulations such as HIPAA and GDPR. Specifically, the coordinate transformation augmentation occurs entirely on-premises during model training, eliminating the need to share sensitive patient data with external services. For clinical implementation, we recommend a federated learning approach where models are trained locally within each institution’s secure infrastructure, preserving patient privacy while enabling continual model improvement.
Additionally, the framework supports differential privacy mechanisms during training, allowing controlled noise addition to prevent potential reconstruction of patient identities from model parameters. The segmentation outputs provide only the clinically relevant regions of interest without retaining or processing patient identifying information. To ensure regulatory compliance across jurisdictions, implementation guidelines should include: (1) data minimization protocols that process only essential diagnostic information, (2) appropriate anonymization of images before processing, (3) secure API implementations with encrypted data transmission, and (4) clear audit trails for all processing steps. These considerations, while beyond the scope of the current technical evaluation, represent critical components for responsible translation of this research into clinical practice.
5.3. Limitation of the study
While this research provides a compelling proof-of-concept for the application of the NCT-CXR framework in chest X-ray segmentation, several limitations must be acknowledged. These primarily relate to dataset characteristics, validation scope, and the breadth of pathological conditions addressed.
One of the main limitations is the use of a single dataset, namely the NIH Chest X-ray dataset. Although this dataset is widely utilized in medical imaging research, it suffers from a significant class imbalance. Certain thoracic conditions are considerably underrepresented, which presents a challenge for training models that generalize well across all categories. Although data augmentation strategies, including geometric transformations, were implemented to alleviate this imbalance, their effectiveness may be limited for very rare conditions. Augmenting existing data introduces synthetic variability, but it cannot fully replace the diversity found in real-world cases. As a result, the model may still struggle to generalize to the true variability of rare pathological patterns.
Furthermore, relying on a single dataset restricts the assessment of the model’s generalizability across different imaging environments and patient populations. Differences in equipment types, acquisition protocols, and demographic distributions across institutions may influence the performance of segmentation models. Although our augmentation strategy was designed to introduce controlled variability, it cannot fully replicate the complex heterogeneity observed in real clinical settings. Public datasets such as CheXpert from Stanford University, MIMIC CXR from MIT, and PadChest from the University of Alicante offer valuable opportunities for a more rigorous and diverse evaluation.
The absence of cross-dataset validation is therefore a notable limitation and will be addressed in future work. We hypothesize that the NCT CXR framework, which emphasizes the preservation of anatomical relationships during augmentation, may inherently support better generalization across domains. However, challenges remain due to domain shifts arising from differences in image acquisition settings, post-processing techniques, and annotation styles. Future research will include comprehensive validation protocols involving training on the NIH dataset and testing on external datasets without retraining, as well as implementing domain adaptation techniques to mitigate inter-dataset differences.
Finally, the current research focuses on detecting and segmenting nine thoracic abnormalities, including consolidation, effusion, fibrosis, pneumonia, pneumothorax, no finding, nodule, atelectasis, and infiltration. However, clinical guidelines recognize up to 18 abnormalities that can be observed on chest X-ray images. Several important conditions, such as cardiomegaly, calcification, cavity formation, hilar lymphadenopathy, bone fractures, pleural thickening, emphysema, and hernia, were not included in the current analysis. Expanding the scope of the model to detect all 18 abnormalities is an important next step. This expansion will require model adaptation to manage increased diagnostic complexity, including the use of more sophisticated architectures, larger and more heterogeneous datasets, and potentially advanced learning strategies such as curriculum learning or multi-task learning. Additionally, class imbalance will become more pronounced as rarer conditions are introduced, necessitating more robust augmentation and sampling techniques to ensure balanced model performance across all abnormalities.
6. Conclusions
This research introduces NCT-CXR, an improved and comprehensive framework designed to enhance semantic segmentation of pulmonary abnormalities in chest X-rays. NCT-CXR achieves this enhancement by strategically integrating data augmentation strategies, including an improved coordinate transformation technique, with the robust YOLOv8 architecture. The core innovation of NCT-CXR lies in its focus on preserving spatial accuracy during augmentation, a critical factor often overlooked in traditional augmentation methods but essential for clinically relevant segmentation. Our findings demonstrate that carefully calibrated geometric augmentation strategies, particularly moderate-angle rotations (±5° and ±10°), lead to statistically significant improvements in model precision for detecting pulmonary abnormalities.
These improvements, observed across four distinct model configurations and rigorously validated through Kruskal-Wallis and Nemenyi statistical testing, underscore the effectiveness of the proposed approach. Specifically, NCT-CXR exhibits notable performance gains in identifying abnormalities with well-defined anatomical boundaries, such as pneumothorax, which are often challenging to segment accurately. The systematic implementation of coordinate transformations during the augmentation process is crucial, as it ensures that the spatial relationships between pathological regions and anatomical landmarks are maintained. This preservation of spatial accuracy guarantees that the resulting segmentations are not only accurate but also clinically relevant and anatomically plausible, a critical requirement for clinical utility.
The demonstrated success of the NCT-CXR framework, particularly its impact on improving precision, has significant implications for enhancing the clinical utility of automated chest X-ray analysis systems. Accurate and reliable segmentation of pulmonary abnormalities is fundamental to a wide range of clinical tasks, including early and accurate diagnosis of pulmonary diseases, personalized treatment planning based on the extent and characteristics of abnormalities, and objective monitoring of disease progression or response to therapy. By improving the precision of automated segmentation, NCT-CXR has the potential to reduce the number of false positive detections, which in turn can minimize unnecessary follow-up procedures, reduce patient anxiety, and optimize healthcare resource allocation. However, while the promising results presented in this research demonstrate the potential of NCT-CXR and highlight its contributions to the field, they also underscore the persistent challenges inherent in medical image analysis and the ongoing need for continued research and development to translate these technological advances into routine clinical practice.
Future work should focus on several key areas to further enhance the NCT-CXR framework and broaden its clinical applicability. First, expanding the framework to incorporate larger and more diverse datasets, including multi-center data acquired using different imaging systems and protocols, is essential for improving the model’s generalizability and robustness to real-world variations. This will involve addressing the challenges of data harmonization and domain adaptation to ensure that the model can perform reliably across diverse datasets. Second, exploring more advanced synthetic data generation techniques, such as GANs, could help address the limitations of data scarcity and class imbalance, particularly for rare or under-represented pathologies.
GANs have the potential to generate realistic synthetic chest X-ray images, augmenting the training data and improving the model’s ability to learn from limited examples. Third, extensive clinical validation studies, involving radiologists and other healthcare professionals across multiple institutions, are crucial for rigorously establishing the real-world efficacy and clinical utility of the NCT-CXR framework. These studies should assess the performance of NCT-CXR in a realistic clinical setting, comparing its performance to that of expert radiologists and evaluating its impact on clinical decision-making. Finally, integrating NCT-CXR seamlessly into existing clinical workflows and electronic health record systems is essential for its widespread adoption and clinical impact.
As automated medical image analysis continues to advance, the NCT-CXR framework, with its emphasis on spatial accuracy, clinically relevant augmentations, and rigorous validation, has the potential to play a pivotal role in bridging the gap between technological innovation and clinical application. By providing healthcare professionals with reliable, clinically validated tools that support more accurate, efficient, and patient-centered care, NCT-CXR can contribute to improved patient outcomes and a more effective healthcare system.
Ethical Statement
This research complies with the ethical standards and policies of MDPI. The research involved analysis of the publicly available and anonymized NIH Chest X-ray dataset. No direct patient contact or animal experiments were performed. Therefore, institutional ethical approval and informed consent were not required. All authors confirm adherence to ethical principles regarding data use, privacy, and publication integrity.
Author Contributions
Conceptualization, A.S. and P.N.A.; methodology, A.S., P.N.A., and P.; software, A.S.; validation, A.S., P.N.A., M.A.S., and M.S.; formal analysis, A.S., F.A., and I.N.D.; investigation, A.S., P., M.A.S., M.S., and S.; resources, E.A.P., D.R., B.S., D.S., and S.; data curation, M.S., F.A., E.A.P., D.R., B.S., and D.S.; writing—original draft preparation, A.S., I.N.D., and F.A.; writing—review and editing, P.N.A., I.N.D., F.C.G., and E.S.; visualization, A.S.; supervision, P.N.A., E.A.P., and A.G.S.; project administration, A.S. and P.N.A.; funding acquisition, F.C.G. and E.S.
Funding
This research was supported by the OncoDoc AI Research Laboratory and Dinus Research Group for AI in Medical Science (DREAMS), Universitas Dian Nuswantoro. No external funding was received.
Institutional Review Board Statement
Ethical review and approval were waived for this research due to the use of publicly available and fully anonymized data from the NIH Chest X-ray dataset. The research did not involve any human participants or animal experiments.
Informed Consent Statement
Not applicable. The research did not involve human subjects directly.
Data Availability Statement
The NIH Chest X-ray dataset used in this research is publicly available at https://nihcc.app.box.com/v/ChestXray-NIHCC.
Acknowledgments
The authors extend their gratitude to their colleagues from the Research Center for Intelligent Distributed Surveillance and Security, particularly those specializing in Dinus Research Group for AI in Medical Science (DREAMS). They also wish to thank the OncoDoc AI Research Team and Laboratory for their valuable insights and contributions, which significantly supported the progress of this research.”
Conflicts of Interest
The authors declare that they have no known competing financial interests or personal relationships that could have appeared to influence the work reported in this manuscript. All authors have individually reviewed and disclosed any potential financial or personal relationships relevant to this research. The funders had no role in the design of the research; in the collection, analyses, or interpretation of data; in the writing of the manuscript; or in the decision to publish the results.
References
- Wuni, A.R.; Botwe, B.; Akudjedu, T. Impact of artificial intelligence on clinical radiography practice: Futuristic prospects in a low resource setting. Radiography 2021, 27, S69–S73. [Google Scholar] [CrossRef] [PubMed]
- Cha, D.; Pae, C.; Lee, S.A.; Na, G.; Hur, Y.K.; Lee, H.Y.; Cho, A.R.; Cho, Y.J.; Han, S.G.; Kim, S.H.; et al. Differential Biases and Variabilities of Deep Learning–Based Artificial Intelligence and Human Experts in Clinical Diagnosis: Retrospective Cohort and Survey Study. JMIR Medical Informatics 2021, 9, e33049. [Google Scholar] [CrossRef] [PubMed]
- Ghosh, H.; P, P.K.; Rahat, I.S.; Hasan Nipu, M.M.; Rama Krishna, G.; Ravindra, J.V.R. Exploring Deep Learning Models for Accurate Alzheimer’s Disease Classification based on MRI Imaging. EAI Endorsed Transactions on Pervasive Health and Technology 2024, 10. [Google Scholar] [CrossRef]
- Arshad, Q.u.A.; Khan, W.Z.; Azam, F.; Khan, M.K. Deep-Learning-Based COVID-19 Detection: Challenges and Future Directions. IEEE Transactions on Artificial Intelligence 2023, 4, 210–228. [Google Scholar] [CrossRef]
- Patel, M.; Das, A.; Pant, V.K.; M, J. Detection of Tuberculosis in Radiographs using Deep Learning-based Ensemble Methods. In Proceedings of the 2021 Smart Technologies, Communication and Robotics (STCR), Sathyamangalam, India; 2021; pp. 1–7. [Google Scholar] [CrossRef]
- Mamalakis, M.; Swift, A.J.; Vorselaars, B.; Ray, S.; Weeks, S.; Ding, W.; Clayton, R.H.; Mackenzie, L.S.; Banerjee, A. DenResCov-19: A deep transfer learning network for robust automatic classification of COVID-19, pneumonia, and tuberculosis from X-rays. Computerized Medical Imaging and Graphics 2021, 94, 102008. [Google Scholar] [CrossRef]
- Singh, D.; Somani, A.; Horsch, A.; Prasad, D.K. Counterfactual Explainable Gastrointestinal and Colonoscopy Image Segmentation. In Proceedings of the 2022 IEEE 19th International Symposium on Biomedical Imaging (ISBI), Kolkata, India; 2022; pp. 1–5. [Google Scholar] [CrossRef]
- Abedalla, A.; Abdullah, M.; Al-Ayyoub, M.; Benkhelifa, E. Chest X-ray pneumothorax segmentation using U-Net with EfficientNet and ResNet architectures. PeerJ Computer Science 2021, 7, e607. [Google Scholar] [CrossRef]
- Zou, L.; Goh, H.L.; Liew, C.J.Y.; Quah, J.L.; Gu, G.T.; Chew, J.J.; Kumar, M.P.; Ang, C.G.L.; Ta, A.W.A. Ensemble Image Explainable AI (XAI) Algorithm for Severe Community-Acquired Pneumonia and COVID-19 Respiratory Infections. IEEE Transactions on Artificial Intelligence 2023, 4, 242–254. [Google Scholar] [CrossRef]
- Kumarasinghe, H.; Kolonne, S.; Fernando, C.; Meedeniya, D. U-Net Based Chest X-ray Segmentation with Ensemble Classification for Covid-19 and Pneumonia. International Journal of Online and Biomedical Engineering (iJOE) 2022, 18, 161–175. [Google Scholar] [CrossRef]
- Arora, R.; Saini, I.; Sood, N. Multi-label segmentation and detection of COVID-19 abnormalities from chest radiographs using deep learning. Optik 2021, 246, 167780. [Google Scholar] [CrossRef]
- Wang, X.; Peng, Y.; Lu, L.; Lu, Z.; Bagheri, M.; Summers, R.M. ChestX-Ray8: Hospital-Scale Chest X-Ray Database and Benchmarks on Weakly-Supervised Classification and Localization of Common Thorax Diseases. In Proceedings of the 2017 IEEE Conference on Computer Vision and Pattern Recognition (CVPR), Honolulu, HI; 2017; pp. 3462–3471. [Google Scholar] [CrossRef]
- Çallı, E.; Sogancioglu, E.; Van Ginneken, B.; Van Leeuwen, K.G.; Murphy, K. Deep learning for chest X-ray analysis: A survey. Medical Image Analysis 2021, 72, 102125. [Google Scholar] [CrossRef]
- Wang, H.; Yang, Y.Y.; Pan, Y.; Han, P.; Li, Z.X.; Huang, H.G.; Zhu, S.Z. Detecting thoracic diseases via representation learning with adaptive sampling. Neurocomputing 2020, 406, 354–360. [Google Scholar] [CrossRef]
- Albahli, S.; Rauf, H.T.; Algosaibi, A.; Balas, V.E. AI-driven deep CNN approach for multi-label pathology classification using chest X-Rays. PeerJ. Computer Science 2021, 7, e495. [Google Scholar] [CrossRef]
- Wang, H.; Xia, Y. ChestNet: A Deep Neural Network for Classification of Thoracic Diseases on Chest Radiography, 2018. [CrossRef]
- Yao, L.; Prosky, J.; Poblenz, E.; Covington, B.; Lyman, K. Weakly Supervised Medical Diagnosis and Localization from Multiple Resolutions, 2018. [CrossRef]
- Pati, S.; Verma, R.; Akbari, H.; Bilello, M.; Hill, V.B.; Sako, C.; Correa, R.; Beig, N.; Venet, L.; Thakur, S.; et al. Reproducibility analysis of multi-institutional paired expert annotations and radiomic features of the Ivy Glioblastoma Atlas Project (Ivy GAP) dataset. Medical Physics 2020, 47, 6039–6052. [Google Scholar] [CrossRef]
- Zhang, Y.; Wei, Y.; Wu, Q.; Zhao, P.; Niu, S.; Huang, J.; Tan, M. Collaborative Unsupervised Domain Adaptation for Medical Image Diagnosis. IEEE Transactions on Image Processing 2020, 29, 7834–7844. [Google Scholar] [CrossRef]
- Yao, Q.; Zhuang, D.; Feng, Y.; Wang, Y.; Liu, J. Accurate Detection of Brain Tumor Lesions From Medical Images Based on Improved YOLOv8 Algorithm. IEEE Access 2024, 12, 144260–144279. [Google Scholar] [CrossRef]
- Ragab, M.G.; Abdulkadir, S.J.; Muneer, A.; Alqushaibi, A.; Sumiea, E.H.; Qureshi, R.; Al-Selwi, S.M.; Alhussian, H. A Comprehensive Systematic Review of YOLO for Medical Object Detection (2018 to 2023). IEEE Access 2024, 12, 57815–57836. [Google Scholar] [CrossRef]
- Yan, J.; Zeng, Y.; Lin, J.; Pei, Z.; Fan, J.; Fang, C.; Cai, Y. Enhanced object detection in pediatric bronchoscopy images using YOLO-based algorithms with CBAM attention mechanism. Heliyon 2024, 10, e32678. [Google Scholar] [CrossRef]
- Zhou, Y.; Guo, J.; Yao, H.; Zhao, J.; Li, X.; Qin, J.; Liu, S. A Dynamic Multi-Output Convolutional Neural Network for Skin Lesion Classification. International Journal of Imaging Systems and Technology 2024, 34, e23164. [Google Scholar] [CrossRef]
- Adhikari, R.; Pokharel, S. Performance Evaluation of Convolutional Neural Network Using Synthetic Medical Data Augmentation Generated by GAN. International Journal of Image and Graphics 2023, 23, 2350002. [Google Scholar] [CrossRef]
- Waheed, A.; Goyal, M.; Gupta, D.; Khanna, A.; Al-Turjman, F.; Pinheiro, P.R. CovidGAN: Data Augmentation Using Auxiliary Classifier GAN for Improved Covid-19 Detection. IEEE Access 2020, 8, 91916–91923. [Google Scholar] [CrossRef]
- Kulkarni, R.V.; Paldewar, A.; Paliwal, S.; Ajinath, P.A.; Panchal, S. Addressing Class Imbalance for Improved Pneumonia Diagnosis: Comparative Analysis of GANs and Weighted Loss Function in Classification of the Chest X-Ray Images. In Proceedings of the 2024 5th International Conference for Emerging Technology (INCET), Belgaum, India; 2024; pp. 1–7. [Google Scholar] [CrossRef]
- Lee, H.M.; Kim, Y.J.; Kim, K.G. Segmentation Performance Comparison Considering Regional Characteristics in Chest X-ray Using Deep Learning. Sensors 2022, 22, 3143. [Google Scholar] [CrossRef] [PubMed]
- Heenaye-Mamode Khan, M.; Gooda Sahib-Kaudeer, N.; Dayalen, M.; Mahomedaly, F.; Sinha, G.R.; Nagwanshi, K.K.; Taylor, A. Multi-Class Skin Problem Classification Using Deep Generative Adversarial Network (DGAN). Computational Intelligence and Neuroscience 2022, 2022, 1–13. [Google Scholar] [CrossRef]
- Wu, T.; Tang, S.; Zhang, R.; Cao, J.; Li, J. Tree-Structured Kronecker Convolutional Network for Semantic Segmentation. In Proceedings of the 2019 IEEE International Conference on Multimedia and Expo (ICME), Shanghai, China; 2019; pp. 940–945. [Google Scholar] [CrossRef]
- Yang, G.; Qi, J.; Sun, X. Robust medical image classification with curvature regularization on the PATHMNIST. In Proceedings of the Fourth International Conference on Computer Graphics, Chengdu, China; Kolivand, H., Moshayedi, A.J., Eds.; p. 1. [CrossRef]
- Rao, D.; Singh, R.; Kamath, S.K.; Pendekanti, S.K.; Pai, D.; Kolekar, S.V.; Holla, M.R.; Pathan, S. OTONet: Deep Neural Network for Precise Otoscopy Image Classification. IEEE Access 2024, 12, 7734–7746. [Google Scholar] [CrossRef]
- Ronneberger, O.; Fischer, P.; Brox, T. U-Net: Convolutional Networks for Biomedical Image Segmentation, 2015. [CrossRef]
- Liu, Y.; Xing, W.; Zhao, M.; Lin, M. A new classification method for diagnosing COVID-19 pneumonia based on joint CNN features of chest X-ray images and parallel pyramid MLP-mixer module. Neural Computing and Applications 2023, 35, 17187–17199. [Google Scholar] [CrossRef] [PubMed]
- Hertel, R.; Benlamri, R. A deep learning segmentation-classification pipeline for X-ray-based COVID-19 diagnosis. Biomedical Engineering Advances 2022, 3, 100041. [Google Scholar] [CrossRef] [PubMed]
- Müller, D.; Soto-Rey, I.; Kramer, F. Robust chest CT image segmentation of COVID-19 lung infection based on limited data. Informatics in Medicine Unlocked 2021, 25, 100681. [Google Scholar] [CrossRef]
- Han, C.; Rundo, L.; Araki, R.; Nagano, Y.; Furukawa, Y.; Mauri, G.; Nakayama, H.; Hayashi, H. Combining Noise-to-Image and Image-to-Image GANs: Brain MR Image Augmentation for Tumor Detection. IEEE Access 2019, 7, 156966–156977. [Google Scholar] [CrossRef]
- Atta-ur-Rahman, *!!! REPLACE !!!*; Sultan, K.; Naseer, I.; Majeed, R.; Musleh, D.; Abdul Salam Gollapalli, M.; Chabani, S.; Ibrahim, N.; Yamin Siddiqui, S.; Adnan Khan, M. Supervised Machine Learning-Based Prediction of COVID-19. Computers, Materials & Continua 2021, 69, 21–34. [Google Scholar] [CrossRef]
- Goyal, S.; Singh, R. Detection and classification of lung diseases for pneumonia and Covid-19 using machine and deep learning techniques. Journal of Ambient Intelligence and Humanized Computing 2023, 14, 3239–3259. [Google Scholar] [CrossRef]
- Ali, M.; Ali, R.; Hussain, N. Improved Medical Image Classification Accuracy on Heterogeneous and Imbalanced Data using Multiple Streams Network. International Journal of Advanced Computer Science and Applications 2021, 12. [Google Scholar] [CrossRef]
- Zhao, A.; Balakrishnan, G.; Durand, F.; Guttag, J.V.; Dalca, A.V. Data Augmentation Using Learned Transformations for One-Shot Medical Image Segmentation. In Proceedings of the 2019 IEEE/CVF Conference on Computer Vision and Pattern Recognition (CVPR), Long Beach, CA, USA; 2019; pp. 8535–8545. [Google Scholar] [CrossRef]
- Bravin, R.; Nanni, L.; Loreggia, A.; Brahnam, S.; Paci, M. Varied Image Data Augmentation Methods for Building Ensemble. IEEE Access 2023, 11, 8810–8823. [Google Scholar] [CrossRef]
- Cirillo, M.D.; Abramian, D.; Eklund, A. What is The Best Data Augmentation For 3D Brain Tumor Segmentation? In Proceedings of the 2021 IEEE International Conference on Image Processing (ICIP), Anchorage, AK, USA; 2021; pp. 36–40. [Google Scholar] [CrossRef]
- Yu, S.N.; Chiu, M.C.; Chang, Y.P.; Liang, C.Y.; Chen, W. Improving Computer-Aided Thoracic Disease Diagnosis through Comparative Analysis Using Chest X-ray Images Taken at Different Times. Sensors 2024, 24, 1478. [Google Scholar] [CrossRef] [PubMed]
- Horry, M.J.; Chakraborty, S.; Pradhan, B.; Paul, M.; Zhu, J.; Barua, P.D.; Mir, H.S.; Chen, F.; Zhou, J.; Acharya, U.R. Full-Resolution Lung Nodule Localization From Chest X-Ray Images Using Residual Encoder-Decoder Networks. IEEE Access 2023, 11, 143016–143036. [Google Scholar] [CrossRef]
Figure 1.
NCT-CXR model scenario
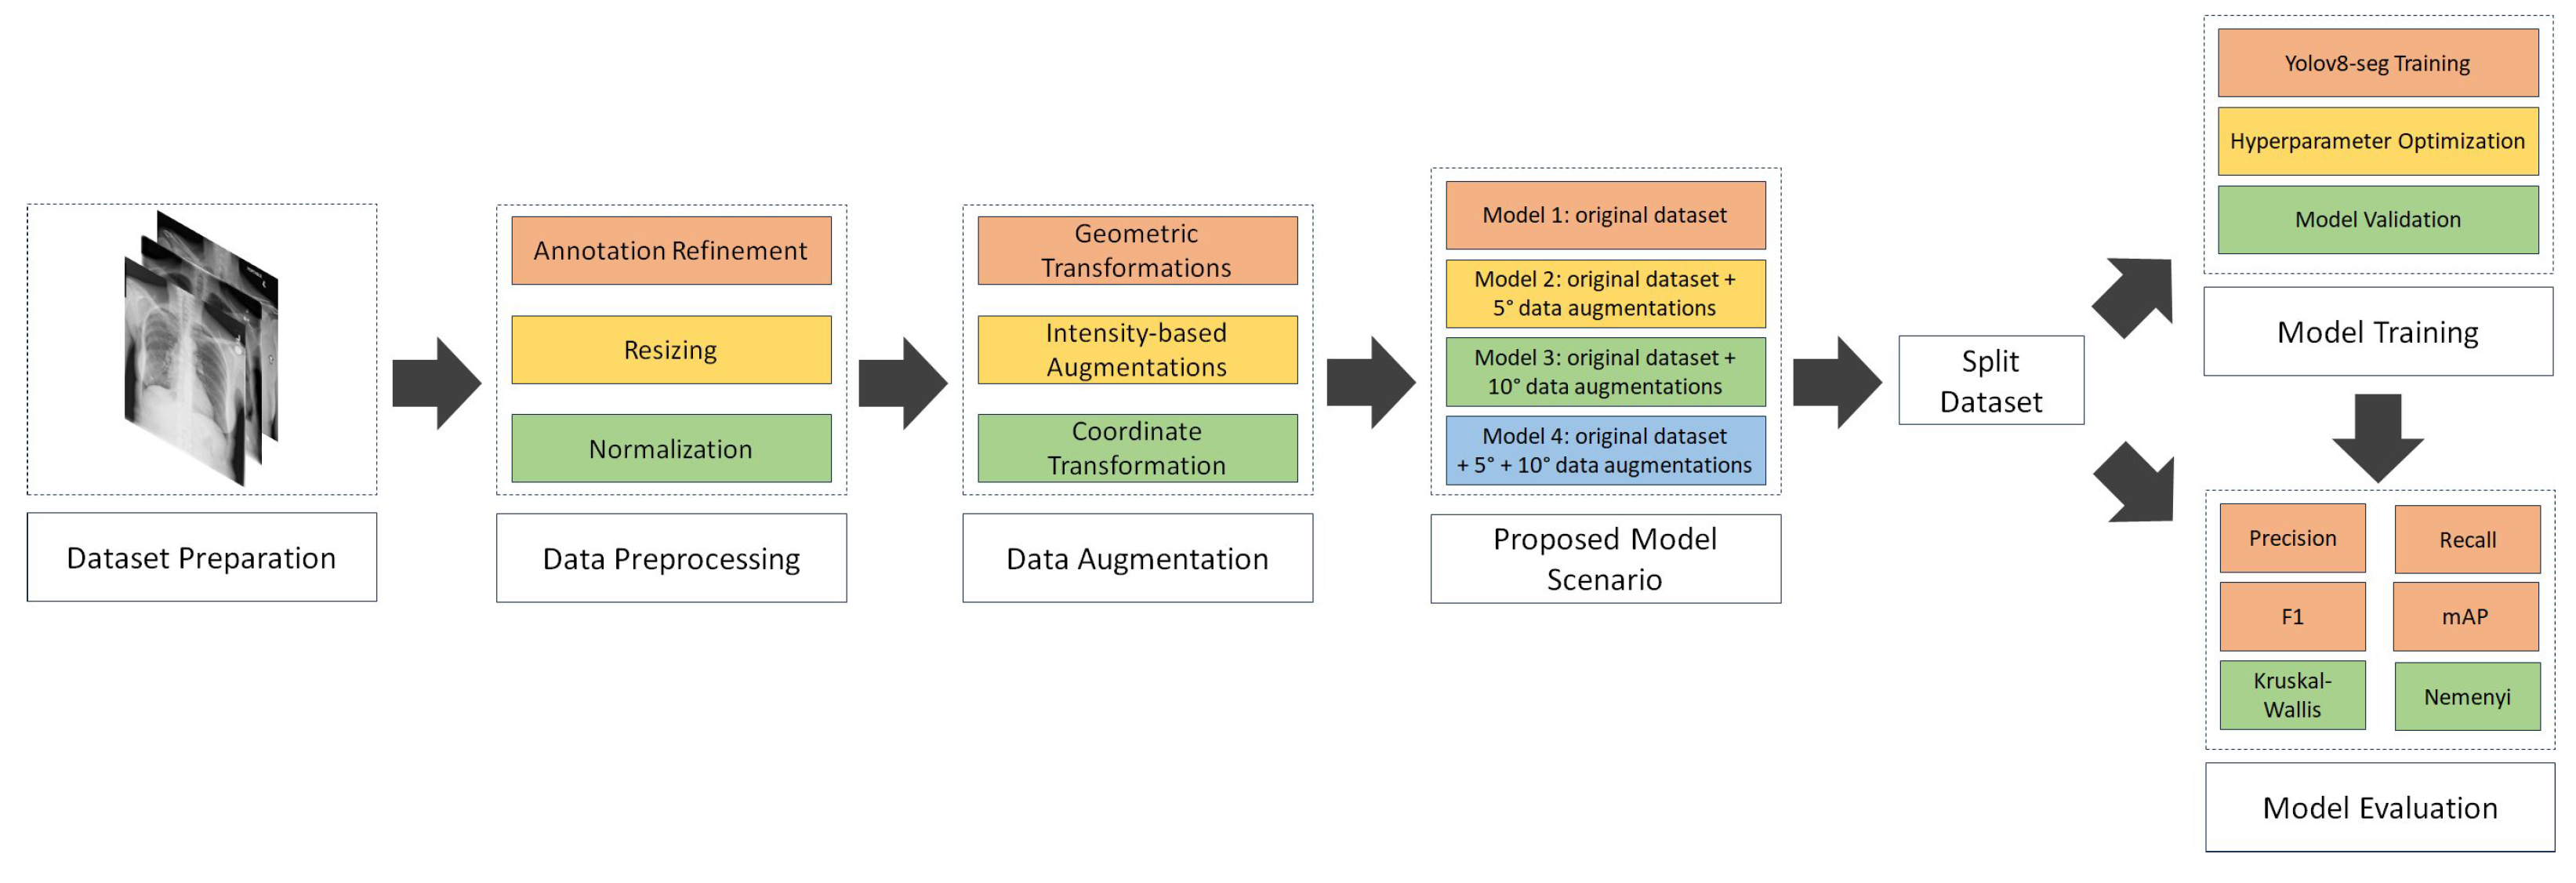
Figure 2.
OncoDocAI interface for multi-label segmentation correction and annotation refinement
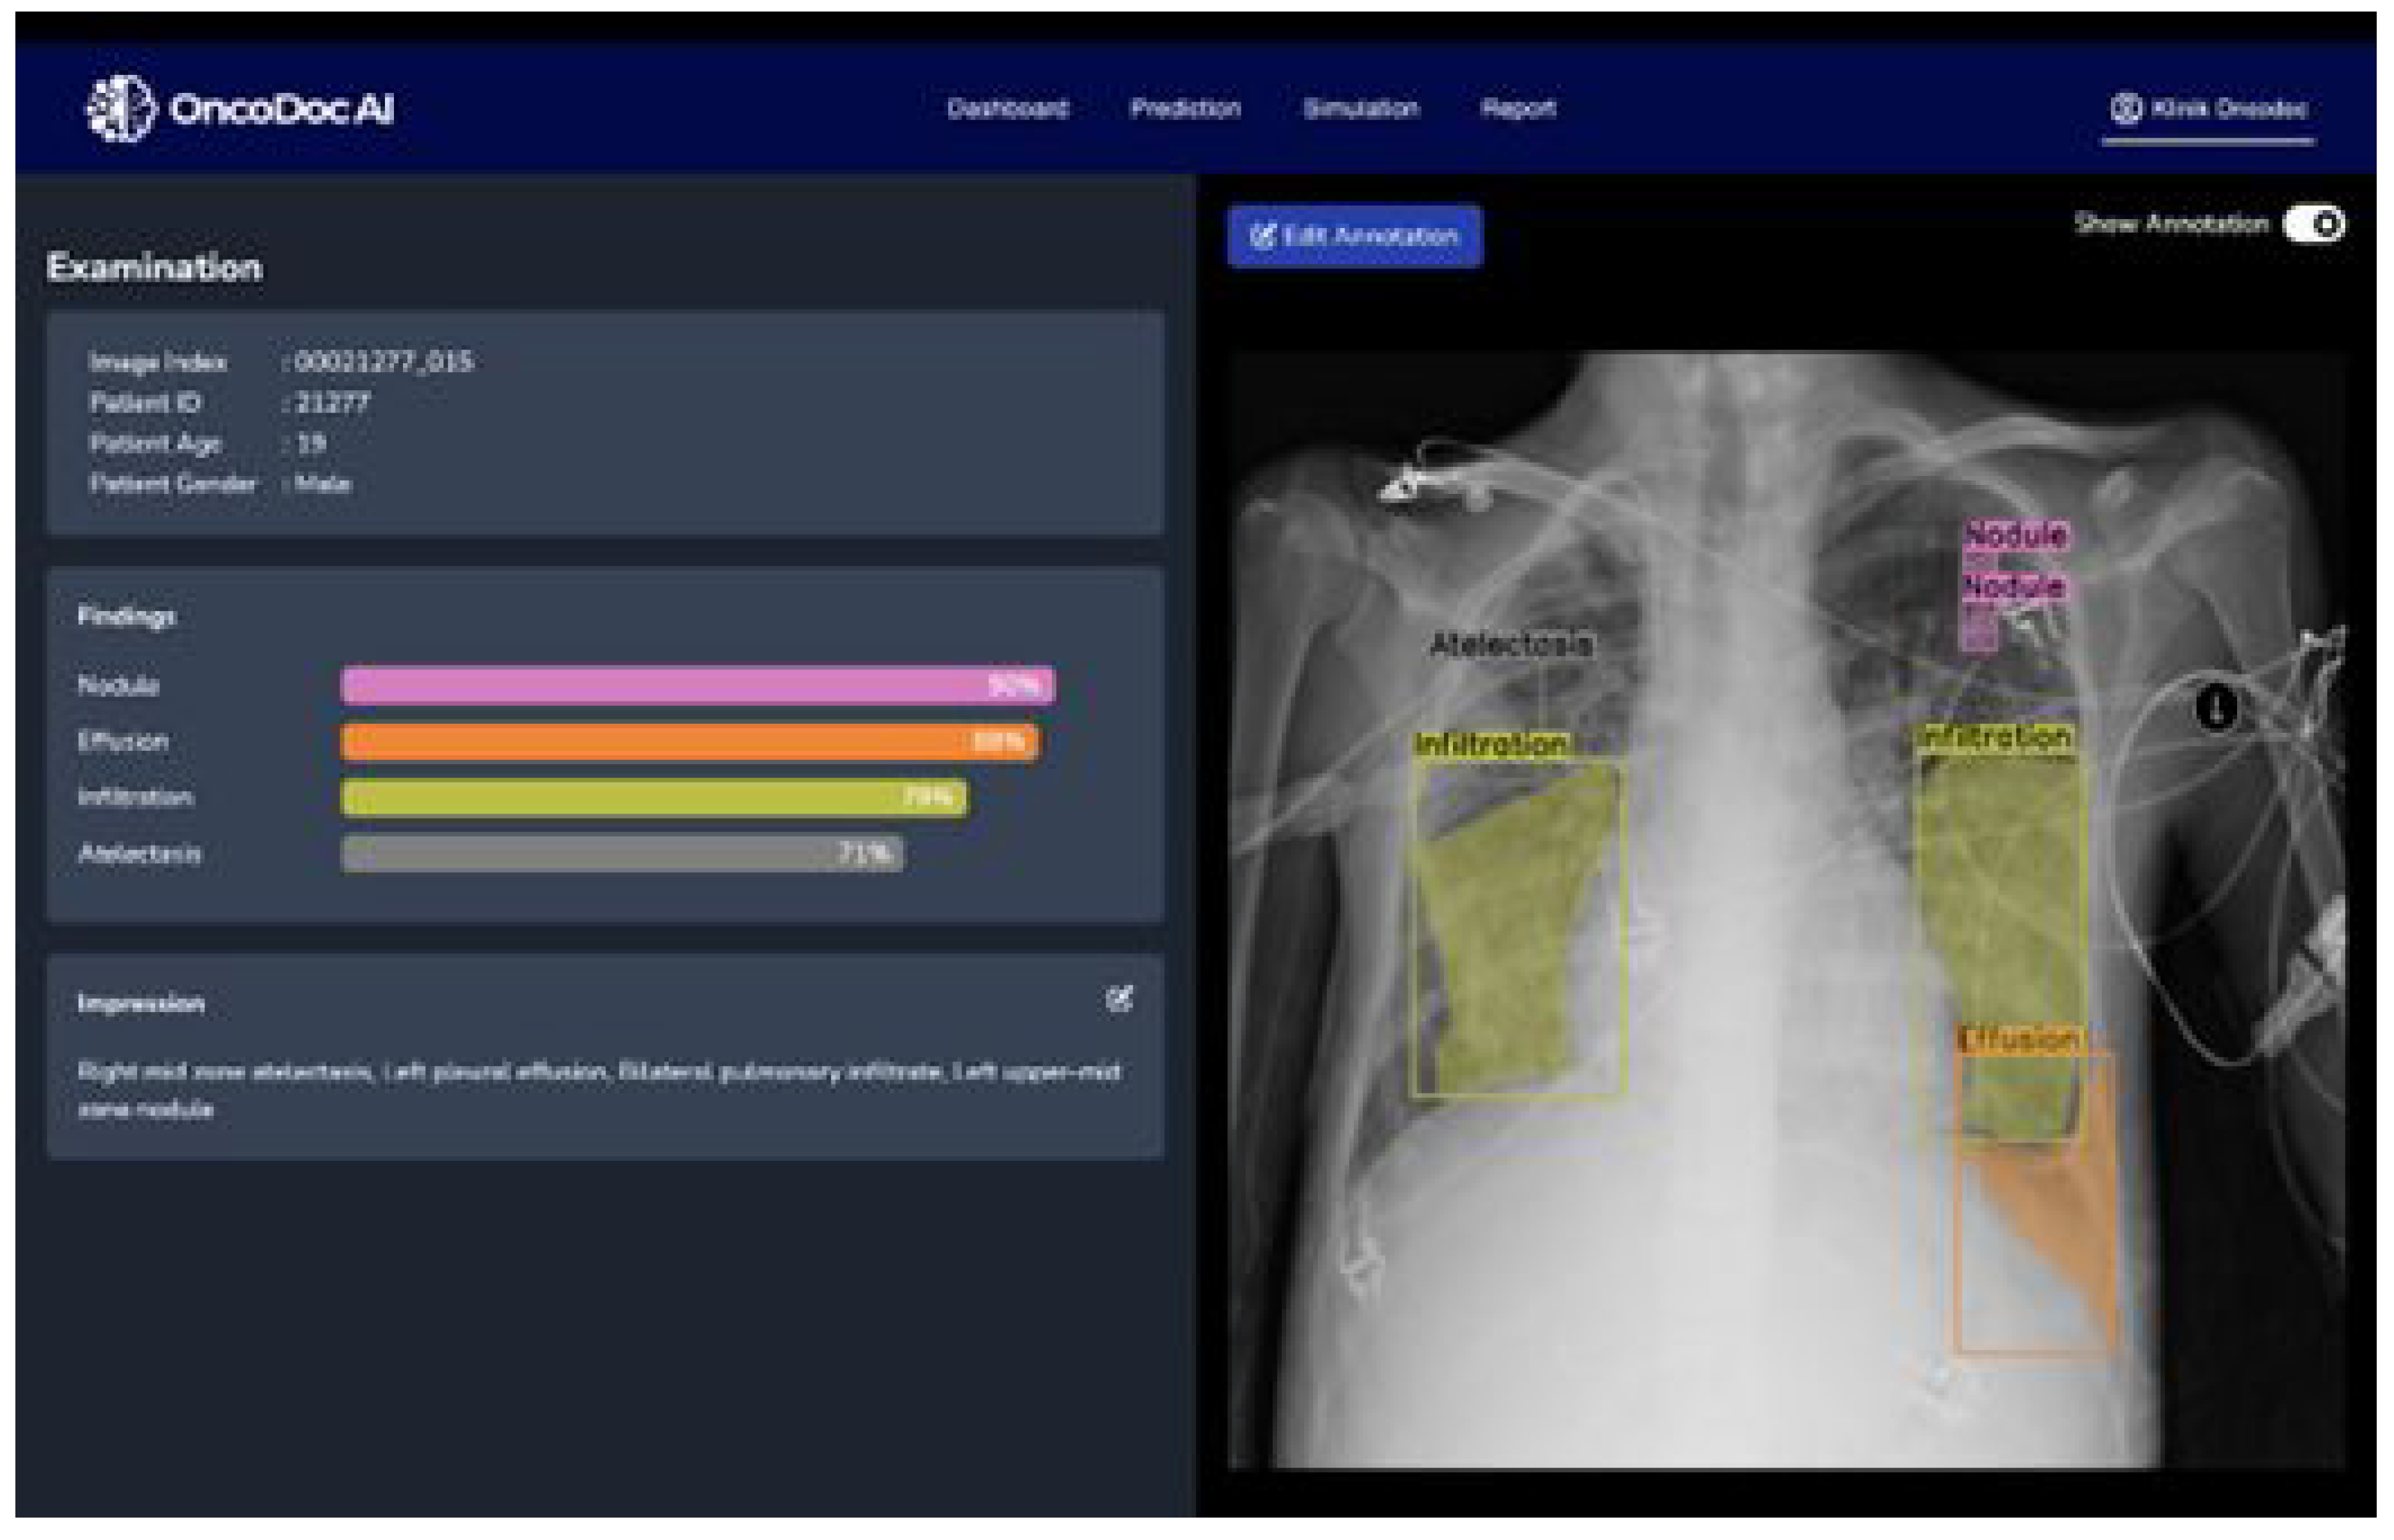
Figure 3.
Comparison of original and discrete rotations at (-10°, +10°) augmented chest X-ray images
Figure 3.
Comparison of original and discrete rotations at (-10°, +10°) augmented chest X-ray images
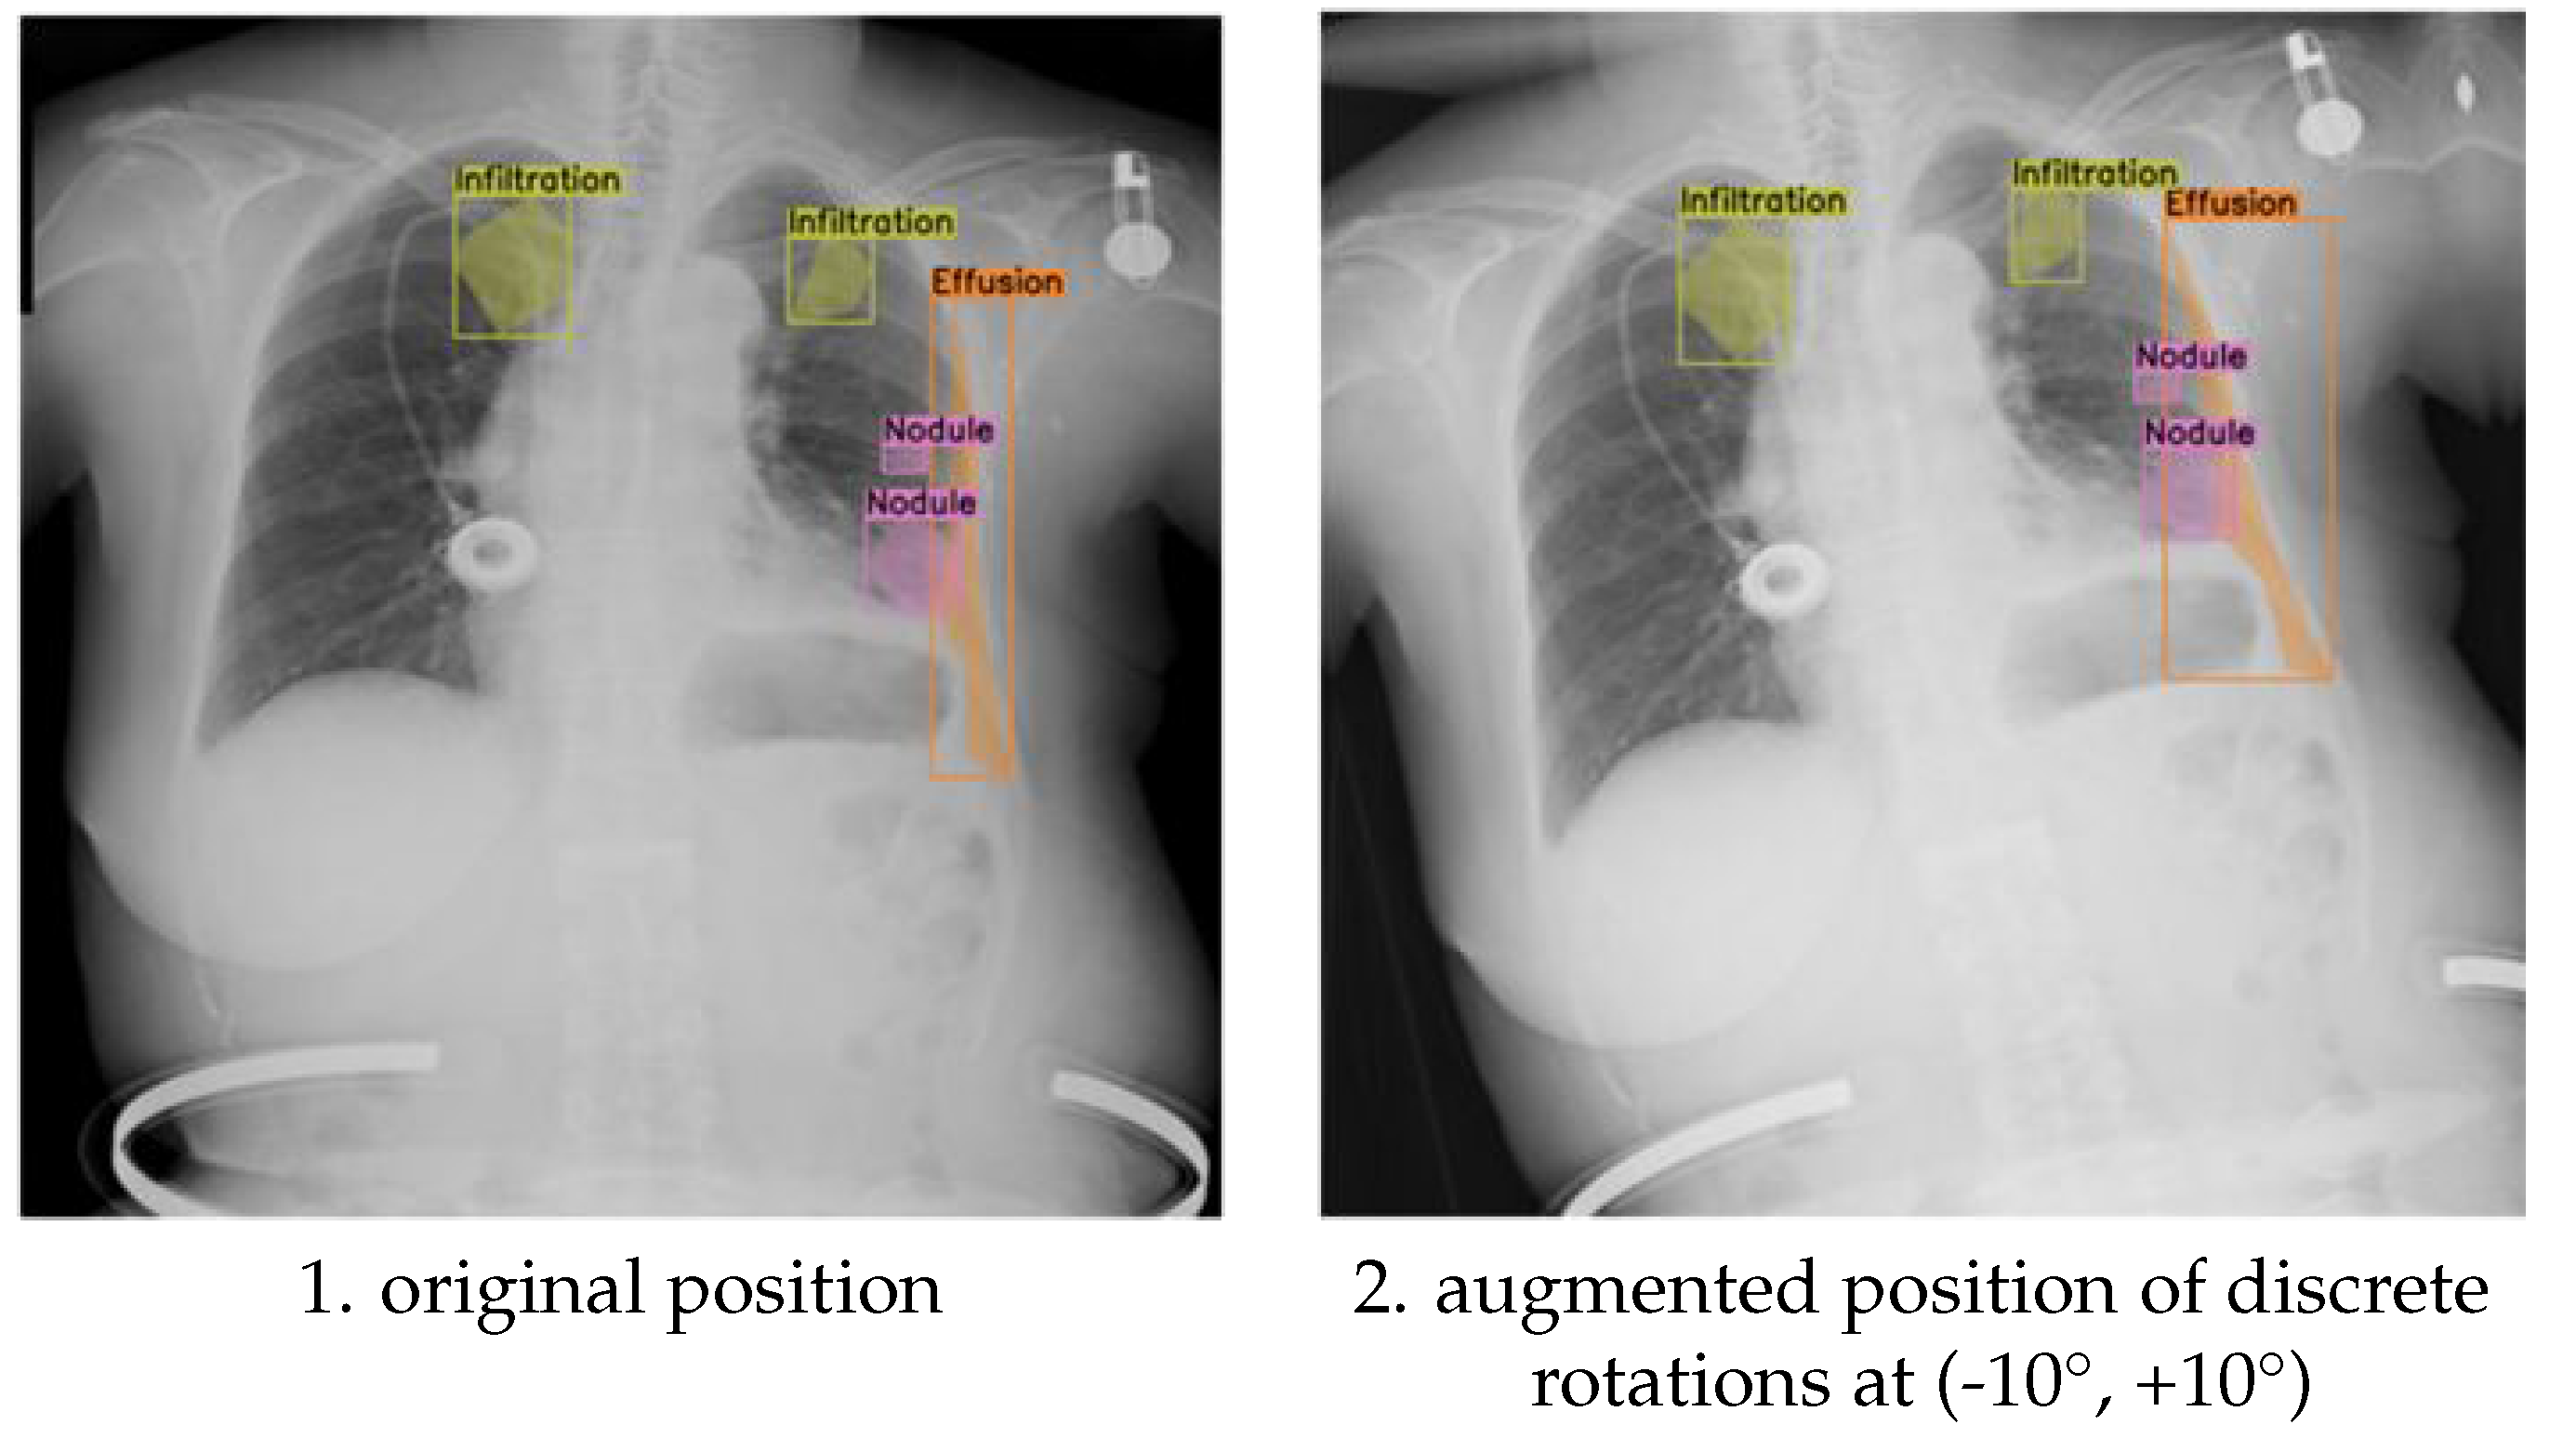
Figure 4.
Comparison of original and discrete rotations at (-5°, +5°) rotation augmented chest X-ray images
Figure 4.
Comparison of original and discrete rotations at (-5°, +5°) rotation augmented chest X-ray images
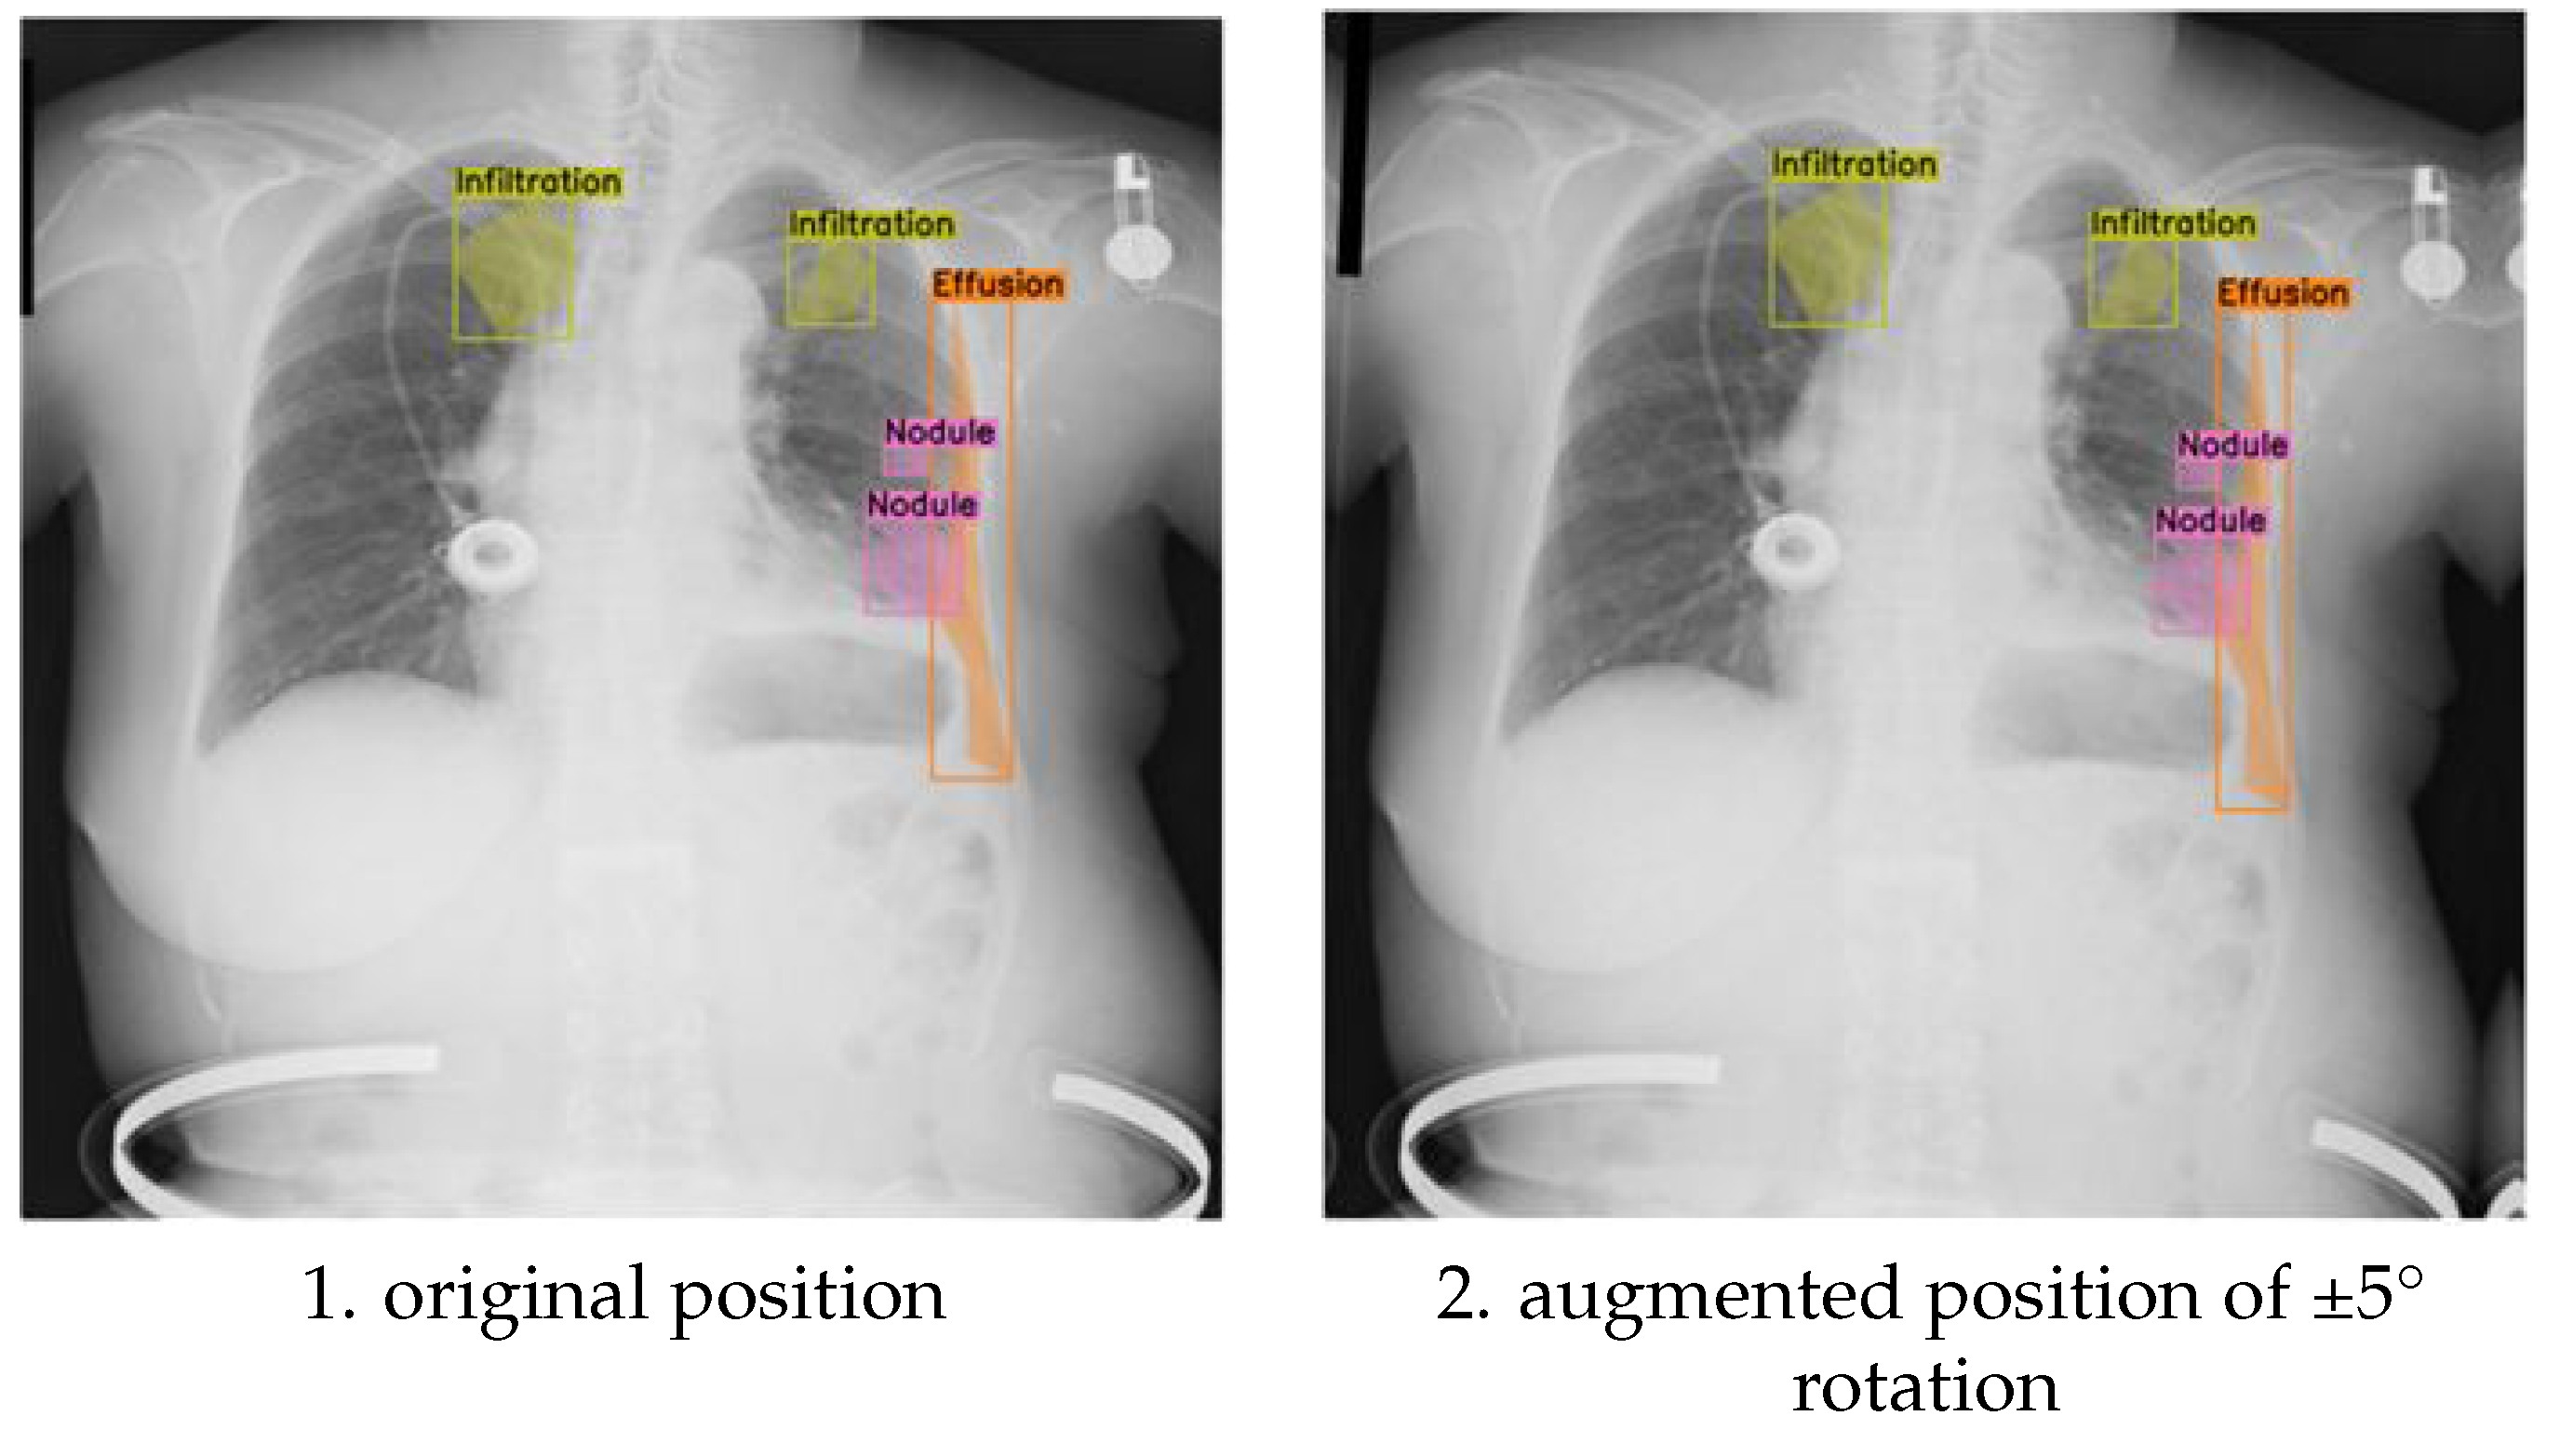
Figure 5.
Comparison of evaluation metrics for different model configurations
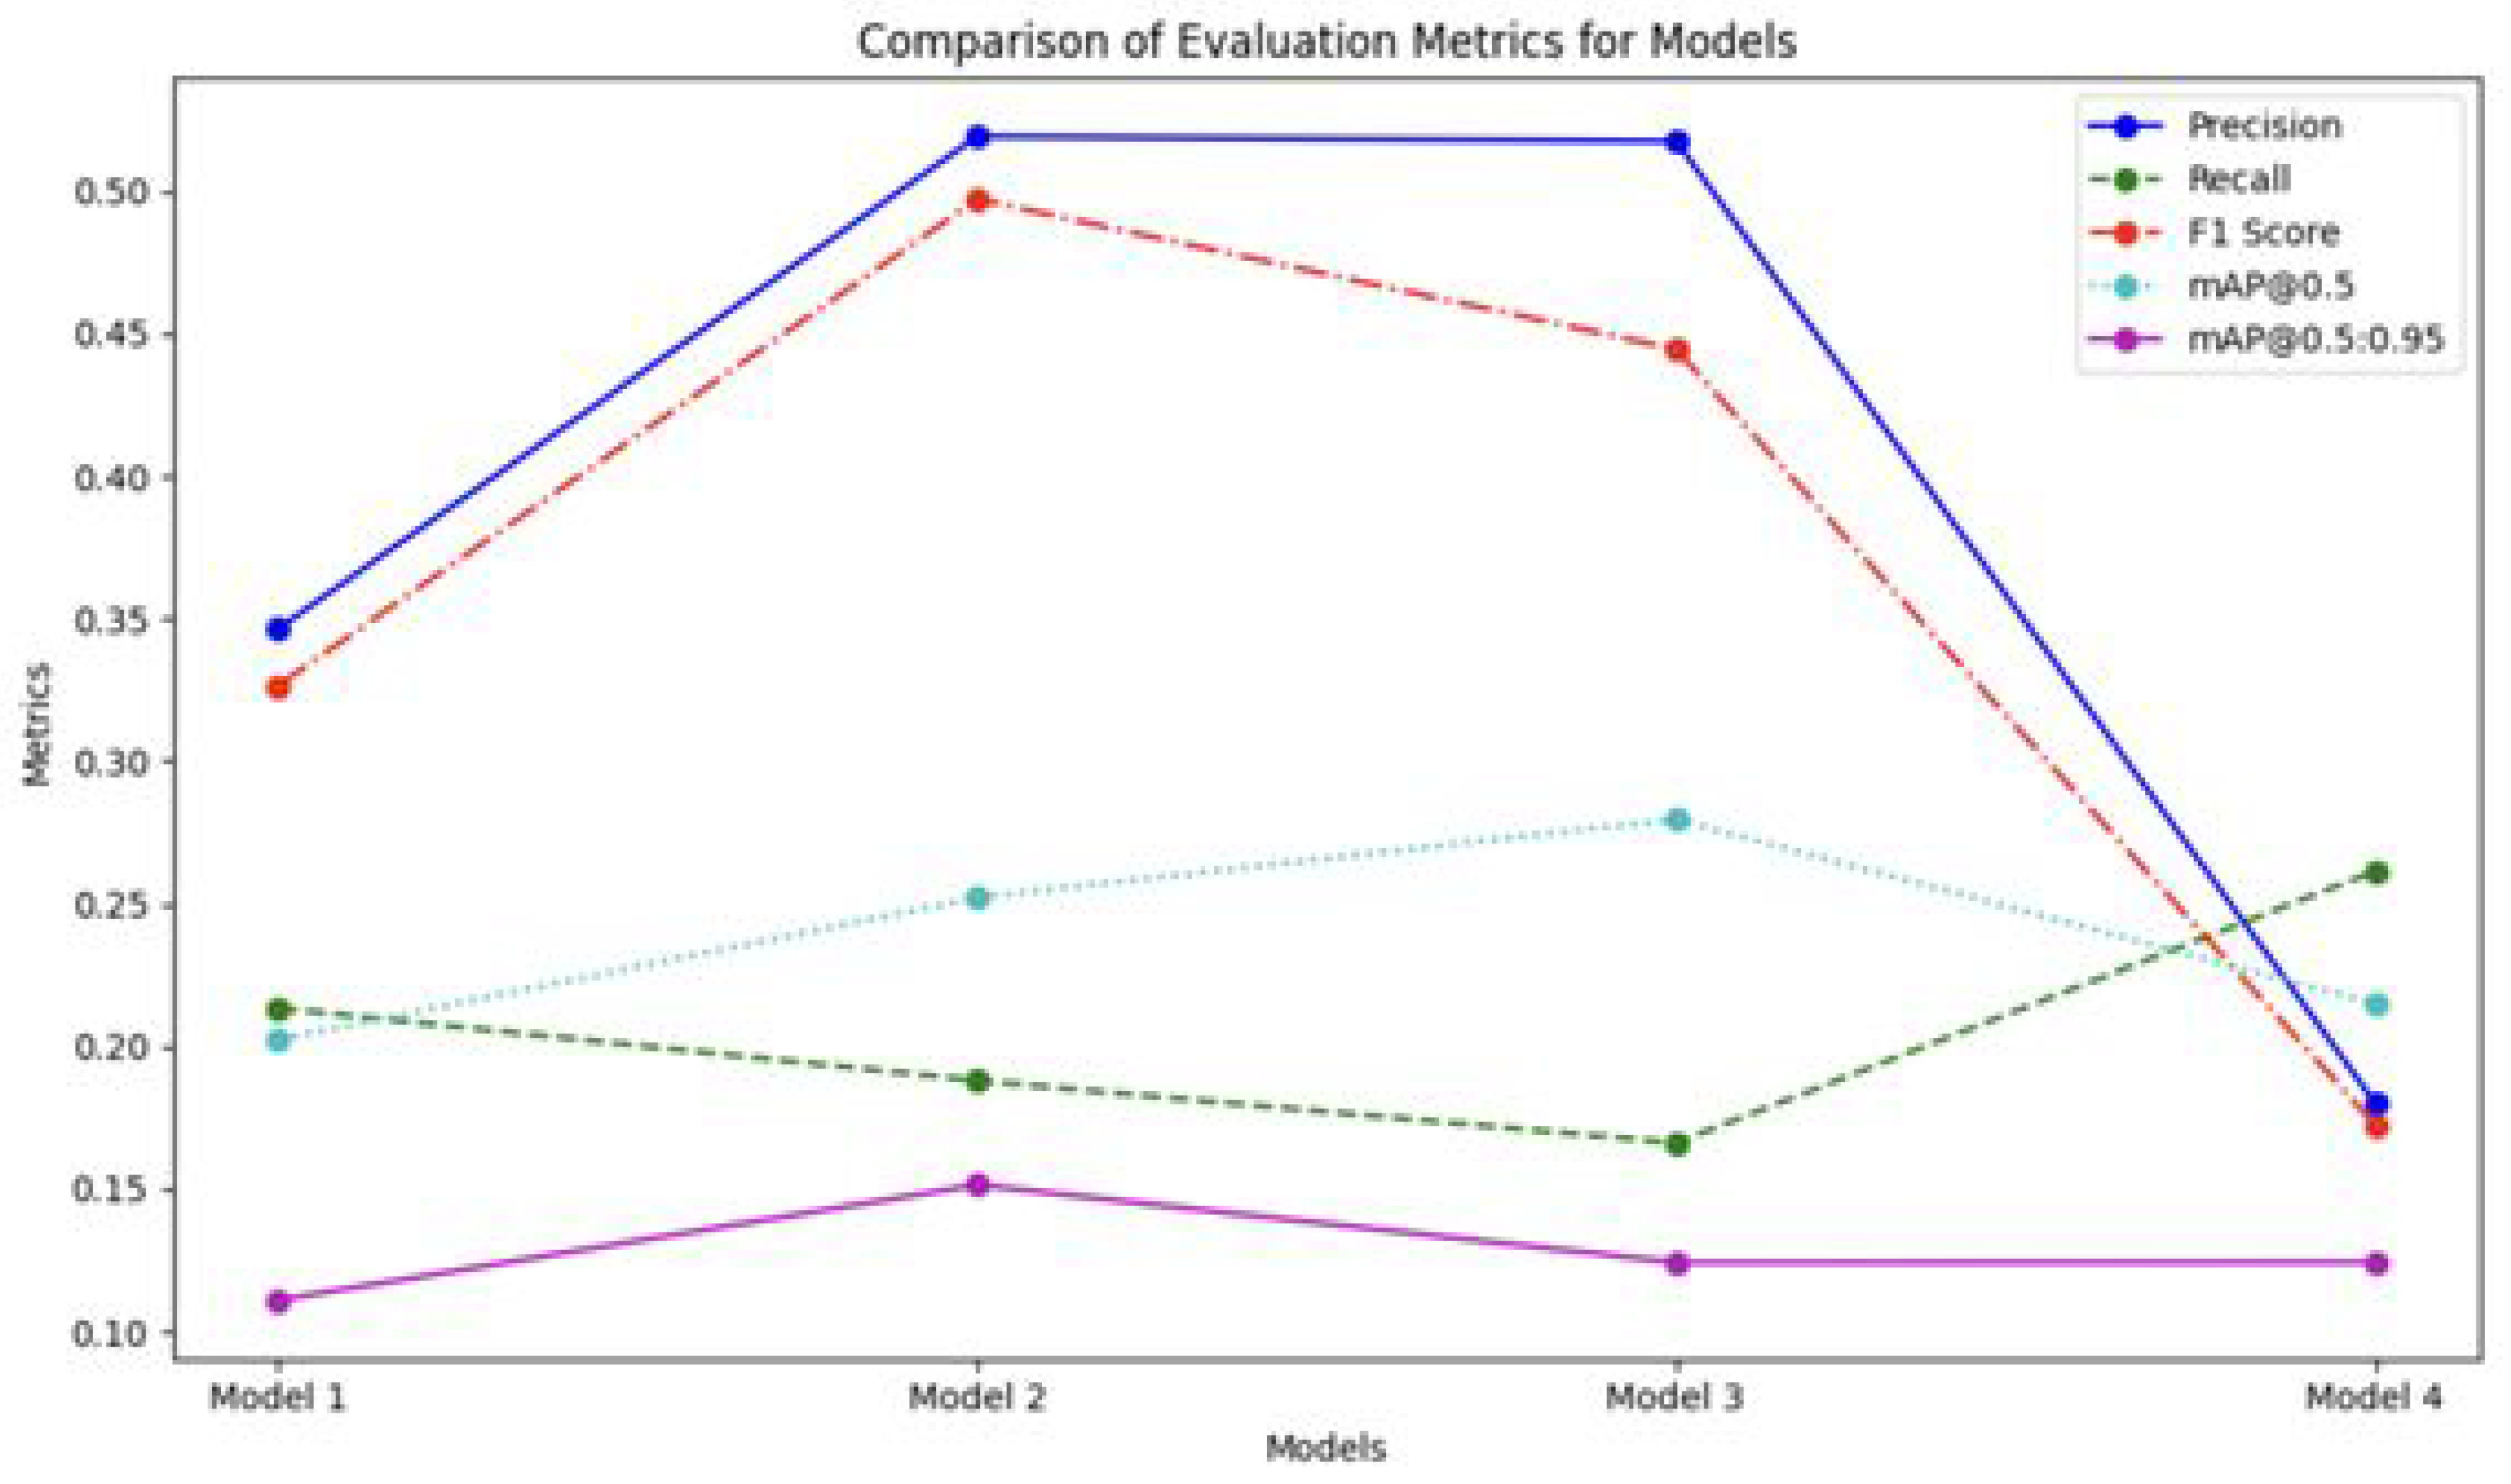
Figure 6.
Sample of segmentation results
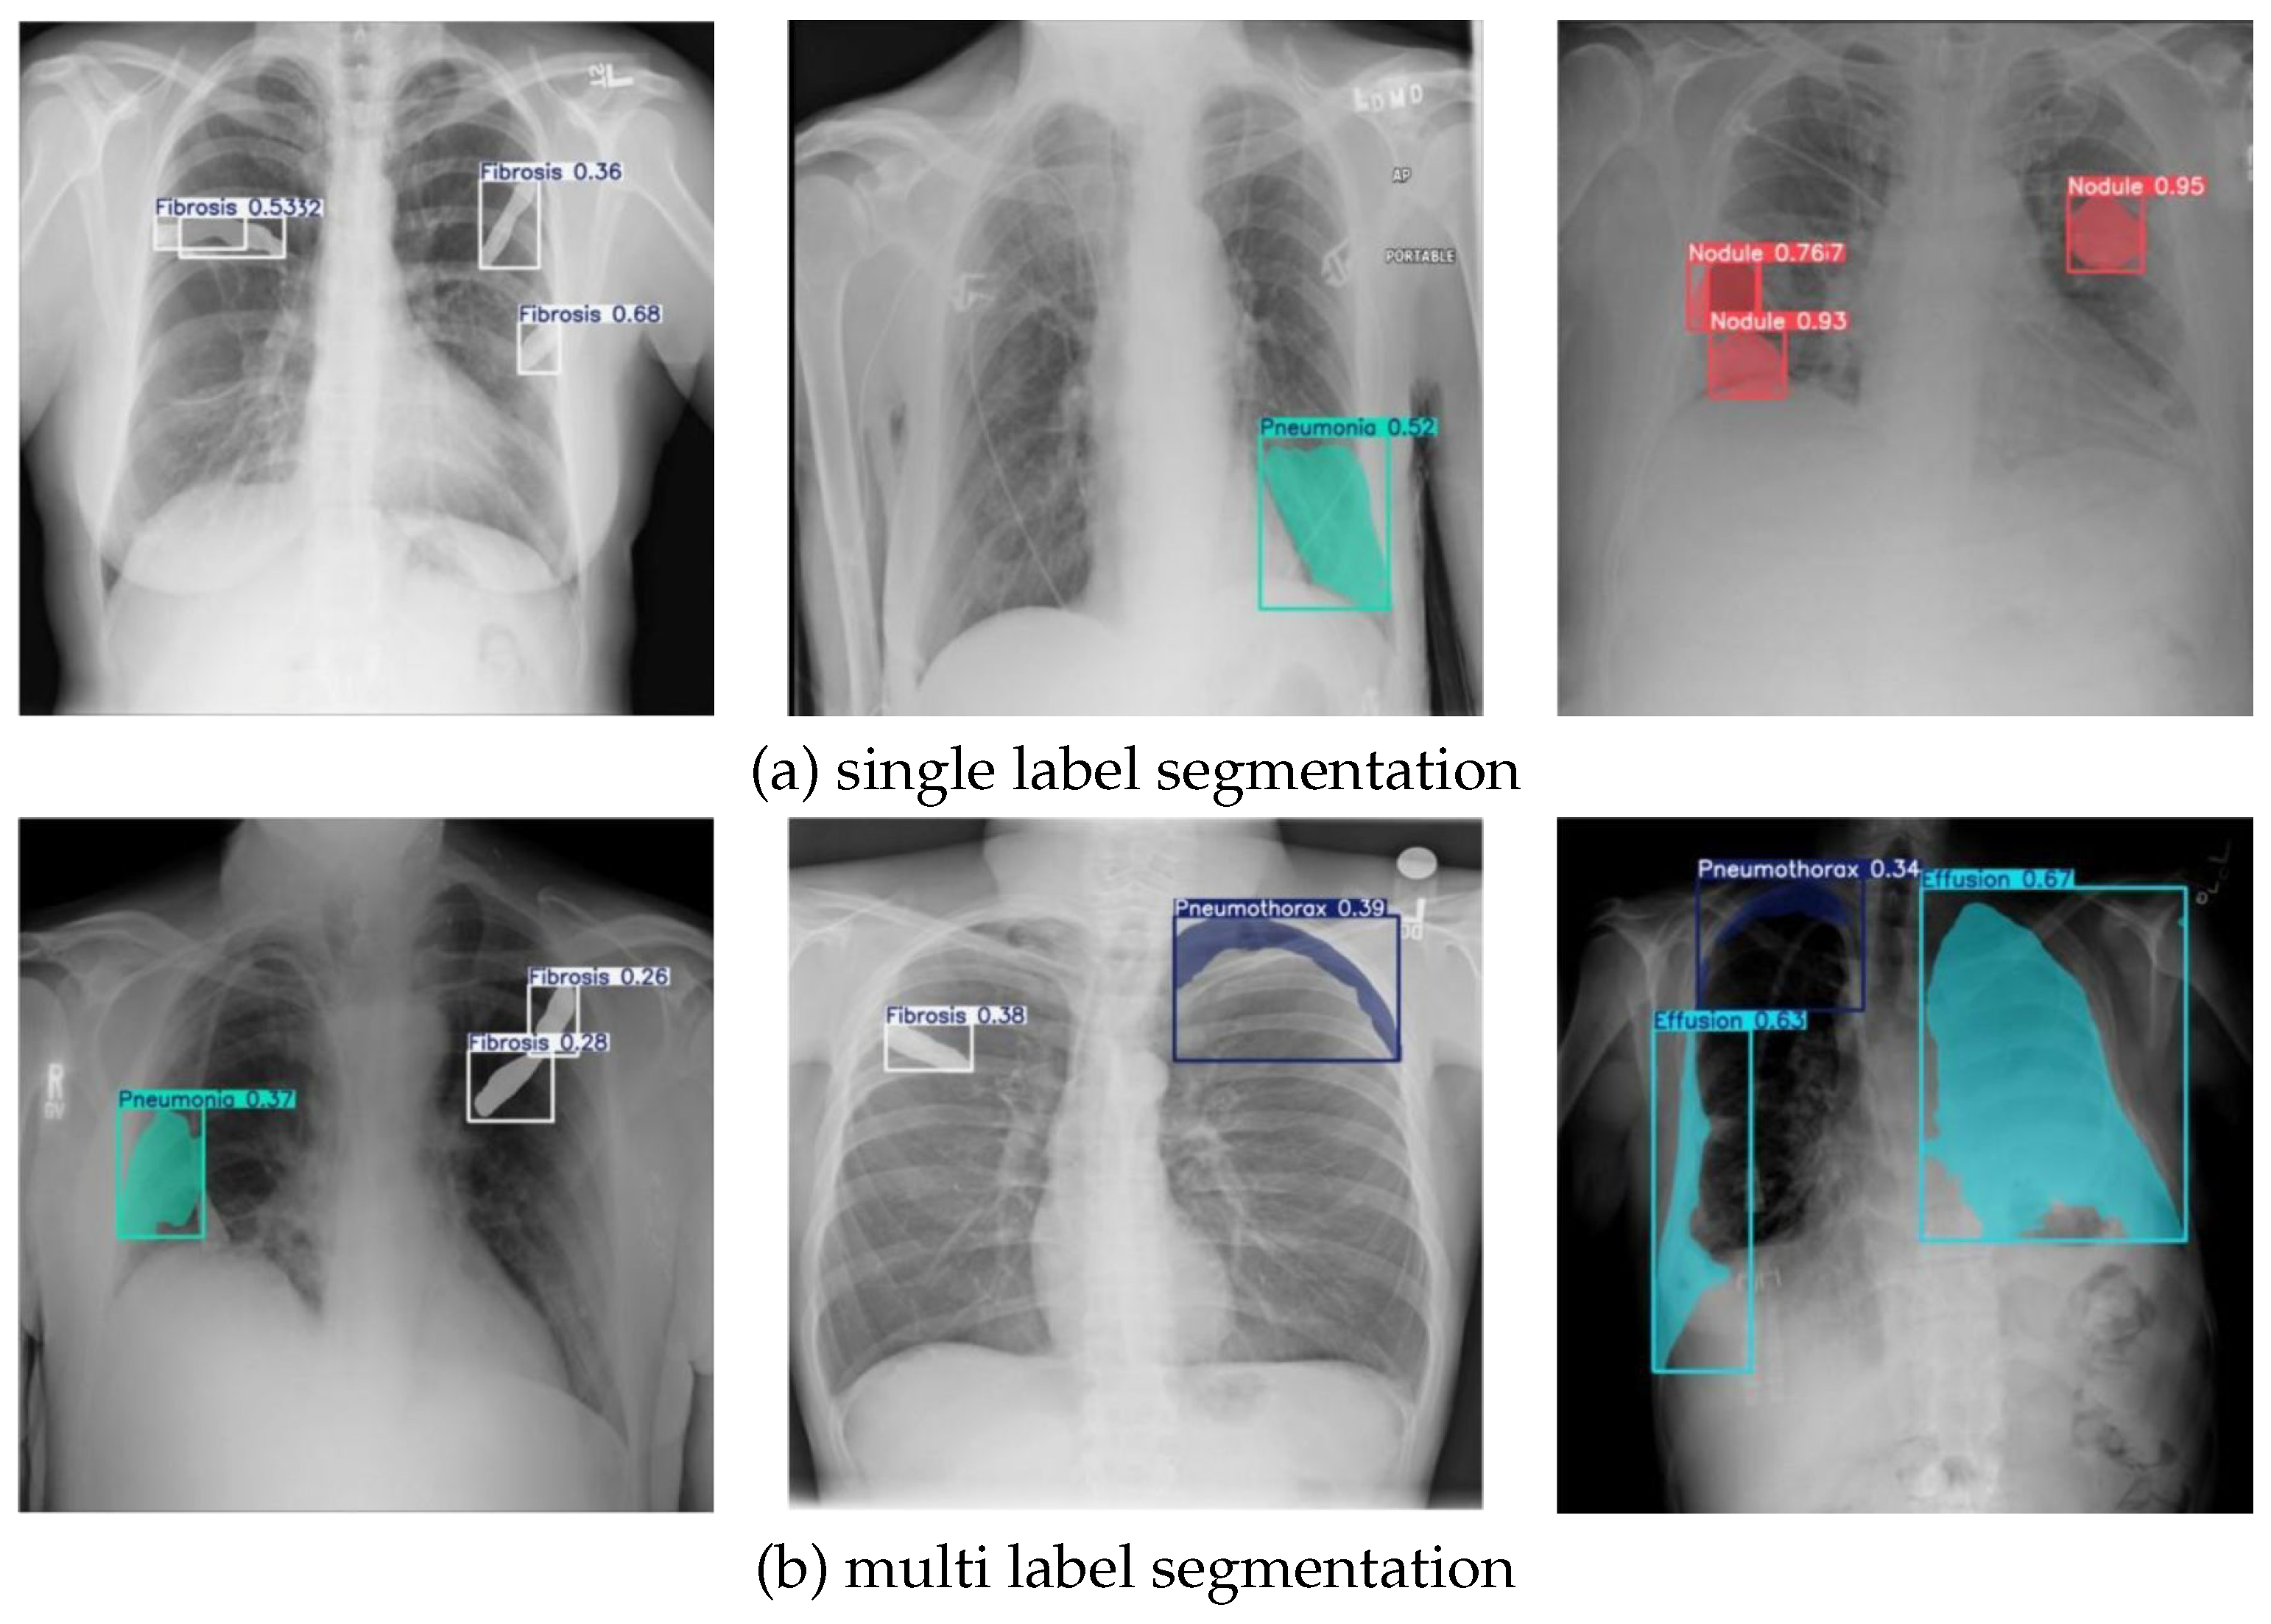
Table 2.
Training and validation data per category after refinement
| Class | Abnormalities labels | Images set | ||
| Training | Validation | Total | ||
| 0 | Consolidation | 215 | 24 | 239 |
| 1 | Effusion | 234 | 32 | 266 |
| 2 | Fibrosis | 511 | 50 | 561 |
| 3 | Pneumonia | 244 | 35 | 279 |
| 4 | Pneumothorax | 99 | 12 | 111 |
| 5 | No Finding | 180 | 20 | 200 |
| 6 | Nodule | 378 | 33 | 411 |
| 7 | Atelectasis | 16 | 4 | 20 |
| 8 | Infiltration | 55 | 10 | 65 |
| 1932 | 220 | 2152 | ||
Table 3.
Summary of image multiplications for data augmentation
| Folder | Original | X | Augmentation | Final Result |
| 0 | 140 | 2 | 280 | 420 |
| 1 | 147 | 2 | 294 | 441 |
| 2 | 140 | 2 | 280 | 420 |
| 3 | 122 | 2 | 244 | 366 |
| 4 | 87 | 3 | 261 | 348 |
| 5 | 180 | 1 | 180 | 360 |
| 6 | 78 | 3 | 234 | 312 |
| 7 | 20 | 12 | 240 | 260 |
| 8 | 18 | 12 | 216 | 234 |
| 9 | 18 | 12 | 216 | 234 |
| 950 | 2445 | 3395 |
Table 4.
Number of abnormality labels in training data before and after augmentation
| Class | Original | Aug | Mix Aug |
| 0 (Consolidation) | 215 | 645 | 1290 |
| 1 (Effusion) | 234 | 942 | 1884 |
| 2 (Fibrosis) | 511 | 2494 | 4988 |
| 3 (Pneumonia) | 244 | 732 | 1464 |
| 4 (Pneumothorax) | 99 | 459 | 918 |
| 5 (No Finding) | 180 | 360 | 720 |
| 6 (Nodule) | 378 | 1791 | 3582 |
| 7 (Atelectasis) | 16 | 209 | 418 |
| 8 (Infiltration) | 55 | 717 | 1434 |
| 1932 | 8349 | 16698 |
Table 5.
Number of abnormality labels annotations in the validation dataset
| Class | Disease | Qty |
| 0 | Consolidation | 24 |
| 1 | Effusion | 32 |
| 2 | Fibrosis | 50 |
| 3 | Pneumonia | 35 |
| 4 | Pneumothorax | 12 |
| 5 | No Finding | 20 |
| 6 | Nodule | 33 |
| 7 | Atelectasis | 4 |
| 8 | Infiltration | 10 |
| 220 | ||
Table 6.
NIH Dataset
| Images Files | Total |
| Atelectasis|Effusion|Infiltration|Nodule | 21 |
| Atelectasis|Fibrosis|Infiltration | 21 |
| Fibrosis|Pneumothorax | 23 |
| Nodule | 100 |
Table 7.
our expert annotator labelling dataset
| Images Files | Total |
| AnnotasiAtelectasis | 1 |
| Atelectasis, Effusion, Infiltrate, Nodule | 10 |
| Atelectasis, Fibrosis, Infiltrate | 5 |
| Atelectasis, Infiltrate | 3 |
| Effusion, Infiltrate | 1 |
| Effusion, Infiltrate, Nodule | 9 |
| Effusion, Nodule | 1 |
| Fibrosis | 19 |
| Fibrosis, Infiltrate | 7 |
| Fibrosis, Pneumothorax | 8 |
| Infiltrate | 1 |
| No nodule | 13 |
| Nodule | 87 |
Table 8.
Recall values across models for different abnormalities
| Class | Recall values across models | |||
| Model 1 | Model 2 | Model 3 | Model 4 | |
| all | 0,2130 | 0,1880 | 0,1660 | 0,2610 |
| Consolidation | 0,4170 | 0,1670 | 0,1290 | 0,4170 |
| Effusion | 0,4060 | 0,3440 | 0,2680 | 0,4380 |
| Fibrosis | 0,1800 | 0,1600 | 0,1400 | 0,1600 |
| Pneumonia | 0,1430 | 0,0857 | 0,0857 | 0,1140 |
| Pneumothorax | 0,2500 | 0,4050 | 0,3330 | 0,5000 |
| Nodule | 0,0606 | 0,0909 | 0,1210 | 0,2120 |
| Atelectasis | 0,2500 | 0,2500 | 0,2500 | 0,2500 |
| Infiltration | 0,0000 | 0,0000 | 0,0000 | 0,0000 |
Table 9.
Precision across models for different abnormalities
| Class | Precision values across models | |||
| Model 1 | Model 2 | Model 3 | Model 4 | |
| all | 0,3460 | 0,5190 | 0,5170 | 0,1800 |
| Consolidation | 0,3320 | 0,2510 | 0,3070 | 0,1610 |
| Effusion | 0,2880 | 0,4160 | 0,4880 | 0,1560 |
| Fibrosis | 0,4190 | 0,5370 | 0,5160 | 0,0816 |
| Pneumonia | 0,2600 | 0,1850 | 0,3470 | 0,0952 |
| Pneumothorax | 0,3450 | 0,8290 | 0,8040 | 0,2730 |
| Nodule | 0,2960 | 0,4370 | 0,3340 | 0,1750 |
| Atelectasis | 0,8320 | 0,5000 | 0,3430 | 0,5000 |
| Infiltration | 0,0000 | 1,0000 | 1,0000 | 0,0000 |
Table 10.
F1-Score across models for different abnormalities
| Class | F1-score values across models | |||
| Model 1 | Model 2 | Model 3 | Model 4 | |
| all | 0,2637 | 0,2760 | 0,2513 | 0,3840 |
| Consolidation | 0,3697 | 0,2006 | 0,1817 | 0,3150 |
| Effusion | 0,3370 | 0,3766 | 0,3460 | 0,4320 |
| Fibrosis | 0,2518 | 0,2465 | 0,2202 | 0,2170 |
| Pneumonia | 0,1845 | 0,1171 | 0,1375 | 0,0980 |
| Pneumothorax | 0,2899 | 0,5442 | 0,4709 | 0,3910 |
| Nodule | 0,1006 | 0,1505 | 0,1776 | 0,1870 |
| Atelectasis | 0,3845 | 0,3333 | 0,2892 | 0,4120 |
| Infiltration | 0,0000 | 0,0000 | 0,0000 | 0,0000 |
Table 11.
Mean Average Precision (mAP) @ IoU 0.5 Across Models
| Class | mAP@0.5 | |||
| Model 1 | Model 2 | Model 3 | Model 4 | |
| all | 0,2020 | 0,2520 | 0,2800 | 0,2150 |
| Consolidation | 0,3670 | 0,2730 | 0,2500 | 0,2320 |
| Effusion | 0,3010 | 0,3570 | 0,3230 | 0,2510 |
| Fibrosis | 0,2010 | 0,2340 | 0,1960 | 0,1440 |
| Pneumonia | 0,1330 | 0,0900 | 0,1240 | 0,0835 |
| Pneumothorax | 0,2220 | 0,4830 | 0,4440 | 0,4470 |
| Nodule | 0,1370 | 0,1450 | 0,1310 | 0,1250 |
| Atelectasis | 0,2530 | 0,4350 | 0,2170 | 0,4350 |
| Infiltration | 0,0025 | 0,0000 | 0,5500 | 0,0000 |
Table 12.
mAP result using IOU 0.5:0.95
| Class | mAP@0.5:0.95 | |||
| Model 1 | Model 2 | Model 3 | Model 4 | |
| all | 0,1110 | 0,1510 | 0,1240 | 0,1240 |
| Consolidation | 0,2340 | 0,1330 | 0,1240 | 0,1390 |
| Effusion | 0,0555 | 0,1080 | 0,0366 | 0,1030 |
| Fibrosis | 0,0475 | 0,0627 | 0,0337 | 0,0684 |
| Pneumonia | 0,0651 | 0,0480 | 0,0645 | 0,0621 |
| Pneumothorax | 0,0540 | 0,1650 | 0,1440 | 0,2770 |
| Nodule | 0,0667 | 0,0670 | 0,0623 | 0,0398 |
| Atelectasis | 0,1770 | 0,3480 | 0,1520 | 0,3040 |
| Infiltration | 0,0010 | 0,0000 | 0,0550 | 0,0000 |
Table 13.
Kruskal-Wallis test
| Metrics | Kruskal-Wallis Statistic | p-value |
| Recall | 2,231198 | 0,525830 |
| Precision | 14,874111 | 0,001927 |
| F1-score | 0,932251 | 0,817639 |
| mAP@0.5 | 1,396756 | 0,706295 |
| mAP@0.5:0.95 | 0,924018 | 0,819628 |
Table 14.
Nemenyi Post-Hoc test for precision values
| Model | Model 1 | Model 2 | Model 3 | Model 4 |
| Model 1 | 1,000000 | 0,635254 | 0,797991 | 0,153177 |
| Model 2 | 0,635254 | 1,000000 | 0,992827 | 0,005602 |
| Model 3 | 0,797991 | 0,992827 | 1,000000 | 0,013806 |
| Model 4 | 0,153177 | 0,005602 | 0,013806 | 1,000000 |
Disclaimer/Publisher’s Note: The statements, opinions and data contained in all publications are solely those of the individual author(s) and contributor(s) and not of MDPI and/or the editor(s). MDPI and/or the editor(s) disclaim responsibility for any injury to people or property resulting from any ideas, methods, instructions or products referred to in the content. |
© 2025 by the authors. Licensee MDPI, Basel, Switzerland. This article is an open access article distributed under the terms and conditions of the Creative Commons Attribution (CC BY) license (http://creativecommons.org/licenses/by/4.0/).
Copyright: This open access article is published under a Creative Commons CC BY 4.0 license, which permit the free download, distribution, and reuse, provided that the author and preprint are cited in any reuse.


